
PEMEX financial results report as of December … Investor Relations PEMEX financial results report...
40
Investor Relations (5255) 1944 9700 Esteban Levin [email protected] Celina Torres [email protected] February 25, 2005 PEMEX financial results report as of December 31, 2004 (unaudited) Financial highlights PEMEX, Mexico’s oil and gas company and the world’s ninth largest integrated oil and gas company 1 , announced its unaudited consolidated financial results for the twelve months ending December 31, 2004. Total sales increased 18%, compared to 2003, reaching Ps. 778.6 billion (US$69.1 billion) 2 Crude oil exports averaged 1,870 thousand barrels per day (Mbd), up 1% from 2003 Income before taxes and duties increased 28%, to Ps. 458.9 billion (US$40.7 billion) Net loss for 2004 decreased Ps. 28.6 billion compared to 2003, resulting in a net loss of Ps. 14.1 billion (US$1.3 billion) Table 1 Petróleos Mexicanos, Subsidiary Entities and Subsidiary Companies Financial results summary Twelve months ending December 31, 2003 2004 Change 2004 (Ps. mm) (US$mm) Total sales 657,893 778,614 18% 120,721 69,119 Domestic sales (1) 407,337 449,028 10% 41,690 39,861 Exports 250,556 329,586 32% 79,030 29,258 - 357,423 458,882 28% 101,459 40,736 - Taxes and duties 402,294 473,025 18% 70,730 41,991 - Net income (loss) (42,754) (14,142) -67% 28,612 (1,255) - EBITDA (2) 374,117 504,446 35% 130,329 44,781 EBITDA / Interest expense (3) 15.1 17.8 Income before taxes and duties (1) (2) Excludes IEPS. (3) Excludes capitalized interest. *Unaudited consolidated financial statements prepared in accordance with Mexican Generally Accepted Accounting Principles (MEXGAAP) issued by the Instituto Mexicano de Contadores Públicos. Inflation recognition is also in accordance with MEXGAAP. Accordingly, peso figures are presented in constant Mexican pesos as of December 31, 2004. Note: Numbers may not total due to rounding. (1) Includes the Special Tax on Production and Services (IEPS). As of December 31, 2003 this figure was Ps. 98,960 million and as of December 31, 2004, Ps. 54,705 million. 1 Petroleum Intelligence Weekly Ranking, December 2004. 2 Amounts in US dollars are translated at the December 31, 2004 exchange rate of Ps. 11.2648 per US dollar.
Transcript of PEMEX financial results report as of December … Investor Relations PEMEX financial results report...
Investor Relations (5255) 1944 9700
Esteban Levin [email protected] Celina Torres [email protected]
February 25, 2005
PEMEX financial results report as of December 31, 2004
(unaudited)
Financial highlights
PEMEX, Mexico’s oil and gas company and the world’s ninth largest integrated oil and gas company1, announced its unaudited consolidated financial results for the twelve months ending December 31, 2004.
Total sales increased 18%, compared to 2003, reaching Ps. 778.6 billion (US$69.1 billion)2
Crude oil exports averaged 1,870 thousand barrels per day (Mbd), up 1% from 2003
Income before taxes and duties increased 28%, to Ps. 458.9 billion (US$40.7 billion)
Net loss for 2004 decreased Ps. 28.6 billion compared to 2003, resulting in a net loss of Ps. 14.1 billion (US$1.3 billion)
Table 1
Petróleos Mexicanos, Subsidiary Entities and Subsidiary CompaniesFinancial results summary
Twelve months ending December 31, 2003 2004 Change 2004
(Ps. mm) (US$mm)Total sales 657,893 778,614 18% 120,721 69,119
Domestic sales(1) 407,337 449,028 10% 41,690 39,861 Exports 250,556 329,586 32% 79,030 29,258
-
357,423 458,882 28% 101,459 40,736 -
Taxes and duties 402,294 473,025 18% 70,730 41,991 -
Net income (loss) (42,754) (14,142) -67% 28,612 (1,255) -
EBITDA(2) 374,117 504,446 35% 130,329 44,781 EBITDA / Interest expense(3) 15.1 17.8
Income before taxes and duties(1)
(2) Excludes IEPS.(3) Excludes capitalized interest.
*Unaudited consolidated financial statements prepared in accordance with Mexican Generally Accepted Accounting Principles (MEXGAAP) issued by the Instituto Mexicano de Contadores Públicos. Inflation recognition is also in accordance with MEXGAAP. Accordingly, peso figures are presented in constant Mexican pesos as of December 31, 2004.
Note: Numbers may not total due to rounding.
(1) Includes the Special Tax on Production and Services (IEPS). As of December 31, 2003 this figure was Ps. 98,960 million and as of December 31, 2004, Ps. 54,705 million.
1 Petroleum Intelligence Weekly Ranking, December 2004. 2 Amounts in US dollars are translated at the December 31, 2004 exchange rate of Ps. 11.2648 per US dollar.

PEMEX Investor Relations
PEMEX financial results report as of December 31, 2004 2/40 www.pemex.com
Operational highlights
Total liquid hydrocarbons production in 2004 totaled 3,825 Mbd, 1% greater than the production of 2003:
Crude oil production increased 12 Mbd, to 3,383 Mbd Natural gas production rose 2% to 4,573 million cubic feet per day (MMcfd)
Natural gas liquids production increased 6% to 442 Mbd In 2004, gas flaring represented 3.3% of total natural gas production
Operating items Exploration and production Production levels
In 2004, crude oil and natural gas production totaled 3,383 Mbd and 4,573 MMcfd, respectively. Heavy crude oil represented 73% of total crude oil production and non-associated natural gas was 34% of total natural gas production. During the fourth quarter of 2004, crude oil production decreased 2% because of adverse weather conditions. Moreover, during the same period, non-associated natural gas production increased 12% while total natural gas production grew 1%.
Gas flaring In 2004, gas flaring represented 3.3% of total natural gas production,
compared to 5.6% in 2003. During the fourth quarter of 2004, gas flaring was 2.9% of total natural gas production, compared to 5.9% in the same period of 2003. This decrease was an effect of the start-up of the offshore gas treatment facility within the Akal-C complex in Cantarell.
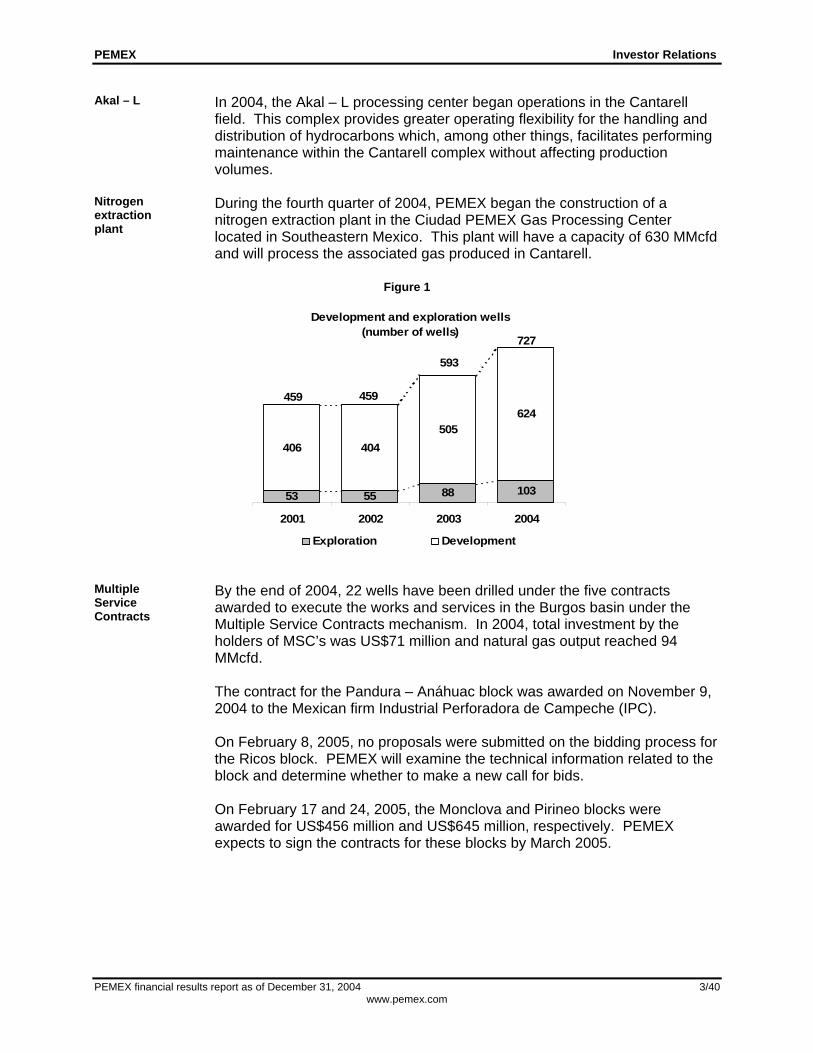
Drilling activity In 2004, exploration drilling activity increased 17%, from 88 to 103 exploratory
wells. Development drilling activity rose 24% compared to 2003, from 505 to 624 development wells (see figure 1). During the fourth quarter of 2004, exploratory and development drilling activity diminished 7% and 1%, respectively, relative to the same quarter of 2003. In 2004, PEMEX successfully completed the exploratory well Nab-1 at a water depth of 681 meters. This is the deepest marine well drilled by PEMEX. The reserves associated to this finding are in the process of evaluation and, therefore, they do not yet modify Mexico’s hydrocarbon reserves level.
PEMEX Investor Relations
PEMEX financial results report as of December 31, 2004 3/40 www.pemex.com
Akal – L In 2004, the Akal – L processing center began operations in the Cantarell
field. This complex provides greater operating flexibility for the handling and distribution of hydrocarbons which, among other things, facilitates performing maintenance within the Cantarell complex without affecting production volumes.
Nitrogen extraction plant
During the fourth quarter of 2004, PEMEX began the construction of a nitrogen extraction plant in the Ciudad PEMEX Gas Processing Center located in Southeastern Mexico. This plant will have a capacity of 630 MMcfd and will process the associated gas produced in Cantarell.
Figure 1
Development and exploration wells (number of wells)
55 88 103
406 404505
624
53
2001 2002 2003 2004
Exploration Development
459 459
727
593
Multiple Service Contracts
By the end of 2004, 22 wells have been drilled under the five contracts awarded to execute the works and services in the Burgos basin under the Multiple Service Contracts mechanism. In 2004, total investment by the holders of MSC’s was US$71 million and natural gas output reached 94 MMcfd. The contract for the Pandura – Anáhuac block was awarded on November 9, 2004 to the Mexican firm Industrial Perforadora de Campeche (IPC). On February 8, 2005, no proposals were submitted on the bidding process for the Ricos block. PEMEX will examine the technical information related to the block and determine whether to make a new call for bids. On February 17 and 24, 2005, the Monclova and Pirineo blocks were awarded for US$456 million and US$645 million, respectively. PEMEX expects to sign the contracts for these blocks by March 2005.

PEMEX Investor Relations
PEMEX financial results report as of December 31, 2004 4/40 www.pemex.com
Table 2
Multiple Service Contracts
Block Reynosa-Monterrey Cuervito Misión Fronterizo Olmos Pandura-
Anáhuac Monclova Pirineo Total
Contract signed 14-Nov-03 21-Nov-03 28-Nov-03 8-Dec-03 9-Feb-04 9-Nov-04 -- --
Expected production(2) 222 36 91 34 42 110 50 70 655
Total expected investment(1) 2,437 260 1,036 265 344 900 456 645 6,343
Investment 2004(1) 44 7 13 7 -- -- -- 71
(2) Million cubic feet daily
Lewis EnergyWinning bidder(s) Repsol
PetrobrasDiavazTeikoku
TecpetrolIPC
Techint
PetrobrasDiavazTeikoku
Constructora Industrial Monclova
Materiales la GloriaAlianz Petroleum
Steel ServSuelopetrol
NCT, Estudios y Proyectos
Petrotesting Colombia
(1) Millions of USD
IPC
Hullera MexicanaEnergy Milenium
Andrews Technologies of
MéxicoYuma E&P Inc.
Aries Operating LP
Gas and basic petrochemicals
Gas processing
In 2004, given the greater supply of wet natural gas and condensates for processing, the production of dry gas from the processing plants increased 4% compared to the production registered in 2003, averaging 3,144 MMcfd. Gas liquids production, including condensates, was 442 Mbd, 6% greater than that observed in 2003. During the fourth quarter of 2004, dry gas from processing plants and gas liquids production increased 4% and 2%, respectively, relative to the fourth quarter of 2003.
Additional cryogenic plants
In 2004 PEMEX started operations of two modular cryogenic plants and a condensates fractionation plant in the Burgos Gas Processing Center (GPC) in northern Mexico. Each plant has a processing capacity of 200 MMcfd of sweet wet gas, while the fractionation plant has a capacity of 6 Mbd of condensates. Additionally, in the third quarter of 2004, PEMEX signed a contract to build a third modular cryogenic plant and expects to sign a new contract, in the first half of 2005, to build a fourth plant. Both new plants will be constructed at the Burgos GPC and will have the same processing capacity as the first two. At the end of 2004, PEMEX carried out the initial phase to build a liquefied petroleum gas (LPG) pipeline with a transport capacity up to 30 Mbd from the GPC Burgos to Monterrey.
PEMEX Investor Relations
PEMEX financial results report as of December 31, 2004 5/40 www.pemex.com
Refining
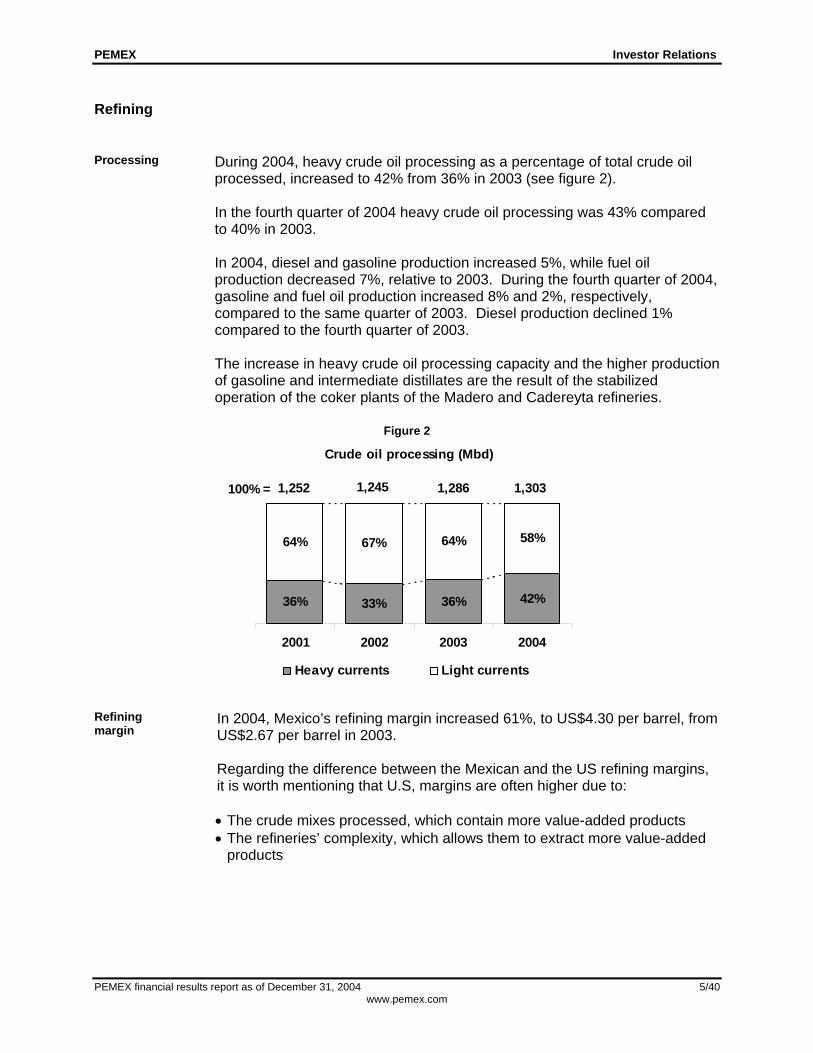
Processing During 2004, heavy crude oil processing as a percentage of total crude oil
processed, increased to 42% from 36% in 2003 (see figure 2). In the fourth quarter of 2004 heavy crude oil processing was 43% compared to 40% in 2003. In 2004, diesel and gasoline production increased 5%, while fuel oil production decreased 7%, relative to 2003. During the fourth quarter of 2004, gasoline and fuel oil production increased 8% and 2%, respectively, compared to the same quarter of 2003. Diesel production declined 1% compared to the fourth quarter of 2003. The increase in heavy crude oil processing capacity and the higher production of gasoline and intermediate distillates are the result of the stabilized operation of the coker plants of the Madero and Cadereyta refineries.
Figure 2
Crude oil processing (Mbd)
33% 36% 42%
64% 67% 64% 58%
36%
2001 2002 2003 2004
Heavy currents Light currents
100% = 1,286 1,3031,2451,252
Refining margin
In 2004, Mexico’s refining margin increased 61%, to US$4.30 per barrel, from US$2.67 per barrel in 2003. Regarding the difference between the Mexican and the US refining margins, it is worth mentioning that U.S, margins are often higher due to: • The crude mixes processed, which contain more value-added products • The refineries’ complexity, which allows them to extract more value-added
products
PEMEX Investor Relations
PEMEX financial results report as of December 31, 2004 6/40 www.pemex.com
Minatitlán The project for the reconfiguration of the Minatitlán refinery was divided into
six engineering, procurement and construction (EPC) packages. The first package (EPC-1) was awarded at the end of 2003, beginning the reconfiguration project. During the third quarter of 2004 two EPC packages were awarded. EPC-2 includes: • Construction of a utilities plant • Construction of a sour water treatment plant • Integration works, caustic waste and effluent treatment
EPC -3 includes the construction of: • An atmospheric and vacuum distillation plant • An intermediate distillates hydro-treatment plant • A fluid catalytic cracker
Franchises The number of franchised gas stations rose 9% to 6,732 as of December 31,
2004, from 6,164 as of December 31, 2003.
Petrochemicals
Petrochemicals production
Total accumulated petrochemicals production for 2004 was 10,731 thousand tons (Mt), 4% higher than in 2003. In particular, ethylene production grew 3%, relative to 2003. This growth is partly attributed to the modernization and enlargement of the installed capacity at the petrochemical plant La Cangrejera. During the fourth quarter of 2004, total accumulated petrochemicals production increased 6% compared to the same period of 2003, from 2,641 Mt to 2,809 Mt. Ethylene output totaled 243 Mt, a 2% year on year increase.
Subsidiary companies
On September 15, 2004, the Secretary of Energy was authorized to carry out the merger of the following subsidiary companies of PEMEX Petroquímica: • Petroquímica Camargo, S.A. de C.V. • Petroquímica La Cangrejera, S.A. de C.V. • Petroquímica Cosoleacaque, S.A. de C.V. • Petroquímica Escolín, S.A. de C.V. • Petroquímica Morelos, S.A. de C.V. • Petroquímica Pajaritos, S.A. de C.V. • Petroquímica Tula, S.A. de C.V. This merger is expected to be completed during 2005.

PEMEX Investor Relations
PEMEX financial results report as of December 31, 2004 7/40 www.pemex.com
Fénix Project On October 2004, PEMEX announced the names of its partners for the
execution of the Fénix Project: • Indelpro, S.A. de C.V. (affiliate of Alfa) • Grupo Idesa, S.A. de C.V. • Nova Chemicals Corporation The Fénix Project requires budgetary approvals and, therefore, it is still under discussion.
International trade3
Crude oil exports
In 2004, PEMEX’s crude oil exports averaged 1,870 Mbd, 1% higher than the volume registered in 2003. Approximately 87% of the total crude oil exports were heavy crude oil (Maya) and the rest was light and extra-light crude oil (Isthmus and Olmeca). 79% of the total crude oil exports were delivered to the United States, while the remaining 21% were distributed among Europe (10%), the Far East (2%), and the rest of America (9%). The 2004 annual weighted average export price of the Mexican crude oil basket was US$31.02 per barrel, as compared to US$26.78 per barrel in 2003. In the fourth quarter of 2004, crude oil exports averaged 1,968 Mbd, 4% higher than the volume registered in the same quarter of 2003. Approximately 85% of these exports were heavy crude oil. The weighted average export price of the Mexican crude oil basket during the fourth quarter of 2004 was US$33.32 per barrel, as compared to US$25.03 per barrel in the same quarter of 2003.
3 Source: PMI.

PEMEX Investor Relations
PEMEX financial results report as of December 31, 2004 8/40 www.pemex.com
Refined products and petrochemicals
In 2004, exports of refined products averaged 152 Mbd, 15% below the 2003 level. This was due to a decrease in the exports of fuel oil, asphalt and jet fuel. Petrochemical exports increased 10% on a yearly basis, totaling 916 Mt. In 2004, imports of refined products increased 8%, to 310 Mbd in 2004 from 287 Mbd in 2003 as a result of higher demand for regular gasoline in urban areas. Petrochemicals imports decreased 48%, to 277 Mt, as a consequence of substitution of imports by increased domestic production. Natural gas imports increased 1% to 766 MMcfd in 2004 from 757 MMcfd in 2003. During the fourth quarter of 2004, exports of refined products averaged 136 Mbd, 27% below the exports registered in the same period of 2003. In the same quarter, petrochemicals exports declined 12%, to 223 Mt from 254 Mt in the fourth quarter of 2003. Also, during the fourth quarter of 2004, imports of refined products increased 32%, to 392 Mbd from 297 Mbd in the same period of 2003. Petrochemicals imports decreased 10%, to 70 Mt from 78 Mt. In the fourth quarter of 2004, imports of natural gas decreased 1%, to 801 MMcfd from 810 MMcfd in the comparable period of 2003.
Financial results as of December 31, 2004
Total sales
Total sales Total sales (including the special tax on production and services, or IEPS)
increased 18% in constant pesos to Ps. 778.6 billion (US$69.1 billion) for 2004, compared to Ps. 657.9 billion in 2003.
PEMEX Investor Relations
PEMEX financial results report as of December 31, 2004 9/40 www.pemex.com
Domestic sales
Total domestic sales (including IEPS) increased 10% to Ps. 449 billion (US$39.9 billion) during 2004, from Ps. 407.3 billion in 2003. Total domestic sales (excluding IEPS) increased 28% to Ps. 394.3 billion (US$35 billion) during 2004, from Ps. 308.4 billion in 2003: • Sales of refined products4, net of IEPS, grew 27% to Ps. 304.7 billion
(US$27.1 billion) from Ps. 239.4 billion. Refined products sales volume increased 2% to 1,718 Mbd, from 1,684 Mbd. The IEPS generated by these sales decreased 45% to Ps. 54.7 billion (US$4.9 billion) from Ps. 99 billion. Sales of refined products, including IEPS, increased 6% to Ps. 359.4 billion (US$31.9 billion) from Ps. 338.4 billion
• Natural gas sales rose 27% to Ps. 71.1 billion (US$6.3 billion) from Ps. 55.8 billion. Natural gas sales volume increased 5% to 2,757 MMcfd from 2,621 MMcfd. The average sales price of natural gas for 2004 was US$6.09 per million British Thermal Units, for 2003, average sales price was US$5.04 per MMBtu
• Petrochemical sales5 increased 40% to Ps. 18.5 billion (US$1.6 billion) from Ps. 13.2 billion. Petrochemicals sales volume grew 12% to 3,531 Mt from 3,144 Mt
Exports Export sales totaled Ps. 329.6 billion (US$29.3 billion), 32% higher than the
Ps. 250.6 billion registered in 2003: • Crude oil and condensates export sales increased 32% to Ps. 299.4 billion
(US$26.6 billion) from Ps. 226.6 billion. Crude oil exports volume rose 1% to 1,870 Mbd from 1,844 Mbd
• Refined products export sales6 rose 23% to Ps. 27.5 billion (US$2.4 billion) from Ps. 22.4 billion. Refined products exports volume fell 15% to 152 Mbd from 179 Mbd. This reduction was due mainly to a decrease of 19 Mbd of fuel oil exports as a result of a lower fuel oil output
• Petrochemical products export sales7 increased 70% to Ps. 2.7 billion (US$0.2 billion) from Ps. 1.6 billion. Petrochemical products exports volume grew 10% to 916 Mt from 835 Mt
4 Mainly Magna Gasoline, Premium Gasoline, Pemex Diesel, industrial diesel, special marine diesel, heavy fuel oil, jet fuel, asphalts and liquefied petroleum gas. 5 Mainly raw material for carbon black, hexane, solvent, vinyl chloride, styrene, ethylene oxide, toluene, xylene, polyethylene, acrylonitrile, ammonia and monoethyleneglicol. 6 Mainly naphtas, long residue, asphalts, diesel, gasoline and jet fuel. 7 Mainly ammonia, ethylene, styrene, acrylonitrile, acetaldehyde, polyethylene, butadiene, vinyl chloride, toluene, benzene y monoethyleneglicol.
PEMEX Investor Relations
PEMEX financial results report as of December 31, 2004 10/40 www.pemex.com
Costs and operating expenses
Costs and expenses grew 24%
Costs and operating expenses increased 24% with respect to 2003, reaching Ps. 336.5 billion (US$29.9 billion).
Cost of sales Cost of sales increased 27%, or Ps. 59.4 billion (US$5.3 billion), to Ps. 277.2
billion (US$24.6 billion). The increase is composed of the following changes: • Ps. 36.8 billion (US$3.3 billion) increase in purchases made by PEMEX for
its trading operations • Ps. 14.4 billion (US$1.3 billion) increase in operational maintenance • Ps. 7.8 billion (US$0.7 billion) increase in the cost of the reserve for
retirement payments, pensions and indemnities • Ps. 7.1 billion (US$0.6 billion) increase in depreciation and amortization
expenses • Ps. 1.3 billion (US$0.1 billion) increase in product manufacturing expenses • An offsetting favourable effect of Ps. 4.6 billion (US$0.4 billion) resulting
from inventory valuations • An offsetting favourable effect of Ps. 2.1 billion (US$0.2 billion) resulting
from a decrease in operating expenses • An offsetting favourable effect of Ps. 1.4 billion (US$0.1 billion) due to the
elimination of the specific oil-field exploration and depletion reserve, as a consequence of the implementation of the successful efforts method for the accounting of costs incurred in exploration, acquisition and development of oil and gas reserves
Transportation and distribution expenses
Transportation and distribution expenses increased 20% to Ps. 19.7 billion (US$1.7 billion) in 2004, from Ps. 16.4 billion in 2003.
Administrative expenses
Administrative expenses increased 7% to Ps. 39.6 billion (US$3.5 billion) in 2004, from Ps. 37 billion in 2003.
Cost of the reserve for retirement payments
The cost of the reserve for retirement payments, pensions and indemnities increased 34% to Ps. 52.8 billion (US$4.7 billion) in 2004 from Ps. 39.5 billion in 2003. This cost is distributed among cost of sales, transportation and distribution expenses and administrative expenses. The growth in the cost of the reserve for retirement payments results not only from the natural evolution of the reserve but also from the incorporation of medical services into the reserve.
PEMEX Investor Relations
PEMEX financial results report as of December 31, 2004 11/40 www.pemex.com
Operating income
Operating income
Operating income in 2004 totaled Ps. 442.1 billion (US$39.2 billion), 14% higher than the comparable 2003 figure of Ps. 386.6 billion. Excluding IEPS, operating income grew 35%, or Ps. 99.7 billion (US$8.6 billion), increasing from Ps. 287.7 billion in 2003 to Ps. 387.4 billion (US$34.5 billion) in 2004.
Comprehensive financing cost
Decrease of comprehensive financing cost
Comprehensive financing cost improved by Ps. 35.6 billion, from a cost of Ps. 32.3 billion in 2003 to an income of Ps. 3.3 billion (US$0.3 billion) in 2004 (see table 2). This variation was caused by: • A decrease of Ps. 1.9 billion in net interest expense • A decrease of Ps. 25.4 billion in net foreign exchange loss • An increase of Ps. 8.3 billion in gains on monetary position
Net interest Net interest expense decreased 11% to Ps. 15.7 billion (US$1.4 billion) in
2004, from Ps. 17.6 billion in 2003. Interest expense increased Ps. 3.6 billion, while interest income increased Ps. 5.5 billion.
Foreign exchange loss
Net foreign exchange loss totaled Ps. 1.4 billion (US$0.1 billion) in 2004 as compared to a net foreign exchange loss of Ps. 26.8 billion in 2003. This decrease of Ps. 25.4 billion was primarily a consequence of a lower depreciation of the Mexican peso against the US dollar. From December 31, 2002 to December 30, 2003 it was 9% (from Ps. 10.3125 to Ps. 11.236 per US dollar), while from December 31, 2003 to December 31, 2004 it was 0.3% (from Ps. 11.236 to Ps. 11.2648 per US dollar).
Monetary gain Monetary gain for 2004 was Ps. 20.4 billion (US$1.8 billion), representing a
69% increase over the monetary gain during 2003. The Ps. 8.3 billion (US$0.7 billion) increase in monetary gain is a consequence of a higher annual inflation observed in 2004 relative to 2003 (5.19% vs 3.98%).
PEMEX Investor Relations
PEMEX financial results report as of December 31, 2004 12/40 www.pemex.com
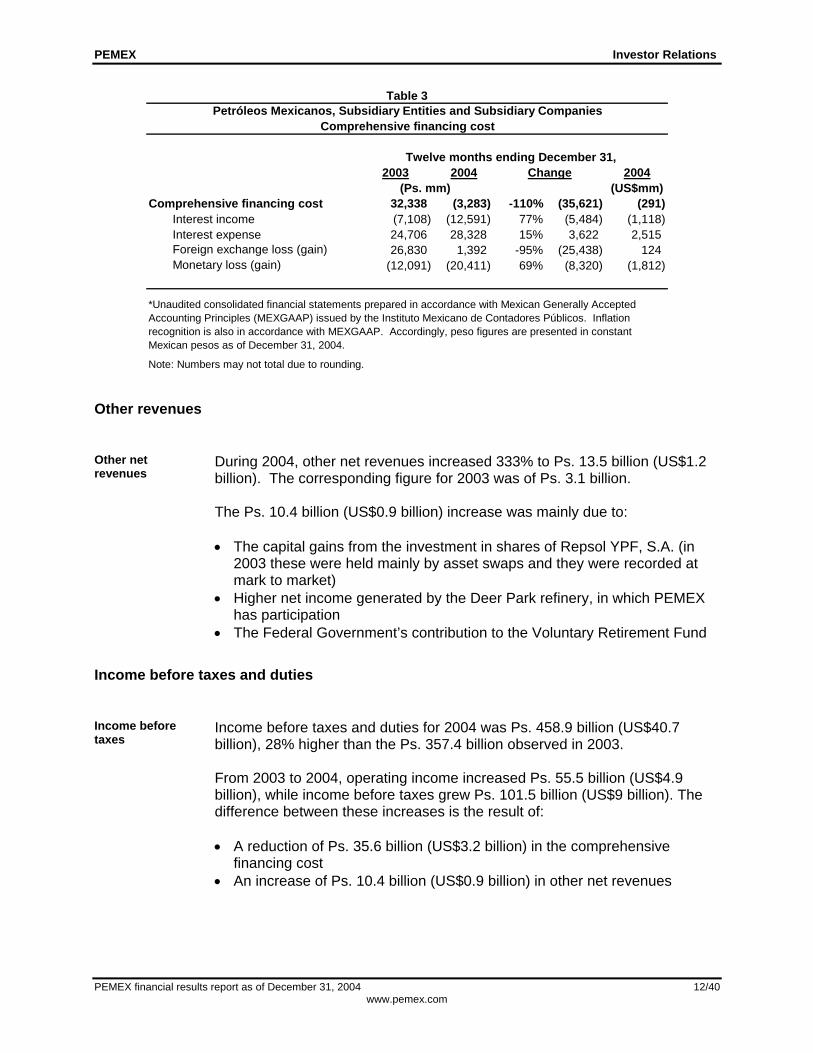
Table 3
Petróleos Mexicanos, Subsidiary Entities and Subsidiary Companies
Twelve months ending December 31, 2003 2004 Change 2004
(Ps. mm) (US$mm)Comprehensive financing cost 32,338 (3,283) -110% (35,621) (291)
Interest income (7,108) (12,591) 77% (5,484) (1,118) Interest expense 24,706 28,328 15% 3,622 2,515 Foreign exchange loss (gain) 26,830 1,392 -95% (25,438) 124 Monetary loss (gain) (12,091) (20,411) 69% (8,320) (1,812)
Note: Numbers may not total due to rounding.
Comprehensive financing cost
*Unaudited consolidated financial statements prepared in accordance with Mexican Generally Accepted Accounting Principles (MEXGAAP) issued by the Instituto Mexicano de Contadores Públicos. Inflation recognition is also in accordance with MEXGAAP. Accordingly, peso figures are presented in constant Mexican pesos as of December 31, 2004.
Other revenues
Other net revenues
During 2004, other net revenues increased 333% to Ps. 13.5 billion (US$1.2 billion). The corresponding figure for 2003 was of Ps. 3.1 billion. The Ps. 10.4 billion (US$0.9 billion) increase was mainly due to: • The capital gains from the investment in shares of Repsol YPF, S.A. (in
2003 these were held mainly by asset swaps and they were recorded at mark to market)
• Higher net income generated by the Deer Park refinery, in which PEMEX has participation
• The Federal Government’s contribution to the Voluntary Retirement Fund
Income before taxes and duties
Income before taxes
Income before taxes and duties for 2004 was Ps. 458.9 billion (US$40.7 billion), 28% higher than the Ps. 357.4 billion observed in 2003. From 2003 to 2004, operating income increased Ps. 55.5 billion (US$4.9 billion), while income before taxes grew Ps. 101.5 billion (US$9 billion). The difference between these increases is the result of: • A reduction of Ps. 35.6 billion (US$3.2 billion) in the comprehensive
financing cost • An increase of Ps. 10.4 billion (US$0.9 billion) in other net revenues
PEMEX Investor Relations
PEMEX financial results report as of December 31, 2004 13/40 www.pemex.com
Taxes and duties
18% increase Petróleos Mexicanos and its subsidiary entities pay taxes and duties
equivalent to 60.8% of total sales8. This includes the special tax on production and services (IEPS) that applies to gasoline. From 2003 to 2004 the taxes and duties paid increased 18%, from Ps. 402.3 billion to Ps. 473 billion (US$42 billion).
IEPS IEPS is paid by the end consumer of gasoline and PEMEX is an intermediary
between the Ministry of Finance (SHCP) and the end consumer. The Ministry of Finance determines the retail price of gasoline. Recently, gasoline prices have remained nearly unchanged because changes are linked to increases in the consumer price index. When PEMEX sells gasoline, it collects an amount based on an estimate of its production cost, assuming efficient refinery operation. The difference between the retail price and the cost that PEMEX collects is primarily IEPS. Therefore, when the crude price is high and so is the production cost of gasoline, the IEPS decreases. The converse is true when crude oil prices are low. In 2003, the weighted average crude oil export price was US$24.78 per barrel. For 2004, this price increased 25%, reaching US$31.02 per barrel. For 2004, IEPS decreased 45% to Ps. 54.7 billion (US$4.9 billion) from Ps. 99 billion (US$8.8 billion) during 2003.
Duty for infrastructure
In 2004, the duty for exploration, gas, refining and petrochemicals infrastructure (duty for infrastructure) replaced the prior excess gains duty. Both duties are equal to 39.2% of the revenues from crude oil export sales in excess of a threshold crude oil price set by the Mexican Government. In 2004, the threshold price was US$20.00 per barrel, compared to US$18.35 per barrel in 2003. Until 2004, there was no difference between both duties. In 2004, the duty for infrastructure was reimbursed to PEMEX. The Income Law (Ley de Ingresos de la Federación9) for the fiscal year 2004 established that “the proceeds from this duty… will be allocated to the investment in infrastructure in exploration, gas, refining and petrochemicals that Petróleos Mexicanos and its subsidiary entities perform.” In 2003, the excess gains duty paid by PEMEX was Ps. 19.7 billion (US$1.7 billion) and in 2004, the duty for infrastructure was Ps. 34.4 billion (US$3.1 billion).
8 PEMEX’s subsidiary companies that are located in México pay corporate income tax on the same basis as private sector companies in México. 9 Section XI “Aprovechamiento para Obras de Infraestructura en Materia de Exploración, Gas, Refinación y Petroquímica”, of Article 7, Chapter II “De las Obligaciones de Petróleos Mexicanos”.
PEMEX Investor Relations
PEMEX financial results report as of December 31, 2004 14/40 www.pemex.com
Reimbursement of the duty for infrastructure
PEMEX received reimbursements of the duty for infrastructure totaling Ps. 33 billion from the Ministry of Finance: • Ps. 12.5 billion received on September 30, 2004 • Ps. 8 billion received on December 15, 2004 • Ps. 12.5 billion received on December 31, 2004 The reimbursements will be destined to finance non-PIDIREGAS capital expenditures and amortizations of PIDIREGAS projects.
Accounting of the duty for infrastructure
Most of the Ps. 33 billion received was exchanged into US dollars, based on the allocation of non-PIDIREGAS investment and PIDIREGAS projects amortizations. Since the Mexican peso appreciated in dollar terms, the accounting of the reimbursement of this duty resulted in a Ps. 0.4 billion exchange loss. The Ps. 32.6 billion difference was deposited by PEMEX in a Trust. Therefore, the accounting registered was a debit to an account receivable and a credit to PEMEX's equity.
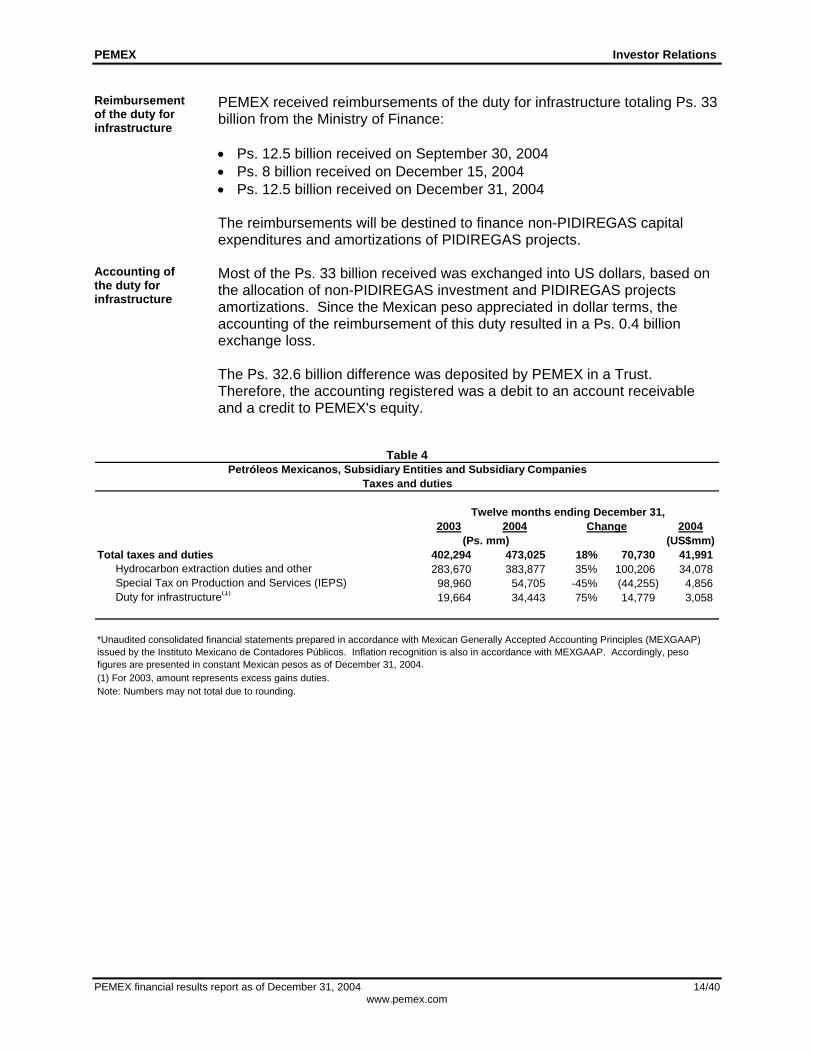
Table 4 Petróleos Mexicanos, Subsidiary Entities and Subsidiary Companies
Taxes and duties
Twelve months ending December 31, 2003 2004 Change 2004
(Ps. mm) (US$mm)Total taxes and duties 402,294 473,025 18% 70,730 41,991
Hydrocarbon extraction duties and other 283,670 383,877 35% 100,206 34,078 Special Tax on Production and Services (IEPS) 98,960 54,705 -45% (44,255) 4,856 Duty for infrastructure(1) 19,664 34,443 75% 14,779 3,058
(1) For 2003, amount represents excess gains duties.Note: Numbers may not total due to rounding.
*Unaudited consolidated financial statements prepared in accordance with Mexican Generally Accepted Accounting Principles (MEXGAAP) issued by the Instituto Mexicano de Contadores Públicos. Inflation recognition is also in accordance with MEXGAAP. Accordingly, peso figures are presented in constant Mexican pesos as of December 31, 2004.

PEMEX Investor Relations
PEMEX financial results report as of December 31, 2004 15/40 www.pemex.com
Net loss
Net loss of Ps. 14.1 billion
In 2004, PEMEX recorded a net loss of Ps. 14.1 billion (US$1.3 billion), compared to a net loss of Ps. 42.8 billion in 2003. The Ps. 28.6 billion (US$2.5 billion) decrease in the net loss is explained by: • An increase of Ps. 55.5 billion (US$4.9 billion) in operating income.
Excluding IEPS, operating income grew Ps. 99.7 billion (US$8.6 billion) • A decrease of Ps. 35.6 billion (US$3.2 billion) in the comprehensive
financing cost • An increase of Ps. 10.4 billion (US$0.9 billion) in other net revenues • The offsetting effect due to a Ps. 70.7 billion (US$6.3 billion) increase in
taxes and duties. Excluding IEPS, the increase in taxes and duties was Ps. 115 billion (US$10.2 billion)
• A favorable offsetting effect of Ps. 2.1 billion (US$0.2 billion) due to the initial accumulated effect of the implementation of accounting bulletin C-15 (impairment of assets)
EBITDA
EBITDA increased 35%
EBITDA increased 35% to Ps. 504.4 billion (US$44.8 billion) in 2004 from Ps. 374.1 billion in 2003. EBITDA is reconciled to net loss as shown in the following table:
Table 5
Petróleos Mexicanos, Subsidiary Entities and Subsidiary Companies
Twelve months ending December 31, 2003 2004 Change 2004
(Ps. mm) (US$mm)Net income (loss) (42,754) (14,142) -67% 28,612 (1,255) + Taxes and duties 402,294 473,025 18% 70,730 41,991 - Special Tax on Production and Services (IEPS) 98,960 54,705 -45% (44,255) 4,856 + Comprehensive financing cost 32,338 (3,283) -110% (35,621) (291) + Depreciation and amortization 43,844 50,737 16% 6,893 4,504 + Cost of the reserve for retirement payments 39,472 52,814 34% 13,342 4,688 - Cummulative effect due to the adoption of new accounting standards 2,117 - (2,117) - EBITDA 374,117 504,446 35% 130,329 44,781
Note: Numbers may not total due to rounding.
EBITDA reconciliation
*Unaudited consolidated financial statements prepared in accordance with Mexican Generally Accepted Accounting Principles (MEXGAAP) issued by the Instituto Mexicano de Contadores Públicos. Inflation recognition is also in accordance with MEXGAAP. Accordingly, peso figures are presented in constant Mexican pesos as of December 31, 2004.
PEMEX Investor Relations
PEMEX financial results report as of December 31, 2004 16/40 www.pemex.com
Total assets
Total assets increased 15%
As of December 31, 2004, total assets were Ps. 1,018.3 billion (US$90.4 billion), representing a 15%, or a Ps. 129 billion (US$11.4 billion) increase with respect to total assets as of December 31, 2003. • Cash and cash equivalents increased 10%, or Ps. 7.8 billion (US$0.7
billion) • Accounts receivable increased 73%, or Ps. 53.7 billion (US$4.8 billion) • Valuation of inventories increased 21%, or Ps. 6.2 billion (US$0.6 billion),
as a result of higher hydrocarbon prices • Plant, property and equipment rose 8%, or Ps. 46.3 billion (US$4.1 billion),
reflecting new investments • Other assets increased 11%, or Ps. 15.1 billion (US$1.3 billion), mainly as
a result of the increase in value of PEMEX’s shareholdings in Repsol YPF, S.A., through the RepCon Lux S.A.
Total liabilities
Liabilities increased 14%
Total liabilities increased 14% to Ps. 960.3 billion (US$85.2 billion), with respect to December 31, 2003. • Short-term liabilities decreased 8% to Ps. 132.7 billion (US$11.8 billion),
primarily as a result of the decrease in short term documented debt • Long-term liabilities increased 19% to Ps. 827.5 billion (US$73.5 billion),
due to the increase in long-term documented debt Total debt is discussed at greater length under “Financing Activities”.

PEMEX Investor Relations
PEMEX financial results report as of December 31, 2004 17/40 www.pemex.com
Reserve for retirement payments
The reserve for retirement payments, pensions and seniority premiums increased 16% to Ps. 347.2 billion (US$30.8 billion) from Ps. 300.6 billion as of December 31, 2003. The increase of Ps. 46.6 billion (US$4.1 billion) resulted from: • An increase of Ps. 11.5 billion (US$1billion) due to a decrease in the
pension fund • An increase of Ps. 10.3 billion (US$0.9 billion) due to the difference
between the realized and the expected wages’ negotiation • An increase of Ps. 10 billion (US$0.9 billion) due to changes in actuarial
assumptions • An increase of Ps. 8.3 billion (US$0.7 billion) caused by the incorporation
of future medical services for retirement, according to accounting bulletin D-3
• An increase of Ps. 4.9 billion (US$0.4 billion) due to a decrease of one year in the funding period
• An increase of Ps. 1.6 billion (US$0.1 billion) due to the seniority annual growth
Equity
Equity increase of Ps. 9.8 billion
As of December 31, 2004, PEMEX’s equity increased 20%, or Ps. 9.8 billion (US$0.9 billion) to Ps 58.1 billion (US$5.2 billion) from Ps. 48.2 billion as of December 31, 2003. The increase is primarily explained by the Ps. 32.6 billion (US$2.9 billion) equity contribution from the reimbursement of the duty for exploration, gas, refining and petrochemicals infrastructure.
Results by segment Sales increase Total sales of each subsidiary entity increased from 2003 to 2004. E&P and Gas had positive operating income
Exploration and Production and Gas and Basic Petrochemicals registered positive operating income, while the rest of the subsidiary entities reported operating losses. Relative to 2003, operating results for each business line improved.

PEMEX Investor Relations
PEMEX financial results report as of December 31, 2004 18/40 www.pemex.com
E&P net loss due to the tax burden
The net loss of PEMEX Exploration and Production, which caused the net loss of the Corporate and its subsidiary companies is primarily attributed to the increase in the tax and duties (excluding IEPS) payment, from Ps. 303.3 billion to Ps. 418.3 billion (US$37.1 billion). The increase in tax and duties paid by PEMEX Exploration and Production was US$10.2 billion.
Statement of changes in financial position Funds used in operating activities
During 2004 funds used in operating activities totaled Ps. 1.1 billion (US$0.1 billion), mainly due to: • An increase in accounts, notes receivable and other due to the
reimbursement of the duty for infrastructure • The impact on monetary gains as a consequence of the higher annual
inflation observed in 2004 relative to 2003. This is a non-cash item Funds used in investing activities
During 2004 funds used in investing activities totaled Ps. 95 billion (US$8.4 billion) as a result of an increase in fixed assets. The main difference between realized capital expenditure and the increase in fixed assets is due to exploration investment and maintenance expenditures.
PEMEX Investor Relations
PEMEX financial results report as of December 31, 2004 19/40 www.pemex.com
Financing activities
Capital expenditures (CAPEX)
2004 CAPEX Capital expenditures for 2004 totaled US$10.1 billion, based on an exchange
rate of Ps. 11.6 per US dollar. CAPEX were allocated as follows: • Exploration and Production 92% • Refining 4% • Gas and basic petrochemicals 2% • Petrochemicals 1% • Others 1% Nearly 90% of 2004 capital expenditures, or US$9.1 billion, were used to fund PIDIREGAS projects.
2005 CAPEX projected allocation
In 2005, projected capital expenditures are US$11.2 billion, based on an exchange rate of Ps. 11.6 per US dollar, and is expected to be allocated as follows: • Exploration and Production 85%, consisting of exploration 18.6%,
production 49% and maintenance 17% • Refining 10% • Gas and basic petrochemicals 3% • Petrochemicals 2% • Others 0.4% Nearly 88% of 2005 projected capital expenditures, or US$9.9 billion, will be used to fund PIDIREGAS.

PEMEX Investor Relations
PEMEX financial results report as of December 31, 2004 20/40 www.pemex.com
Financing activities
2004 financing As of December 31, 2004, US$9.5 billion were raised as follows:
• US$4.3 billion in foreign capital markets • US$2.5 billion in the Mexican capital market • US$1.4 billion from export credit agencies (ECA’s) • US$1.3 billion in bank loans Approximately 60% has been raised in the international markets and the rest in the Mexican market. Since market conditions were favorable, PEMEX pre-funded part of its 2005 financing requirements by approximately US$1.5 billion.
2005 financing program
In 2005, PEMEX plans to raise an additional US$8.5 billion, approximately. Around 60% will be raised in foreign capital markets and the rest in the Mexican market. • US$2.5 billion in foreign capital markets • US$2.7 billion in the Mexican capital market • US$0.8 billion from export credit agencies (ECA’s) • US$2.5 billion in bank loans
Capital markets
Exchange offer PEMEX’s strategy in the capital markets aims to reduce the number of issues
and increase their liquidity. As a consequence, in December 2004, Petróleos Mexicanos and the Pemex Project Funding Master Trust concluded exchange offers relating to bonds of the former to bonds of the latter. The principal amount exchanged was US$2.3 billion, which was 77% of the aggregate principal amount eligible for the exchange offer. The market value of the amount exchanged as of December 31, 2004 was US$2.9 billion.
PEMEX Investor Relations
PEMEX financial results report as of December 31, 2004 21/40 www.pemex.com
Short-term notes program
In July 2004, Petróleos Mexicanos and the Mexican Trust F/163 established a Ps.10 billion short term notes program, which will also be used to fund working capital needs. Under this program, either Petróleos Mexicanos or Trust F/163 may issue notes having maturities of less than 360 days. The characteristics of note issuances under this program are found in annex Table A7.
Master Trust During 2004, the Pemex Project Funding Master Trust, a Delaware trust
controlled by, and whose debt is guaranteed by PEMEX, issued: • On June 15, 2004, US$1.5 billion of its floating-rate notes due 2010 • On August 5, 2004, EUR850 million of its 6.375% notes due 2016 • On September 28, 2004, US$1.75 billion of its 7.75% perpetual bond with
an option to redeem in full beginning in year five On February 24, 2005, the Pemex Project Funding Master Trust issued EUR1,000 million of its 5,5% notes due 2025.
F/163 During the third quarter of 2004, Trust F/163 reopened its peso bond
issuances of October, 2003. Including the first issuance on October 24, 2003 and the reopenings of January and March, 2004, the aggregate amount of the peso bonds issued totals Ps. 32.7 billion, distributed as follows: • Ps. 13 billion of floating rate instruments due 2007 • Ps. 13.5 billion of floating rate instruments due 2009 • Ps. 6.2 billion of 8.38% instruments due 2010 On December 23, 2004, Trust F/163 issued notes in the Mexican market. The amount was settled in UDI’s equivalent to Ps. 5.0 billion. The notes issued are zero-coupon with a 9.01% interest rate and 15 years maturity. On February 1, 2005, the issuance was reopened for UDI’s equivalent to Ps. 6 billion with a 9.07% interest rate. On February 11, 2005 Trust F/163 issued Ps.15 billion notes in the Mexican market. The issuance was done in two tranches: • A principal amount of Ps. 7.5 billion, with an interest rate equal to 91 days
CETES plus 51 basis points due in 2010 • A principal amount of Ps. 7.5 billion, with an interest rate equal to 182 days
CETES plus 57 basis points due in 2013

PEMEX Investor Relations
PEMEX financial results report as of December 31, 2004 22/40 www.pemex.com
Petróleos Mexicanos
On June 30, 2004, Petróleos Mexicanos obtained a syndicated revolving credit facility that will be used to fund working capital needs. The facility is divided in two tranches: • US$600 million maturing on December 31, 2007 with an interest rate of
LIBOR plus 0.55% • US$650 million maturing on June 30, 2009 with an interest rate of LIBOR
plus 0.75% This syndicated revolving credit facility replaced two banker’s acceptance credit facilities totaling US$785 million, and a commercial paper program of US$445 million. As of today, this syndicated revolving credit facility has not been used.
RepCon Lux On January 26, 2004, RepCon Lux S.A., a financing vehicle formed in
Luxembourg, issued US$1.37 billion of its 4.5% guaranteed exchangeable bonds due 2011. These bonds are guaranteed by PEMEX and are exchangeable into shares of Repsol YPF, S.A. or, at the option of the issuer, the cash equivalent thereof.
Total debt
Total net debt of US$44.9 billion
As of December 31, 2004, total consolidated debt including accrued interest was Ps. 505.3 billion (US$44.9 billion). This figure represents an increase of 15%, or Ps.67.1 billion, compared to the figure recorded on December 31, 2003. Total debt includes: • Documented debt of Petróleos Mexicanos, the Pemex Project Funding
Master Trust, Trust F/163 and RepCon Lux S.A. • Notes payable to contractors • Sale of future accounts receivable (representing Pemex Finance debt of
US$3.6 billion as of December 31, 2004) Net debt, or the difference between debt and cash equivalents, increased Ps. 59.3 billion, to Ps. 420.4 billion (US$ 37.3 billion) as of December 31, 2004, from Ps. 361.1 billion as of December 31, 2003.

PEMEX Investor Relations
PEMEX financial results report as of December 31, 2004 23/40 www.pemex.com
Table 6
As of December 31,2003 2004 Change 2004
(Ps. mm) (US$mm)Documented debt(1) 379,861 441,333 16% 61,471 39,178
Short-term 60,488 46,783 -23% (13,705) 4,153 Long-term 319,373 394,549 24% 75,176 35,025
- Notes payable to contractors 15,807 27,355 73% 11,549 2,428
Short-term 1,985 1,880 -5% (105) 167 Long-term 13,822 25,476 84% 11,654 2,262
- Sale of future accounts receivable(2) 42,557 36,636 -14% (5,921) 3,252
Long-term 42,557 36,636 -14% (5,921) 3,252 -
438,225 505,324 15% 67,099 44,859 Short-term 62,474 48,663 -22% (13,810) 4,320 Long-term 375,752 456,661 22% 80,909 40,539
Cash & cash equivalents 77,143 84,898 10% 7,755 7,537
Total net debt 361,082 420,426 16% 59,344 37,322
(1) Consistent with Securities and Exchange Commission filings.
(2) Represents Pemex Finance debt.
Note: Numbers may not total due to rounding.
*Unaudited consolidated financial statements prepared in accordance with Mexican Generally Accepted Accounting Principles (MEXGAAP) issued by the Instituto Mexicano de Contadores Públicos. Inflation recognition is also in accordance with MEXGAAP. Accordingly, peso figures are presented in constant Mexican pesos as of December 31, 2004.
Petróleos Mexicanos, Subsidiary Entities and Subsidiary CompaniesConsolidated total debt
Total debt
Short-term debt
Total debt with a remaining maturity of less than twelve months was Ps. 48.7 billion (US$4.3 billion) as of December 31, 2004, including: • Ps. 46.8 billion (US$4.2 billion) in documented debt • Ps. 1.9 billion (US$0.2 billion) in notes payable to contractors As of December 31, 2003, the corresponding amounts were Ps. 60.5 billion and Ps. 2 billion, respectively and total short-term debt was Ps. 62.5 billion.

PEMEX Investor Relations
PEMEX financial results report as of December 31, 2004 24/40 www.pemex.com
Long-term debt
Total long-term debt as of December 31, 2004 was Ps. 456.7 billion (US$40.5 billion). This figure includes: • Ps. 394.5 billion (US$35 billion) in documented debt • Ps. 25.5 billion (US$2.3 billion) in notes payable to contractors • Ps. 36.6 billion (US$3.3 billion) in sale of future accounts receivable As of December 31, 2003 these figures were Ps. 319.4 billion, Ps. 13.8 billion and Ps. 42.6 billion, respectively, and total long-term debt was Ps. 375.8 billion.
Financial ratios
The ratio of EBITDA to interest expense (excluding capitalized interest) was 17.8 as of December 31, 2004, compared to 15.1 as of the same date of 2003. The ratio of EBITDA to net interest expense was 32.1 as of December 31, 2004, compared to 21.3 as of December 31, 2003.
Maturity profile The following table shows the maturity profile of PEMEX’s total debt by
currency:
Table 7
As of December 31, 2004(Ps. mm) US$mm
Documented debt in pesos 66,563 5,909 One year 3,614 321
Two years 3,944 350 Three years 17,944 1,593 Four years 4,944 439
Five years and beyond 36,116 3,206
Documented debt in other currencies 438,761 38,950 One year 45,050 3,999
Two years 66,259 5,882 Three years 48,996 4,349 Four years 48,172 4,276
Five years and beyond 230,284 20,443
Total debt 505,324 44,859
Note: Numbers may not total due to rounding.
*Unaudited consolidated financial statements prepared in accordance with Mexican Generally Accepted Accounting Principles (MEXGAAP) issued by the Instituto Mexicano de Contadores Públicos. Inflation recognition is also in accordance with MEXGAAP. Accordingly, peso figures are presented in constant Mexican pesos as of December 31, 2004.
Petróleos Mexicanos, Subsidiary Entities and Subsidiary CompaniesMaturity profile

PEMEX Investor Relations
PEMEX financial results report as of December 31, 2004 25/40 www.pemex.com
Increase of duration
PEMEX aims to increase the duration of its outstanding debt in order to make it comparable to that of other oil and gas companies with similar credit ratings. The average duration of the debt exposure is presented in the following table.
Table 8
Petróleos Mexicanos, Subsidiary Entities and Subsidiary CompaniesAverage duration of debt exposure
As of December 31,2003 2004 Change
(Years)U.S. Dollars 3.7 4.2 0.5Mexican pesos 0.6 1.3 0.8Euros 0.7 1.1 0.4Japanese yen 3.3 2.8 (0.5)Swiss francs 0.5 0.5 0.0Total 3.5 3.8 0.3
Note: Numbers may not total due to rounding.
Interest rate risk
PEMEX´s policy is to maintain a balance between fixed and floating rate liabilities, in order to mitigate the impact of fluctuations in interest rates. As of December 31, 2004, approximately 62% of PEMEX’s debt exposure carried a fixed interest rate, and 38% of its debt bore interest at floating rates.
Mainly US$ at fixed rate
As a consequence of issuance of peso-denominated securities, PEMEX’s US dollar debt exposure has decreased 4 percentage points from December 31, 2003 to the same date of 2004.
Debt exposure
The following table sets forth PEMEX’s debt exposure to currency and interest rate risk:
Table 9
Petróleos Mexicanos, Subsidiary Entities and Subsidiary CompaniesDebt exposure
(without accrued interest)
As of December 31,2003 2004 2003 2004 2003 2004
PercentageBy currency At fixed rate At floating rate
U.S. Dollars 93.1% 85.1% 65.60% 69.49% 34.40% 30.51%Mexican pesos 6.5% 14.7% 11.98% 39.36% 88.02% 60.64%Euros 0.02% 0.01% 10.48% 19.31% 89.52% 80.69%Japanese yen 0.3% 0.2% 100.00% 100.00% 0.00% 0.00%Swiss francs 0.0011% 0.0005% 0.00% 0.00% 100.00% 100.00%Total 100.00% 100.00% 62.19% 65.14% 37.81% 34.86%
Note: Numbers may not total due to rounding.

PEMEX Investor Relations
PEMEX financial results report as of December 31, 2004 26/40 www.pemex.com
Crude oil price risk
In September 2004, PEMEX arranged a short term hedging program in order to mitigate the impact of crude oil price volatility on its cash flows. The program consists of the acquisition of options in order to hedge against potential price crude oil reductions for the rest of the year. The underlying crude volume accounted for approximately 7% of PEMEX’s annual crude oil production. This program ended December 31, 2004. Due to high crude prices, these options expired with out being exercised.
Other relevant developments Oil spillages Recently, sizable spillages of crude oil and derivatives have occurred in the
States of Veracruz and Tabasco. On December 22, 2004, a fire took place in the Mazumiapan pumping station of the 30-inch Nuevo Teapa - Poza Rica oil pipeline. This accident caused the rupture of the pipeline, spilling 5 Mb of crude oil in the region of Nanchital, Veracruz. On December 31, 2004, a crude oil spillage took place in the state of Tabasco due to a rupture of a 16-inch pipeline running from Cunduacán Storage and Pumping Central to Dos Bocas Maritime Terminal. On January 24, 2005 a light naptha spillage was registered in the region of Agua Dulce, Veracruz. The accident occurred due to the rupture of a 12-inch gasoline pipeline running from the Cactus Gas Processing Center to La Cangrejera Petrochemical Center. In collaboration with the Veracruz Government, the Mexican Army and Navy, the Ministry of Environment and Natural Resources, the Ministry of Health, municipal authorities, Veracruz University, Civil Protection, local communities and specialized companies, among others, PEMEX has implemented contingency plans to protect and reestablish the health and integrity of the population and counteract the environmental impact.
PEMEX Investor Relations
PEMEX financial results report as of December 31, 2004 27/40 www.pemex.com
Fiscal regime in 2005
In 2005 PEMEX will pay a hydrocarbon duty equivalent to 60.8% of its sales revenues. It will also pay an excess gains duty on the value of crude oil exports if the crude oil export average price per barrel exceeds US$23.00. The excess gains duty will be 39.2% of the revenue from crude oil export sales in excess of US$23.00 per barrel, multiplied by the crude oil export volume. The excess gains duty generated for amounts in excess of US$27.00 per barrel will be destined: • 50% to PEMEX capital expenditures in exploration, production, refining,
gas and petrochemical activities • 50% to infrastructure and equipment investment programs and projects of
other federal entities
PEMEX Investor Relations
PEMEX financial results report as of December 31, 2004 28/40 www.pemex.com
Proposed PEMEX’s fiscal regime
On October 28, 2004, the Chamber of Deputies approved a new fiscal regime for PEMEX.10 It remains subject to approval by the Senate. Under this proposal, PEMEX’s Exploration and Production tax regime would be governed by the “Ley Federal de Derechos” and the taxes for the other subsidiary entities would continue to be governed by the “Ley de Ingresos de la Federación”. If passed, the new fiscal regime for PEMEX Exploration and Production would consist of the following duties: • Duty for hydrocarbons extraction, which is paid on the value of production
of crude oil and natural gas (net of quantities used for production). This duty distinguishes crude oil from natural gas production and separates existing from new hydrocarbons.11 Sales of existing crude oil (as defined in the proposal) would be taxed at a rate ranging from 35.1 to 74.8%, depending on the sales price,12 and new crude oil would be taxed at a 25% rate. Sales of existing gas would be taxed at a rate of 15%, while new gas would be taxed at a 10% rate. This duty would have exemptions of up to 30 barrels of crude oil per day per producing well and up to one million cubic feet per day of non-associated natural gas per well
• Duty for hydrocarbons for the stabilization fund, which is paid on the value of the extracted crude oil production, would range from 1% to 10%, depending on the average Mexican crude oil export price, and only if the crude oil export price exceeds US$22 per barrel13
• Extraordinary duty for crude oil exports of 13.1%, paid on the value of exports when the average export price of the Mexican crude oil basket exceeds the price estimated by the Congress each year. This duty is to be credited against the duty for hydrocarbons for the stabilization fund
• Ordinary duty for hydrocarbons of 69% on the value of extracted production minus certain permitted deductions (including for certain investments, some costs and expenses, and the other duties)14
The purpose of the new fiscal regime is to strengthen PEMEX’s competitiveness and to contribute to improve its financial position.
10 Dictamen de las Comisiones Unidas de Energía y de Hacienda y Crédito Público 11 Refer to “Existing and new hydrocarbons’ limits calculation” in the Annex 12 Table A8 in the Annex 13 Table A9 in the Annex 14 Table A10 in the Annex
PEMEX Investor Relations
PEMEX financial results report as of December 31, 2004 29/40 www.pemex.com
Credit rating upgrade
On February 1, 2005, Standard & Poor’s Ratings Services (S&P) raised the foreign currency long-term corporate credit rating on PEMEX and on the Pemex Project Funding Master Trust to BBB from BBB-. S&P also raised the PEMEX and RepConLux S.A. unsecured foreign currency ratings to BBB from BBB-. At the same time, S&P affirmed PEMEX’s (A-) local currency credit rating, its (mxAAA) national scale corporate credit rating, and the (mxAAA) national scale senior unsecured rating assigned to Fideicomiso F/163, as well as PEMEX’s and Fideicomiso F/163 rating for their (mxA-1+) short term note programs. The rating actions follow the upgrade of the foreign currency sovereign ratings on Mexico to BBB from BBB- and the confirmation of its local currency rating of A-. The upgrade on PEMEX is, according to S&P, “consistent with S&P’s opinion that PEMEX’s importance to the country constitutes a strong economic incentive for the sovereign to support the issuer during a period of financial distress.… Despite the fact that PEMEX’s debt is not guaranteed by the Mexican government, S&P acknowledges that PEMEX's debt has received pari passu treatment with direct debt of the sovereign in previous restructurings of Mexico’s external debt. Additionally, certain notes issued by PEMEX contain collective action clauses that are also included in some notes issued by the sovereign, again indicating the tight relationship between the debt management of United Mexican States and PEMEX.” S&P considered the outlook for PEMEX’s foreign currency rating to be stable.
Director General of PEMEX
On November 1, 2004, Luis Ramírez Corzo replaced Raúl Muñoz Leos as General Director of Petróleos Mexicanos. Before his appointment, Luis Ramírez Corzo was General Director of PEMEX Exploración y Producción.
PEMEX Investor Relations
PEMEX financial results report as of December 31, 2004 30/40 www.pemex.com
Annex
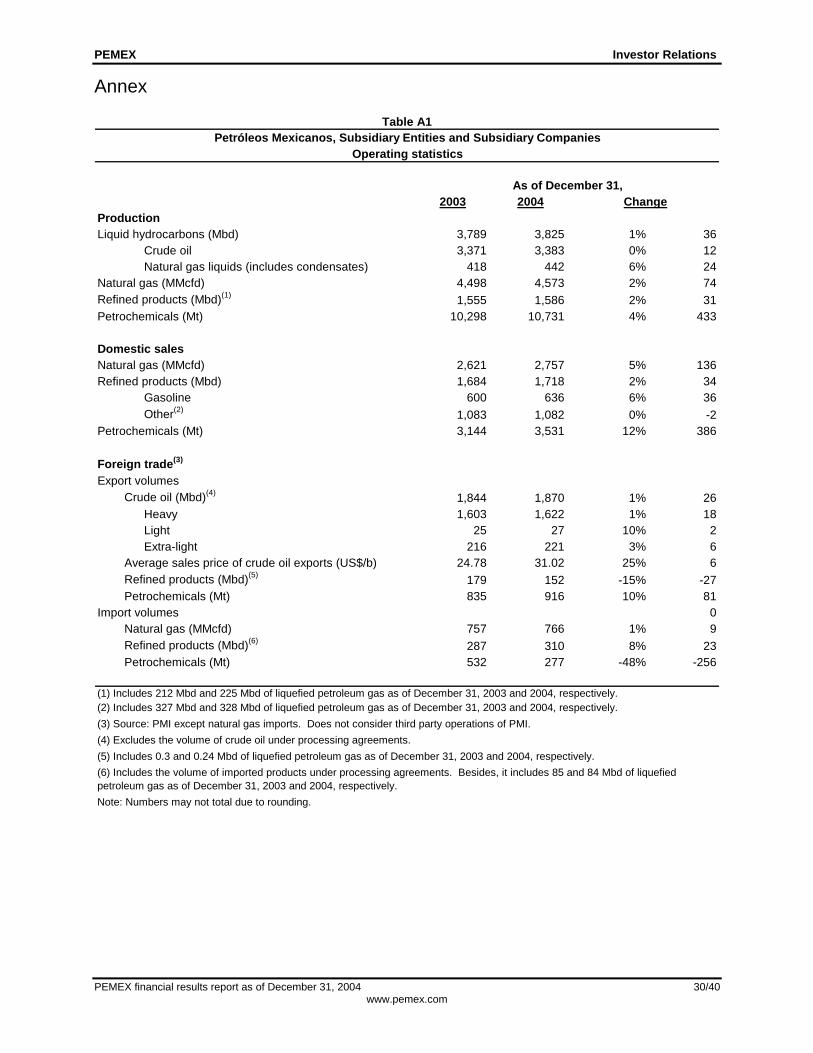
Table A1 Petróleos Mexicanos, Subsidiary Entities and Subsidiary Companies
Operating statistics
As of December 31,2003 2004 Change
ProductionLiquid hydrocarbons (Mbd) 3,789 3,825 1% 36
Crude oil 3,371 3,383 0% 12Natural gas liquids (includes condensates) 418 442 6% 24
Natural gas (MMcfd) 4,498 4,573 2% 74Refined products (Mbd)(1) 1,555 1,586 2% 31Petrochemicals (Mt) 10,298 10,731 4% 433
Domestic salesNatural gas (MMcfd) 2,621 2,757 5% 136Refined products (Mbd) 1,684 1,718 2% 34
Gasoline 600 636 6% 36Other(2) 1,083 1,082 0% -2
Petrochemicals (Mt) 3,144 3,531 12% 386
Foreign trade(3)
Export volumesCrude oil (Mbd)(4) 1,844 1,870 1% 26
Heavy 1,603 1,622 1% 18Light 25 27 10% 2Extra-light 216 221 3% 6
Average sales price of crude oil exports (US$/b) 24.78 31.02 25% 6Refined products (Mbd)(5) 179 152 -15% -27Petrochemicals (Mt) 835 916 10% 81
Import volumes 0Natural gas (MMcfd) 757 766 1% 9Refined products (Mbd)(6) 287 310 8% 23Petrochemicals (Mt) 532 277 -48% -256
(1) Includes 212 Mbd and 225 Mbd of liquefied petroleum gas as of December 31, 2003 and 2004, respectively.(2) Includes 327 Mbd and 328 Mbd of liquefied petroleum gas as of December 31, 2003 and 2004, respectively.(3) Source: PMI except natural gas imports. Does not consider third party operations of PMI.(4) Excludes the volume of crude oil under processing agreements.(5) Includes 0.3 and 0.24 Mbd of liquefied petroleum gas as of December 31, 2003 and 2004, respectively.
Note: Numbers may not total due to rounding.
(6) Includes the volume of imported products under processing agreements. Besides, it includes 85 and 84 Mbd of liquefied petroleum gas as of December 31, 2003 and 2004, respectively.
PEMEX Investor Relations
PEMEX financial results report as of December 31, 2004 31/40 www.pemex.com
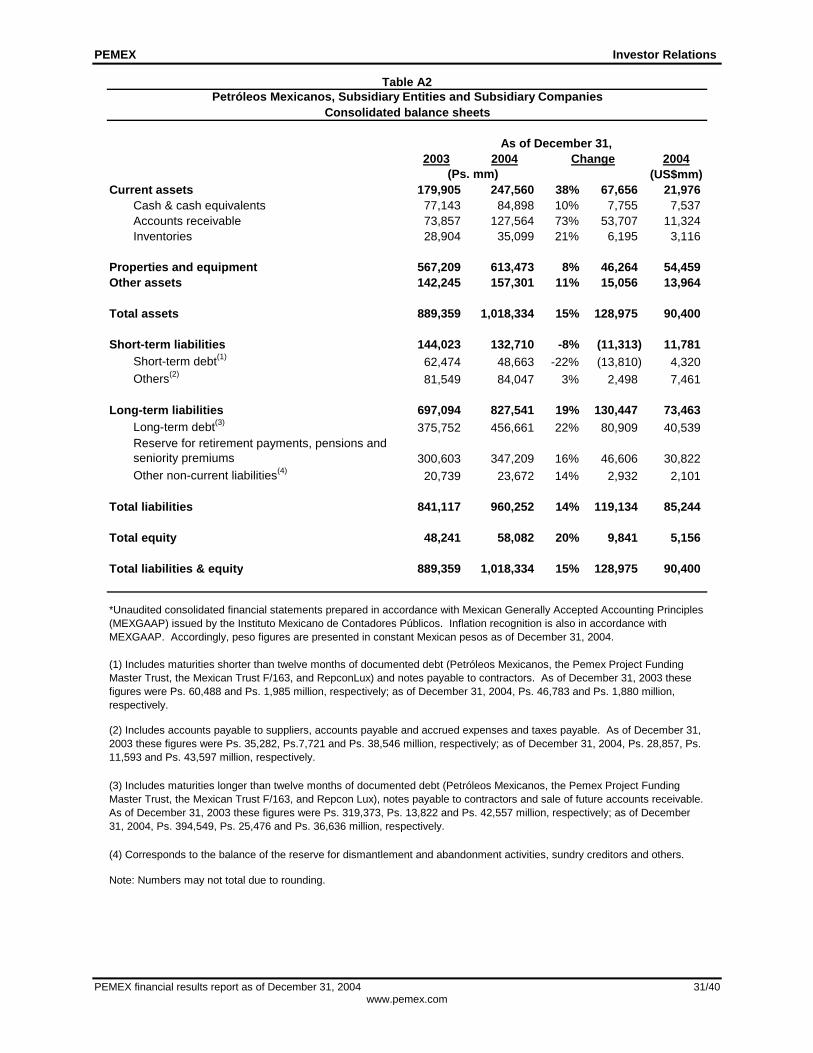
Table A2 Petróleos Mexicanos, Subsidiary Entities and Subsidiary Companies
Consolidated balance sheets
As of December 31,2003 2004 Change 2004
(Ps. mm) (US$mm)Current assets 179,905 247,560 38% 67,656 21,976
Cash & cash equivalents 77,143 84,898 10% 7,755 7,537 Accounts receivable 73,857 127,564 73% 53,707 11,324 Inventories 28,904 35,099 21% 6,195 3,116
Properties and equipment 567,209 613,473 8% 46,264 54,459 Other assets 142,245 157,301 11% 15,056 13,964
Total assets 889,359 1,018,334 15% 128,975 90,400
Short-term liabilities 144,023 132,710 -8% (11,313) 11,781 Short-term debt(1) 62,474 48,663 -22% (13,810) 4,320 Others(2) 81,549 84,047 3% 2,498 7,461
Long-term liabilities 697,094 827,541 19% 130,447 73,463 Long-term debt(3) 375,752 456,661 22% 80,909 40,539 Reserve for retirement payments, pensions and seniority premiums 300,603 347,209 16% 46,606 30,822 Other non-current liabilities(4) 20,739 23,672 14% 2,932 2,101
Total liabilities 841,117 960,252 14% 119,134 85,244
Total equity 48,241 58,082 20% 9,841 5,156
Total liabilities & equity 889,359 1,018,334 15% 128,975 90,400
Note: Numbers may not total due to rounding.
(4) Corresponds to the balance of the reserve for dismantlement and abandonment activities, sundry creditors and others.
*Unaudited consolidated financial statements prepared in accordance with Mexican Generally Accepted Accounting Principles (MEXGAAP) issued by the Instituto Mexicano de Contadores Públicos. Inflation recognition is also in accordance with MEXGAAP. Accordingly, peso figures are presented in constant Mexican pesos as of December 31, 2004.
(1) Includes maturities shorter than twelve months of documented debt (Petróleos Mexicanos, the Pemex Project Funding Master Trust, the Mexican Trust F/163, and RepconLux) and notes payable to contractors. As of December 31, 2003 these figures were Ps. 60,488 and Ps. 1,985 million, respectively; as of December 31, 2004, Ps. 46,783 and Ps. 1,880 million, respectively.
(2) Includes accounts payable to suppliers, accounts payable and accrued expenses and taxes payable. As of December 31, 2003 these figures were Ps. 35,282, Ps.7,721 and Ps. 38,546 million, respectively; as of December 31, 2004, Ps. 28,857, Ps. 11,593 and Ps. 43,597 million, respectively.
(3) Includes maturities longer than twelve months of documented debt (Petróleos Mexicanos, the Pemex Project Funding Master Trust, the Mexican Trust F/163, and Repcon Lux), notes payable to contractors and sale of future accounts receivable. As of December 31, 2003 these figures were Ps. 319,373, Ps. 13,822 and Ps. 42,557 million, respectively; as of December 31, 2004, Ps. 394,549, Ps. 25,476 and Ps. 36,636 million, respectively.
PEMEX Investor Relations
PEMEX financial results report as of December 31, 2004 32/40 www.pemex.com
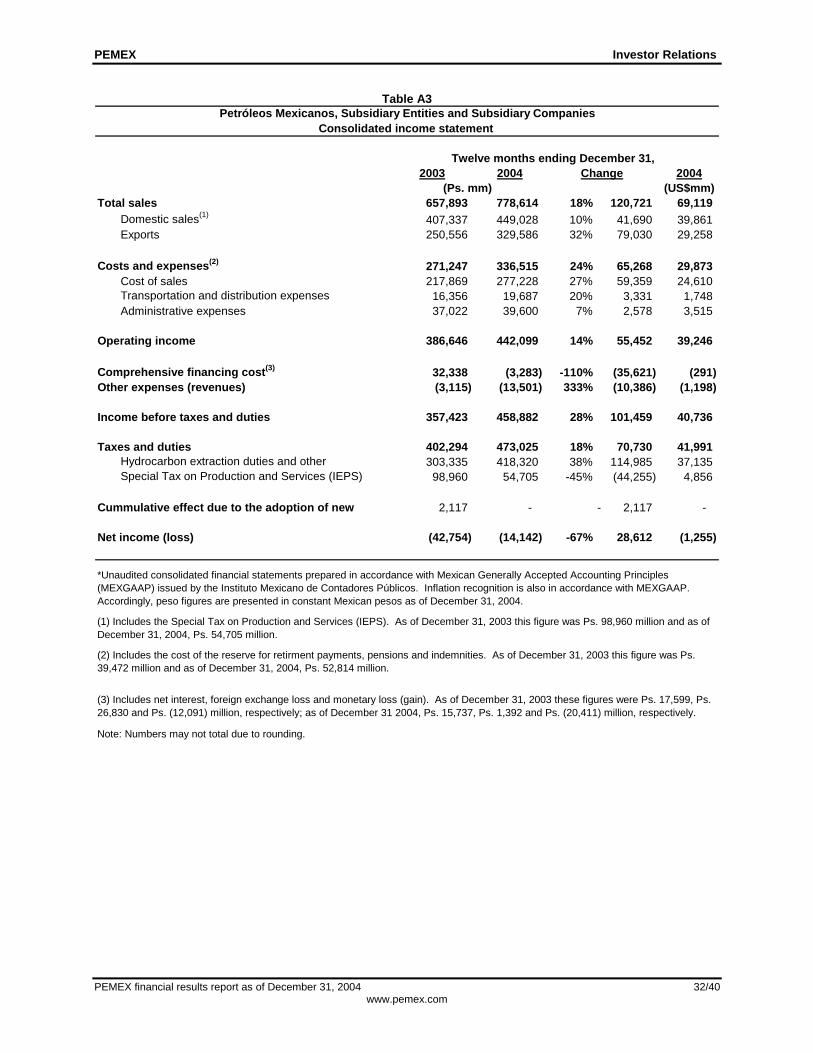
Table A3
Petróleos Mexicanos, Subsidiary Entities and Subsidiary CompaniesConsolidated income statement
Twelve months ending December 31, 2003 2004 Change 2004
(Ps. mm) (US$mm)Total sales 657,893 778,614 18% 120,721 69,119
Domestic sales(1) 407,337 449,028 10% 41,690 39,861 Exports 250,556 329,586 32% 79,030 29,258
Costs and expenses(2) 271,247 336,515 24% 65,268 29,873 Cost of sales 217,869 277,228 27% 59,359 24,610 Transportation and distribution expenses 16,356 19,687 20% 3,331 1,748 Administrative expenses 37,022 39,600 7% 2,578 3,515
386,646 442,099 14% 55,452 39,246
Comprehensive financing cost(3) 32,338 (3,283) -110% (35,621) (291) Other expenses (revenues) (3,115) (13,501) 333% (10,386) (1,198)
Income before taxes and duties 357,423 458,882 28% 101,459 40,736
Taxes and duties 402,294 473,025 18% 70,730 41,991 Hydrocarbon extraction duties and other 303,335 418,320 38% 114,985 37,135 Special Tax on Production and Services (IEPS) 98,960 54,705 -45% (44,255) 4,856
2,117 - 2,117- -
Net income (loss) (42,754) (14,142) -67% 28,612 (1,255)
Note: Numbers may not total due to rounding.
(1) Includes the Special Tax on Production and Services (IEPS). As of December 31, 2003 this figure was Ps. 98,960 million and as of December 31, 2004, Ps. 54,705 million.
(3) Includes net interest, foreign exchange loss and monetary loss (gain). As of December 31, 2003 these figures were Ps. 17,599, Ps. 26,830 and Ps. (12,091) million, respectively; as of December 31 2004, Ps. 15,737, Ps. 1,392 and Ps. (20,411) million, respectively.
(2) Includes the cost of the reserve for retirment payments, pensions and indemnities. As of December 31, 2003 this figure was Ps. 39,472 million and as of December 31, 2004, Ps. 52,814 million.
Operating income
*Unaudited consolidated financial statements prepared in accordance with Mexican Generally Accepted Accounting Principles (MEXGAAP) issued by the Instituto Mexicano de Contadores Públicos. Inflation recognition is also in accordance with MEXGAAP. Accordingly, peso figures are presented in constant Mexican pesos as of December 31, 2004.
Cummulative effect due to the adoption of new
PEMEX Investor Relations
PEMEX financial results report as of December 31, 2004 33/40 www.pemex.com
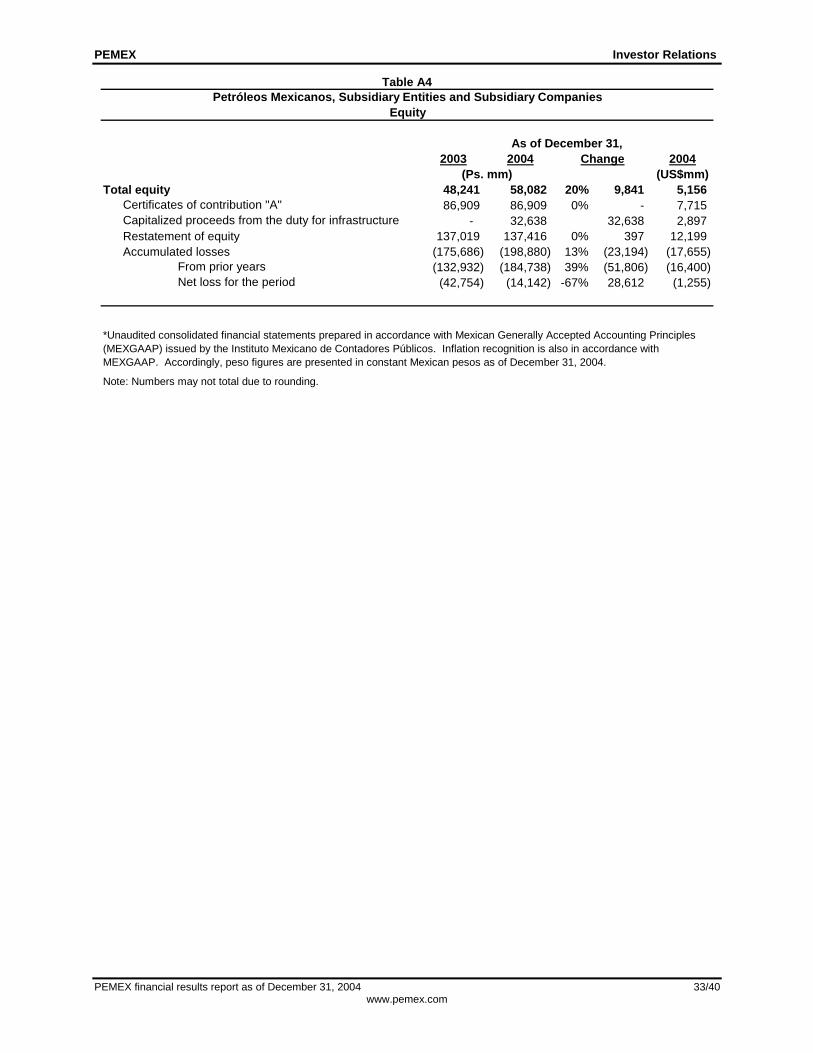
Table A4
As of December 31,2003 2004 Change 2004
(Ps. mm) (US$mm)Total equity 48,241 58,082 20% 9,841 5,156
Certificates of contribution "A" 86,909 86,909 0% - 7,715 Capitalized proceeds from the duty for infrastructure - 32,638 32,638 2,897 Restatement of equity 137,019 137,416 0% 397 12,199 Accumulated losses (175,686) (198,880) 13% (23,194) (17,655)
From prior years (132,932) (184,738) 39% (51,806) (16,400) Net loss for the period (42,754) (14,142) -67% 28,612 (1,255)
Note: Numbers may not total due to rounding.
Petróleos Mexicanos, Subsidiary Entities and Subsidiary CompaniesEquity
*Unaudited consolidated financial statements prepared in accordance with Mexican Generally Accepted Accounting Principles (MEXGAAP) issued by the Instituto Mexicano de Contadores Públicos. Inflation recognition is also in accordance with MEXGAAP. Accordingly, peso figures are presented in constant Mexican pesos as of December 31, 2004.

PEMEX Investor Relations
PEMEX financial results report as of December 31, 2004 34/40 www.pemex.com
Table A5 Petróleos Mexicanos, Subsidiary Entities and Subsidiary Companies
Consolidated statements of changes in financial position
Twelve months ending December 31, 2003 2004 Change 2004
(Ps. mm) (US$mm)Operating activitiesNet income (loss) (42,754) (14,142) -67% 28,612 (1,255)
103,312 88,771 -14% (14,542) 7,880 Depreciation and amortization 43,844 50,737 16% 6,893 4,504 Cost of the reserve for retirement payments, pensions and indemnities 39,472 52,814 34% 13,342 4,688 Specific oil-field exploration and depletion reserve 9,344 - -100% (9,344) - Foreign exchange and monetary loss (gain) 10,652 (14,780) -239% (25,433) (1,312)
(30,669) (75,735) 147% (45,066) (6,723) Accounts, notes receivable and other (13,295) (53,707) 304% (40,412) (4,768) Inventories (2,183) (6,195) 184% (4,011) (550)
Intangible asset derived from actuarial computation of labor obligations and other assets 418 (15,056) -3705% (15,473) (1,337) Suppliers 3,268 (6,426) -297% (9,694) (570) Accounts payable and accrued expenses 357 3,872 983% 3,515 344 Taxes payable 9,326 5,051 -46% (4,275) 448 Reserve for dismantlement and abandonment activites, sundry creditors and others 12,330 2,932 -76% (9,398) 260 Reserve for retirement payments, pensions and seniority premiums (17,815) (6,208) -65% 11,607 (551)
29,889 (1,106) -104% (30,996) (98)
Financing activities(10,500) (10,703) 2% (203) (950) 12,091 53,049 40,958 4,709
(15,908) 11,549 -173% 27,457 1,025 94,026 55,840 -41% (38,186) 4,957 (4,954) (5,921) 20% (968) (526) 74,755 103,813 39% 29,058 9,216
Investing activities(75,491) (94,952) 26% (19,461) (8,429) (75,491) (94,952) 26% (19,461) (8,429)
29,153 7,755 -73% (21,399) 688 47,989 77,143 61% 29,154 6,848 77,143 84,898 10% 7,755 7,537
29,889 (1,106) -104% (30,996) (98) (75,491) (94,952) 26% (19,461) (8,429)
Free cash-flow (45,602) (96,058) 111% (50,457) (8,527)
(10,500) (10,703) 2% (203) (950) Discretional free cash-flow (56,102) (106,762) 90% (50,660) (9,477)
Net increase in cash and cash equivalents
Minimum guaranteed dividends paid to the Mexican Government
Cash and cash equivalents at the beginning of the yearCash and cash equivalents at the end of the year
Funds provided (used) by operating activitiesIncrease in fixed assets - net
Sale of future accounts receivable - netFunds provided (used) by financing activities
Increase in fixed assets - netFunds provided (used) by investing activities
Charges to operations not requiring the use of funds:
Changes in working capital:
Funds provided (used) by operating activities
Minimum guaranteed dividends paid to the Mexican GovernmentOther equity movements - netNotes payable to contractors - netDocumented debt - net
Note: Numbers may not total due to rounding.
*Unaudited consolidated financial statements prepared in accordance with Mexican Generally Accepted Accounting Principles (MEXGAAP) issued by the Instituto Mexicano de Contadores Públicos. Inflation recognition is also in accordance with MEXGAAP. Accordingly, peso figures are presented in constant Mexican pesos as of December 31, 2004.
PEMEX Investor Relations
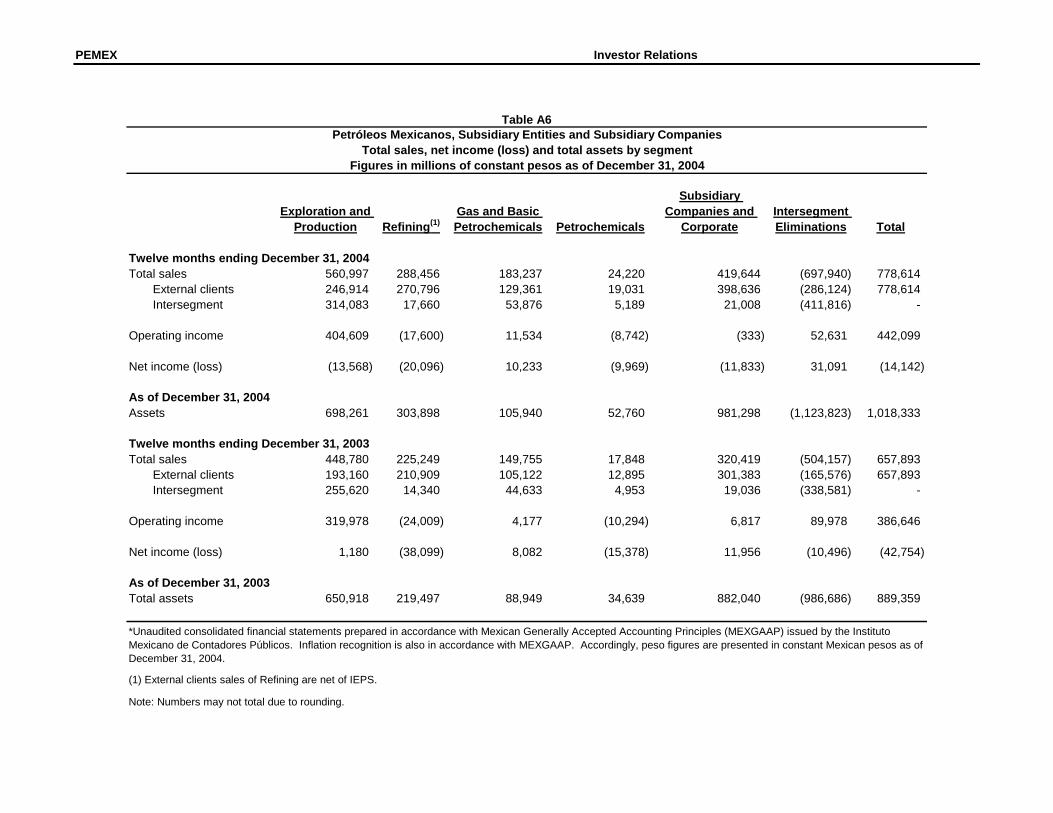
Table A6
Petróleos Mexicanos, Subsidiary Entities and Subsidiary CompaniesTotal sales, net income (loss) and total assets by segment
Figures in millions of constant pesos as of December 31, 2004
Exploration and Production Refining(1)
Gas and Basic Petrochemicals Petrochemicals
Subsidiary Companies and
CorporateIntersegment Eliminations Total
Twelve months ending December 31, 2004Total sales 560,997 288,456 183,237 24,220 419,644 (697,940) 778,614
External clients 246,914 270,796 129,361 19,031 398,636 (286,124) 778,614 Intersegment 314,083 17,660 53,876 5,189 21,008 (411,816) -
Operating income 404,609 (17,600) 11,534 (8,742) (333) 52,631 442,099
Net income (loss) (13,568) (20,096) 10,233 (9,969) (11,833) 31,091 (14,142)
As of December 31, 2004Assets 698,261 303,898 105,940 52,760 981,298 (1,123,823) 1,018,333
Twelve months ending December 31, 2003Total sales 448,780 225,249 149,755 17,848 320,419 (504,157) 657,893
External clients 193,160 210,909 105,122 12,895 301,383 (165,576) 657,893 Intersegment 255,620 14,340 44,633 4,953 19,036 (338,581) -
Operating income 319,978 (24,009) 4,177 (10,294) 6,817 89,978 386,646
Net income (loss) 1,180 (38,099) 8,082 (15,378) 11,956 (10,496) (42,754)
As of December 31, 2003Total assets 650,918 219,497 88,949 34,639 882,040 (986,686) 889,359
Note: Numbers may not total due to rounding.
*Unaudited consolidated financial statements prepared in accordance with Mexican Generally Accepted Accounting Principles (MEXGAAP) issued by the Instituto Mexicano de Contadores Públicos. Inflation recognition is also in accordance with MEXGAAP. Accordingly, peso figures are presented in constant Mexican pesos as of December 31, 2004.
(1) External clients sales of Refining are net of IEPS.

PEMEX Investor Relations
Table A7
Petróleos Mexicanos, Subsidiary Entities and Subsidiary CompaniesShort-term bonds issuances
Issuance date Maturity date Maturity(days)
Amount issued(Ps. mm)
Weighted average rate
28 days cetes rate of primary auction
24-02-05 23-03-05 27 500.0 9.37% 9.23%17-02-05 17-03-05 28 500.0 9.25% 9.15%10-02-05 10-03-05 28 500.0 9.25% 9.14%03-02-05 03-03-05 28 500.0 9.21% 9.07%27-01-05 24-02-05 28 500.0 8.84% 8.63%20-01-05 17-02-05 28 500.0 8.76% 8.63%13-01-05 10-02-05 28 500.0 8.80% 8.59%06-01-05 03-02-05 28 500.0 8.75% 8.56%23-12-04 27-01-05 35 500.0 8.79% 8.60%16-12-04 20-01-05 35 500.0 8.87% 8.57%09-12-04 13-01-05 35 500.0 8.54% 8.34%02-12-04 06-01-05 35 500.0 8.50% 8.37%25-11-04 23-12-04 28 500.0 8.50% 8.36%18-11-04 16-12-04 28 500.0 8.32% 8.23%11-11-04 09-12-04 28 500.0 8.41% 8.20%04-11-04 02-12-04 28 500.0 8.22% 8.02%28-10-04 25-11-04 28 500.0 8.15% 7.97%21-10-04 18-11-04 28 500.0 7.91% 7.77%14-10-04 11-11-04 28 500.0 7.82% 7.65%07-10-04 04-11-04 28 500.0 7.82% 7.65%30-09-04 28-10-04 28 500.0 7.80% 7.61%15-09-04 14-10-04 29 500.0 7.48% 7.27%09-09-04 07-10-04 28 500.0 7.50% 7.32%02-09-04 30-09-04 28 500.0 7.44% 7.29%26-08-04 23-09-04 28 500.0 7.46% 7.32%19-08-04 15-09-04 27 500.0 7.19% 7.13%
PEMEX Investor Relations
PEMEX financial results report as of December 31, 2004 37/40 www.pemex.com
0
1,000
2,000
3,000
4,000
5,000
0 1 2 3 4 5
YearM
bd
2,983
Existingcrude oil
Newcrude oil
0
2,000
4,000
6,000
8,000
10,000
0 1 2 3 4 5
Year
MM
cfd
3,951
Existingnatural gas
Newnatural gas
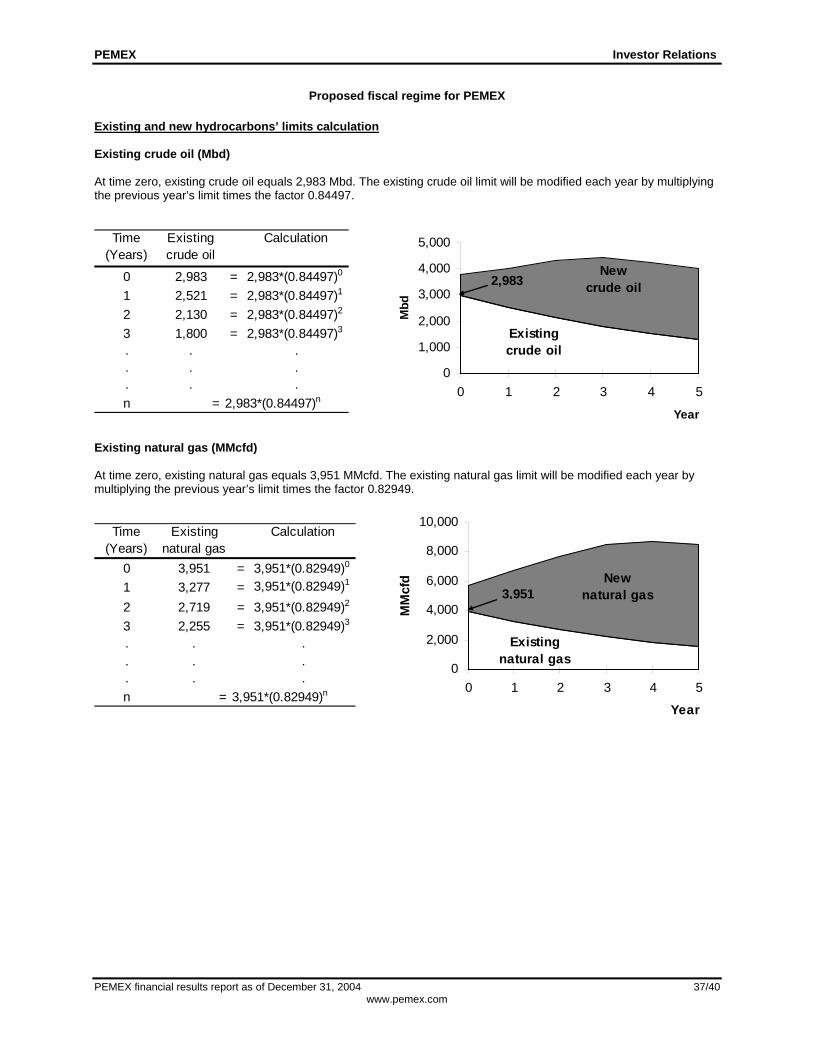
Proposed fiscal regime for PEMEX
Existing and new hydrocarbons’ limits calculation Existing crude oil (Mbd) At time zero, existing crude oil equals 2,983 Mbd. The existing crude oil limit will be modified each year by multiplying the previous year’s limit times the factor 0.84497.
Time (Years)
Existing crude oil
Calculation
0 2,983 = 2,983*(0.84497)0
1 2,521 = 2,983*(0.84497)1
2 2,130 = 2,983*(0.84497)2
3 1,800 = 2,983*(0.84497)3
. . .
. . .
. . .n = 2,983*(0.84497)n
Existing natural gas (MMcfd) At time zero, existing natural gas equals 3,951 MMcfd. The existing natural gas limit will be modified each year by multiplying the previous year’s limit times the factor 0.82949.
Time (Years)
Existing natural gas
Calculation
0 3,951 = 3,951*(0.82949)0
1 3,277 = 3,951*(0.82949)1
2 2,719 = 3,951*(0.82949)2
3 2,255 = 3,951*(0.82949)3
. . .
. . .
. . .n = 3,951*(0.82949)n
PEMEX Investor Relations
PEMEX financial results report as of December 31, 2004 38/40 www.pemex.com
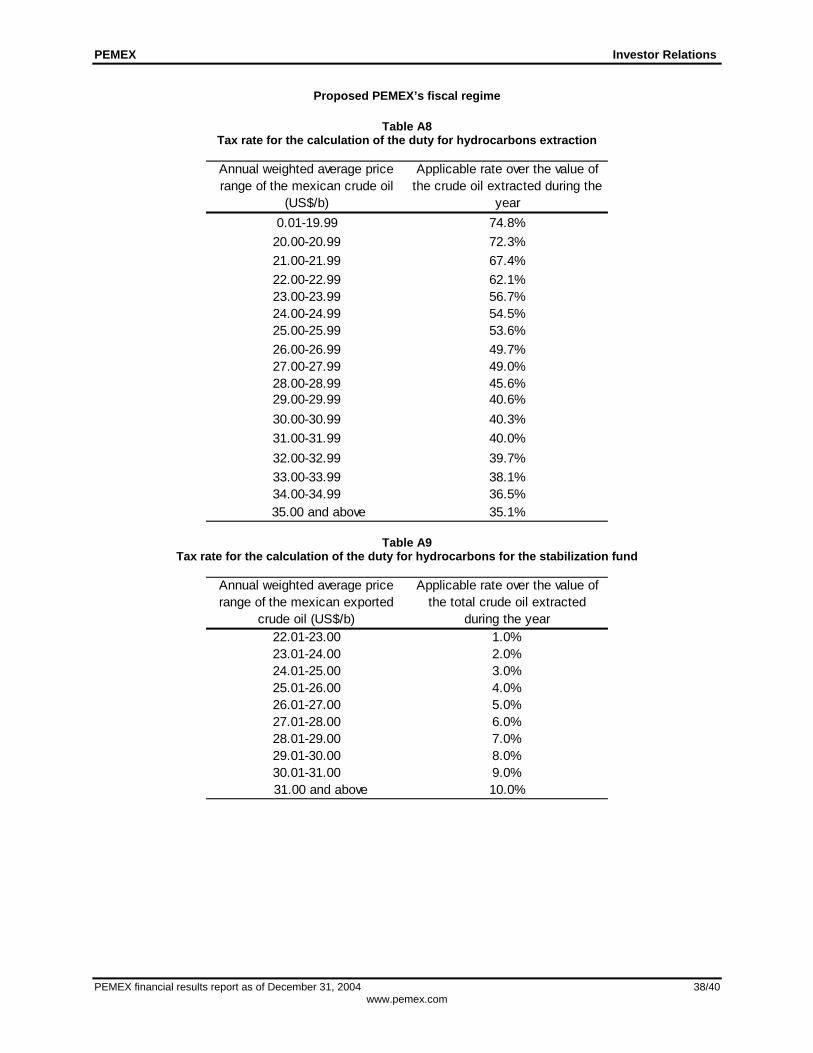
Proposed PEMEX’s fiscal regime
Table A8
Tax rate for the calculation of the duty for hydrocarbons extraction
Annual weighted average price range of the mexican crude oil
(US$/b)
Applicable rate over the value of the crude oil extracted during the
year0.01-19.99 74.8%
20.00-20.99 72.3%21.00-21.99 67.4%22.00-22.99 62.1%23.00-23.99 56.7%24.00-24.99 54.5%25.00-25.99 53.6%26.00-26.99 49.7%27.00-27.99 49.0%28.00-28.99 45.6%29.00-29.99 40.6%30.00-30.99 40.3%31.00-31.99 40.0%32.00-32.99 39.7%33.00-33.99 38.1%34.00-34.99 36.5%
35.00 and above 35.1%
Table A9 Tax rate for the calculation of the duty for hydrocarbons for the stabilization fund
Annual weighted average price range of the mexican exported
crude oil (US$/b)
Applicable rate over the value of the total crude oil extracted
during the year22.01-23.00 1.0%23.01-24.00 2.0%24.01-25.00 3.0%25.01-26.00 4.0%26.01-27.00 5.0%27.01-28.00 6.0%28.01-29.00 7.0%29.01-30.00 8.0%30.01-31.00 9.0%
31.00 and above 10.0%

PEMEX Investor Relations
PEMEX financial results report as of December 31, 2004 39/40 www.pemex.com
Table A10 Permitted deductions for the tax base calculation of the ordinary duty for hydrocarbons
Concept Annual deduction
Investments(1)
ExplorationEnhanced recoveryNon-capitalized maintenanceDevelopmentProductionOil pipelinesGas pipelinesTerminalsTransportationStorage
CostsProduction costs(2) 100%
Expenses(3)
ExplorationTransportation
(1) In any case, investments' deductions w ill not exceed 100% of the original investments
(2) According to Mexican GAAP and not including investments(3) Given that the expenses are incorporated in the sale's price
100%
20%
5%
100%
In any case, total deductions (investments, costs and expenses) will not exceed the costcap: Costcapt = (5.3 US$/b * total crude oil volume in year t)+(2.7 US$/Mcf * total net natural gas volume in year t)
Table A11
Description of wells(Number of wells)
As of December 31,2003 2004 Change
Operating wells 5,106 5,448 7% 342 Injection 237 231 -3% (6) Producing 4,869 5,217 7% 348
Crude and associated gas 2,968 2,986 1% 18 Non-associated gas 1,901 2,231 17% 330

PEMEX Investor Relations
PEMEX financial results report as of December 31, 2004 40/40 www.pemex.com
PEMEX is Mexico’s national oil and gas company. Created in 1938, it is the exclusive producer of Mexico’s oil and gas resources. The operating subsidiary entities are PEMEX Exploration and Production, PEMEX Refining, PEMEX Gas and Basic Petrochemicals and PEMEX Petrochemicals. The principal subsidiary company is PMI, its international trading arm. Amounts in US dollars are translated at the December 31, 2004 exchange rate of Ps. 11.2648 per US dollar. This report contains forward-looking statements. Statements that are not historical facts, including statements about our beliefs and expectations, are forward looking-statements. These are good faith statements based on current plans, estimates and projections and therefore you should not place undue reliance on them. Forward-looking statements speak only as of the date they were made, and we undertake no obligation to update publicly any of them in light of new information or future events. Forward-looking statements involve inherent risks and uncertainties. These risks and uncertainties include crude oil price volatility; production, equipment, and transportation risks inherent in the oil industry; environmental regulations in Mexico; actions of the Mexican government with respect to our operations, budget, taxation, commercial activities, control of hydrocarbon reserves, or debt service payments; any limitations on exports resulting from agreements of the Mexican government; and economic, political, and foreign exchange risks affecting Mexico. These risks and uncertainties are more fully detailed in PEMEX most recent Form 20-F filing with the US Securities and Exchange Commission (www.sec.gov) and the PEMEX Prospectus filed with the National Banking and Securities Commission (CNBV) and available through the Mexican Stock Exchange (wwww.bmv.com.mx). These factors could cause actual results to differ materially from those contained in any forward-looking statement. The US Securities and Exchange Commission (SEC) permits oil and gas companies, in their filings with the SEC, to disclose only proved reserves that a company has demonstrated by actual production or conclusive formation tests to be economically and legally producible under existing economic and operating conditions. We use certain terms in this document, such as total reserves, probable reserves and possible reserves, that the SEC's guidelines strictly prohibit us from including in filings with the SEC. Investors are urged to consider closely the disclosure in our Form 20-F, “File No. 0-99”, available from us at www.pemex.com or Marina Nacional 329 Floor 38 Col. Huasteca, Mexico City 11311 or at (52 55) 1944 9700. You can also obtain this Form from the SEC by calling 1-800-SEC-0330. EBITDA, free cash-flow and discretionary cash-flow are non-GAAP measures, which are calculated as described above. They are presented because PEMEX believes that they are widely accepted financial indicator of its ability to service or incur debt. EBITDA, free cash-flow and discretionary cash-flow should not be considered as indicators of financial performance, as an alternative to cash flow, as a measure of liquidity, or as being comparable to similarly named measures of other companies. The total debt calculation includes, in addition to documented debt, the items that are usually considered as debt by the financial markets.


