Jennifer Bourn: Onboarding New Clients and Setting Expectations
Upload
truongthuyCategory
view
212download
0
NASDAQ: BBSI | MARCH 2018
I N V E S TO R
P R E S E N TAT I O N
FORWARD-LOOKING STATEMENTS
Statements in this presentation about future events or performance, including expectations for market opportunities and capacity,
growth in new clients, the effectiveness of our referral-based channels, rate of client retention, gross billings and diluted earnings
per share, are forward-looking statements which involve known and unknown risks, uncertainties and other factors that may cause
our actual results to be materially different from any future results expressed or implied by such forward-looking statements.
Factors that could affect future results include economic conditions in our service areas and their effect on revenue levels, the
effect of changes in our mix of services on gross margin, our ability to retain current clients and attract new clients, difficulties with
integrating clients into our operations, the availability of financing or other sources of capital, the potential for material deviations
from expected future workers' compensation claims experience, the workers’ compensation regulatory environment in our primary
markets, litigation costs, the ongoing investigation of accounting issues by government agencies, security breaches or failures in
our information technology systems, the effect of escalating medical costs on our business, the collectability of accounts
receivable, the carrying value of deferred income tax assets and goodwill, and the effect of conditions in the global capital markets
on our investment portfolio, among others. Other important factors that may affect our prospects are described in our 2017 Annual
Report on Form 10-K. Although forward-looking statements help to provide complete information about our Company, investors
should keep in mind that forward-looking statements are less reliable than historical information. We undertake no obligation to
update or revise forward-looking statements in this presentation to reflect events or changes in circumstances that occur after the
date of this presentation.
2

PURPOSE FOR APPROACHING
THE MARKET
3

4
VISION: IMPROVE THE PROBABILITY
OF SMALL BUSINESS SUCCESS
Source: Bureau of Labor Statistics.

HOW WE ARE POSITIONED
5
• Engage as a tactical subordinate
• Minimal integration with the business
TYPICAL OUTCOME:
TOOLS, SYSTEMS, PROCESSES
• Engage as an expert guide
• Highly integrated with the business
TYPICAL OUTCOME:
WHITE PAPERS
TYPICAL OUTCOME:
BLUEPRINT TO
MORE
EFFICIENTLY RUN
BUSINESS

6
VO
LU
ME
R E - L E V E R
I N F L E C T I O N
P O I N T
I D E A
O P E R AT I O N AL
P L AT E AU
T I M E
R E - L E V E R
R E - L E V E R
OUR VIEW TO
THE BUSINESS CYCLE

7
POTENTIAL BRAND IMPACT
1,000 ~5,600 15,000 45,000+TODAY

FIELD STRUCTURE & FOOTPRINT
8
• 101 teams housed in
58 physical locations
• Decentralized
structure
• Most clients within
50-mile radius of
BBSI branch

HOW WE BUILD & SUPPORT
OUR TEAMS
• $500K investment
per team
• Capacity of ~90 clients
• Average: 30 employees
per client
• Ability to lever operating
margins
9

SEASONED
PROFESSIONAL
TRAITS OF A BBSI PROFESSIONAL
10
ENTREPRENEURIAL
INNATELY
CURIOUS
OWNERSHIP
MENTALITY
STRONG BUSINESS
ACUMEN
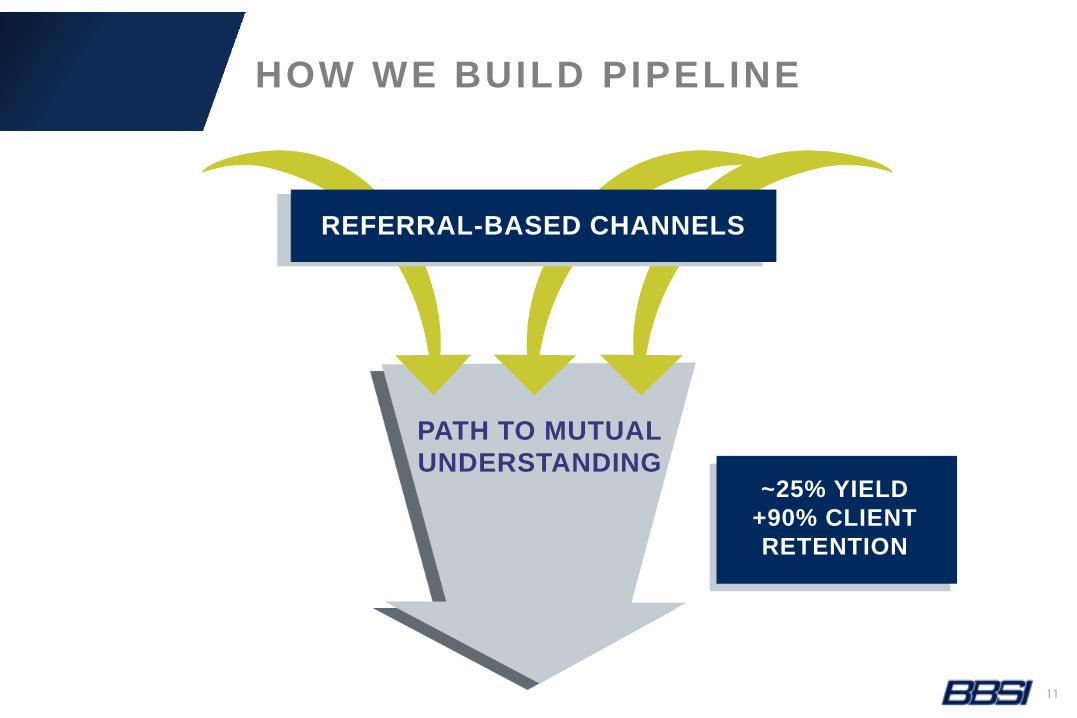
HOW WE BUILD PIPELINE
11
PATH TO MUTUAL
UNDERSTANDING
REFERRAL-BASED CHANNELS
~25% YIELD
+90% CLIENT
RETENTION

HOW WE ALIGN WITH OUR CLIENTS
12
OUTCOMES
Stability
Capacity
Leverage
Profitability
Predictability
90%+ Retention

13
PROACTIVELY POSITIONED
FOR SCALE
PROFILE OF
OUR PEOPLE
PRODUCT
ORG
STRUCTURE
PIPELINE & MARKET
APPROACH
PROCESS
& SYSTEMS
FINANCE3X

MARKET OPPORTUNITY
14
BBSI
works with
approximately
5,600 businesses
– roughly 3%
BBSI works with
less than 1%
of target market
in U.S.
Source: Statistics of U.S. Businesses, SBA Office of Advocacy, Updated Feb 9, 2015.

• Leverage net client add to
support referrals
• Expand within existing
markets – build branches
within branches
• Penetrate adjacent markets
to meet demand
CURRENT STATE
15

FUTURE STATE
16
• Leverage net client add to
support referrals
• Expand within existing
markets – build branches
within branches
• Penetrate adjacent markets
to meet demand

58 physical locations
•17 Mature = run rate of $100 million +
•15 Emerging = run rate of $30 million +
•26 Developing = run rate of $1-$30 million
BRANCH STRATIFICATION
17

$404
$537
$636
$741
$841
$920
2012 2013 2014 2015 2016 2017
ANNUAL NET REVENUE GROWTH
18
$Millions

$2,081
$2,817
$3,357
$4,016
$4,693
$5,301
~$6,042
2012 2013 2014 2015 2016 2017 2018E²
Gross Billings ($Millions)
ANNUAL GROSS BILLINGS
& PEO CLIENT GROWTH
19
1) PEO customers defined as the active number of customer Federal Employee Identification Numbers (FEINs). Please take into consideration that this figure is a broad
estimate of the Company’s actual client count. However, the Company does believe the number represents an effective proxy for the health of its business. 2017 client
count represents the Company’s estimated client count at the end of the year.
2) Guidance updated on Feb 27, 2018.
~14% expected gross
revenue growth vs.
2017²
~2,200~2,600
~3,000
~4,000
~4,900
~5,600PEOCustomers¹

$1.47$2.12
-$3.57
$3.47
$2.55$3.30
$4.45
2012 2013 2014¹ 2015 2016 2017 2018E²
ANNUAL DILUTED EPS
PERFORMANCE
20
1) The net loss per share in 2014 is primarily due to expense associated with an increase in the Company’s reserve for workers’ compensation claims liabilities of
approximately $104.2 million.
2) Guidance updated on Feb 27, 2018. Includes an estimate of ~$0.06 per diluted share in remaining costs associated with legal costs related to securities law
issues, as well as a lower effective tax rate of ~20%.
Includes ~$0.06 per
share for legal costs
and a lower effective
tax rate of ~20% vs.
2017

ORGANIC GROWTH
• New client stack
• Runoff
• Same customer sales
LEVERAGE
• Capacity utilization against infrastructure
SCALE
• Expansion
21
DRIVERS OF FUTURE GROWTH

$3
,35
7 $4,0
16
$4
,69
3 $5
,30
1
2014 2015 2016 2017
Annual GrossBillings
($Millions)
Trading Data (@ March 8, 2018)
Stock Price $83.52
52 Week High/Low $83.62/$44.52
Avg. Daily Vol. (3 mo.) 41,543
Shares Outstanding 7.3M
Institutional Holdings 82%
Insider Holdings 4%
Valuation Measures
Market Cap $610.0M
P/E (ttm) 25.1x
Dividend Payout Ratio (ttm) 31%
Financial Highlights (@ Dec. 31, 2017)
Gross Billings (ttm) $5,301M
Income from Ops. (ttm) $29.9M
Diluted EPS (ttm) $3.33
Cash¹ (mrq) $456.6M
Total Assets (mrq) $682.5M
Total Debt (mrq) $4.4M
Total Liabilities (mrq) $593.7M
Total Equity (mrq) $88.8M
Source: CapitalIQ & Company filings.
ttm = trailing twelve months; mrq = most recent quarter.
1) Represents cash and cash equivalents, investments, and
restricted cash and investments.
KEY STATS: BBSI (NASDAQ)
22
Clients ~3000 ~4000 ~4900 ~5600

NASDAQ: BBSI | MARCH 2018
INVESTOR CONTACT:
Cody Slach
Liol ios
949-574-3860
BBSI@Liol ios.com