
Investor Open House May 2012 - Canadian Natural Resources
9
1 Investor Open House 2012 North America Natural Gas May 2012 Premium Value Defined Growth Independent North America Natural Gas Investor Open House May 2012 Bill Peterson, Senior Vice-President, Production, Drilling & Completions
Transcript of Investor Open House May 2012 - Canadian Natural Resources

1
Investor Open House 2012North America Natural Gas
May 2012
Premium Value Defined Growth Independent
North America Natural Gas
Investor Open HouseMay 2012
Bill Peterson, Senior Vice-President, Production, Drilling & Completions
2
Investor Open House 2012North America Natural Gas
May 2012
CNQSlide 3
Certain statements relating to Canadian Natural Resources Limited (the “Company”) in this document or documents incorporated herein by referenceconstitute forward-looking statements or information (collectively referred to herein as “forward-looking statements”) within the meaning of applicable securities legislation. Forward-looking statements can be identified by the words “believe”, “anticipate”, “expect”, “plan”, “estimate”, “target”, “continue”, “could”, “intend”, “may”, “potential”, “predict”, “should”, “will”, “objective”, “project”, “forecast”, “goal”, “guidance”, “outlook”, “effort”, “seeks”, “schedule” or expressions of a similar nature suggesting future outcome or statements regarding an outlook. Disclosure related to expected future commodity pricing, forecast or anticipated production volumes, royalties, operating costs, capital expenditures, income tax expenses and other guidance provided throughout this Management’s Discussion and Analysis (“MD&A”) including the information in the “Outlook” section and the sensitivity analysis constitute forward-looking statements. Disclosure of plans relating to and expected results of existing and future developments, including but not limited to the Horizon Oil Sands operations and future expansion, ability to recover insurance proceeds, Primrose, Pelican Lake, the Kirby Thermal Oil Sands Project, the Keystone XL Pipeline US Gulf Coast expansion, and the construction and future operations of the North West Redwater bitumen upgrader and refinery also constitute forward-looking statements. This forward-looking information is based on annual budgets and multi-year forecasts, and is reviewed and revised throughout the year as necessary in the context of targeted financial ratios, project returns, product pricing expectations and balance in project risk and time horizons. These statements are not guarantees of future performance and are subject to certain risks and the reader should not place undue reliance on these forward-looking statements as there can be no assurances that the plans, initiatives or expectations upon which they are based will occur.In addition, statements relating to “reserves” are deemed to be forward-looking statements as they involve the implied assessment based on certain estimates and assumptions that the reserves described can be profitably produced in the future. There are numerous uncertainties inherent in estimating quantities of proved and proved plus probable crude oil and natural gas reserves and in projecting future rates of production and the timing of development expenditures. The total amount or timing of actual future production may vary significantly from reserve and production estimates.The forward-looking statements are based on current expectations, estimates and projections about the Company and the industry in which the Company operates, which speak only as of the date such statements were made or as of the date of the report or document in which they are contained, and are subject to known and unknown risks and uncertainties that could cause the actual results, performance or achievements of the Company to be materially different from any future results, performance or achievements expressed or implied by such forward-looking statements. Such risks and uncertainties include, among others: general economic and business conditions which will, among other things, impact demand for and market prices of the Company’s products; volatility of and assumptions regarding crude oil and natural gas prices; fluctuations in currency and interest rates; assumptions on which the Company’s current guidance is based; economic conditions in the countries and regions in which the Company conducts business; political uncertainty, including actions of or against terrorists, insurgent groups or other conflict including conflict between states; industry capacity; ability of the Company to implement its business strategy, including exploration and development activities; impact of competition; the Company’s defense of lawsuits; availability and cost of seismic, drilling and other equipment; ability of the Company and its subsidiaries to complete capital programs; the Company’s and its subsidiaries’ ability to secure adequate transportation for its products; unexpected disruptions or delays in the resumption of the mining, extracting or upgrading of the Company’s bitumen products; potential delays or changes in plans with respect to exploration or development projects or capital expenditures; ability of the Company to attract the necessary labour required to build its thermal and oil sands mining projects; operating hazards and other difficulties inherent in the exploration for and production and sale of crude oil and natural gas and in mining, extracting or upgrading the Company’s bitumen products; availability and cost of financing; the Company’s and its subsidiaries’ success of exploration and development activities and their ability to replace and expand crude oil and natural gas reserves; timing and success of integrating the business and operations of acquired companies; production levels; imprecision of reserve estimates and estimates of recoverable quantities of crude oil, natural gas and natural gas liquids (“NGLs”) not currently classified as proved; actions by governmental authorities; government regulations and the expenditures required to comply with them (especially safety and environmental laws and regulations and the impact of climate change initiatives on capital and operating costs); asset retirement obligations; the adequacy of the Company’s provision for taxes; and other circumstances affecting revenues and expenses. The Company’s operations have been, and in the future may be, affected by political developments and by federal, provincial and local laws and regulations such as restrictions on production, changes in taxes, royalties and other amounts payable to governments or governmental agencies, price or gathering rate controls and environmental protection regulations. Should one or more of these risks or uncertainties materialize, or should any of the Company’s assumptions prove incorrect, actual results may vary in material respects from those projected in the forward-looking statements. The impact of any one factor on a particular forward-looking statement is not determinable with certainty as such factors are dependent upon other factors, and the Company’s course of action would depend upon its assessment of the future considering all information then available. For additional information refer to the “Risks and Uncertainties” section of this MD&A.Readers are cautioned that the foregoing list of factors is not exhaustive. Unpredictable or unknown factors not discussed in this report could also have material adverse effects on forward-looking statements. Although the Company believes that the expectations conveyed by the forward-looking statements are reasonable based on information available to it on the date such forward-looking statements are made, no assurances can be given as to future results, levels of activity and achievements. All subsequent forward-looking statements, whether written or oral, attributable to the Company or persons acting on its behalf are expressly qualified in their entirety by these cautionary statements. Except as required by law, the Company assumes no obligation to update forward-looking statements, whether as a result of new information, future events or other factors, or the foregoing factors affecting this information, should circumstances or Management’s estimates or opinions change.
Forward Looking StatementsForward Looking Statements
CNQSlide 4
Special Note Regarding Currency, Production and ReservesIn this document, all references to dollars refer to Canadian dollars unless otherwise stated. Reserves and production data are presented on a before royalties basis unless otherwise stated. In addition, reference is made to crude oil and natural gas in common units called barrel of oil equivalent (“boe”). A barrel of oil equivalent (“BOE”) is derived by converting six thousand cubic feet (“Mcf”) of natural gas to one barrel (“bbl”) of crude oil (6 Mcf:1 bbl). This conversion may be misleading, particularly if used in isolation, since the 6 Mcf:1 bbl ratio is based on an energy equivalency conversion method primarily applicable at the burner tip and does not represent a value equivalency at the wellhead. In comparing the value ratio using current crude oil prices relative to natural gas prices, the 6 Mcf:1 bbl conversion ratio may be misleading as an indication of value. In addition, for the purposes of this MD&A, crude oil is defined to include the following commodities: light & medium crude oil, primary heavy crude oil, Pelican Lake heavy crude oil, bitumen (thermal oil), and synthetic crude oil.For the year ended December 31, 2011 the Company retained Independent Qualified Reserves Evaluators (”Evaluators”), Sproule Associates Limited and Sproule International Limited (together as “Sproule”) and GLJ Petroleum Consultants Ltd. (“GLJ”), to evaluate and review all of the Company’s proved and proved plus probable reserves with an effective date of December 31, 2011 and a preparation date of February 13, 2012. Sproule evaluated the North America and International crude oil, NGL and natural gas reserves. GLJ evaluated the Horizon SCO reserves. The evaluation and review was conducted in accordance with the standards contained in the Canadian Oil and Gas Evaluation Handbook (“COGE Handbook”) and disclosed in accordance with National Instrument 51-101 – Standards of Disclosure for Oil and Gas Activities (“NI 51-101”) requirements. The 2011 reserves disclosure is presented in accordance with Canadian reporting requirements using forecast prices and escalated costs. The recovery and reserves estimates of crude oil, NGL and natural gas reserves provided in this presentation are estimates only and there is no guarantee that the estimated reserves will be recovered. Actual crude oil, NGL and natural gas reserves may be greater than or less than the estimates provided.Reserves estimates provided in this presentation are company gross, before royalties.Resources Other Than ReservesThe contingent resources other than reserves (“resources”) estimates provided in this presentation are internally evaluated by qualified reserves evaluators in accordance with the COGE Handbook as directed by NI 51-101. No independent third party evaluation or audit was completed. Resources provided are best estimates as of December 31, 2011. The resources are evaluated using deterministic methods which represent the expected outcome with no optimism or conservatism.Resources, as per the COGE Handbook definition, are those quantities of petroleum estimated, as of a given date, to be potentially recoverable from know accumulations using established technology or technology under development, but are not currently considered commercially viable due to one or more contingencies. There is no certainty that it will be commercially viable to produce any portion of these resources. Due to the inherent differences in standards and requirements employed in the evaluation of reserves and contingent resources, the total volumes of reserves or resources are not to be considered indicative of total volumes that may actually be recovered and are provided for illustrative purposes only.Petroleum, bitumen or natural gas initially-in-place volumes provided are discovered resources which include: production, reserves, contingent resources and unrecoverable volumes.Special Note Regarding non-GAAP Financial MeasuresThis MD&A includes references to financial measures commonly used in the crude oil and natural gas industry, such as adjusted net earnings from operations, cash flow from operations, cash production costs and net asset value. These financial measures are not defined by International Financial Reporting Standards (“IFRS”) and therefore are referred to as non-GAAP measures. The non-GAAP measures used by the Company may not be comparable to similar measures presented by other companies. The Company uses these non-GAAP measures to evaluate its performance. The non-GAAP measures should not be considered an alternative to or more meaningful than net earnings, as determined in accordance with IFRS, as an indication of the Company’s performance. The non-GAAP measures adjusted net earnings from operations and cash flow from operations are reconciled to net earnings, as determined in accordance with IFRS, in the “Financial Highlights” section of this MD&A. The derivation of cash production costs is included in the “Operating Highlights – Oil Sands Mining and Upgrading” section of this MD&A. The Company also presents certain non-GAAP financial ratios and their derivation in the “Liquidity and Capital Resources” section of this MD&A.Volumes shown are Company share before royalties unless otherwise stated.
Reporting DisclosuresReporting Disclosures
3
Investor Open House 2012North America Natural Gas
May 2012
CNQSlide 5
North America Natural Gas Core Area SummaryNorth America Natural Gas Core Area Summary
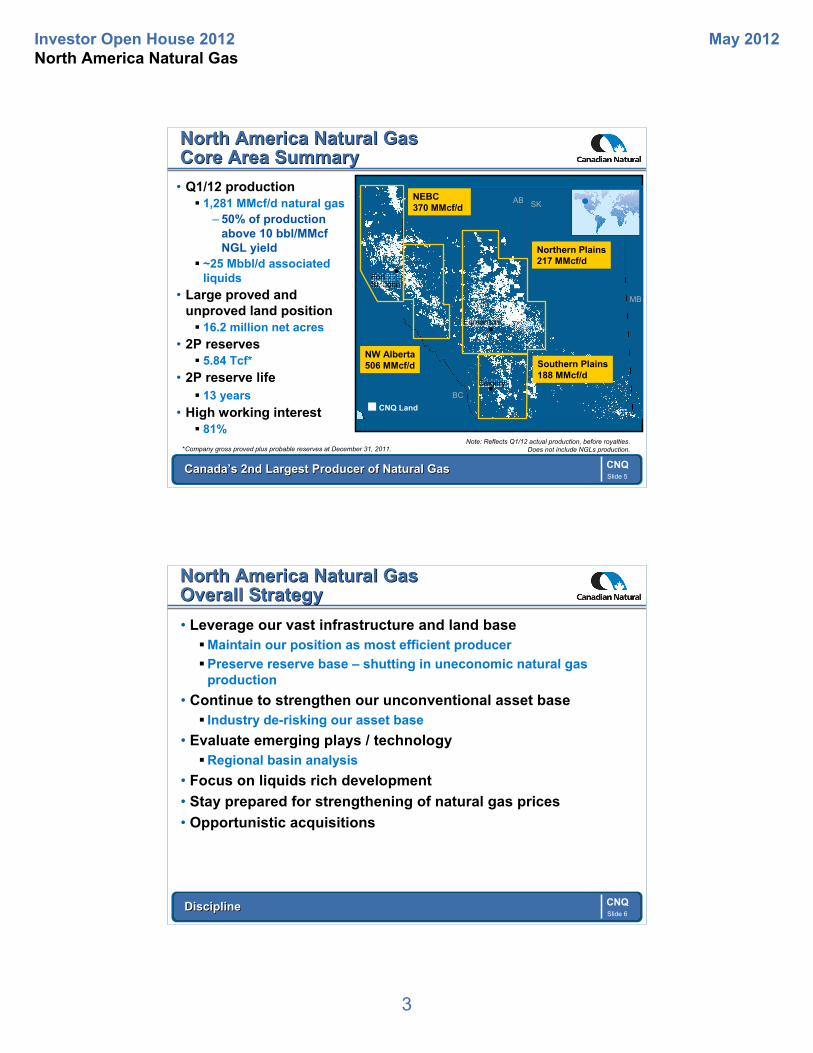
Canada’s 2nd Largest Producer of Natural GasCanada’s 2nd Largest Producer of Natural Gas
Note: Reflects Q1/12 actual production, before royalties.Does not include NGLs production.*Company gross proved plus probable reserves at December 31, 2011.
NEBC370 MMcf/d
BC
AB SK
Northern Plains217 MMcf/d
NW Alberta506 MMcf/d Southern Plains
188 MMcf/d
CNQ Land
Calgary
Edmonton
Fort St. John
MB
• Q1/12 production 1,281 MMcf/d natural gas
– 50% of production above 10 bbl/MMcfNGL yield
~25 Mbbl/d associated liquids
• Large proved and unproved land position 16.2 million net acres
• 2P reserves 5.84 Tcf*
• 2P reserve life 13 years
• High working interest 81%
CNQSlide 6
• Leverage our vast infrastructure and land baseMaintain our position as most efficient producer
Preserve reserve base – shutting in uneconomic natural gas production
• Continue to strengthen our unconventional asset base Industry de-risking our asset base
• Evaluate emerging plays / technologyRegional basin analysis
• Focus on liquids rich development
• Stay prepared for strengthening of natural gas prices
• Opportunistic acquisitions
North America Natural Gas Overall StrategyNorth America Natural Gas Overall Strategy
Discipline Discipline

4
Investor Open House 2012North America Natural Gas
May 2012
CNQSlide 7
North America Natural Gas 2012 PlanNorth America Natural Gas 2012 Plan
• Exit to Exit 11% decline
2011 2012F % Change
Production (MMcf/d) 1,231 1,210-1,230 (1)%
Drilling (net wells) 86 36 (58)%
Capital ($ Million)
Turnaround / Maintenance 106 135
Land / Seismic 66 49
Drill, Complete, Tie-in 535 441
Total $707 $625 (12)%
CNQSlide 8
• Focus on unconventional assets• Leverage technology – horizontal drilling 3% of gas wells in 2009 65% in 2012B
• Liquids rich prospects >30 bbl/MMcf
• Strategic drilling – new plays Montney Fahler / Wilrich Notikewin Duvernay
• Drive capital and operating efficiencies
North America Natural Gas5 Year PlanNorth America Natural Gas5 Year Plan
DisciplineDiscipline

5
Investor Open House 2012North America Natural Gas
May 2012
CNQSlide 9
• Lands proximal to existing
CNQ land base
• Consolidate facilities and utilize
CNQ extensive infrastructure –
particularly sour processing
facilities
• Synergies provide the
opportunity to reduce operating
costs
• Upside potential remains on
existing production and
undeveloped land
North America Natural Gas Typical Natural Gas AcquisitionNorth America Natural Gas Typical Natural Gas Acquisition
Assets End Up In The Hands of the Most Efficient and Effective ProducerAssets End Up In The Hands of the Most Efficient and Effective Producer
CNQ Land CNQ Pipeline InterconnectsAcquisition Lands
CNQSlide 10
0 100,000 200,000 300,000 400,000 500,000 600,000 700,000 800,000 900,000 1,000,000
Large Land BaseLarge Land Base
North America Natural Gas Top Montney Land Holders by Net AcresNorth America Natural Gas Top Montney Land Holders by Net Acres
Canadian Natural – 916,000 Net Acres
Source: Cormark Reports for peers and CNQ internal. Peers include: ARX, BIR, CLT, ECA, GO, MUR, POU, PRQ, RDS, TLM, TOU.

6
Investor Open House 2012North America Natural Gas
May 2012
CNQSlide 11
North America Natural Gas Strategic Development – Septimus Montney UpdateNorth America Natural Gas Strategic Development – Septimus Montney Update
• Large resource 1.2 Tcfe contingent resource* 531 BCF 2P reserves** 51 MMbbl 2P reserves booked liquids
• Project to date Completed 10 wells in 2011 Average drill & complete cost $5.5 MM/well Between 6-14 fracs per horizontal well Constructed 32 km 16 inch pipeline to
Younger Deep Cut – in service December 2011– Increased C3+ liquid recovery from
37 to 47 bbl/MMcf– Producing 58 MMcf/d– Producing >3,000 bbl/d C3-C5+ liquids– Producing >2,700 bbl/d C2 liquids
• Efficiencies Completion cost
– 2011 $3.5 MM/well– 2012 forecast $3.1 MM/well
Increased frac efficiencies– 2011 1.55 frac/d, 2012 1.9 frac/d
Increase use of cluster fracs
Execution Delivered – Superior ResultsExecution Delivered – Superior Results
*Best estimate contingent resources other than reserves.**Company gross proved plus probable reserves at December 31, 2011.
CNQSlide 12
North America Natural Gas Septimus Montney Play – Next StepsNorth America Natural Gas Septimus Montney Play – Next Steps
• 2012 program Septimus plant expansion to
110 MMcf/d natural gas and 11 Mbbl/d of liquids sales capacity; onstream target date December 2012
Drilled 10 horizontal well program
7 wells deferred until 2013
• 2013 program Planning 24 horizontal
well program
Includes 4 step out horizontal wells to expand development on land base
1 Hz planned to test Montney oil window
Commercial Growth in Low Price EnvironmentCommercial Growth in Low Price Environment
CNQ Land
Septimus Development
2004 to 2010 – 29 wells
2011 – 12 wells
2012 – 10 wells
2013 – 24 wells

7
Investor Open House 2012North America Natural Gas
May 2012
CNQSlide 13
• Emerging plays require regional basin evaluations
• Identify sweet spots for area teams to focus
• Monitor industry activity
• Remain disciplined
• Selective entry points
North America Natural Gas CNQ Duvernay Land SummaryNorth America Natural Gas CNQ Duvernay Land Summary
0 100,000 200,000 300,000 400,000 500,000
Canadian Natural – 399,000 Net Acres
Source: Macquarie Research for peers and CNQ internal. Peers include: ATH, CLT, CVX, DAY, ECA, GO, NAE, PBN, PWT, TET, TLM.
Top Duvernay Land Holders by Net Acres
Large Land BaseLarge Land Base
CNQSlide 14
0
20
40
60
80
100
120
140
160
180
200
2011 2012F 2013F 2014F 2015F 2016F
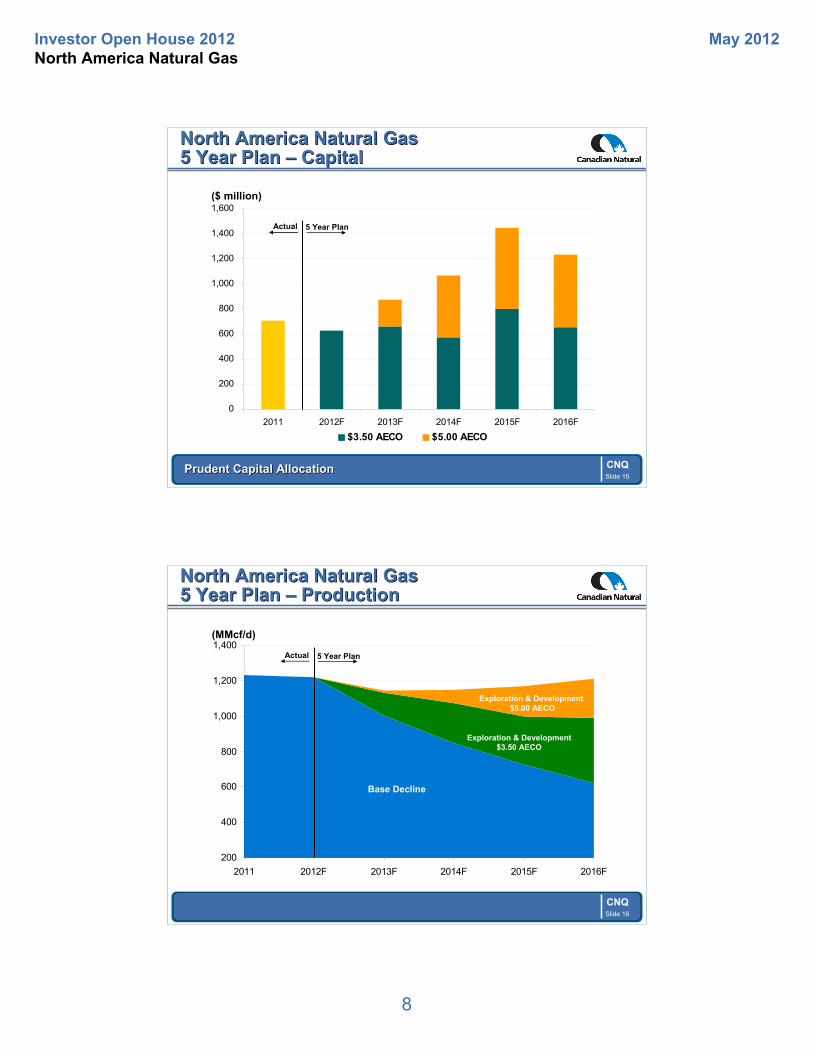
$3.50 AECO $5.00 AECO
North America Natural Gas 5 Year Plan – DrillingNorth America Natural Gas 5 Year Plan – Drilling
(Net wells)
Actual 5 Year Plan
Prudent Drilling StrategyPrudent Drilling Strategy
• 5 year plan targeting liquids rich natural gas (NGL >30 bbl/MMcf)
8
Investor Open House 2012North America Natural Gas
May 2012
CNQSlide 15
0
200
400
600
800
1,000
1,200
1,400
1,600
2011 2012F 2013F 2014F 2015F 2016F
$3.50 AECO $5.00 AECO
North America Natural Gas 5 Year Plan – CapitalNorth America Natural Gas 5 Year Plan – Capital
($ million)
Actual 5 Year Plan
Prudent Capital AllocationPrudent Capital Allocation
CNQSlide 16
200
400
600
800
1,000
1,200
1,400
2011 2012F 2013F 2014F 2015F 2016F
North America Natural Gas5 Year Plan – ProductionNorth America Natural Gas5 Year Plan – Production
(MMcf/d)
Base Decline
Exploration & Development $5.00 AECO
Actual 5 Year Plan
Exploration & Development$3.50 AECO

9
Investor Open House 2012North America Natural Gas
May 2012
CNQSlide 17
North America Natural Gas Technology LeverageNorth America Natural Gas Technology Leverage
• Application of horizontal multi-stage frac technology
• Integrate micro seismic, production logging and chemical tracers to improve frac effectiveness
• Laboratory assessment of rock properties and reservoir parameters to help quantify porosity, permeability and the effects of micro fractures
• Regional basin evaluations to identify sweet spots and new play fairways using thermal maturity and liquids composition
Unlocking ValueUnlocking Value
CNQSlide 18
North America Natural Gas OpportunitiesNorth America Natural Gas Opportunities
• Land base allows us to participate in most plays
• Diversified assets allows flexibility and patience
• Leverage extensive land base and infrastructure
• Efficient and effective operations
• One of the largest Montney and Duvernay land holders in Western Canada
• Significant upside when natural gas prices recover


![[Architecture eBook] Canadian Wood-Frame House Construction](https://static.fdocuments.us/doc/165x107/563db833550346aa9a917f04/architecture-ebook-canadian-wood-frame-house-construction-5661f565da5ed.jpg)
