INVESTOR DAY - Bemis Companyinvestors.bemis.com/.../file/BMS_Investor_Day_2015_Final.pdf · of the...
106
INVESTOR DAY March 10, 2015 NYSE: BMS
Transcript of INVESTOR DAY - Bemis Companyinvestors.bemis.com/.../file/BMS_Investor_Day_2015_Final.pdf · of the...

INVESTOR DAY March 10, 2015
NYSE: BMS

SAFE HARBOR STATEMENT
2
This presentation includes forward-looking statements within the meaning of the Safe
Harbor provisions of the Securities Litigation Reform Act of 1995. Such statements
include, but are not limited to, statements relating to the expected future performance
of the company and its objectives, expectations, and intentions for the future. These
forward-looking statements are based on the current beliefs and expectations of Bemis
Company’s management and are subject to risks and uncertainties. The forward-
looking statements speak only as of the date of this presentation, and Bemis Company
does not undertake to update such statements to reflect changes that occur after that
date. There are a number of factors that could cause actual results to differ from those
set forth in the forward-looking statements. These factors include, but are not limited to:
general economic conditions, competitive conditions in our markets, the cost and
availability of raw materials, and our ability to pass these price changes on to our
customers. These and other risks, uncertainties, and assumptions are identified from
time to time in our filings with the Securities and Exchange Commission including our
most recent Annual Report on form 10-K and our quarterly reports on Form 10-Q. Such
reports are available on the website of the Securities and Exchange Commission
(www.sec.gov).

TODAY’S AGENDA
9:00 am Safe Harbor & Introduction
Erin Winters Director Investor Relations
9:00 am A New Perspective
Bill Austen President & Chief Executive Officer
9:20 am Technology
William Jackson, PhD Vice President & Chief Technology Officer
9:35 am U.S. Packaging
Jim Ransom Senior Vice President, Bemis Company, Inc.
President, Bemis North America
10:50 am Global Healthcare
Paul Verbeten President, Bemis Healthcare Packaging
10:30 am Latin America
Nelson Fazenda President, Bemis Latin America
11:25 am Wrap-up
Bill Austen
10:05 am Europe
Rick Michaletz President, Bemis Europe
9:55 am Asia-Pacific
B.L. Lim President, Bemis Asia-Pacific
11:05 am Financial Discipline & Targets
Mike Clauer Vice President & Chief Financial Officer
11:30 am Q & A
Bemis Team
3
Break (15 mins)

BEMIS: A NEW PERSPECTIVE
Bill Austen
President & Chief Executive Officer
OUR STRATEGIC OBJECTIVES
5
performance
improvement
(ROS, ROIC)
accelerate growth
focus innovation
continuously
improve

WHAT’S DIFFERENT?
6
with
focus alignment with
alignment Accountability
& rigor
with
accountability
& rigor
HOW we execute…

HOW WE EXECUTE…
Our vision…
passionate commitment to the
growth and success of our
customers will make Bemis the
clear choice for
inspired packaging solutions
7
with
focus

HOW WE EXECUTE…
8
with
alignment integrated
global operating
model
performance-
linked
compensation
metrics
global identity

9
with
accountability
& rigor
HOW WE EXECUTE…
innovation
stage gate
process
commercial
analytics
process
strategic
acquisition
process
capital
investment
process

10
CAPITAL INVESTMENT PROCESS
Disciplined approach to capital investment
ROIC: 15% 5-year average
Execution &
Accountability
Continuous
Capital
Allocation
Process

11
CAPEX EMPHASIZES GROWTH
CAPEX shift is focused on growth and productivity
5x%
46% 50% 48%
66% ~65%
$0
$50
$100
$150
$200
2010 2011 2012 2013 2014 2015 - 2019
EHS & Maintenance Growth & Productivity
48%
46% 50% 48%
66% ~65%
($ in millions)

TRENDS IMPACTING OUR CUSTOMERS
12
health & wellness sustainability
healthcare differentiation
Global trends favor Bemis solutions

OUR STRATEGIC OBJECTIVES
13
performance
improvement
(ROS, ROIC)
accelerate growth
focus innovation
continuously
improve

14
Bemis’ growth objectives are balanced between organic & acquisitions
new product commercialization
product globalization
conversion to flexible formats
k
e
y
d
r
i
v
e
r
s speed to market
technology
geography
k
e
y
d
r
i
v
e
r
s
3% organic 3% inorganic
customer intimacy adjacencies
ACCELERATE GROWTH

FOCUS INNOVATION
15
Legacy Products
85%
New
15%
customer-
recognized
technology
leader
valued
global
partner
Innovation is our unique competitive advantage
strong technical
foundation

16
CONTINUOUSLY IMPROVE
execute disciplined
product launches
enhance cost
discipline
deploy world-class
systems
modernize asset
base & processes
Continuous improvement creates sustained high-performance momentum

EXECUTING OUR STRATEGY
2014 $4.3b
Revenue
2019 ~$5.8b
Revenue
17
5-year target CAGR = ~6% (organic + inorganic)

BEMIS: A NEW PERSPECTIVE
18
Customer-centric Internal External focus
Resources aligned
Urgency in all we do

BEMIS COMPANY – PURE PACKAGING
19
NO
RT
H A
ME
RIC
A 52% 25% 13% 10%
LA
TIN
AM
ER
ICA
EU
RO
PE
AS
IA-P
AC
IFIC
HE
AL
TH
CA
RE
$2,861 U.S. Packaging
Global Packaging
$1,483
2014 Net Sales
2014 Net Sales
($ in millions)

TECHNOLOGY &
INNOVATION
William Jackson, PhD
Vice President & Chief Technology Officer

REJUVENATING BEMIS R&D
21
enhance customer
intimacy
focus innovation
pipeline
execute disciplined
research
leverage technology
globallyenhance talent base
increase external
research

INNOVATION PIPELINE: U.S. PACKAGING
22
Build Business
Case Development
Customer
Validation Production
Launch
shrink
protein
clear high
barrier
polarized
films
evolution™
water vapor
protection
retail liquid
pouch
oxygen
scavenging
dry foods
conversion
next-gen cans
to pouch
next-gen
single serve
Innovation pipeline supports organic growth plan

INNOVATION PIPELINE: GLOBAL PACKAGING
23
Build Business
Case Development
Customer
Validation Production
Launch
water vapor
protection
PVdC free
blister pack
CXB pharma retort stand-
up pouch
yogurt “on-
the-go”
expanded PP
and PET rigid
retail cup high barrier
polar films
next-gen
sauce SUP
LCD high
adhesive
protect film
MAP meat
electronics
protective
film
Innovation pipeline supports organic growth plan

STAGE GATE PROCESS
Build
Business
Case
Development Customer
Validation
Production
Launch
24
Execution and Risk Retirement
- Differentiation
- Market analysis
- ROIC > 15%
- Customer needs
- Design & model
- IP creation
- Customer trial
- Strategic pricing
- Margin analysis
- Scale-up
- Leverage
Marketing, Technology, Operations Reviews
Robust Stage Gate process = Focused innovation Robust stage gate process = focused innovation
technology

BEMIS INNOVATION: HELPING OUR CUSTOMERS GROW
25
Build
Business
Case
Consumer complaint: “incumbent
package…too hard to open”
• Multi-layer structure
• Easy-open
• Reduces material Development
Creation of predictive model for shelf-
life testing accelerated customer
validation with a high degree of
confidence
Customer
Validation
Bemis’ Evolution™ platform pudding cups
Production Launch

PRODUCT VITALITY
26
Product vitality = revenue from
new specifications created over
the prior 3 years as a percent of
total year sales
15%
85%
2014 revenue New Products
Base Products
15% of Bemis revenue is from products launched over the last 3 years

PRODUCT VITALITY
27
Legacy Products
85%
New
15%
0
5
10
15
20
2013 2014
% o
f To
tal
U.S. Packaging
Revenue
0
5
10
15
20
2013 2014
% o
f To
tal
Global Packaging
Revenue
Global technology leveraging improves vitality

CREATING A NEW CUSTOMER EXPERIENCE
28
A global hub for customer collaboration, ideation, and innovation
Bemis Innovation Center – Neenah, WI

U.S. PACKAGING
Jim Ransom
Senior Vice President, Bemis Company, Inc.
President, Bemis North America

OUR U.S. PACKAGING BUSINESS
30
0%
10%
20%
30%
Meat &Cheese
Dairy &Liquids
SpecialtyFood &
Meals
Dry Foods BeverageWraps
Candy,Snacks &
Bakery
Other Non-food
Health &Hygiene
Percent of 2014 Net Sales
$2.9b2014 Net Sales
2014 Op Profit
28 plants
13.1%
Leading technologies. Broad product line. Diverse customer base.

ECONOMIC TRENDS: U.S.
United States Past 3 Years 2014 2015-2019 FCST
Real GDP ~2% 2.4% 3.1%
Inflation ~2% 1.7% 2.1%
Unemployment ~7% ~6% ~5%
Source: International Monetary Fund, Bureau of Labor Statistics, and Bureau of
Economic Analysis
31

THE COMPETITIVE LANDSCAPE
32
Bemis is the broadest flexible packager in North America
Principal Competitors:
PROCESSED
MEAT &
CHEESE
FRESH MEAT &
CHEESE
(SHRINK BAGS)
DAIRY &
LIQUID
INSTITUTIONAL
LIQUIDDRY FOODS BEVERAGES
CANDY &
SNACKSBAKERY
HEALTH &
HYGIENE
BEMIS ● ● ● ● ● ● ● ● ●
WINPAK ● ● ● ● ●
SONOCO ● ● ● ●
BERRY ● ● ●
SEALED AIR ● ●
PRINTPAK ● ● ● ● ● ●
COVERIS ● ● ● ● ●
AMERICAN PKG ● ●
COATING EXCELLENCE ● ●
FRES-CO ● ●

HOW WE GROW U.S. PACKAGING
33
xx
grow share of wallet scale. speed. expertise. breath.
deliver new products collaborative innovation. solutions that fit trends.
capitalize on packaging
format conversions glass/can/corrugate → flexible
the clear
choice for
inspired
packaging
solutions

THE CLEAR CHOICE FOR HEALTH & WELLNESS
34
Freshness Less preservatives
more sophisticated
packaging
Healthy snacking in a one-handed world

THE CLEAR CHOICE FOR SUSTAINABILITY
35
Extend shelf life To reduce food waste
Reduce material
weight & volume
Reduce & reuse in-
process waste

THE CLEAR CHOICE TO DELIVER CUSTOMER GROWTH INITIATIVES
36
Gaining share of
consumers’ wallet
Brand
rejuvenation
Modernization of
packaging formats

THE CLEAR CHOICE FOR EMERGING CHANNELS
37
Convenience
Stores & Drug
Stores
Dollar Stores E-retail
Price. Package. Architecture.
Club Stores

THE CONVERSION TO FLEXIBLE PACKAGING
38
The demand for flexible packaging… The speed of conversion…
Logistics savings
Shelf appeal & billboard
Less waste at the grocer
Driven by customers' filling line reinvestment

LEVERAGING BEMIS TECHNOLOGY – EVOLUTION™
39
creamers
pudding

INVESTMENT TO SUPPORT GROWTH
40
U.S. Packaging CAPEX $*
Dairy & Liquid $45m
Meat & Cheese (Shrink
rollstock)$25m
Converting
Productivity$25m
Proprietary Barrier
Films for Various End-
Market Applications$8m
*Major CAPEX projects 2014-2016

PATH TO IMPROVED RESULTS
DEPLOY
WORLD-CLASS
SYSTEMS (pricing analytics;
supply chain excellence)
ACCELERATE DEPLOYMENT OF
CAPEX FOR GROWTH & PRODUCTIVITY
LEVERAGE MARKET TRENDS &
DIFFERENTIATED PRODUCTS (collaborative innovation)
15-18% ROS
41

U.S. PACKAGING: POSITIONED TO GROW
2014 $2.9b
Revenue
2019 ~$3.2b
Revenue
42
Market trends favor Bemis solutions
Customers seek Bemis’ collaboration
Capital investments support growth
CAGR = ~2% (organic)

GLOBAL PACKAGING

OUR GLOBAL PACKAGING BUSINESS
44
0%
10%
20%
30%
Medical &Pharma
Dairy &Liquids
Meat &Cheese
Health &Hygiene
SpecialtyFood
Beverage Candy,Snacks &
Bakery
Other Non-food
Percent of 2014 Net Sales
$1.5b2014 Net Sales
2014 Op Profit
32plants, 4
continents
7.6%

ASIA-PACIFIC
B.L. Lim
President, Bemis Asia-Pacific

OUR BUSINESS IN ASIA-PACIFIC
46
0%
10%
20%
30%
40%
50%
Health & Hygiene Other Non-food Meat & Cheese Specialty Food Dry Food
Percent of 2014 Net Sales
$148m2014 Net Sales
4plants, 3
countries
(Australia, China, New Zealand)

ECONOMIC TRENDS: ASIA-PACIFIC
47
ASEAN Past 3 Years 2014 2015-2019 FCST
Real GDP ~5% 4.6% ~5%
Inflation ~4% 5% ~5%
China Past 3 Years 2014 2015-2019 FCST
Real GDP ~8% 7.3% ~7%
Inflation ~2.5% 2.3% ~3%
Source: International Monetary Fund
Fast-paced growth environment

COMPETITIVE LANDSCAPE
48
Principal Competitors:
PROCESSED
MEAT &
CHEESE
FRESH MEAT &
CHEESE
(SHRINK BAGS)
SPECIALTY
FOODDRY FOODS
OTHER NON-
FOOD
HEALTH &
HYGIENE
BEMIS ● ● ● ● ● ●
AMCOR ● ●
SEALED AIR ●
ESSEL PROPACK ●
Bemis: most sophisticated product offering
THE CLEAR CHOICE FOR FOOD SAFETY
49
Food Safety
Heightened consumer
awareness
Evolving Food
Regulations

THE CLEAR CHOICE FOR DIFFERENTIATION
50
Increasingly
sophisticated consumer
preferences
Desire for
convenience &
shelf appeal

THE CLEAR CHOICE FOR A DIGITAL WORLD
51
Protective films
1 2
3
4 5 6 7
8
9
10
11
12
13
14
LCD Panel (exploded view)
Our high-clarity films protect layers 2,3,5,6, and 8 of
the inputs used to make LCD panels.

LEVERAGING BEMIS TECHNOLOGY
52
Protecting our
technology in Asia
Stringent segregation
of knowledge
Bringing Bemis
technology into Asia
Process technology &
barrier meat packaging
technology

INVESTMENT TO SUPPORT GROWTH
53
Asia-Pacific CAPEX $ (USD)*
Barrier Films
(Meat & Electronics)~$20m
*Major CAPEX projects 2014-2016

PATH TO IMPROVED RESULTS
54
LEVERAGE &
EXTEND BEMIS
TECHNOLOGIES
ESTABLISH
DIFFERENTIATED
MANUFACTURING EXCELLENCE
INCREASE SALES OF
SOPHISTICATED, VALUE-ADDED
BARRIER FILMS (for meat,
high-flavor snacks & electronics)

BEMIS ASIA-PACIFIC: POSITIONED TO GROW
2014 $148m
Revenue
2019 ~$210m Revenue
55
Emerging economy with significant growth opportunity
Evolving consumer preferences and regional regulatory
changes favor Bemis solutions
Innovative & Bemis proprietary solutions support growth
2009 $1m
Revenue
CAGR = ~7% (organic)

EUROPE
Rick Michaletz
President, Bemis Europe

OUR BUSINESS IN EUROPE
57
$196m2014 Net Sales
4plants, 3
countries
(Belgium, Finland, UK)
Specialized player (meat & cheese) with sales reach throughout Europe
0%
20%
40%
60%
80%
Meat & Cheese Health & Hygiene Other Food
Percent of 2014 Net Sales

ECONOMIC TRENDS: EUROPE
58
European Union Past 3 Years 2014 2015-2019 FCST
Real GDP ~flat 1.4% 1.9%
Inflation ~2% 0.7% 1.5%
Unemployment ~10% 10.3% ~9%
Source: International Monetary Fund

COMPETITIVE LANDSCAPE
59
Bemis is a specialized player in value-added packaging in Europe
Principal Competitors:
MEAT CHEESE
BEMIS ● ●
AMCOR ●
SEALED AIR ● ●
WIPAK ● ●
SUDPACK ● ●
KREHALON ●

THE CLEAR CHOICE FOR DIFFERENTIATION
60
“Display”
Shelf appeal & impression
THE CLEAR CHOICE FOR DIFFERENTIATION
61
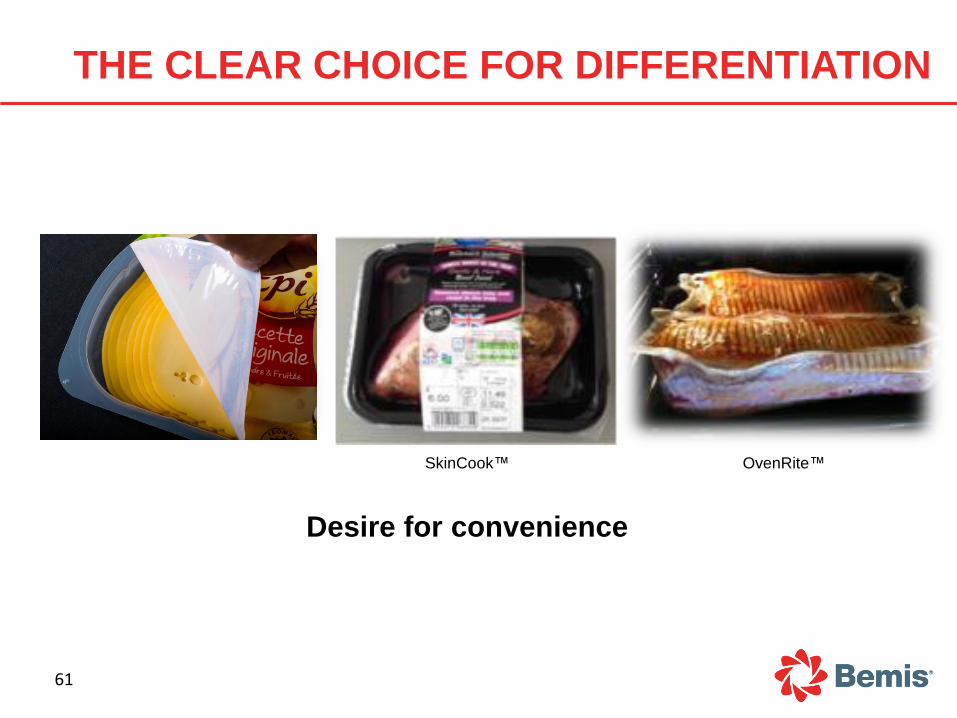
Desire for convenience
SkinCook™ OvenRite™

THE CLEAR CHOICE FOR SUSTAINABILITY
62
Reduce material weight
& volume
Clearshield™ PRO
30% less material
Recycle-ready
PET-based packaging

LEVERAGING BEMIS TECHNOLOGY
63
Productivity. Presentation. Security.
Conversion away from shrink bags to shrink
rollstock eliminates the need for hand-packing
X Form-Tite™ and Flow-Tite™

INVESTMENT TO SUPPORT GROWTH
64
Europe CAPEX $ (USD)*
Meat & Cheese
(Shrink Rollstock)$8m
Meat & Cheese
(Skin & Peel Reseal)$7m
*Major CAPEX projects 2013-2015

PATH TO IMPROVED RESULTS
65
IMPROVE COST
STRUCTURE
LEVERAGE DATA
& ANALYTICS
TO IMPROVE
MARGINS
INCREASE SALES OF
SOPHISTICATED, VALUE-ADDED
PACKAGING (Meat & Cheese)

BEMIS EUROPE: POSITIONED TO GROW
2014 $196m
Revenue
2019 ~$250m Revenue
66
Disciplined focus on pricing & cost reduction improves
margins
Market trends favor Bemis solutions
Capital investments support growth
CAGR = ~5% (organic)

BREAK

LATIN AMERICA
Nelson Fazenda
President, Bemis Latin America

OUR BUSINESS IN LATIN AMERICA
69
0%
10%
20%
30%
Meat &Cheese
Dairy &Liquids
Health &Hygiene
Beverage Rigid retail(disposables)
Dry Food Candy,Snacks &
Bakery
Other Non-food
Percent of 2014 Net Sales
$775m2014 Net Sales
16plants, 3
countries
(Argentina, Brazil, Mexico)
Leading technologies. Broad product line. Diverse customer base.

ECONOMIC TRENDS: LATIN AMERICA
2015-2019 FCST
Real GDP: ~4%
Inflation: ~3.2%.......................
2015-2019 FCST
Real GDP: ~2.5%
Inflation: ~21%....................
2015-2019 FCST
Real GDP: ~2.5%
....................Inflation: ~5%
Source: International Monetary Fund
70
Our business model effectively manages dynamic economic trends

COMPETITIVE LANDSCAPE
71
Bemis is the largest packaging supplier in Brazil (flex and rigid plastic)
Principal Competitors:
PROCESSED
MEAT & CHEESE
FRESH MEAT &
CHEESE (SHRINK
BAGS)
DAIRY & LIQUID DRY FOODS BEVERAGESCANDY, SNACKS
& BAKERY
HEALTH &
HYGIENE
BEMIS ● ● ● ● ● ● ●
SEALED AIR ●
EMPLAL ●
VIDEPLAST ● ●
FIBRASA ●
POLYVAC ● ●
ZARAPLAST ● ●
CONVERPLAST ●
CONSTANTIA ● ● ●
PRINTPAK ● ●

TRENDS IN LATIN AMERICA
72
Source: Instituto de Tecnologia de Alimentos “Brasil Pack Trends 2020”
convenience and simplicity
aesthetics and identity
quality and new technologies
sustainability and ethics
Consumer trends favor Bemis’ sophisticated packaging solutions

THE CLEAR CHOICE FOR DIFFERENTIATION
73
Increasingly
sophisticated consumer
preferences
Desire for
convenience
Collaborative customer relationships Creativity. Collaboration. Solutions.

COLLABORATIVE INNOVATION…IN ACTION
74
1st “Click”
2nd “Click”
Danone's Goals Bemis' Innovation
New concept: cups instead of bottles Improved cup design: 24% lighter
Update brand Stackable design for improved retailing
Appeal to young people Shrink sleeve decoration
Attract on-the-go consumers "Double-click lid" to prevent spilling
Create a flavor explosion Custom lid opening creates a "flavor explosion"
"We need to launch this product in 2014!"

THE CLEAR CHOICE FOR SUSTAINABILITY
75
Flexibles replace blow-molded
bottles 70% less plastic
Reduce material
Flexibles replace metal can
Reduce material weight &
volume

LEVERAGING BEMIS TECHNOLOGY
76
BRF’s slogan: “More than a new
product, a new category”
“Soltíssimo packaging brings benefits of functionality and convenience to the consumer, which are major
global trends, and brings innovation to the Sadia brand, which was the first Brazilian company to launch cold
cuts in resealable packaging.” -Laís Silva Novaes, Marketing Manager, BRF S.A.

INVESTMENT TO SUPPORT GROWTH
77
Latin America CAPEX $ (USD)*
Dairy & Liquid $27m
Meat & Cheese $19m
Converting
Productivity$16m
*Major CAPEX projects 2013-2016

PATH TO IMPROVED RESULTS
78
LEVERAGE
PRICING
ANALYTICS
IMPROVE OPERATING PERFORMANCE
INCREASE SALES OF
SOPHISTICATED PACKAGING
(meat & dairy)

BEMIS LATIN AMERICA: POSITIONED TO GROW
2014 $775m
Revenue
2019 ~$900m Revenue
79
Consumer trends favor Bemis’ sophisticated solutions
Deep customer relationships expand opportunity
Collaborative innovation creates growth
CAGR = ~3% (organic)

HEALTHCARE
PACKAGING
Paul Verbeten
President, Bemis Healthcare Packaging

OUR HEALTHCARE PACKAGING BUSINESS
81
Medical Device
83%
Pharma 17%
North America
57%
Latin America
15%
Europe 17%
Asia-Pacific
11%
$360m 9 plants 5 countries
2014 Net Sales (Brazil, China, Malaysia,
Northern Ireland, U.S.)

THE COMPETITIVE LANDSCAPE
82
Bemis is the only global supplier providing all major medical device packaging formats
PHARMA
Principal Competitors:TRAYS LIDS & POUCHES ROLLSTOCK
BEMIS ● ● ● ●
AMCOR ● ● ●
PRENT ●
KLOCKNER ●
CONSTANTIA ●
STERIPACK ●
OLIVER-TOLAS ● ●
WIPAK ●
MEDICAL DEVICES
THE HEALTHCARE ENVIRONMENT…
83
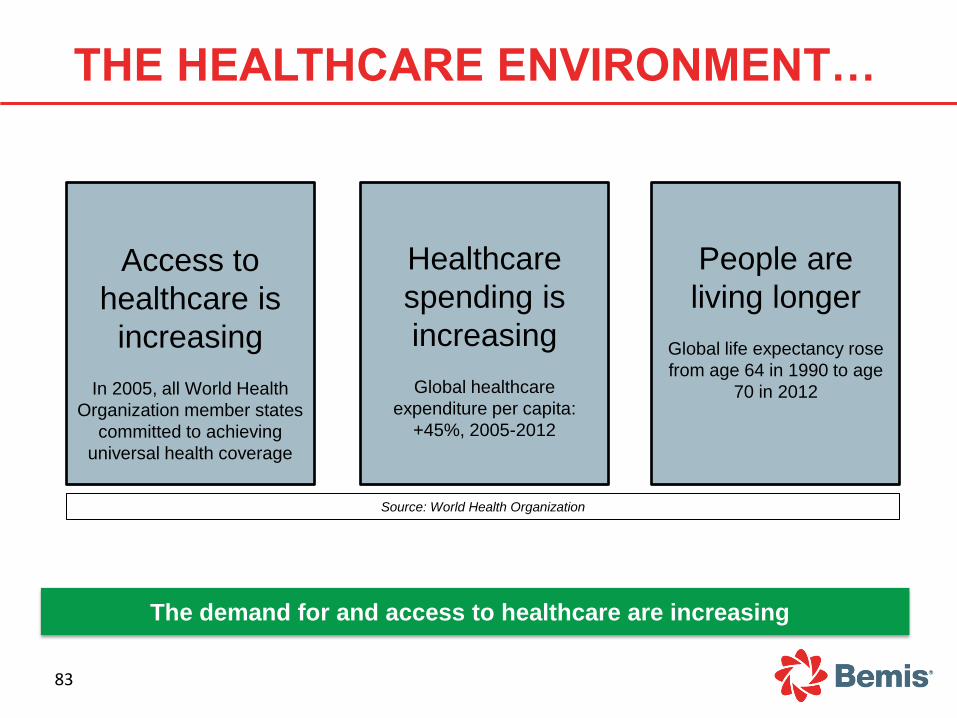
The demand for and access to healthcare are increasing
Access to
healthcare is
increasing
In 2005, all World Health
Organization member states
committed to achieving
universal health coverage
Healthcare
spending is
increasing
Global healthcare
expenditure per capita:
+45%, 2005-2012
People are
living longer
Global life expectancy rose
from age 64 in 1990 to age
70 in 2012
Source: World Health Organization

COMPLEX DEMANDS FOR HEALTHCARE PACKAGING
84
Trusted to meet complex healthcare demands
safety &
sterility
quality global
supplydrug efficacy
qualifications &
testing
navigating the
regulatory
environment

THE CLEAR CHOICE FOR HEALTHCARE
85
Consistent quality creates value
“To meet new market expectations, BD will be deploying a Policy of Zero Escapes across all our supplier base this year.” –Sam Machour, VP Quality Mgmt
Need for zero defects
Value Proposition

LEVERAGING BEMIS TECHNOLOGY
86
Cereal liner technology
surgical glove package
Hot dog packaging
technology syringe
package
Ketchup package
technology transdermal
patch package

INVESTMENT TO SUPPORT GROWTH
87
Medical Device / Pharma CAPEX $ (USD)*
U.S. Expansion
Coater & Clean Room$28m
Asia Extrusion Capacity $8m
*Major CAPEX projects 2014-2015

PATH TO IMPROVED RESULTS
88
EXTEND OUR
TECHNOLOGY TO MEET
CUSTOMER NEEDS
CONTINUOUSLY ELEVATE OUR
INDUSTRY-LEADING QUALITY…
EXPAND CAPACITY TO
MEET INCREASING
DEMAND

HEALTHCARE PACKAGING: POSITIONED TO GROW
2014 $360m
Revenue
2019 ~$575m Revenue
89
Growing with world-class customer base
Industry-leading technology & quality
Capital investments that support healthcare growth
CAGR = ~10% (organic)

FINANCIAL DISCIPLINE
& TARGETS Mike Clauer
Vice President & Chief Financial Officer

CFO OBSERVATIONS RECENT HISTORY. RELATIVE TO PEER GROUP.
91
Bemis: A solid business with great opportunity
what we do well
opportunities to
improve
.
.
.
.
Return cash to shareholders
New CAPEX discipline & accountability
Manage raw material cost volatility
SG&A and cost discipline
Use of balance sheet
Volume growth
Return on sales
ROIC
Working capital management

NEAR-TERM CFO PRIORITIES
92
support business strategy
execute acquisition strategy
improve cash flow
Committed to creating shareholder value

2000 - 2004 2005 - 2009 2010 - 2014 2015 - 2019
Organic* Inorganic
ACCELERATE GROWTH
2014 $4.3b
Revenue
CAGR = ~6% (organic + inorganic) 2019
~$5.8b Revenue
93 *organic = price/volume/mix, currency, divestiture
Growth: a balanced approach

INORGANIC GROWTH STRATEGY
94
adjacencies speed to market
proprietary
technologies
complementary
geographies

INORGANIC GROWTH DISCIPLINE
95
revenue synergies
cost synergies
exceptional growth
ROIC-hurdle rate accretive
sustainable competitive advantage
Rigorous evaluation and integration process

EXPAND OPERATING MARGINS
2014 13.1%
ROS
U.S. Packaging
96
2019 15-18%
ROS
2014 7.6%
ROS
Global Packaging
2019 10%+
ROS

97
CAPITAL SPENDING DISCIPLINE
CAPEX shift is focused on growth & productivity
DISCIPLINE:
15% ROIC HURDLE
RATE, 5-YEAR AVG
ACCOUNTABILITY:
POST-AUDIT AND
CONTINUOUS
REVIEW PROCESS $0
$50
$100
$150
$200
$250
2010 2011 2012 2013 2014 2015 - 2019
EHS & Maintenance Growth & Productivity D&A
($ in millions)

IMPROVE ROIC
98
2014: 9.7% Bottom quartile, peer group
2019: Top quartile
NEW CAPITAL:
15% HURDLE RATE,
5-YEAR AVG
ACQUISITIONS:
ACCRETIVE TO
ROIC WITHIN 5
YEARS
CAPEX discipline and margin improvement drive ROIC improvement

IMPROVE WORKING CAPITAL
99
Working capital Discipline. Accountability. Improvement.
2014:
20%2019:
14-16%
primary working capital % of sales

100
Capex
Dividends
Divestitures
dividend payments
capital investments
strategic acquisitions
share repurchases
CAPITAL ALLOCATION DISCIPLINE

RECENT SHARE REPURCHASE
101
6.7m REMAINING SHARES
AUTHORIZED FOR REPURCHASE,
AS OF YEAR-END 2014
2010:
1.5m2011:
5.0m2013:
2.1m2014:
3.8m
shares repurchased

2019 FINANCIAL TARGETS
102
Assumptions: • Constant currency (Jan 2015)
• Effective pass-through of resin prices
• Cost take-out more than offsets non-raw material inflation
• SG&A spending is held flat
• Tax rate: 34%
• Constant share count
• Interest rates in line with forward curve (Jan 2015)
• Primary working capital is 14-16% of sales (2016-2019)
($ millions) 2014 2019 2014 2019
Actual Target Actual Target
Revenue Growth ROIC
Total $4.3b $5.8b Industry quartile Bottom Top
Organic 3.0%
Inorganic 3.0% CAPEX* $186 ~$200
EPS growth* 10% 10%+
U.S. Pkg 13.1% 15-18%
Global Pkg 7.6% 10%+ Cash from ops $248 ~$550
*excludes acquisitions
Operating Margins*

STARTING OUR 5-YEAR JOURNEY
103
2015 guidance is on the path to achieve our 2019 goals
EPS $2.52 - $2.67
CAPEX $185 - $200
Cash from ops $400+
Unit volume U.S. +2%; Global +4%
2015 Targets:

WRAP-UP
Bill Austen
President & Chief Executive Officer

BEMIS: POSITIONED TO GROW
105
leading market positions
disciplined capital allocation
relevant product pipeline
intimate customer relationships
global footprint
aligned resources
favorable market trends

Q&A