Investor Briefing - sktelecom.com · 2018 Highlights Investor Briefing Completed acquisition SK...
17
January 31, 2019 Investor Briefing Results for the FY 2018 SK Telecom (K-IFRS, Non-audited)
Transcript of Investor Briefing - sktelecom.com · 2018 Highlights Investor Briefing Completed acquisition SK...

January 31, 2019
0
Investor Briefing
Results for the FY 2018
SK Telecom
(K-IFRS, Non-audited)

1
Disclaimer
Investor Briefing
This presentation contains forward-looking statements with respect to the financial condition,
results of operations and business of SK Telecom and its subsidiaries (the “Company”, or “SKT”)
and plans and objectives of the management of the Company. The aforementioned forward-
looking statements are influenced by unknown risks, uncertainties and other factors which may
change the actual results or performance of the Company.
The Company does not make any representation or warranty, expressed or implied, as to the
accuracy or completeness of the information contained in this management presentation, and
nothing contained herein is, or shall be relied upon as, a promise or representation, whether
as to the past or the future.
Therefore, this presentation contained herein should not be utilized for any legal purposes in
regards to investors’ investment results. The Company hereby expressly disclaims any and all
liability for any loss or damage resulting from the investors’ reliance on the information
contained herein.
This presentation only speaks the information as of the date they are made, and the Company
undertakes no obligation to update publicly any of them in light of new information or future
events.
As of January 1, 2018, the Company has adopted IFRS 15, 「Revenue from Contracts with
Customers」, by recognizing the cumulative effect of initially applying IFRS 15 as an adjustment
to the opening balance of retained earnings as of January 1, 2018.
As a supplemental discussion of our operating results, this presentation contains unaudited
results under the comparative historical accounting method prior to our adoption of IFRS 15.

Contents
2018 Highlights 3
Mobile Service 7
Media 9
Security 10
Commerce 11
Financial Results 12
Financial Statements 14
Operating Data 16
Investor Briefing
2

2018 Highlights Investor Briefing
Consolidated Financial Results
Financial Highlights
3
□ Revenue for 2018 experienced a marginal decline of 3.7% YoY thanks to New
ICT businesses such as media and security businesses making up for the
decreased MNO revenue
• While non-consolidated revenue decreased by 6.1% due to annual reflection of the
tariff cut effect, the MNO revenue decline was narrowed with continued efforts to
innovate customer value
• SK Broadband marked record-high annual earningsRevenue KRW 3.25tn(YoY +6.6%) in 2018
driven by qualitative growth of IPTV business, including growing content consumption
and larger mix of UHD subscribers
• While MNO revenue slightly decreased in 4Q18, consolidated revenue increased by
3.9% QoQ thanks to IPTV revenue growth as well as consolidation of ADT Caps’
revenue
□ Consolidated net income for 2018 recorded KRW 3.132 trillion, an 17.9%
increase YoY, due to larger equity method gains on SK Hynix
• Operating income for 4Q18 fell QoQ due to one-off losses related to SK Planet’s
restructuring efforts
□ While MNO marketing costsYoY -8.0% were cut and 11ST’ profitabilityYoY KRW +86.2bn
was improved, operating income for 2018 decreased by 21.8% YoY due to
MNO revenue decrease
(KRW bn) 2017(Historical)
2018(IFRS 15)
YoYIFRS 15 Historical
3Q18 4Q18 QoQ 4Q17 4Q18 YoY
Operating Revenues
17,520.0 16,874.0 △3.7% 4,186.4 4,351.7 3.9% 4,497.3 4,371.3 △2.8%
OperatingExpenses
15,983.4 15,672.2 △1.9% 3,882.3 4,126.4 6.3% 4,186.9 4,163.4 △0.6%
Operating Income
1,536.6 1,201.8 △21.8% 304.1 225.3 △25.9% 310.4 207.9 △33.0%
Net Income 2,657.6 3,132.0 17.9% 1,049.8 474.5 △54.8% 660.6 466.7 △29.3%
EBITDA 4,783.6 4,485.3 △6.2% 1,110.9 1,071.5 △3.5% 1,142.4 1,054.1 △7.7%
EPS (KRW) 36,582 44,075 20.5% 14,555 6,815 △53.2% 8,236 6,691 △18.8%

2018 Highlights Investor Briefing
Biz. Highlights
□ Implementation of the 8 Customer Value Innovation Program reduced
marketing costs while achieving continued net handset subscriber additions
throughout the year and a record-low churn rate
• Increased customer benefits with a no-contract plan and a reorganized membership
program; innovated price plans through T Plan and 0 Plan and strengthened retention;
lessened burden of purchasing handsets by introducing T rental
• With a roaming service launched in Dec. 2018 that provides free overseas voice calls
on T Phone app. on top of the Guam-Saipan Pass which applies domestic rates,
customer experiences regarding roaming were improved
• MNO marketing costs decreased by 8.0% YoY and recorded a 10-year low
• Handset subscribers recorded net adds every quarter, recording 185k for the year,
while annual churn rate marked a record-low 1.22%
• Also, set a new record as the company with the longest consecutive years of being
ranked no.1 in all three customer satisfaction indices in Korea
4
□ In media business, subscriber growth and competitive platform accelerated
growth while the recent OTT service agreement with three terrestrial
broadcasters secured a new growth opportunity
• IPTV subscribers reached 4.73 millionYoY +9.7%, and in Q4, the portion of high-ARPU
UHD subscribers exceeded 50% 53.8%(YoY +11.4%p)
• Oksusu acquired 9.73 million subscribersYoY+13.4% as of the end of 2018, thereby
continuing growth, and signed an MOU to cooperate on an OTT service with ‘POOQ’,
the service of the three terrestrial broadcasters (Jan. 3, 2019)
(For details, please refer to the Investor Briefing (I.B.) dated January 3, 2019,
‘MOU for OTT Partnership with 3 Terrestrial Broadcaster’)
https://www.sktelecom.com/img/eng/presen/20190107/InvestorBriefingNewOTTPartnershipENG.pdf
• Launched the AI-based personalized music platform FLO in December, strengthening
the media service portfolio
• Agreed on establishing joint venture with the largest US terrestrial broadcaster Sinclair
to enter the next-generation broadcasting solutions market, securing the opportunity
to occupy the US broadcasting solutions market ahead of others (Jan. 7, 2019)

2018 Highlights Investor Briefing
□ Completed acquisition SK Infosec, following that of ADT Caps and NSOK,
building an optimal portfolio for security business, our new growth engine
□ 11ST successfully attracted investment of KRW 500 billion, valued at
KRW 2.75 trillionPost-money, and paved the way to reach BEP in 2019 through
improved profitability in 2018
5
• Invested KRW 702 billion in May 2018 and acquired a 55% stake and management
rights to the nation’s no.2 security company ADT Caps, the earnings of which
contribute to consolidated earnings from Q4
(For details, please refer to the I.B. dated May 8, 2018 ‘ADT Caps Acquisition’)
https://www.sktelecom.com/img/eng/presen/20181026/InvestorBriefingADTCaps.pdf
• ADT Caps and NSOK have completed the merger (Dec. 2018) and integration process;
improved dispatch service quality and cost efficiency are expected as a result of
integration of customer/infrastructure integration
• In December 2018, completed acquisition of nation’s no.1 information security
company SK Infosec, equipping ourselves with converged security service line-up, with
quantum cryptography security of IDQ, and physical security of ADT Caps
(For details, please refer to the I.B. dated Oct. 26, 2018, ‘SK Infosec Acquisition’)
https://www.sktelecom.com/img/eng/presen/20181026/InvestorBriefingSKInfosecAcquisitionENG.pdf
• With the newly raised KRW 500 billion, 11ST was spun off from SK Planet to be
established as a separate entity (Sep. 2018)
(For details, please refer to the I.B. dated June 19, 2018, ‘SK Planet Restructuring/ 11ST
External Funding’)
https://www.sktelecom.com/img/eng/presen/20181026/InvestorBriefing11stExternalFundraising.pdf
• Reduced losses by KRW 86.2 billion while maintaining annual revenue for 2018 similar
to that of the previous year, and in 4Q18, achieved revenue growthQoQ +9.3% and loss
reductionQoQ KRW -1.4bn at the same time
• Mobile-led growth continued, with portion of mobile transactions for 2018 growing
by 4.2%p YoY to record 64.9%
2018 Highlights Investor Briefing
6
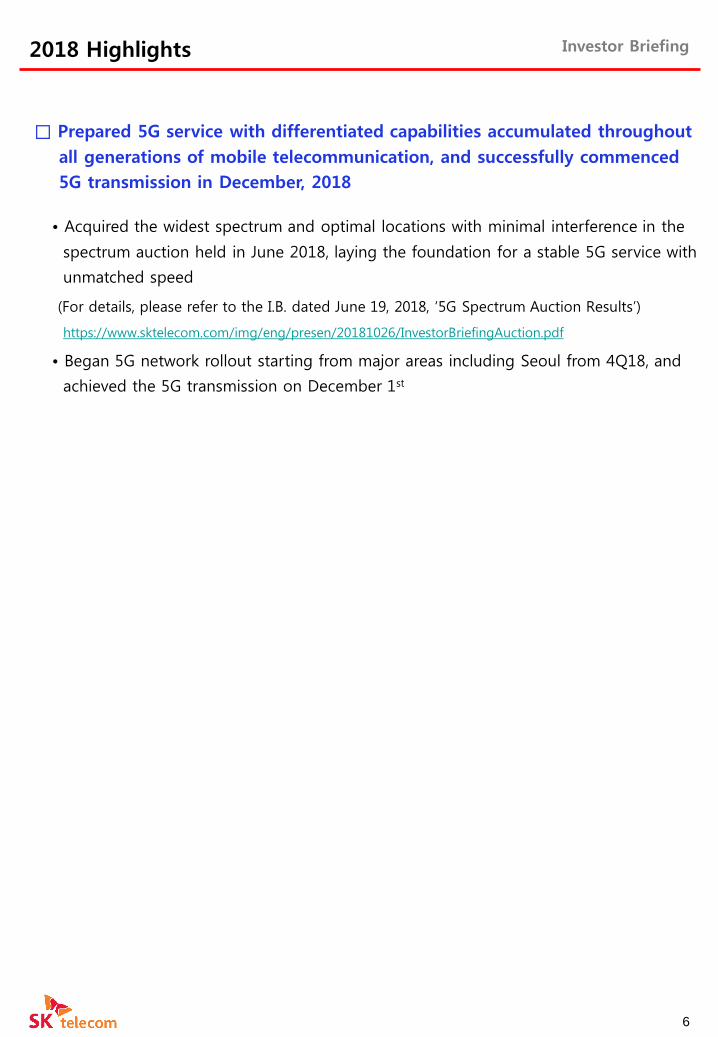
□ Prepared 5G service with differentiated capabilities accumulated throughout
all generations of mobile telecommunication, and successfully commenced
5G transmission in December, 2018
• Acquired the widest spectrum and optimal locations with minimal interference in the
spectrum auction held in June 2018, laying the foundation for a stable 5G service with
unmatched speed
(For details, please refer to the I.B. dated June 19, 2018, ‘5G Spectrum Auction Results’)
https://www.sktelecom.com/img/eng/presen/20181026/InvestorBriefingAuction.pdf
• Began 5G network rollout starting from major areas including Seoul from 4Q18, and
achieved the 5G transmission on December 1st
24,560 24,668 24,720 24,722
4Q17 1Q18 2Q18 3Q18 4Q18
2.69 2.57 2.50 2.49 2.45
4Q17 1Q18 2Q18 3Q18 4Q18
Mobile service revenue
Mobile Service Investor Briefing
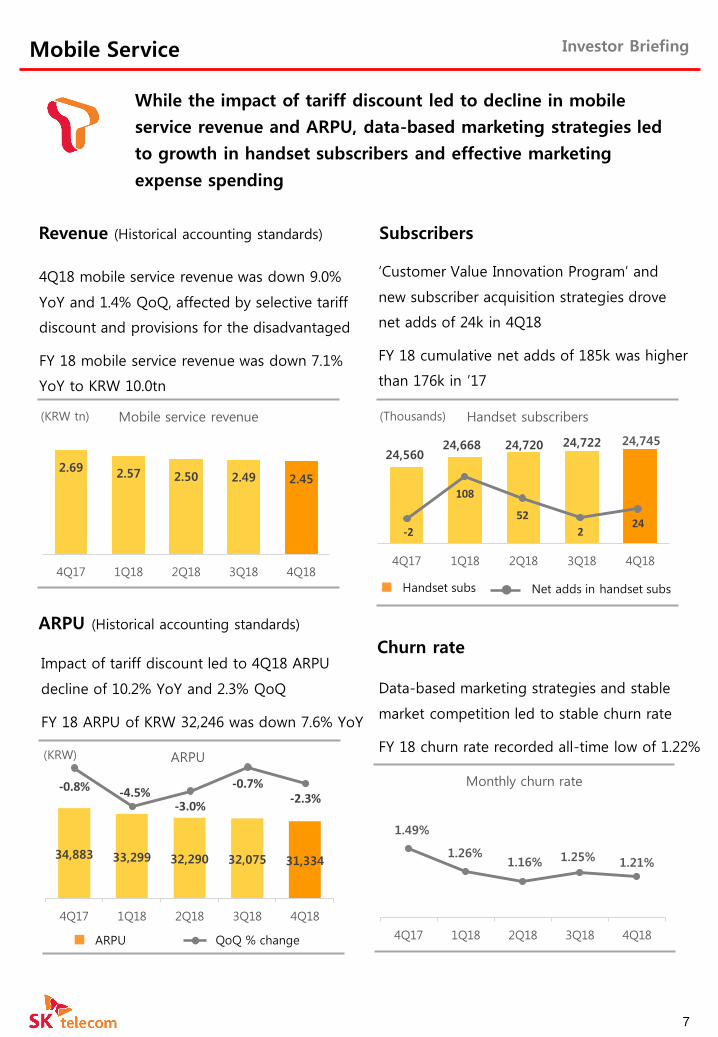
While the impact of tariff discount led to decline in mobile
service revenue and ARPU, data-based marketing strategies led
to growth in handset subscribers and effective marketing
expense spending
4Q18 mobile service revenue was down 9.0%
YoY and 1.4% QoQ, affected by selective tariff
discount and provisions for the disadvantaged
FY 18 mobile service revenue was down 7.1%
YoY to KRW 10.0tn
(KRW tn)
Revenue (Historical accounting standards) Subscribers
‘Customer Value Innovation Program’ and
new subscriber acquisition strategies drove
net adds of 24k in 4Q18
FY 18 cumulative net adds of 185k was higher
than 176k in ’17
-2
108
52
224
Handset subs Net adds in handset subs
Handset subscribers(Thousands)
24,745
Churn rate
Data-based marketing strategies and stable
market competition led to stable churn rate
FY 18 churn rate recorded all-time low of 1.22%
1.49%
1.26%1.16% 1.25% 1.21%
4Q17 1Q18 2Q18 3Q18 4Q18
Monthly churn rate
7
34,883 33,299 32,290 32,075 31,334
4Q17 1Q18 2Q18 3Q18 4Q18
ARPU(KRW)
ARPU (Historical accounting standards)
Impact of tariff discount led to 4Q18 ARPU
decline of 10.2% YoY and 2.3% QoQ
FY 18 ARPU of KRW 32,246 was down 7.6% YoY
ARPU QoQ % change
-0.8% -4.5%-3.0%
-0.7%-2.3%

794.2
715.9 701.5 722.9 730.6
4Q17 1Q18 2Q18 3Q18 4Q18
Mobile Service Investor Briefing
Marketing paradigm shift in 2018
Drive change and innovation through ‘Customer
Value Innovation Program’
While the impact of tariff discount led to decline in mobile
service revenue and ARPU, data-based marketing strategies led
to growth in handset subscribers and effective marketing
expense spending
8
[8] T Phone based roaming (December 17)
Provides unlimited voice calls to data roamingplan subscribers using T Phone app
By end of December 2018, has attracted over
4mn subscribers since its launch by offering
greater data allowance and bundling benefits
Added ‘T Plan Regular’ plan to meet customer
demand (KRW 43,000/month, 2GB data/month)
More than 55% of subscribers on Family and
Infinity plans share their data with family
members
T Plan, the intuitive price plan
4Q18 marketing expense was up 1.1% QoQ
due to increase in advertising cost but down
8.0% YoY due to ‘Customer Value Innovation
Program’ and market stabilization efforts.
Marketing expense to revenue was down YoY
despite lower revenue (4Q18 adjusted for
lower interconnection rate impact)
FY 18 marketing expense of KRW 2.87tn was
down 8.0% YoY
Marketing expense
(Historical accounting standards)
25.5%
23.9% 23.8%24.7% 25.2%
Marketing expense
Marketing expense(KRW bn)
Marketing expense to revenue
[1] No-contract plan (March 5)
In lieu of contract discounts, points that can be applied toward future device purchases or monthly payments are awarded to lock in customers
[2] Roaming Plan Upgrade (March 22)
Offer 3 free minute and lower data roaming prices
[3] Membership Program Upgrade (April 2)
Strengthen customer benefit with unlimited membership points and actual benefits (T Day)
[4] T Rental (June 1)
Provide the latest devices through rental service
[5] T Plan (July 18)
Introduced 5 price plans with bigger data offering which will contribute to the growth of mobile media business
[6] 0 Plan (August 13)
Offers greater data allowance and premium benefits to younger generation subscribers
[7] T Guam∙Saipan Pass (September 19)
Allows subscribers to use roaming services in Guam and Saipan at domestic rates

4Q18 IPTV revenue increased 29.1% YoY and
16.0% QoQ to KRW 374.4bn as a result of growth
in subscriber base, paid contents demand, and
platform biz
FY 18 IPTV revenue increased 25.8% YoY to
KRW 1.29tn
IPTV revenue
34.5%37.5% 38.5% 38.7%
40.9%
Media Investor Briefing
Recorded all-time high IPTV sales and profits driven by high-quality
growth, including content demand increase
Mobile OTT oksusu subscriber and content revenue increased through
strengthened contents competitiveness
Revenues (Historical accounting standards)
Subscribers
With net adds of 70k in 4Q18, IPTV
subscribers reached 4.73mn
Usage increase from strengthened contents
competitiveness led to 4Q18 IPTV contents
revenue increase of 7.7% YoY
oksusu’s contents revenue portion recorded
52.5% on the back of contents diversification
and strengthening of personalized menu
Contents
The subscriber portion of UHD-the premium
service continued to increase and recorded
53.8% by the end of December 2018
In 4Q18, oksusu subscribers increased by
13.4% YoY to 9.73mn and monthly duration
time increased 29.5% YoY to 487 minutes per
subscriber
oksusu subscribers(Thousands)(KRW bn)
% of IPTV to total revenueIPTV revenue
IPTV subscribers and % of UHD(Thousands)
% of UHD to total IPTV subsIPTV subs
% of contents revenue to total revenue of oksusu
53.1% 55.6%
46.5%52.7% 52.5%
4Q17 1Q18 2Q18 3Q18 4Q18
4,370 4,464 4,554 4,659 4,729
4Q17 1Q18 2Q18 3Q18 4Q18
9
290.1 287.5 305.8 322.8 374.4
4Q17 1Q18 2Q18 3Q18 4Q18
42.4%44.4%
47.3%49.6%
53.8%
8,585 8,875
9,135 9,457
9,730
4Q17 1Q18 2Q18 3Q18 4Q18

Security Investor Briefing
ADT Caps to contribute on both Top-Line and profitability based on
its stable earnings with upward trend, while leading the innovation
in security market for upcoming convergence security era
Revenues and earnings of ADT Caps are
reflected in 4Q18 consolidated results
Upward revenue trend continues in ’18, based
on the growth of security market and stable
recurring revenue of the company
Revenues
Positioning as leading company in security
market based on synergies from SK ICT Family
while expanding its business beyond physical
security to convergence security
Reduction in FY 18 operating income due to
one off effects from acquisition/restructuring
including the merge with NSOK
Operating income to rebound in FY 19 through
the revenue growth and cost optimization
based on synergies from the merger
Operating income
ADT Caps Growth strategy
[1] Synergies from SK ICT Family
Solidify the synergies from integration of
distribution channel/infrastructure and home
related integrated offerings from incorporation
with SK ICT family, and merger with NSOK while
strengthening capabilities on New ICT based
technology and convergence security
[2] Beyond security
Business expansion beyond physical security to
safety∙care expert company through early
expansion on new business model centering on
New ICT∙unmanned∙care related services
[3] Secure readiness on convergence security
Leading the upcoming convergence security era
by incorporating with SK Infosec on developing
convergence security products such as 5G/AI
based next generation integrated monitoring
system
10
666.4 693.3 721.7776.3
200.8
'15 '16 '17 '18 4Q18
ADT Caps* revenues(KRW bn)
122.5135.8
143.5
101.3
28.6
'15 '16 '17 '18 4Q18
ADT Caps* operating income(KRW bn)
* Includes CAPSTEC, ADT Security
* Includes CAPSTEC, ADT Security

Commerce Investor Briefing
11ST continues to improve its margins and targets to achieve
growth and profitability improvement through various
partnerships and synergies with SK ICT Family
4Q18 revenue of KRW 176.3bn was up 9% QoQ
on the back of ’11 Shopping Holiday’ event etc.
FY 18 revenue of KRW 674.4bn was similar to
last year due to efforts to enhance profitability
Revenues
11ST revenue(KRW bn)
-48.0
-18.0 -13.0
-19.1 -17.7
4Q17 1Q18 2Q18 3Q18 4Q18
Evolve into commerce portal by utilizing the
strengths of 11ST: industry-leading customer
base and product line-up, synergy with SK ICT
Family
11ST operating Income(KRW bn)
4Q18 operating losses decreased by
KRW 1.4bn QoQ and KRW 30.3bn YoY
through cost-effective marketing spend
FY 18 operating loss improved by KRW 86.2bn
YoY to KRW -67.8bn
Operating income
11ST Growth Strategy
[1] Increase sellers and product line-up through
partnerships
Though partnership with KOREACENTER (‘18.12),
enhance overseas sales capabilities and drive new
sellers to join
- Increase overseas sales by utilizing seven
logistics centers located around the world
owned by delivery agency service ‘malltail’.
Secure sellers through shopping mall launching
solution ‘MakeShop’
Increase product line-up through various external
partnerships in areas such as Fashion/Fresh
Goods/Beauty
[2] SK ICT Family Synergy
Create synergies among SKT, SKB and 11ST, by
utilizing extensive customer data base, and
offering integrated membership points
Mobile phone shop of 11ST to become SKT’s
online handset distribution channel
Offer differentiated experience in 5G era by
utilizing SKT’s technological strengths in AI/Search
and by introducing video commerce
176.2 166.1 170.7 161.3
176.3
4Q17 1Q18 2Q18 3Q18 4Q18
* Pro forma for operating income before spinoff on ‘18.9.1
11
4.50 4.18 4.15 4.19 4.35
1.14 1.15 1.15 1.11 1.07
4Q17 1Q18 2Q18 3Q18 4Q18
Consolidated revenues EBITDA
Financial Results Investor Briefing
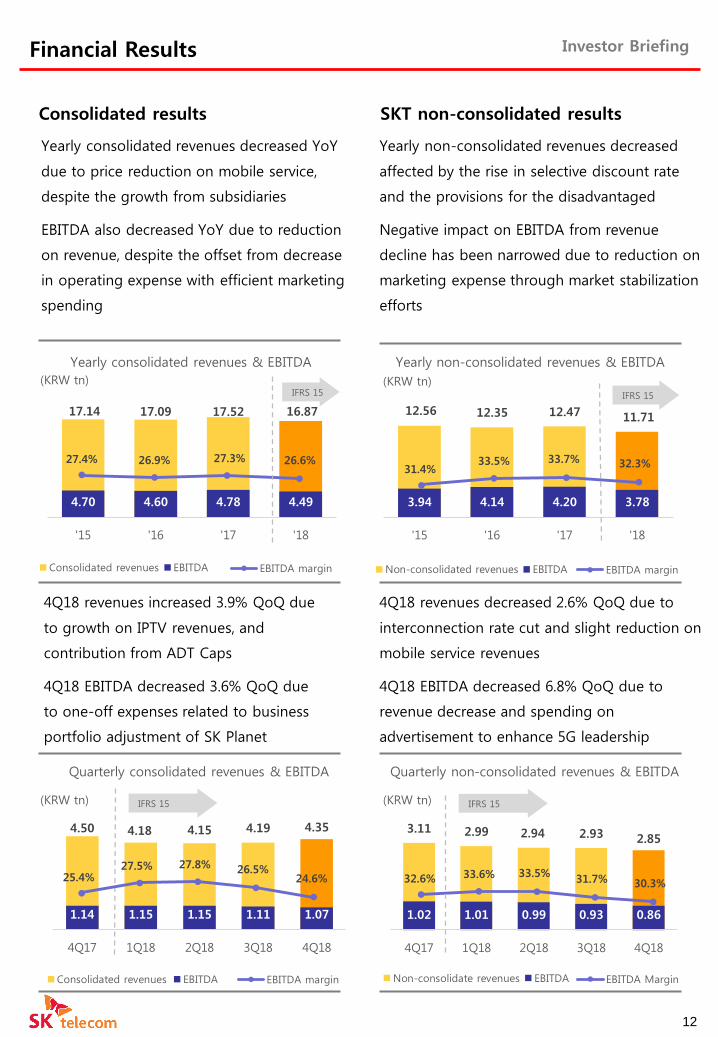
Consolidated results SKT non-consolidated results
Yearly consolidated revenues decreased YoY
due to price reduction on mobile service,
despite the growth from subsidiaries
EBITDA also decreased YoY due to reduction
on revenue, despite the offset from decrease
in operating expense with efficient marketing
spending
Yearly non-consolidated revenues decreased
affected by the rise in selective discount rate
and the provisions for the disadvantaged
Negative impact on EBITDA from revenue
decline has been narrowed due to reduction on
marketing expense through market stabilization
efforts
12
4Q18 revenues increased 3.9% QoQ due
to growth on IPTV revenues, and
contribution from ADT Caps
4Q18 EBITDA decreased 3.6% QoQ due
to one-off expenses related to business
portfolio adjustment of SK Planet
4Q18 revenues decreased 2.6% QoQ due to
interconnection rate cut and slight reduction on
mobile service revenues
4Q18 EBITDA decreased 6.8% QoQ due to
revenue decrease and spending on
advertisement to enhance 5G leadership
17.14 17.09 17.52 16.87
4.70 4.60 4.78 4.49
'15 '16 '17 '18
Consolidated revenues EBITDA
27.4% 26.9% 27.3% 26.6%
EBITDA margin
IFRS 15(KRW tn)
Yearly consolidated revenues & EBITDA
IFRS 15(KRW tn)
Quarterly consolidated revenues & EBITDA
25.4%27.5% 27.8% 26.5%
24.6%
EBITDA margin
12.56 12.35 12.47 11.71
3.94 4.14 4.20 3.78
'15 '16 '17 '18
Non-consolidated revenues EBITDA
Yearly non-consolidated revenues & EBITDA
IFRS 15
(KRW tn)
31.4%33.5% 33.7% 32.3%
EBITDA margin
3.11 2.99 2.94 2.93 2.85
1.02 1.01 0.99 0.93 0.86
4Q17 1Q18 2Q18 3Q18 4Q18
Non-consolidate revenues EBITDA
32.6% 33.6% 33.5%31.7% 30.3%
EBITDA Margin
Quarterly non-consolidated revenues & EBITDA
IFRS 15(KRW tn)

Consolidated EPS
1.89 1.96 1.982.13
'15 '16 '17 '18
Financial Results Investor Briefing
Non-consolidated CAPEX
(KRW)
(KRW tn)
EPS
CAPEX
Consolidated EPS grew in 20.5% YoY due to
increase in equity method earnings from SK
Hynix
Equity method earnings from SK Hynix for
FY 18 and 4Q18 recorded KRW 3.238tn and
KRW 722bn, respectively
FY 18 non-consolidated CAPEX recorded
KRW 2.13tn, executed within the level of
original guidance
13
Labor Cost decreased by KRW 1.1bn due to
the effects from amortizing prior period
customer acquisition costs
Commissions decrease by KRW 23.3bn from
capitalizing customer acquisition costs and
accounting changes for consideration paid to
customers
Advertising decrease by KRW 12.6bn as
certain previously expensed items are
recognized as sales discounts
IFRS 15Effects on consolidated financials
Operating revenues
Consolidated operating revenues decreased
by KRW 19.6bn, as a result of sales discounts
from previously expensed items and revenue
reallocation from combined contracts
Operating expenses
* IFRS 15 results – Historical results
20,988 23,497
36,58244,075
'15 '16 '17 '18
IFRS 15
(KRW bn)4Q18
(IFRS 15)Adj.*
4Q18(Historical)
Operating Revenues
4,351.7 (19.6) 4,371.3
Operating Expenses
4,126.4 (36.9) 4,163.4
Labor cost 664.6 (1.1) 665.7
Commissions 1,257.5 (23.2) 1,280.8
Advertising 138.0 (12.6) 150.6
OperatingIncome
225.3 17.4 207.9
Income Before Tax
604.0 17.4 586.6
Net Income 474.5 7.8 466.7

Financial Statements – Income Statements Investor Briefing
14
Consolidated Income Statement
Non-consolidated Income Statement
1) Revenues from direct carrier billing and verification reclassified from mobile service revenues to other revenues (historical data within this presentation restated)
2) Depreciation and amortization includes R&D related depreciation
1) Depreciation and amortization includes R&D related depreciation
1Q18 2Q18 3Q18 4Q18 2018 4Q18 2017 2018
Operating revenue 4,181.5 4,154.3 4,186.4 4,351.7 16,874.0 4,371.3 17,520.0 16,962.9
Operating expenses 3,856.1 3,807.4 3,882.3 4,126.4 15,672.2 4,163.4 15,983.4 15,737.5
Labor cost 550.0 535.6 538.5 664.6 2,288.7 665.7 1,966.2 2,290.1
Commissions paid 1,262.1 1,216.9 1,266.1 1,257.5 5,002.6 1,280.8 5,486.3 5,015.2
Advertising 100.1 110.5 119.9 138.0 468.5 150.6 522.8 519.7
Depreciation1) 823.8 806.7 806.8 846.2 3,283.5 846.2 3,247.0 3,283.5
Network interconnection 215.0 218.8 212.2 162.4 808.4 162.4 875.0 808.4
Leased line 41.8 40.4 41.0 34.8 158.1 34.8 192.0 158.1
Frequency usage fees 38.8 36.1 38.6 38.2 151.7 38.2 150.3 151.7
Cost of goods sold 410.9 399.0 418.3 568.0 1,796.1 568.0 1,886.5 1,796.1
Others 413.6 443.4 440.9 416.5 1,714.4 416.7 1,657.4 1,714.7
Operating income 325.5 346.9 304.1 225.3 1,201.8 207.9 1,536.6 1,225.4
EBITDA 1,149.3 1,153.6 1,110.9 1,071.5 4,485.3 1,054.1 4,783.6 4,508.9
EBITDA margin 27.5% 27.8% 26.5% 24.6% 26.6% 24.1% 27.3% 26.6%
Net profit or loss from non-operating items 581.5 816.1 997.8 378.7 2,774.2 378.7 1,866.6 2,774.2
Equity gains or losses 626.6 915.6 992.4 736.2 3,270.9 736.2 2,245.7 3,270.9
Income from continuing operations before tax 907.0 1,163.0 1,301.9 604.0 3,976.0 586.6 3,403.2 3,999.6
Consolidated net income 693.4 914.3 1,049.8 474.5 3,132.0 466.7 2,657.6 3,149.2
Majority interests 695.0 916.7 1,031.4 484.9 3,127.9 505.9 2,599.8 3,174.9
Minority interests (1.6) (2.4) 18.4 (10.4) 4.1 (39.2) 57.8 (25.7)
Basic earnings per share(KRW) 9,842 12,863 14,555 6,815 44,075 6,691 36,582 44,319
(KRW bn)IFRS 15 Historical
1Q18 2Q18 3Q18 4Q18 2018 4Q18 2017 2018
Operating revenue 2,988.5 2,941.8 2,925.6 2,849.7 11,705.6 2,854.4 12,468.0 11,716.0
Mobile service revenue1) 2,568.9 2,497.7 2,484.6 2,448.6 9,999.8 2,449.0 10,768.8 10,000.7
Interconnection 150.9 156.1 155.9 102.5 565.3 102.5 624.3 565.3
Others 268.8 288.0 285.1 298.6 1,140.5 302.9 1,075.0 1,150.0
Operating expenses 2,619.3 2,573.6 2,614.9 2,590.4 10,398.1 2,587.3 10,770.3 10,358.5
Labor cost 175.0 158.7 174.8 176.3 684.8 176.3 624.9 684.8
Commissions paid 1,132.9 1,085.5 1,112.7 1,123.6 4,454.8 1,120.4 4,864.5 4,415.1
Marketing commissions 712.3 664.5 692.4 672.3 2,741.5 669.2 2,968.6 2,701.8
Other commissions 420.7 421.0 420.3 451.2 1,713.3 451.2 1,895.8 1,713.3
Advertising 26.0 38.0 43.7 61.4 169.0 61.4 150.4 169.0
Depreciation2) 636.2 617.2 615.7 604.4 2,473.5 604.4 2,503.5 2,473.5
Network interconnection 162.6 167.0 162.3 114.5 606.5 114.5 628.6 606.5
Leased line 31.7 32.2 31.6 29.5 125.0 29.5 140.1 125.0
Frequency usage fees 38.8 36.1 38.6 38.2 151.7 38.2 150.3 151.7
Others 416.0 438.9 435.5 442.5 1,733.0 442.5 1,708.1 1,733.0
Operating income 369.3 368.2 310.6 259.3 1,307.5 267.2 1,697.7 1,357.6
EBITDA 1,005.4 985.4 926.3 863.7 3,781.0 871.6 4,201.2 3,831.0
EBITDA margin 33.6% 33.5% 31.7% 30.3% 32.3% 30.5% 33.7% 32.7%
Net profit or loss from non-operating items 108.2 (72.3) (60.7) (61.4) (86.2) (61.4) (93.9) (86.2)
Income from continuing operations before tax 477.5 295.9 249.9 197.9 1,221.2 205.8 1,603.8 1,271.3
Net income 364.4 219.8 183.3 166.4 933.9 169.2 1,331.1 970.3
(KRW bn)IFRS 15 Historical

Financial Statements – Financial Position Investor Briefing
15
Consolidated Balance Sheet
Non-consolidated Balance Sheet
1) Cash and marketable securities includes cash & cash equivalents, marketable securities & short-term financial instruments2) Other comprehensive income/loss include gains or losses on valuation of investment securities and derivatives
(KRW bn) 12-31-17 Adj* 1-1-18 3-31-18 6-30-18 9-30-18 12-31-18
Total assets 33,428.7 2,523.0 35,951.7 36,134.4 36,336.8 38,186.5 42,369.1
Current assets 6,201.8 1,804.1 8,005.9 8,471.3 7,814.3 9,025.6 7,958.8
Cash and marketable securities1) 2,171.5 - 2,171.5 2,482.2 2,287.5 3,108.6 2,589.6
Accounts receivable 3,386.8 (4.3) 3,382.5 3,601.2 3,085.0 3,580.7 2,946.5
Other current assets 643.4 1,808.4 2,451.8 2,387.9 2,441.8 2,336.3 2,422.7
Non-current assets 27,226.9 718.9 27,945.8 27,663.1 28,522.5 29,160.9 34,410.3
PP&E and intangible assets 15,646.9 - 15,646.9 15,018.8 14,830.8 14,628.3 19,170.4
Investment assets 10,426.7 - 10,426.7 11,161.9 12,070.9 12,838.4 13,477.7
Other non-current assets 1,153.3 718.9 1,872.2 1,482.4 1,620.8 1,694.2 1,762.2
Total liabilities 15,399.5 622.9 16,022.4 16,146.6 15,428.0 16,015.7 20,019.9
Current liabilities 7,109.1 12.5 7,121.6 6,883.7 5,759.3 5,889.8 6,847.6
Short-term borrowings 130.0 - 130.0 30.0 45.9 53.1 80.0
Accounts payable 2,438.3 - 2,438.3 1,743.5 1,805.3 1,735.8 2,477.1
Other current liabilities 4,540.8 12.5 4,553.3 5,110.2 3,908.1 4,100.9 4,290.5
Non-current liabilities 8,290.4 610.4 8,900.8 9,262.9 9,668.7 10,125.9 13,172.3
Bonds payable & long-term borrowings 5,808.1 - 5,808.1 6,332.9 6,604.0 6,883.3 8,587.6
Deferred tax liabilities 978.7 599.3 1,578.0 1,685.0 1,812.6 1,966.1 2,269.8
Other non-current liabilities 1,503.6 11.1 1,514.7 1,245.0 1,252.1 1,276.5 2,314.9
Total shareholders' equity 18,029.2 1,900.0 19,929.2 19,987.8 20,908.8 22,170.8 22,349.3
Common stock and additional paid in capital 240.9 - 240.9 241.4 234.2 551.7 699.8
Retained earnings 17,835.9 1,900.0 19,736.0 19,842.4 20,754.7 21,696.9 22,144.5
Other comprehensive income/loss2) (234.7) - (234.7) (292.8) (283.9) (356.1) (373.4)
Minoriry interests 187.1 - 187.1 196.8 203.8 278.3 (121.6)
(KRW bn) 12-31-17 Adj* 1-1-18 3-31-18 6-30-18 9-30-18 12-31-18
Total assets 25,557.5 2,325.2 27,882.7 27,787.3 26,997.5 27,065.1 28,848.0
Current assets 3,768.1 1,711.4 5,479.5 6,087.1 5,343.9 5,517.4 4,679.4
Cash and marketable securities1) 974.6 - 974.6 1,380.6 1,135.2 1,137.4 976.8
Accounts receivable 2,523.7 - 2,523.7 2,769.3 2,250.7 2,490.6 1,872.7
Other current assets 269.8 1,711.4 1,981.2 1,937.2 1,958.0 1,889.4 1,829.9
Non-current assets 21,789.4 613.8 22,403.2 21,700.2 21,653.6 21,547.7 24,168.6
PP&E and intangible assets 11,318.9 - 11,318.9 10,774.5 10,555.5 10,344.6 12,260.6
Investment assets 9,877.3 - 9,877.3 9,884.4 9,916.4 9,940.8 10,188.9
Other non-current assets 593.2 613.8 1,207.0 1,041.3 1,181.7 1,262.3 1,719.1
Total liabilities 10,550.1 601.2 11,151.3 11,371.9 10,390.3 10,353.3 11,960.5
Current liabilities 4,767.4 - 4,767.4 4,840.6 3,420.6 3,300.8 4,178.1
Accounts payable 1,867.0 - 1,867.0 1,381.4 1,410.4 1,238.7 1,782.3
Other current liabilities 2,900.4 - 2,900.4 3,459.2 2,010.2 2,062.1 2,395.8
Non-current liabilities 5,782.7 601.2 6,383.9 6,531.3 6,969.7 7,052.5 7,782.5
Bonds payable & long-term borrowings 4,377.3 - 4,377.3 4,802.8 5,293.7 5,412.8 5,254.6
Long-term payables 1,328.6 - 1,328.6 1,036.4 1,040.8 1,045.2 1,939.1
Other non-current liabilities 76.8 601 678.0 692.1 635.2 594.5 588.8
Total shareholders' equity 15,007.4 1,724.0 16,731.4 16,415.4 16,607.2 16,711.8 16,887.5
Common stock and additional paid in capital 416.5 - 416.5 416.7 415.6 415.7 460.0
Retained earnings 14,512.6 1,724.0 16,236.5 16,008.0 16,224.0 16,317.3 16,467.8
Other comprehensive income/loss2) 78.3 - 78.3 (9.3) (32.4) (21.2) (40.3)
1) Cash and marketable securities includes cash & cash equivalents, marketable securities & short-term financial instruments2) Other comprehensive income/loss include gains or losses on valuation of investment securities and derivatives
*Impact of IFRS 15
*Impact of IFRS 15

Operating Data Investor Briefing
Subscribers
ARPU
(Thousands) 1Q17 2Q17 3Q17 4Q17 1Q18 2Q18 3Q18 4Q18 YoY QoQ
Subscribers 1) 29,833 29,993 30,156 30,195 30,349 30,719 30,771 30,882 2.3% 0.4%
Net adds 238 160 163 39 155 370 52 112 189.6% 113.9%
Activations 1,583 1,385 1,462 1,391 1,299 1,434 1,209 1,235 -11.2% 2.1%
Deactivations 1,345 1,225 1,299 1,352 1,144 1,063 1,156 1,123 -17.0% -2.9%
Monthly Churn 1.5% 1.4% 1.4% 1.5% 1.3% 1.2% 1.3% 1.2% -0.3%p -0.1%p
Smartphone Subs 22,181 22,424 22,735 22,985 23,386 23,705 23,842 23,964 4.3% 0.5%
LTE Subs 1) 21,650 22,071 22,569 22,865 23,401 23,993 24,391 24,796 8.4% 1.7%
LTE Penetration 72.6% 73.6% 74.8% 75.7% 77.1% 78.1% 79.3% 80.3% 4.6%p 1.0%p
High speed internet 5,103 5,137 5,196 5,233 5,277 5,318 5,368 5,405 3.3% 0.7%
IPTV 2) 4,073 4,170 4,287 4,370 4,464 4,554 4,659 4,729 8.2% 1.5%
(KRW) 1Q17 2Q17 3Q17 4Q17 1Q18 2Q18 3Q18 4Q18 YoY QoQ
ARPU1) 34,615 34,934 35,172 34,883 33,299 32,289 32,070 31,328 -10.2% -2.3%
ARPU including MVNO 31,039 31,260 31,371 31,014 29,586 28,652 28,454 27,782 -10.4% -2.4%
16
1) Includes MVNO connections, excludes other connections such as facility-monitoring lines
2) Restated subscriber count including VoD users effective as of 2Q17 (historical data restated)
1) Calculated from SK Telecom mobile service revenue (2G/3G/LTE and IoT) : Includes voice, data, and other revenue (Excludes activation fee and interconnection revenue).
Net of sales discount from contract and bundling, etc. Excludes MVNO related revenue.
Calculated from SK Telecom mobile service revenue (2G/3G/LTE and IoT) : From MSIT subscriber statistics (average number of billed connections for the quarter)
2018 ARPU: IFRS 15 accounting standards
※ Revenues from direct carrier billing and verification are reclassified from mobile service revenues to other revenues. Historical data within this presentation is restated accordingly.