Vodafone Digital Services & Experiences Investor Briefing ...
Upload
company-spotlightCategory
view
4.333download
0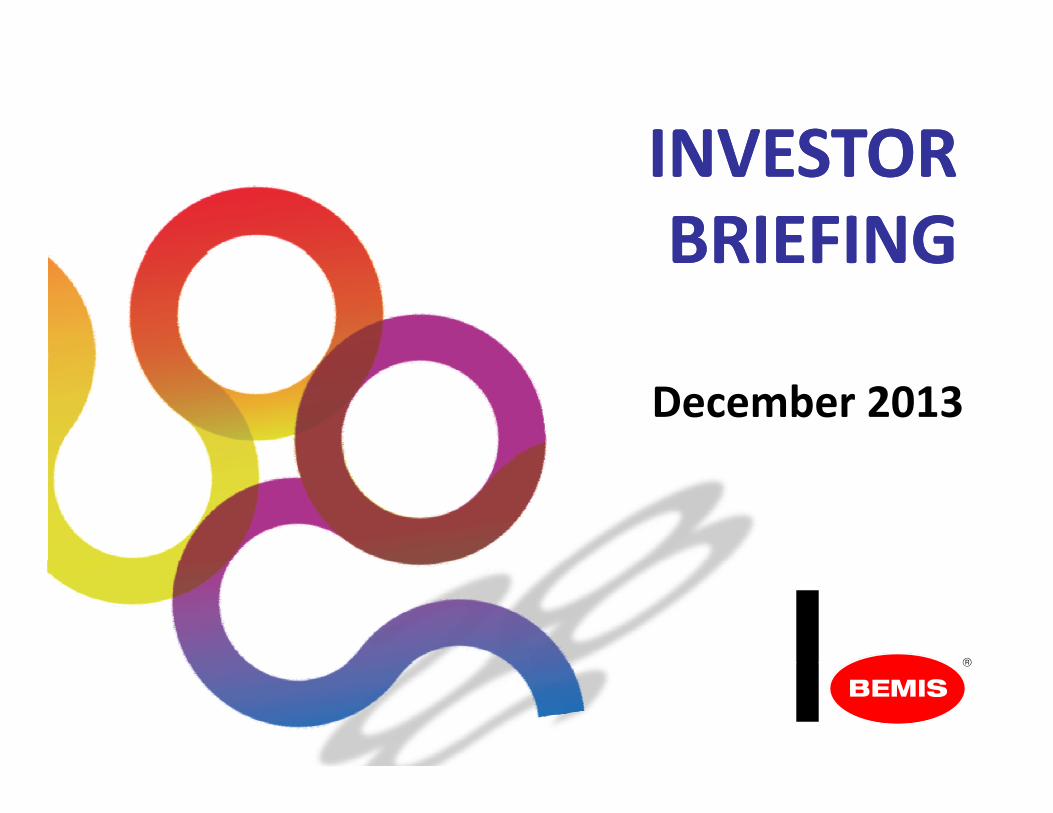
INVESTORINVESTORINVESTORINVESTORBRIEFINGBRIEFINGBRIEFINGBRIEFING
December 2013

Safe Harbor StatementSafe Harbor Statement
This presentation includes forward‐looking statements within the meaning of the Safe Harbor provisions of the Securities Litigation Reform Act of 1995. Such statements include, but are not limited to, statements relating to the expected future performance of the company and its objectives, expectations and intentions for the future. These forward‐looking statements are based on the current beliefs and expectations of Bemis Company’s management and are subject to risks and uncertainties. The forward‐looking statements speak only as of the date of this presentation, and Bemis Company does not undertake to update such statements to reflect changes that occur after that date. There are a number of factors that could cause actual results to differ from those set forth in the forward‐looking statements. These factors include, but are not limited to: general economic conditions, competitive conditions in our markets, regional governmental regulations, the cost and availability of raw materials, and our ability to pass these price changes on to our customers or otherwise manage commodity price fluctuation risks. These and other risks, uncertainties, and assumptions are identified from time to time in our filings with the Securities and Exchange Commission including our most recent Annual Report on form 10‐K and our quarterly reports on Form 10‐Q. Such reports are available on the website of the Securities and Exchange Commission (www.sec.gov).
Page 2

Bemis Company ProfileBemis Company Profile
2012 Net Sales by Region Packaging industry leader
since 1858
69%9%
since 1858
$5.1 billion 2012 net sales
F 50019%
3% Fortune 500 S&P 500
Vertical integration creates
North America Latin America
Vertical integration creates competitive advantage
74 facilities in 11 countries Latin America Europe Asia Pacific
74 facilities in 11 countries
~ 20,000 employees worldwide
Page 3

2012 Highlights2012 Highlights
Record adjusted EPS of $2.15
Increased dividend payable to shareholders Increased dividend payable to shareholders
Announced new reportable segment structure: U S PackagingU.S. Packaging Global Packaging Pressure Sensitive Materials
Substantially completed facility consolidation program to close 9 manufacturing locations
Increased footprint in Asia‐Pacific
Page 4
Net Sales & Adjusted Op ProfitNet Sales & Adjusted Op Profit** % by Segment% by Segment($ i illi )($ in millions)
U.S. Packaging
Pressure SensitiveMaterials
Global Packaging
$3 04043%
$556
16%
8%
$1 544
100%
$3,04057%
$55612%
64%
$1,544
15.0% $3,000
12.8%11.0%
13.0%
10 0%
15.0% $3,000 15.0%
$3,000
North America Latin AmericaEurope Asia Pacific
$1,451 $1,637 $1,543
8.8%7.4% 7.0%
5.0%
10.0%
$1,000
$2,000
$2,822 $3,111 $3,040
5.0%
10.0%
$1,000
$2,000
5.9% 6.3% 6.6%
5.0%
10.0%
$1,000
$2,0008.8%
Page 5
$ ,
0.0% $‐2010 2011 2012
0.0% $‐2010 2011 2012
$563 $574 $556 0.0% $‐
2010 2011 2012
* See appendix for reconciliation from GAAP to Adjusted Operating Profit excluding certain items.Page 5

U.S. Packaging ProfileU.S. Packaging ProfilePercent of 2012 Net Sales
20%
30%Percent of 2012 Net Sales
0%
10%
Meat & Dairy & Specialty Dry Foods Beverage Candy, Health & OtherCheese Liquids Food &
MealsWraps Snacks &
BakeryHygiene Non‐food
Extends shelf life of perishable foods (meat, cheese dairy produce)cheese, dairy, produce)
Proprietary and patented film structures
Premium manufacturing Premium manufacturing scale and printing capabilities support both national and regional brands
Page 6
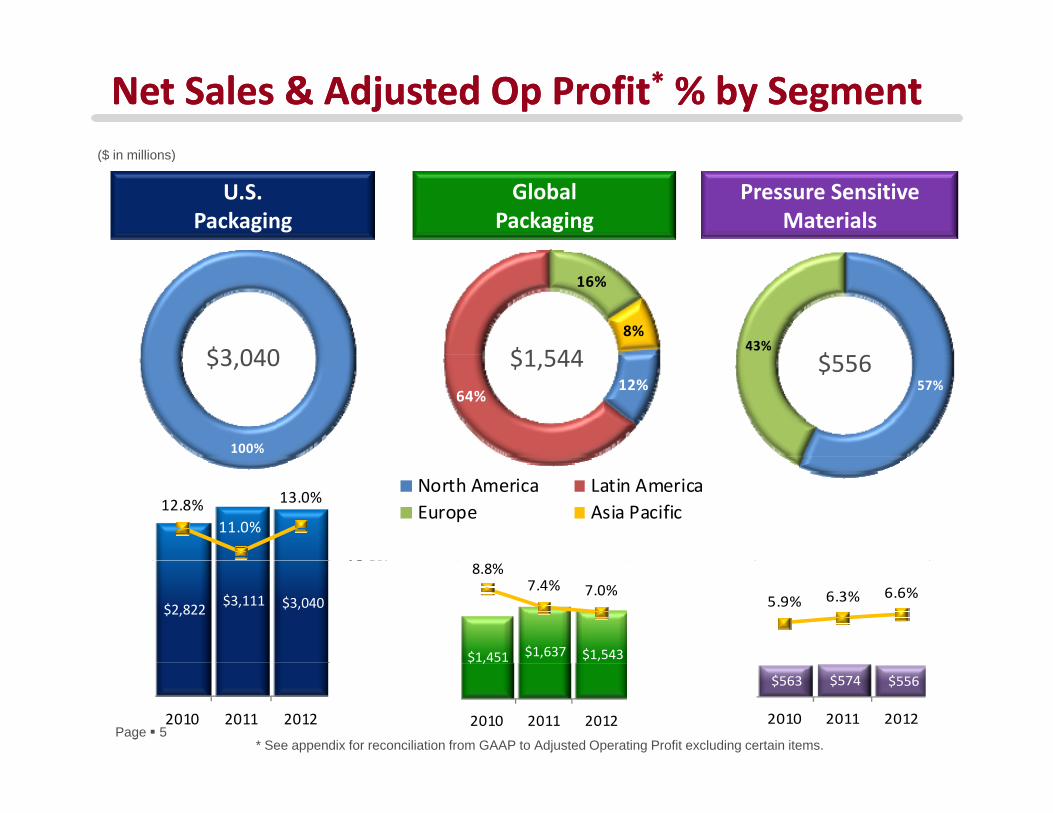
U.S. U.S. Packaging Growth DriversPackaging Growth Drivers Conversion from jars and
cans to pouches
Single serving / Single serving / convenience sizes
Material content and
Glass jar Pouch
weight reduction for sustainability and cost management
Convenient cook‐in packages
Eli i ti f PVdC
Paper envelope Stand up pouch w/window
Elimination of PVdCcontent from plastic cups
Page 7
Can Cook-in Pouch

Global Packaging ProfileGlobal Packaging Profile
20%
Percent of 2012 Net Sales
0%
10%
Medical & Dairy & Meat & Health & Specialty Beverage Candy, Other
Expanding consumer
ed ca &Pharma
a y &Liquids
eat &Cheese
ea t &Hygiene
Spec a tyFood
e e ageWraps
Ca dy,Snacks &Bakery
Ot eNon‐food
markets in Latin America and Asia
Sterility and quality areSterility and quality are paramount for medical applications
Page 8

Global Packaging Global Packaging Growth DriversGrowth Drivers Food safety regulations in
emerging marketsWal-Mart located in China
New generation of consumers looking for convenience features
Need for shelf stable foods due to lack of available refrigeration spacerefrigeration space
Retort
Page 9
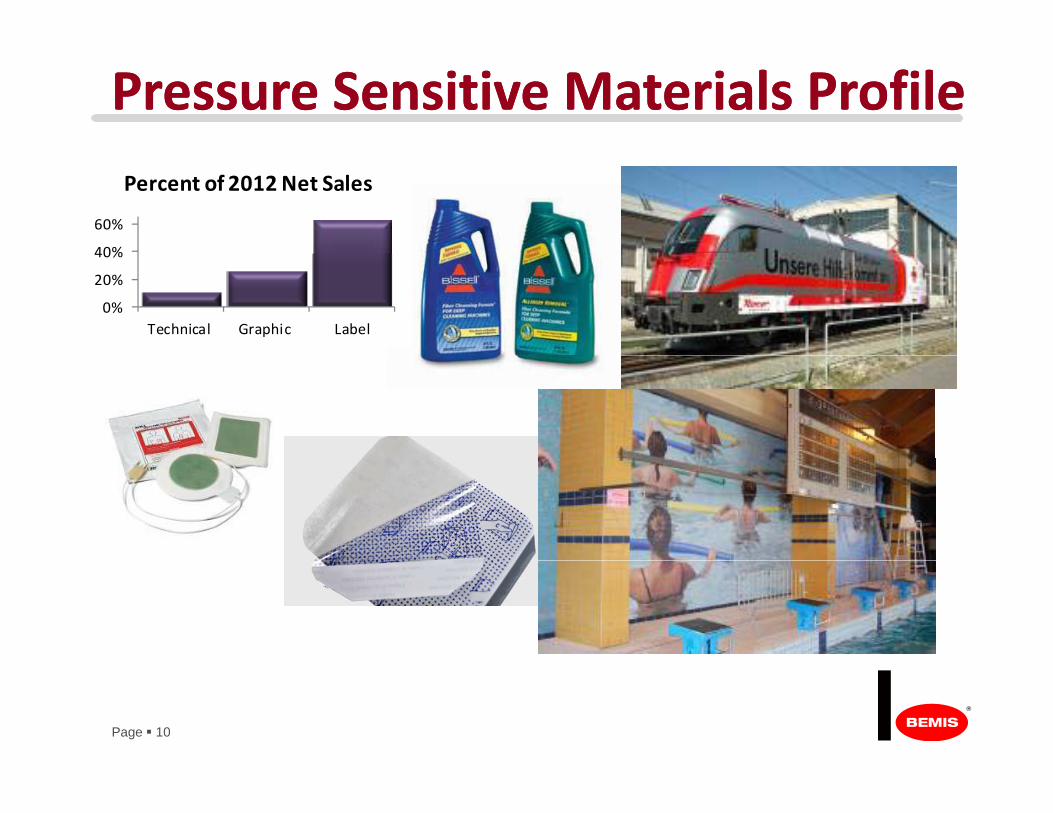
Pressure Sensitive Materials ProfilePressure Sensitive Materials Profile
40%
60%
Percent of 2012 Net Sales
0%
20%
40%
Technical Graphic Label
Page 10

DisciplinedDisciplined CapitalCapital StewardshipStewardshipPriorities:
1) 30 consecutive years $400
$500Cash Flow from Operations ($ in millions)
of increasing dividend payments
2) Fund organic growth $100
$200
$300
$400
2) Fund organic growth to enhance revenues and returns
) d$1.20
Cash Di idends
$0
$100
2002 2003 2004 2005 2006 2007 2008 2009 2010 2011 2012
3) Fund acquisitions
4) Balance share repurchases and $0 40
$0.60
$0.80
$1.00Cash Dividends
repurchases and deleveraging
$0.00
$0.20
$0.40
2002 2003 2004 2005 2006 2007 2008 2009 2010 2011 2012 2013
Page 11

Share Repurchase HistoryShare Repurchase History
$154 $161
$50 $18 $27
$46
2002 2003 2004 2005 2006 2007 2008 2009 2010 2011 2012
Deleveraging
M&A Transactio
n
M&A Transactio
n
M&A Transactio
n
($203)
M M M
Page 12

World Class Customer BaseWorld Class Customer Base
Why customers choose Bemis:
U i h l i l d i i Unique technological and engineering resources
Reduced waste in production and pdistribution system
Flexible capacity to accommodate new product launchesnew product launches
Reliable supply; Quality product
Investment grade supplier Investment grade supplier
Global supply capabilities
Page 13

Strategic PrioritiesStrategic Priorities
Optimize & Leverage p gOur Scale
Grow in Target Areas
Accelerate InnovationAccelerate Innovation
Page 14
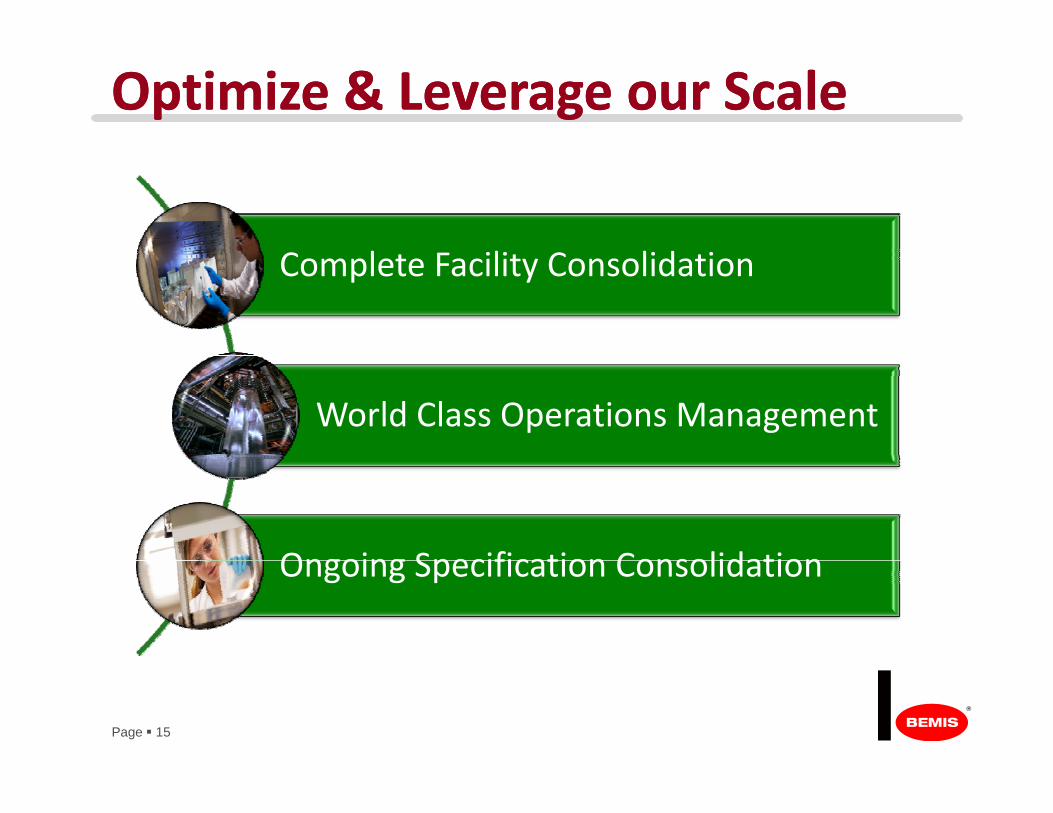
Optimize & Leverage our ScaleOptimize & Leverage our Scale
C l F ili C lid iComplete Facility Consolidation
World Class Operations Management
Ongoing Specification ConsolidationOngoing Specification Consolidation
Page 15

Grow in Target AreasGrow in Target Areas
Packaging demand from Medical and pharmaceutical High barrier packaging
developing countries
• Emerging economies demanding/regulating
pharmaceutical industries
• Demographics continue to drive
opportunities
• New products continue to win business in g g g
food safety and convenience features
• Lack of refrigeration creates need for shelf
growth• Modern bio‐technology requires more complex packaging
established U.S. food applications
• Expanding opportunities for high
stable packaging• Increasing consumer populations
p g g• Opportunities for smart packaging to solve emerging market needs
pp gbarrier film in Latin America and Asia
Page 16

Accelerate InnovationAccelerate Innovation
Unique Polymer
Polyethylene
Polyester
NylonPolymer Technologies
Nylon
Polypropylene
Barrier resins
Consumer Convenience Features
EZ Peel/Reseal
IntegraCut / IntegraScore
Microwaveable/self venting
Weight reduction
Reduced transportationFood
Proprietary sealantsSustainability Reduced packaging material
Less food and material waste
Lower carbon footprint
Food Safety
Antimicrobial coatingsRetort technologies
Page 17
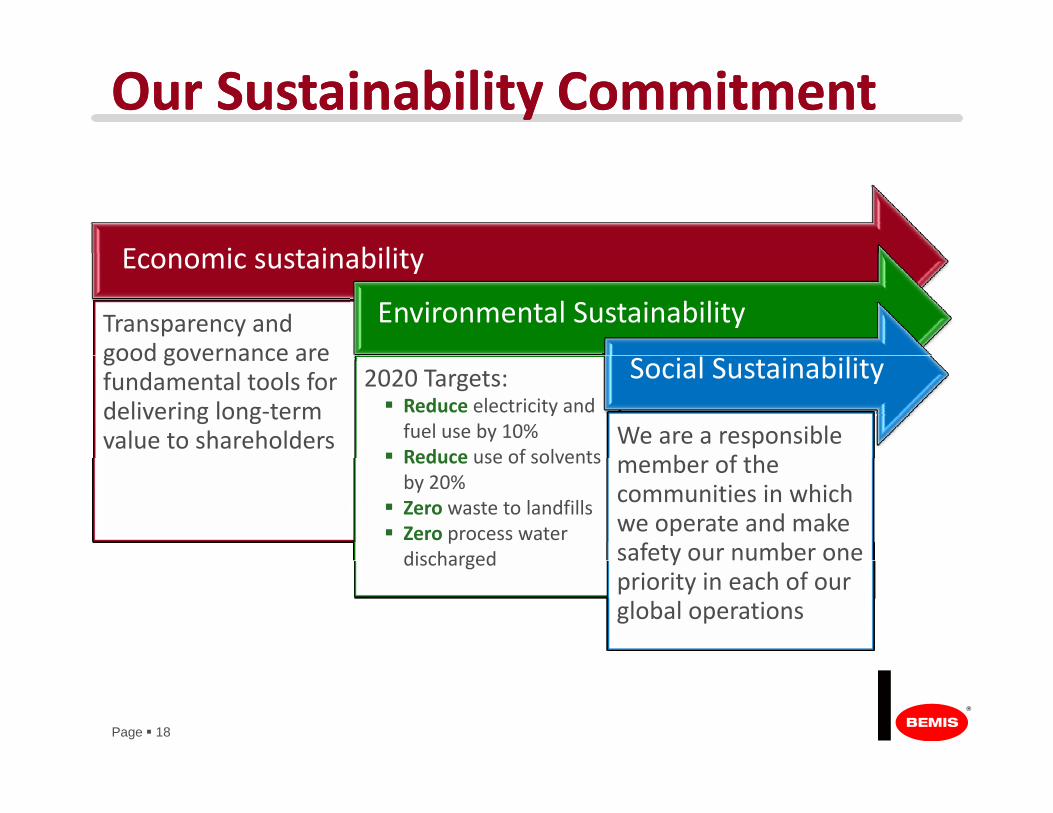
Our Sustainability CommitmentOur Sustainability Commitment
E i t i bilitEconomic sustainability
Transparency and good governance are
Environmental Sustainabilitygood governance are fundamental tools for delivering long‐term value to shareholders
2020 Targets: Social Sustainability
We are a responsible b f th
Reduce electricity and fuel use by 10%
Reduce use of solvents member of the communities in which we operate and make safety our number one
Reduce use of solvents by 20%
Zero waste to landfills Zero process water discharged sa ety ou u be o e
priority in each of our global operations
discharged
Page 18

2013 2013 GuidanceGuidance
Adjusted EPS guidance of $2.24 to $2.30
Cash flow from operations ~ $400 million
• Reflects ~$40 million of pension contributions• Includes ~$50 million of cash payments for facility consolidation activities
• Cash flow from operations expected to be $500 million beginning in 2014
Capital expenditures of ~$130 to 140 million
Page 19
Note: Guidance as of October 25, 2013

An Attractive InvestmentAn Attractive Investment
Strong balance sheet and cash
flow
Disciplined capital allocation
World‐class customer base allocation
Strong market position
Expanding global market reach
Patented and proprietary
Page 20
p p yproducts

APPENDIXAPPENDIX

Reconciliation of NonReconciliation of Non‐‐GAAP Earnings Per ShareGAAP Earnings Per Share
Q313 Q213 Q113 2012 Q412 Q312 Q212 Q112Actual Actual Actual Actual Actual Actual Actual Actual
GAAP EPS 0.52$ 0.51$ 0.47$ 1.66$ 0.38$ 0.45$ 0.40$ 0.42$
Special charges:Acquisition related costs ‐ ‐ ‐ 0.04 ‐ 0.01 0.02 0.02 Facility consolidation and other costs 0.10 0.13 0.06 0.45 0.14 0.14 0.12 0.05 Gain on sale of Clysar plant ‐ (0.03) ‐ ‐ ‐ ‐ ‐ ‐ Gain on sale of land and building (0.02) ‐ ‐ ‐ ‐ ‐ ‐ ‐
Adjusted EPS 0.60$ 0.61$ 0.53$ 2.15$ 0.52$ 0.60$ 0.54$ 0.49$
Page 22

Facility Consolidation Program Financial SummaryFacility Consolidation Program Financial Summary
Cash Net CostCash Net CostExpense Paid Savings*
Q411 38.4$ 3.3$ 2011 38.4 3.3
Q112 8.3 8.0 Q212 19.7 4.5 Q312 21.4 11.2 5.0 Q412 19 3 11 5 3 0Q412 19.3 11.5 3.0 2012 68.7 35.2 8.0
Q113 9.3 10.8 7.5 Q213 20 9 11 7 12 5Q213 20.9 11.7 12.5 Q313 15.8 10.2 6.0 Q413 Estimate ‐ 24.2 6.0 2013 Estimate 46.0 56.9 32.0
Total Facility Consolidation Impact 153.1$ 95.4$
Expected Annual Savings Run‐Rate 50.0$
Page 23
*Savings net of increased costs associated with consolidation activities.

Components of Change in Net Sales Components of Change in Net Sales –– Q313Q313Net Sales Third QuarterNet Sales($ in mil l ions ) 2013 2012 % Change
U.S. Packaging 750.7$ 774.9$ (3.1%)Divestiture effect (2.5%)
Third Quarter
Divestiture effect (2.5%)Optimization effect (1.5%)Organic (Price/Mix/Volume) growth 0.9%
Global Packaging 370.8 377.5 (1.8%)Currency effect (5.7%)
Acquisition effect 4.8%Optimization effect (3.0%)Organic (Price/Mix/Volume) growth 2.1%
Pressure Sensitive Materials 137.0 135.4 1.2%Currency effect 1.7%Organic (Price/Mix/Volume) decline (0.5%)
Total Net Sales 1,258.5$ 1,287.8$ (2.3%)
Currency effect (1.5%)
Acquisition/Divestiture effect (0.1%)Optimization effect (1 8%)
Page 24
Optimization effect (1.8%)Organic (Price/Mix/Volume) growth 1.1%