Investor Briefing 2007 - IAG · Investor Briefing 2007 ... Workers Comp 3% Liability 6% CTP 11%...
118
Investor Briefing 2007 29 October 2007
Transcript of Investor Briefing 2007 - IAG · Investor Briefing 2007 ... Workers Comp 3% Liability 6% CTP 11%...
Investor Briefing 2007
29 October 2007

PAGE 2
IMPORTANT INFORMATION
The information in this presentation is an overview and does not contain all information necessary to an investment decision.
The information contained in this presentation and accompanying materials has been prepared in good faith by IAG. No representation or warranty, express or implied, is made as to the accuracy, adequacy or reliability of any statements, estimates or opinions or other information contained in this presentation. To the maximum extent permitted by law, IAG, its directors, officers, employees and agents disclaim all liability and responsibility (including without limitation any liability arising from fault or negligence on the part of IAG, its directors, officers, employees and agents) for any direct or indirect loss or damage which may be suffered by any recipient through use of or reliance on anything contained in or omitted from this presentation. In making an investment decision, investors must rely on their own examination of IAG, including the merits and risks involved. Investors should consult with their own legal, tax, business and/or financial advisors in connection with any acquisition of securities.
This presentation is not a prospectus nor an offer of shares for subscription or sale in any jurisdiction. This presentation does not constitute an offer to sell, or a solicitation of an offer to buy, securities in the United States or to any U.S. person, as defined in Regulation S under the U.S. Securities Act of 1933, as amended (the “U.S. Securities Act”). Securities may not be offered or sold in the United States, or to or for the account of any U.S. person (as defined in Regulation S under the U.S. Securities Act), unless the securities have been registered under the U.S. Securities Act or an exemption from registration is available.
Certain statements contained in this presentation may constitute “forward-looking statements” or statements about “future matters” for the purposes of section 728(2) of the Corporations Act 2001 (Cth) and/or “forward-looking statements” within the meaning of the U.S. Private Securities Litigation Reform Act of 1995. These forward-looking statements speak only as of the date of this presentation. The forward-looking statements involve known and unknown risks, uncertainties and other factors that may cause IAG’s actual results, performance or achievements to differ materially from any future results, performance or achievements expressed or implied by these forward-looking statements. Neither IAG, nor any other person, gives anyrepresentation, assurance or guarantee that the occurrence of the events expressed or implied in any forward looking statements in this presentation will actually occur.
This presentation is being supplied to you solely for your information and may not be reproduced or distributed to any other person (including any general distribution in the United States) or published, in whole or in part, for any purpose without the prior written permission of IAG.
All amounts are presented in Australian dollars unless otherwise stated.

PAGE 3
AGENDA
Introduction, Strategy and Outlook Mike Hawker 09.00-09.10
Direct Personal Insurance David Issa 09.10-09.30
Australian Commercial Lines Mario Pirone 09.30-09.50
Business Partnerships Jacki Johnson 09.50-10.10
Reserving Tony Coleman 10.10-10.30
-------------------------------------------------------------------------
Morning Tea 10.30-10.45
-------------------------------------------------------------------------
UK Neil Utley 10.45-11.15
New Zealand Nick Hawkins 11.15-11.35
Asia Justin Breheny 11.35-11.55
Summary and Q&A Mike Hawker 11.55-12.15
PAGE 4
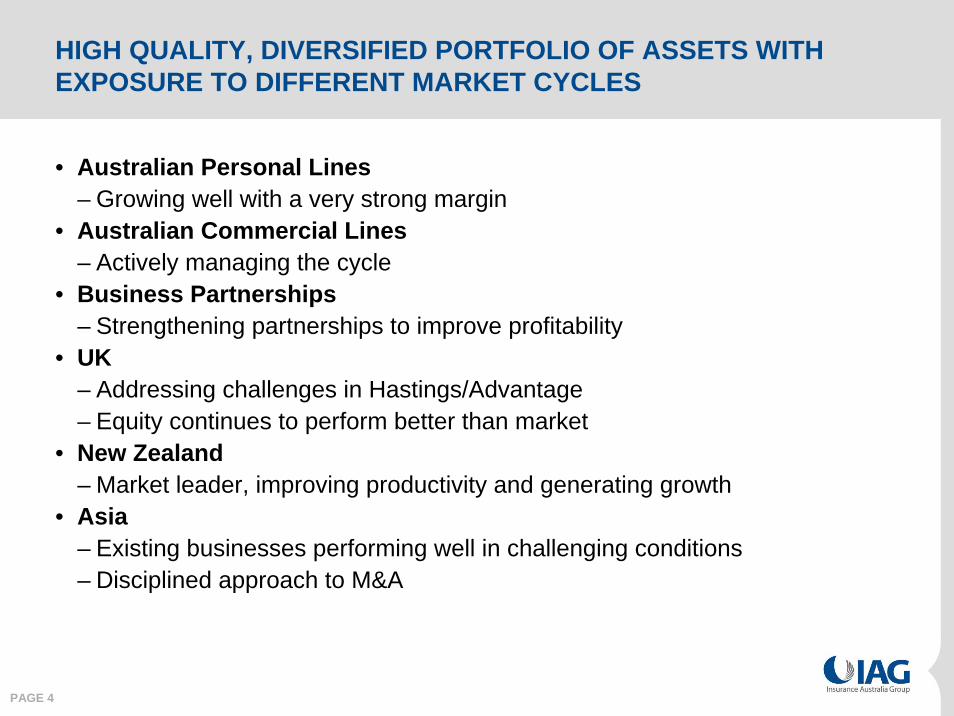
HIGH QUALITY, DIVERSIFIED PORTFOLIO OF ASSETS WITH EXPOSURE TO DIFFERENT MARKET CYCLES
• Australian Personal Lines– Growing well with a very strong margin
• Australian Commercial Lines– Actively managing the cycle
• Business Partnerships– Strengthening partnerships to improve profitability
• UK – Addressing challenges in Hastings/Advantage – Equity continues to perform better than market
• New Zealand – Market leader, improving productivity and generating growth
• Asia – Existing businesses performing well in challenging conditions– Disciplined approach to M&A

PAGE 5
STRATEGY UNCHANGED
To be the best general insurer in every market we invest in
To be the best general insurer in every market we invest in
Growing marketleadership in core markets
(AU & NZ)
Growing marketleadership in core markets
(AU & NZ)
Core capabilitiesCore capabilities
Insurance technical skills, underwriting and claimsInsurance technical skills, underwriting and claims
Invest for marginInvest for margin Invest for growthInvest for growth
Profitable niches in select mature markets
Profitable niches in select mature markets
Enter and growin high growth
markets
Enter and growin high growth
markets

PAGE 6
GEOGRAPHICALLY DIVERSIFIED BUSINESS WITH STRONG BRANDS
PAGE 7
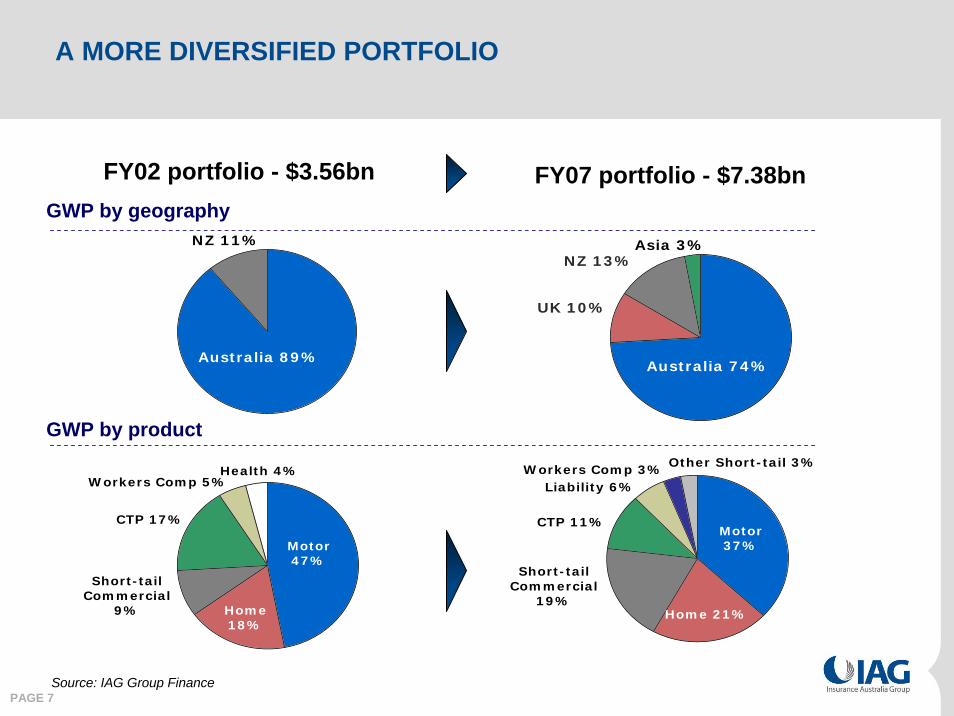
A MORE DIVERSIFIED PORTFOLIO
Source: IAG Group Finance
FY07 portfolio - $7.38bnFY02 portfolio - $3.56bn
Asia 3%NZ 13%
UK 10%
Australia 74%
NZ 11%
Australia 89%
Home 21%
Other Short-tail 3%Workers Comp 3%Liability 6%
CTP 11%
Short-tailCommercial
19%
Motor37%
Home18%
Health 4%Workers Comp 5%
CTP 17%
Short-tailCommercial
9%
Motor47%
GWP by geography
GWP by product

PAGE 8
A STRUCTURE TO SUPPORT STRATEGY
Michael HawkerChief Executive Officer& Managing Director
George VenardosChief Financial Officer
Mario PironeCEO, CGU
Michael WilkinsChief Operating Officer &Deputy Managing Director
Tony ColemanChief Risk Officer& Group Actuary
Christine McLoughlinGroup Executive,
Corporate Development,People & Performance
Neil UtleyCEO, United Kingdom
Jan van der SchalkCEO, Asset Management
& Reinsurance
Jacki JohnsonCEO, Business Partners
David IssaCEO, Personal Insurance
Nick HawkinsCEO, New Zealand
Justin BrehenyCEO, Asia

PAGE 9
FY08 TRADING OUTLOOK – SUMMARY
• GWP growth of 7 – 9%
• Insurance margin of 11 – 13% on NEP of c$7.5bn– Subject to no catastrophes or large losses outside our allowance nor
any material movements in currency or credit spreads
• Financial position– Consistent and conservative approach to reserving– Supported by strong capital position and very strong ‘AA’ ratings for
key wholly-owned insurers
• Dividend guidance of 29.5 cents per share maintained– Acknowledge payout ratio likely to exceed 50-70% of normalised
earnings – Do not expect to underwrite FY08 dividends

Direct Personal Insurance
David Issa29 October 2007

PAGE 11
DIRECT PERSONAL INSURANCE – A GROWTH STORY
• Market is highly competitive but rational
• Returned business to growth
• Maintaining a very competitive margin
PAGE 12
MARKET REMAINS HIGHLY COMPETITIVE BETWEEN MAJOR PLAYERS
• Fight for market share continues through:
- Price leadership messages and position – pricing remains rational but competitive
- Advertising noise around product features and benefits to generate traffic and call volumes
• Industry ownership is obviously more concentrated, from customerperspective there is no real change (same brands)

PAGE 13
OUR BUSINESS BENEFITS FROM ITS LARGE SCALE
Brands
States
Channels
Products
32Branches
4Call Centres
3Internet sites
1
190Country Service
Centres
5m calls answered nationally
Over 7.6m risks in force policies
Over 440,000claims finalised
4,765 employees
Statistics for FY07
NSW / ACT Qld WA SA
Target Market
Suppliers & Partners
Retail customers – mass market, $3bn GWP
1,812 smash repairers 129 builders 553 other
suppliers22 community
partners
Motor Home CTP Lifestyle & Leisure
Home Security Health Business Insurance
Vic
1. RACV brand is not owned by IAG. IAG & RACV are, respectively, 70%/30% shareholders in IMA, a short-tail personal lines underwriter

PAGE 14
THE JUNE 2007 QBW STORMS DEMONSTRATED OUR HELP PROPOSITION AND THE BENEFITS OF SCALE
• When Newcastle storms broke out over the Queen’s birthday weekend…
• NRMA was the first on the ground and the first insurance company to reassure our customers that all claims would be paid
• We are now actively showcasing our response; how we helped restore order, thanking our partners and staff, and asking our customers whether they can afford not to be insured with NRMA
• Advertising campaign across NSW

PAGE 15
OUR STRATEGIC PRIORITIES ARE TO STRENGTHEN OUR SOURCES OF COMPETITIVE ADVANTAGE IN THE MARKET TO GENERATE PROFITABLE GROWTH
Four sources of competitive advantage
Trusted brandsRisk-based pricing combined with customer analytics to drive profitable growthMarket presence through distribution network Supply chain management and productivity to support competitive retail pricing
Strategic priorities
1. Attract new customers
2. Retain existing customers
3. Profitable growth
PAGE 16
STABILITY AND FOCUS DELIVERING GROWTH
• A stable management team has delivered the turnaround to growth through:
– Competitive pricing
– Focus on marketing
– Back to basics – reduced change for front line staff

PAGE 17
STRONG 1H08 GWP MOMENTUM FOR SHORT-TAIL
• GWP is forecast to be up by 4% – 6% compared to same period last year
• Strong conversion rates in our distribution network
• Non-customer pre-disposition towards our brands remain strong, a lead indicator of GWP growth
• Sales & Service Customer Satisfaction Index (CSI) of 84 in 2H07, 2 points above the market average; Claims CSI is in line with the market at 82
• Segmented price adjustments allows optimisation between volume and GWP growth
PAGE 18
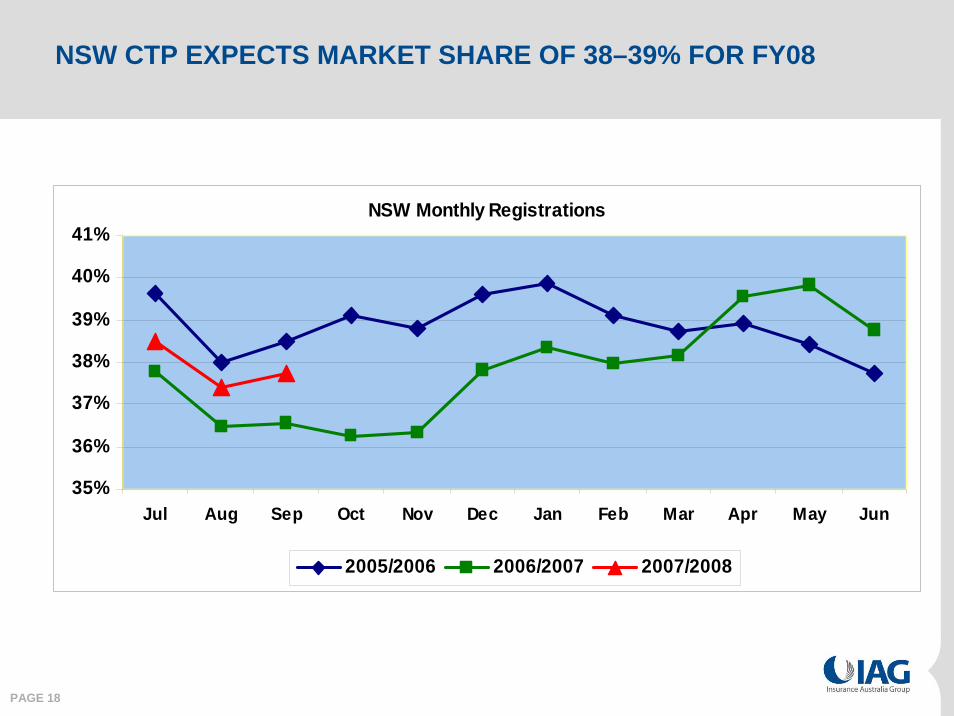
NSW CTP EXPECTS MARKET SHARE OF 38–39% FOR FY08
NSW Monthly Registrations
35%
36%
37%
38%
39%
40%
41%
Jul Aug Sep Oct Nov Dec Jan Feb Mar Apr May Jun
2005/2006 2006/2007 2007/2008
PAGE 19
CTP MOMENTUM CONTINUES
• Growing market share in NSW and Qld, particularly in low risk car segments, substantiates our price positioning in both States
• GWP growth is ahead of our expectations in NSW and Qld
• Our premiums increase by an average of 5.6% in NSW from 1 November and remain competitive
• Claim frequencies in both States have plateaued, with NSW frequency well below industry average

PAGE 20
GWP GROWTH, CONSISTENT MARGIN TO CONTINUE
DIRECT PERSONAL INSURANCE
FY06A FY07A FY08F
(1.6%)
(4.9%)
17.0%
1.9%
(1.0%)
16.2%
GWP – Growth % vs SPLY
Insurance margin
Total PI (1) 17 - 20%
Short-tail 4 - 6%
Long-tail (post LTC)
Total direct personal lines (including LTC)
3 - 4%
2 - 4%
Note: (1) Forecast assumes historical long term average for storms
LTC = NSW Lifetime Care & Support Scheme

PAGE 21
DIRECT PERSONAL INSURANCE – A GROWTH STORY
• Market is highly competitive but rational
• Returned business to growth
• Maintaining a very competitive margin

CGU Insurance
Mario Pirone29 October 2007

PAGE 23
EXECUTIVE SUMMARY
• State of the market– Soft market conditions likely to continue through to end calendar year 2009
• Competitive position– Diversified product mix with high retention rates– Strong distribution network with strong focus on SME/middle market segments
• Strategy– Actively managing the cycle to maximise returns– Entrenching market position through account management model & expanding
into market segments• Progress on execution
– Commenced implementing premium rate increases to short-tail book– Undertaken remedial action over past three years to withdraw from unprofitable
products and sell underperforming businesses or those with a poor strategic fit• Outlook
– Premium growth under pressure as CGU implements short-tail rate increases• Focus/priorities
– Continue to grow selective portfolios and BusinessPak book; implement selective short-tail rate increases; support retention rates; roll out account management model; refresh eCommerce platform; and purchase outstanding interest in NTI
PAGE 24
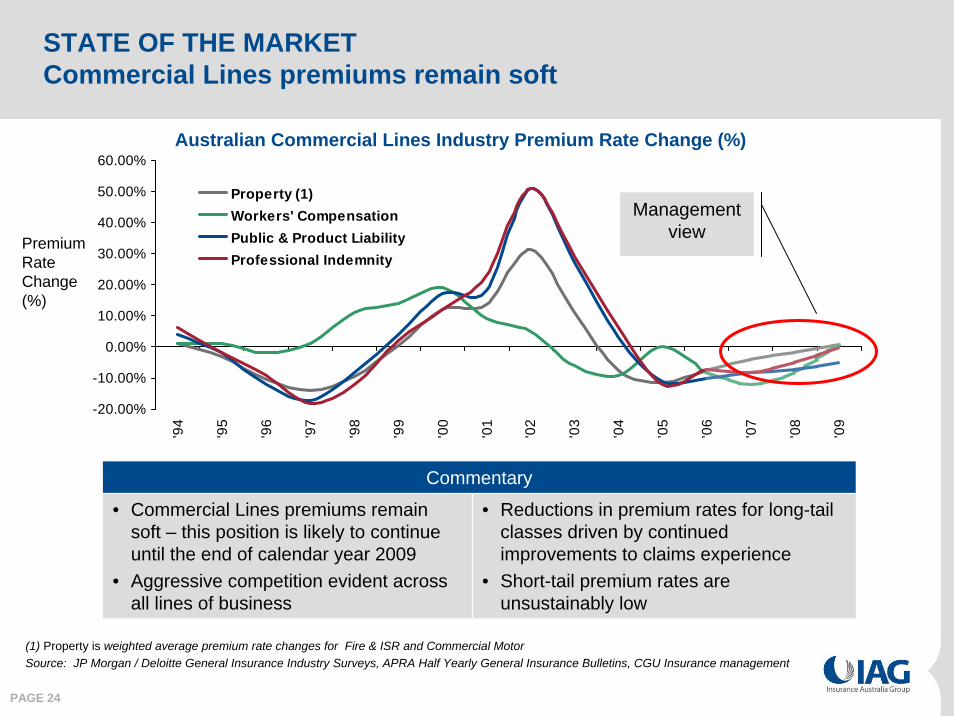
STATE OF THE MARKETCommercial Lines premiums remain soft
-20.00%
-10.00%
0.00%
10.00%
20.00%
30.00%
40.00%
50.00%
60.00%'9
4
'95
'96
'97
'98
'99
'00
'01
'02
'03
'04
'05
'06
'07
'08
'09
Property (1)Workers' CompensationPublic & Product LiabilityProfessional Indemnity
Premium Rate Change (%)
Management view
Australian Commercial Lines Industry Premium Rate Change (%)
(1) Property is weighted average premium rate changes for Fire & ISR and Commercial MotorSource: JP Morgan / Deloitte General Insurance Industry Surveys, APRA Half Yearly General Insurance Bulletins, CGU Insurance management
Commentary
• Commercial Lines premiums remain soft – this position is likely to continue until the end of calendar year 2009
• Aggressive competition evident across all lines of business
• Reductions in premium rates for long-tail classes driven by continued improvements to claims experience
• Short-tail premium rates are unsustainably low

PAGE 25
• Focus is on SME and middle market segments• Packaged business is 19% of commercial
portfolio• Strong market share in portfolios with high
profitability – Workers’ Compensation and Professional Risks
COMPETITIVE POSITIONThe business is strongly diversified
Long-tail
Short-tail
• Highly decentralised distribution network relative to other insurers. Consists of 73 branch offices providing a large geographic footprint
• Strong relationships with Australian broker network
• Policy retention rates steadily improving over last 12 months and are now around 83%
• Employee engagement up to 61% in 2007, placing CGU in the ‘Best Employers’ zone
• Turnover below 15% where industry turnover for Australian Commercial Insurance is around 20%
Highly engaged people Competitive business mix
Strong customer relationships CGU Insurance GWP Commercial Lines FY07
61%
39%
PAGE 26
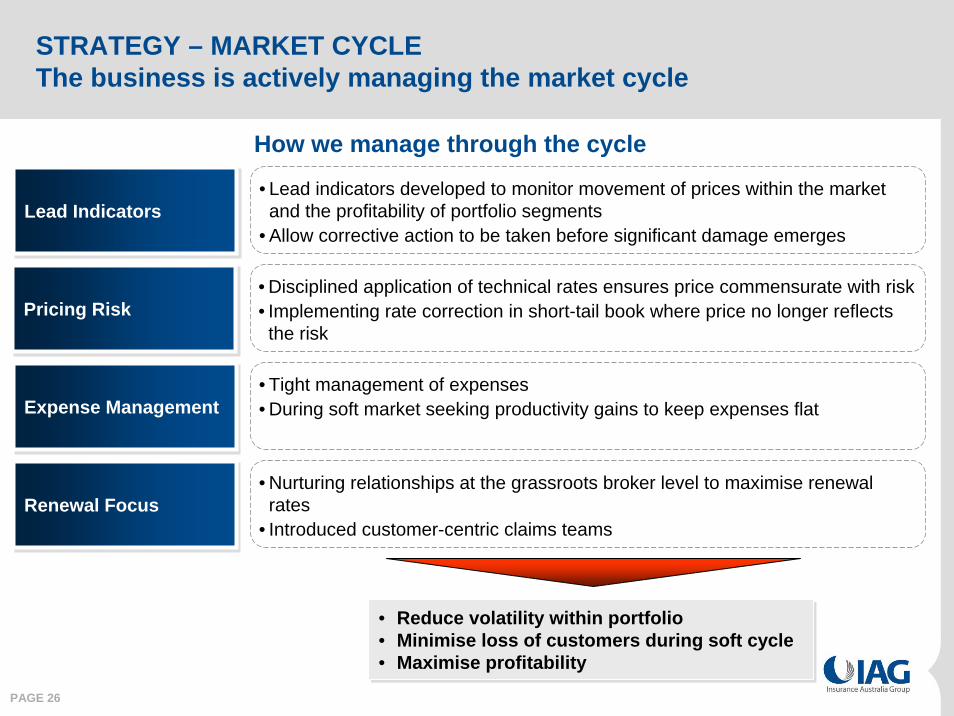
STRATEGY – MARKET CYCLEThe business is actively managing the market cycle
• Lead indicators developed to monitor movement of prices within the market and the profitability of portfolio segments
• Allow corrective action to be taken before significant damage emergesLead IndicatorsLead Indicators
• Disciplined application of technical rates ensures price commensurate with risk• Implementing rate correction in short-tail book where price no longer reflects the risk
Pricing RiskPricing Risk
• Tight management of expenses• During soft market seeking productivity gains to keep expenses flatExpense ManagementExpense Management
• Nurturing relationships at the grassroots broker level to maximise renewal rates
• Introduced customer-centric claims teamsRenewal FocusRenewal Focus
How we manage through the cycle
• Reduce volatility within portfolio• Minimise loss of customers during soft cycle• Maximise profitability
• Reduce volatility within portfolio• Minimise loss of customers during soft cycle• Maximise profitability
PAGE 27
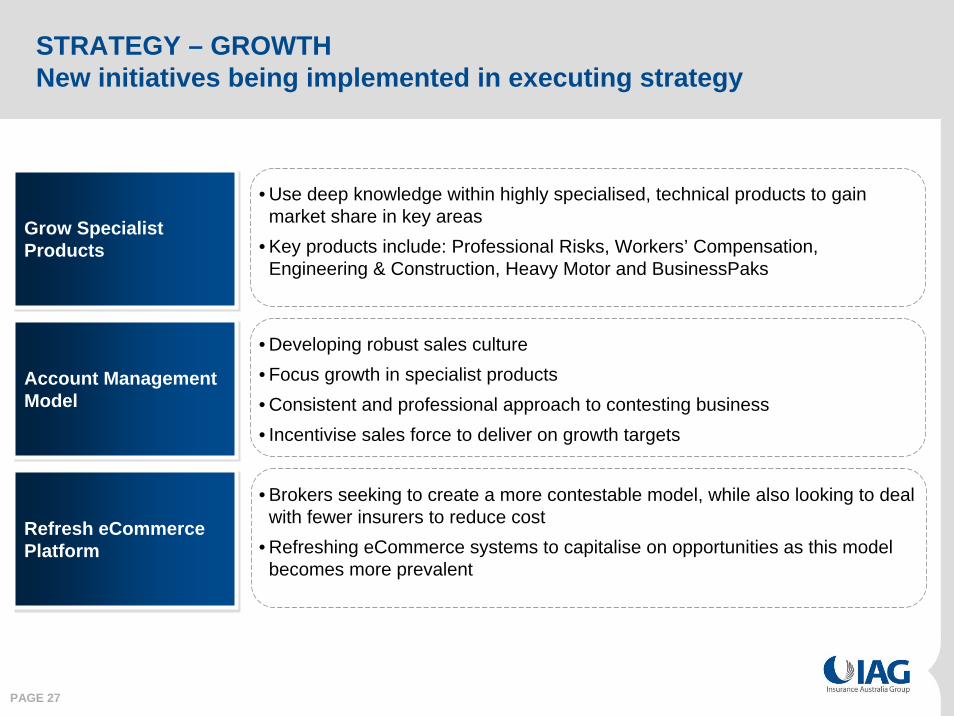
STRATEGY – GROWTHNew initiatives being implemented in executing strategy
• Developing robust sales culture• Focus growth in specialist products• Consistent and professional approach to contesting business• Incentivise sales force to deliver on growth targets
Account Management ModelAccount Management Model
• Brokers seeking to create a more contestable model, while also looking to deal with fewer insurers to reduce cost
• Refreshing eCommerce systems to capitalise on opportunities as this model becomes more prevalent
Refresh eCommerce PlatformRefresh eCommerce Platform
• Use deep knowledge within highly specialised, technical products to gain market share in key areas
• Key products include: Professional Risks, Workers’ Compensation, Engineering & Construction, Heavy Motor and BusinessPaks
Grow Specialist ProductsGrow Specialist Products
PAGE 28
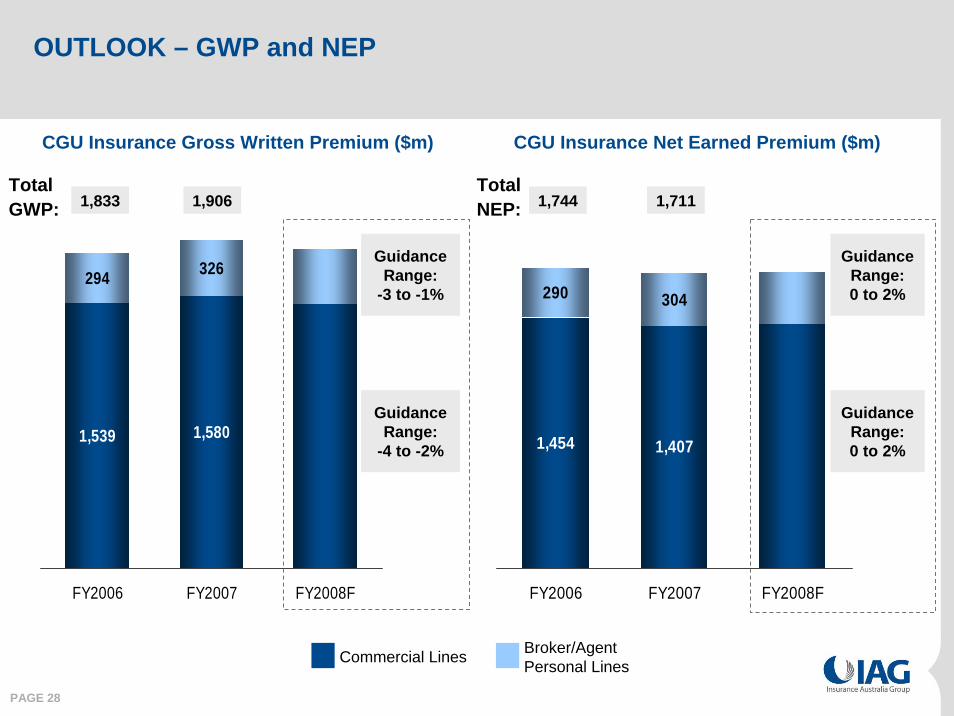
OUTLOOK – GWP and NEP
294 326
1,539 1,580
FY2006 FY2007 FY2008F
290 304
1,454 1,407
FY2006 FY2007 FY2008F
CGU Insurance Gross Written Premium ($m)
1,833 1,906
GuidanceRange:
-3 to -1%
CGU Insurance Net Earned Premium ($m)
GuidanceRange:0 to 2%
1,744 1,711TotalGWP:
TotalNEP:
GuidanceRange:
-4 to -2%
GuidanceRange:0 to 2%
Commercial Lines Broker/Agent Personal Lines
PAGE 29
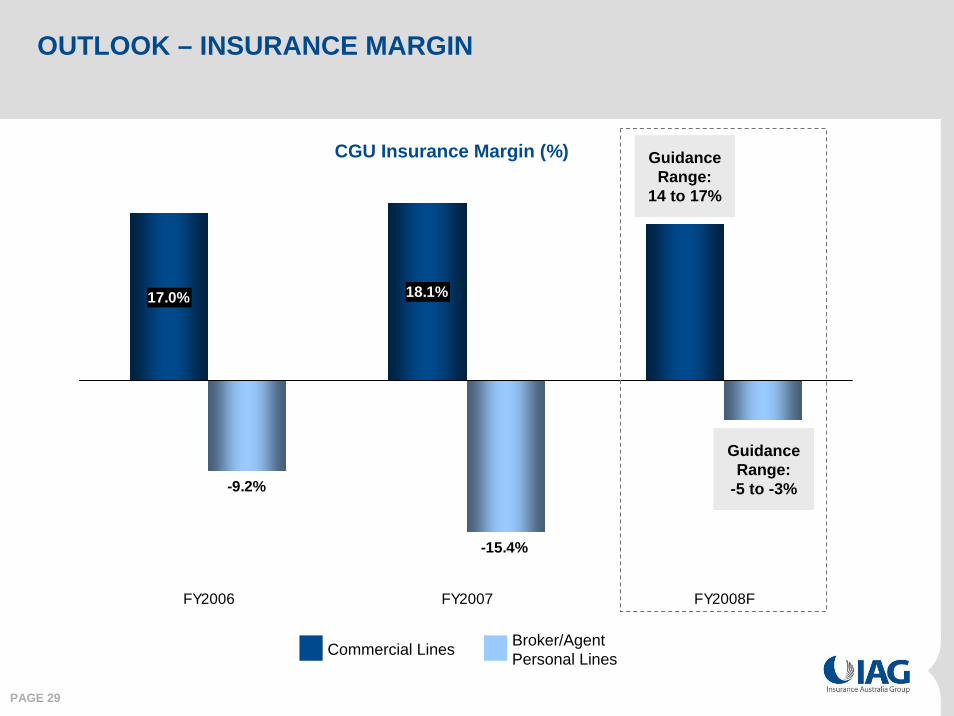
OUTLOOK – INSURANCE MARGIN
17.0% 18.1%
-9.2%
-15.4%
FY2006 FY2007 FY2008F
CGU Insurance Margin (%) GuidanceRange:
14 to 17%
Commercial Lines Broker/Agent Personal Lines
GuidanceRange:
-5 to -3%

PAGE 30
FOCUS / PRIORITIES
• The key priorities for the business in FY08
– Continue to grow selective portfolios and BusinessPak book
– Implement selective short-tail rate increases
– Support retention rates
– Roll out account management model
– Refresh eCommerce platform
– Purchase outstanding interest in NTI

Business Partnerships
Jacki Johnson 29 October 2007
PAGE 32
• Consumer behaviours are changing – purchasing on convenience
– This trend increases the relevance of our Affinity channels
• Positive earnings outlook for Business Partnerships based on:
– Implementing rate increases across the home and motor insurance portfolios
– Full employment makes it easier to improve the return to work outcomes in our Workers’ Compensation business, maximising our performance fees
– Focus on productivity improvements
• Rigorous and disciplined approach to partnering, focussing on strategic and profitable growth
EXECUTIVE SUMMARY
PAGE 33
BUSINESS UNIT SIZE AND COMPOSITION
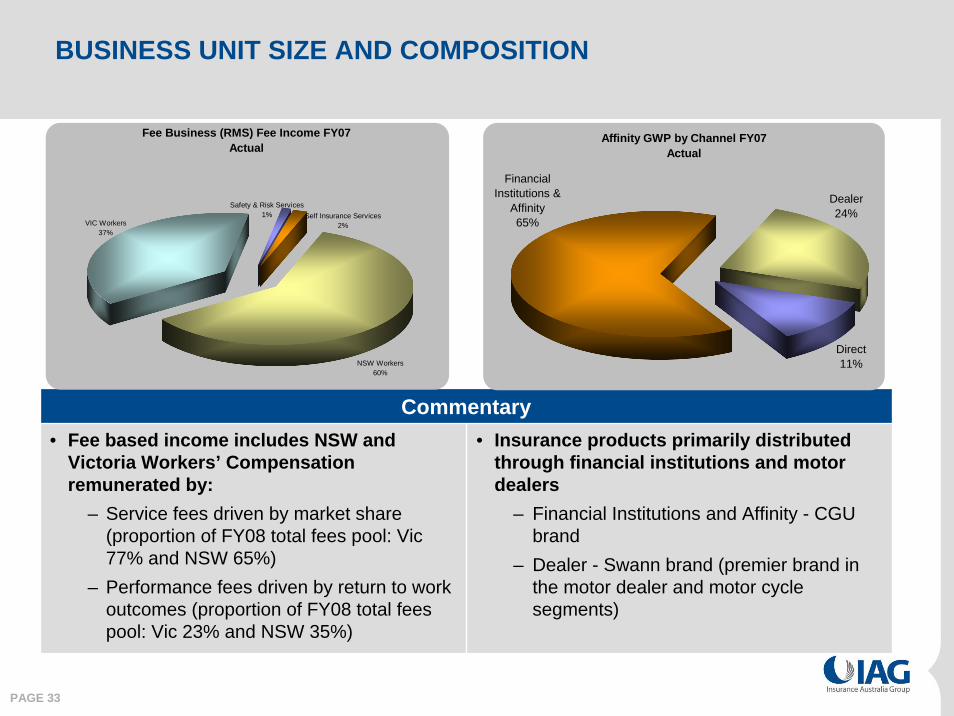
Commentary• Fee based income includes NSW and
Victoria Workers’ Compensation remunerated by:
– Service fees driven by market share (proportion of FY08 total fees pool: Vic 77% and NSW 65%)
– Performance fees driven by return to work outcomes (proportion of FY08 total fees pool: Vic 23% and NSW 35%)
• Insurance products primarily distributed through financial institutions and motor dealers
– Financial Institutions and Affinity - CGU brand
– Dealer - Swann brand (premier brand in the motor dealer and motor cycle segments)
Fee Business (RMS) Fee Income FY07Actual
VIC Workers 37%
NSW Workers 60%
Self Insurance Services2%
Safety & Risk Services1%
Affinity GWP by Channel FY07Actual
Dealer24%
Financial Institutions &
Affinity65%
Direct11%
PAGE 34
AFFINITY DIVERSIFIED BY PRODUCT AND STATE
Commentary
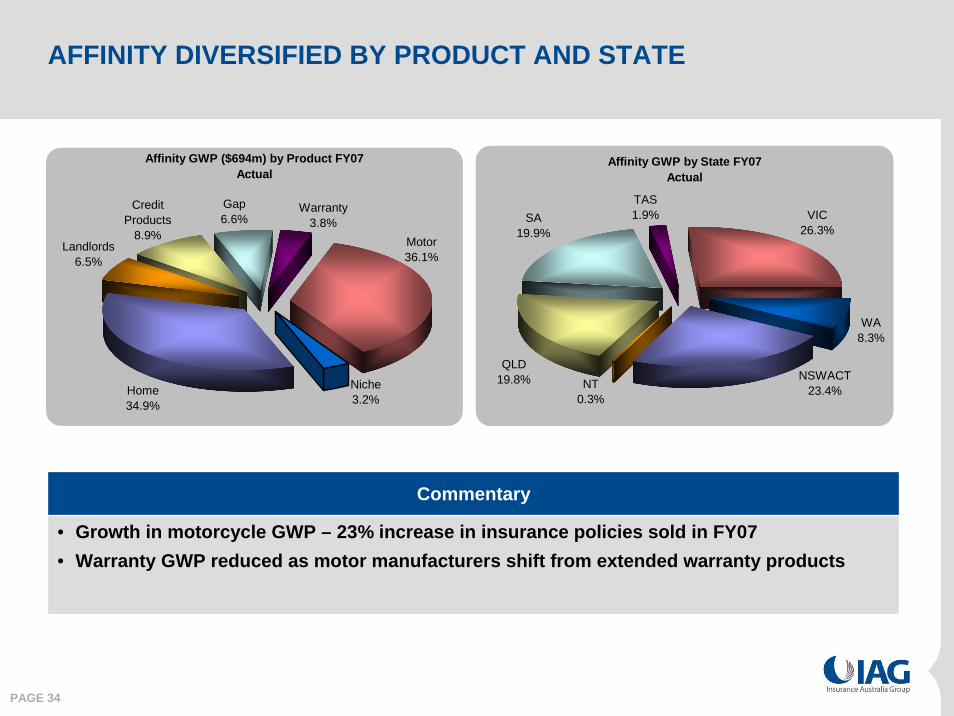
• Growth in motorcycle GWP – 23% increase in insurance policies sold in FY07• Warranty GWP reduced as motor manufacturers shift from extended warranty products
Affinity GWP ($694m) by Product FY07Actual
Credit Products
8.9%
Gap6.6%
Landlords6.5%
Home34.9%
Warranty3.8%
Motor36.1%
Niche3.2%
Affinity GWP by State FY07Actual
VIC26.3%
QLD19.8%
SA19.9%
NT0.3%
NSWACT23.4%
TAS1.9%
WA8.3%

PAGE 35
DYNAMIC MARKET CONDITIONS –Creating opportunities and risks
• Consolidation of medium and smaller sized financial institutions• Slower growth in new home loans with higher interest rates and slower house price growth1
• Financial driver to continue to increase non-interest income streams derived through commissions
• Competitors being aggressive with pricing and remuneration offerings to secure market share
• Motor dealers becoming listed entities and consolidating with larger Australian-based retailers• Reduced motor vehicle sales in 2006 compared with 2005 (down 2.6%)2 and a shift to smaller
vehicles driving down motor premium. Increase in new motorcycle and motor scooter sales for fourth consecutive year (up 20.5%3 from 2005)
• Use of personal finance for new and used cars reduced over the past four years• Continued competitive pressure on motor dealer remuneration driving acquisition costs higher
Dea
ler
1 Reserve Bank Bulletin, Loan Approvals, Repayments and Housing Credit Growth, July 20072 Australian Automotive Intelligence Report (AAIR) February 20073 Federal Chamber of Automotive Industries 2007
Dea
ler
Fina
ncia
l In
stitu
tions
&
Affi
nity
Fina
ncia
l In
stitu
tions
&
Affi
nity
Fee
Bas
ed
Bus
ines
ses
Fee
Bas
ed
Bus
ines
ses • Harmonisation of state schemes
• Changes in industry mix and Australian workforce demographics changing nature of injury type • Aggressive activity by competitors to attract market share • Potential for privatisation in NSW may provide an opportunity to secure additional underwriting
premium in this class of business • Full employment improving ‘Return To Work’ outcomes

PAGE 36
Customer behaviour is shifting e.g. convenience of purchase of insurance with point of transaction or loan
RATIONALE FOR OUR MARKET PRESENCE
CUSTOMER PARTNER
Our insights provide diverse perspectives to give us the edge in finding new customer value propositions → Positions our business for
innovation of new products and services creating value to the Group
Partners driven to increase non-core income e.g. due to
decreased home loans or vehicle purchases and desire to provide broader customer
value proposition
Affinity Channel Fee Based Businesses• Represents $694m GWP in FY07 which would
otherwise be unavailable to IAG
• We enable a diversified channel approach reducing the risk of loss of business to the Group with changes in consumer behaviours
• Return on capital exceeds Group’s benchmark - low capital requirement
• Presence in fee based markets allows CGU to provide a national value proposition to employers and brokers
• Strong relationship with the regulators assists us to influence agendas that support the broader Group

PAGE 37
BUSINESS PARTNERSHIPS STRATEGY 2007-2010 Competitive advantage through mutually beneficial partnerships
Competitive advantage through mutually beneficial partnerships
Build our people strength to realise our objectives and enable our capability
Stra
tegi
c Le
vers
Grow tight
Opportunity management &
responding to market changes
Expansion opportunities
Bus
ines
s O
bjec
tives
Our
3 y
ear
Am
bitio
n Building and strengthening partnerships to achieve sustainable profit growth 15% return on expenses (Risk Management Services) and
7-9% insurance margin (Insurance businesses)
Prod
uctiv
ity
impr
ovem
ents
New
pro
duct
s/
chan
nels
Peop
le
stra
tegy
Stra
tegi
c co
mm
erci
al
part
ners
hips

PAGE 38
Productivity improvementsProductivity
improvements
Account management
Account management
• Mapping and improving processes• Development of technology strategies• Achieve further reductions in people turnover
STRONG FOCUS ON STRATEGY AND IMPROVING PROFITABILITY
• Focus on strategic, significant and profitable relationships for existing and new business - increased customer retention with strategic partners
• Salesforce.com implementation to leverage partner base and drive cultural change
Rate increases for Affinity business
Rate increases for Affinity business
Maximise fee based workers’compensation remuneration
Maximise fee based workers’compensation remuneration
• Return to work initiatives to drive improved performance
• Improved monitoring tools to track performance and increase accountabilities
• Securing of market share through account management approach
• Six monthly review of pricing and product with distributors to ensure sustainable growth and adequate return for all stakeholders
• Retention rates at 90% following recent rate increases• Further rate increases are scheduled for FI&A in 1H08 and 2H08
Development of our people capability
Development of our people capability
• Develop our leadership and account management capability• Further develop capability in personal injury management

PAGE 39
•Our Dealer business demonstrates innovation and rapid speed to market in its new product development:
– Motorcycle warranty product -launched July 07
– Launch of Beaurepaires branded Tyre & Rim policy - November 07
– Assessment of alternative Motor, Motorcycle and Gap policies is underway - significant sales are not expected in FY08
– New market initiatives such as Marine, Debt Protection and AxaLife extension are being investigated – sales not expected in FY08
•Our Dealer business transfers capabilities to Asia
LEVERAGING EXISTING CAPABILITY INTO DOMESTICAND INTERNATIONAL MARKETS
Increasing penetration in
existing markets with existing
products
New products into existing
channels
Moving existing products into new markets
New products into new markets
ProductsProducts
Mar
kets
Mar
kets
PAGE 40
OUTLOOK – AFFINITY BUSINESSES GWP
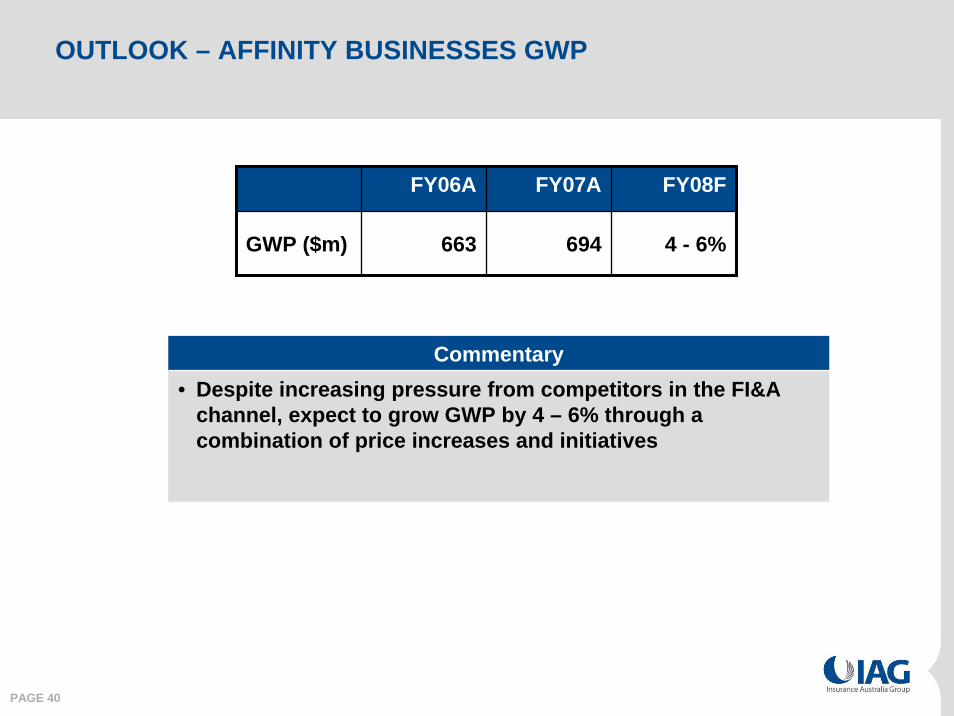
FY06A FY07A FY08F
GWP ($m) 663 694 4 - 6%
Commentary• Despite increasing pressure from competitors in the FI&A
channel, expect to grow GWP by 4 – 6% through a combination of price increases and initiatives
PAGE 41
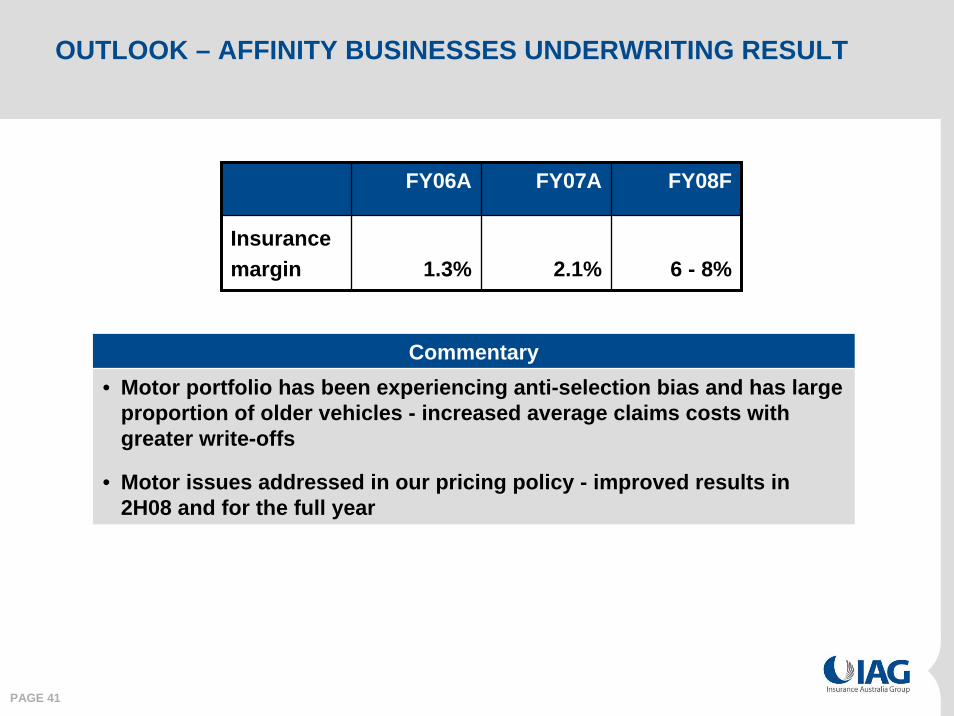
OUTLOOK – AFFINITY BUSINESSES UNDERWRITING RESULT
Commentary• Motor portfolio has been experiencing anti-selection bias and has large
proportion of older vehicles - increased average claims costs with greater write-offs
• Motor issues addressed in our pricing policy - improved results in 2H08 and for the full year
FY06A FY07A FY08F
Insurancemargin 1.3% 2.1% 6 - 8%

PAGE 42
OUTLOOK – RISK MANAGEMENT SERVICESFee based businesses
Sustainable profits of $16m to $24m p.a. over 5 yearsSustainable profits of $16m to $24m p.a. over 5 years
Securing of market share
Securing of market share
Implementation of initiatives and improved performance tracking/ accountability for strengthened
‘return to work’ outcomes to secure performance and incentive fees
Implementation of initiatives and improved performance tracking/ accountability for strengthened
‘return to work’ outcomes to secure performance and incentive fees
Improving efficiency to drive down
expenses
Improving efficiency to drive down
expenses
Commentary• Significant reduction in prior period payments expected following changes in remuneration
models which improved stability in Workers’ Compensation schemes - no material prior period payments expected after 1H08
• 1H08 improved and prior period payment lower than FY07
• Our initiatives are focussed on improved and sustainable return on expenses

PAGE 43
EXECUTIVE SUMMARY
• Consumer behaviours are changing – purchasing on convenience
– This trend increases the relevance of our Affinity channels
• Positive earnings outlook for Business Partnerships based on
– Implementing rate increases across the home and motor insurance portfolios
– Full employment makes it easier to improve the return to work outcomes in our Workers’ Compensation business, maximising our performance fees
– Focus on productivity improvements
• Rigorous and disciplined approach to partnering, focussing on strategic and profitable growth

IAG Reserving Philosophy & Practice
Tony Coleman 29 October 2007
PAGE 45
EXECUTIVE SUMMARY
• Robust reserving processes with a reliable history
• Risk margins – understanding the critical issues
• Conservative nature of IAG risk margins given capital employed
• IAG UK – actuarial capability transfer

PAGE 46
KEY STEPS IN THE RESERVING PROCESS
• Estimate claims frequency and severity from experience observed, primarily to establish central estimates
• Determine suitable probability distributions based on experienceto establish potential estimate uncertainty for risk margins
• Establish measures of uncertainty
• Co-efficient of Variation (CoV) (= Standard Deviation / Mean) (e.g. 15%, 30%)
• Probability of Adequacy (PoA) (e.g. 75%, 90%)

PAGE 47
ROBUST AND RELIABLE CENTRAL ESTIMATES
• Trends are all downwards indicating a strong history of prudent reserving approach to central estimates
• Each year is higher than former due to growth in business
Development of Ultimate Net Claims Liability (Central Estimate) 2002-2006
0
500
1000
1500
2000
2500
3000
3500
4000
4500
1 2 3 4 5 6
Development Year
$000
s
2002 2003 2004 2005 2006
Source: IAG FY07 Claims development tables
PAGE 48
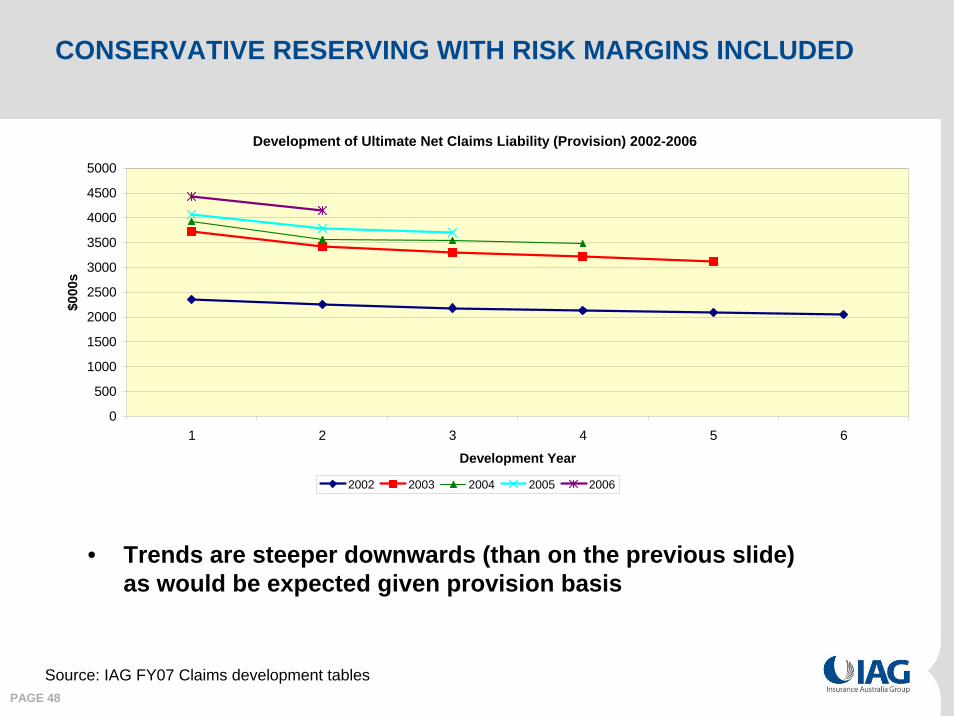
CONSERVATIVE RESERVING WITH RISK MARGINS INCLUDED
• Trends are steeper downwards (than on the previous slide) as would be expected given provision basis
Development of Ultimate Net Claims Liability (Provision) 2002-2006
0
500
1000
1500
2000
2500
3000
3500
4000
4500
5000
1 2 3 4 5 6
Development Year
$000
s
2002 2003 2004 2005 2006
Source: IAG FY07 Claims development tables
PAGE 49
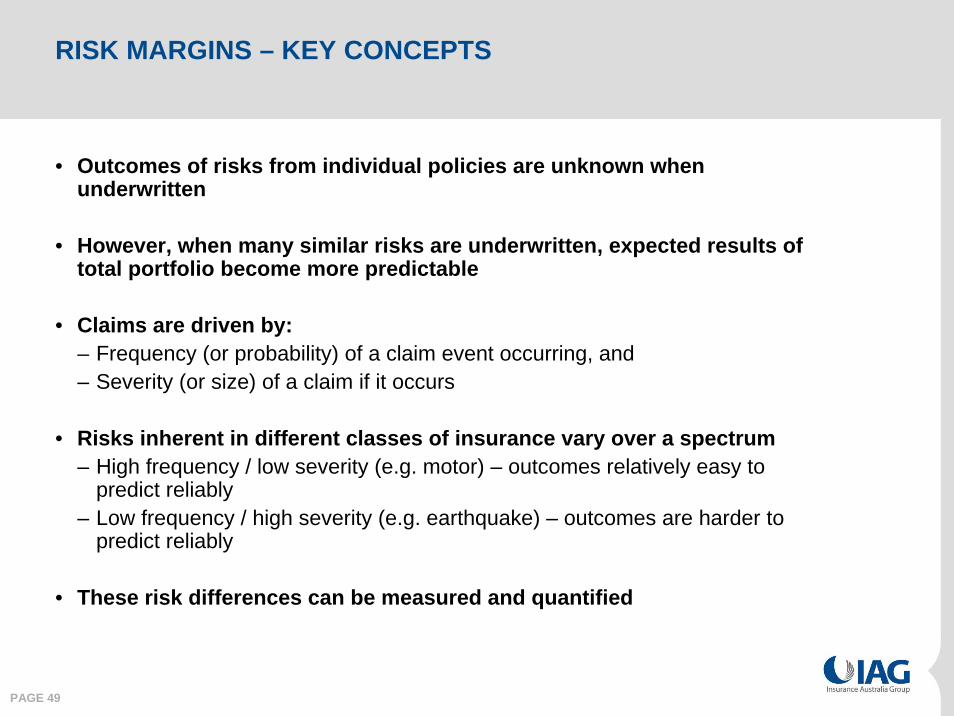
RISK MARGINS – KEY CONCEPTS
• Outcomes of risks from individual policies are unknown when underwritten
• However, when many similar risks are underwritten, expected results of total portfolio become more predictable
• Claims are driven by:– Frequency (or probability) of a claim event occurring, and– Severity (or size) of a claim if it occurs
• Risks inherent in different classes of insurance vary over a spectrum– High frequency / low severity (e.g. motor) – outcomes relatively easy to
predict reliably– Low frequency / high severity (e.g. earthquake) – outcomes are harder to
predict reliably
• These risk differences can be measured and quantified

PAGE 50
Range of Outcomes
Risk MarginCentral Estimate
Total Liability
Lognormal Distribution(CoV = 0.3)
0.00002
Incr
easi
ng P
roba
bilit
y
0.00006
0.00008
0.0001
0.00012
0.00014
0.00016
4000 9000 14000 19000 24000 29000
90th Percentile
75th Percentile
Mean
Probability of Adequacy (PoA) = the area under the curve to the left of the liability outcome selected
Illustration
CENTRAL ESTIMATE & RISK MARGIN OF OUTSTANDING CLAIMS
PAGE 51
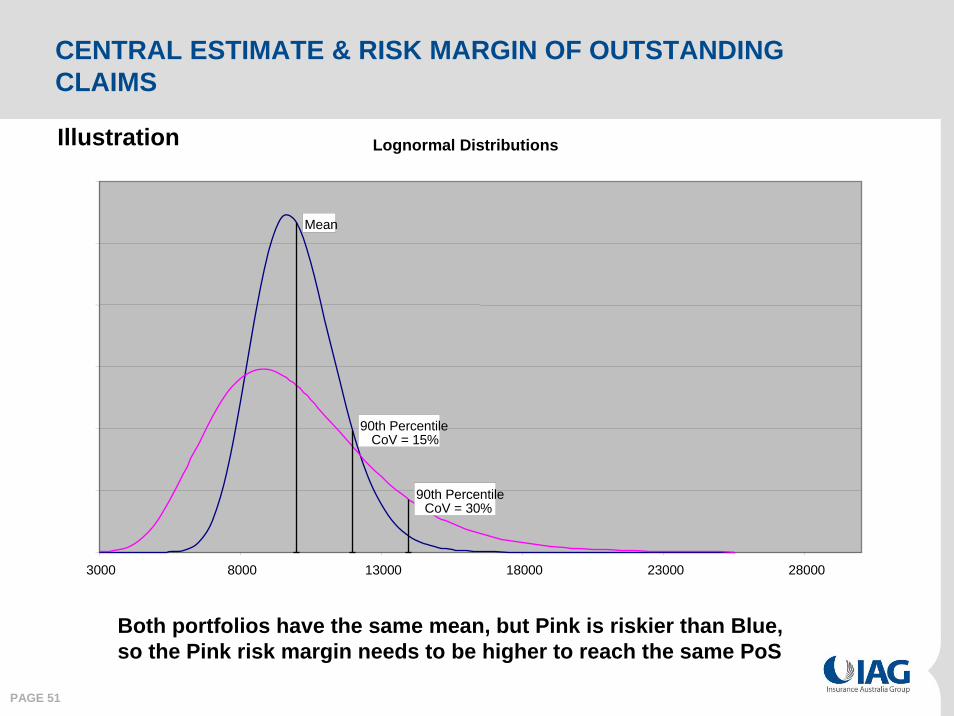
Lognormal Distributions
Mean
90th PercentileCoV = 30%
90th PercentileCoV = 15%
0
0.00005
0.0001
0.00015
0.0002
0.00025
0.0003
3000 8000 13000 18000 23000 28000
Both portfolios have the same mean, but Pink is riskier than Blue, so the Pink risk margin needs to be higher to reach the same PoS
Illustration
CENTRAL ESTIMATE & RISK MARGIN OF OUTSTANDING CLAIMS
PAGE 52
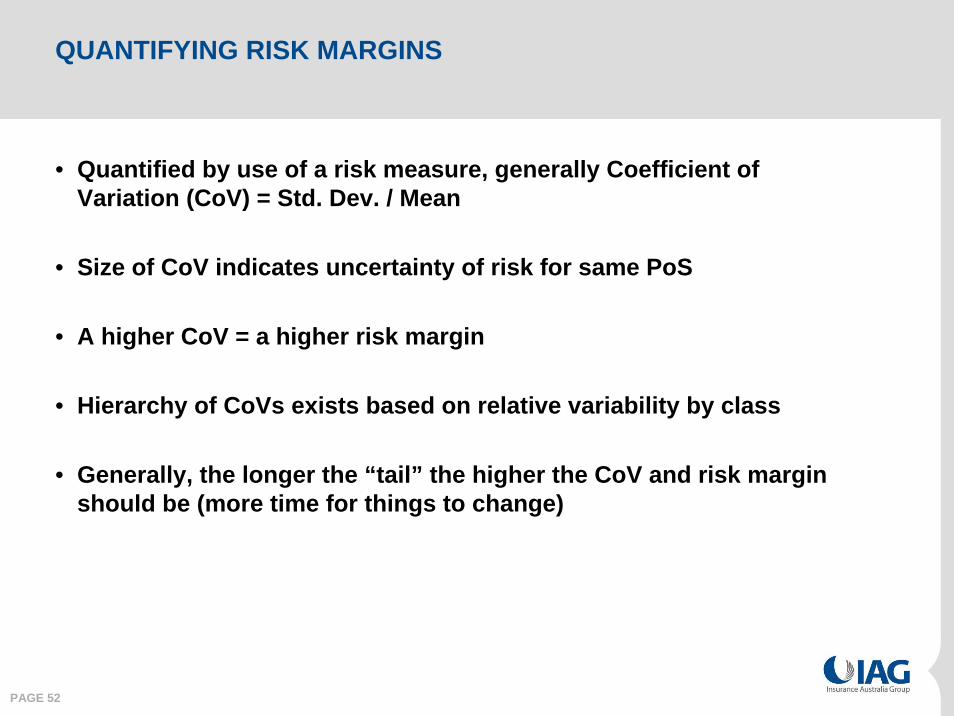
QUANTIFYING RISK MARGINS
• Quantified by use of a risk measure, generally Coefficient of Variation (CoV) = Std. Dev. / Mean
• Size of CoV indicates uncertainty of risk for same PoS
• A higher CoV = a higher risk margin
• Hierarchy of CoVs exists based on relative variability by class
• Generally, the longer the “tail” the higher the CoV and risk margin should be (more time for things to change)

PAGE 53
Projected asbestos cashflows (undiscounted)
2007
2010
2013
2016
2019
2022
2025
2028
2031
2034
2037
2040
2043
2046
2049
2052
2055
2058
2061
2064
Financial payment year
Net CE Jun07 Gross CE Jun07
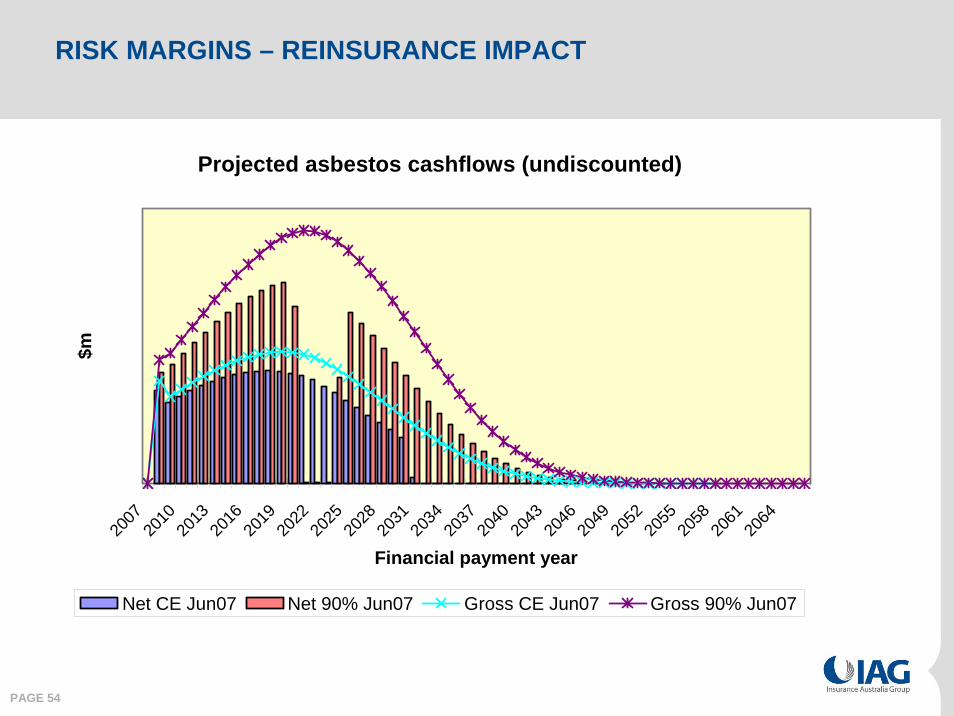
RISK MARGINS – REINSURANCE IMPACT
PAGE 54
Projected asbestos cashflows (undiscounted)
2007
2010
2013
2016
2019
2022
2025
2028
2031
2034
2037
2040
2043
2046
2049
2052
2055
2058
2061
2064
Financial payment year
$m
Net CE Jun07 Net 90% Jun07 Gross CE Jun07 Gross 90% Jun07
RISK MARGINS – REINSURANCE IMPACT
PAGE 55
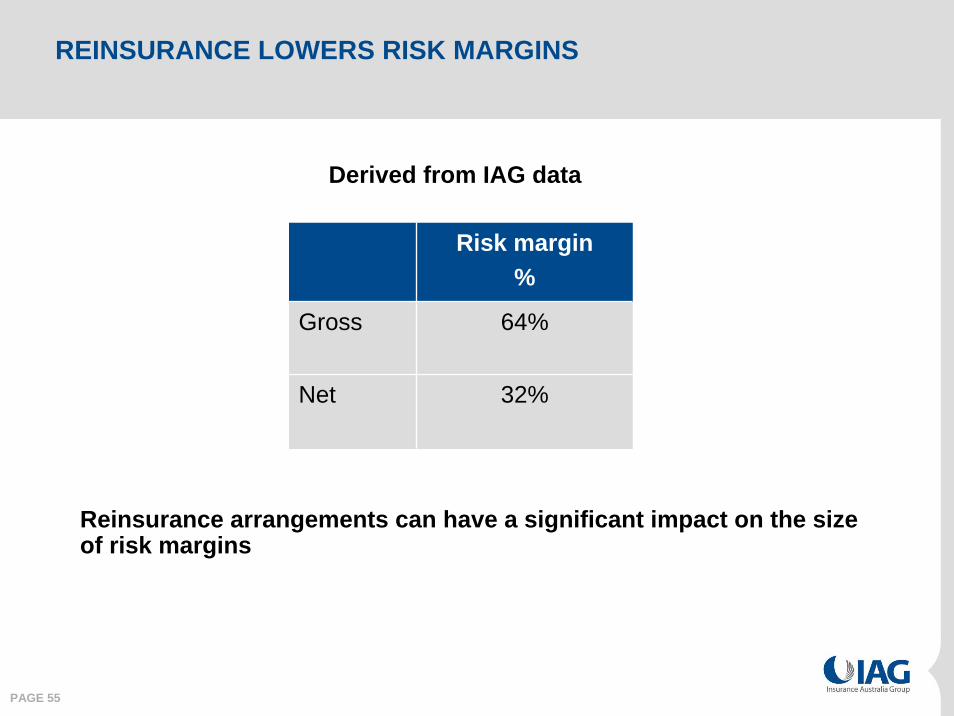
REINSURANCE LOWERS RISK MARGINS
Reinsurance arrangements can have a significant impact on the size of risk margins
Risk margin %
Gross 64%
Net 32%
Derived from IAG data

PAGE 56
CAPITAL AND RISK - A SIMPLE ILLUSTRATION
Assume an insurer commits to pay claims based on the roll of a dice - 100 rolls representing the uncertain underwriting results for 100 “policies” :
If 1 is result, insurer pays a claim of $1If 2 is result, insurer pays a claim of $2
•etc.•
If 5 is result, insurer pays a claim of $5, BUTIf 6 is result, there is no claim at all
Assume the dice can be thrown at any time within 1 year AND that the resulting claims are to be paid at end of 1 year
PAGE 57
WHAT SHOULD THE LIABILITY IN THE BALANCE SHEET BE BEFORE THE DICE IS ROLLED?
• Insurer’s maximum / minimum payout is $500 / Nil
• Insurer’s expected payout is $250
• Assume the premium has been set at $3 per throw – does that impact the liability?
• Assume for simplicity that there are no operational expenses
• The higher the liability determined the greater the probability will be that the liability will be adequate to pay all claims
• So, if you are a director of the insurer, what liability is used?
PAGE 58
THE “COST OF CAPITAL” CONCEPT
• The insurer will also need at least $200 of capital (net assets) available for one year before receiving the $300 premium on day one, to avoid the risk of insolvency
• Assume the risk free interest rate is 4% p.a.
• If investors require a total return on equity of 10% p.a. before tax to provide the capital for one year, the cost of that $200 of capital will be $20
• Hence, in this simple example, the exit value would be = ($250 + $20) / 1.04 = $260
PAGE 59
THE PRE-CLAIM LIABILITY WILL BE
• $300 if using unearned premium only
• $240 (=$250 / 1.04) if using central estimate only
• $252 (=$262 / 1.04) if using 75% PoA
• $262 (=$272 / 1.04) if using 90% PoA
• $260 if using the “Cost of Capital” concept
PAGE 60
PROFIT OF INSURER
• $50 “Expected” average profit over whole process, plus investment earnings on funds held over 1 year
• $Nil on Day 1 under AASB 1023 using unearned premium • $48 on Day 1 for 75% PoA under IASB proposal• $38 on Day 1 for 90% PoA under IASB proposal• $40 on Day 1 if using the “Cost of Capital” concept
• Actual profit will be brought to account once all 100 throws of dice have been completed – this will depend upon the actual total of claims paid and could be anywhere between $300 and ($200), plus investment earnings on funds held
PAGE 61
WHAT IS THE EMERGING IASB VIEW?
• Reported profitability should be based on outstanding claims liabilities that are based on
– Realistic central estimates
– Risk margins calibrated by real cost of capital employed to support liabilities rather than by PoA (so a target of, say, 90% PoA becomes less relevant)
– Explicit diversification between portfolios may not be allowed in risk margins or liabilities (unless IASB changes its view on this) – but may become implicitly incorporated
PAGE 62
LINKING PoA WITH IASB “EXIT” VALUE
• Compare for typical portfolios– Net present value (at cost of capital in excess of risk free rate) of
requirement to hold funds in excess of the central estimate up to the 99.5th percentile of outstanding claims (assumed solvency level)
– This will be equal to the initial capital needed less the NPV of expected capital releases as claims are settled after allowing for a risk free return for matching assets
• Assuming– CoV’s of claims log-normally distributed (i.e., skewed outcomes)– Constant over run-off of claims– Realistic returns on capital (4% and 6% p.a. over risk free of 5% p.a.)– Using short, medium and long-tailed classes (CoVs 10%, 20% and
30% respectively)
PAGE 63
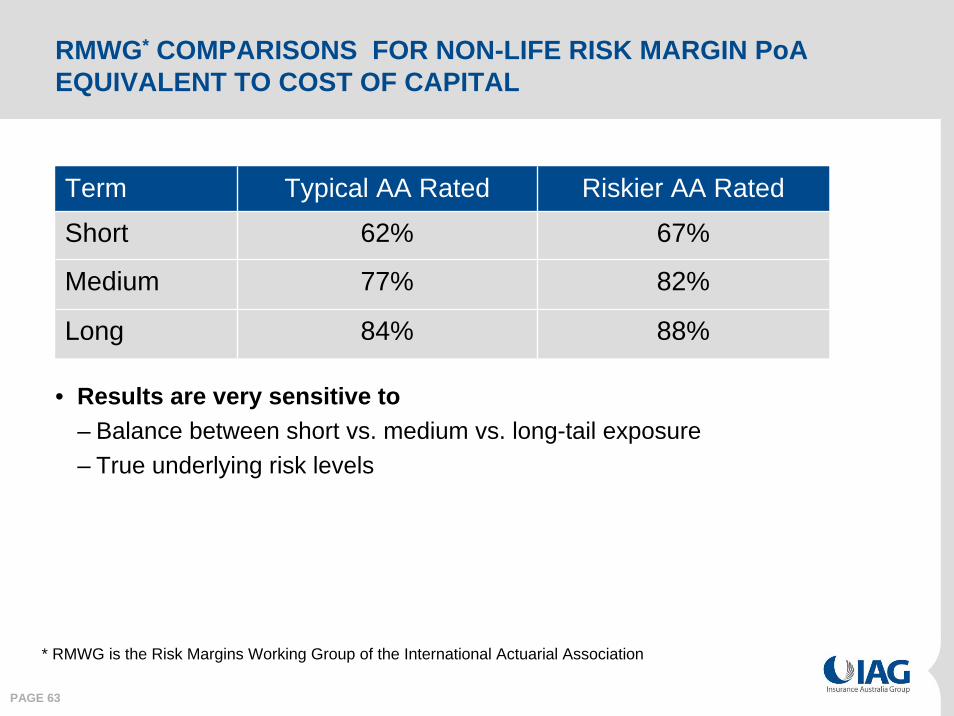
RMWG* COMPARISONS FOR NON-LIFE RISK MARGIN PoAEQUIVALENT TO COST OF CAPITAL
Term Typical AA Rated Riskier AA Rated
Short 62% 67%
Medium 77% 82%
Long 84% 88%
• Results are very sensitive to– Balance between short vs. medium vs. long-tail exposure– True underlying risk levels
* RMWG is the Risk Margins Working Group of the International Actuarial Association

PAGE 64
LINKING PoA WITH EXIT VALUE – CONCLUSIONS
• PoA equivalent to cost of capital varies significantly by duration of business (and CoV)– Around 60% - 70% for short-tail– Around 70% - 80% for medium-tail– Around 80% - 90% for long-tail
• Average over a ‘balanced’ portfolio will be around 75% PoA
• For IAG, the difference between 75% PoA and current 90% PoA(diversified) is significant
Note that this impact will be a lot smaller if an insurer is heavily reinsured, or has low risk margins already
PAGE 65
THE “COST OF CAPITAL” IMPACT
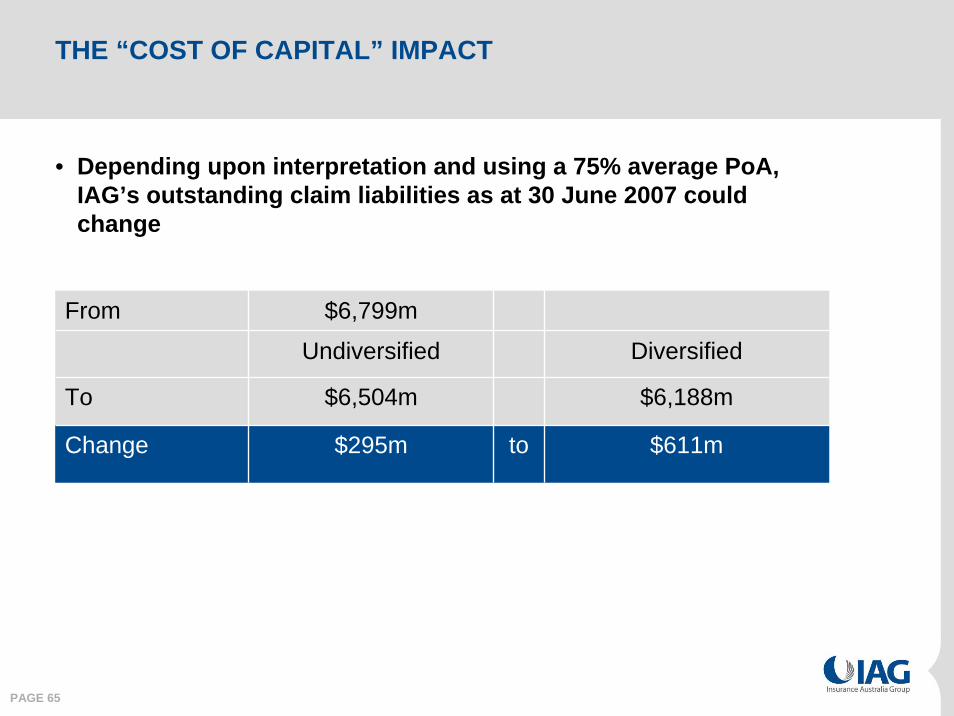
• Depending upon interpretation and using a 75% average PoA, IAG’s outstanding claim liabilities as at 30 June 2007 could change
From $6,799m
Undiversified Diversified
To $6,504m $6,188m
Change $295m to $611m

PAGE 66
ACTUARIAL CAPABILITY TRANSFER - IAG UK
• Need for actuarial capability transfer identified at Due Diligence
• Previously no in-house actuarial capability in either Hastings or EIG – complete reliance on external actuaries
• Due diligence identified need to materially improve reserving processes
• Recruited a CRO & a Chief Actuary for IAG UK (2 people)
• Seconded staff with extensive experience in pricing; data segmentation; reserving and actuarial / statistical risk management
• Initiated a major underwriting, pricing and risk margin review
• New rating “engine” being developed for 2008 to further refine pricing

PAGE 67
Prior Position
Targeted Segments
100% Retention
0% Retention
Geographical and Demographic clusters
0
20
40
60
80
100
120
60.0%
70.0%
80.0%
90.0%
100.0%
110.0%
120.0%
GWP Incurred Loss ratio
Prior Position
Targeted Segments
100% Retention
0% Retention
Geographical and Demographic clusters
0
20
40
60
80
100
120
60.0%
70.0%
80.0%
90.0%
100.0%
110.0%
120.0%
GWP Incurred Loss ratio
GWP £m
Loss Ratio
NEW RISK RATING IN ADVANTAGE
• Represents the impact on the portfolio if one small under-performing segment is re-priced and either retained in full (100% retention) on renewal or cancelled

PAGE 68
EXECUTIVE SUMMARY
• Robust reserving processes with a reliable history
• Risk margins – understanding the critical issues
• Conservative nature of IAG risk margins given capital employed
• IAG UK – actuarial capability transfer
PAGE 69
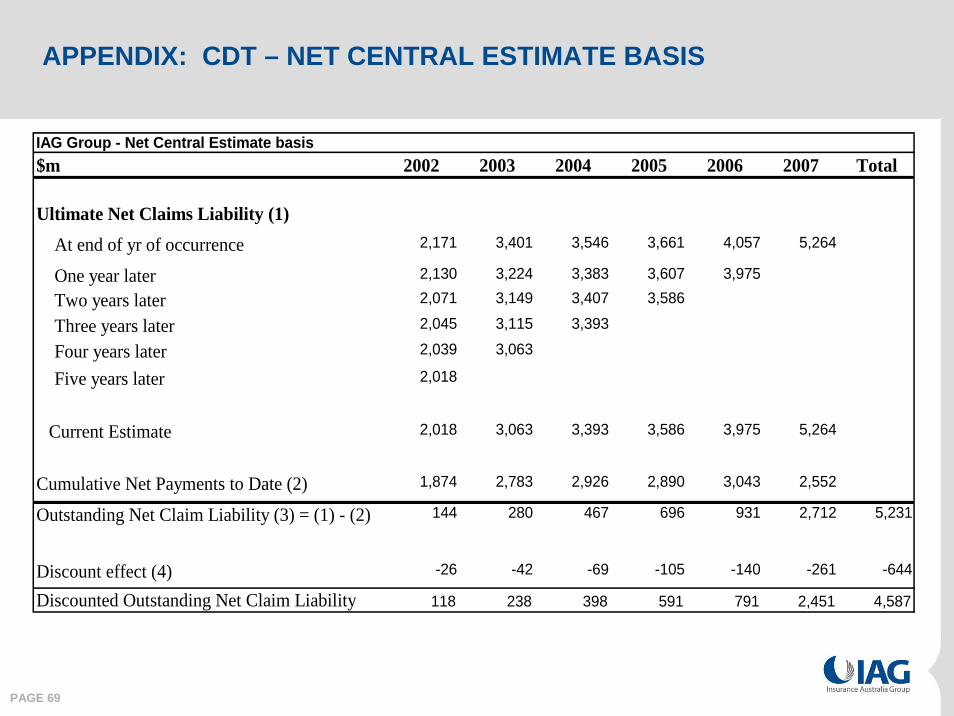
IAG Group - Net Central Estimate basis$m 2002 2003 2004 2005 2006 2007 Total
Ultimate Net Claims Liability (1) At end of yr of occurrence 2,171 3,401 3,546 3,661 4,057 5,264
One year later 2,130 3,224 3,383 3,607 3,975
Two years later 2,071 3,149 3,407 3,586
Three years later 2,045 3,115 3,393
Four years later 2,039 3,063
Five years later 2,018
Current Estimate 2,018 3,063 3,393 3,586 3,975 5,264
Cumulative Net Payments to Date (2) 1,874 2,783 2,926 2,890 3,043 2,552
Outstanding Net Claim Liability (3) = (1) - (2) 144 280 467 696 931 2,712 5,231
Discount effect (4) -26 -42 -69 -105 -140 -261 -644
Discounted Outstanding Net Claim Liability 118 238 398 591 791 2,451 4,587
APPENDIX: CDT – NET CENTRAL ESTIMATE BASIS

PAGE 70
APPENDIX: CDT – NET CENTRAL ESTIMATE BASIS
2002 2003 2004 2005 2006 2007
Ultimate Net Claims Liability (1)At end of yr of occurrence
One year later -2% -5% -5% -1% -2%Two years later -3% -2% 1% -1%
Three years later -1% -1% 0%
Four years later 0% -2%Five years later -1%
Overall change -7% -10% -4% -2% -2%Average rate change p.a. -1% -3% -1% -1% -2%
Average rate change p.a. from 2006 CDT -2% -3% -2% -2%

PAGE 71
$m 2002 2003 2004 2005 2006 2007 Total
Ultimate Net Claims Liability (1) At end of yr of occurrence 2,359 3,733 3,927 4,071 4,438 5,767
One year later 2,263 3,415 3,572 3,794 4,147
Two years later 2,184 3,303 3,546 3,715
Three years later 2,133 3,214 3,480
Four years later 2,095 3,115
Five years later 2,045
Current Estimate 2,045 3,115 3,480 3,715 4,147 5,767
Cumulative Net Payments to Date (2) 1,874 2,783 2,926 2,890 3,043 2,552
Outstanding Net Claim Liability (3) = (1) - (2) 171 332 554 825 1,104 3,215 6,201
Discount effect (4) -31 -50 -82 -124 -166 -310 -763
Discounted Outstanding Net Claim Liability 140 282 472 701 938 2,905 5,438
APPENDIX: CDT –NET PROVISION BASIS
PAGE 72
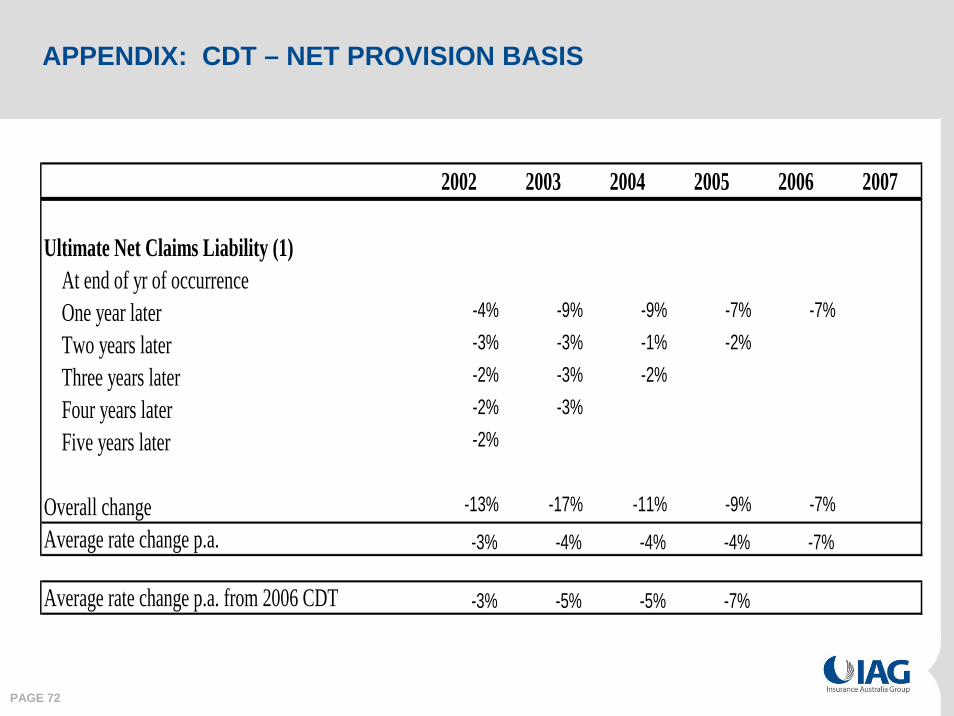
2002 2003 2004 2005 2006 2007
Ultimate Net Claims Liability (1) At end of yr of occurrence One year later -4% -9% -9% -7% -7%
Two years later -3% -3% -1% -2%
Three years later -2% -3% -2%
Four years later -2% -3%
Five years later -2%
Overall change -13% -17% -11% -9% -7%
Average rate change p.a. -3% -4% -4% -4% -7%
Average rate change p.a. from 2006 CDT -3% -5% -5% -7%
APPENDIX: CDT – NET PROVISION BASIS

PAGE 73
Morning Tea
Webcast will resume shortly
UK
Neil Utley29 October 2007

PAGE 75
EXECUTIVE SUMMARY
• Quality assets well positioned in a large market
• Market soft but improving
• Integration of UK businesses to drive efficiencies
• Positioning business for market upturn
PAGE 76
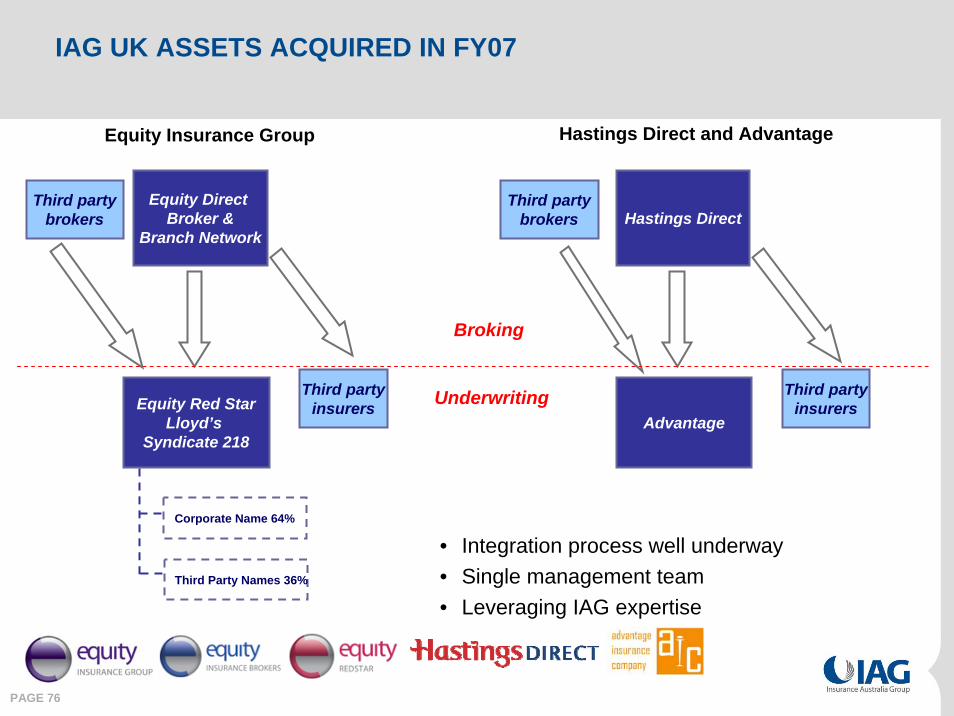
IAG UK ASSETS ACQUIRED IN FY07
Equity Direct Broker &
Branch Network
Third partybrokers
Equity Red StarLloyd’s
Syndicate 218
Third partyinsurers
Corporate Name 64%
Third Party Names 36%
Equity Insurance Group
Hastings DirectThird party
brokers
Advantage
Third partyinsurers
Hastings Direct and Advantage
Underwriting
Broking
• Integration process well underway• Single management team• Leveraging IAG expertise
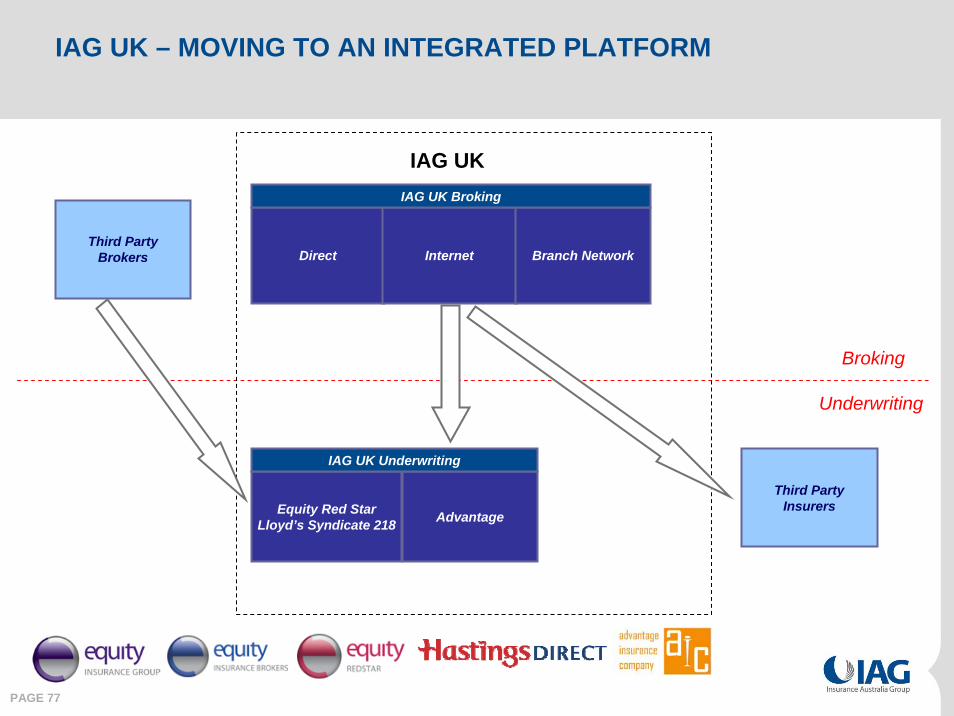
PAGE 77
Direct
Equity Red StarLloyd’s Syndicate 218
InternetThird Party
Brokers
Advantage
Third PartyInsurers
IAG UK Underwriting
Branch Network
IAG UK Broking
IAG UK
Underwriting
Broking
IAG UK – MOVING TO AN INTEGRATED PLATFORM
PAGE 78
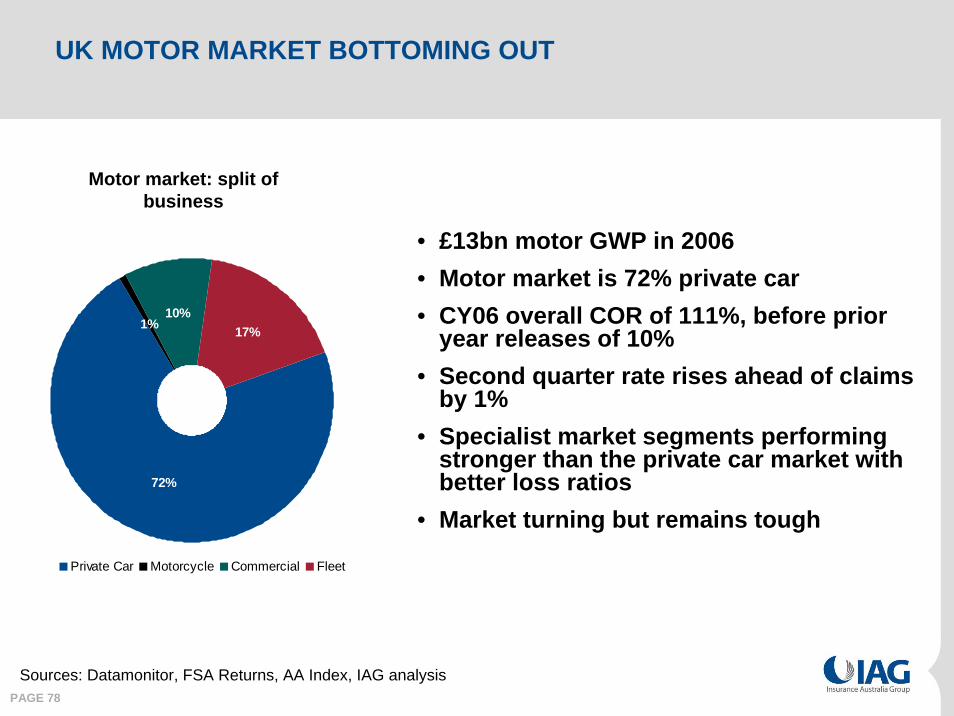
UK MOTOR MARKET BOTTOMING OUT
• £13bn motor GWP in 2006 • Motor market is 72% private car• CY06 overall COR of 111%, before prior
year releases of 10% • Second quarter rate rises ahead of claims
by 1% • Specialist market segments performing
stronger than the private car market with better loss ratios
• Market turning but remains tough
Motor market: split of business
Sources: Datamonitor, FSA Returns, AA Index, IAG analysis
17%1%
72%
10%
Private Car Motorcycle Commercial Fleet
PAGE 79
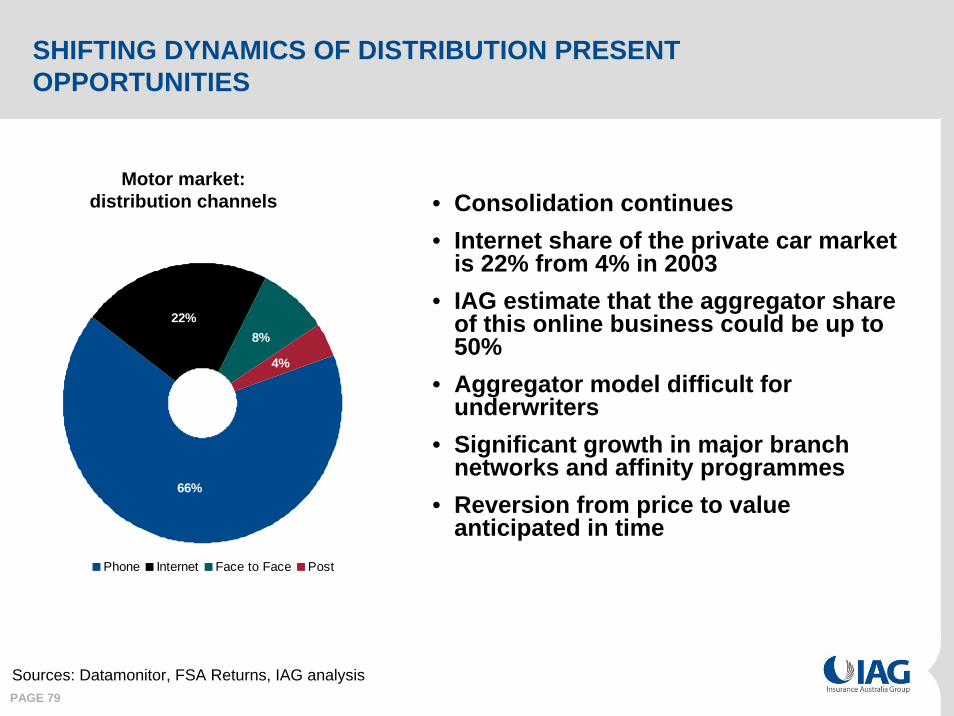
SHIFTING DYNAMICS OF DISTRIBUTION PRESENT OPPORTUNITIES
• Consolidation continues• Internet share of the private car market
is 22% from 4% in 2003• IAG estimate that the aggregator share
of this online business could be up to 50%
• Aggregator model difficult for underwriters
• Significant growth in major branch networks and affinity programmes
• Reversion from price to value anticipated in time
Motor market: distribution channels
Sources: Datamonitor, FSA Returns, IAG analysis
4%
22%
66%
8%
Phone Internet Face to Face Post

PAGE 80
2004 - 2006 combined shows Equity with a market leading Combined Ratio
0
5
10
15
20
25
30
708090100110120130
RBS
HBOS
AvivaR&SA
Provident
NFU
AllianzFortis
HighwayLiv Vic
MMA
AXAGroupama
Market S
hare %
2004-2006 Combined Ratio % (FSA / GAAP basis)
Zurich
HSBC Brit
Market average = 95.7%
OPERATING RATIOS FOR IAG vs. THE MARKET
Sources: FSA Returns, IAG analysis. Numbers presented on UK GAAP basis
PAGE 81
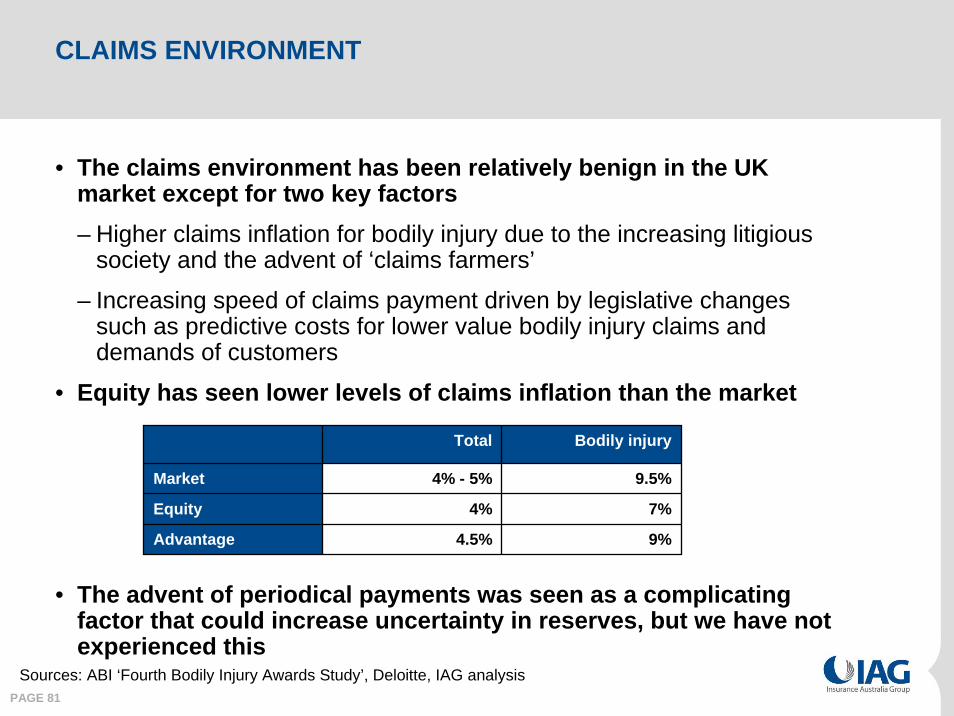
CLAIMS ENVIRONMENT
• The claims environment has been relatively benign in the UK market except for two key factors– Higher claims inflation for bodily injury due to the increasing litigious
society and the advent of ‘claims farmers’
– Increasing speed of claims payment driven by legislative changessuch as predictive costs for lower value bodily injury claims and demands of customers
• Equity has seen lower levels of claims inflation than the market
• The advent of periodical payments was seen as a complicating factor that could increase uncertainty in reserves, but we have not experienced this
Sources: ABI ‘Fourth Bodily Injury Awards Study’, Deloitte, IAG analysis
Total Bodily injury
Market 4% - 5% 9.5%
Equity 4% 7%
Advantage 4.5% 9%
PAGE 82
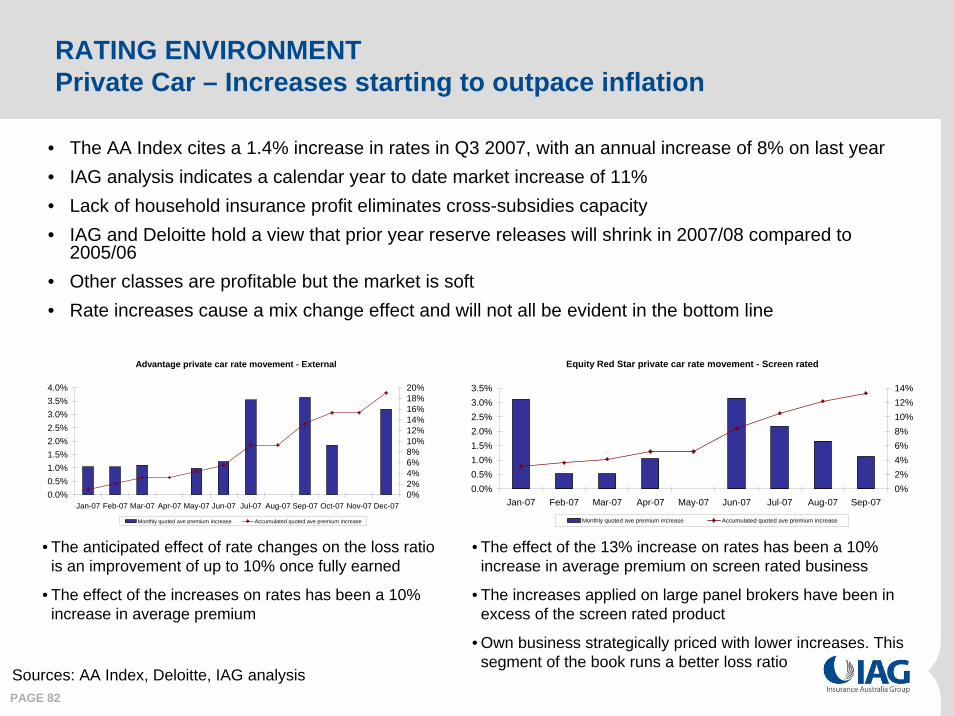
RATING ENVIRONMENTPrivate Car – Increases starting to outpace inflation
• The AA Index cites a 1.4% increase in rates in Q3 2007, with an annual increase of 8% on last year• IAG analysis indicates a calendar year to date market increase of 11%• Lack of household insurance profit eliminates cross-subsidies capacity• IAG and Deloitte hold a view that prior year reserve releases will shrink in 2007/08 compared to
2005/06 • Other classes are profitable but the market is soft• Rate increases cause a mix change effect and will not all be evident in the bottom line
• The anticipated effect of rate changes on the loss ratio is an improvement of up to 10% once fully earned
• The effect of the increases on rates has been a 10% increase in average premium
• The effect of the 13% increase on rates has been a 10% increase in average premium on screen rated business
• The increases applied on large panel brokers have been in excess of the screen rated product
• Own business strategically priced with lower increases. This segment of the book runs a better loss ratio
Sources: AA Index, Deloitte, IAG analysis
Advantage private car rate movement - External
0.0%0.5%1.0%1.5%2.0%2.5%3.0%3.5%4.0%
Jan-07 Feb-07 Mar-07 Apr-07 May-07 Jun-07 Jul-07 Aug-07 Sep-07 Oct-07 Nov-07 Dec-070%2%4%6%8%10%12%14%16%18%20%
Monthly quoted ave premium increase Accumulated quoted ave premium increase
Equity Red Star private car rate movement - Screen rated
0.0%0.5%1.0%1.5%2.0%2.5%3.0%3.5%
Jan-07 Feb-07 Mar-07 Apr-07 May-07 Jun-07 Jul-07 Aug-07 Sep-070%2%4%6%8%10%12%14%
Monthly quoted ave premium increase Accumulated quoted ave premium increase

PAGE 83
IAG UK UNDERWRITINGFocus on specialist segments and owned distribution channels
• ERS has a diversified book with a number of specialist niches. 20% sourced from internal distribution
• ERS maintains position as number one motorcycle insurer
• ERS premium of £187m (IAG share) and COR 98.6%* six months to June 2007
• Advantage writes predominantly private car with the majority sourced from Hastings
• Advantage premium of £75m and COR of 118% for six months to June 2007
ERS £500m GWP (CY06) Advantage £113m GWP (CY06)
* UK GAAP basis
24%
13%
2%4%3%
19%
22%
3%
10%
Private Car Motorcycle Household
Classic Car Roadside Rescue PA
Fleet Special Risks Farm
96%
4%
Private Car Motorcycle
PAGE 84
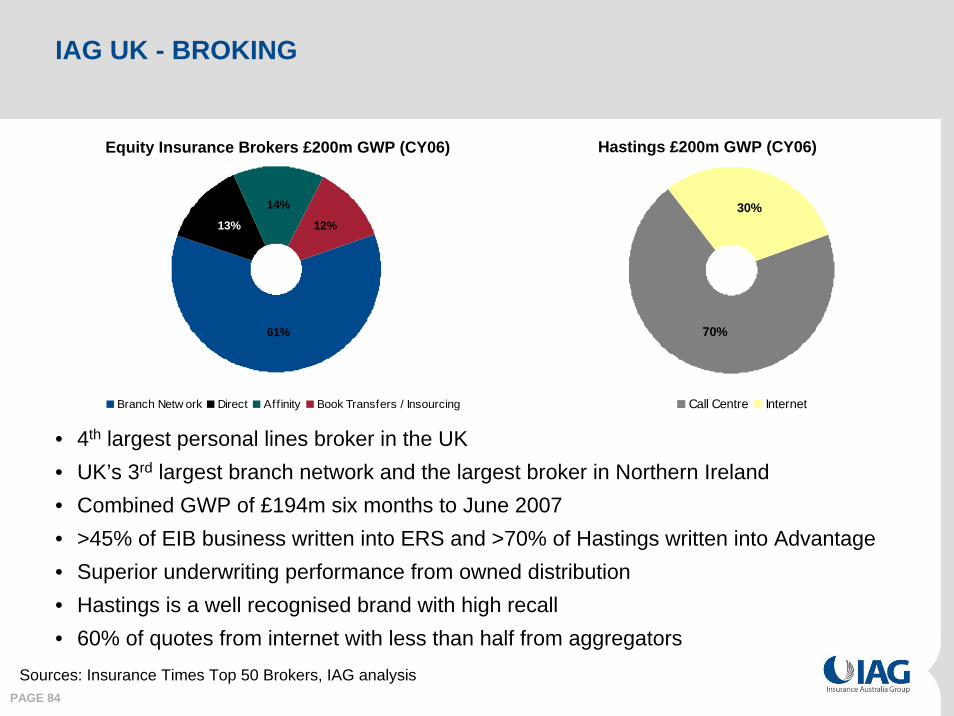
IAG UK - BROKING
Sources: Insurance Times Top 50 Brokers, IAG analysis
Equity Insurance Brokers £200m GWP (CY06) Hastings £200m GWP (CY06)
• 4th largest personal lines broker in the UK• UK’s 3rd largest branch network and the largest broker in Northern Ireland• Combined GWP of £194m six months to June 2007• >45% of EIB business written into ERS and >70% of Hastings written into Advantage• Superior underwriting performance from owned distribution • Hastings is a well recognised brand with high recall• 60% of quotes from internet with less than half from aggregators
70%
30%
Call Centre Internet
61%
14%
12%13%
Branch Netw ork Direct Affinity Book Transfers / Insourcing

PAGE 85
HASTINGS & ADVANTAGE - PERFORMANCE BELOW EXPECTATIONS
• Businesses purchased in October 2006
• Number of issues have come to light since April
– Market factors
– Underwriting

PAGE 86
HASTINGS AND ADVANTAGE - PERFORMANCE BELOW EXPECTATIONS
Market factors
• Soft market took longer to turn than expected
• Reduced effectiveness of marketing spend
• Increasing presence of the internet and rise of aggregators– Low conversion rates– Lower cross-sell of ancillary products
• Overall margin pressure
PAGE 87
Underwriting• Writing large volumes of low risk business but severely underpriced
during 2006– Enabled Hastings to grow rapidly
– Negative impact on Advantage COR (deteriorated from high 90%s in 2005 to 118% in 2006) *
• Loss of third party capacity from Inter Hannover– Reduction in competitiveness for Hastings
– To maintain business volumes significant proportion written by Advantage, underpriced
• Advantage grew its business with external brokers with highly competitive rates during 2006
• Rating engine issues• Temporary removal of third party panel• Slow to develop outbound capability in response to the increase in
internet business
HASTINGS AND ADVANTAGE - PERFORMANCE BELOW EXPECTATIONS
* UK GAAP
PAGE 88
HASTINGS - ACTIVELY RESPONDING TO RAPIDLY CHANGING MARKET
• Business strengths:– 500,000 owned customers– Brand with high recall– Improved website
• Utilising strengths in active response to rapidly evolving market• Moving brand away from low cost to value• Capitalisation on internet opportunity
– Aggregators bring low cost acquisition– Outbound model being developed to maximise earnings– Refocus marketing to Hastingsdirect.com
• Integration with Equity Direct• Optimising operational efficiency and customer service
– Unleashing the Potential annualised pre-tax savings targeted of £9m – Merging common support functions with Equity
PAGE 89
ADVANTAGE - PRICING FOR PROFIT
• Senior management changes• Focus on own distribution, particularly branches• Actuarial review quick wins of £3m – £5m per annum identified
– Leveraging off IAG actuarial capability to better segment and calibrate technical prices
– Eliminating poor segments of business by detailed cluster analysis and then out-sorting the poorer performing areas by price or acceptability
• Reduction in sales through big name broker panels• Improvements being made to rating engine• Renegotiation of supply chain contracts• Leverage off ERS expertise• Rate rises average 13% this calendar year to date (15% for external
business)– Beneficial change in mix– Expected retained premium inflation of 7 - 8%, running above claims
inflation at 4 - 5%
PAGE 90
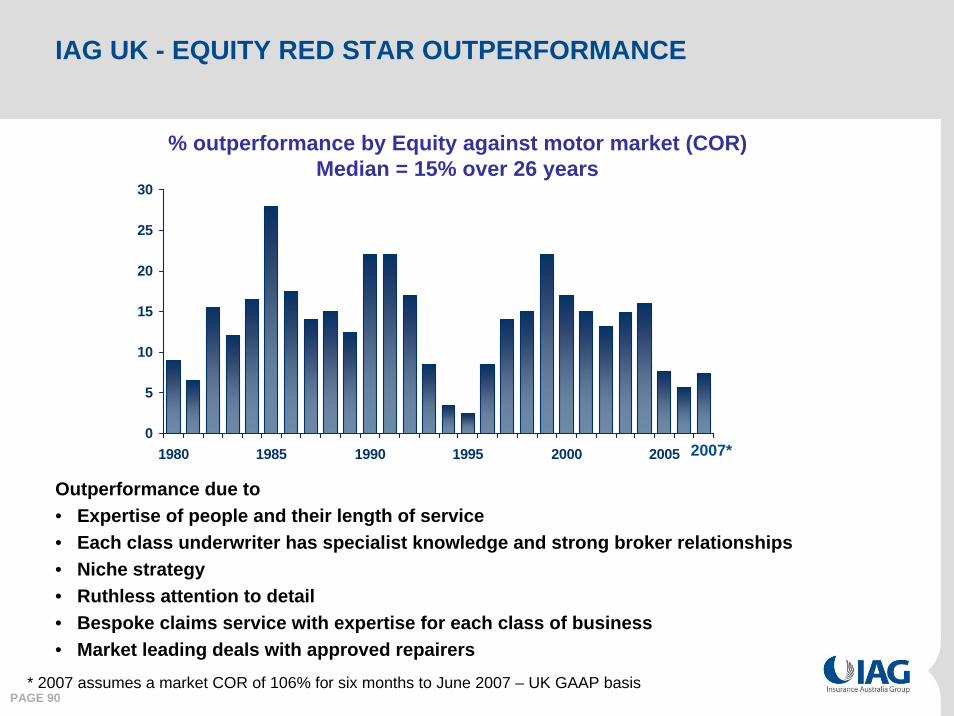
IAG UK - EQUITY RED STAR OUTPERFORMANCE
0
5
10
15
20
25
30
1980 1985 1990 1995 2000 2005
Outperformance due to • Expertise of people and their length of service• Each class underwriter has specialist knowledge and strong broker relationships• Niche strategy• Ruthless attention to detail• Bespoke claims service with expertise for each class of business• Market leading deals with approved repairers
2007*
* 2007 assumes a market COR of 106% for six months to June 2007 – UK GAAP basis
% outperformance by Equity against motor market (COR)Median = 15% over 26 years

PAGE 91
IAG UK UNDERWRITING STRATEGYEquity Red Star – Strengthening our segments
• Largest motor syndicate at Lloyd’s• Focus on distribution through third party brokers• Private car rate rises average 12% calendar year to date• Grow bespoke and specialist motor business organically
– Development of underwriting satellite offices (launch Jan ’08)– Leverage key broker relationships
• Focus private car on key broker relationships only, until marketreturns to profitability
• Develop small commercial underwriting presence, leveraging IAG experience– Further SME classes– Deepen our relationships with key brokers and major clients

PAGE 92
• 81 branches (13 acquisitions this calendar year to date)
• Growing branch network through acquisitions to:
– Control distribution in profitable underwriting areas
– Higher retention and cross sell
– Lower cost and lower risk policy acquisition
– Increase underwriting share of acquired business
– Increase margin
• Strategy to acquire at least 15-20 branches per annum
• Increase organic growth rate
• Target to own 200 branches by 2012
IAG UK BROKING STRATEGYBranch Network – Controlling distribution in profitable areas

PAGE 93
IAG UK STRATEGY SUMMARY
Unleashing the Potential• Integration• Alignment• Synergies
ERS – Strengthening our segments
• Focus on specialist segments
• Key broker relationships
• New SME classes
• Regional underwriting centres
Advantage – Pricing for profit
• Focus on owned channels
• Increasing lifetime value
• Underwriting for profit
• Eliminating unprofitable segments
Branch – Controlling distribution in profitable areas
• Capitalise on acquisition opportunities
• Increasing share of underwritten business
• Generating customer lock-in
Direct – Actively repositioning in rapidly changing market
• Repositioning brand to value
• Capitalising on the internet
• Optimising efficiencies
PAGE 94
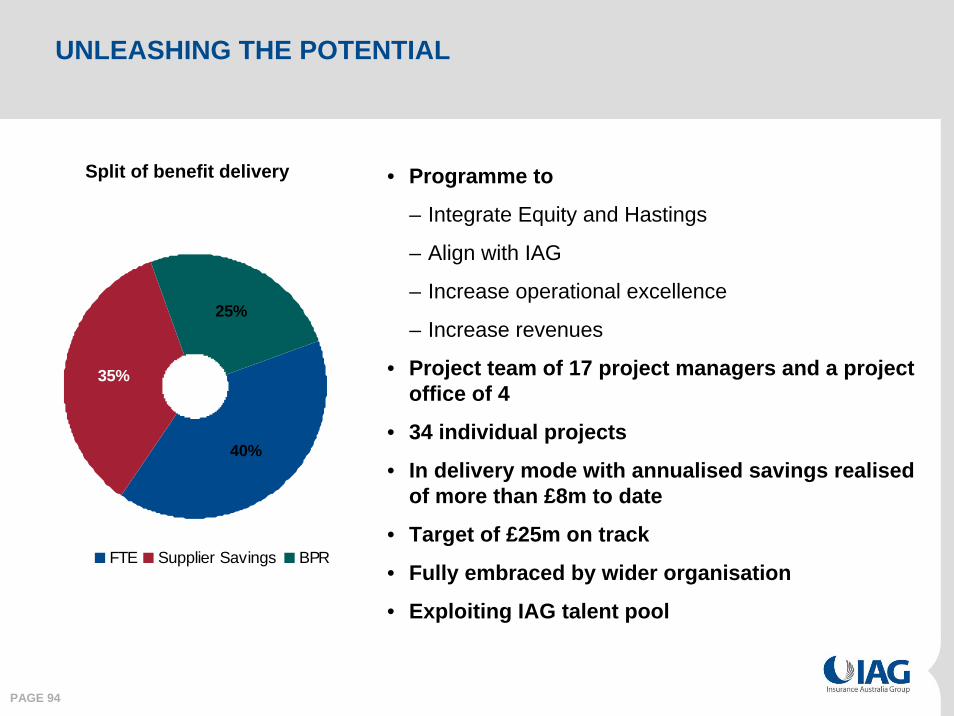
UNLEASHING THE POTENTIAL
• Programme to
– Integrate Equity and Hastings
– Align with IAG
– Increase operational excellence
– Increase revenues
• Project team of 17 project managers and a project office of 4
• 34 individual projects
• In delivery mode with annualised savings realised of more than £8m to date
• Target of £25m on track
• Fully embraced by wider organisation
• Exploiting IAG talent pool
Split of benefit delivery
40%
25%
35%
FTE Supplier Savings BPR
PAGE 95
IAG UK OUTLOOK
• FY08 GWP for Equity at £500m (£320m our share) flat on prior year • Mix improved as drop in private car volume is made up by gains in bespoke
business• Advantage flat in 1H08 with growth of 30% in 2H08 due to household licence
and business received from Equity broking• Hastings income 20% lower year on year with cost reductions showing
through in 2H08• Equity broking gross income for FY08, up 17%
– Excluding acquisitions up 7%
– Profits from Equity Broking being consumed by Hastings issues
• UK storm underwriting losses for Equity £3.5m and modest reserve movements reduce margin in first half
– Market conditions added to this have reduced profit expectations for CY07
• Full year Equity insurance margin target 10%+• Advantage COR running at 115% but with positive margin moving into FY09
PAGE 96
EXECUTIVE SUMMARY
• Quality assets well positioned in a large market
• Market soft but improving
• Integration of UK businesses to drive efficiencies
• Positioning business for market upturn

IAG New Zealand
Nick Hawkins29 October 2007
PAGE 98
EXECUTIVE SUMMARY
• Mature, rational market impacted by a large event in July 2007
• Our intermediated business is growing market share in this stable environment
• Focused on leveraging the advantages of our scale– Leading rate changes in commercial lines– Reductions in our cost base improving COR by 1-2% in next 12-18 months
PAGE 99
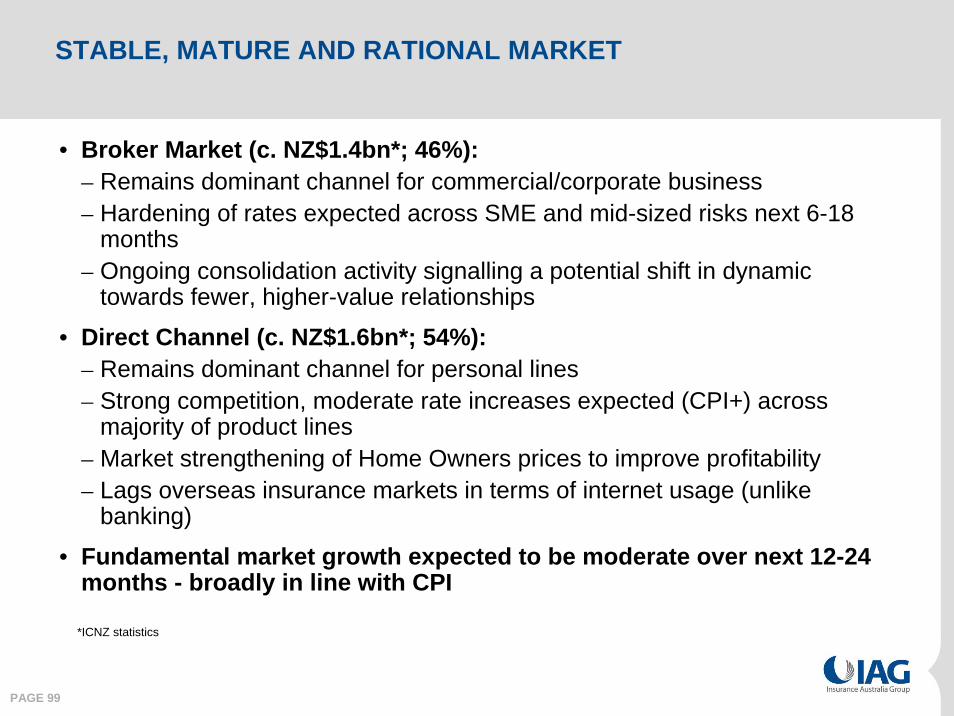
STABLE, MATURE AND RATIONAL MARKET
• Broker Market (c. NZ$1.4bn*; 46%):– Remains dominant channel for commercial/corporate business– Hardening of rates expected across SME and mid-sized risks next 6-18
months– Ongoing consolidation activity signalling a potential shift in dynamic
towards fewer, higher-value relationships
• Direct Channel (c. NZ$1.6bn*; 54%):– Remains dominant channel for personal lines– Strong competition, moderate rate increases expected (CPI+) across
majority of product lines– Market strengthening of Home Owners prices to improve profitability– Lags overseas insurance markets in terms of internet usage (unlike
banking)
• Fundamental market growth expected to be moderate over next 12-24 months - broadly in line with CPI
*ICNZ statistics

PAGE 100
IAG NZ HOLDS A LEADING MARKET SHARE AT 36%
State 37%
NZI 46%
Business Partners 17%
IAG NZ Channels
Products• Predominantly short-tail insurance• Business mix consistent with market
Distribution Channels
• State provides personal & commercial insurance to NZ personal customers and SMEs
• NZI is our broker business predominantly focused on SME & Mid markets with increasing focus on corporate market
• Business Partnerships distributes personal and commercial insurance through financial institutions and dealerships; intermediated and direct travel business
IAG NZ Product Mix
27%
15%
12.0%
19%
12%
7.0%
3%5%
Private Motor Vechile
Home Contents
Home Owner
Other Personal
Material Damage/ Business Interruption
Commercial Motor Vehicle
Liability
Other Commercial
PAGE 101
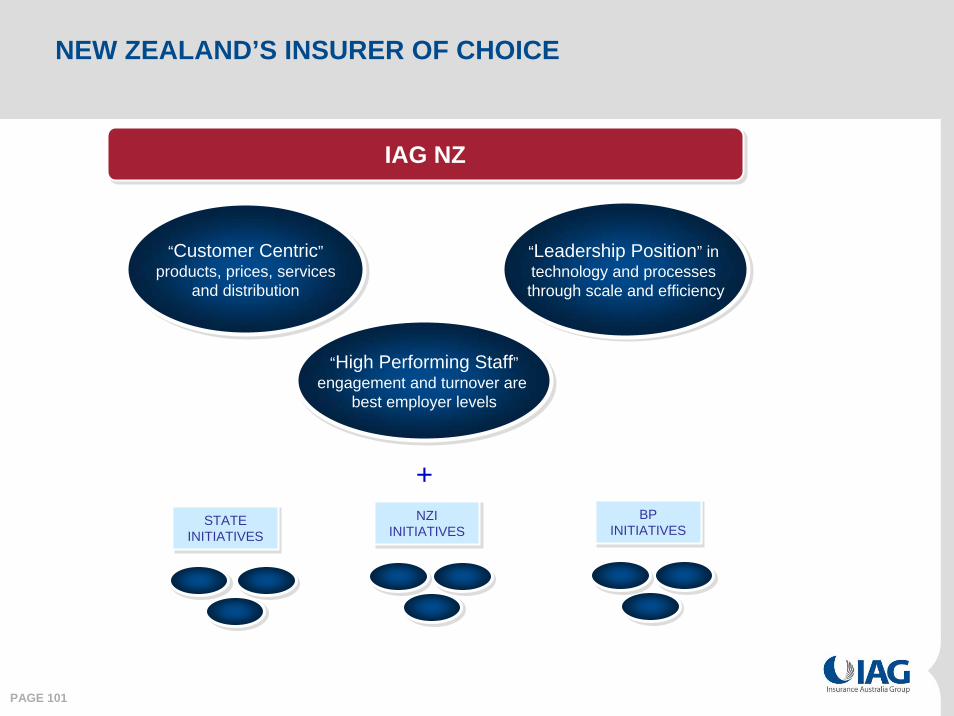
NEW ZEALAND’S INSURER OF CHOICE
“Customer Centric”products, prices, services
and distribution
“Customer Centric”products, prices, services
and distribution
“High Performing Staff”engagement and turnover are
best employer levels
“High Performing Staff”engagement and turnover are
best employer levels
“Leadership Position” in technology and processes through scale and efficiency
“Leadership Position” in technology and processes through scale and efficiency
STATE INITIATIVES
STATE INITIATIVES
NZI INITIATIVES
NZI INITIATIVES
BP INITIATIVES
BP INITIATIVES
+
IAG NZIAG NZ

PAGE 102
SIGNIFICANT PROGRESS ON EXECUTION
• Offering a complete suite of commercial products with the launch of Professional Liability, Marine and SME Direct products
• Re-aligned operational model around our customers• Embedding customer advocacy into the culture of the business• Increasing our share of large Corporate market• Stronger and more strategic relationships with brokers
• Invested in new personal lines system (Huon), leveraging Group assets, improving underwriting capability and achieving long term competitive advantages
• Implementing improvements from operational efficiency program with expected benefits of 1-2% in COR
• Driving hardening of commercial rates
• Invested in new personal lines system (Huon), leveraging Group assets, improving underwriting capability and achieving long term competitive advantages
• Implementing improvements from operational efficiency program with expected benefits of 1-2% in COR
• Driving hardening of commercial rates
• Improved staff turnover and engagement• Development of flexible remuneration structure to better reward right
behaviours focused on profitable growth• Enhancements to our talent management framework including the
introduction of a new talent management system
• Improved staff turnover and engagement• Development of flexible remuneration structure to better reward right
behaviours focused on profitable growth• Enhancements to our talent management framework including the
introduction of a new talent management system
High Performing
Staff
LeadershipPosition
CustomerCentric
PAGE 103
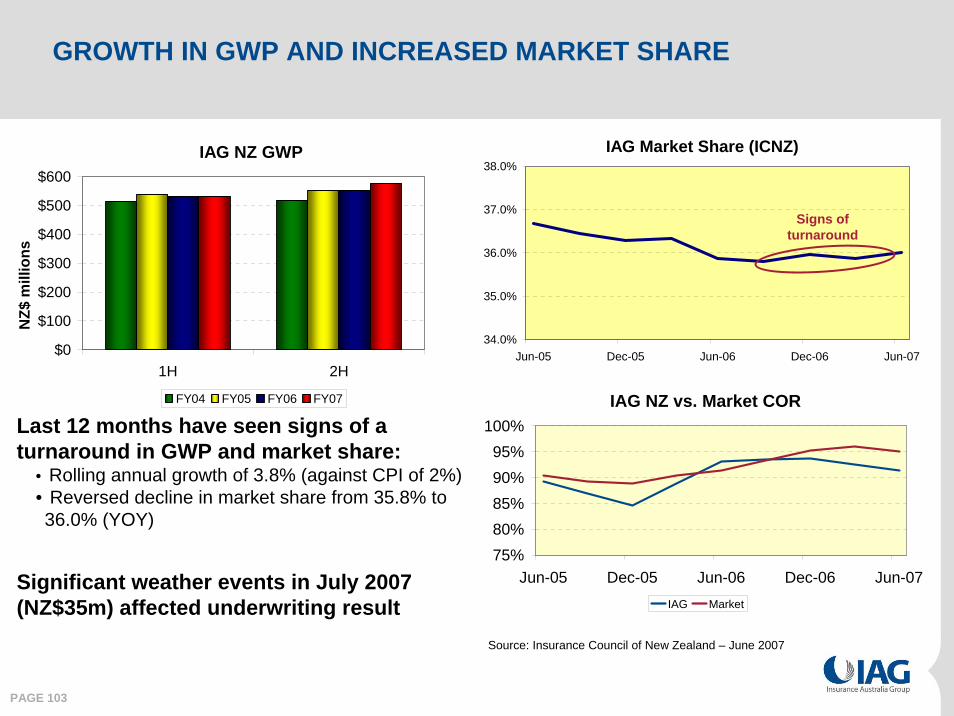
GROWTH IN GWP AND INCREASED MARKET SHARE
Last 12 months have seen signs of a turnaround in GWP and market share:
• Rolling annual growth of 3.8% (against CPI of 2%)• Reversed decline in market share from 35.8% to 36.0% (YOY)
Significant weather events in July 2007 (NZ$35m) affected underwriting result
Source: Insurance Council of New Zealand – June 2007
IAG NZ GWP
$0
$100
$200
$300
$400
$500
$600
1H 2H
NZ$
mill
ions
FY04 FY05 FY06 FY07
IAG Market Share (ICNZ)
34.0%
35.0%
36.0%
37.0%
38.0%
Jun-05 Dec-05 Jun-06 Dec-06 Jun-07
Signs of turnaround
IAG NZ vs. Market COR
75%80%85%90%95%
100%
Jun-05 Dec-05 Jun-06 Dec-06 Jun-07IAG Market
PAGE 104
OUTLOOK
• NZ$ GWP growth for FY08 expected to be 3-5%
– Exceeding market and CPI
• Insurance result outlook hit by July storms
– Expect 4 – 6% margin for FY08

PAGE 105
EXECUTIVE SUMMARY
• Mature, rational market impacted by a large event in July 2007
• Our intermediated business is growing market share in this stable environment
• Focused on leveraging the advantages of our scale– Leading rate changes in commercial lines– Reductions in our cost base improving COR by 1-2% in next 12-18 months

IAG Asia
Investor Briefing
Justin Breheny29 October 2007
PAGE 107
EXECUTIVE SUMMARY
• State of the markets– Challenging but growing markets– Competition is increasing
• Organic growth– IAG Thailand year-on-year GWP growth around 5-6% despite a drop in
consumer confidence – Malaysia (AmAssurance) year-on-year GWP growth around 20% despite
soft new car sales
• Acquisition focus– Planned growth through prudent and disciplined M&A– Focused on four key markets: Thailand, Malaysia, China and India

PAGE 108
CHALLENGING MARKET CONDITIONS
State of the market• Difficult market as political instability
adversely impacts consumer confidence and large infrastructure spending
• CY06 new car sales were down 3% on 2005 and Jan-Apr 2007 sales down by almost 16% on the previous year
State of the market• Consumer confidence has slipped, resulting in
new car sales for FY07 falling 15% to 460,000 units
• There has been a small improvement since July 2007
• Despite this situation, AmAssurance has grown premium by around 20% in the first 3 months of FY08 compared to the same period last year
Thailand MalaysiaConsumer Confident Index
35.0
45.0
55.0
65.0
75.0
85.0
95.0
105.0
115.0
Jan-9
9Ju
n-99
Nov-99
Apr-00
Sep-00
Feb-01Ju
l-01
Dec-01
May-02
Oct-02
Mar-03
Aug-03
Jan-0
4Ju
n-04
Nov-04
Apr-05
Sep-05
Feb-06Ju
l-06
Dec-06
May-07
New Car Sales - Malaysia
0
10,000
20,000
30,000
40,000
50,000
60,000
Apr'05 July Oct Jan'06 Apr'06 July Oct Jan'07 Apr'07 July
2006 2007
PAGE 109
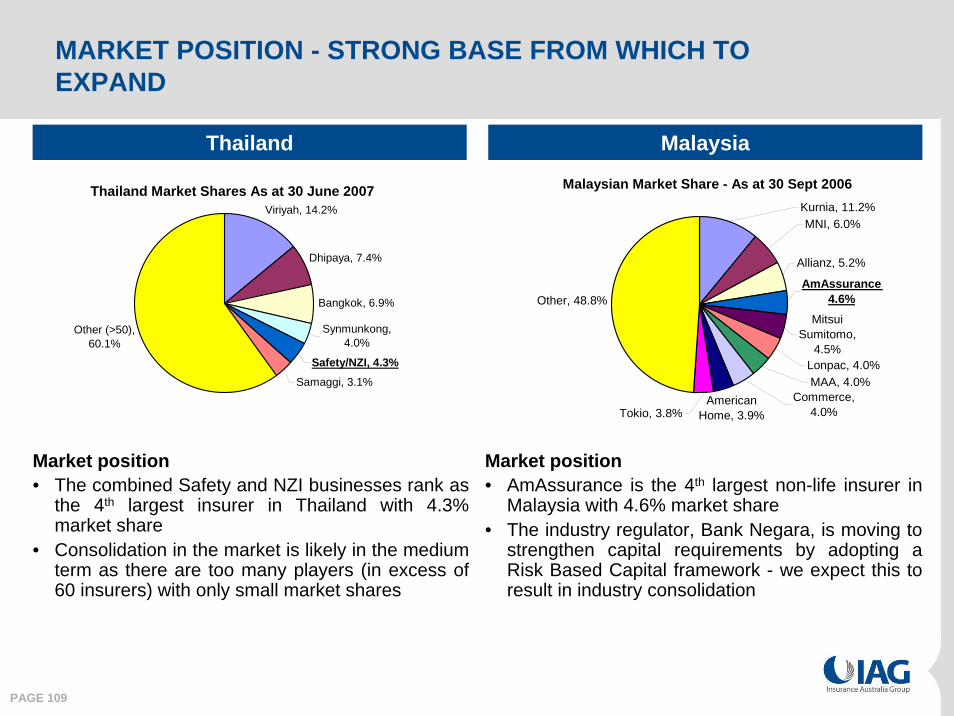
MARKET POSITION - STRONG BASE FROM WHICH TO EXPAND
Market position• The combined Safety and NZI businesses rank as
the 4th largest insurer in Thailand with 4.3% market share
• Consolidation in the market is likely in the medium term as there are too many players (in excess of 60 insurers) with only small market shares
Market position• AmAssurance is the 4th largest non-life insurer in
Malaysia with 4.6% market share• The industry regulator, Bank Negara, is moving to
strengthen capital requirements by adopting a Risk Based Capital framework - we expect this to result in industry consolidation
Thailand Malaysia
Thailand Market Shares As at 30 June 2007Viriyah, 14.2%
Dhipaya, 7.4%
Bangkok, 6.9%
Synmunkong, 4.0%
Samaggi, 3.1%
Other (>50), 60.1%
Safety/NZI, 4.3%
Malaysian Market Share - As at 30 Sept 2006
Allianz, 5.2%
Mitsui Sumitomo,
4.5%
Other, 48.8%
MNI, 6.0%Kurnia, 11.2%
Lonpac, 4.0%MAA, 4.0%
Commerce, 4.0%
AmAssurance 4.6%
American Home, 3.9%Tokio, 3.8%
PAGE 110
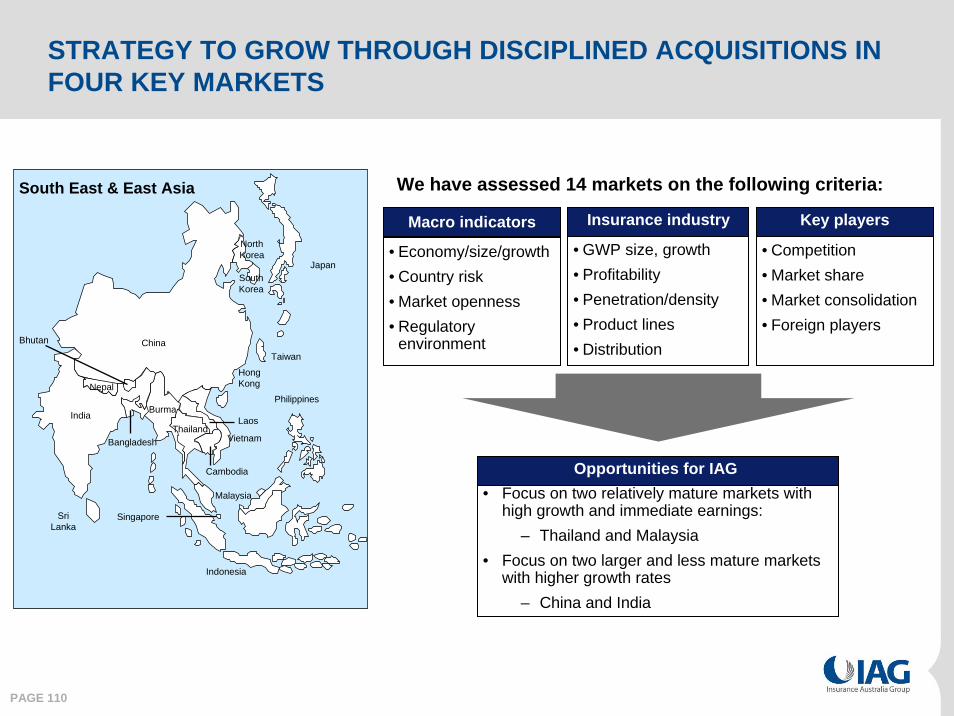
STRATEGY TO GROW THROUGH DISCIPLINED ACQUISITIONS IN FOUR KEY MARKETS
• GWP size, growth• Profitability• Penetration/density• Product lines• Distribution
Insurance industry
• Competition• Market share• Market consolidation• Foreign players
Key players
• Focus on two relatively mature markets with high growth and immediate earnings:
– Thailand and Malaysia• Focus on two larger and less mature markets
with higher growth rates– China and India
Opportunities for IAG
India
China
Japan
Taiwan
Indonesia
North Korea
Burma
South Korea
ThailandVietnam
Cambodia
Bangladesh
Bhutan
Nepal
Laos
Philippines
Malaysia
South East & East Asia
Hong Kong
SingaporeSri Lanka
We have assessed 14 markets on the following criteria:
Macro indicators
• Economy/size/growth• Country risk• Market openness• Regulatory
environment

PAGE 111
Distribution/Operations• Telemarketing centre established • Distribution of new car Extended Warranty product
via Hyundai dealers • Distribution of used car Extended Warranty
product via Chevrolet dealers• Distribution of Gap Insurance product via GMAC• Expansion of branch network to capture growth in
North and North East Thailand
Product• Gap Insurance product launched • New ‘Low cost’ travel product developed• Extended Warranty product for new cars• Extended Warranty product for used cars• Personal Accident Insurances
Technical• Portfolio and risk analysis reviews • Introduction of improved reporting tools• Improved understanding of underwriting
performance and risk selection • Claims performance reporting improvements
Distribution/Operations• Banking systems review with AmBank has identified
opportunities for improved systems integration and broader bancassurance product suite
• Joint project targeting improved service, efficiency and management via consolidation of existing branch network
Product• New Gap Insurance product developed for AmBank
Auto loan division • Extended Warranty product developed for new cars• Extended Warranty product developed for used cars• New products accounted for approximately 2-3% of
AmAssurance's GWP growth
Technical• IAG actuarial expertise has improved insight into
AmAssurance underwriting and portfolio performance
• Bodily Injury (CTP) review of claims operation in conjunction with IAG Australia • Remedial action plan implemented
MalaysiaThailand
PROGRESS ON EXECUTION Continued strong progress on capability transfer

PAGE 112
PROGRESS ON EXECUTION Active and disciplined approach to M&A
OVERALL
• Our strategic focus remains– Entry into China and India– Acquire and integrate other insurers in Thailand and Malaysia as the market consolidates
• Disciplined in our approach - many opportunities rejected as did not align with our strategy or acquisition criteria or the prices being paid were not, in our view, rational
MARKET SPECIFIC
• China: We continue to talk to a number of insurers in China who are seeking foreign strategic investors
• India: We are in advanced discussions with a number of Indian companies with a view to establishing a non-life insurance JV
• Malaysia: We have developed a strong relationship with our partner, AmGroup, and have been invited to increase our ownership to 49% - we will sell-down our life insurance ownership at the same time. We continue to look for acquisition opportunities
• Thailand: Opportunities have been few due to political uncertainty - we continue to build relationships with potential partners / targets
PAGE 113
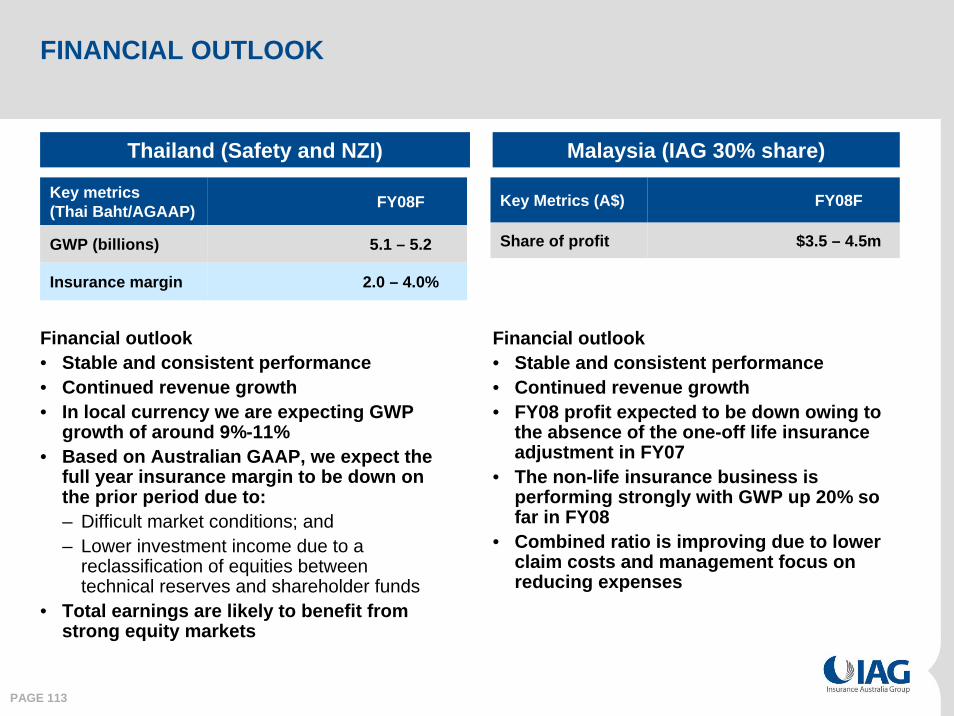
FINANCIAL OUTLOOK
Financial outlook• Stable and consistent performance• Continued revenue growth• In local currency we are expecting GWP
growth of around 9%-11% • Based on Australian GAAP, we expect the
full year insurance margin to be down on the prior period due to:– Difficult market conditions; and – Lower investment income due to a
reclassification of equities between technical reserves and shareholder funds
• Total earnings are likely to benefit from strong equity markets
Financial outlook• Stable and consistent performance• Continued revenue growth• FY08 profit expected to be down owing to
the absence of the one-off life insurance adjustment in FY07
• The non-life insurance business is performing strongly with GWP up 20% so far in FY08
• Combined ratio is improving due to lower claim costs and management focus on reducing expenses
Thailand (Safety and NZI) Malaysia (IAG 30% share)
Key Metrics (A$) FY08F
Share of profit $3.5 – 4.5m
Key metrics (Thai Baht/AGAAP) FY08F
GWP (billions) 5.1 – 5.2
Insurance margin 2.0 – 4.0%
PAGE 114
EXECUTIVE SUMMARY
• STATE OF THE MARKET– Fast growing markets– Difficult market conditions in Thailand due to political unrest– Competition is increasing and more insurers looking to enter the markets, thus acquisitions are
difficult and prices paid by others are not always rational
• STRATEGY– Our presence in the region continues to develop around four key markets: seeking to consolidate
in Thailand and Malaysia and build a presence in China and India– We are confident that our practical partnership model will ensure that we partner with the right
companies and along with our capability transfer program we can build value for our shareholders
• PROGRESS ON EXECUTION– The financial and operational results in both Thailand and Malaysia are showing signs of further
improvement on the back of our capability transfer program and we continue to look for opportunities to consolidate our position in these markets
– We are in discussions with a number of players in both China and India with a view to finalising our entry in the medium term
• FINANCIAL OUTLOOK– We are confident that earnings will improve in FY08 over FY07 driven by good growth in the top
line and an improvement in both the loss and expense ratios
Summary
Mike Hawker29 October 2007
PAGE 116
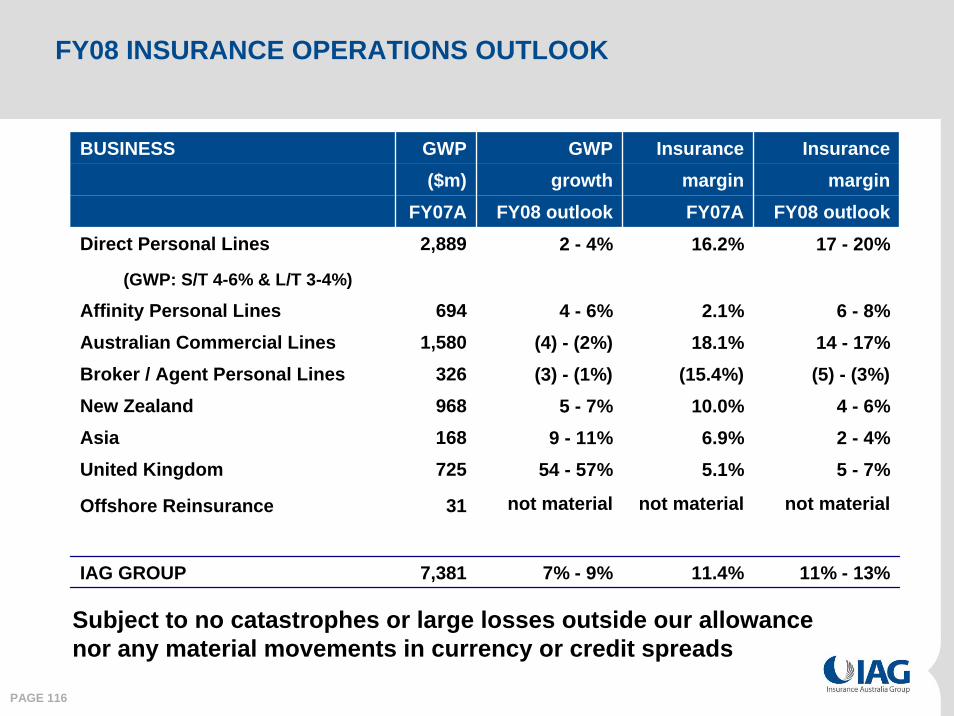
FY08 INSURANCE OPERATIONS OUTLOOK
BUSINESS GWP GWP Insurance Insurance($m) growth margin margin
FY07A FY08 outlook FY07A FY08 outlookDirect Personal Lines 2,889 2 - 4% 16.2% 17 - 20%
(GWP: S/T 4-6% & L/T 3-4%)
Affinity Personal Lines 694 4 - 6% 2.1% 6 - 8%Australian Commercial Lines 1,580 (4) - (2%) 18.1% 14 - 17%Broker / Agent Personal Lines 326 (3) - (1%) (15.4%) (5) - (3%)New Zealand 968 5 - 7% 10.0% 4 - 6%Asia 168 9 - 11% 6.9% 2 - 4%United Kingdom 725 54 - 57% 5.1% 5 - 7%
Offshore Reinsurance 31 not material not material not material
IAG GROUP 7,381 7% - 9% 11.4% 11% - 13%
Subject to no catastrophes or large losses outside our allowance nor any material movements in currency or credit spreads
PAGE 117
FY08 TRADING OUTLOOK – SUMMARY
• GWP growth of 7 – 9%
• Insurance margin of 11 – 13% on NEP of c$7.5bn– Subject to no catastrophes or large losses outside our allowance nor
any material movements in currency or credit spreads
• Financial position– Consistent and conservative approach to reserving– Supported by strong capital position and very strong ‘AA’ ratings for
key wholly-owned insurers
• Dividend guidance of 29.5 cents per share maintained– Acknowledge payout ratio likely to exceed 50-70% of normalised
earnings – Do not expect to underwrite FY08 dividends

QUESTIONS