Investment in Africa's Manufacturing Sector: a Four Country … · Investment in Africa’s...
28
Investment in Africa’s Manufacturing Sector: a Four Country Panel Data Analysis Arne Bigsten , Paul Collier , Stefan Dercon , Bernard Gauthier , (1) (2) (3) (4) Jan Willem Gunning , Anders Isaksson , Abena Oduro , (5) (1) (6) Remco Oostendorp , Cathy Pattillo , Mans Soderbom , (5) (7) (1) Michel Sylvain , Francis Teal , Albert Zeufack (4) (2) (8) WPS/97-11 April 1997 Centre for the Study of African Economies Institute of Economics and Statistics University of Oxford St Cross Building Manor Road Oxford OX1 3UL University of Gothenburg, University of Oxford, University of Oxford and Katholieke Universiteit Leuven, École (1) (2) (3) (4) des Hautes Études Commerciales, Montréal, Free University, Amsterdam, University of Ghana, Legon, Research (5) (6) (7) Department, IMF, CERDI, The University of Auvergne, Clermont-Ferrand. The authors form the ISA (Industrial (8) Surveys in Africa) group which uses multi-country panel data sets to analyse the microeconomics of industrial performance in Africa. Key words: firm investment, liquidity constraints, African manufacturing. JEL Classifications: D21, O55, O12. Correspondence: Dr F J Teal, Centre for the Study of African Economies. E-mail: [email protected]. This paper draws on work undertaken as part of the Regional Programme on Enterprise Development (RPED), organised by the World Bank and funded by the Swedish, French, Belgian, UK, Canadian and Dutch governments. Support of the Dutch and UK governments for workshops of the group is gratefully acknowledged. The use of the data and the responsibility for the views expressed are the authors’. Abstract: Firm-level data for the manufacturing sector in Africa, presented in this paper, shows very low levels of investment. A positive effect from profits onto investment is identified in a flexible accelerator specification of the investment function controlling for firm fixed effects. There is evidence that this effect is confined to smaller firms. A comparison with other studies shows that, for such firms, the profit effect is much smaller in Africa than in other countries. Reasons for the relative insensitivity of investment to profits in African firms are suggested.
Transcript of Investment in Africa's Manufacturing Sector: a Four Country … · Investment in Africa’s...

Investment in Africa’s ManufacturingSector: a Four Country Panel Data Analysis
Arne Bigsten , Paul Collier , Stefan Dercon , Bernard Gauthier ,(1) (2) (3) (4)
Jan Willem Gunning , Anders Isaksson , Abena Oduro ,(5) (1) (6)
Remco Oostendorp , Cathy Pattillo , Mans Soderbom , (5) (7) (1)
Michel Sylvain , Francis Teal , Albert Zeufack(4) (2) (8)
WPS/97-11
April 1997
Centre for the Study of African EconomiesInstitute of Economics and Statistics
University of OxfordSt Cross Building
Manor RoadOxford OX1 3UL
University of Gothenburg, University of Oxford, University of Oxford and Katholieke Universiteit Leuven, École(1) (2) (3) (4)
des Hautes Études Commerciales, Montréal, Free University, Amsterdam, University of Ghana, Legon, Research(5) (6) (7)
Department, IMF, CERDI, The University of Auvergne, Clermont-Ferrand. The authors form the ISA (Industrial(8)
Surveys in Africa) group which uses multi-country panel data sets to analyse the microeconomics of industrialperformance in Africa.
Key words: firm investment, liquidity constraints, African manufacturing.JEL Classifications: D21, O55, O12.
Correspondence: Dr F J Teal, Centre for the Study of African Economies.E-mail: [email protected].
This paper draws on work undertaken as part of the Regional Programme on Enterprise Development (RPED),organised by the World Bank and funded by the Swedish, French, Belgian, UK, Canadian and Dutch governments.Support of the Dutch and UK governments for workshops of the group is gratefully acknowledged. The use of the dataand the responsibility for the views expressed are the authors’.
Abstract: Firm-level data for the manufacturing sector in Africa, presented in this paper, shows very low levels ofinvestment. A positive effect from profits onto investment is identified in a flexible accelerator specification of theinvestment function controlling for firm fixed effects. There is evidence that this effect is confined to smaller firms. Acomparison with other studies shows that, for such firms, the profit effect is much smaller in Africa than in othercountries. Reasons for the relative insensitivity of investment to profits in African firms are suggested.


Contents
1. Introduction 1
2. The Macroeconomic Background 2
3. Firm Characteristics 6
4. Alternative Specifications for the Investment Function 9
5. The Evidence 12
6. Implications of the Findings 16
7. Summary and Conclusions 18
References 20
Appendices 22


1
1. IntroductionThis paper investigates manufacturing investment in four African countries in which financialmarkets have been heavily controlled. During the 1990s per capita GDP has declined in Africa at1.8% p.a., whereas in other developing areas it has grown by 4.4% (World Bank 1996). Thereis some evidence from growth regressions (King and Levine 1993 and Easterly and Levine 1995)that financial markets are important in the growth process and that their weakness in Africa hascontributed to these outcomes. One route by which financial markets might matter is through thelevel and efficiency of investment. To date, analyses of African investment have typically beenbased upon national aggregate investment rates, whether through time series of particularcountries (for example, Jenkins 1996 and Mlambo and Mhlophe 1995) or international cross-sections (for example, Kumar and Mlambo 1995 and Hadjimichael et al. 1995). Such data sets donot provide the information necessary to assess the links between financial performance and firminvestment.
Policy environments for investment in Africa are changing rapidly as some countries implementstructural adjustment reforms. The present study uses a four-country firm-level panel data set,enabling an assessment to be made of the extent to which differences in investment rates betweenfirms are explained by factors which vary within countries as compared with those which varybetween countries.
The factors on which we focus as determinants of investment are profitability, growth of value-added, past firm borrowing and the size and age of the firm. A positive relationship betweenprofitability and investment has been widely found in both developed and developing countries(Fazzari et al. 1988, Hoshi et al. 1991, Bond and Meghir 1994, Tybout 1983, Athey and Laumas1994 and Harris et al. 1994). If firms have limited access to financial markets, profitability affectsthe capacity to finance investment. The more financially constrained the firm the less able it is toadjust to its desired capital stock. Tybout (1983, p. 600) argues that ‘if the effect of creditrationing is essentially to increase the user cost of capital, rationed firms should exhibit relativelyhigh marginal products of capital in the long run, and they should be relatively sluggish inadjusting their capital stocks to any given gap between actual and desired levels’. In a flexibleaccelerator specification of the investment function the ability of the firm to respond to changesin its desired capital stock is reflected in the positive effect on investment of the growth in value-added. Past firm borrowing may affect present investment adversely if such borrowing increasesthe probability of bankruptcy. Firm size and age may affect investment for several reasons. Bothsize and age may affect access to finance and thus be associated with firm-specific capital costs.Indivisibilities in investment, if investment rates are low, may imply a different pattern in thetiming of investment for firms of different size. The importance of all these factors in determininginvestment in plant and equipment in African manufacturing firms is investigated in this paper inthe context of major changes in their macroeconomic policies.
The structure of the paper is as follows. Section 2 describes the macroeconomic policyenvironments in the four countries. In Section 3 the data on which the results are based isdescribed. Alternative specifications for the investment function are set out in section 4 and theestimation results presented in Section 5. Section 6 provides a comparative review of the findingsin this paper for Africa and those for other countries. Section 7 concludes.
2
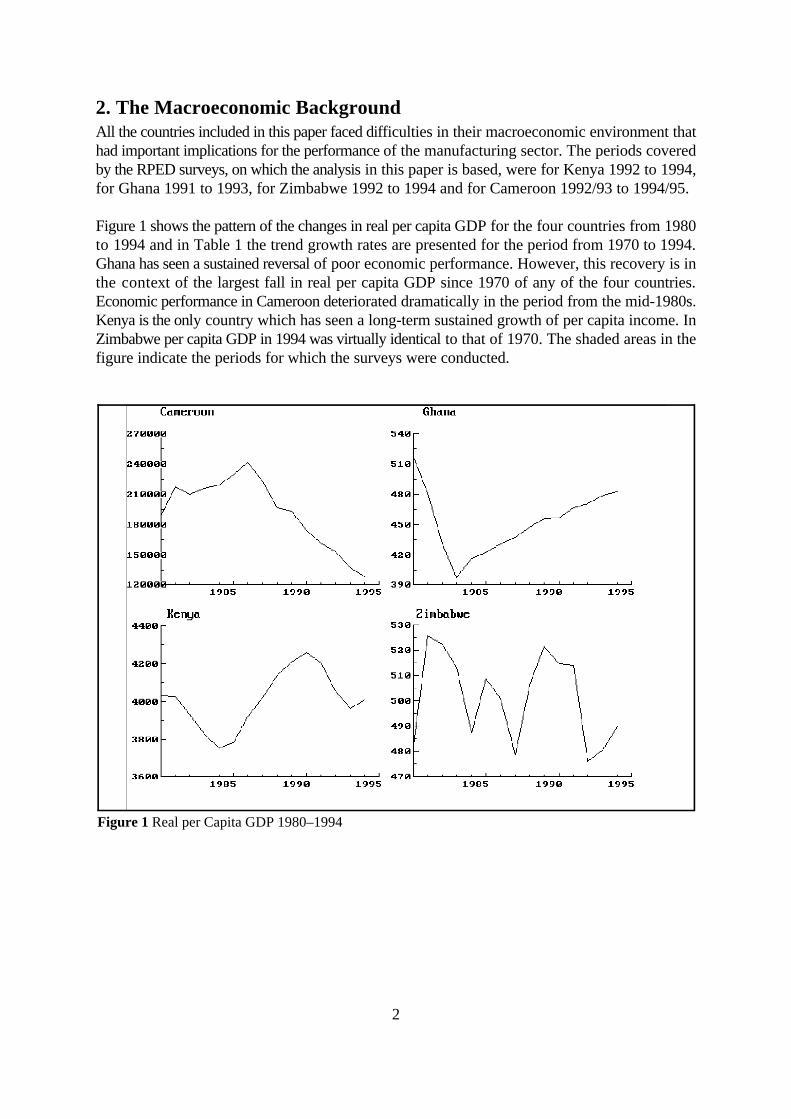
Figure 1 Real per Capita GDP 1980–1994
2. The Macroeconomic BackgroundAll the countries included in this paper faced difficulties in their macroeconomic environment thathad important implications for the performance of the manufacturing sector. The periods coveredby the RPED surveys, on which the analysis in this paper is based, were for Kenya 1992 to 1994,for Ghana 1991 to 1993, for Zimbabwe 1992 to 1994 and for Cameroon 1992/93 to 1994/95.
Figure 1 shows the pattern of the changes in real per capita GDP for the four countries from 1980to 1994 and in Table 1 the trend growth rates are presented for the period from 1970 to 1994.Ghana has seen a sustained reversal of poor economic performance. However, this recovery is inthe context of the largest fall in real per capita GDP since 1970 of any of the four countries.Economic performance in Cameroon deteriorated dramatically in the period from the mid-1980s.Kenya is the only country which has seen a long-term sustained growth of per capita income. InZimbabwe per capita GDP in 1994 was virtually identical to that of 1970. The shaded areas in thefigure indicate the periods for which the surveys were conducted.

3
Table 1 Trend Growth Rates: Real per Capita GDP (% pa)
Period 1970–1994 1970–83 1983–94
Cameroon 1.7 5.7 -5.4Kenya 1.0 2.0 0.7Ghana -1.4 -3.0 1.6Zimbabwe -0.3 -0.6 -0.2
Source for Figure 1 and Table 1: World Bank Tables. The figures were taken from the STARS database.
All the countries have adopted some measures of economic reform in the last decade. Thestructural adjustment programmes adopted by the Ghana government date from 1983. In theperiod from 1983 to 1991 the exchange rate had been liberalised so that, by the start of the surveyperiod (1992), the premium on foreign exchange had been eliminated. In the late 1980s a reformof the financial system had removed a substantial number of non-performing loans from thebanking system and had liberalised interest rates which were substantially positive in real termsover the survey period (see Table 2 below). There may have been a slow-down in growth in theyears covered by the survey but, as can be seen from Table 1, the trend growth over the period1983–94 was far higher than for any of the other countries.
In Kenya the donors temporarily withdrew their support in 1991. This initiated a serious economiccrisis and there were falls in per capita GDP from 1991 to 1993 (Figure 1). Political turmoil andethnic clashes before and after the elections in December 1992 also had serious repercussions onthe economy. There was considerable uncertainty about government policies. Thus 1993, whichis the year at the centre of the survey period, was one of the worst years in post-independenceKenya. By mid-1994 there had been some economic recovery and the per capita growth rate for1994 was positive for the first time in four years (Figure 1).
In both Zimbabwe and Cameroon the period since 1983 has seen trend declines in their per capitaGDP and, in the case of Zimbabwe, this negative trend extends from the 1970s. Both countriesadopted policies of substantial reform in the 1990s.
In Zimbabwe a structural adjustment programme was adopted in 1991. Policy changes initiallyfocused on dismantling the highly restrictive system of import and foreign exchange controls. Thisinvolved substantial exchange rate adjustment, which quickly eliminated much of the parallelmarket premium, and the gradual movement of import categories to an Open General ImportLicence (OGIL) list to which foreign exchange rationing did not apply. By the time of the firstsurvey (June 1993) these reforms had eliminated most of the trade and exchange rate problemswhich firms had faced throughout the 1980s. Zimbabwe was hit by a very serious drought in1991/92, which still affected the surveyed manufacturing firms in 1993, in that demand was stilllow. It subsequently recovered quickly. In the course of the survey period (1993–95) there weretwo important changes. First, competition increased, both from new domestic firms and fromimports. Second, the combination of financial liberalisation and a large fiscal deficit led to sharprises in interest rates (Table 2).
Cameroon experienced by far the largest fall in per capita GDP, of the four countries, in theperiod 1983 to 1994 (Table 1). Between 1986 and 1994 Cameroon’s per capita income fell by

4
nearly 50% (Figure 1). An adverse terms-of-trade shock in 1986, and declines in governmentrevenue, led to the financing of the public deficit with increased external borrowing and arrearsin the private sector. In 1988, an IMF-supported stabilisation package was accepted by thegovernment, followed a year later by the implementation of a World Bank and bilateraldonor-financed Structural Adjustment Programme (SAP). Given the CFA zone’s fixed nominalexchange rate vis-à-vis the French franc, the government had to rely on policy instruments otherthan the exchange rate for adjustment. Despite some major reforms in the business environment(including price and labour deregulation, banking sector reform and tariff reductions), incomecontinued to fall, with little export growth. The inward focus of industry, widespread publiccontrols on economic activity, and the overvalued exchange rate made it impossible for traditionaland non-traditional exporters to expand their sales abroad and compensate for declining oilrevenues. In early 1994, the CFAF was finally devalued by 50% against the French franc, andmeasures of trade and indirect tax reform section were implemented. Since this latest round ofreforms, some positive signals have been registered at the macroeconomic level, in particular thefirst positive increase in per capita GDP since 1986 (Navaretti, Gauthier and Tybout 1996).
Table 2 presents the rates of inflation, the rates of depreciation of the exchange rate and interestrates from 1990 to 1994 for all the countries in this study. The largest nominal depreciation wasin Ghana, the smallest in Cameroon. All four countries have in common high, and highly variable,rates of inflation and exchange rate depreciation. In all four countries real interest rates, measuredsimply as the difference between nominal rates and the rate of inflation, have moved betweensubstantial positive and negative numbers. The level of nominal interest rates has also been highlyvariable; in Kenya doubling, then halving, during the period of the surveys. It is clear that themacroeconomic environment in which the firms worked ensured the potential for substantialuncertainty – uncertainty about the real interest rate they would face, uncertainty about the realexchange rate and uncertainty about the credibility of government policies to maintain incentivesto export. It will be argued that such uncertainty plays a major role in explaining the poorinvestment performance of the firms.

5
Table 2 Rates of Inflation, Exchange Rates and Interest Rates
Rates of Inflation Cameroon Ghana Kenya Zimbabwe(annual average percentages)
1990/91 0 18.1 19.8 23.31991/92 0 10 29.5 42.11992/93 -3 25 45.8 27.61993/94 35.1 25 29.0 22.21994/95 13.9 60 0.8 22.6
1990/95 7.98 25.2 21.6 24.2
Exchange rate Cameroon Ghana Kenya ZimbabweDepreciation(average annual percentage changes in the domestic currency to US$ exchange rate)
1991/92 -6.2 18.8 17.1 48.61992/93 6.9 48.5 80.0 27.11993/94 96.1 47.4 -3.4 25.91994/95 -10.1 25.5 -8.2 6.2
1990/95 12.1 26.1 16.7 25.3
Interest Rates Cameroon Ghana Kenya Zimbabwe(end of year percentages)
1990 11.0 33.0 19.43 10.251991 10.75 20.0 20.27 20.001992 12.00 30.0 20.46 na1993 11.5 35.0 45.50 28.501994 7.75 33.0 21.50 29.501995 8.60 45.0 24.50 29.50
Source: IMF Financial Statistics (various issues). The exchange rate is the period average of the domesticcurrency relative to the US dollar (line rf), the interest rate is the rate at which the monetary authorities lendor discount eligible paper for deposit money banks (line 60).

6
3. Firm CharacteristicsThe sample is drawn from a survey of firms in the manufacturing sectors of Cameroon, Ghana,Kenya and Zimbabwe ranging in size from micro (less than five employees) to those employingover a thousand. For each of the four countries three rounds of interviews were conducted overthe period 1992 to 1995. Appendix A presents the details of the surveys for each country by adetailed size classification. The sample was chosen by sampling from four sectors withinmanufacturing – textile and clothing, wood and furniture, metal working and machinery and foods– and stratifying by size and location. In the regressions reported below we control for, but do notreport, sector effects. The samples over-represent large firms relative to the population. Theaverage size of firms in the samples is smallest in Ghana, at 44 employees, and largest inZimbabwe at 301 employees (Appendix A Table 1). Only in Ghana has the average size of firmsincreased over the survey period (Appendix A Table 2). We wish to use lagged values of thevariables, and to measure the growth rate of value-added, so we lose one wave of the survey foreach country. The sample size for which we have complete information on employment, capitalstock, borrowing and investment is 733. Initial inspection of the data led us to discard 19 of theseobservations as being very sizeable outliers, leaving a sample size of 714. It is this sample whichprovides the basis of the regressions reported in this paper.
Table 3 presents the averages of the variables we wish to explain across the second and thirdrounds of the survey and across the four countries. Investment refers to purchases of plant andequipment; investment in building and land is excluded from the analysis throughout this paper.A striking feature of the data is that close to half the firms carry out no investment in any year.This problem also arose in the analysis of Harris, Schiantarelli and Siregar (1994, p. 43) whoexcluded all firms from their estimation which did not have four consecutive years of non-zeroinvestments. It is clear from Table 3 that there is a pattern by which large firms, while more likelyto invest, invest less than smaller firms when they do invest. Possible explanations for this findingare considered in the next section. In estimating a model for the determinants of investment it willbe of importance to model the decision as to whether to invest, as well as the decision as to howmuch to invest. The means of investment to capital of 12.8 per cent are higher than those reportedin studies for the UK and India (see Table 5). However, such averages are misleading, as can beseen from the distribution of the variables shown in Table 4.

7
Table 3 The Pattern of Firm Investment across Countries and Firm SizeInvestment Proportion Investment/ Investment/ Investment/ Investment/by country of firms Value-added Capital Value-added CapitalMeans investing if firms invest if firms invest
Cameroon1993/94 0.125 0.145 0.479 0.018 0.0591994/95 0.347 0.306 0.382 0.106 0.132
Ghana1992 0.363 0.144 0.428 0.052 0.0901993 0.536 0.249 0.254 0.134 0.136
Kenya1993 0.357 0.146 0.202 0.052 0.0721994 0.459 0.309 0.277 0.142 0.127
Zimbabwe1993 0.621 0.194 0.111 0.121 0.0691994 0.738 0.129 0.193 0.095 0.142
Investmentby firm sizeMeans
Large 0.738 0.173 0.152 0.128 0.113(>=100 employees)Small 0.458 0.234 0.291 0.107 0.134(< 100 employees)
Average 0.535 0.211 0.239 0.113 0.128
It is well known that rates of investment, in general, in African countries have been low. Table 4shows just how low has been investment in the manufacturing sector. The median value forinvestment to value-added, and for investment to the capital stock, in the four countries is closeto zero. The average profit rate shown in Table 4 is very high. This is true for all the countries inthe sample. It is also the case that this variable too has a highly asymmetric distribution in that themean is 198 per cent and the median is 40 per cent. The asymmetry of the distribution of thevariables implies that the medians are a better measure than the means of central tendency. Table4 shows both value-added to capital and the capital to value-added ratios. At the median thecapital to value-added ratio is 1.3. It is lowest in Ghana at 0.728; for the other countries there islittle variation. Formal debts to the banking system (B/K) are negligible for the majority of firmsand the data is wholly consistent with a severely financially constrained regime operating in all thecountries in the survey. Finally, the growth in value-added at the median is negative at -2.1 percent per annum. Only in Ghana is the median growth rate positive.

8
Table 4 Descriptive statistics showing distribution of key variables
Cameroon Ghana Kenya Zimbabwe AllN 117 177 185 235 714
I/K M25 0 0 0 0 0(-1)
M50 0 0.004 0 0.033 0.005M75 0.025 0.138 0.069 0.134 0.110Mean 0.122 0.133 0.119 0.134 0.128
I/V M25 0 0 0 0 0M50 0 0.003 0 0.041 0.007M75 0.028 0.060 0.072 0.117 0.085Mean 0.094 0.129 0.128 0.098 0.113
C/K M25 0.075 0.135 0.082 0.168 0.120M50 0.360 0.707 0.320 0.422 0.403M75 1.431 3.175 1.072 0.862 1.367Mean 1.556 3.696 1.956 0.918 1.980
V/K M25 0.269 0.333 0.205 0.385 0.310M50 0.645 1.373 0.613 0.804 0.759M75 1.909 4.907 1.881 1.696 2.149Mean 2.099 4.974 2.716 1.6098 2.811
)V /K M25 -0.484 -0.343 -0.181 -0.135 -0.231c (-1)
M50 -0.119 0.008 -0.011 -0.011 -0.021M75 0.069 0.442 0.122 0.094 0.143Mean -0.199 0.282 -0.004 -0.155 -0.015
K/V M25 0.524 0.204 0.531 0.589 0.465M50 1.552 0.728 1.630 1.242 1.317M75 3.716 3.001 4.883 2.596 3.222Mean 4.389 3.179 4.402 2.238 3.384
B/K M25 0 0 0 0 0M50 0.007 0 0 0 0M75 0.213 0 0.019 0.100 0.035Mean 0.203 0.029 0.067 0.163 0.112
Mi is the i percentile, N is the number of observations.th
Variable definitions: I/K is investment in plant and equipment to the lagged capital stock, I/V is investment(-1)
to value-added, C/K is the profit rate, V/K is value-added to capital, )V /K is real value-added deflatedc (-1)
by lagged capital, K/V is the capital to value-added ratio and B/K is indebtedness (defined as past formalborrowing) to capital.

9
Table 5 Comparative Data for Europe and India (a)
Belgium France Germany UK UK India(1981–1989) (1983–1986)
Small Large
I/K Mean 0.125 0.11 0.122 0.117 0.087 na na
Median na na na na 0.068 0.08 0.12
C/K Mean 0.178 0.119 0.160 0.134 0.159 na na
Median na na na na 0.141 0.07 0.10
B/K Mean na na na na 0.118 na na
Median na na na na 0.095 na na
(a) The source for the first four columns is Bond, Elston, Mairesse and Mulkay (1997, Table 2). The sourcefor the UK data from 1983–1986 is Bond and Meghir (1994). The Indian data is taken from Athey andLaumas (1994). Size for the Indian firms refers to a measure of market capitalisation so is not directlycomparable to the employment definition used in this and other papers to investigate the size issue.
Table 5 provides comparative data for the UK and India. Compared to both these countries themedian value of investment to capital in all the African countries is low while the profit rate ishigh. In the literature the possibility that own finance is used to fund investment has been linkedto the existence of financial constraints and capital market segmentation.
The extent to which capital markets are segmented and how this segmentation can be modelledhas been extensively investigated in the literature. Athey and Laumas (1994) use panel data onfirms listed on the Indian stock exchange, summarised in Table 5, and find that net profits weremost important for larger firms where size is defined in terms of capital value. Harris, Schiantarelliand Siregar (1994) have panel data for Indonesian firms, and they find that small firms, definedin terms of employment (<100 workers), appear to rely on internal funds more than larger firmsdo. This is also the finding in Tybout (1983). The specifications used in these papers are veryclose. A similar result, derived by a different route, can be found in Nabi (1989), who uses anendogenous switching model to show that firms excluded from the formal capital market relymore on profits for investment. It is this implication that small firms are more likely to befinancially constrained that will be considered in the regressions reported below.
4. Alternative Specifications for the Investment Function In the analyses of investment discussed in the last section all the papers assume that the firm’sobjective is to maximise profits. They differ in the specification chosen, essentially choosing eithera flexible accelerator or proceeding by the use of an Euler equation. In empirical implementationthe latter uses a more general cost of adjustment function than is implied by the flexibleaccelerator model. The papers have in common a valuation function of the form:

10
[1] V (K ) = max {A(K , L , I ) + $ E [V (K )]}t t-1 t t t t+1 t t+1 tt
A (.) is the net revenue function, K is the capital stock, L is labour and I is investment. Thet t t
expectations operator E [.] is conditional on information available at the start of period t.t
The Euler equation approach is adopted by Bond and Meghir (1994) using UK data and byJaramillo et al. (1996) for Ecuadorian firms. They write a net revenue function of the form:
[2] A = [ p F(K ,L ) - w L - G(I , K ) - p I ]t t t t t t t t tI
where F (K,L) is the production function, w is the wage rate, r the discount rate used by the firmand G (I , K) is the cost of adjusting the capital stock, p is the output price and p is the price oft t
I
capital goods. The Euler equation specified in discrete time can be written as:
[3] - (1- *) $ E [ A (K,I) ] = - A (K,I) - A (K,I)tt+1 t I t+1 I t K t
where * is the depreciation rate and $ = 1/(1+r ) is the firms discount factor.tt+1 t
This equation, when extended to allow for imperfect competition and the possibility of debtfinancing of the firm, leads to an estimating equation of the form:
[4] (I/K) = " + " (I/K) - " (I/K) - " (C/K) + " (V/K) + " (B/K) t 0 1 t-1 2 t-1 3 t-1 4 t-1 5 t-12 2
where C/K = (p F - w L)/p K.
In this equation the term V/K controls for imperfect competition and is eliminated from the Eulerequation under perfect competition; otherwise the coefficient on the term is positive. The debtterm in the equation (B/K) controls for non-separability between investment and borrowing and2
is eliminated under Modigliani-Miller debt irrelevance.
The specification in equation [3] specialises to the flexible accelerator form if the cost functiondepends only on investment, it can be shown that
[5] A = r G (I) - G (I) dI/dtK I II
and that such a specification leads directly to the accelerator model of investment
[6] I = $ [K* - K ]t t
where K* is the desired capital stock.
This formulation of the flexible accelerator model was originally due to Eisner and Strotz (1963).If this model is extended to allow for liquidity constraints and the effects of past borrowing thenthe specification is of the following form:
[7] I/K = " + " )V/K + " C/K + " (B/K) (-1) 0 1 (-1) 2 (-1) 3 t-1

11
Bond, Elston, Mairesse and Mulkay (1997) provide a comparison of the effects of functional formby using specifications based on both the Euler equation and the flexible accelerator form for fourEuropean countries: Belgium, France, Germany and the UK. They note that the interpretation ofcash flow or profit terms in equations like [7] is ambiguous: ‘Whilst a significant cash flow effectcould reflect the presence of financial constraints on investment, it is also possible that such termscould be significant in the absence of financial constraints. In the presence of adjustment costs,for example, current investment depends not only on current but also on expected future changesin the desired stock of capital. It is possible that information on cash flow helps to forecast output,for example, in which case such information on cash flow would help to explain investmentspending in such a reduced form model.’ (p. 4)
The implication of the Euler equation, if there are no adjustment costs, is the simple marginalproductivity equation in a static model:
[8] A = dA /dtK I
where A = (F - F dL/dK - w dL/dK) exp(-rt) K K L
A = - p exp(-rt) and A = r p exp(-rt)I t It tI I
implying
[9] F = rk
In such a model the decision to invest depends on the marginal product of capital, F , beingk
greater than the cost of capital r. The case of no adjustment costs is relevant for this paper as somany of the firms in the sample are not investing. The fact of zero investment may reflect eithera wish to disinvest, analysed in Nickell (1978, pp. 55ff), or the effects of uncertainty andirreversibility in ensuring that delaying investment is optimal (Dixit and Pindyck 1994). In thelatter case, the cost of capital term must include an allowance for uncertainty, and in the basicmodels analysed by Dixit and Pindyck (1994) the greater the uncertainty the greater the possiblegains from waiting. The firms in our sample are small so allied to such effects may be theindivisibilities in investment that ensure that small firms invest less often than large ones.
In this paper we seek to go some way towards disentangling these alternative explanations forzero investment by means of two variables which may influence the costs of capital to the firm.The first is the size of firm, measured by its number of employees. If indivisibilities are importantthen larger firms will be more likely to invest. If the cost of capital is being proxied by the size offirm, larger firms having more access to the formal capital market might be expected to face lowerfirm-specific capital costs, then size should affect both the propensity to invest and the amountof investment undertaken. The consequences of Dixit and Pindyck (1994) irreversibility are lessclear-cut. Large firms may have better information but, if they wish to undertake largerinvestments, the irreversibility of the investment may be a greater problem for them. The secondvariable we consider is the age of the firm. Longer-established firms could arguably be thoughtto have access to lower-cost capital and greater experience. If age is proxying cost it should affectboth the decision to invest and the amount of investment undertaken. Of these two variables onlysize can be used in a panel estimation.

12
In the approaches to modelling investment summarised above it is assumed that the firm faces anexogenously given cost of capital, r, and any differences in firm costs are allowed for by using apanel estimation method. It is also possible to embed the flexible accelerator specification in ageneral dynamic framework as is done, for example for the flexible accelerator specification, byTybout (1983).
The general form of the equations which have been used in the literature can now be summarised:
[10] (I/K) = " + " (I/K) - " (I/K) - " (C/K) + " (V/K) + " (B/K)t 0 1 t-1 2 t-1 3 t-1 4 t-1 5 t-12 2
+ d + 0 + vt i it
[11] (I/K ) = " + " (I/K ) + " )V/K + " (C/K) + " (B/K)t-1 0 1 t-1 t-1 2 (-1) 3 t-1 5 t-1
+ d + 0 + vt i it
where d is a time dummy, 0 is an unobserved firm-specific effect and v is an error term. t i it
Bond, Elston, Mairesse and Mulkay (1997) provide a comparison of the effects of alternativefunctional forms by using both these equations on a common set of data. We will draw on theirfindings in the comparison between the results for this paper and others in section 6 below.
The importance of the factors discussed above – profitability, the growth of value-added,borrowing, firm size and age – in the determination of investment is taken up in the next section.We adopt a flexible accelerator approach to modelling investment as the length of the panel, threeyears, is short, and the problems of bias identified by Nickell (1981) would be likely to be veryserious if we sought to obtain panel estimates of equation [10]. We also confine attention toequations without a lagged dependent variable.
5. The EvidenceIn this section we examine how far the alternative variables in the investment function can explainboth the decision to invest and the amount of investment undertaken in the four countries. InTable 6 column (1) a logit for the decision to invest is presented. The accelerator specification,modified by liquidity effects, suggests that the change in value-added, borrowing and the profitrate will enter the function. The argument presented in the last section is that both firm size andfirm age may influence the decision to invest, insofar as they reflect indivisibilities, uncertainty andfirm-specific capital costs. All the variables, except the change in value-added, enter thespecification with a lag. Table 6 columns (2) and (3) report the equation for the amount ofinvestment undertaken, if a firm invests. Column (2) makes no allowance for selectivity whilecolumn (3) does. If the factors which determine the decision to invest and the amount ofinvestment are the same then the correct specification is the Tobit which is reported in Column(4). The choice of a logit estimator is motivated, in part, by our wish to allow for firm fixedeffects which will be reported below.
As Table 6 column (1) shows, both the size of firm and its age are highly significant determinantsof the decision whether to invest. Larger firms are much more likely to invest and older firmsmuch less likely. However, neither of these factors determines the amount of investment. In termsof the discussion in the previous section these results suggest that it is indivisibilities anduncertainty, rather than the cost of capital to the firm, that are being proxied by these variables.

13
Such an interpretation is strengthened by an examination of the Tobit which is clearly a mis-specification. The normality test based on the tests proposed by Pagan and Vella (1989) decisivelyrejects the validity of the assumption. Thus both in terms of its economic interpretation and itsstatistical properties the Tobit must be rejected.
Table 7 reports the same specification as that in Table 6 but allows for firm fixed effects in theinvestment decision by means of a panel Logit and for firm fixed effects in the amount ofinvestment by means of a differenced estimator. In Table 7 columns (2)–(4) the sample isrestricted to firms which change investment. Table 7 column (1) shows that the effect of allowingfor firm fixed effect in the logit is to eliminate the significance of the size effect and to reduce thesize of the profit coefficient. In Table 7 column (2) we report a fixed effect estimator for the firmswhich change their investment for the two periods for which we have data. In comparing thisresult with that in Table 6 column (2), the profit rate term doubles in size and there is little changein the standard error. This result would seem to confirm the importance of firm fixed effects whichare biasing down this coefficient. Table 7 columns (3) and (4) then report on a decomposition ofthis result between large (>=100 employees) and small (<100 employees) firms. There is noevidence for a profit effect in larger firms for any of the countries in the sample. The test forpooling reported in Table 7 confirms that, for small firms, the coefficient on the profit term differsacross the four countries. The highest coefficient is for Zimbabwe at 0.12, the lowest is for Ghanaat 0.02.

14
Table 6InvestmentequationsPooled estimates if any selectivity(a) selectivity (a)
Logit Investment/ Investment/ Tobit(INVDUM=0 if Capital Capital no investment, 1 No allowance for Allowing for
investment)
(-1) (-1)
(1) (2) (3) (4)
Constant -0.41 0.40 0.28 -0.09[0.93] [2.89] [0.75] [0.78]
)Value-added/ 0.03 0.008 0.01 0.01Capital [1.31] [0.74] [1.08] [2.2](-1)
Profit 0.04 0.03 0.03 0.03Rate [2.2] [3.23] [5.03] [7.35](-1)
Ln (Size) 0.45 -0.04 -0.02 0.06(-1)
[5.48] [1.85] [0.28] [2.97]
Firm Age -0.02 -0.002 -0.003 -0.006 (-1)
[2.94] [1.76] [0.99] [3.34]
(Borrowing/ -0.41 0.03 0.01 -0.05Capital) [1.78] [0.64] [0.17] [0.84](-1)
Ghana -0.74 -0.10 -0.13 -0.18[2.96] [1.37] [1.21] [2.97]
Kenya -1.03 0.04 -0.01 -0.16 [4.34] [0.6] [0.06] [2.64]
Cameroon -1.94 0.11 0.02 -0.30 [6.58] [1.23] [0.08] [4.02]
Lamda / 0.13 0.50F [0.36] [26.2]
N 714 382 382 714
Ln (Likelihood) -424.92 -466.92
P (df) test for 540.582
normality (2)
P (df) for 111.5 (173)2
heteroscedasticity p=0.99
Adjusted R 0.17 0.172
The figures in [ ] brackets are t statistics.(a) The standard errors have been corrected for heteroscedasticity by the method due to White (1980).

15
Table 7InvestmentequationsFixed effects if anyestimates investment) (a)
Panel Logit Dependent variable Investment/Capital (INVDUM=0 if if DINVDUM = 1 Differenced specification (b)no investment, 1
(-1)
All firms (c) Small firms Large firms< 100 employees >= 100(c) employees (c)
(1) (2) (3) (4)
Constant -0.09 -0.10 -0.12[0.82] [0.77] [0.84]
)Value-added/ -0.02 0.023 0.029 -0.18Capital [0.10] [1.28] [1.50] [2.38](-1)
Profit 0.01 0.069 0.072 -0.05Rate [0.12] [2.94] [3.08] [1.24](-1)
Ln (Size) -0.40 0.026 0.017 -0.22(-1)
[0.71] [0.21] [0.12] [1.47]
(Borrowing/ -0.27 0.002 -0.036 -0.003Capital) [0.46] [0.02] [0.32] [0.02](-1)
P (df) Wald 23.6 (3) 19.4 (3) 2.41 (3)2
Statistic test (d) p=0.000 p=0.000 p=0.49
P (df) for 28.1 (29) 20 (29) 52.8 (28)2
heteroscedasticity p=0.51 p=0.88 p=0.003
Log likelihood -64.43
N 594 211 144 67
Adjusted R 0.21 0.25 0.042
The figures in [ ] brackets are t statistics.(a) The panel logit estimator is due to Chamberlain (1980). The results reported here are from theestimator as programmed in LIMDEP (Greene 1995).(b) DINVDUM measures if there is a change in investment. The sample is restricted to those firmswhich change their investment levels between the two periods. (c) The standard errors are robust to heteroscedasticity. The standard errors reported are the robuststatistics calculated by the DPD programme (Arellano and Bond 1988) . (d) This is a test for a common set of coefficients on the profit term across countries. Countrydummies were included in this equation but they were not significant.
The specification reported in Tables 6 and 7 is similar to that chosen by Tybout (1983), Harris,Schiantarelli and Siregar (1994) and Athey and Laumas (1994). The results reported show thatsimilar effects to those observed in other data sets can be found in this African study. However,it is not simply the existence of a profit effect that is of importance but its size, both across firmsof different size and across countries. How the results reported in Tables 6 and 7 compare withother studies is shown in Table 8 and discussed in the next section.

16
6. Implications of the FindingsSection 2 presented the macroeconomic background of the countries used in the sample in thispaper. The country that has experienced the largest sustained rise in per capita income in therecent past is Ghana. This may be an important factor in explaining the relative success of Ghanain the sample. Only in Ghana was the median growth in value-added positive for themanufacturing sector. Only in Ghana did the average size of firms, measured in terms ofemployment, increase over the three waves of the survey. The propensity for firms to invest issignificantly higher in Ghana than in Kenya and Cameroon (see Table 6). While the relativelyfavourable macroeconomic environment in Ghana may have helped smaller firms to carry outsome investment the gain was limited. As we stressed above, averages are misleading and in termsof median rates of investment Zimbabwe is, at 3.3 per cent, far higher than any of the othercountries. It is this very poor performance of the best performer which is indicative of themagnitude of the problems faced by firms in Africa’s manufacturing sector. Why are theseinvestment rates so low?
A common factor across all the four African countries in our sample is a poor macroeconomicpolicy environment: high and variable rates of inflation, rapid and variable rates of exchange ratedepreciation in Kenya, Ghana and Zimbabwe; a large devaluation in Cameroon that was widelyanticipated and contentious as a policy option. In cross-section studies there is evidence that thequality of the macroeconomic environment is of importance for growth. The evidence presentedhere is indirect, but entirely consistent with this cross-section evidence. The most persuasivefactor suggesting that high risk plays a very important part in the problems facing firms in Africa’smanufacturing sector is the very high profit rates shown across all the countries. It is importantto stress that these are average rates of return; marginal rates are likely to be much lower. Thehigh rate of return required on investment in Africa suggests that the cost of capital, in terms ofthe firm-specific discount required to justify investment, is very high. This micro finding isconsistent with other evidence. Bhattacharya, Montiel and Sharma (1996) find that the return onforeign investment in Africa over the period 1990 to 1994 is around 60 per cent higher than inother developing countries, in the range of 24–30 per cent, as against 16–18 per cent. They alsofind that these high returns do not generate high rates of investment: in 1995 flows to Africa(excluding South Africa) were only US$2 billion, less than 2 per cent of all flows to developingcountries and less than half those to the next lowest region, the Middle East.
The most common reason advanced for low levels of investment, particularly among small firms,is that they are financially constrained. We noted above that most studies have found that smallerfirms respond more to profits than do larger firms. It seems useful, as the average size of firmsin the sample is so small, to compare the results for this study with others. Table 8 presents sucha comparison.

17
Table 8 Profits and Investment: An International ComparisonThe coefficient reported in this table shows the effect on investment of a $US 1 increase in profits
Study All firms Large Firms Small firms
Bond and Meghir (1994, 0.18 na naTable 2, column (ii)) (a)
Athey and Laumas (1994, 0.12 na naTable 3) (b)
Tybout (1983, Table 1) (c) na 0 0.429
Harris, Schiantarelli and na 0.056 0.65Siregar (1994, Table, column (2)) (d)
Bond, Elston, Mairesse and Mulkay (1997) (e)Accelerator ModelBelgium 0.13France 0.14Germany 0.38UK 0.61
Euler EquationBelgium 0.01France 0.07Germany 0.04UK 0.29
This study (Table 7) 0.069 0.0 0.072
Notes(a) The dependent variable in Bond and Meghir is I/K and there are linear and non-linear lagged dependentterms. The figure shown is the long-run result calculated at the means of the sample. Bond and Meghirinvestigate the effect of different financial regimes but do not focus on size defined by employment.(b) Athey and Laumas report results for large and small firms but these are defined in terms of capitalisationand are thus not directly comparable with the other studies. Large firms as defined in their sample have largerprofit effects than small firms.(c) Small firms are those with between 10 and 199 employees, large firms are those with at least 200employees (p. 603).(d) Harris, Schiantarelli and Siregar defined small firms as those employing fewer than 100 workers, largefirms employ more than 100 (p. 37).(e) Bond, Elston, Mairesse and Mulkay report comparative results for the flexible accelerator and EulerEquations using a method of moments first differenced estimator in which the instruments used are laggedtwo periods. The data summarised is taken from their tables 4 and 6.(e) ‘Small’ is firms with less than 100, large is firms with more than 100 employees. A finer division wastried identifying firms with from 20–100 employees separately but there was no difference between suchfirms and those employing less than 20.
The comparison presented in Table 8 shows that the profit effect is much less for the firms in our

18
sample than that found in most comparable studies. The profit coefficient for all firms is one-thirdthat found by Bond and Meghir (1994) and half that found by Athey and Laumas (1994).Considering small firms where ‘small’ is defined as employing less than 100, the coefficient of0.072 compares with 0.429 in Tybout (1983) and 0.65 in Harris, Schiantarelli and Siregar (1994).While Bond and Meghir (1994) use the Euler equation approach the other studies use a verysimilar specification to that of this paper. The paper by Bond, Elston, Mairesse and Mulkay(1997) is particularly relevant as it compares the accelerator and Euler equation approaches onthe same data. Their findings are reproduced in the lower part of Table 8. For all four of theEuropean countries in their study the Euler equation approach produced a lower coefficient onthe profit term than the accelerator model. Their result strongly suggests that our low coefficienton the profit term does not result from our choice of an accelerator, rather than Euler equation,specification. The comparative data presented in Table 8 strongly suggests that the reasons forthe low levels of investment in Africa are not to be sought in the financial constraints that firmsface. Most firms in the sample could invest more, by the use of internal funds, than they do. Thereasons for such low investment rates must be sought elsewhere in the causes of the high risks andassociated high capital costs.
7. Summary and ConclusionsThe low levels of investment in sub-Saharan Africa have been widely recognised to be animportant policy problem. In this paper firm-level evidence has been reported for investment inplant and equipment in the manufacturing sector for four countries: Cameroon, Ghana, Kenya andZimbabwe. The median rate of investment across the four countries is close to zero. These lowinvestment rates are associated with high profit rates and low rates of growth of value-added.
The low rate of value-added growth from the micro data is reflected in the macroeconomicperformances of the economies. Only Kenya has seen a long-run, sustained per capita incomegrowth over the last twenty years, and that has been modest. All the countries have experiencedhigh and variable rates of inflation, and large changes in nominal interest, and exchange, rates.There is evidence from macroeconomic studies that such instability has adverse effects on growthand investment.
In order to understand the reasons for the low investment rates in the firms in the countriessurveyed, we have estimated a model of both the decision to invest and the amount of investmentundertaken. In doing so we have been able to use the panel dimension of the data to allow for firmfixed effects. The most robust result to emerge from both the cross-section and fixed effectsestimates is that firm profits play a significant part in investment decisions. The cross-section datasuggests that large firms are more likely to undertake some investment in any years but, given theyinvest, undertake less. This evidence is consistent with investment decisions for the firms beingaffected by indivisibilities, rather than the cost of capital being lower for the larger firms. Olderfirms are less likely to invest, which again suggests that factors other than firm-specific costs ofcapital are important in determining investment. The results reported in Table 7 allow for firmfixed effects and show a highly significant positive profit effect onto investment for small firms,which is about twice the coefficient found in the cross-section data. This coefficient differs acrossthe countries in the sample ranging from 0.12 in Zimbabwe to 0.02 in Ghana. The average valueacross all the countries is 0.072.
We have compared these results with those available for other countries. Where a direct

19
comparison for small firms is possible the coefficient found in this study is substantially lower thanthat in comparable studies. In this paper we have used a flexible accelerator specification.Research using data from European countries finds that an Euler equation approach produces amuch smaller coefficient on the profit term in investment equations than the use of the flexibleaccelerator specification. This suggests that our result may be an upper estimate of the size of theprofit coefficient. The African data reported in this paper differs radically from all the comparablestudies in the combination of very low levels of investment and high profit rates.
The conclusion we would draw is that, while the evidence is consistent with small firms beingfinancially constrained, the most important factor adversely affecting investment is the high capitalcosts facing the firms, which are reflected in their high profit rates. Macroeconomic studies reportan adverse effect of instability on investment. The micro evidence presented here is entirelyconsistent with such findings. High capital cost, associated with uncertainty and high risk,constrains investment, not the availability of finance to the firms.

20
References
Athey, M.J. and P.S. Laumas (1994), ‘Internal funds and corporate investment in India’, Journalof Development Economics, 45, 287–303.Arellano, M. and S. Bond (1988), Dynamic Panel Data Estimation Using DPD – A guide forusers, September.Bhattscharya, A., P.J. Montiel and S. Sharma (1996), ‘Private capital flows to sub-SaharanAfrica: an overview of trends and determinants’, mimeo, Research Department, InternationalMonetary Fund.Bond, S., J. Elston, J. Mairesse and B. Mulkay (1997), ‘Financial factors and investment inBelgium, France, Germany and the UK: a comparison using company panel data’, NBERWorking Paper No. 5900.Bond, S. and C. Meghir (1994), ‘Dynamic investment models and the firm’s financial policy’,Review of Economic Studies, Vol. 61, pp. 197–222.Chamberlain, G. (1980), ‘Analysis of covariance with qualitative data’, Review of EconomicStudies, 47, pp. 225–238.Dixit, A.K. and R.S. Pindyck (1994), Investment under Uncertainty, Princeton University Press.Easterly, W. and R. Levine (1995), ‘Africa’s growth tragedy’, mimeo, World Bank.Eisner, R. and R.H. Strotz (1963), ‘Determinants of business investment’, in Impacts of MonetaryPolicy, A series of research studies prepared for the Commission on Money and Credit, Prentice-Hall, Englewood Cliffs, NJ, 60–233.Fazzari, S.M., R.G. Hubbard and B. Peterson (1988), ‘Financing constraints and corporateinvestment’, in Brookings Papers on Economic Activity, pp. 141–95.Greene, W.H. (1995), LIMDEP Version 7: User’s Manual and Reference Guide, EconometricSoftware, Inc.Hadjimichael, M.T., D. Ghura, M. Muehleisen, R. Nord and E.M. Ucer (1995), Sub-SaharanAfrica: Growth, Savings, and Investment, 1986–93 International Monetary Fund, OccasionalPaper 118, Washington, DC.Harris, J.R., F. Schiantarelli and M.G. Siregar (1994), ‘The effects of financial liberalisation onthe capital structure and investment decisions of Indonesian manufacturing establishments’, TheWorld Bank Economic Review, 8, 17–47.Hoshi, T., A.K. Kashyap and D. Scharfstein (1991), ‘Corporate structure, liquidity andinvestment: evidence from Japanese industrial groups’, Quarterly Journal of Economics, 106:33–60.Jaramillo, F., F. Schiantarelli and A.Weiss (1996), ‘Capital market imperfections before and afterfinancial liberalisation: an Euler equation approach to panel data for Ecuadorian firms’, Journalof Development Economics, 51, 376–386.Jenkins, C. (1998), ‘Determinants of private investment in Zimbabwe’, Journal of AfricanEconomies, Vol. 7, no. 1.King, R.G. and R. Levine (1993), ‘Finance, entrepreneurship and growth: theory and evidence’,Journal of Monetary Economics, 32, pp. 513–42Kumar, M.S. and K. Mlambo (1995), ‘Determinants of private investment in sub-Saharan Africa:an empirical investigation’, paper presented to the International Economics AssociationConference, Tunis, December.Mlambo, K. and M.C. Mhlophe (1995), ‘Investment behaviour under uncertainty: an analysis ofthe determinants of investment in Zimbabwe’, African Economic Research Centre, Nairobi.Nabi, I. (1989), ‘Investment in segmented capital markets’, The Quarterly Journal of Economics,

21
104, 453–462.Navaretti, G.B., B. Gauthier and J. Tybout (1996), ‘Industrial enterprises response to thedevaluation in Cameroon’, Centro Studi Luca d’Agliano, Development Studies Working Papers,QEH, Oxford.Nickell, S.J. (1978), The Investment Decisions of Firms, Cambridge University Press.Nickell, S.J. (1981), ‘Biases in dynamic models with fixed effects’, Econometrica, 49, 1399–1416.Pagan, A. and F. Vella (1989), ‘Diagnostic testing using individual data’, Journal of AppliedEconometrics, Supplement, S29–S60.Tybout, J.R. (1983), ‘Credit rationing and investment behavior in a developing country’, Reviewof Economics and Statistics, 65, 598–607.White, H. (1980), ‘A heteroscedasticity-consistent covariance matrix estimator and a direct testfor heteroscedasticity’, Econometrica, 48, 817–838.World Bank (1996), World Development Report, Oxford University Press for the World Bank.

22
Appendices
Appendix A Table 1 Details of the Sample by Firm Size
Cameroon Ghana Kenya ZimbabweAll
Large Mean 419 223 327 552 446>100 employees N 71 49 104 240 464
Std 594 127 396 708 602
Medium Mean 53 49 54 63 55> 20 employees N 103 83 136 102 424<= 100 employees Std 19 16 16 19 18
Small Mean 14 15 13 14 14<=20 employees N 152 219 145 97 613> 5 employees Std 6 7 7 7 7
Micro Mean 4 4 3 4 3<= 5 employees N 53 69 111 27 260
Std 1 1 3 4 1
All Mean 99 44 88 301 136N 379 420 496 466 1761Std 299 80 219 570 361
Appendix A Table 2 Average Employment Size of Firms across the Three Rounds of the Survey
Cameroon Ghana Kenya ZimbabweAll
N 58 90 80 111 339
Round 1 Mean 95 39 93 305 148Std 207 81 215 503 338
Round 2 Mean 91 41 76 302 143Std 206 75 106 479 314
Round 3 Mean 92 45 75 301 144Std 215 81 106 485 318
N is the number of observations, Std is the standard deviation.

23
Appendix B Variable Definitions
I/K is investment to lagged capital.(-1)
‘Investment’ in this paper refers to investment in plant and equipment. Investments in land and building areexcluded. The capital stock takes the reported value of the capital stock in the first round of the survey andaggregates by the value of investment to create the capital stock for rounds 2 and 3.
We experimented with a variety of depreciation rates and also with using the reported values of the capitalstock. The use of alternative depreciation rates made no difference to the results. There is some evidence thatthe reported values perform better than the calculated values in the levels specification. However, in thedifferenced specifications, which are central for the method we have chosen to allow for firm fixed effects,it is clear that measuring the change in the capital stock by the level of investment produces much better-defined statistical results than using the changes in the reported values of the capital stock.
I/V is investment to value-added.The measure of output used in this paper is value-added. Value-added was calculated from data on output,sales, material costs, defined as the raw materials inputs used in producing output and indirect costs. Adetailed list of indirect costs was specified in the questionnaire.
C/K is the profit rate.Profits are measured as value-added less wages less interest payments. This differs slightly from thediscussion in section 4 above. The exclusion of interest payments from the definition of the profit rate madeno difference to the results.
V/K is value-added to capital.This is the ratio of value-added to capital as already defined.
)V /K is real value-added deflated by lagged capital.c (-1)
This variable is the change in the real value of value-added, defined as value-added deflated by the consumerprice index, divided by the real value of capital of the previous period, defined as capital stock deflated bythe consumer price index. The rationale for this procedure is as follows. The rate of inflation has variedwidely across both countries and time. This means that changes in the real value of value-added cannot besimply picked up by the dummy terms in the regressions. We have limited price information common acrossall four countries so we have attempted to allow at least for differential aggregative changes in the price levelby deflating both value-added and the capital stock by the CPI.
B/K is indebtedness (measured by past formal borrowing) to the value of the capital stock.Formal borrowing was identified separately in the questionnaire and include borrowing from banks and otherformal institutions.
Employment is defined to be the total number of employees in the firm. There is no distinction betweencasuals or part-time workers. The number of part-time workers identified in the surveys is small.

24