Investing in Infrastructure Fundsprobitaspartners.com/pdfs/infrastructure.pdf · infrastructure...
40
Investing in Infrastructure Funds September 2007 © Probitas Partners
Transcript of Investing in Infrastructure Fundsprobitaspartners.com/pdfs/infrastructure.pdf · infrastructure...

Investing in Infrastructure FundsSeptember 2007
© Probitas Partners

Contents
introduction .................................................................................. 1
institutional infrastructure investing ....................................... 2Public-Private Partnerships ..................................................................... 2Case Study: The Example of the United Kingdom ........................................... 6Risk-Return Spectrum; Definitions ............................................................ 8
institutional portfolio considerations ....................................... 10The Motivation to Invest ........................................................................ 10The Issue of Portfolio “Fit” ..................................................................... 10Benchmarking .................................................................................... 11
fund investment considerations ................................................... 12Fund Duration ................................................................................... 12Liquidity .......................................................................................... 13Available Fund Manager Capabilities ......................................................... 14The Importance of Co-Investment in Infrastructure Investments ............................ 15The Influence of Organized Labor in Infrastructure Investing ............................... 16Infrastructure Fund Landscape ................................................................. 17
investor survey & interview results ............................................. 19Survey Findings: Overview ..................................................................... 19Profile of Respondents ........................................................................... 20For Those Not Investing ......................................................................... 31
conclusion ...................................................................................... 32
appendix: selected third party infrastructure funds ................. 33

ForewordProbitas Partners is an independent provider of integrated, alternative investment solutions to the institutional market. It offers an array of customized services that include placement of private equity funds, and investment and liquidity management. These services are offered by a team of professionals dedicated to leveraging the firm’s vast knowledge and technical resources to provide the best results for its clients.
On an ongoing basis, Probitas Partners offers investment tools and research on the alternative investment market as aids to its institutional investor and general partner clients. Accurate data is elusive in private markets. Probitas Partners strives to improve the quality of information via original research, compiling data from various trade and other sources and then vetting, analyzing and enhancing that data by applying its team’s experience and broad knowledge of the market.

1 investing in infrastructure funds
introduction
infrastructure investing has become an increasing area of focus among institutional investors and among state and municipal
governments that are likely to be future sources of infrastructure deal flow.
Many of the largest institutional investors in the United States have found
it pressing to study the space, establish an allocation and create staffing to
become active in the sector; many seek to have allocations in place by the
Fall, from a dead start less than a year ago.
At the same time, a growing number of European institutions are following their local colleagues who were early adopters of infrastructure investing, and setting up programs, though not at the frenetic pace seen in the U.S.
The U.S. market in particular is the scene of increased investor interest and great expectations for new investment opportunities. Strained public debt markets and a growing urgency to address new and deferred infrastructure needs have caused public entities to seek third-party capital for a growing universe of infrastructure projects. Recent events like the tragic bridge collapse in Minneapolis have further focused urgency to address infrastructure deficiencies in the U.S., but it is still early days. Relatively few private-investment transactions have occurred in the U.S. compared with markets like the United Kingdom (“U.K.”), Australia, Canada, Continental Europe, and more recently, the Middle East and Asia. As of a year ago, most U.S. institutions hadn’t given much thought about infrastructure as a discrete allocation in their portfolio, or even as a sub-allocation within their private equity or real estate portfolios.
For most institutional investors, infrastructure investing remains in a state of flux as it shifts from being a niche sector to become a full-blown, independent asset class. In the midst of this transition a full set of investment “best practices” has yet to develop. Long-standing and new investors continue to evaluate offerings against their existing portfolios, direct and Co-Investment objectives, and their somewhat conflicting interests in near-term liquidity and long-term exposure to these longer-lived assets.
There are a number of informative studies available in the market today that present the basics of the infrastructure market. We would suggest Deloitte’s Closing the American Infrastructure Gap: The Role of Public-Private Partnerships. Relatively little, however, has been written about the issues institutional investors face in integrating private funds focused on infrastructure investing into their portfolios. That is the topic of this white paper.
the U.s. market in particular is the scene of increased investor interest and great expectations for new investment opportunities.

2 investing in infrastructure funds
institutional infrastructure investing Public-Private PartnershiPs
The world’s glaring infrastructure deficit manifests itself in the obvious need for new facilities, and, in developed countries such as the U.S., in decaying public transit systems and recreational facilities, dilapidated bridges, deteriorated schools and hospitals, and outmoded waste treatment facilities. Many factors contribute to the current deficiencies in infrastructure including age, economic and population growth, and perhaps most importantly, the fiscal impact of unfunded entitlements. The deficient condition and absolute limitations of many public infrastructure facilities imposes a great productivity cost on society. The need to repair and expand these facilities or build new systems and improve outcomes is obvious to everyone. The question is: how will government pay for the necessary new facilities and fixes to existing facilities?
Historically, governments around the world have shouldered the burden of infrastructure finance through a variety of public-financing structures, usually offset by pay-as-you-go user fees on the affected facilities or by taxes. However, stretched public finance capacities, together with recognized limitations on the public sector’s ability to effectively deliver projects and provide operations and maintenance support for those facilities post-completion, have created a growing trend that involves governments turning to the private sector for the Design, Build, Finance and Operate elements (“DBFO”) of infrastructure projects. These collaborations, broadly known as public-private partnerships (“PPPs”), have emerged as one of the most important models governments use to close the infrastructure-funding gap and improve productivity and service performance outcomes for infrastructure.
The U.K. pioneered this trend and serves as the most advanced model for other governments, infrastructure funds, operating companies, and investors seeking to understand the inroads PPPs can make into a country’s infrastructure capacity. PPPs now represent between 10% and 15% of all U.K. investments in public infrastructure. This trend has been mirrored in other countries: in India, $35.5 billion is slated for investment in PPPs to upgrade highway systems over the next six years. Japan has 20 new PPP projects in the pipeline. In many countries in the European Union, PPP deal volume is quadrupling year-over-year (with the most advanced growth seen in the emerging democracies of Central Europe). In the Western Hemisphere, 20% of all new infrastructure transactions in British Columbia are now designed, built, financed and operated by the private sector.
PPPs are likely to have very different adoption and success rates region-by-region. Many factors play a role in PPP development, including local geography and political climate, the sophistication of government entities and capital markets, the forces driving formation of partnerships, and the factors enabling their creation. Some governments that should still be at the first stage of PPP development (i.e., designing the partnership policy and legislative framework, defining the procurements and contracts, and building the marketplace for private sector bidding) are leap-frogging to the execution phase of PPPs. Prudent governments who are late adopters of the PPP model should look to earlier adopters (e.g., the U.K, Australia, Canada, Ireland, the Netherlands) for the proper ways to successfully convert specific components of public infrastructure to a PPP model. The U.S. has been slowly moving in the direction of employing private financing for infrastructure: more than half the states have passed PPP-enabling legislation in recent years, and huge PPP projects are underway or planned in California, Texas, Florida, and other states across the U.S.
the question is: how will government pay for the necessary new facilities and fixes to existing facilities?

3 investing in infrastructure funds
benefits of PPPs
PPPs provide several benefits for nations that choose to utilize them as a means to solve infrastructure deficits and enhance public service delivery:
n Financing responsibility PPPs provide new sources of capital for public infrastruc-ture projects. Private equity, pension funds, and other sources of private financing can be used to shift the responsibility of arranging financing from the shoulders of the public entity if it is unwilling or unable to assume the full funding or operational risk of a project.
n bringing construction Forward PPPs enable the public sector to spread the cost of infrastructure investment over the lifetime of an asset inclusive of the development, construction and operating phases of an asset.
n On-time and On-budget Because of the alignment of incentives between the source and recipient of funds, PPPs have a solid track record of completing construction on time or even ahead of schedule, and at or under budget, in stark contrast to the completion history of pure public projects.
n shifting risk to the Private sector Well-designed PPPs transfer DBFO risks to the private sector, insulating the long-term infrastructure plans from a wide range of potential risks.
n cost savings Historical experience with PPP methods around the world have demonstrated a 15% to 30% life cycle cost savings, 75% that occur in the design build and 25% in the operations phase of the life cycle of an infrastructure asset.
n stronger customer service Orientation Private sector providers, often relying on fees from customers for revenues, have a strong incentive to focus on providing superior customer service. Moreover, as the asset is no longer managed by the public sector, the public sector partner is able to use its staff resources to ensure the private provider maintains certain customer service levels via measurable incentive schemes.
n Focus on Outcomes When properly structured, PPPs allow governments to focus leadership attention on the outcome-based public value they are trying to create, rather than on the physical assets it will take to obtain that value (e.g., a government can focus on education instead of the minutiae of building and operating school facilities). Effective PPP implementation results in better outcomes.
common PPP Problems & solutions
There are several common pitfalls that affect nascent PPP programs, generally falling into these major categories:
n Poor Planning and Prioritization The success or failure of PPPs can often be traced back to the initial design of PPP programs (policies, legislation, and guidance).
n inappropriate risk Model A common mistake is transferring demand risk in a project to the private partner when the private contractor has no control over demand factors.
When properly structured, PPPs allow governments to focus leadership attention on the outcome-based public value they are trying to create, rather than on the physical assets it will take to obtain that value.

4 investing in infrastructure funds
n lack of internal staff capacity The sponsoring government or private-sector entity must dedicate sufficient staff to properly monitor contract performance for a project.
n Failure to realize value for Money
n inadequate capacity Planning
These problems can generally be addressed through a combination of several strategies:
n apply Full life-cycle approach Governments need a full life-cycle approach for partnerships that confer adequate attention to all phases of a PPP.
n understand risk shifting structures Governments need to develop a strong understanding of innovation in PPP models that are designed to alleviate specific types of complex risk in conditions of increasing uncertainty.
n apply PPP to the “right” Projects PPP transactions should be used primarily to unlock the value from undervalued and underutilized assets or improve the quality of facilities and services, freeing up funds for infrastructure assets that are not as well suited to PPP-type transactions.
sector Opportunities & challenges
The map presented below (Figure 1) summarizes macro infrastructure demand globally, illustrating the need for governments around the world to pursue PPPs as a means of funding the large and growing demand for infrastructure capital.
Figure 1. Macro infrastructure needs Globally
sources: World Bank, American Society of Civil Engineers, ProjectFinance, A&L Goodbody Consulting, RailPage Australia, Business New Zealand, Government of IndiaMap from Deloitte Research: Closing the Infrastructure Gap
Canada Plugging Canada’s infrastructure gap requires an investment of six to ten times the level of current annual government infrastructure spending. Canada’s local governments alone face a $60 billion annual infrastructure deficit — a number growing at a rate of $2 billion a year. Investment needs for urban roads and bridges are $66 billion over 10 years.
Europe The infrastructure needs for the European Union run into trillions of dollars. The energy sector alone requires $1.2 trillion over the next 20 years. Approximately $90 billion is needed for infrastructure investment in Germany alone this year.
United States The U.S. infrastructure deficit totals $40 billion a year in the roads sector alone. Overall, the American Society of Civil Engineers estimates total U.S. infrastructure investment needs over the next five years to be $1.6 trillion — an amount equivalent to Italy’s GDP in 2004.
South Asia India spends just 6% of its GDP on infrastructure, compared to China’s 20%. To achieve its targeted GDP growth rates, the country will need to invest approximately $250 billion in infrastructure over the next five years. “The importance of infrastructure for rapid economic development cannot be overstated,” explains P. Chidambaram, India’s Finance Minister. “The most glaring deficit in India is the infrastructure deficit.”
East Asia The developing economies in East Asia need to invest $165 billion per year over the next five years for electricity, telecommunications, major inter-urban roads, rail routes, water and sanitation. This amounts to nearly 6.2% of the GDP for the region — 4.0% for investment and 2.2% for maintenance. China, with its enormous electricity needs, is expected to account for 80% of all regional infrastructure expenditures.
South Pacific A survey by Econotech and the Australian Council for Infrastructure Development puts Australia’s infrastructure deficit at $19 billion. Meanwhile, the infrastructure deficit in New Zealand is estimated at 5 percent of its GDP (around $4 billion).
Canada $125BIreland $127B Germany
$843B by 2010
China $132B
East Asia & Pacific $178B
Australia $18B
New Zealand $3.6B
India $250B by 2010
U.S. $1.6T by 2010
Latin America & Caribbean $71B
Middle East & North Africa $28B
Sub-Saharan Africa $26B
California $500B by 2026

52007 private equity desk book & funds in or coming to market5 investing in infrastructure funds
Separate market dynamics impact each of the infra-structure sectors across geographies. Examples:
TranSporTaTion PPPs have played an increasingly central role in addressing the pressing need for new and well-maintained roads, tunnels, bridges, airports, ships, railways, and other forms of transportation. Historically transportation has represented more PPP transactions than any other sector. the ability to identify the DbFo elements of discreet transporta-tion assets has facilitated the use of PPP’s methods in transport projects. the growing acceptance of user fees for transportation assets allows for easy cash flow reconciliation. the scale and long-term nature of these projects are also well served by PPPs. Challenges resistance of user fees, project sit-
ing and environmental considerations. Leading practitioners australia, Canada,
France, Greece, ireland, italy, new Zealand, spain, U.K., U.s.
WaTEr and WaSTE Water and wastewater manage-ment, traditionally the province of state and local governments, represents another fast-growing area for PPPs. Many countries have started to use PPP structures to finance needed investment in these critical sectors. Challenges traditional view that access to clean
water is a public entitlement, the small scale of some projects, and political and environmental issues surrounding water and the disposal of waste.
Leading practitioners australia, France, ire-land, U.K., U.s., Canada.
EduCaTion PPPs can deliver substantial innovation to education infrastructure and service delivery. Un-der typical education PPPs, the private sector invests in the school infrastructure and provides related non-core services (school transport, food services, clean-ing, and so on) under contract while the government continues to provide core services, namely teaching. Challenges acceptance of private management
of public education facilities, resolution of long-term appropriations for PPP contracts.
Leading practitioners australia, netherlands, U.K., ireland.
HoSpiTaLS in recent years, a number of countries have aggressively moved to diversify the sources of health care funding by using PPP arrangements to meet the growing demand for health care infrastruc-ture. typically, a private consortium designs, builds, and operates a hospital or healthcare facility and leases it back to the relevant government entity. Challenges Uncertainty about future public
health care payment and insurance arrange-ments, separation of health care infrastructure and delivery of services.
Leading practitioners australia, Canada, Por-tugal, south africa, U.K.
pubLiC HouSing, Land & arEa dEvELopmEnT sev-eral central governments have encouraged the use of concession models in pilot PPP public housing projects. Joint ventures allow the local governments to retain control over planning and development while utilizing the private partners’ available resources and expertise. Challenges Uncertainty regarding refurbish-
ment costs, volatile future demand and revenue streams, and aligning the goals of the large num-ber of stakeholders (e.g. citizens, shop-owners, private developers, etc.).
Leading practitioners netherlands, U. K., ireland.
dEfEnSE PPP projects in the defense sector include equipment maintenance and installation, supply chain integration and operational support, depot mainte-nance, specialized military training, and real estate management. the projects typically are designed to overcome fiscal constraints, manage life-cycle costs, and reduce pressure on military personnel. Challenges Uncertainty about future defense
needs, the high rate of technological change, high upfront costs in small-scale projects, and securing value for money in noncompetitive situations.
Leading practitioners australia, Germany, U.K., U.s.
priSonS PPP projects in this sector have led to no-ticeable gains in construction times and costs. Challenges Political sensitivity, public purpose
issues, and difficulty specifying and agreeing on objectives.
Leading practitioners australia, France, Ger-many, U.K., U.s.
markET dynamiCS

62007 private equity desk book & funds in or coming to market6 investing in infrastructure funds
the U.K. experienced a steady decline in public invest-ment in infrastructure as a percentage of Gross Do-mestic Product (“GDP”) between the 1970s and 1990s. Public sector net investment (“Psni”) fell by an aver-age of more than 15% each year between 1991–1992 and 1996 –1997, and in 1997 it represented only 0.6 per-cent of GDP. by 1997 the backlog of repairs in schools was estimated at £7 billion and the backlog of mainte-nance of national Health service buildings in 1997 was over £3 billion, to say nothing of new needs.
in order to help address these needs, the U.K. Govern-ment launched the PFi program in 1992. since its intro-duction, over 700 projects with a total value in excess of £46 billion have closed. of these 700 projects, con-struction has been completed on 500, which include 185 new or refurbished health facilities 230 new and refurbished schools, and 43 new transport projects. Currently, PFi projects represent between 10% and 15% of all U.K. investment in public infrastructure.
the pipeline of future projects is impressive. When the report was completed in 2006, there were ap-proximately 200 projects with a capital value of £26 billion in the procurement pipeline through 2010. these investments are expected to deliver significant new or refurbished public infrastructure over the next few years, including over 60 health facilities and 104 schools. this includes the first, second and third waves of the building schools for the Future (bsF) program, which are in procurement or pre-procure-ment and will form part of the project pipeline.
as with other PPP programs, the PFi program is one of a number of financing options available to develop and provide essential services. in deciding whether a project is viable for PFi procurement versus other financing methods, the U.K. Government has stated that:
the choice of procurement route is based on an objective assessment of value for money;
there is no bias between procurement options;
Value for money does not come at the expense of employee terms and conditions (i.e., labor); and
Use of PFi must comply with the Government’s wider public sector reform agenda.
of the criteria mentioned above, the Government is keenly focused on value for money and uses it as the key measure for any new project to be considered for PFi procurement. the Government defines value for money as “the optimum combination of whole life cost and quality (or fitness for purpose) to meet the user’s requirement.” Value for money should not be confused with the lowest cost option. rather, value for money revolves around a complete understand-ing of the whole-life benefits and costs of a project for all stakeholders. additionally, the government has clearly established that value for money cannot come at the expense of labor (see discussion on labor influence on infrastructure, page 16).
CaSE STudy
THE ExampLE of THE uniTEd kingdom
In most areas of the world, PPPs or Private Finance Initiatives are new methods of financing
infrastructure needs. The country with the longest history of using this approach is the U.K.
and its experience is importantly instructive. In March 2006 the U.K. Treasury released a
report, PFI: Strengthening Long-Term Partnerships, that details its experience and confirms
that the government expects PFIs to continue to play an important role in delivering public
services to U.K. residents.

72007 private equity desk book & funds in or coming to market7 investing in infrastructure funds
successful on-time construction of projects plays a critical role in achieving value for money. as covered in a previous report by the U.K. treasury in 2003, 73% of non-PFi construction assets came in over-budget and 70% were delivered late. in contrast only 20% of PFi projects came in late or over-budget. this es-tablished track record of efficiency in construction is followed by an equally impressive track record in user satisfaction as displayed in Chart 1 below. From the more than 500 operational projects evaluated, it clearly demonstrated that:
Users are satisfied with the services provided by PFi projects;
Public authorities are reporting good overall per-formance and high levels of satisfaction against the contracted levels of service;
services contracted for are appropriate, with 83% of projects reporting that their contracts always or almost always accurately specify the services required; and
incentives within PFi contracts are working.
as illustrated by Chart 1 below, research commis-sioned by the U.K. treasury from Partnerships U.K. concluded that 80% of all users of PFi projects are always or almost always satisfied with the service being provided. the results of this study were consis-tent with results from a joint study by KPMG and the business services association.
While the PFi program has a demonstrated track re-cord of success, the U.K. Government has striven to improve the program, looking to achieve increased value for money by removing inefficiencies in PFi procurement and execution. the report concludes that improvements can be made to strengthen the program further, to achieve consistent high perfor-mance from the operational phase of their projects, to bolster public sector PFi procurement profession-alism, and to make sure authorities understand the long-term trade-offs between flexibility and value for money when designing projects.
it is notable that as the PFi program has taken hold, the long-term trends in Psni in the U.K. have been reversed, rising from 0.6% of GDP in 1997 to 2.25% in 2006.
chart 1. PFi customer satisfaction
70%
60%
50%
40%
30%
20%
10%
Always Satisfied Almost Always Satisfied
Satisfied About Half the Time
Almost Never Satisfied
Never Satisfied
Source: Partnerships UK

8 investing in infrastructure funds
risK-return sPectruM; DeFinitiOns
There are three broadly defined risk/return investment types within the infrastructure sector:
n brownfield investments refer to well established cash-flowing assets, such as fully operating toll roads. They are perceived to be the lowest return and lowest risk sector of infrastructure investing. The typical Brownfield investment profile is akin to a long-term bond, with an immediate current coupon and a term of 15 to 30 years or more.
n rehabilitated brownfield investments generally lie on the midpoint of the infrastructure risk/return spectrum. An example of a Rehabilitated Brownfield investment would be the purchase of concession rights for an operating toll bridge that, though currently generating cash flow, requires significant immediate capital improvements for major retrofitting or expansion. This structure is effectively a blend of Brownfield and Greenfield risks and returns.
n Greenfield investments typically involve more risk than pure Brownfield Investments as they include design and build risk, as well as operating risk. These types of investments are often sold to other investors once the project is completed and stabilized (usually over a four-to-five year time line) and is generating consistent cash flow.
Categorizing infrastructure investments into these three broad types, however does not adequately define the risk/return profile of individual projects. A Greenfield investment is not necessarily riskier than a Brownfield or Rehabilitated Brownfield project. Ultimately, the risk/return profile of each investment is a function of the structure of the investment and how that structure addresses a number of specific important risks, including:
n elasticity of Demand For those projects whose returns depend upon user fees, the demand for those services during the life of the contract are extremely important in determining ultimate return. Even for a Brownfield toll road whose use characteristics are presumed to be well known (thus less risky than, say, a Greenfield project), the availability of non-toll alternatives now or in the future, or the impact of either soaring fuel prices or steeply rising tolls on traffic can reduce actual revenue. In fact, a Greenfield social infrastructure project with well-defined contractual structures and availability payments may be inherently less risky than a toll road whose revenue streams are driven by user fees.
Ultimately, risk/return profile of each investment is a function of the structure of the investment and how that structure addresses a number of specific important risks.

9 investing in infrastructure funds
n leverage The risk in any project is also driven by the amount of financial leverage applied to the transaction. Interestingly, since Brownfield projects are generally considered more stable, they are usually easier to leverage aggressively to generate higher returns on invested equity. However, any project that is highly leveraged has less financial flexibility, and for projects whose returns are generated through user fees as described above, the combination of flawed revenue forecasts and too much leverage can significantly increase risk and ultimately reduce returns.
n inflation As with any long-lived asset, increasing inflation can also impact profitability. This risk can be mitigated contractually through inflation adjustment clauses, or in certain instances, through contracts hedging key operating costs.
n Political risk This area of risk is broad, covering such issues as rejection of contracts, currency risk (where the currency of the country where the project is located differs from the currency of the fund), political instability or potential civil strife. Thus, projects in emerging market countries are generally perceived to have a higher degree of risk than those in developed economies.
Any particular infrastructure project contains all of these issues in a specific structure designed by the sponsor to manage risks and enhance returns. How that specific balance of risks versus returns is struck determines the actual return profile of a transaction. The underlying risk of a project is often over-simplistically characterized under a label like “Brownfield” or “Greenfield” and does not properly reflect the real risk represented by an investment opportunity. A fund sponsor constructing a portfolio of projects is ultimately building a portfolio of risks and related pro forma returns that require a balancing of all these factors in order to develop a pool of projects that are meant to perform well as a whole.
Projects in emerging market countries are generally perceived to have a higher degree of risk than those in developed economies.

10 investing in infrastructure funds
institutional Portfolio Considerations
the MOtivatiOn tO invest
Institutional investors are motivated to create allocations to infrastructure investing in order to match long-tailed portfolio liabilities to long-lived, stable, high-quality, inflation-hedged assets. Pension or Superannuation Plans are natural investors in this emerging asset class because of their inherently long-term liabilities; as a result they have become the most active investors in the sector.
There are other motivations as well. For public sector pensions, investing in local infrastructure projects can boost local economies and help achieve public policy goals while at the same time safely investing pension dollars in assets that offer attractive risk/return profiles. Taft-Hartley Plans in the U.S. seem to be looking favorably on infrastructure investing as a way potentially to boost job prospects for members in construction and post-construction operating trades while achieving similar investment goals. Many other investors are looking for the same qualities in a newer and less efficiently priced area of alternative investments.
This increasing demand for infrastructure investments has been met by an increasing supply of opportunities, as discussed above. Over the past two years there have been over $250 billion in transactions in Europe, the U.S., and Canada as a result of PPPs, mergers and acquisitions, and privatizations. With continuing stresses on government budgets, as well as constraints on their ability to raise capital through taxation, government spending on infrastructure has been steadily reducing at the same time demand has been rising. These trends provide increased opportunities for the private sector to take advantage of this imbalance in the infrastructure sector.
the issue OF POrtFOliO “Fit”
A number of institutions, mostly European, Canadian, and Australian, have included infrastructure investing in their portfolios for a decade or more. The majority of institutional investors, however, are just beginning to evaluate infrastructure investing. The jury is out on whether infrastructure has risen to the level of being deemed a separate asset class among these investors, although there are many practitioners who expect this to occur.
For most investors new to infrastructure investing, the hurdle issue is, “Where does it fit?” Even if an institution is leaning towards eventually setting up a formal separate infrastructure allocation, “toehold” positions are often done as a means of market reconnaissance, and these early investments are placed, at least on a temporary basis, into existing allocations. The existing allocation options most used for this approach include private equity, real estate, or fixed income, but the risk/return profile of most infrastructure investments does not perfectly overlap with the profile of any one of those investment types.
We believe that infrastructure assets originate more like private equity transactions in the initial origination and structuring phase and in the case of Rehabilitative Brownfield and Greenfield assets the DBFO phase. In contrast, infrastructure assets behave more like long-duration alternative fixed income assets in the Operations and Maintenance phase or the post-completion phase. The key determinants of risk relate to contractual structure and timing. Assets that are through initial structuring and formation, and are in the operating and maintenance phase (with consecutive quarters of stable operating history meeting or exceeding plan) are clearly more mature and less risky than assets that are in an early phase of validation.
Government spending on infrastructure has been steadily reducing at the same time demand has been rising.

11 investing in infrastructure funds
Interestingly, the ultimate answer to where infrastructure “fits” for new investors is often colored dramatically by orientation. If the private equity team within an institution is asked to administer the allocation or to determine appropriate benchmarks and design a program, often there is an expectation of high teens-plus returns and shorter holding periods, more akin to private equity returns. This results in a bias towards higher-risk oriented investments capable of generating such returns in shorter time frames. If the real estate team is given the same task, the performance expectations are often high-single or low-double-digit returns, more akin to core real estate returns. The result can be a greater focus on investments in existing, stabilized assets with lower volatility, favorable risk sharing and risk mitigation arrangements and more rigorous contractual definition with resultingly lower overall returns.
While infrastructure investments can share attributes of private equity, real estate and fixed income, its proper characterization probably lies somewhere in between existing allocations for most institutional portfolios. We believe that ultimately most investors with sufficient time to study the space will come to recognize the unique nature of infrastructure investing and create, or migrate to, a stand-alone asset allocation with dedicated professionals experienced in the area.
benchMarKinG
The history of private infrastructure funds is relatively short and shallow compared to that of private equity or real estate. As a result, no source comparable to Venture Economics, Cambridge Associates , or NCREIF that provides vintage year comparisons for these funds has yet developed. Private Equity Intelligence, an on-line service that tracks individual fund performance through publicly available listings and Freedom of Information Act requests, has begun to track the performance of individual infrastructure funds, but that database at this point is sparsely populated, mostly by funds that remain at a very early stage of implementation.
In the public markets, a few indices designed to track infrastructure returns offer a view of comparable investment performance. For example, Macquarie Bank and FTSE have combined to create a number of jointly provided indices covering infrastructure globally and in various regions. However, these indices are heavily weighted towards publicly-traded electric, gas, and water utility companies that are not necessarily representative of the infrastructure sector in general. None of these indices (either on a direct or adjusted basis) has won broad support as a benchmark for the institutional investors with whom we spoke and who responded to our survey.
A few experienced investors have set their return benchmarks on an absolute basis, looking for returns of at least 8% to 10% in the sector. Others prefer benchmarks that are inflation-linked (e.g., 400 basis points over inflation), clearly reflecting the purpose of infrastructure in their portfolios. It should be noted that most of these investors tend to focus on investments in developed countries. The risk/return profile — and thus appropriate benchmark — for funds focused in emerging market countries would obviously be quite different.
Given current investor focus on infrastructure opportunities with long-lived assets generating a degree of current income, we believe that both absolute and inflation-adjusted benchmarks are likely to become increasingly important. We also believe that as the market continues to grow and a deeper base of historical results is developed, “vintage year” analysis of returns for managers will become a more meaningful relative performance measure.
We believe that ultimately most investors with sufficient time to study the space will come to recognize the unique nature of infrastructure investing and create a stand-alone asset allocation.

12 investing in infrastructure funds
Fund investment Considerations
Only a handful of the largest and most mature investment programs have dedicated direct and co-investment teams to execute infrastructure investments. These large investors are often well-staffed, well-compensated, and compete directly with the largest infrastructure funds — either alone or in consortia — for the largest infrastructure investments that come to market. Most investors who approach infrastructure investing for the first time do so necessarily through private fund structures, even if their ultimate goal is to set up active co-investment or direct investment programs.
Since the vast majority of institutional investors today, and at least into the near future, will invest in infrastructure through traditional fund vehicles, this discussion focuses on issues that impact fund investing in infrastructure. Much of the analysis here is based upon information collected as part of our Probitas Partners Survey, which is included in detail later in this paper.
FunD DuratiOn
There is no clearly established standard for fund duration today, and different vehicles handle duration in differing ways.
n traditional Private equity Fund structures with 10-Year Maturities These structures are the most common in the market today and have won acceptance from investors newer to the sector. Experienced investors with more mature portfolios often complain that such vehicles seem inappropriate for investments whose underlying maturities may be 15 to 30 years. These more mature investors often seek to hold or enjoy exposure to contractually well defined and stable assets for as long as possible. To address this issue, some vehicles are now offering 12-year or 15-year maturities (or longer), providing a more efficient holding period for assets with inherently long durations.
n hybrid structures These structures were designed to invest across the infrastructure risk/return spectrum, aggregating investments with both shorter and longer maturities. Greenfield investments can be sold once they are completed and stabilized (generating higher IRRs than if the intent was to hold them to ultimate maturity), while other projects with natural longer maturities are often either transferred in some way at the end of the life of the vehicle to limited partners focused on long-tailed returns, sold to other investors, or transferred to vehicles affiliated with the firm and sponsor, with longer durations and moderated economics to reflect a more passive, stabilized role.
In some cases the transfer between affiliated shorter-term oriented funds and longer-term affiliated vehicles has caused significant conflict issues for the fund sponsors. As a result, funds that include such features appear to have either lost institutional support because of the risk of fiduciary liability in the case of such obvious conflict, or gained much greater scrutiny and now include significantly greater limited partner protections in the event of such transfers.
No common methodology has yet to emerge to address the most difficult conflict issue: pricing of positions upon transfers to affiliated entities. Some newer funds have set up sales mechanisms to affiliated vehicles with some element of third-party validation buying a portion of the transferred asset. Other evolving structures we see today include opt outs at the end of the fund life for shorter-term investors and similar structures that seek to offer shorter-term investors a contractual right of realization while reserving
the vast majority of institutional investors today, and at least into the near future, will invest in infrastructure through traditional fund vehicles.

13 investing in infrastructure funds
longer-term investors the opportunity to stay with assets they know for a longer horizon. Given the divergent interests of new and mature investors in having shorter and longer-term holds, respectively, this will continue to be an issue that fund sponsors will seek to address with greater flexibility for both parties at the maturity of an asset.
n evergreen structures Favored by certain investors as a natural vehicle for long-tailed assets, evergreen vehicles create policy and legal difficulties for many others. Exit mechanisms for evergreen vehicles that allow investors liquidity after a set period are sometimes plagued by the same pricing issues that effect hybrid vehicles. The largest of funds that include an evergreen structure have been targeted at retail investors who seek a bond-alternative with some upside potential.
None of the approaches noted above has become dominant in the market and the different structures available reflect the differing needs, desires and sophistication of investors, as well as the varying natural maturity structures of investment opportunities. Interestingly, in talking with experienced investors we found dissatisfaction with many of the structures that currently exist, but no consensus around a preferred approach.
liQuiDitY
An important issue for investors to consider is how they will deal with the ultimate liquidity of their investment if, at the end of a partnership’s stated life, a significant number of positions remain in portfolio. Most private equity funds allow for extensions of a partnership’s life for one to three years in one fashion or another, but these extensions are meant to deal with small, tag-end positions that may not quite be ready for exit, and not a larger portfolio of naturally long-lived assets. The Hybrid and Evergreen structures described above are meant to address this issue directly, but have not yet gained wide acceptance because the structures are inconsistent with most institutional investors’ preferences and delegations of authority.
Other alternatives are described below:
n sales to Other sponsors or acquirers General partners can always elect to sell positions in their portfolios. Potential purchasers of these positions include:
strategic acquirers Depending upon the sector, there may be strategic acquirers looking to build their base of assets or contracts in order to gain scale for which certain positions may represent attractive acquisitions.
sophisticated Primary investors Many of the primary informants active in the market are large, sophisticated investors — such as public pension plans — with strong appetites for cash-flowing contractually defined investments which are likely to be the type of positions held in a fund at the end of its life. A number of these investors already have active co-investment and direct investment programs that make excellent targets for such sales.
specialist vehicles A number of specialist vehicles exist (such as publicly traded vehicles or specialist PFI secondary funds) that actively look to purchase positions in the current market that fit with their portfolio needs. Given the cash flow profile of more mature investments, it would also seem logical that future structured or securitized vehicles will be created in the capital markets that could include types of assets to be attractive acquisitions.
in talking with experienced investors we found dissatisfaction with many of the structures that currently exist, but no consensus around a preferred approach.

14 investing in infrastructure funds
n secondary sales by individual investors The sale of partnership positions, as distinct from the sale of underlying transactions in a portfolio, is always an option for investors in a fund. However, infrastructure overall is a relatively new asset class and as a result secondary sales of partnerships have been limited. As the primary market develops and deepens, however, we expect that the secondary market for these interests will deepen as well, with likely interest coming from both sophisticated primary investors and specialist vehicles described above.
In the future, we believe that hybrid structures in general are likely to become more important if the transfer pricing issues can be properly addressed. The development of deeper private and public markets for these long-term assets should provide an increasing number of liquidity options both for fund managers and individual investors.
available FunD ManaGer caPabilities
The pool of experienced managers within the infrastructure sector is exceptionally thin. The largest share of talent comes from the investment banking world, where most professionals gained experience arranging debt financing for large infrastructure projects around the world with the most active period between 1994 and 2000, and more recently a renewed period of interest and increased activity starting in 2005. Not surprisingly, with most of the experienced personnel coming from the investment banking world, many of the new funds are investment bank-sponsored vehicles that seek third-party capital. There are relatively few truly independent vehicles doing infrastructure investing.
n investment backgrounds Infrastructure investment is a rapidly growing area, and many of the funds active in the sector are first-time vehicles. There are relatively few investment professionals in the sector that have attributable equity investment track records. As indicated above, the majority of such professionals focused on infrastructure investing today have backgrounds as debt investors or arrangers in the sector.
n Operational experience Though investment professionals with specific equity investment experience in the sector are few, most general partners bring operational and financial expertise in the sector. Those with longer and varied backgrounds in the sector, through different cycles and in different geographies, are more likely to have the requisite skills and experience to perform well in the future.
n sponsored vs. independent vehicles A number of large financial organizations have extensive histories in infrastructure investing, but their sponsored vehicles also face potential conflicts of interest that concern investors. Of special concern is team stability: investment professionals at a number of large sponsored vehicles are employees instead of partners, with no vested stake in the carry of the fund or even a direct measurable nexus in their compensation to the fund’s performance. Additional conflicts of interest exist where sponsoring entities generate significant fee revenue from originating, financing, selling or managing underlying investments, especially when such entities have competitive investment vehicles, or affiliated vehicles into which assets are transferred between affiliated funds.
the pool of experienced managers within the infrastructure sector investing is exceptionally thin.

15 investing in infrastructure funds
the iMPOrtance OF cO-investMent in inFrastructure investMents
As discussed above, new and established investors’ goals and objectives for infrastructure investments vary widely. At the simplest level, an investor seeking exposure to a stable cash flow from an inflation-hedged, long-tailed asset may find infrastructure inherently interesting to match with similar maturity liabilities and be willing to pay the fee and carry of a fund structure to gain such exposure.
For other investors, the private equity-like structure of a management fee and carry (typically 1.5–2% and 20%, respectively), coupled with lower than private equity returns (typically low-to-mid teens), is less attractive, especially for a limited number of larger institutions with well-developed existing infrastructure portfolios and a qualified team of experienced direct investment professionals.
Institutions with more mature infrastructure exposure and internal teams may only look at fund investing as a means of enhancing co-investment deal flow in order to expand exposure at a reduced cost. This is especially true for a growing number of institutions that have assembled deep benches of professionals experienced in direct infrastructure investing. But geographic familiarity and unique industry and local or regional knowledge are likely to continue to play an important role in asset formation. Unique geographic and industry knowledge and skill on the part of individual managers will continue to benefit even the most seasoned institutional investor teams.
the role of co-investment
Most institutional investors lack the resources either to underwrite or make timely commitments in co-investments. Even those with co-investment capabilities often lack the specific infrastructure experience and capabilities required to diligence and evaluate infrastructure co-investments. As a result, only a small — albeit growing — universe of very large institutional investors actually have the capability to execute infrastructure co-investment opportunities on their own.
For smaller and medium-sized investors, or larger investors new to the sector, giving up co-investment opportunities to larger limited partners in a fund may be beneficial. Co-investment will likely be a frequent feature of many infrastructure transactions given their scale. By having a ready and willing source of capital in the form of existing fund limited partners, the fund sponsor effectively can deploy a larger check book than enjoyed by the fund alone, and can more effectively negotiate and win larger transactions without having to seek co-investment from non-affiliated investors or from competitive infrastructure funds. This can create benefits for all limited partners of the fund.
Lastly, given the growing expertise resident on many investment staffs at institutions likely to participate in co-investments, their participation may enhance the quality and performance of fund transactions; further, given many of these co-investors’ direct investment capabilities, they may actually be a source of new investment opportunities for the fund.
Most institutional investors lack the resources either to underwrite or make timely commitments in co-investments.

16 investing in infrastructure funds
the inFluence OF OrGaniZeD labOr in inFrastructure investinG
Organized labor plays multiple roles in infrastructure investing in the developed world, and also approaches investing in infrastructure from varying perspectives.
n trade unions in the construction trades The construction trades, even in the U.S., where the importance of organized labor has been dwindling, are heavily unionized. These unions see the advent of increased infrastructure investing as an opportunity for their members for increased work on Greenfield and Rehabilitated Brownfield investments.
n trade union Pension Plans These pension plans (governed in the U.S. by the Taft-Hartley Act) are natural investors in long-term assets, and a number of them are either active investors in infrastructure or are considering investments in the sector. Many of them perceive private infrastructure investing as relatively friendly to organized labor because of the potential for creating jobs in the construction trades in addition to the ability of the sector to create attractive returns for pensioners’ money.
n Public sector Pensions To date, some of the largest investors in infrastructure have been large public sector pensions. Many of the members of these pension plans are members of unions, and the boards and investment committees of these plans are often composed of a combination of union representatives, management and government officials. Certain of the beneficiaries of these plans are also employed directly in infrastructure operation (as toll booth operators, for example).
The primary focus of the pension plan managers is their fiduciary responsibility to their beneficiaries. They are tasked with generating the necessary returns to provide the promised benefits to plan participants. However, they are also usually unwilling to make investments that in some high profile manner are perceived to undermine the interests of their beneficiaries.
Just as the risk/return profile of Greenfield and Brownfield investments are very different, they are also perceived differently by some members of organized labor. Greenfield investments are clearly perceived as potential new job creators. Brownfield privatizations are typically more controversial, as established assets with long operating histories are either sold outright or contracted through concessions with private operators. As one would expect, Rehabilitated Brownfield projects are a mix of both of these, with some degree of new construction job creation due to extensive repairs, followed by the transfer of the assets or concessions to the private sector. Global infrastructure investment patterns and trends over the last 20 years suggest that in the realm of public projects, Rehabilitated Brownfield and Greenfield projects are likely to exceed Brownfield privatization and concessions in both number and amount of funds employed over time.
brownfield privatizations are typically more controversial, as established assets with long operating histories are either sold outright or contracted through concessions with private operators.
17 investing in infrastructure funds
The U.K. experience with labor protection standards offers one of the more meaningful case studies for the effect of privatization on labor employment. As a matter of public policy, the U.K. government has made it clear that the potential to bring improved value for money in public services with greater quality and innovation in infrastructure projects should not be at the expense of labor. As a result, the government has formalized labor protection standards that require private operators to offer jobs with compensation and benefits that are comparable to the public sector. However, comparability in the U.K. does not constitute guaranteed employment, as the private sector is left to its resources to evaluate workers and seek productivity improvements in the DBFO elements of infrastructure projects. In the U.K. to date, the government has generated greater efficiencies through PPPs while continuing to pursue a strategy of enhancing worker protections and ensuring fair and reasonable treatment in infrastructure projects.
So far, the situation in the U.S. has not produced a unified approach. PPP rules are being put in place on a state-by-state basis, and in many cases are still being worked on. At the same time, certain Taft-Hartley and public pension funds have taken it upon themselves to adopt forms of Responsible Contractor Language (“RCL”) covering infrastructure investing for specific-fund investments that they are pursuing. Though RCL provides a generally labor-supportive framework, it is not uniform and remains subject to negotiation. As a result, different infrastructure vehicles can find themselves subject to different self-imposed restrictions regarding their use of labor depending upon whom they have accepted as investors and what specific RCL language they agreed to abide by.
Given the current stage of the U.S market’s development, it is difficult to predict exactly how the issue will develop with respect to labor and employment. In the interim, infrastructure investors, especially those targeting the U.S., should review these issues when performing due diligence on infrastructure vehicles they are considering.
inFrastructure FunD lanDscaPe
The fundraising market for private infrastructure funds has expanded dramatically over the last 18 months, as Chart 2, below, demonstrates. Commitments raised during the first six months of 2007 nearly equaled the total raised for all of 2006, and 2006 fundraising was three times as high as it was in 2005.
chart 2. Global infrastructure Fundraising
Billio
ns
$25
$20
$15
$10
$5
2004 2005 2006 June ’07
Source: Probitas Partners
$2.4
$16.7$17.9
$5.2
Given the current stage of the U.s market’s development, it is difficult to predict exactly how the issue will develop with respect to labor and employment.

18 investing in infrastructure funds
Table 1 lists the ten largest infrastructure funds either raised to date or currently in the market. This fundraising is concentrated in a small number of large funds, most of which are first-time funds.
table 1. largest infrastructure Funds, June 2007
Fund Name ParentAmount Raised or Target (MM)
Vintage Year or Status
Geographic Target
GS Infrastructure Partners I Goldman Sachs $6,500 2006 GlobalMacquarie European Infrastructure Fund II Macquarie Bank €4,600 2006 EuropeMacquarie Infrastructure Partners Macquarie Bank $4,000 2007 North AmericaAlinda Capital Partners I Alinda Capital Partners $3,000 2007 North AmericaAIG Highstar III AIG Highstar $3,000 In Market GlobalCitigroup Infrastructure Investors Citigroup Alternative Investments $3,000 In Market Developed MarketsMorgan Stanley Infrastructure Morgan Stanley $3,000 In Market GlobalRREEF Pan-European Infrastructure Fund Deutsche-RREEF €2,000 In Market EuropeAbraaj Infrastructure and Growth Capital Fund Abraaj Capital $2,000 In Market GlobalBabcock & Brown Infrastructure Fund Babcock & Brown $2,000 In Market North AmericaGulf One Infrastructure Fund Gulf One Bank $2,000 In Market Middle EastIDFC Private Equity Fund II IDFC Private Equity $2,000 In Market IndiaInfracapital Partners Prudential Plc £1,000 In Market Europe
Based upon funds either closed or actively fundraising Source: Probitas Partners
There are a number of similarities among these infrastructure funds in the market:
n Most are Focused on Developed countries Much of the capital currently being committed is directed at the European and North American markets, even within those funds that have global investment mandates. However, it should be noted that there are a significant number of funds focused on investing in India and the Middle East.
n sponsored vehicles Most of the largest funds in the market are sponsored by large financial institutions, and many of these funds are run more like a division of an investment bank than an independent fund manager. The largest, and one of the few truly independent fund managers listed here, is Alinda.
n Opportunistic investment strategies Many of these funds (especially those focused on developed countries) opportunistically invest across the infrastructure risk/return spectrum. Those funds focused on emerging economies are more focused on Greenfield investments while those focused on developed markets tend to be more focused on Brownfield and Rehabilitated Brownfield investments.
Besides these large vehicles, there are also a number of smaller funds in the market (see Appendix, page 33, for a detailed listing). Most of these funds have either a narrow industry sector or geographic focus. As the market develops, we are likely to see the creation of more independent fund managers, likely staffed by professionals spinning out of sponsored funds.
as the market develops, we are likely to see the creation of more independent fund managers, likely staffed by professionals spinning out of sponsored funds.

19 investing in infrastructure funds
infrastructure investors survey
During spring 2007 we conducted an internet survey to gauge investor interest, opinions, and perspectives on investing in infrastructure funds. We contacted approximately 1,500 institutional investors and received responses from 114 senior investment executives from Public & Corporate Pension Plans, Fund of Funds Managers, Family Offices, Endowments & Foundations, Consultants & Advisors, Insurance Companies and other agencies. We also conducted extensive phone interviews with a dozen of the largest, most active institutional investors in order to garner a deeper understanding of trends noted in the survey.
surveY FinDinGs: OvervieW
The following summarizes the top line findings from the Survey on investor preferences, perspectives and practices:
n high level of interest in the sector Though infrastructure investing is a relatively new activity for the majority of institutional investors, especially in the U.S., respondents to the survey were extremely interested in the sector. More than a quarter of survey respondents already had active infrastructure investment programs in place and over 52% confirmed that they were either actively considering infrastructure investing or would opportunistically do so in the future.
n Most Placing in Private equity bucket; interim step When asked where they would place infrastructure within their portfolios, a majority of respondents stated that they would put it in their private equity allocations. Active investors who have made several investments are more likely to have a separate allocation specifically for infrastructure investments. Several investors told us that they perceived the placement of infrastructure investments in Private Equity or Real Estate allocations as an interim step on the way to developing an Infrastructure allocation once a critical mass in their portfolios was reached.
n stable & increasing allocations Thirty-four percent of respondents said that they would increase allocations to infrastructure in 2008 while 31% reported that they would continue to allocate similar amounts. Thirty percent said that their allocations in 2008 would be opportunistic, based upon both market conditions and available investment options. Only 1% of respondents said that they planned to decrease future commitments to the sector.
n Mid-teens expectations The vast majority of investors expect returns in infrastructure to be in the range of 10% to 18%, with the bulk of responses in the 13% to 15% range. Interestingly, for investors with active infrastructure investment programs, expectations are somewhat lower than the overall responses, with 41% of active investors expecting returns in the 10% to 12% range. Respondents who placed infrastructure investments in their private equity allocations have slightly higher expectations, with 9% of these investors anticipating returns of 19% to 22%.
34 percent of respondents said that they would increase allocations to infrastructure in 2008

20 investing in infrastructure funds
n Preference: Global, then north american When asked if they had any particular preference for infrastructure funds with specific geographical investment mandates, 60% cited a bias towards global infrastructure funds with significant allocations to OECD countries, with funds focused on North America preferred by 36% of respondents (though the large number of North American survey respondents have likely skewed these results). Interest in funds strictly focused on emerging markets trailed significantly.
n Fund Duration Preferences remain Mixed Investors were asked if they had a particular preference for the fund’s structure or life. A third of the respondent base was indifferent to the underlying fund’s term and structure while 28% preferred a 10-year fund term, typical of private equity funds. Among active investors, the strongest preference was for hybrid 10-year vehicles structured to deal with both shorter-term and longer-term investment opportunities.
PrOFile OF resPOnDents
The first series of questions in the Survey created a profile of the respondents in order to provide context to the results.
chart 3. respondents by investor type
“I represent a ...”
20%
16%
12%
8%
4%
Public Pension
Plan
Family Office
Fund of Funds
Manager
Endowment or
Foundation
Consultant or Adviser
Insurance Company
Corporate Pension
Plan
Other Taft-Hartley or Other
Labor Plan
Gov’t Agency
Bank
Respondents represented a wide range of types of institutional investors including Public & Corporate Pension Plans, Family Offices, Advisors & Consultants, Fund of Funds (FoFs), Endowments and others.
Public Pension Plans led in responses at 18.4%, followed by Family Offices at 16.7%. Interestingly, Consultants/Advisors constituted the fourth largest respondent set, and individual interviews with certain consultants confirmed that their interest in the sector is being driven by an emerging interest in the sector from their clients.
18.4%
0.9%0.9%1.8%
6.1%7.0%7.0%
13.2%14.0%
16.7%
14.0%

21 investing in infrastructure funds
chart 4. respondents by location of Firm’s headquarters
“My firm is headquartered in ...”
80%
60%
40%
20%
U.S. Western Europe Canada Asia Australia Middle East Other
Institutional investors from the U.S. made up the dominant share of respondents at 77%, followed by Western Europe at 14%, with smaller percentages from Canada, Australia, and Asia. The over-representation of U.S. respondents may be driven by the fact that infrastructure investing is extremely topical at the moment for U.S. pension funds, leading to a higher interest in the sector. It should also be noted that all but one of the investors from Canada and Australia designated themselves as active investors in infrastructure, a much higher percentage than other geographies.
chart 5. 2007 Private equity allocation targets
“In 2007, we are looking to commit across all areas of private equity ...”
35%
28%
21%
14%
7%
< $50M $50M–$150 $150M–$250M $250M–$500M $500M–$1B > $1B
When asked about their targets for private equity allocation, overall investor response was close to the results reported in Probitas Partners 2007 Investor Survey completed earlier this year. Though the overall results were fairly well spread across different size segments, it was notable that there is more of a concentration of larger investors from respondents who are experienced, active infrastructure investors. Many of these larger investors are also Public Pension Plans.
75%
3%4%
15%
3%
29.6%
21.0%
14.8%
7.9%
14.8%15.8%
7.4%9.7%
25.9%28.0%
7.4%
17.5%
Base Overall Respondents Experienced Investors
the over-representation of U.s. respondents may be driven by the fact that infrastructure investing is extremely topical at the moment for U.s. pension funds,
22 investing in infrastructure funds
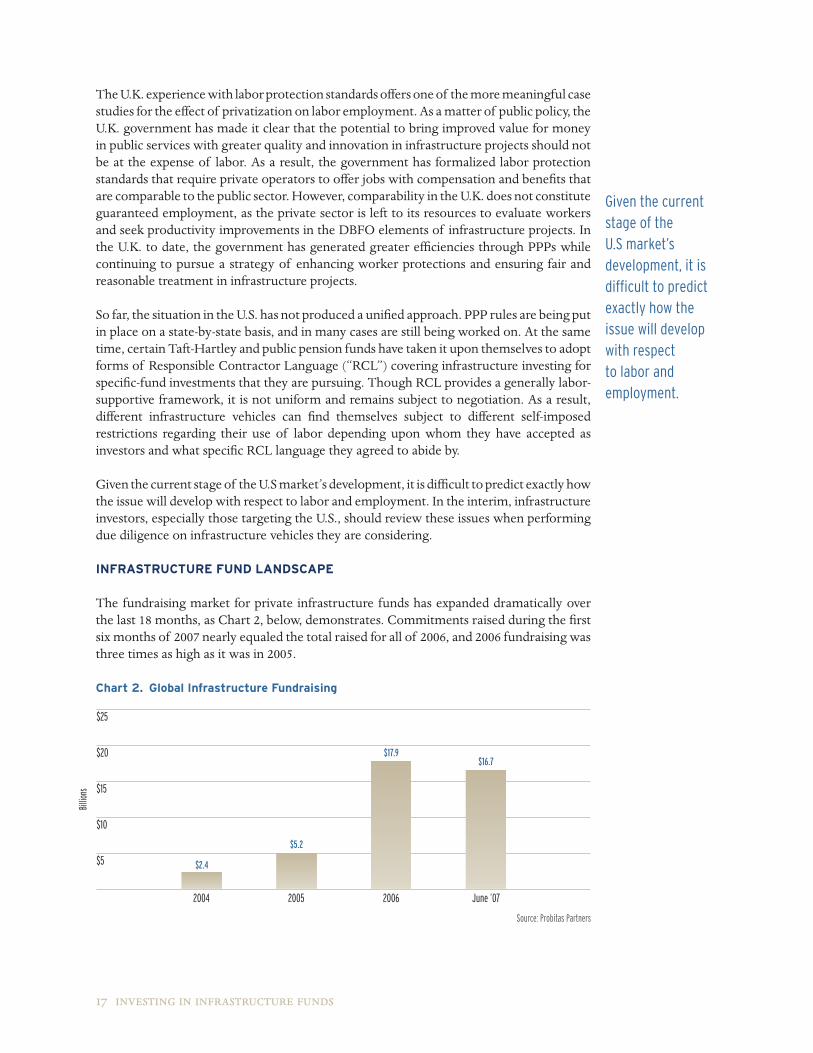
chart 6. targeted sectors in 2007
“During 2007 I plan to focus most of my attention on investing
in the following sectors (choose no more than four) ...”
10% 20% 30% 40% 50% 60%
To get a better sense of sector attractiveness, we asked investors to identify up to four sectors that they planned to focus on during 2007.
In line with the preponderance of U.S. respondents, U.S. Middle Market Buyouts were the leading response, closely followed by Distressed Debt Funds. U.S. Venture Capital Funds, another core holding of many U.S. and European institutional investors, ranked third. Somewhat surprisingly, Infrastructure Funds tied European Middle Market Buyout funds for fourth. That result was likely impacted by the fact that the overall survey was somewhat under-represented by European investors, but it also reflects a strong interest in infrastructure investments across all geographies.
For those respondents who identify themselves as active investors in infrastructure, infrastructure is actually the leading response, with 63% identifying it as one of their top four sectors. This result is likely impacted by the fact that a number of these respondents are solely focused on infrastructure investing as part of a dedicated allocation to the sector.
U.S. Middle Market Buyouts 50.9%
Distressed Debt Funds 46.5%
U.S. Venture Capital 41.2%
European Middle Market Buyouts 34.2%
Opportunistic Real Estate Funds 32.5%
Infrastructure Funds 34.2%
Mega Buyout Funds 26.3%
Asian Funds 23.7%
Other 18.4%
Mezzanine Funds 10.5%
Fund of Funds 13.2%
European/Israeli Venture Capital 4.4%
Energy Funds 22.8%For those respondents who identify themselves as active investors in infrastructure, infrastructure is actually the leading response.

23 investing in infrastructure funds
chart 7. Drivers for sector target Focus
“My sector investment focus in 2007 is being driven by ...”
5% 10% 15% 20% 25% 30% 35%
Investors were next asked to explain their reasons for tactical sector focus. Almost one-third reported that they did not have any single compelling driver, but that they would simply pursue the best opportunities available in the market. The next most popular response given by over a quarter of respondents was a need to diversify their portfolios.
Plans FOr inFrastructure investinG
The next section of the survey focused specifically on investor’s specific plans for infrastructure investing. A number of the issues covered in this section were covered in further depth by personal or telephone interviews with certain investors experienced in the sector.
chart 8. Plans for infrastructure investing
“As far as infrastructure investing is concerned ...”
5% 10% 15% 20% 25% 30%
As noted above, nearly 52% of respondents to the Survey are either active investors in infrastructure, have just begun a program to invest in the sector, or opportunistically make investments in the sector. A further 29% are considering making an allocation to the sector, while only 19% have no plans to make infrastructure investments. (It needs to be noted that other investors with no plans to invest in infrastructure may have been tempted not to respond to the survey at all.)
I Have No Particular Sector Focus But Simply Pursue the Best Funds Available in the Market 31.6%
My Firm Is Considering Making an Allocation to Infrastructure Investing 29.3%
My Institution’s Need to Diversify Its Private Equity Portfolio 22.8%
My Firm Has an Active Investing Program and Has Made at Least One Fund or Direct Investment 25.5%
A Focus on Those Private Equity Sectors I Believe Will Outperform Others in This Vintage Year 17.5%
My Firm Opportunistically Considers Infrastructure Investments 22.6%
My Need to Deploy Significant Amounts of Capital Allocated to Private Equity 5.3%
My Firm Has Just Begun a Program to Make Infrastructure Investments 3.8%
Targeting Funds That Will Provide Access to Co-Investments 3.5%
Other 3.8%
A Desire to More Closely Match the Duration of My Assets with the Duration of My Liabilities 2.7%
Maintaining Established Relationships with Fund Managers Returning to Market This Year 14.0%
My Firm Does Not Make Infrastructure Investments and Has No Current Plans to Do So 18.9%
Other 2.6%
nearly 52% of respondents are either active investors in infrastructure, have just begun a program to invest in the sector, or opportunistically make investments in the sector.

24 investing in infrastructure funds
Perhaps the most significant result in Chart 8, on the previous page, is the large percentage of investors who are actively investigating the sector. Discussions with investors confirm that even those who consider themselves active investors have rarely been investing for more than three or four years, and they note that more of their fellow investors are now actively studying the sector.
chart 9. categorizing infrastructure
“Within our portfolio, infrastructure investments are or will be placed ...”
50%
40%
30%
20%
10%
In Their Own Separate Allocation
In Our Private Equity Portfolio
In Our Real Estate Portfolio
In Our General Alternatives Portfolio
Other
Overall, 41% of the respondents to the survey place infrastructure investments in their private equity portfolios, while over 25% of respondents had a separate infrastructure allocation. Other investors placed their infrastructure investments either in their general alternatives or real estate portfolios. However, among experienced, active investors, the percentage of investors with a specific infrastructure allocation increases dramatically to 48%.
A clearer picture of what underlies these responses emerged as a result of our discussions with investors. Among experienced investors, many placed their original infrastructure investments in their private equity, real estate or general alternative portfolios while they tested the waters and investigated the infrastructure market. Then, once their infrastructure interest reached a critical stage and they began to hire dedicated investment staff, they migrated to a dedicated infrastructure allocation. Given this background, it is quite possible that the overall results of the survey for this question reflect a market in the early stages of transition to a more dedicated allocation based on the experience of investors who have been active in infrastructure for some period.
There remains disagreement among investors on the precise definition of an “infrastructure investment.” A number of investors consider funds focused on energy investments to be infrastructure funds, while the majority considers the return profile of energy funds more appropriate for a private equity allocation. For many investors, any fund with an average expected return greater than 12% falls outside the norm for infrastructure while others expect returns of 15% or higher. These expectations will be discussed in greater detail, below.
17.0%
11.1%
17.0%
3.7%
11.3%14.8%
40.6%
37.0%
25.5%
48.1% Base Overall Respondents Experienced Investors
it is quite possible that the overall results of the survey for this question reflect a market in the early stages of transition to a more dedicated allocation.

25 investing in infrastructure funds
chart 10. 2007 infrastructure allocations
“For 2007, our allocation to infrastructure commitments is ...”
60%
50%
40%
30%
20%
10%
Up to $50M $50M–$100M $100M–$250M $250M–$500M > $500M No Specific Allocation
Other
Exactly half of respondents had no specific allocation to infrastructure investments for 2007. This is not entirely surprising given that so many investors either invest opportunistically or are in the early stages of investigating infrastructure. A clearer allocation picture emerges in Chart 10, above, when focusing on the results reported by experienced investors, with nearly 50% of those investors having allocations of $100 million or less, while nearly 30% of those respondents have allocations of $250 million or more.
In our individual discussions we also found that a number of the largest experienced investors were very focused on co-investments, and had active programs in place to utilize their fund investment programs to generate co-investment deal flow. There was also an expectation that since transaction sizes in infrastructure can be quite large, individual co-investment opportunities would also be large as well. Some of our discussions with experienced investors found allocations of as much as or greater than $10 billion.
7.6%
14.8%
50.0%
14.8%
3.8%3.7%1.9%
14.8%
4.7%
22.2%
12.3%
25.9%
20.8%
Base Overall Respondents Experienced Investors
3.7%
exactly half of respondents had no specific allocation to infrastructure investments for 2007.

26 investing in infrastructure funds
chart 11. 2008 appetite for infrastructure
“I believe that my firm’s appetite for infrastructure investments in 2008 ...”
40%
30%
20%
10%
Will Increase from 2007
Will Decrease from 2007
Will Remain Basically the Same
Will Continue to Be Opportunistic Based Upon
Market Conditions and Available Opportunities
Other
To establish investment appetite over the short term we asked respondents if they expected changes in their 2008 outlook on the sector.
Investors were overwhelmingly optimistic going forward; 34% stated that their appetites would increase; and 31% said that it would remain the same, with another 30% reporting that they would continue to be opportunistic based upon market conditions and available options. Though not reflected separately in the graph above, 52% of active investors reported that their appetite was likely to increase next year.
It is also notable that just 1% of all respondents felt that their future allocations would decrease, reflecting general overall optimism about this investment sector.
34.9%
29.3%31.1%
0.9%3.8%

27 investing in infrastructure funds
chart 12. targeted returns for infrastructure
“Our targeted returns for infrastructure investments are ...”
40%
30%
20%
10%
< 10% Per Annum
10%–12% Per Annum
13%–15% Per Annum
16%–18% Per Annum
19%–22% Per Annum
> 22% Per Annum
Other
Fifty-four percent of respondents targeted infrastructure returns of between 10% and 15%, with the tails of the distribution declining sharply in either direction. Though no one targeted returns of greater than 23%, the most common response in the “Other” category was that their target depended upon the specific risk profile of the vehicle.
For experienced investors in the sector, results were even more clustered, with 67% of results in the 10% to 15%. In addition, targeted returns were noticeably lower, with 37% of Active Investors targeting returns of 10% to 12%.
Our individual discussions with investors uncovered the most impacting factor for expected investment performance: the investment strategy. Many of the experienced investors that we talked with, especially those with co-investment or direct investment programs, were focused on Brownfield investments because of their perceived risk return profile and their desire for investments generating current income.
Many of these same investors felt that targeted returns of greater than 15% were more appropriate for private equity funds and, thus not an infrastructure fund per se. For this reason, most energy-focused funds — even if self-defined as infrastructure funds — were not considered infrastructure vehicles by most currently active infrastructure investors. Interestingly, many private fund structures available in the market are not pure play Brownfield or Greenfield strategies, but instead have strategies that opportunistically pursue what the fund managers perceive as the best opportunities available in the market. In building these portfolios, fund managers focus on a wider array of risk factors that determine the attractiveness of a particular project and structure, and not simply whether a project can be described as Brownfield or Greenfield.
7.4%
16.0%
3.7%
7.6%
29.6%30.2%
11.1%
15.1%
37.0%
24.5%
11.1%
6.6%
Base Overall Respondents Experienced Investors
our individual discussions with investors uncovered the most impacting factor for expected investment performance: the investment strategy.

28 investing in infrastructure funds
chart 13. Geographic Focus
“My firm invests in infrastructure funds with investment mandates focused on ...”
70%
60%
50%
40%
30%
20%
10%
Global North America Other Europe Asia Latin America Middle East/Africa
Investors were asked if they had a preference for a particular geographic area. As noted previously, the vast majority of the respondents to the Survey were from North America and Western Europe, and the results reflect this bias. A majority of respondents cited a bias towards Global Infrastructure funds, followed by strong interest in North America. As noted above, the interest in North America was quite strong even among non-North American respondents, most of whom were from Western Europe.
There was little interest to invest in Asia or Latin America, and none of our respondents chose the Middle East/Africa as an area of interest, even though there has been considerable investment activity in the region, funded predominantly from regional institutional sources. It should be noted that none of the Middle Eastern or African investors we contacted responded to the survey. Also of note is that non-North American investors had a stronger attraction to European infrastructure investments.
Base Overall Respondents North American Respondents Non-North American Investors
the interest in north america was quite strong even among non-north american respondents.

29 investing in infrastructure funds
Since many infrastructure funds are opportunistic in their strategy, focusing on projects they consider to be attractive, they tend to contain a mix of assets with different natural maturity profiles. For this reason, there tends to be more variety in the structure of infrastructure funds than there is in private equity funds or real estate funds, for example.
In this question, investors were asked if they had a particular preference for the fund’s structure or life.
chart 14. Preferred term & Fund structures
“The preferred term of the private infrastructure vehicles we invest in is ...”
5% 10% 15% 20% 25% 30% 35%
The overall results here were quite different from those of the self-described “experienced, active” investors, as noted above. “No Preference” was the leading response, followed by “Standard 10-year life” and “Other”. (Most of the specific responses in the “Other” category were effectively either “No Preference” or “Don’t know enough to have an informed opinion”). For experienced investors, however, the leading response was “Hybrid 10-year structures”, with “Standard 10-year life” and “Evergreen structures” being next popular.
In our conversations with experienced investors, they were very aware of the potential conflicts that could arise when an asset with a natural life of 15 years or more was included in a 10-year vehicle, forcing it to be sold part way through that life. Though many of these investors were interested in hybrid terms and structures that could address these issues, none of the institutions we interviewed had yet identified a structure they believed to be optimal.
Standard 10-Year Private Equity Fund Life 27.4%
Evergreen Structures 5.7%
Hybrid 10-Year Structures That Allow for Asset Liquidation or Longer Holds at the Investor’s Choice 12.3%
No Particular Preference 34.0%
Fund Lives of 15 Years or Longer 6.6%
Other 14.2%
18.5%
18.5%
33.3%
14.8%
11.1%
3.7%Base Overall Respondents Experienced Investors
there tends to be more variety in the structure of infrastructure funds than there is in private equity funds or real estate funds.

30 investing in infrastructure funds
chart 15. investment structures
“As far as investment structures, my firm invests in (mark all that apply) ...”
100%
80%
60%
40%
20%
Private Infrastructure Funds
Co-Investments Alongside Fund Managers
Direct Investments Into Projects
Publicly Traded Infrastructure Vehicles
Other
Institutional investors can acquire exposure to infrastructure through a variety of vehicles including private funds, publicly listed and traded funds, dedicated secondary funds, co-investments or through doing direct investments.
As was the case with many other questions in the survey, there was a distinct difference between the overall responses and the responses from experienced investors. Only two categories, Private Funds and Co-Investments, were identified by 25% or more of investors as structures in which they had invested; for experienced investors every category was identified by 37% or more as one in which they were active. Interestingly, 41% of experienced investors had invested directly in projects separately from Co-Investments, an activity that is time and staff resource intensive and that would be extremely unusual in the private equity market.
Our individual discussions revealed that for some of the most experienced investors, the main thrust of their infrastructure programs was in Direct Investments and Co-Investments, and Private Fund investments were committed to sparingly as a way to strategically “prime the pump” to enhance deal flow for these other core activities.
24.5%
3.7%
17.0%
37.0%
17.9%
40.7%
24.5%
44.4%
72.6%
92.6% Base Overall Respondents Experienced Investors
For some of the most experienced investors, the main thrust of their infrastructure programs was in Direct investments and Co-investments.

31 investing in infrastructure funds
FOr thOse nOt investinG
chart 16. reasons for not investing in infrastructure
“My firm isn’t interested in infrastructure because (mark all that apply) ...”
5% 10% 15% 20% 25% 30% 35% 40% 45%
We inquired as to the reasons some investors said they would not be investing in infrastructure at all. The leading reason, chosen by 44% of respondents, was that they found the return profile unattractive. Still, 36% of the respondents stated that they might consider infrastructure investing in the future after their current alternative investment portfolio was more fully developed.
We Find the Return Profile Is Unattractive 44%
We May Consider Infrastructure Investing at a Later Date After Our Program Is More Fully Developed 36%
It Is Not Within Our Investment Mandate 28%
The Average Duration Is Too Long for Our Needs 20%
We Don’t Believe the Market Is Currently Developed Enough to Warrant a Specific Allocation 20%
Other 20%
Our Current Portfolio Allocation Serves Our Needs 28%

32 investing in infrastructure funds
Conclusion
Infrastructure investing as a recognized allocation within institutional investors’ portfolios is a very recent phenomenon for the majority of investors, especially in the U.S. Though new, it is gaining significant momentum for two basic reasons:
n Strong demand by institutional investors for current income generating, long-term assets that better match their long-term liabilities;
n Need for governments globally to find alternative financing methods to both build and maintain and operate public sector infrastructure.
Among alternative assets, the risk/return profile of infrastructure investments falls between core real estate, fixed income, and private equity investments, and is not directly correlated with any of them. Though in this regard infrastructure is clearly a separate asset class, as a new sector in the process of being introduced to many investors, its status within portfolios, is clearly in flux. Many investors are performing reconnaissance on infrastructure investing by, at least temporarily, assigning investment responsibility for the sector to private equity, real estate or even fixed income staff. The long-term trend, however, is clearly to create specific infrastructure allocations managed by separate staffs.
As a developing asset class, a number of issues — from benchmarking to standard investment structures — remain unsettled. However, the pent up demand among governments for infrastructure projects and the attractive risk/return profile of infrastructure investments for long-term investors will engender continued interest in this sector as it inevitably develops into a sizeable autonomous allocation within most institutional portfolios.
the pent up demand among governments for infrastructure projects and the attractive risk/return profile will engender continued interest in this sector.

332007 private equity desk book & funds in or coming to market33 investing in infrastructure funds
appendix: selected third Party infrastructure Funds

34 investing in infrastructure funds
selected third Party infrastructure Fundsaugust 2007
Fund Size (MM) in $U.S. Unless Marked Note: Does not include Probitas-placed funds
Fund/Parent/Status: Current Last Web Site Year Founded Comments Offices
2i Capital Indian Infrastructure Development Fund / 2i Capital / In Market
500 N/A www.2icapital.com 2007 First Indian Shariah compliant infrastructure fund Bangalore
3i Indian Infrastructure Fund / 3i / In Market 1,000 N/A www.3i.com 2007 Joint venture betwee 3i and the India Infrastructure Finance Company; 3i is committing $500mm to the fund from its publicly traded fund
Mumbai, London
ABN AMRO Infrastructure Capital Equity Fund / ABN AMRO / Recently Closed
€1,000 N/A www.capital.abnamro.com 2005 First infrastructure effort of this European commercial bank; the fund will focus on investing in Europe
Amsterdam
ABN AMRO Renewable Energy Fund / ABN AMRO / In Market
€200 N/A www.capital.abnamro.com 2005 Focused on environmentally friendly infrastructure projects
Amsterdam
Abraaj Infrastructure and Growth Capital Fund / Abraaj / In Market
2,000 N/A www.abraaj.com 2005 Fund has a broad infrastructure investment mandate; one of a series of funds launched recently by this UAE based institution
Dubai
Abu Dhabi Investment Infrastructure / Abu Dhabi Investment Company / In Market
1,000 N/A www.adic.ae 2006 Launched in conjunction with IL&FS, focused on Asia, the Middle East and Africa
Abu Dhabi
AIG Highstar Capital III / AIG / In Market 3,000 800 www.aiggig.com 2000 Fund sponsored by AIG originally focused on energy, now with a broader investment mandate
New York
Alinda Capital Partners I / Alinda Capital Partners / Recently Closed
3,000 N/A www.alinda.com 2005 Core of the group spun out of Citigroup; focused on North America and Europe
New York, London
Alterna Core Capital Asset Fund / Alterna Capital / In Market
1,000 N/A www.alternacapital.com 2007 Focused on transportation, industrial and energy capital assets in developed economies
Westport, CT
Babcock & Brown Infrastructure Fund North America / Babcock & Brown / In Market
2,000 N/A www.babcockbrown.com 2006 Unlisted fund organized and overseen by a listed Australian company with deep experience in infrastructure
San Francisco, New York, Sydney
Barclays European Infrastructure Fund II / Barclays / Recently Closed
£280 £178 www.barcap.com 1996 One of the more established European infrastructure players that has managed 5 separate fund vehicles
London
Brookfield Infrastructure Fund I / Brookfield Asset Management / Coming to Market
2,000 N/A www.brookfield.com 2007 New vehicle being launched by this Canadian asset manager
Toronto, New York, London
Carlyle Infrastructure Fund I / Carlyle / In Market
1,000 N/A www.thecarlylegroup.com 2005 First infrastructure effort of this large private equity fund group that sponsors funds in many strategies
New York
Carlyle Riverstone Renewable Energy Infrastructure / Carlyle / Recently Closed
685 N/A www.thecarlylegroup.com 2005 First infrastructure effort of this Carlyle affiliate New York
Central American Mezzanine Infrastructure Fund I / EMP Global / In Market
150 N/A www.empglobal.com 2005 First Central American vehicle of this emerging market specialist
Washington
Citigroup Infrastructure Investors / Citigroup / In Market
3,000 N/A www.citigroupai.com 2007 Sponsored by the US investment bank, it targets infrastructure investments in developed markets
New York
Colonial First State European Diversified Infrastructure Fund / Colonial First State Asset Management / In Market
€1,500 N/A www.cfsgam.com.au 1988 Evergreen vehicle focused on Europe run by an established Australian money manager
London, Sydney
DIB Infrastructure Fund I / Dubai Investment Bank / In Market
500 N/A www.alislami.co.ae 2005 One of a number of private equity funds recently launched by the Dubai Investment Bank, focused on the Middle East
Dubai
ECP MENA Fund I / ECP / Recently Closed 523 N/A N/A 2006 Team spinning out of EMP focused on the Middle East and North Africa
Washington
EMP Indonesia Infrastructure Fund / Emerging Markets Partners / In Market
1,000 N/A www.empglobal.com 2006 Indonesian vehicle of this emerging markets specialist Washington, Singapore, Hong Kong
EQT Infrastructure Fund / EQT / Coming to Market
€1,000 N/A www.eqt.se 2007 Newly forming group focused on Scandinavia being launched by EQT, a large private equity firm
Stockholm
GIMV-DEXIA Infrastructure Fund I / GIMV / In Market
€100 N/A www.gimv.com 2007 Targets infrastructure-investments in transport and utilities as well as real estate construction and Public Private Partnerships (PPP); has a primary focus on the Benelux and secondary the rest of Northern Continental Europe.
Antwerp

35 investing in infrastructure funds
Fund Size (MM) in $U.S. Unless Marked Note: Does not include Probitas-placed funds
Fund/Parent/Status: Current Last Web Site Year Founded Comments Offices
GS Infrastructure Partners I / Goldman Sachs / Recently Closed
6,500 N/A www.gs.com/pe 2006 Global infrastructure fund sponsored by Goldman Sachs New York, London
Guggenheim Infrastructure Fund / Guggenheim Partners / In Market
1,000 N/A www.guggenheimpartners.com
2006 Global vehicle with a broad infrastructure focus New York
Gulf One Infrastructure Fund I / Gulf One Bank / In Market
2,000 N/A www.gulf1bank.com 2006 Primary focus in GCC countries Bahrain
Hastings Private Equity Fund II / Hastings Funds Management / Recently Closed
180 AUD 97 www.hfm.com.au 1994 Hastings Funds Management is involved in timber, fixed income and private equity investing as well as infrastructure; mainly focused in Australia
Melbourne, Sydney
HBG Infrastructure / HBG Holdings / In Market 200 N/A www.hbgholdings.com 2006 Focused on infrastructure investments in India and Pakistan
Dubai
Henderson Private Finance Initiative Secondary Fund II / Henderson Private Capital / Recently Closed
£574 £330 www.hendersonprivatecapital.com
2001 Focused on secondary purchases of PFIs (Public Finance Initiatives) in the UK and Europe
London
IDFC Private Equity Fund II / IDFC Private Equity / In Market
2,000 440 www.idfc.com 2004 Focused on Indian infrastructure Mumbai
India Global Competitive Fund / SREI Infrastructure Finance / In Market
INR10,000 N/A www.srei.com 1989 Focused on infrastructure investing in India Calcutta, Bangalore, Mumbai, New Delhi
Infracapital Partners / Prudential Plc / In Market
£1,000 N/A www.prumandg.com N/A Managed by the investment management arm of Prudential Plc, its main focus will be traditional infrastructure investments in Western Europe
London
ING Atlas Infrastructure Fund / ING Real Estate Investment Management / In Market
€1,000 N/A www.ing.com 1995 Sponsored by ING Bank, focused on investing in Europe London
Innisfree PFI Fund III / Innisfree / Closed £360 £150 www.innisfree.co.uk 1995 Focused on PPP and PFI transactions in the UK and Europe London
Innisfree Secondary Fund 2006 / Innisfree / Recently Closed
£350 £225 www.innisfree.co.uk 1995 Long term secondary fund basically formed to hold assets from Innisfree PFI Fund II
London
International Infrastructure Financing Pakistan Fund / 2if / In Market
500 N/A N/A 2007 Focused on Pakistan, key team members came from various international banks
Dubai
KB Asset Management Infrastructure Fund / KB Asset Management / Recently Closed
KRW 1,200,000
N/A www.kbam.co.kr 2006 Korean focused infrastructure vehicle Seoul
Korea Emerging Infrastructure / Darby Overseas / Recently Closed
KRW 580,000
N/A www.darbyoverseas.com 2006 Korean focused infrastructure vehicle of this emerging markets fund manager
Seoul, Washington
Macquarie European Infrastructure Fund II / Macquarie Bank / Recently Closed
€4,600 €1,500 www.macquarie.com.au 2000 Part of the largest investment bank in Australia, Macquarie runs a series of infrastructure funds with various geographic or industry focuses; fund orginally targeted €3 billion
London, Sydney
Macquarie Infrastructure Partners / Macquarie Bank / Closed
4,000 N/A www.macquarie.com.au 2000 Part of the largest investment bank in Australia, Macquarie runs a series of infrastructure funds with various geographic or industry focuses; this fund is focused on North America
New York, Sydney
Macquarie Korean Opportunities Fund / Macquarie Bank / Recently Closed
350 N/A www.macquarie.com.au 2000 Korean focused vehicle of this large infrastructure player Seoul, Sydney
Macquarie Telecommunications Infrastructure I /Macquarie Bank / Coming to Market
3,000 N/A www.macquarie.com.au 2000 Part of the largest investment bank in Australia, Macquarie runs a series of infrastructure funds with various geographic or industry focuses
New York, London, Sydney
MENA Infrastructure Fund / In Market 500 N/A www.dubaiic.com 2005 Sponsored by the government of Dubai and HSBC, the fund is focused on infrastructure investments in the Middle East and Africa
Dubai
Meridiam Infrastructure / Credit Agricole Private Equity / In Market
€600 N/A www.privateequity.creditlyonnais.com
2006 Focused on Public Private Partnerships in OECD countries Paris
Merrill Lynch Infrastructure Fund I / Merrill Lynch / Coming to Market
2,000 N/A www.merrilllynch.com 2007 First infrastructure fund to be sponsored by this investment bank
New York
J.P. Morgan Infrastructure Investments Fund / J.P. Morgan / In Market
Open fund structure www.jpmorganpartners.com
2007 Vehicle sponsored by J.P. Morgan with a global remit New York
Morgan Stanley Infrastructure / Morgan Stanley / In Market
3,000 N/A www.morganstanley.com N/A Fund has a broad infrastructure investment mandate New York

36 investing in infrastructure funds
Fund Size (MM) in $U.S. Unless Marked Note: Does not include Probitas-placed funds
Fund/Parent/Status: Current Last Web Site Year Founded Comments Offices
New Africa Infrastructure Fund / Decorum Capital / In Market
R 1,000 N/A www.newafricaminingfund.co.za
N/A Managed by Decorum Capital, a manager of mining funds Dunkeld, South Africa
NGP Energy Infrastructure and Resource Partners / Natural Gas Partners / In Market
1,500 N/A www.naturalgaspartners.com
1988 First infrastructure fund raised by this manager of a number of energy funds; focused on energy and mining infrastructure in North America
Irving, TX
NIBC European Infrastructure Fund I / NIBC / In Market
500 N/A www.nibc.com 2007 Targets sectors such as healthcare, education, government accommodation, social infrastructure, waste management, roads, transportation (rail roads), logistics, renewable energy, waste-to-energy projects, oil and gas processing and distribution. The fund’s regional focus is Europe specifically UK, Benelux and Germany.
Den Haag, Netherlands
Old Lane India Specific Fund / Old Lane Partners / Recently Closed
500 N/A www.oldlane.com 2006 Founded by a New York City based financial manager of hedge funds and private equity funds; manager was recently purchased by Citibank
New York
Pan African Infrastructure Development Fund / In Market
1,000 N/A www.paif.com 2005 Focused on telecomms, transportation and energy infrstructure in Africa
Pretoria
Pan Asia Project Development Fund / Infrastructure Leasing & Financial Services / In Market
100 N/A www.ilfsinvestmentmanagers.com
1996 Focused on India, Malaysia, Thailand and the Philippines; the fund is sponsored by Infrastructure Leasing & Financial Services Ltd.
Mumbai, Bangalore
RREEF North American Infrastructure Fund / Deutsche-RREEF / In Market
500 N/A www.rreef.com N/A Long time real estate investor now developing a significant infrastructure presence
New York, Sydney, London
RREEF Pan-European Infrastructure Fund / Deutsche-RREEF / Recently Closed
€2,000 N/A www.rreef.com N/A Long time real estate investor now developing a significant infrastructure presence
New York, Sydney, London
Saratoga Capital Indonesia Fund / Saratoga Investama Sedaya / In Market
500 N/A N/A 1998 Founded by Edwin Soeryadjaya, an extremely wealthy Indonesian
Jakarta
STAR II / Star Capital / Recently Closed 1,000 €581 www.star-capital.com 2000 Involved in both investment and advisory services in capital assets in Western Europe
London
Starwood Energy Infrastructure Fund / Starwood Energy Group / Coming to Market
3,000 N/A www.starwoodcapital.com 2005 Group founded in 2005 by this long time real estate investor
Greenwich, CT
Thomas Weisel India Infrastructure Fund / Thomas Weisel Partners / In Market
200 N/A www.tweisel.com 2007 Founded by a US boutique investment bank, though focused on India
San Francisco, Mumbai
UTI India Fund / UTI Bank / In Market 500 N/A wwwutibank.com 2007 Focused on Indian infrastructure, has a $50 million commitment from its sponsor
Mumbai

san Francisco425 california streetsuite 2300san francisco, ca 94104tel 415.402.0700fax 415.402.0052
new York1251 avenue of the americassuite 2390new york, ny 10020tel 212.403.3662fax 212.403.3537
londonnew courtst. swithins lanelondon ec4p 4dutel 44.20.7280.5801fax 44.20.7280.1866