Investigation of Pallet Stacking Pattern on Unit Load Bridging
101
Investigation of Pallet Stacking Pattern on Unit Load Bridging Eduardo Molina Montoya Thesis submitted to the faculty of the Virginia Polytechnic Institute and State University in partial fulfillment of the requirements for the degree of Master of Science In Forest Products Laszlo Horvath, Committee Chair Marshall S. White Brad A. Gething May 4 th , 2017 Blacksburg, VA Keywords: pallets, stacking patterns, packaging, unit load, unit load interactions
Transcript of Investigation of Pallet Stacking Pattern on Unit Load Bridging

Investigation of Pallet Stacking Pattern on Unit Load Bridging
Eduardo Molina Montoya
Thesis submitted to the faculty of the Virginia Polytechnic Institute and
State University in partial fulfillment of the requirements for the degree of
Master of Science
In
Forest Products
Laszlo Horvath, Committee Chair
Marshall S. White
Brad A. Gething
May 4th, 2017
Blacksburg, VA
Keywords: pallets, stacking patterns, packaging, unit load, unit load interactions
Investigation of Pallet Stacking Pattern on Unit Load Bridging
Eduardo Molina Montoya
ACADEMIC ABSTRACT
The optimization of pallet design in today’s competitive supply chain is imperative to
reduce costs and improve sustainability. With over two billion pallets in circulation in the United
States, most packaged products are handled using unit loads and the interactions between the unit
load components are not being considered in the pallet design process. This study aims to
investigate the effect of the interlocking of layers and the pallet stacking patterns on pallet bending.
This effect is part of a greater encompassing observed behavior known as load bridging, where a
redistribution of the stresses on the pallet dependent on the characteristics of the load is generated.
The bending of the unit load was measured under four common support conditions,
warehouse racked across the width and length, fork tine support across the width and floor
stacking. Five different pallet stacking patterns were then analyzed, comparing different
interlocking levels, from column stacking to fully interlocking.
It was identified that interlocking the layers causes a reduction in pallet deflection of up to
53% versus column stacking, and is more significant on lower stiffness pallets. The stacking
patterns and interlocking levels also presented an effect on pallet deflection, albeit only for very
low stiffness pallets when supported on its weakest components.
A relationship between the observed results and a ratio of load and pallet stiffness was
conducted, suggesting that when the load on the pallet is not significantly high in relation to the
stiffness, load bridging won’t be observed. These results provide a guideline on improving pallet
design and help furthering the understanding of the load bridging effect.

Investigation of Pallet Stacking Pattern on Unit Load Bridging
Eduardo Molina Montoya
GENERAL AUDIENCE ABSTRACT
The optimization of pallet design in today’s competitive supply chain is imperative
to reduce costs and improve sustainability. With over two billion pallets in circulation in
the United States, most packaged products are handled using unit loads and the interactions
between the unit load components are not being considered in the pallet design process.
This study aims to investigate the effect of the interlocking of layers and the pallet stacking
patterns on pallet bending. This effect is part of a greater encompassing observed behavior
known as load bridging, where a redistribution of the stresses on the pallet dependent on
the characteristics of the load is generated.
Tests were conducted to measure the pallet bending performance under common
scenarios, evaluating the effect of five different pallet stacking patterns. It was identified
that when the layers of a unit load are interlocked, the pallet presents lower deflection (up
to 53%).
A relationship between the observed results and a ratio of load and pallet stiffness
was conducted, suggesting that when the load on the pallet is not significantly high in
relation to the stiffness, load bridging won’t be observed.
These results provide a guideline on improving pallet design and help furthering
the understanding of the load bridging effect.
iv
TABLE OF CONTENTS
Chapter 1: Introduction ................................................................................................... 1
Chapter 2: Literature Review .......................................................................................... 5
2.1 Pallets ............................................................................................................................. 5
2.1.1 Introduction and history of Pallets ............................................................................. 5
2.1.2 Pallet Materials........................................................................................................... 5
2.1.3 Pallet Classes .............................................................................................................. 7
2.1.4 Additional Classifications .......................................................................................... 9
2.1.5 Pallet sizes, usage and popularity ............................................................................. 10
2.1.6 Pallet performance and testing ................................................................................. 11
2.2 Corrugated boxes .......................................................................................................... 13
2.2.1 Introduction and history of corrugated boxes .......................................................... 13
2.2.2 Corrugated boxes classifications .............................................................................. 14
2.2.3 Corrugated box performance and testing ................................................................. 18
2.3 Containment Methods .................................................................................................. 20
2.4 Unit Load ...................................................................................................................... 21
2.4.1 Introduction and history of the Unit Load Concept ................................................. 21
2.4.2 Stacking Patterns in Unit Loads ............................................................................... 22
2.4.3 Systems based Unit Load Design ............................................................................. 29
2.4.4 Interactions between Unit Load components ........................................................... 29
Chapter 3: Materials, Methods and Experimental Design ......................................... 35
3.1 Materials ....................................................................................................................... 35
3.1.1 Pallets ....................................................................................................................... 35
3.1.2 Corrugated Boxes ..................................................................................................... 37
3.1.3 Unit Load ................................................................................................................. 39
3.2 Methods ........................................................................................................................ 39
3.2.1 Pallet Stacking Patterns ............................................................................................ 39
3.2.2 Support Conditions ................................................................................................... 42
3.3 Experimental Design .................................................................................................... 47
Chapter 4: Results and Discussion ................................................................................ 49
4.1 Pallet deflection when racked across the width ............................................................ 49

v
4.2 Pallet deflection when racked across the length ........................................................... 51
4.3 Pallet deflection when supported on fork tines across the width .................................. 53
4.4 Pallet deflection when stacked on floor ........................................................................ 57
4.5 Effect of pallet stiffness in load bridging ..................................................................... 60
Chapter 5: Conclusions .................................................................................................. 62
Chapter 6: Recommendations for future research ...................................................... 64
References ........................................................................................................................ 65
Appendix A: Modulus of Elasticity (MOE) measurements for pallet components .. 71
Appendix B: Statistical analysis results for the effect of pallet stacking patterns on
pallet deflection ........................................................................................................................... 75
Appendix C: Data collected for the evaluation of the effect of pallet stacking
patterns on pallet deflection ....................................................................................................... 81

vi
List of Figures
Figure 1. Schematic Diagram of Typical Stringer Class Pallet, with Principal Parts Labeled (MH1
Committee, 2016) ........................................................................................................................... 8
Figure 2. Schematic Diagram of Typical Block Class Pallet, with Principal Parts Labeled (MH1
Committee, 2016) ........................................................................................................................... 9
Figure 3. Possible corrugated configurations (from Foster 2010). ............................................... 15
Figure 4. (a) Guillotinable and (b) non-guillotinable stacking patterns (From (Silva et al., 2016)).
....................................................................................................................................................... 23
Figure 5. Examples of possible pallet patterns (From (Heskett et al., 1964)). ............................. 24
Figure 6. Five basic stacking pattern forms. (From (Peleg & Peleg, 1976)). ............................... 25
Figure 7. Example of a column stacked unit load supported on a forklift. ................................... 28
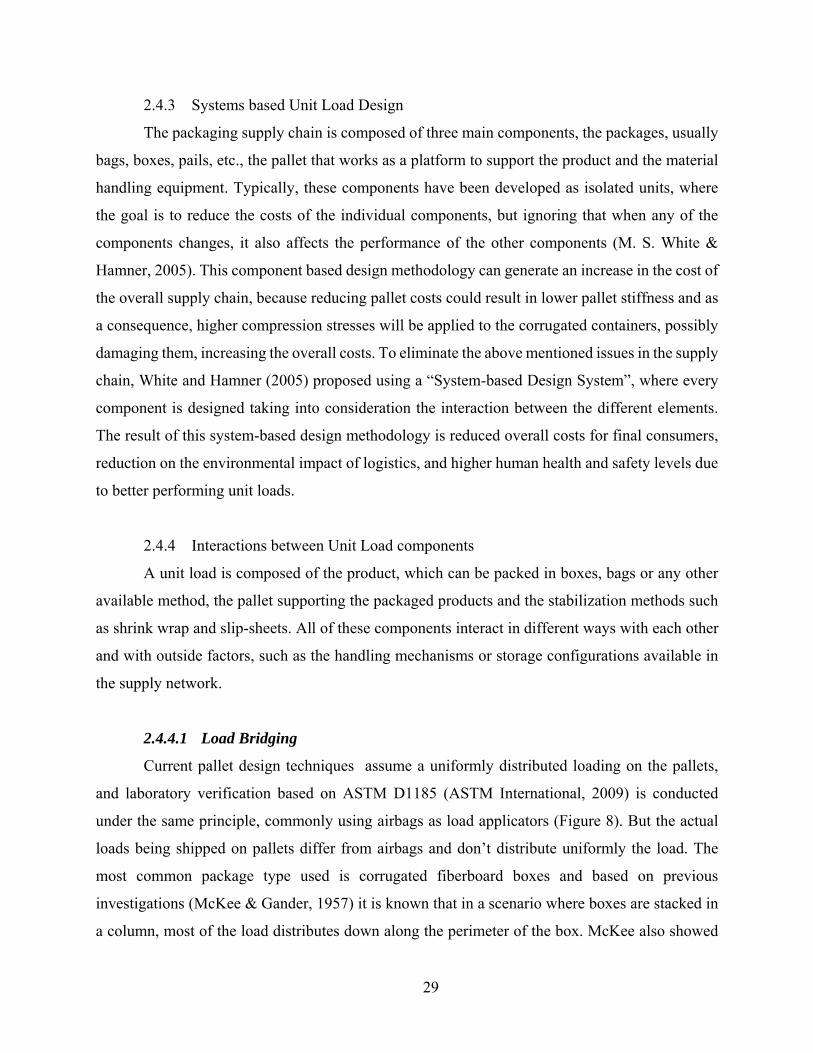
Figure 8. Pallet racked across the width under uniformly distributed loading with an airbag. .... 30
Figure 9. Experimentally observed load redistribution of a four-layer unit load on a racked across
the width pallet. ............................................................................................................................. 30
Figure 10. Experimental setup for the warehouse rack support across the width. ........................ 42
Figure 11. Identification of the pallet locations for the deflection measurements of the warehouse
rack support across the width. ....................................................................................................... 43
Figure 12. Experimental setup for the warehouse rack support across the length. ....................... 44
Figure 13. Identification of the pallet locations for the deflection measurements of the warehouse
rack support across the length test. ............................................................................................... 44
Figure 14. Experimental setup for the fork tine support across the width. ................................... 45
Figure 15. Identification of the pallet locations for the deflection measurements of the fork tine
support across the width test. ........................................................................................................ 46
Figure 16. Experimental setup for the floor support. .................................................................... 46
Figure 17. Identification of the pallet locations for the deflection measurements of the floor support
test. ................................................................................................................................................ 47
Figure 18. Average racked across the width pallet center deflection by stacking pattern and pallet
design. ........................................................................................................................................... 50
Figure 19. Average racked across the length pallet center deflection by stacking pattern and pallet
design. ........................................................................................................................................... 53

vii
Figure 20. Average fork tine support racked across the width pallet deflection by stacking pattern
and pallet design, on the right side of the pallet. .......................................................................... 55
Figure 21. Load transfer schematic of a column stacked Unit Load on a fork lift support across the
width. ............................................................................................................................................ 56
Figure 22. Average floor stacking pallet top deckboard deflection by stacking pattern and pallet
design. ........................................................................................................................................... 58
Figure 23. Schematic of load transfer in the floor stacking mode ................................................ 59
Figure 24. Top deckboard deflection measurement locations. ..................................................... 59
viii
List of Tables
Table 1. Common materials used for pallet manufacturing, advantages, disadvantages and uses
(adapted from (Clarke, 2004; Lacefield, 2015)). ............................................................................ 6
Table 2. Market share estimate and usage of pallets by different materials (adapted from (McCrea,
2016; The Freedonia Group, 2008)). .............................................................................................. 7
Table 3. ISO Standard Pallet Dimensions (Adapted from ISO 6780: 2003) ............................... 11
Table 4. Most common flute styles and characteristics (adapted from Dekker, n.d.; Foster 2010).
....................................................................................................................................................... 16
Table 5. Common nominal basis weights for linerboard and medium in the U.S. and similar
international grades (adapted from Steadman 2002) . .................................................................. 17
Table 6. Dimensions for the components of the pallets. ............................................................... 35
Table 7. Modulus of Elasticity (MOE) and Moisture Content (M.C.) for the pallet components.36
Table 8. Pallet stiffness for the low, medium and high stiffness designs under uniform loading. 36
Table 9. Performance estimation for the low, medium and high stiffness pallets based on The Pallet
Design System® computer model. ............................................................................................... 37
Table 10. Performance characteristics of the corrugated fiberboard used in the experimentation
phase. ............................................................................................................................................ 38
Table 11. Stacking Patterns developed for the study (Images generated using BestLoad®). ...... 41
Table 12. Experimental Designs for the Unit Load Deflection. ................................................... 48
Table 13. Average racked across the width pallet center deflection by stacking pattern and pallet
design. ........................................................................................................................................... 49
Table 14. Average racked across the width pallet ends deflection by stacking pattern and pallet
design. ........................................................................................................................................... 49
Table 15. Average racked across the length pallet center deflection by stacking pattern and pallet
design. ........................................................................................................................................... 52
Table 16. Average racked across the length pallet ends deflection by stacking pattern and pallet
design. ........................................................................................................................................... 52
Table 17. Average fork tine support racked across the width pallet deflection by stacking pattern
and pallet design, on the right side (A) of the pallet. .................................................................... 54
Table 18. Average fork tine support racked across the width pallet deflection by stacking pattern
and pallet design, on the left side (B) of the pallet. ...................................................................... 54

ix
Table 19. Diagrams of pallet patterns for the bottom layers. ........................................................ 56
Table 20. Average floor stacking pallet top deckboard deflection by stacking pattern and pallet
design. ........................................................................................................................................... 57
Table 21. Deflection of top deckboards under a floor stacking support at four locations. ........... 60
Table 22. Load-stiffness ratio for every pallet design under common support conditions with a
680kg payload. .............................................................................................................................. 61
1
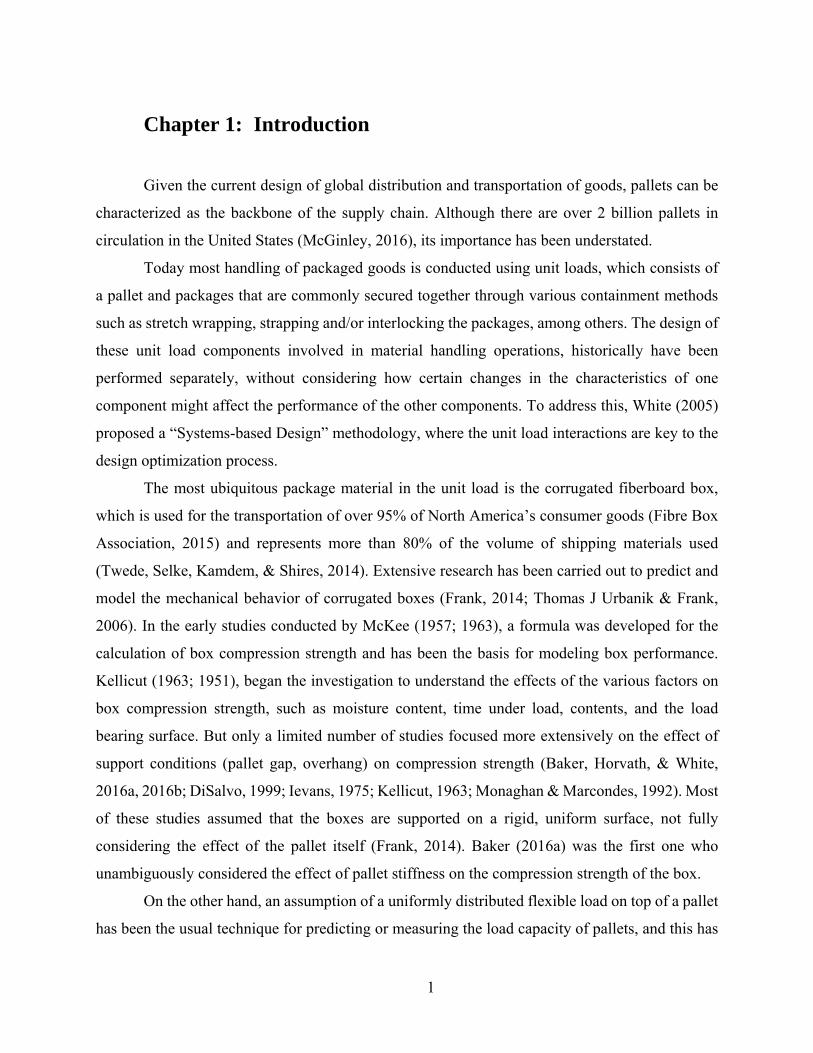
Chapter 1: Introduction
Given the current design of global distribution and transportation of goods, pallets can be
characterized as the backbone of the supply chain. Although there are over 2 billion pallets in
circulation in the United States (McGinley, 2016), its importance has been understated.
Today most handling of packaged goods is conducted using unit loads, which consists of
a pallet and packages that are commonly secured together through various containment methods
such as stretch wrapping, strapping and/or interlocking the packages, among others. The design of
these unit load components involved in material handling operations, historically have been
performed separately, without considering how certain changes in the characteristics of one
component might affect the performance of the other components. To address this, White (2005)
proposed a “Systems-based Design” methodology, where the unit load interactions are key to the
design optimization process.
The most ubiquitous package material in the unit load is the corrugated fiberboard box,
which is used for the transportation of over 95% of North America’s consumer goods (Fibre Box
Association, 2015) and represents more than 80% of the volume of shipping materials used
(Twede, Selke, Kamdem, & Shires, 2014). Extensive research has been carried out to predict and
model the mechanical behavior of corrugated boxes (Frank, 2014; Thomas J Urbanik & Frank,
2006). In the early studies conducted by McKee (1957; 1963), a formula was developed for the
calculation of box compression strength and has been the basis for modeling box performance.
Kellicut (1963; 1951), began the investigation to understand the effects of the various factors on
box compression strength, such as moisture content, time under load, contents, and the load
bearing surface. But only a limited number of studies focused more extensively on the effect of
support conditions (pallet gap, overhang) on compression strength (Baker, Horvath, & White,
2016a, 2016b; DiSalvo, 1999; Ievans, 1975; Kellicut, 1963; Monaghan & Marcondes, 1992). Most
of these studies assumed that the boxes are supported on a rigid, uniform surface, not fully
considering the effect of the pallet itself (Frank, 2014). Baker (2016a) was the first one who
unambiguously considered the effect of pallet stiffness on the compression strength of the box.
On the other hand, an assumption of a uniformly distributed flexible load on top of a pallet
has been the usual technique for predicting or measuring the load capacity of pallets, and this has
2
been conducted commonly using an airbag as load applicator in laboratory environments. Lofersky
et. al (1988) developed a reliability based method for the design of wooden pallets. Wooden pallets
are used by 96% of companies in the U.S. (McCrea, 2016). Additional research has been conducted
to improve the modeling capabilities of wooden pallets using the assumption of uniformly
distributed loading (Samarasinghe, 1987; T J Urbanik, 1985a, 1985b; B. S. White, 2008). This
technique provides a safe baseline and is necessary for a replicable modeling method but it was
proven to underestimate the load capacity of pallets carrying packages such as bags, boxes, pails,
etc. (Collie, 1984; Fagan, 1982). The underestimation is due to a phenomenon known as the load
bridging effect, that reduces stresses in the pallet because of a redistribution of the pressure along
the packages.
In order to characterize the load bridging effect, multiple studies have been conducted to
account for different compositions of the packages on top of a pallet, taking also into consideration
the available support conditions. Fagan (1982) conducted the first investigation on the subject
comparing four different load types (an airbag, two interlocked box loads and a platen-type load)
and concluded that the load type has a significant effect on the pallet stiffness and the magnitude
of the effect is dependent on the stiffness of pallet, being less for high stiffness pallets. This study
did not identify a significant difference between the two interlocking patterns used.
Collie (1984) further analyzed this load bridging effect. It was identified that when multiple
unit loads are stacked on the top of each other, the deflection of the top deckboards of the bottom
pallet does not increase proportionally to the amount of unit loads stacked. It was concluded that
only 80% of the weight of the second unit load and 66% of the third unit load contributed to the
bending of the top deckboard of the bottom pallet. Regarding the racking condition, an experiment
with seven load types was conducted, concluding that a significant difference exists on pallet
deflection when the rigidity of the load changes. Collie found differences among two interlocking
pattern of boxes when racked across the deckboards on a low stiffness pallet, but not on the higher
stiffness treatments or when racked across the stringers.
Park et al. (2017) confirmed that the size of the boxes and the flute type have a significant
effect on load bridging, increasing pallet deflection when box size decreases or when flute type is
less stiff. The type of containment method and force applied also has a significant effect on the
rigidity of the load, affecting unit load deflection(M. S. White, Dibling, Rupert, & Mcleod, 1999).
Yoo (2011), based on the principle of a beam on an elastic foundation, developed a model to

3
predict compressive stress distributions at the interface between the packages and the pallet, which
depends on deckboard stiffness, package stiffness and pallet joint fixity. Empirical data of these
studies showed that load bridging decreases pallet deflection for certain conditions, but its effect
on ultimate pallet strength has not been evaluated due to the fact that most packages fail at a lower
load than the necessary load to reach pallet failure.
The pallet stacking pattern, one of the factors affecting load bridging, has also been widely
investigated from different perspectives and multiple disciplines. Extensive literature and multiple
software packages can be found on solving the “Manufacturer’s Pallet Loading Problem”, which
focuses on finding the optimal or most efficient arrangement of a set of rectangular boxes on a
pallet, mainly to maximize volume utilization in transport(Silva, Oliveira, & Wäscher, 2016).
From the standpoint of the performance of corrugated boxes, research has been conducted to
measure the reduction in compression strength when using an interlocking pattern instead of a
columnar stacking pattern (DiSalvo, 1999; Frank, Gilgenbach, & Maltenfort, 2010; Ievans, 1975;
Kellicut, 1963; Monaghan & Marcondes, 1992). Additional investigations focused on
investigating how stacking pattern affects the stability of unit loads, taking advantage of it as an
alternative form of unit load containment method (Carpenter & Dowsland, 1985; Kocjan &
Holmström, 2010). Regarding the stacking pattern and its effect on pallet strength and stiffness, it
was identified that it has an effect on the bending resistance of the pallet but additional research is
required to further generalize the effect (Center for Unit-Load Design, 1997; Collie, 1984; Fagan,
1982; M. S. White et al., 1999). If, by interlocking the packages or varying the stacking pattern,
the deflection of the pallet can be reduced and load carrying capacity increased. Knowing its effect
can provide a useful tool for unit load designers to optimize material consumption.
Given the relevance of the stacking pattern in material handling and in the interactions
between the unit load components, the objective of this research is to investigate the effect of the
different pallet stacking patterns on the bending stiffness of the pallet.

4
Objectives
The main objective of the project is to investigate the effect of pallet stacking pattern on
the bending stiffness of the pallet.
Specific objectives of the project are
1) To investigate the effect of interlocking the layers of a unit load on the bending resistance
of the pallet, comparable to column stacking.
2) To investigate the effect of different stacking patterns on the bending resistance of the
pallet.
5
Chapter 2: Literature Review
2.1 Pallets
2.1.1 Introduction and history of Pallets
Currently in the United States, there are over 2 billion pallets in circulation (McGinley,
2016) and is expected to grow to around 2.6 billion by the year 2019 (The Freedonia Group, 2015),
conforming an industry with total revenues of over $7.9 billion dollars (McGinley, 2016). In 2011,
more than 416 million wooden pallets were produced and over 326 million were recovered,
remanufactured or repaired (Bush & Araman, 2014).
The development of the pallet was closely related to the invention and advance of the
forklifts. Between the years 1887 and 1909, the first low lift trucks where developed, which were
able to carry skids inside the factories, facilitating the material handling. Fork lift design
improvements continued until around the year 1925, when forklifts began to be constructed with
a cantilever fork design and were able to carry higher loads. This flexibility in the forklift added
pressure to the design of the skids, changing the appearance of the pallet to roughly how we know
it today. In the next years, although the benefits where evident, the utilization expanded very
slowly, mostly due to the high costs of the handling equipment (LeBlanc & Richardson, 2003).
As the United States entered World War II, an urgency to optimize the logistics appeared.
The pallet was seen as an alternative to reduce the manual labor requirements by mechanizing the
material handling processes and reducing the time of the operations involved. By that time, a
specialized industry developed around the pallet manufacturing. When the war ended, pallet
demand contracted dramatically, but it had been now widely demonstrated the benefits of unitizing
the products (LeBlanc & Richardson, 2003). In the following years, different industries began
adopting the use of pallets, up to the point now, where around 80% of U.S. trade moves on one of
them (Mazeika Bilbao, Carrano, Hewitt, & Thorn, 2011).
In order to properly identify pallets, the ANSI MH1:2016 standard, recommends specifying
the class, use, type, style, bottom deck, size, and design (MH1 Committee, 2016).
2.1.2 Pallet Materials
The first material for the production of pallets was wood and its dominance did not change
significantly since the introduction of the first units. Projections conducted for pallet industry

6
estimate that by 2019, an 84 percent of the available units will be in the form of wooden pallets,
and it will represent a 93% of total sales (The Freedonia Group, 2015). In the last years, different
alternatives were developed for the production of pallets, but their market share still remains small.
Table 1 summarizes the most commonly used materials in pallet manufacturing, including their
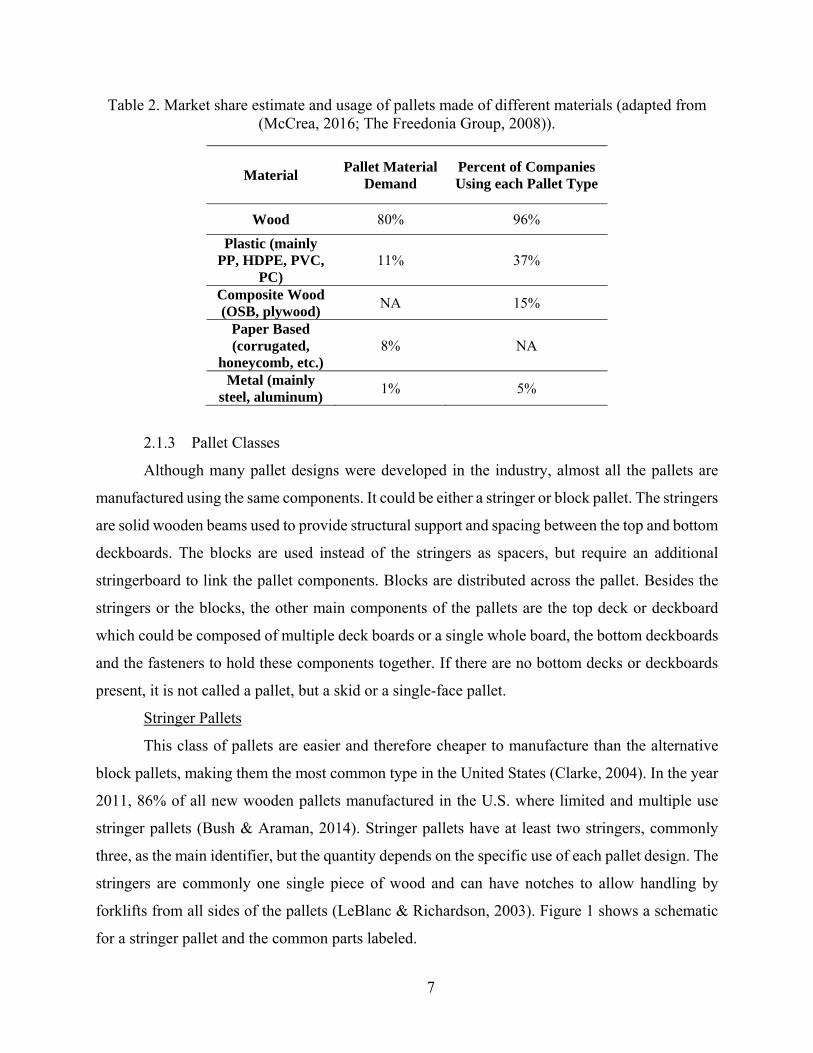
advantages and disadvantages and lastly the preferred use for each one. Table 2 shows the market
share estimate for each of the different materials and the percentage of the companies that use
either entirely or partially, each type of pallet.
Table 1. Common materials used for pallet manufacturing, advantages, disadvantages and uses (adapted from (Clarke, 2004; Lacefield, 2015)).
Material Advantages Disadvantages Preferred Uses
Wood Most research and design parameters developed for wood. Easy to prototype. Best cost/performance ratio.
Product damage by fasteners. Variability inherent to a natural material. Moisture desorption can affect packaging. Can harbor insects.
Extended use across almost all type of industries.
Plastic (mainly PP, HDPE, PVC, PC)
Durability. Sanitation. No fasteners. Broad design alternatives. Lightweight.
Higher initial cost. Low stiffness. Difficult to prototype and analyze. No remanufacturing possibility. Fire hazards.
Closed loop supply chains, high sanitation requirements
Composite Wood (OSB, plywood)
Lower cost than plastic or metal. Can be used when pest regulations forbid wood pallets. Easy to prototype.
Require fasteners. Low weather resistance. Expensive to repair.
Industries with pest regulations and at import/export operations.
Paper Based (corrugated, honeycomb, etc.)
Lightweight. Easily recyclable. Can be used when pest regulations forbid wood pallets.
Could be more expensive than wood. Performance dependent on moisture.
Industries with pest regulations. Airfreight with weight dependent costs.
Metal (mainly steel, aluminum)
Excellent durability, strength and stiffness. Sanitary. Recyclable.
High cost. Closed loop supply chains with heavy weight requirements.
7
Table 2. Market share estimate and usage of pallets made of different materials (adapted from (McCrea, 2016; The Freedonia Group, 2008)).
Material Pallet Material
Demand Percent of Companies Using each Pallet Type
Wood 80% 96%
Plastic (mainly PP, HDPE, PVC,
PC) 11% 37%
Composite Wood (OSB, plywood)
NA 15%
Paper Based (corrugated,
honeycomb, etc.) 8% NA
Metal (mainly steel, aluminum)
1% 5%
2.1.3 Pallet Classes
Although many pallet designs were developed in the industry, almost all the pallets are
manufactured using the same components. It could be either a stringer or block pallet. The stringers
are solid wooden beams used to provide structural support and spacing between the top and bottom
deckboards. The blocks are used instead of the stringers as spacers, but require an additional
stringerboard to link the pallet components. Blocks are distributed across the pallet. Besides the
stringers or the blocks, the other main components of the pallets are the top deck or deckboard
which could be composed of multiple deck boards or a single whole board, the bottom deckboards
and the fasteners to hold these components together. If there are no bottom decks or deckboards
present, it is not called a pallet, but a skid or a single-face pallet.
Stringer Pallets
This class of pallets are easier and therefore cheaper to manufacture than the alternative
block pallets, making them the most common type in the United States (Clarke, 2004). In the year
2011, 86% of all new wooden pallets manufactured in the U.S. where limited and multiple use
stringer pallets (Bush & Araman, 2014). Stringer pallets have at least two stringers, commonly
three, as the main identifier, but the quantity depends on the specific use of each pallet design. The
stringers are commonly one single piece of wood and can have notches to allow handling by
forklifts from all sides of the pallets (LeBlanc & Richardson, 2003). Figure 1 shows a schematic
for a stringer pallet and the common parts labeled.

8
Figure 1. Schematic Diagram of Typical Stringer Class Pallet, with Principal Parts Labeled (MH1 Committee, 2016)
Block Pallets
Block pallets are manufactured using wooden blocks, typically nine located at the corners,
center of the sides and the center of the pallet. These blocks function as spacers between top and
bottom decks. Additionally, a stringerboard is used to link the components at the top of the pallet.
The block pallet design allows for material handling equipment to access the pallet from all four
directions in most cases, helping the improvement of cube utilization and reducing the time of the
handling, increasing the popularity of this type of pallet (LeBlanc & Richardson, 2003). Block
pallets represented a 6% of new wooden pallets produced in the U.S. in 2011(Bush & Araman,
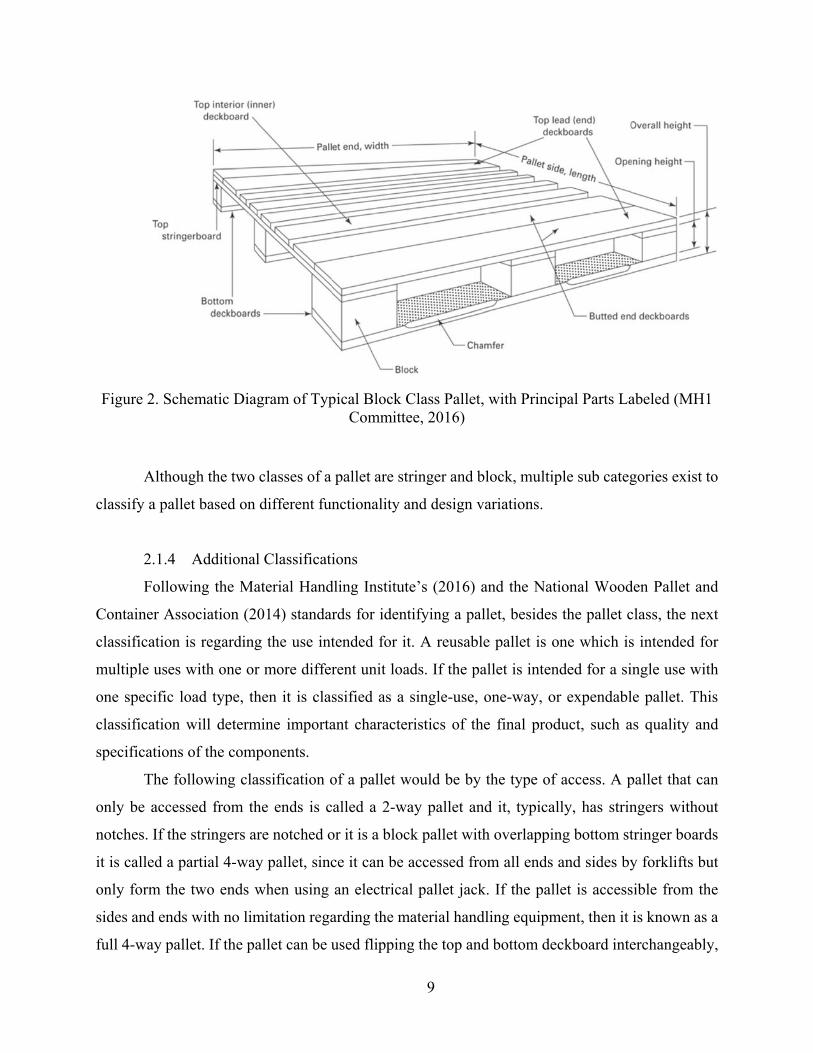
2014). Figure 2shows a schematic for a block pallet and the common parts labeled.
9
Figure 2. Schematic Diagram of Typical Block Class Pallet, with Principal Parts Labeled (MH1 Committee, 2016)
Although the two classes of a pallet are stringer and block, multiple sub categories exist to
classify a pallet based on different functionality and design variations.
2.1.4 Additional Classifications
Following the Material Handling Institute’s (2016) and the National Wooden Pallet and
Container Association (2014) standards for identifying a pallet, besides the pallet class, the next
classification is regarding the use intended for it. A reusable pallet is one which is intended for
multiple uses with one or more different unit loads. If the pallet is intended for a single use with
one specific load type, then it is classified as a single-use, one-way, or expendable pallet. This
classification will determine important characteristics of the final product, such as quality and
specifications of the components.
The following classification of a pallet would be by the type of access. A pallet that can
only be accessed from the ends is called a 2-way pallet and it, typically, has stringers without
notches. If the stringers are notched or it is a block pallet with overlapping bottom stringer boards
it is called a partial 4-way pallet, since it can be accessed from all ends and sides by forklifts but
only form the two ends when using an electrical pallet jack. If the pallet is accessible from the
sides and ends with no limitation regarding the material handling equipment, then it is known as a
full 4-way pallet. If the pallet can be used flipping the top and bottom deckboard interchangeably,
10
it is a reversible pallet, otherwise it is a non-reversible pallet that has specific bottom and top
deckboards.
The design of the base of the block pallet can be identified as three types. First, the
unidirectional base that consists of deckboards positioned all parallel in one direction. If the pallet
instead has deckboards in both directions and contains butted and endboards is known as a
perimeter base. Lastly, a cruciform base is similar to the perimeter base but including connector
boards in the center of the pallet.
One additional classification for the pallet design is the alignment of the stringers on the
sides with the ends of the deckboards or panel. If the ends of the deckboards are flush with the
stringer, it is called a flush pallet. Meanwhile, if the ends of the deckboards overhang the stringer
forming a cantilever at the end, it is called a wing pallet. Pallets with only top decks overhanging
are called single wing pallets. Pallets with both the top and bottom decks overhanging the stringers
are called double winged pallets.
2.1.5 Pallet sizes, usage and popularity
Pallet dimensions are usually specified as length by width, where the length of a pallet is
the length of the stringers or stringer boards while the width of the pallet is the length of the length
of the top deck boards (ISO, 2003). When pallet utilization began expanding, different sizes
emerged to fulfill specific needs. The most common dimensions were defined to optimize or at
least match the dimensions of the vehicles used in the region and/or the rest of the material
handling equipment used along the supply chain (Twede et al., 2014).
In an effort to standardize the pallet sizes the International Standard ISO 6780:2003 Flat
Pallets for intercontinental materials handling - Principal dimensions and tolerances was
developed, aiming to increase distribution efficiency. In this standard, six different plan
dimensions are proposed, three of which are rectangular and the other three square pallets.
Additionally, they are classified according to the region where the usage is more common.
11
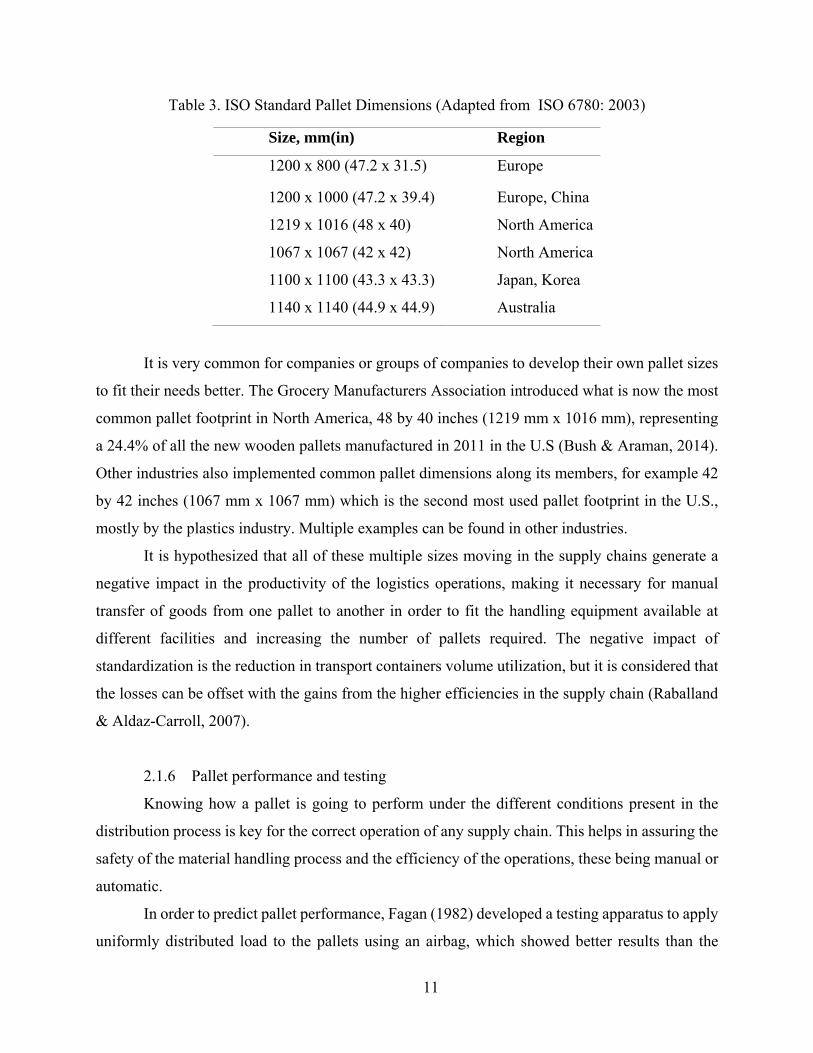
Table 3. ISO Standard Pallet Dimensions (Adapted from ISO 6780: 2003)
Size, mm(in) Region
1200 x 800 (47.2 x 31.5) Europe
1200 x 1000 (47.2 x 39.4) Europe, China
1219 x 1016 (48 x 40) North America
1067 x 1067 (42 x 42) North America
1100 x 1100 (43.3 x 43.3) Japan, Korea
1140 x 1140 (44.9 x 44.9) Australia
It is very common for companies or groups of companies to develop their own pallet sizes
to fit their needs better. The Grocery Manufacturers Association introduced what is now the most
common pallet footprint in North America, 48 by 40 inches (1219 mm x 1016 mm), representing
a 24.4% of all the new wooden pallets manufactured in 2011 in the U.S (Bush & Araman, 2014).
Other industries also implemented common pallet dimensions along its members, for example 42
by 42 inches (1067 mm x 1067 mm) which is the second most used pallet footprint in the U.S.,
mostly by the plastics industry. Multiple examples can be found in other industries.
It is hypothesized that all of these multiple sizes moving in the supply chains generate a
negative impact in the productivity of the logistics operations, making it necessary for manual
transfer of goods from one pallet to another in order to fit the handling equipment available at
different facilities and increasing the number of pallets required. The negative impact of
standardization is the reduction in transport containers volume utilization, but it is considered that
the losses can be offset with the gains from the higher efficiencies in the supply chain (Raballand
& Aldaz-Carroll, 2007).
2.1.6 Pallet performance and testing
Knowing how a pallet is going to perform under the different conditions present in the
distribution process is key for the correct operation of any supply chain. This helps in assuring the
safety of the material handling process and the efficiency of the operations, these being manual or
automatic.
In order to predict pallet performance, Fagan (1982) developed a testing apparatus to apply
uniformly distributed load to the pallets using an airbag, which showed better results than the

12
methods available at that time, which were based mostly on manually loading pallets with bags or
boxes and measuring deflection. This new method provided a constant rate of uniform load
application, providing greater testing capabilities.
Multiple standardized testing procedures have been developed to evaluate pallet
performance by simulating different scenarios found in the logistics operations. These tests are
designed to determine performance values such as the maximum safe load a pallet can carry under
different support condition or the durability of the pallet or some of its components.
ISO 8611 – Pallets for material handling – Flat Pallets (2011) provides a framework of
testing methods to simulate the normal use of a pallet in the material handling operations. It is
composed of four parts. Part 1 describes the tests methods used to determine the nominal load
capacity of the pallet. Part 2 describes the performance requirements for the various support
conditions and the selection of the tests. The results of the tests provide the nominal load of the
pallet, which corresponds to “the lowest safe load value for the specified support conditions,
independent of the type of load”(ISO/FDIS, 2011) and is a comparative value for evaluating pallet
performance, but not an actual payload. Part 3 describes the determination methodology of the
maximum working load capacity of the pallet. The maximum working load is the “greatest
payload that a pallet is permitted to carry in a specific loading and support condition” (ISO/FDIS,
2011) and can be lower or higher than the nominal load.
ASTM D 1185 Standard Test Methods for Pallets and Related Structures Employed in
Materials Handling and Shipping (2009) includes two major types of testing procedures, static
and dynamic tests. Static tests include compression and bending tests for estimation of stiffness,
strength and safe working loads. The results of these tests are dependent on the type of support
condition used and the load used. If the pallet designer is required to evaluate the durability and
functionality of the pallet, data provided from the dynamic testing is to be used. These tests include
corner and end drop tests, and a set of different incline impact tests. Overall, these standard tests
can be used to predict the performance characteristics of a pallet under specific material handling
and shipping environments, as well as classifying pallets as single or multiple use.
The MH1 - Pallets, Slip Sheets, and Other Bases for Unit Loads (2016) is a standard from
the Materials Handling Industry which provides guidelines for the standardization of pallet
dimensions, quality and characteristics for the different materials used in pallet manufacturing. It
13
also includes a protocol for testing pallet nails and staples and makes reference to other standards
for evaluating pallet performance, but does not includes testing protocols.
The National Wooden Pallet and Container Association (NWPCA) Uniform Standard for
Wood Pallets (2014) contains minimum quality requirements for pallet production. It begins with
a section covering the quality of materials used in the pallet, workmanship, tolerances and all the
guidelines necessary. Part 2 encompasses the performance evaluation of the pallets. In this sections
in makes reference to the two standards previously mentioned, as well as the evaluation of the
pallet design using computerized models in the software The Pallet Design System (PDS)©. Part 3
covers the phytosanitation of wood pallets.
Besides running physical tests to evaluate the performance of a pallet, predictive mathematical
models have been developed, using finite element analysis. These models are the backbone of the
current pallet design software packages in the market and accurately predict pallet deformation of
the simulated pallets when compared with field testing (Han, White, & Hamner, 2007).
2.2 Corrugated boxes
2.2.1 Introduction and history of corrugated boxes
Corrugated boxes are the most common shipping containers made from corrugated
fiberboard. The corrugated fiberboard is usually conformed of two outside papers, known as liners,
and a corrugated paper in the middle, known as the medium. Different arrangements can be made
by changing the medium design (flute) or adding additional layers and combinations of fiberboard
in order to adjust the container for each specific use (Dekker, 2013).
Corrugated boxes have been for more than a hundred years, the preferred shipping
containers for transporting almost every type of goods and currently represent 80% of the volume
of shipping materials used in the US (Twede, 2007). The development process began in the second
half of the nineteenth century, until reaching a wide usage of the corrugated boxes in the early
1900’s, supporting the need for moving the ever increasing amount of consumer goods being
manufactured (Twede, 2007).
In the year 1856, a patent was issued for the first corrugated material used for lining in tall
hats of Victorian Englishmen (Fibre Box Association, 2005). The material was further improved
and in 1871 Albert Jones of New York City received the patent for single face corrugated board,
being the first patent specifically granted for use as a packaging material (Jones, 1871; Twede,
14
2007). By 1894 in New York City, the first double-faced corrugated box was manufactured by
Thompson and Norris in order to be used for light express shipping by Wells Fargo (Twede, 2007).
In 1903, certain cereal manufacturers were allowed to ship their product on corrugated boxes and
by 1906 most carriers authorized the general use of fiber boxes, although charging a premium
versus wood packaging (Browder, 1935). After a long debate, railroad companies accepted the
transportation of goods packaged in corrugated boxes without charging any additional tariff. In the
year 1914 the Interstate Commerce Commission defined in the Prindham Decision that there were
no transportation differences between the corrugated boxes and the primary packaging product of
the time, wooden crates, prohibiting the railroads to charge any additional amount for the use of
corrugated containers (Twede, 2007).
Paper and paperboard packaging is currently the main material used for packaging in the
U.S., and is tied with plastics in worldwide usage. Of the different package forms produced from
paper and paperboard, the corrugated fiberboard packaging represented a 64% of the total value
of the shipments in the year 2011, and a total production for the industry of $26.1 billion in the
United States (Twede et al., 2014).
2.2.2 Corrugated boxes classifications
2.2.2.1 Corrugated board
The corrugated fiberboard, from which corrugated boxes are made from, is composed of
two structural elements, the linerboard and the medium. The facings of the corrugated board are
the linerboards and the medium is the fluting structure adhered to the liners (Fibre Box Association,
2005). These two elements are glued together using most commonly starch-base adhesive, which
allows to form a good bond at high manufacturing speeds (Twede et al., 2014).
Linerboards can be of several types, the most common being Kraft liner. This type of facing
is made from softwood fibers and can be mixed with recycled fibers. In the United States it is
consider “virgin” if at least 80% is new fiber (Maltenfort, 1988).
The corrugated medium is made by a similar process as the linerboards but from a different
type of pulp. It is normally made from recycled corrugated board or from virgin hardwood fibers.
This type of medium is known as semi chemical, due to the process of defibering by mechanical
and chemical processes. Although most packaging applications wouldn’t consider this type of fiber

15
acceptable, in the production of medium, it is beneficial to facilitate the corrugating process
without breaking the paper (Maltenfort, 1988; Twede et al., 2014).
These components are used together in different configurations. When only one layer of
liner is attached to the medium, it is known as a single face corrugated board, mostly used as a
wrapping material and shipped and sold in rolls. When two liners are attached, one on the inside
and other on the outside of the board it is called a double face board or single wall. Double or triple
wall corrugated boards are extensions of the arrangements possible between liners and mediums
(Twede et al., 2014). Figure 3 shows drawings for these configurations.
Figure 3. Possible corrugated configurations (from Foster 2010).
2.2.2.2 Flute types
The flutes or medium can be made in several different common standard sizes. These sizes
are characterized by the flute height and the number of flutes per linear distance (feet or meters)
and identified with letters. The thickest flute type is A and the most popular type is C-flute. The
sizes are not ordered correspondingly to the alphabet order but as they appeared historically, being
16
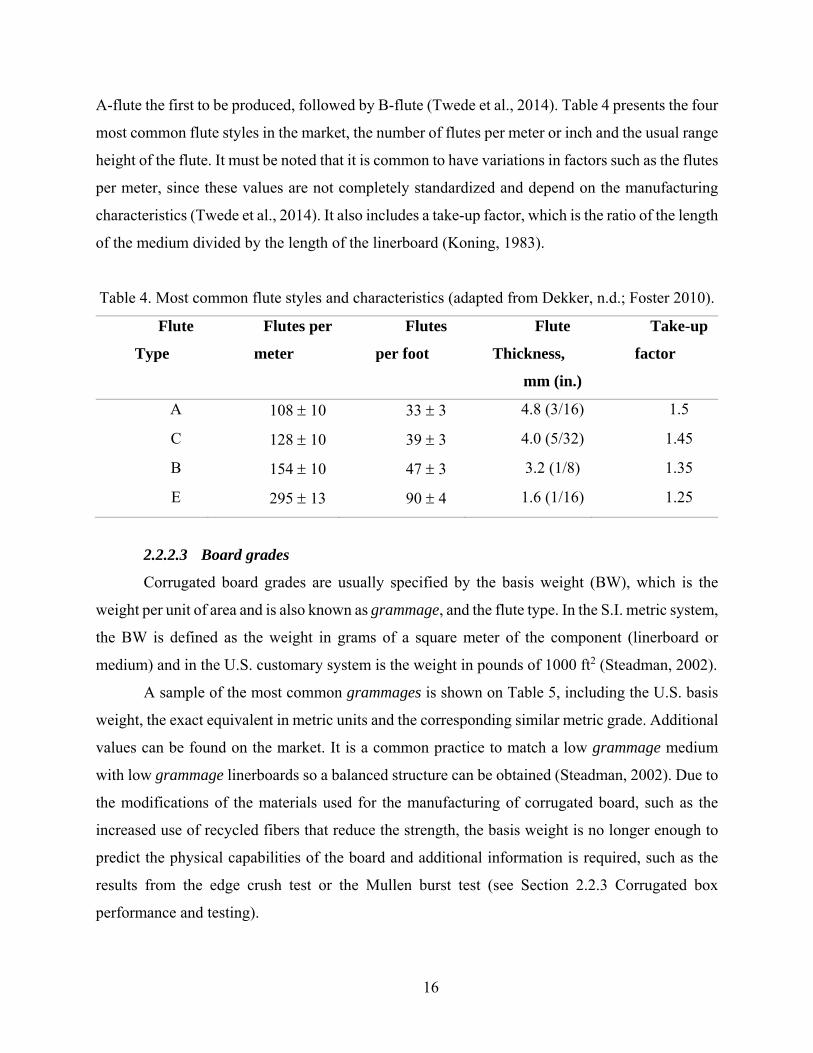
A-flute the first to be produced, followed by B-flute (Twede et al., 2014). Table 4 presents the four
most common flute styles in the market, the number of flutes per meter or inch and the usual range
height of the flute. It must be noted that it is common to have variations in factors such as the flutes
per meter, since these values are not completely standardized and depend on the manufacturing
characteristics (Twede et al., 2014). It also includes a take-up factor, which is the ratio of the length
of the medium divided by the length of the linerboard (Koning, 1983).
Table 4. Most common flute styles and characteristics (adapted from Dekker, n.d.; Foster 2010).
Flute
Type
Flutes per
meter
Flutes
per foot
Flute
Thickness,
mm (in.)
Take-up
factor
A 108 10 33 3 4.8 (3/16) 1.5
C 128 10 39 3 4.0 (5/32) 1.45
B 154 10 47 3 3.2 (1/8) 1.35
E 295 13 90 4 1.6 (1/16) 1.25
2.2.2.3 Board grades
Corrugated board grades are usually specified by the basis weight (BW), which is the
weight per unit of area and is also known as grammage, and the flute type. In the S.I. metric system,
the BW is defined as the weight in grams of a square meter of the component (linerboard or
medium) and in the U.S. customary system is the weight in pounds of 1000 ft2 (Steadman, 2002).
A sample of the most common grammages is shown on Table 5, including the U.S. basis
weight, the exact equivalent in metric units and the corresponding similar metric grade. Additional
values can be found on the market. It is a common practice to match a low grammage medium
with low grammage linerboards so a balanced structure can be obtained (Steadman, 2002). Due to
the modifications of the materials used for the manufacturing of corrugated board, such as the
increased use of recycled fibers that reduce the strength, the basis weight is no longer enough to
predict the physical capabilities of the board and additional information is required, such as the
results from the edge crush test or the Mullen burst test (see Section 2.2.3 Corrugated box
performance and testing).

17
Table 5. Common nominal basis weights for linerboard and medium in the U.S. and similar international grades (adapted from Steadman 2002) .
Common Basis Weight or Grammage
Linerboard Medium
U.S. customary
(lb/1000ft2)
Metric
System
(g/m2)
U.S. customary
(lb/1000ft2)
Metric
System
(g/m2)
26 125 26 125
33 150 28 140
38 175 30 150
42 200 36 175
47 225 40 200
69 339 42 200
Note: Relation between the common basis weights is not equivalent to the mathematical
conversion of the units.
2.2.2.4 Corrugated box styles
In order to be able to identify the different box styles, a collaboration between the European
Federation of Corrugated Board Manufacturers (FEFCO) and the European Solid Board
Association (ESBO), developed a classification method, assigning numerical codes to the different
styles of boxes according to their designs (Fibre Box Association, 2005).
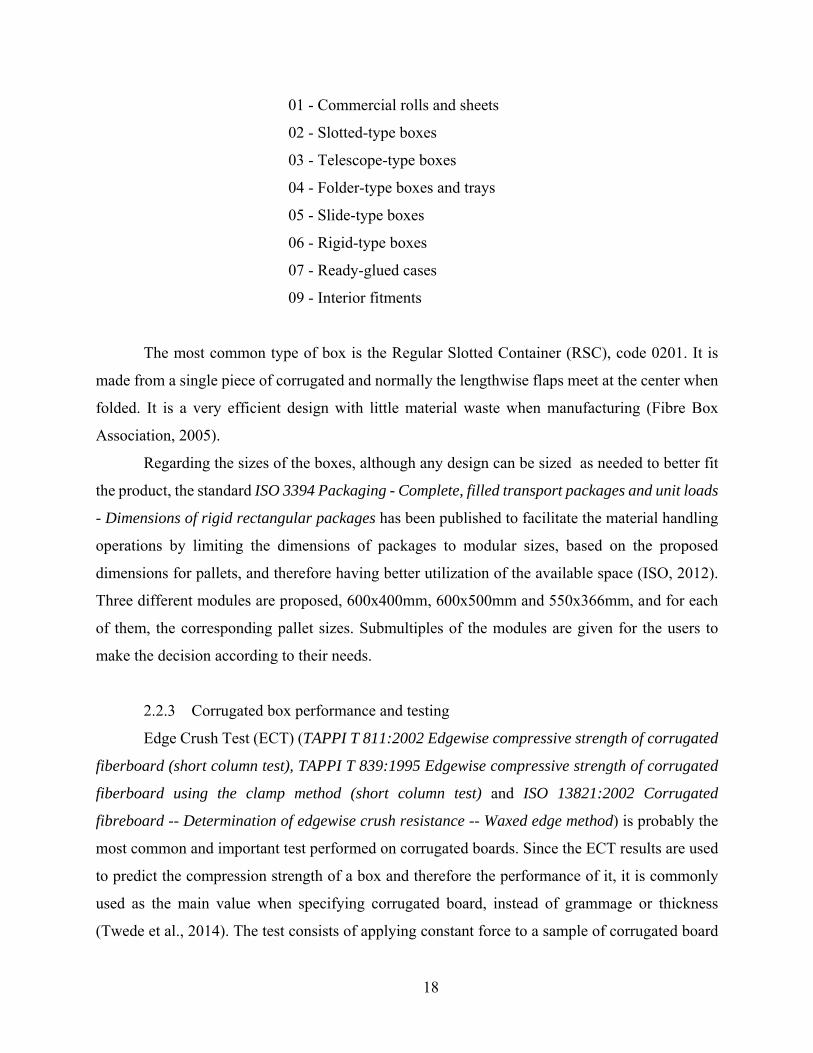
The FEFCO classification groups all box styles in nine basic categories. The first two digits
of the four digit FEFCO code represent the different categories while the last two digits identify
the specific design with the category (FEFCO-ESBO, 2007). The different categories are listed
next.
18
01 - Commercial rolls and sheets
02 - Slotted-type boxes
03 - Telescope-type boxes
04 - Folder-type boxes and trays
05 - Slide-type boxes
06 - Rigid-type boxes
07 - Ready-glued cases
09 - Interior fitments
The most common type of box is the Regular Slotted Container (RSC), code 0201. It is
made from a single piece of corrugated and normally the lengthwise flaps meet at the center when
folded. It is a very efficient design with little material waste when manufacturing (Fibre Box
Association, 2005).
Regarding the sizes of the boxes, although any design can be sized as needed to better fit
the product, the standard ISO 3394 Packaging - Complete, filled transport packages and unit loads
- Dimensions of rigid rectangular packages has been published to facilitate the material handling
operations by limiting the dimensions of packages to modular sizes, based on the proposed
dimensions for pallets, and therefore having better utilization of the available space (ISO, 2012).
Three different modules are proposed, 600x400mm, 600x500mm and 550x366mm, and for each
of them, the corresponding pallet sizes. Submultiples of the modules are given for the users to
make the decision according to their needs.
2.2.3 Corrugated box performance and testing
Edge Crush Test (ECT) (TAPPI T 811:2002 Edgewise compressive strength of corrugated
fiberboard (short column test), TAPPI T 839:1995 Edgewise compressive strength of corrugated
fiberboard using the clamp method (short column test) and ISO 13821:2002 Corrugated
fibreboard -- Determination of edgewise crush resistance -- Waxed edge method) is probably the
most common and important test performed on corrugated boards. Since the ECT results are used
to predict the compression strength of a box and therefore the performance of it, it is commonly
used as the main value when specifying corrugated board, instead of grammage or thickness
(Twede et al., 2014). The test consists of applying constant force to a sample of corrugated board
19
standing on its edge with its flutes parallel to the force until the board is crushed. The amount of
force when the failure occurs divided by the length of the sample gives the ECT value (lb-force/in
or kilonewtons/meter).
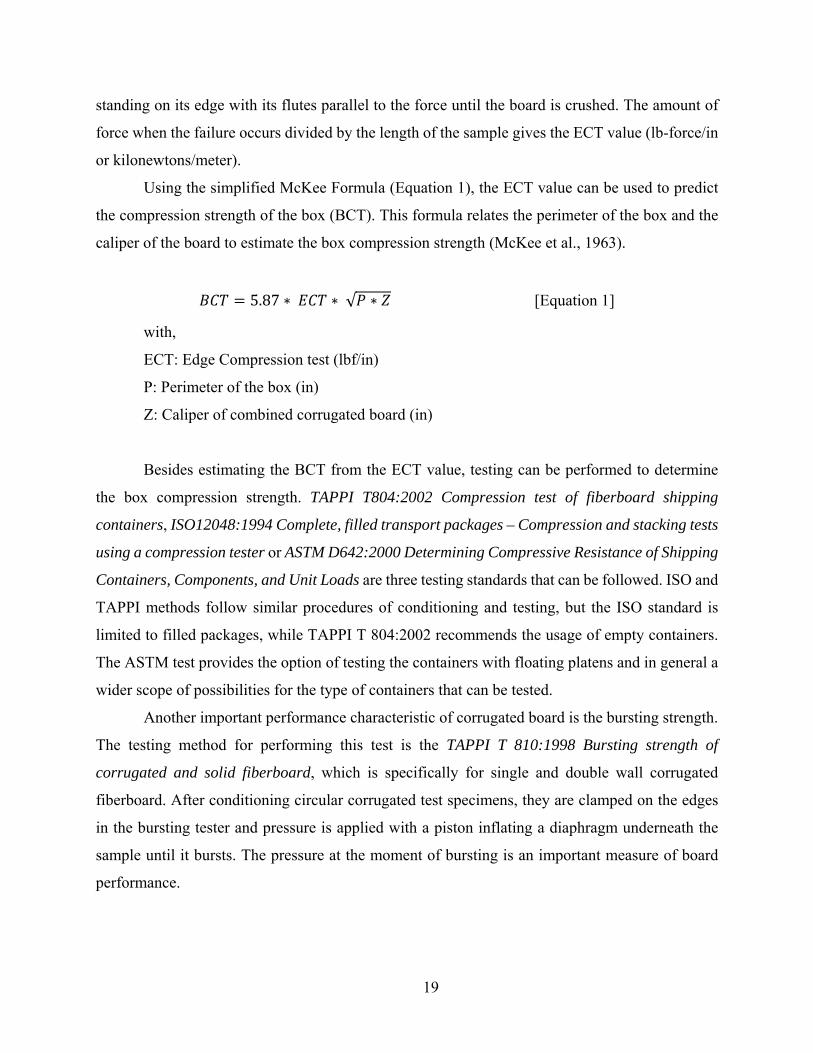
Using the simplified McKee Formula (Equation 1), the ECT value can be used to predict
the compression strength of the box (BCT). This formula relates the perimeter of the box and the
caliper of the board to estimate the box compression strength (McKee et al., 1963).
5.87 ∗ ∗ √ ∗ [Equation 1]
with,
ECT: Edge Compression test (lbf/in)
P: Perimeter of the box (in)
Z: Caliper of combined corrugated board (in)
Besides estimating the BCT from the ECT value, testing can be performed to determine
the box compression strength. TAPPI T804:2002 Compression test of fiberboard shipping
containers, ISO12048:1994 Complete, filled transport packages – Compression and stacking tests
using a compression tester or ASTM D642:2000 Determining Compressive Resistance of Shipping
Containers, Components, and Unit Loads are three testing standards that can be followed. ISO and
TAPPI methods follow similar procedures of conditioning and testing, but the ISO standard is
limited to filled packages, while TAPPI T 804:2002 recommends the usage of empty containers.
The ASTM test provides the option of testing the containers with floating platens and in general a
wider scope of possibilities for the type of containers that can be tested.
Another important performance characteristic of corrugated board is the bursting strength.
The testing method for performing this test is the TAPPI T 810:1998 Bursting strength of
corrugated and solid fiberboard, which is specifically for single and double wall corrugated
fiberboard. After conditioning circular corrugated test specimens, they are clamped on the edges
in the bursting tester and pressure is applied with a piston inflating a diaphragm underneath the
sample until it bursts. The pressure at the moment of bursting is an important measure of board
performance.

20
Flat crush testing (FCT) is a measure of the compression strength of the flutes of corrugated
when a force is applied perpendicular to the board surface. TAPPI T808:2001 Flat crush test of
corrugated board (flexible beam method) is description of this test.
2.3 Containment Methods
To protect the product as it moves through the supply chain in unit load form, packages are
secured on the pallet with one of several load stabilizers (Singh, Cernokus, Saha, & Roy, 2014)..
One option is to organize the product or packages on the pallet in an interlocked pattern instead of
column stacking, so each layer stabilizes the boxes on the bottom of it by applying force in an
opposite direction. Additional to this, a containment force can be applied to the unit load, which
can be achieved by the utilization of any of various methods such as stretch wrapping, stretch
hooding, strapping or shrink wrap, among others. The most common type of containment method
is the stretch wrap (Singh et al., 2014).
The stretch wrapping of a unit load is commonly made using Linear-Low Density
Polyethylene polymer (LLDPE) due to its elastic properties, puncture resistance and market
acceptance (Rogers, 2011). There are three methods of applying the stretch wrap to the unit load.
The manual method is labor intensive and results in an uneven load along the unit load, generally
with low containment force. Semi-automatic systems apply the stretch wrap by itself, but they are
manually loaded. Automatic machines receive the product via an automated mechanism such as a
conveyor, and wrap the load automatically. The stretch wrapping machines can be identified by
the mechanism they use to apply the containment force to the load. This can be a turntable, a rotary
arm or an orbital stretch wrapping system. Each one has different characteristics and is best suited
for different operations depending on the weight, fragility and shape of the load (Singh et al.,
2014).
Singh (2014) studied the effect of pre-stretching of the stretch wrap on the containment
force experienced by the unit load and how it affects the unit load performance along the
distribution. It was concluded that the magnitude of pre-stretching has no direct effect on the
containment of the load, either before or after the simulated distribution, so higher pre-stretching
values can be used to save costs. Additionally, it was validated that the containment force is
proportional to the number of layers applied.
21
Bisha (2008) compared the effect of different load stabilizers when the unit load is under
vibration and when it is impacted. By measuring the displacement of the load from the pallet and
the shift of the load between each layer of boxes, it was concluded that the best load containment
method, when under vibration is strapping, since it restricts vertical spring movement and the worst
was the 400ga stretch hooding. The other two methods tested were 80ga and 63ga stretch wrap.
When the unit load was impacted on one side, the stretch hooding yielded the best results for
prevention of load shifting, while the stretch wrapping failed to secure the load as much as the
other options, and the 63ga performed worse than the 80ga. All of these results were specific to
the amounts and techniques used, so the same type of stretch wrap, with different amounts and
application patterns, could generate different results.
Methods have been developed to measure the applied containment force, specifically for
stretch wrapping. The standard ASTM D4649-03 Selection and Use of Stretch Wrap Films provides
guidelines to measure and compare the wrapping performance of the films, but it measures the
containment load only at the faces and not at the corners, where higher pressure might exist,
therefore generating a possible bias. This method performs the measurements after applying the
film, so a trial and error process must be followed to reach specific containment forces. Efforts
have been conducted in order to develop methods capable of predicting a containment force
following standardized calculations, using film thickness and pre-stretch as inputs, but additional
research is required to obtain more consistent results (Bisha, 2012).
Regarding the unit load stability, the effect of the containment method can be evaluated
running standardized tests such as ASTM D4169:2009 Standard Practice for Performance Testing
of Shipping Containers and Systems or ISTA 3E (2009) Unitized Loads of the Same Product but it
can’t be accurately predicted.
2.4 Unit Load
2.4.1 Introduction and history of the Unit Load Concept
Unitizing product shipments using a pallet as a platform helps reduce product damage as
much as an 80% when compared to shipping loose items. This reduction in damage enables
shippers to reduce packaging costs (Goertz, 1976). Another benefit is the time to complete a
distribution cycle. Unitizing product and the proper material handling equipment will generate
significant reductions in time and therefore overall savings and better inventory control. Internal

22
and external theft can be reduced, minimizing inventory shrinkage. The main drawback identified
from palletizing instead of break bulk shipping is the reduction on the efficiency of the cargo space
utilization. When using ISO standardized pallets, up to 30% of the otherwise available volume
won’t be used (Goertz, 1976), but the overall efficiencies gained make it the preferred shipping
method, with an estimate of an 80% of the product transported in the United States being moved
in the form of a unit load (Raballand & Aldaz-Carroll, 2007).
2.4.2 Stacking Patterns in Unit Loads
Significant research has been conducted on the stacking patterns from mainly three
perspectives. One, which relates to the design activities for the product containers, is how the
strength of the packages, especially for corrugated fiberboard boxes, is affected when the box
stacking pattern is interlocked versus column. Studies have shown that interlocking boxes between
layers significantly reduces the box resistance to compression (Ievans, 1975; Kellicut, 1963).
Additional experimentation was conducted to further characterize the behavior, but most
comparisons where between column stacks and one interlock stack configuration.
The second perspective has been conducted in the Mathematics and Operations Research
fields. It focuses on maximizing the space utilization of a certain storage or shipping area, by
developing algorithms capable of positioning the highest quantity of packages on the pallet. The
emphasis of this research has been on the mathematical calculations for solving the “Pallet Loading
Problem”, but most of the investigations exclude considerations on the effect of the resulting
stacking pattern on the strength of packages or the pallet (Carpenter & Dowsland, 1985).
The last perspective of research related to stacking patterns is to increase unit load stability.
Some of these investigations can be presented as part of the two previous classifications, where
additional considerations were taken. Carpenter and Dowsland (Carpenter & Dowsland, 1985)
developed guidelines to improve the applicability of the “Pallet Loading Problem” solutions for
real world cases. For it, they included certain constrains to assure the stability of the unit loads
within the calculations performed.
Multiple classification options and development guidelines have been created to properly
identify stacking patterns. To begin the classification, the problem must be identified as a
manufacturer’s problem, where all the packages are of the same size, or if it is dealing with the
distributor’s problem, where packages of non-identical sizes must be unitized. The main focus on
23
the studies regarding the stacking patterns, is around the manufacturer’s problem, since a single
solution will be developed in the design stage and used repeatedly throughout the life of the
product, therefore requiring better performance. Distributor’s problem solutions require quick
results to keep up with the operations pace, processing a new pallet each time. Given that the
majority of products are shipped in rectangular shapes, most of the research has excluded any other
types of geometries (Hodgson, 1982).
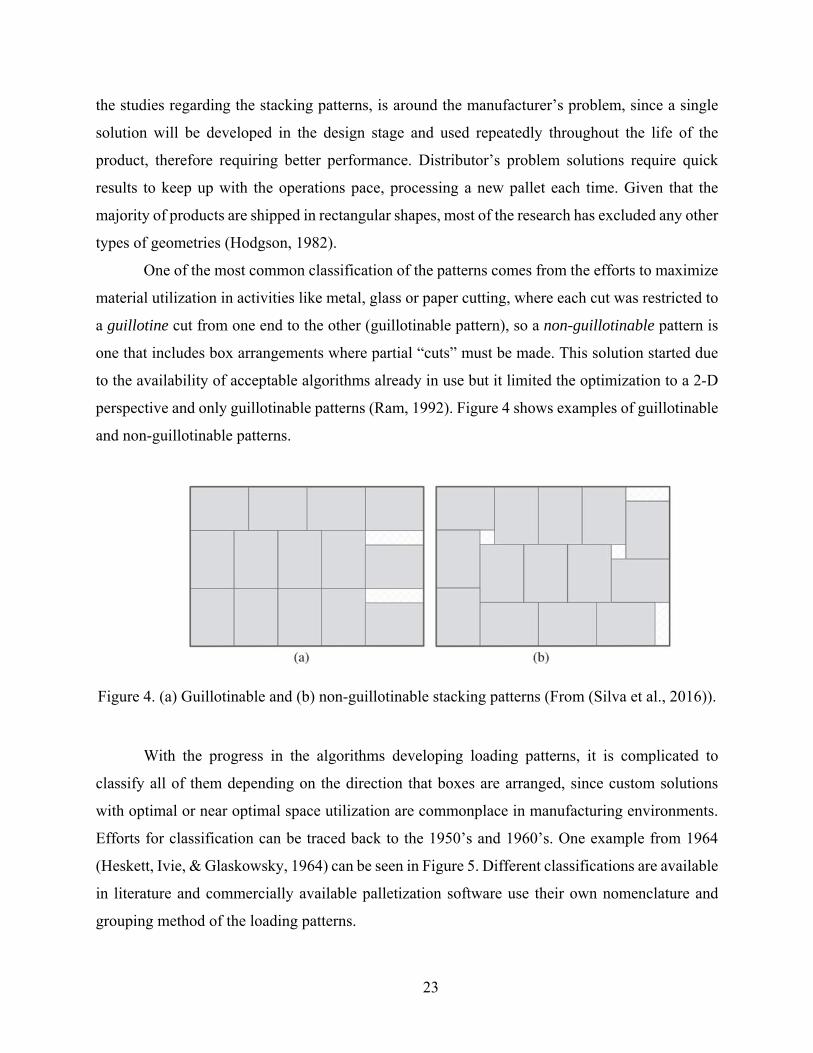
One of the most common classification of the patterns comes from the efforts to maximize
material utilization in activities like metal, glass or paper cutting, where each cut was restricted to
a guillotine cut from one end to the other (guillotinable pattern), so a non-guillotinable pattern is
one that includes box arrangements where partial “cuts” must be made. This solution started due
to the availability of acceptable algorithms already in use but it limited the optimization to a 2-D
perspective and only guillotinable patterns (Ram, 1992). Figure 4 shows examples of guillotinable
and non-guillotinable patterns.
Figure 4. (a) Guillotinable and (b) non-guillotinable stacking patterns (From (Silva et al., 2016)).
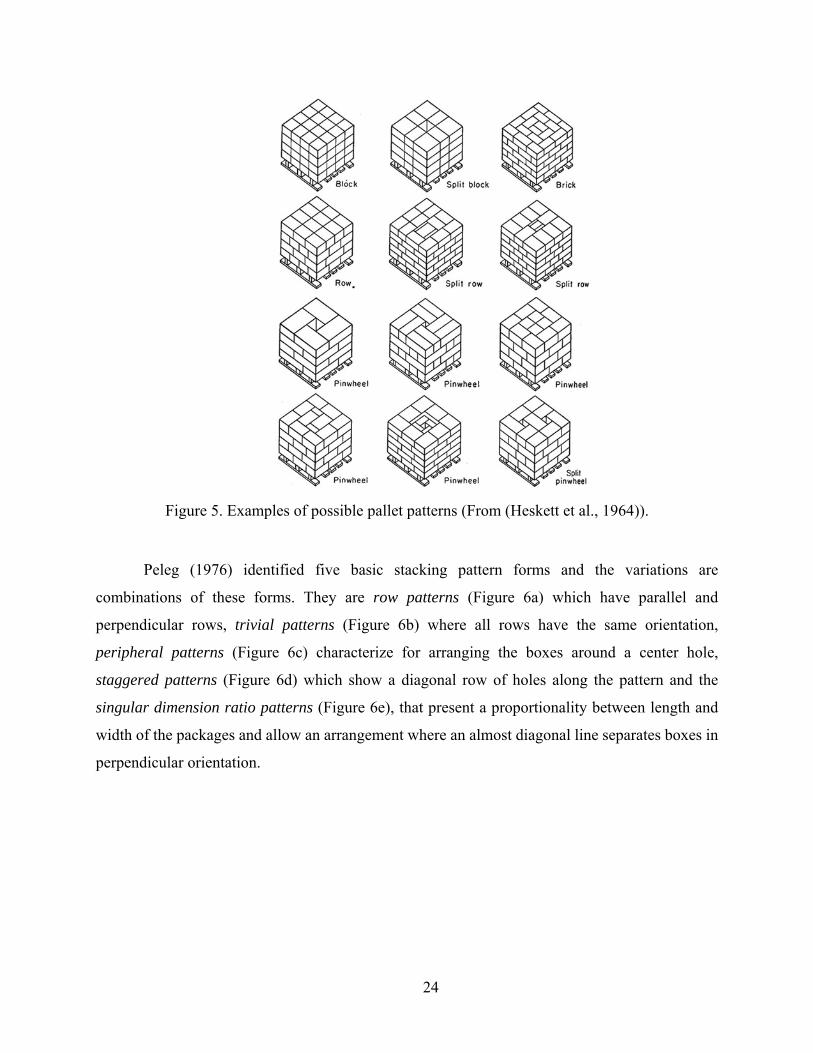
With the progress in the algorithms developing loading patterns, it is complicated to
classify all of them depending on the direction that boxes are arranged, since custom solutions
with optimal or near optimal space utilization are commonplace in manufacturing environments.
Efforts for classification can be traced back to the 1950’s and 1960’s. One example from 1964
(Heskett, Ivie, & Glaskowsky, 1964) can be seen in Figure 5. Different classifications are available
in literature and commercially available palletization software use their own nomenclature and
grouping method of the loading patterns.
24
Figure 5. Examples of possible pallet patterns (From (Heskett et al., 1964)).
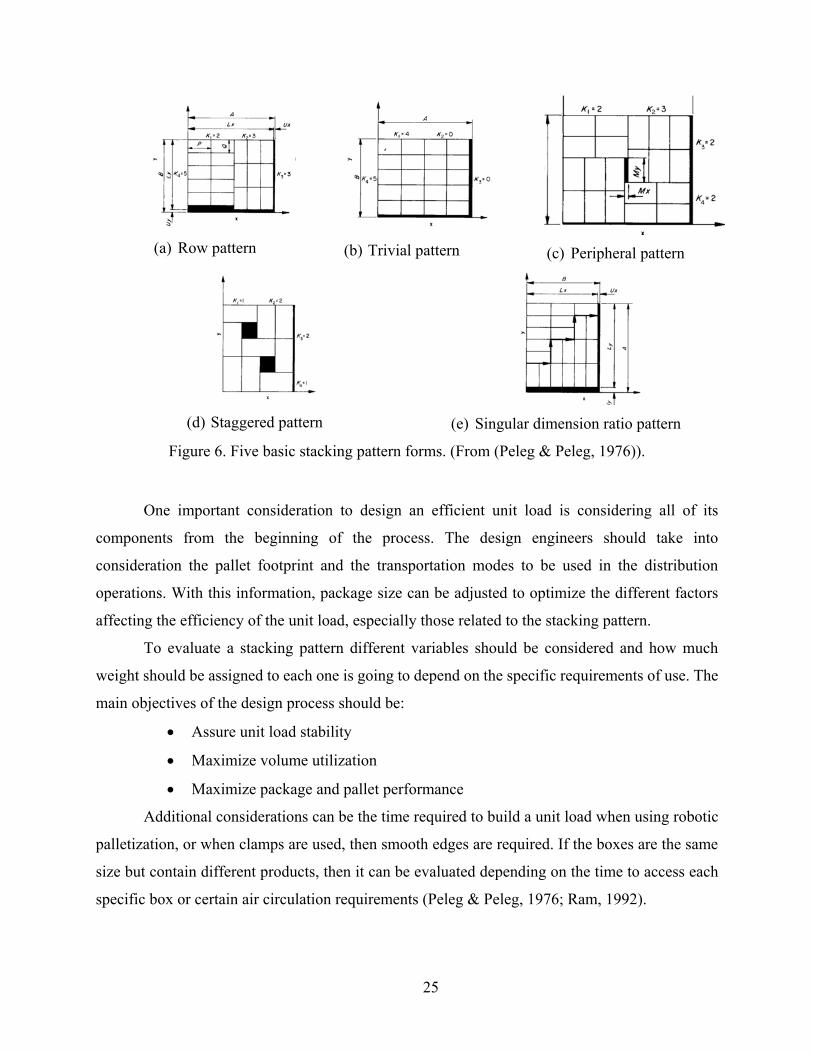
Peleg (1976) identified five basic stacking pattern forms and the variations are
combinations of these forms. They are row patterns (Figure 6a) which have parallel and
perpendicular rows, trivial patterns (Figure 6b) where all rows have the same orientation,
peripheral patterns (Figure 6c) characterize for arranging the boxes around a center hole,
staggered patterns (Figure 6d) which show a diagonal row of holes along the pattern and the
singular dimension ratio patterns (Figure 6e), that present a proportionality between length and
width of the packages and allow an arrangement where an almost diagonal line separates boxes in
perpendicular orientation.
25
(a) Row pattern (b) Trivial pattern (c) Peripheral pattern
(d) Staggered pattern
(e) Singular dimension ratio pattern
Figure 6. Five basic stacking pattern forms. (From (Peleg & Peleg, 1976)).
One important consideration to design an efficient unit load is considering all of its
components from the beginning of the process. The design engineers should take into
consideration the pallet footprint and the transportation modes to be used in the distribution
operations. With this information, package size can be adjusted to optimize the different factors
affecting the efficiency of the unit load, especially those related to the stacking pattern.
To evaluate a stacking pattern different variables should be considered and how much
weight should be assigned to each one is going to depend on the specific requirements of use. The
main objectives of the design process should be:
Assure unit load stability
Maximize volume utilization
Maximize package and pallet performance
Additional considerations can be the time required to build a unit load when using robotic
palletization, or when clamps are used, then smooth edges are required. If the boxes are the same
size but contain different products, then it can be evaluated depending on the time to access each
specific box or certain air circulation requirements (Peleg & Peleg, 1976; Ram, 1992).
26
2.4.2.1 Stacking Patterns and Volume Utilization
Since the introduction of pallets and the unitization of packages for distribution, one
concern has been how to optimize the handling operations. Significant time and cost is saved when
a product is no longer handled as individual packages but instead, as a unit load. The main
drawback of this change is the reduction in the effective space utilization during transportation due
to the unit load shape. To solve this, the main effort comes from the Operations Research
discipline, who has been working the past 50 years with the “Manufacturer’s Pallet Loading
Problem (MPLP)” in order to develop optimal or near-optimal solutions to it, using different
analytical methods.
Initial exact solutions can be traced back to Barnett and Kynch (Barnett & Kynch, 1967)
in 1967, for very limited cases. Research was moved forward using exact and heuristic algorithms
and the application of multiple techniques such as simulation and exact, integer or linear
programming. For most instances of the MPLP, optimal solutions were generated with reasonable
computing times; however, for some specialized scenarios the models still cannot provide an
optimal solution without the need for too much computational effort. These scenarios are currently
being investigated (Silva et al., 2016).
The main measure in this subject is pallet utilization, which represents the percentage of
volume is covered by product. The most popular commercial softwares for solving this
palletization problem are CAPE and TOPS (Twede et al., 2014).
2.4.2.2 Stacking Patterns and Unit Load Stability
Stacking patterns affect unit load stability. Unstable unit loads are serious hazards in
distribution operations, generating not only product damage but also putting at risk associates
handling the product or customers in club stores walking by the rack storage.
Columnar stacks tend to generate unstable unit loads and require additional containment
methods to hold the load in place. Common containment force applicators are stretch wrapping,
stretch hooding, strapping or using tie-sheets among other alternatives. The quantity used and the
force applied are going to depend on the geometry and stability of the unit load itself, but an excess
of containment force can generate package damage. Interlocking the packages in addition to other
containment methods is going to increase the overall stability and reduce the risk of collapse and
could allow the cost allocated to material consumption from the load stabilizers to be reduced.

27
Unit load stability can be evaluated in laboratory testing or using theoretical calculations
related to the solution of the “Pallet Loading Problem”. Laboratory testing, subjects the unit load
to different distribution simulations to measure the shift of the load position on the pallet and also
the movement between each layer.
Additional methods to measure the stability of the stacking pattern (without consideration
of additional load stabilizers) have been defined by Carpenter and Dowsland (1985). They
determined three main design criteria for evaluating the stability. These criteria are:
Each box has to be supported by at least two boxes under it.
Measure the percentage of the box that is in contact with the layer underneath.
And the “non-guillotine cut” criterion, which intends to reduce the possibility of
developing stacks that are completely dividable, as in two major columns of
interlocked boxes.
More extensive literature on the stability of stacking patterns relates to the solution of the
“Distributor’s Pallet Loading Problem”, due to the inherent instability issues generated by stacking
boxes of different sizes. But the same three criteria are generally applied (Schuster, Bormann,
Steidl, Reynolds-Haertle, & Stilman, 2010).
2.4.2.3 Stacking Patterns and Corrugated Box Strength
When determining the strength of a corrugated box, it is critical to know whether a column
or an interlocking stacking pattern is going to be used in the distribution environment. When
stacked, a box supports most of the load at the corners(McKee & Gander, 1957), so by interlocking,
the load will transfer from corners to the less resistant walls, decreasing the overall load carrying
capacity of the box. This reduction is be estimated to be between 35% and 55%, depending on the
specific conditions of the investigations conducted (Carstens & Mina, 1988; Ievans, 1975;
Kellicut, 1963; Singh & Singh, 2011). Although it was previously mentioned that interlocked
patterns are more stable, it is worth noting that if the reduction in box strength is enough to cause
box failure, mainly at the bottom of the stack, the overall unit load could present stability issues
and lead to product damage (Singh & Singh, 2011).

28
2.4.2.4 Stacking Patterns and Pallet Deflection
Limited research has been conducted with the objective to determine the effect of the
stacking pattern in pallet deflection and ultimate load carrying capacity. The load configuration,
which is affected by the specification of the stacking pattern, leads to significant changes in the
bending behavior of the pallet.
Fagan (1982) and Collie (1984) conducted investigations where different load
configurations where evaluated and a clear trend of relationship between load characteristics and
pallet bending was found, but no specific evaluation was conducted to measure the effect of the
stacking pattern by itself. White et al. (M. S. White et al., 1999) also evaluated the effect on pallet
deflection due to the application of different load stabilizers, among which stacking pattern was
included to compare column versus interlock. The results identified a significant effect of load
stabilizers on pallet deflection but no conclusive results were obtained. Figure 7 shows an example
of a unit load composed of a column stack pattern and a low stiffness pallet.
In general, it can be concluded that the different stacking patterns modify the pressure
distribution of the load on the pallet, and therefore change the pallet performance but no specific
knowledge is available to the exact effect of the stacking pattern. Identifying simple alternatives
to improve the performance of the unit load can translate to cost and material reduction and a more
efficient supply chain.
Figure 7. Example of a column stacked unit load supported on a forklift.
29
2.4.3 Systems based Unit Load Design
The packaging supply chain is composed of three main components, the packages, usually
bags, boxes, pails, etc., the pallet that works as a platform to support the product and the material
handling equipment. Typically, these components have been developed as isolated units, where
the goal is to reduce the costs of the individual components, but ignoring that when any of the
components changes, it also affects the performance of the other components (M. S. White &
Hamner, 2005). This component based design methodology can generate an increase in the cost of
the overall supply chain, because reducing pallet costs could result in lower pallet stiffness and as
a consequence, higher compression stresses will be applied to the corrugated containers, possibly
damaging them, increasing the overall costs. To eliminate the above mentioned issues in the supply
chain, White and Hamner (2005) proposed using a “System-based Design System”, where every
component is designed taking into consideration the interaction between the different elements.
The result of this system-based design methodology is reduced overall costs for final consumers,
reduction on the environmental impact of logistics, and higher human health and safety levels due
to better performing unit loads.
2.4.4 Interactions between Unit Load components
A unit load is composed of the product, which can be packed in boxes, bags or any other
available method, the pallet supporting the packaged products and the stabilization methods such
as shrink wrap and slip-sheets. All of these components interact in different ways with each other
and with outside factors, such as the handling mechanisms or storage configurations available in
the supply network.
2.4.4.1 Load Bridging
Current pallet design techniques assume a uniformly distributed loading on the pallets,
and laboratory verification based on ASTM D1185 (ASTM International, 2009) is conducted
under the same principle, commonly using airbags as load applicators (Figure 8). But the actual
loads being shipped on pallets differ from airbags and don’t distribute uniformly the load. The
most common package type used is corrugated fiberboard boxes and based on previous
investigations (McKee & Gander, 1957) it is known that in a scenario where boxes are stacked in
a column, most of the load distributes down along the perimeter of the box. McKee also showed
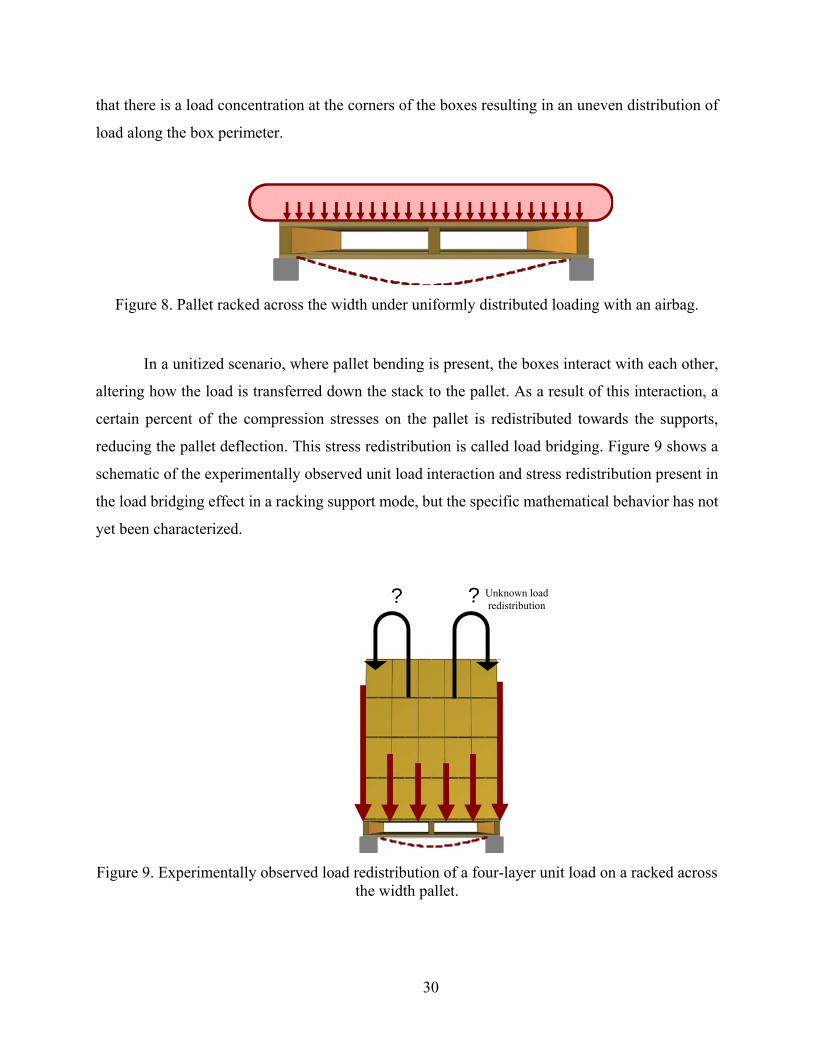
30
that there is a load concentration at the corners of the boxes resulting in an uneven distribution of
load along the box perimeter.
Figure 8. Pallet racked across the width under uniformly distributed loading with an airbag.
In a unitized scenario, where pallet bending is present, the boxes interact with each other,
altering how the load is transferred down the stack to the pallet. As a result of this interaction, a
certain percent of the compression stresses on the pallet is redistributed towards the supports,
reducing the pallet deflection. This stress redistribution is called load bridging. Figure 9 shows a
schematic of the experimentally observed unit load interaction and stress redistribution present in
the load bridging effect in a racking support mode, but the specific mathematical behavior has not
yet been characterized.
Figure 9. Experimentally observed load redistribution of a four-layer unit load on a racked across the width pallet.
? ? Unknown load redistribution

31
The factors that have been identified to affect the stiffness of the load and therefore the
load bridging effect magnitude are (Center for Unit-Load Design, 1997; Collie, 1984; Fagan, 1982;
Park, 2015; Park et al., 2017; M. S. White et al., 1999; Yoo, 2011):
Package size
Package and pallet stiffness
Containment force
Number of layers
Unit Load height
Coefficient of Friction between components
Stacking Pattern
Fagan (1982) began characterizing the loads, supports and structural members of the unit
loads in order to be able to gain an understanding on how the type of load affects the pallet
performance. In this initial study, the author tested four different load types representing different
expected load bridging effects and measured pallet deflection as the main response. The first one
was uniform loading with an airbag (no load-bridging), then a symmetrical box pattern on the
pallet (low load-bridging), next an asymmetrical box pattern (medium load-bridging) and the
fourth a platen-type load (extreme load-bridging). Every load type was tested for four pallets with
different stiffness, identified by the average MOE of the components of each pallet, and in the two
racking directions, racked across the length and across the width. It was concluded that there is a
significant effect on the deflection of the pallet depending on the load type and the stiffness of the
pallet. The stiffness of the pallet what drives the magnitude of the effect of the other factors.
Collie (1984) continued with investigation of the load bridging effect on unit loads. One of
the studies performed evaluated the effect of the stacking patterns and the amount of unit loads
stacked on one another. All these tests were performed simulating floor stacking. No effect in
deflection was identified for the different stacking patterns and adjustment factors were calculated
for the effect due to the number of piled pallets.
In additional tests, Collie (1984) worked toward identifying and characterizing the factors
causing the load-bridging effect when the unit load is in a racking support condition. For this
experiment, five different loads where used as treatments with different levels of expected load
bridging. For extreme load bridging, box goods of the size of half the pallet width where used.
Two loads with the same boxes but different stacking pattern where used as estimated medium

32
bridging. A stiffer load with minimal bridging was simulated with bagged goods and finally, an
airbag was used as control, with no load bridging at all. Every type of load was tested on three
different pallet types, of low, medium and high stiffness and each of these combinations was tested
in racking across the width and racking across the length, being pallet deflection the main response
measured. He identified, as Fagan (1982) had also concluded, that load bridging decreases
significantly when the stiffness of the pallet increases, making the effect almost negligible on very
stiff pallets. Also, the racking direction was demonstrated as a critical factor on the amount of
resulting load bridging by the unit loads. Bridging is greater on pallets spanning pallet width
because pallets are less stiff in this mode of support. Regarding the differences in deflection due
to the load type, only on the low stiffness pallets was possible to find any significant variation
between them.
When the size of the package is increased, the load is distributed along less points and a
higher percentage of the load is directly supported by the supports of the pallet, mainly in a racking
support (Collie, 1984). To better understand and model the distribution of the stresses on pallet
decks, Yoo (2011) developed research relating pallet stress distribution with the theory of a beam
on an elastic foundation. It was identified that the compression stresses are higher near the supports
and diminish towards the middle of the free span. The magnitude of the stress redistribution
depends on the pallet stiffness and the stiffness of the load itself.
In order to quantify the effect of the size of the corrugated box on the performance of the
unit load, Park (2017) measured pallet deformation while varying box sizes and flute types, finding
that up to a 76% reduction in the unit load deflection can be achieved by increasing the package
dimensions.
Park (2015) conducted an experiment to identify the effect of the containment force of
stretch wrap on the load bridging of the unit loads. The tests were conducted using two plywood
boards as simulated pallets with low and high stiffness, three different packaging sizes and three
levels of containment force (0 lbs., 30 lbs. and 60 lbs.). The effect was measured by the
deformation of the simulated pallet and deflection was compared to the one of the same simulated
pallets but with the load applied using an airbag. It was concluded that pallet deformation decreases
significantly with changes in the size of the box. An interaction was present when varying box size
and containment force. Using a pressure mat it was also identified that the stress distribution on
the board changes with the increase in the containment force. With little or no containment force,

33
the stresses are more evenly distributed along the pallet, but as the applied containment force
increases, the stresses move towards the edges, applying more pressure to the packages and
increasing the load bridging effect.
2.4.4.2 Effect of pallet design on compression stresses on packaged product
Multiple studies have been performed in order to characterize the interaction between a
product, mainly corrugated boxes, and the different pallet design characteristics. One critical
characteristic identified are the gaps between deckboards in the pallet. Kellicut (1963) addressed
this from the perspective of the strength of the corrugated boxes and how they are affected by the
pallet gaps, showing a reduction in strength when the box was not fully supported. Monaghan and
Marcondes (1992) worked towards quantifying the effect of the overhang and the pallet gap size
on the compression strength of the corrugated boxes. They determined an exponential and
decreasing relationship between the compression strength and the pallet gap size. Regarding the
overhang, a reduction was identified although not quantified.
More extensive research was conducted by Baker et al. (Baker et al., 2016a) where different
pallet gaps where analyzed in combination with different stiffness of deckboards to identify the
changes in the compression strength of the corrugated box.
Packages stacked in a unit load are subjected to compression stresses of variable
magnitudes. For an effective package design, these forces must be known and besides the common
factors in determining compressive stresses such as force applied and the effective bearing area, it
has been identified that in the case of unitized product, the stiffness of the pallet is a significant
factor with a direct effect on the bearing area. If the stiffness of the pallets decks is increased, the
deflection of the deckboards is minimized, resulting in increased effective bearing area, which
reduces the compressive stresses on the packages (M. S. White, 2015).
2.4.4.3 Stress distribution during stacking in Unit Loads
In a study conducted by Collie (1984) it was identified that when multiple unit loads are
stacked on the top of each other, the deflection of the top deckboards of the bottom pallet does not
increase proportionally to the amount of unit loads stacked. It was concluded that only 80% of the
weight of the second unit load and 66% of the third unit load contributed to the bending of the top
34
deckboard of the bottom pallet, which is the critical pallet component during the floor stacking
mode.
2.4.4.4 Vibration Transmissibility
The design of the pallet and the characteristics of the components from which it was built,
have a significant effect on the magnification of the vibratory movement and its acceleration
experienced by packages in a unit load while it is being transported. The pallet essentially acts as
a spring between the transportation mode and the product. A pallet can be redesigned in order to
control and reduce the transmissibility (ratio of output to input acceleration) from the
transportation mode vibration to the vibration the packages experience. If stiffer deckboards and
stiffer joints are used, the transmissibility can be significantly decreased since the resonance
frequency of the product package system will be modified. Overall, the magnification of the
vibration hazard in distribution is dependent on the stiffness of the deckboards, the joint type
between the components and the characteristics of the load (Weigel & White, 1999). As an
example of the findings of this research, a pallet with a deck stiffness of 202 N/m2 produced a
transmissibility of 2.4 G’s of output for every G from the input acceleration, while a stiffer pallet
(2391 N/m2) had a transmissibility of only 1.6 G, reducing notably the hazards for the product.

35
Chapter 3: Materials, Methods and Experimental Design
In order to characterize the behavior of the pallet under different types of load
configurations, an experimental setup was developed.
3.1 Materials
3.1.1 Pallets
To simulate low, medium, and high stiffness pallets commonly used in the industry, 1200
mm x 1000 mm, two-way stringer class wooden pallets were built. The pallets were composed of
3 stringers, 5 bottom deckboards and 7 top deckboards. The top and bottom deckboards were
manufactured from Spruce-Pine-Fir (SPF) No. 2 and better and the stringers from defect free
Poplar. All components were kiln dried to 19% moisture content. The fasteners used were 63.5
mm (2.5 in.) long structural screws. A total of 72 screws per pallet were used, 2 at each joint
between a deckboard and a stringer. The nominal component dimensions of the pallets are listed
in Table 6.
Table 6. Dimensions for the components of the pallets.
Pallet Components Specifications Low Stiffness Medium Stiffness High Stiffness
Top Deck
Quantity 7 7 7 Thickness (mm) 10 16 22
Width (mm) 90 90 90 Length (mm) 1000 1000 1000
Bottom Deck
Quantity 5 5 5 Thickness (mm) 10 16 22
Width (mm) 90 90 90 Length (mm) 1000 1000 1000
Stringers
Quantity 3 3 3 Width (mm) 25 38 44 Height (mm) 90 90 90 Length (mm) 1200 1200 1200
The Modulus of Elasticity (MOE) was determined for each wood component, following
the procedures in ASTM D198 (ASTM, 2015) Static Tests of Lumber in Structural Sizes. With
the load and bending data obtained, the MOE was calculated using Equation 2. The average MOE
of the different pallet components for each pallet design are shown in Table 7. Components with

36
low MOE were grouped and used for the low stiffness pallet in order to reduce stiffness variability
within components of each pallet. The same was done for the medium and high stiffness pallets.
4 ∆ [Equation 2]
Where is the increment of applied load on flexure specimen below proportional limit,
(N), is the span of flexure (mm), is the width of flexure specimen (mm), is the depth of
rectangular flexure specimen (mm) and ∆ is the increment of deflection of neutral axis of flexure
specimen measured at midspan over distance and corresponding load (mm).
Table 7. Modulus of Elasticity (MOE) and Moisture Content (M.C.) for the pallet components.
Pallet Components Specifications Low Stiffness Medium Stiffness High Stiffness
Deckboards Average MOE, MPa (COV)
7,155 (29%)
9,662 (17%)
10,627 (14%)
Average M.C. (%) 12.68 14.38 14.86
Stringers Average MOE, MPa (COV)
11,157 (2%)
11,632 (7%)
12,181 (9%)
Average M.C. 15% 15% 15%
The pallet stiffness under a uniformly distributed load was measured using an airbag as
load applicator, following the standard ASTM D1185-98a(2009) . This provides a comparison of
the bending characteristics between pallet designs and are in Table 8.
Table 8. Pallet stiffness for the low, medium and high stiffness designs under uniform loading.
Pallet Stiffness (kg/mm)
Low Stiffness Medium Stiffness
High Stiffness
Racked Across the Length
165.63 283.48 295.74
Racked Across the Width
17.44 84.59 175.24
Forklift Support (RAW)
69.40 98.65 212.92
Floor Support 122.83 366.53 466.68
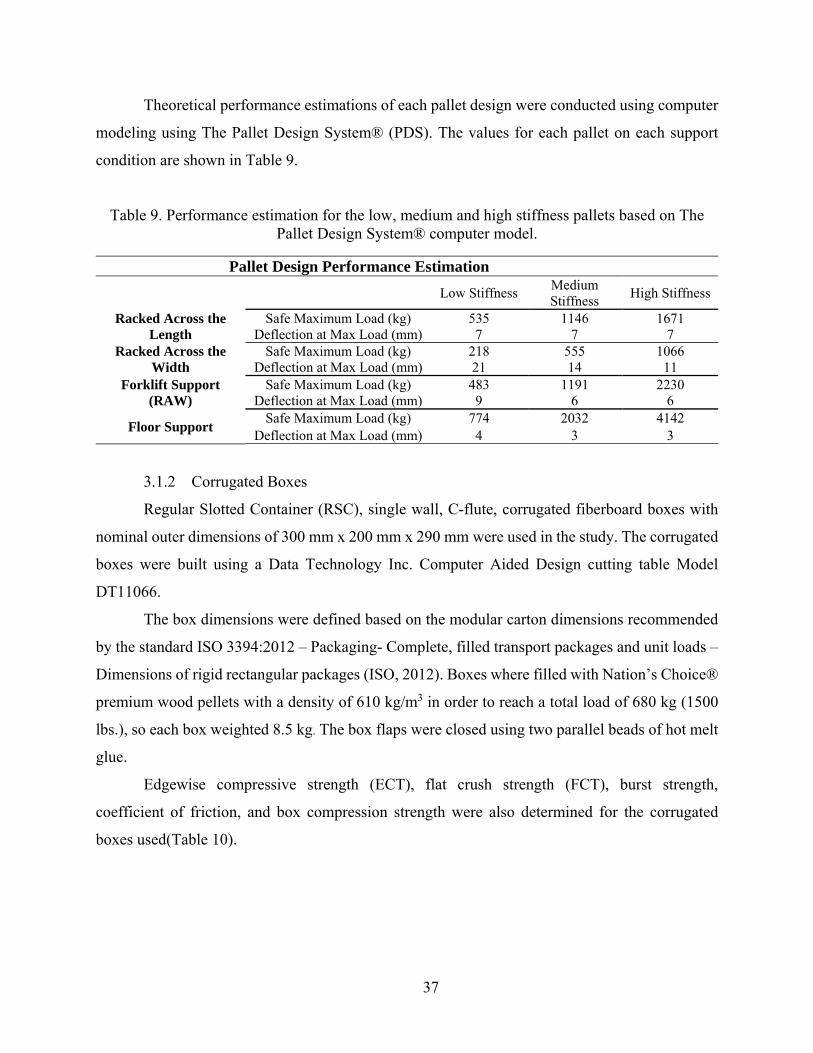
37
Theoretical performance estimations of each pallet design were conducted using computer
modeling using The Pallet Design System® (PDS). The values for each pallet on each support
condition are shown in Table 9.
Table 9. Performance estimation for the low, medium and high stiffness pallets based on The Pallet Design System® computer model.
Pallet Design Performance Estimation
Low Stiffness Medium Stiffness
High Stiffness
Racked Across the Length
Safe Maximum Load (kg) 535 1146 1671 Deflection at Max Load (mm) 7 7 7
Racked Across the Width
Safe Maximum Load (kg) 218 555 1066 Deflection at Max Load (mm) 21 14 11
Forklift Support (RAW)
Safe Maximum Load (kg) 483 1191 2230 Deflection at Max Load (mm) 9 6 6
Floor Support Safe Maximum Load (kg) 774 2032 4142
Deflection at Max Load (mm) 4 3 3
3.1.2 Corrugated Boxes
Regular Slotted Container (RSC), single wall, C-flute, corrugated fiberboard boxes with
nominal outer dimensions of 300 mm x 200 mm x 290 mm were used in the study. The corrugated
boxes were built using a Data Technology Inc. Computer Aided Design cutting table Model
DT11066.
The box dimensions were defined based on the modular carton dimensions recommended
by the standard ISO 3394:2012 – Packaging- Complete, filled transport packages and unit loads –
Dimensions of rigid rectangular packages (ISO, 2012). Boxes where filled with Nation’s Choice®
premium wood pellets with a density of 610 kg/m3 in order to reach a total load of 680 kg (1500
lbs.), so each box weighted 8.5 kg. The box flaps were closed using two parallel beads of hot melt
glue.
Edgewise compressive strength (ECT), flat crush strength (FCT), burst strength,
coefficient of friction, and box compression strength were also determined for the corrugated
boxes used(Table 10).

38
Table 10. Performance characteristics of the corrugated fiberboard used in the experimentation phase.
Characteristic Average Value COV (%)
Edgewise Compressive Strength (ECT) 4.52 kN/m 3.26
Flat Crush Strength (FCT) 302 kPa 2.44
Burst Strength 1,170 kPa 10.04
Coefficient of Friction 0.50 (26º Slide Angle) 11.68
Grammage
Outer: 178 g/m2
Medium: 130 g/m2
Inner: 178 g/m2
0.69
1.13
1.88
Details regarding each test performed were as follows.
Edge Crush Test (ECT)
Test performed according to TAPPI T 839 (2009) Edgewise compressive strength of
corrugated fiberboard using the clamp method (short column test). Universal testing machine
(Model: MTS Criterion 42) with a 5kN load cell was used. Ten replicate tests were conducted.
Flat Crush Test (FCT)
Test performed according to TAPPI T 808 (2013) Flat crush test of corrugated board.
Universal testing machine (Model: MTS Criterion 42) with a 5kN load cell was used. Ten valid
replicate tests were conducted.
Bursting Strength
Test performed according to TAPPI T 810 (2011) Bursting strength of corrugated and solid
fiberboard. Mullen Burst Tester (Model AD) was used. Twenty replicate tests were conducted.
Coefficient of Friction
Test performed according to TAPPI T 815 (2001) Coefficient of static friction (slide angle)
of packaging and packaging materials (including shipping sack papers, corrugated and solid
fiberboard) (inclined plane method). Coefficient of Friction Tester (Model 32-25) from Testing
Machines Inc. was used. Twenty replicate tests were conducted, with the orientation of the
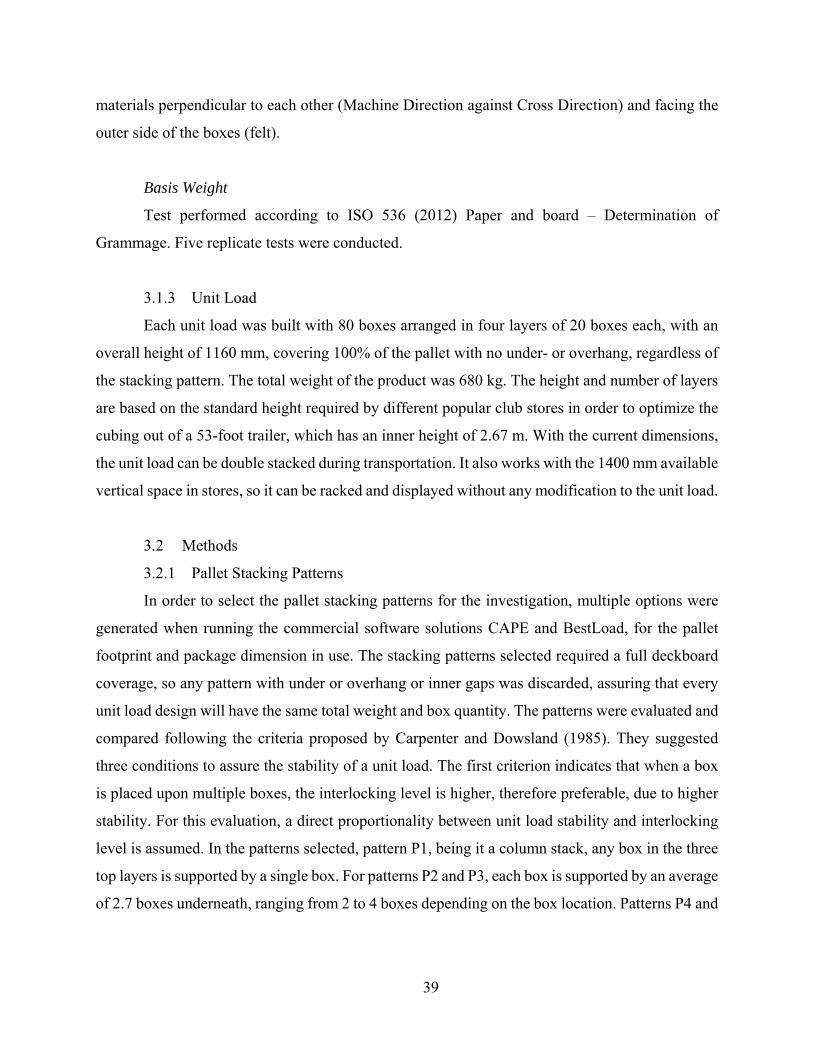
39
materials perpendicular to each other (Machine Direction against Cross Direction) and facing the
outer side of the boxes (felt).
Basis Weight
Test performed according to ISO 536 (2012) Paper and board – Determination of
Grammage. Five replicate tests were conducted.
3.1.3 Unit Load
Each unit load was built with 80 boxes arranged in four layers of 20 boxes each, with an
overall height of 1160 mm, covering 100% of the pallet with no under- or overhang, regardless of
the stacking pattern. The total weight of the product was 680 kg. The height and number of layers
are based on the standard height required by different popular club stores in order to optimize the
cubing out of a 53-foot trailer, which has an inner height of 2.67 m. With the current dimensions,
the unit load can be double stacked during transportation. It also works with the 1400 mm available
vertical space in stores, so it can be racked and displayed without any modification to the unit load.
3.2 Methods
3.2.1 Pallet Stacking Patterns
In order to select the pallet stacking patterns for the investigation, multiple options were
generated when running the commercial software solutions CAPE and BestLoad, for the pallet
footprint and package dimension in use. The stacking patterns selected required a full deckboard
coverage, so any pattern with under or overhang or inner gaps was discarded, assuring that every
unit load design will have the same total weight and box quantity. The patterns were evaluated and
compared following the criteria proposed by Carpenter and Dowsland (1985). They suggested
three conditions to assure the stability of a unit load. The first criterion indicates that when a box
is placed upon multiple boxes, the interlocking level is higher, therefore preferable, due to higher
stability. For this evaluation, a direct proportionality between unit load stability and interlocking
level is assumed. In the patterns selected, pattern P1, being it a column stack, any box in the three
top layers is supported by a single box. For patterns P2 and P3, each box is supported by an average
of 2.7 boxes underneath, ranging from 2 to 4 boxes depending on the box location. Patterns P4 and

40
P5 have an average on 2.1 boxes placed upon each other, representing then a lower level of
interlocking. The unit loads are shown in Table 11.
The second criterion is that each box must have a predetermined percent of the base
supported by another box. For this study, only patterns where a 100% of the base of every box is
supported were selected, discarding any patterns with gaps or boxes protruding on the sides.
The third criterion was the number of guillotine cuts along the whole unit load, which is,
trying to minimize the number of independent columns in the stack, which would allow for
movement and generate instability. Pattern P1 had 20 columns which generated 7 guillotine cuts
across the unit load. The remaining patterns had a single cut across. It was not possible to develop
a stacking pattern without guillotine cuts for the box and pallet dimensions being used, that also
provided 100% of the pallet deck coverage and no overhang.
Although other options where available, these patterns make possible the evaluation
between symmetric and asymmetric loading, where depending if boxes are facing the length or the
width, different pallet behavior could be observed, due to higher load concentration in certain
areas. Additionally, previous research identified that the box size is a significant factor in unit load
deflection (Park et al., 2017). Although the box size is not varied in this investigation, the effect
of the box direction could result in a variation in the effective box size for each of the pallet
patterns. Here, the rectangular box could have the length or the width side parallel aligned with
the free span on each of the support conditions, thus affecting the load application.
The bottom layer is the one that directly interacts with the pallet, so the effect of not only
changing the interlocking level but also the design of the bottom layer changes the location where
the edges and corners of the boxes are located, potentially changing how the compression stresses
are distributed down to the pallet. Three designs were selected, one for P1, a second design for P2
and P4 and a final one for P3 and P5. Table 11 shows the diagrams for the bottom layers.
In summary, the stacking patterns selected were, pattern P1, which was a regular column
stacking pattern, P2 was a split-row fully interlocked pattern, P3 followed a pinwheel fully
interlocked design, P4 had the bottom two layers arranged in a column stacked and the top layers
were interlocked, with every layer following a split-row design, and P5 used a pinwheel pattern
with the bottom layers stacked in a column and the top layers interlocked.
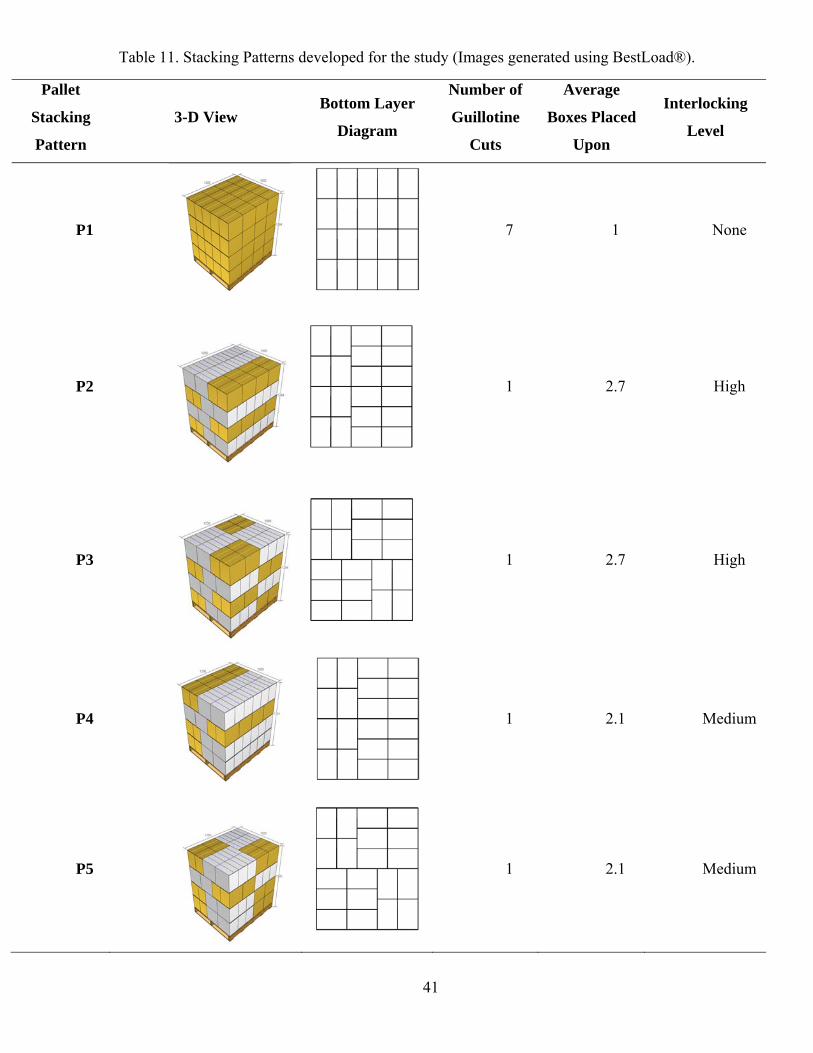
41
Table 11. Stacking Patterns developed for the study (Images generated using BestLoad®).
Pallet
Stacking
Pattern
3-D View Bottom Layer
Diagram
Number of
Guillotine
Cuts
Average
Boxes Placed
Upon
Interlocking
Level
P1
7 1 None
P2
1 2.7 High
P3
1 2.7 High
P4
1 2.1 Medium
P5
1 2.1 Medium
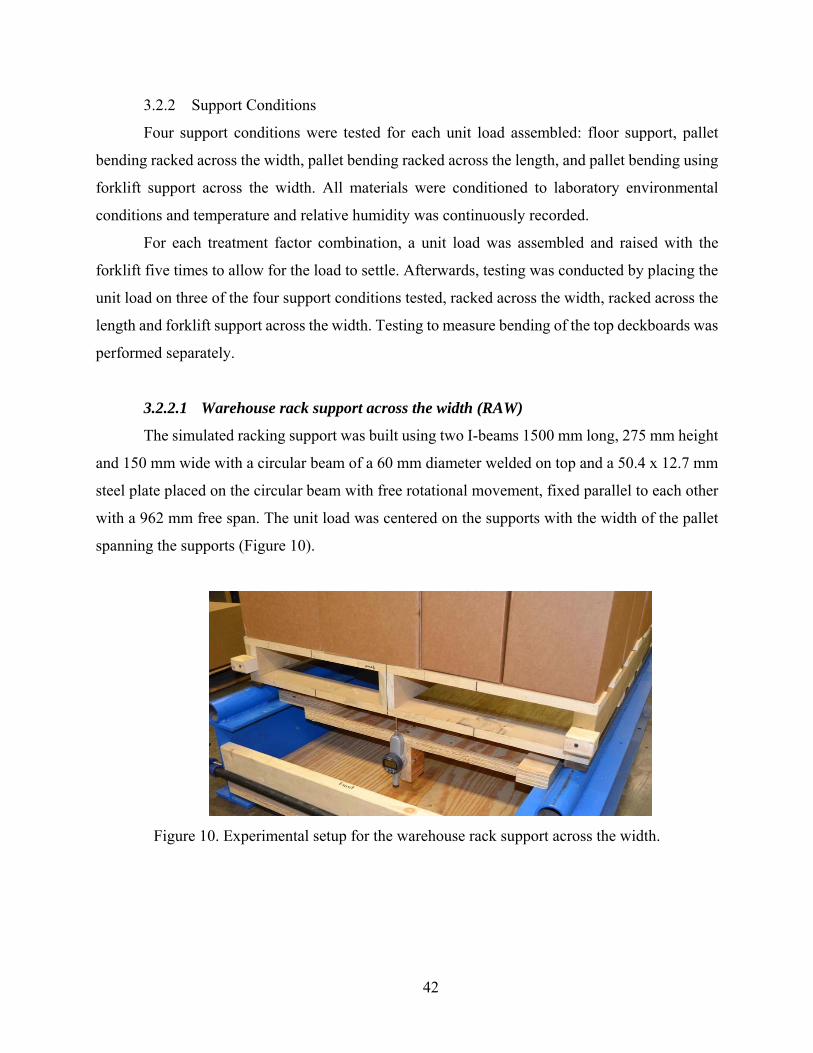
42
3.2.2 Support Conditions
Four support conditions were tested for each unit load assembled: floor support, pallet
bending racked across the width, pallet bending racked across the length, and pallet bending using
forklift support across the width. All materials were conditioned to laboratory environmental
conditions and temperature and relative humidity was continuously recorded.
For each treatment factor combination, a unit load was assembled and raised with the
forklift five times to allow for the load to settle. Afterwards, testing was conducted by placing the
unit load on three of the four support conditions tested, racked across the width, racked across the
length and forklift support across the width. Testing to measure bending of the top deckboards was
performed separately.
3.2.2.1 Warehouse rack support across the width (RAW)
The simulated racking support was built using two I-beams 1500 mm long, 275 mm height
and 150 mm wide with a circular beam of a 60 mm diameter welded on top and a 50.4 x 12.7 mm
steel plate placed on the circular beam with free rotational movement, fixed parallel to each other
with a 962 mm free span. The unit load was centered on the supports with the width of the pallet
spanning the supports (Figure 10).
Figure 10. Experimental setup for the warehouse rack support across the width.
43
After two minutes of the application of the payload the deflection was recorded at the points
shown in Figure 11. Deflection was measured using a Mitutoyo Digimatic Indicator Series with a
50.8 mm range attached to a custom jig which was supported on the flanges of the I-beams.
Figure 11. Identification of the pallet locations for the deflection measurements of the warehouse rack support across the width.
3.2.2.2 Warehouse rack support across the length (RAL)
The simulated racking support was built using two I-beams 1500 mm long, 275 mm height
and 150 mm wide with a circular beam of a 60 mm diameter welded on top and a 50.4 x 12.7 mm
steel plate placed on the circular beam with free rotational movement, fixed parallel to each other
with a 1150 mm free span. The unit load was centered on the supports with the length of the pallet
spanning the supports (Figure 12).
X
X
X

44
Figure 12. Experimental setup for the warehouse rack support across the length.
After two minutes of the application of the payload the deflection was recorded at the points
shown in Figure 13. Deflection was measured using a Mitutoyo Digimatic Indicator Series 543
with a 50.8 mm range attached to a custom jig which was supported on the flanges of the I-beams.
Figure 13. Identification of the pallet locations for the deflection measurements of the warehouse rack support across the length test.
X X X
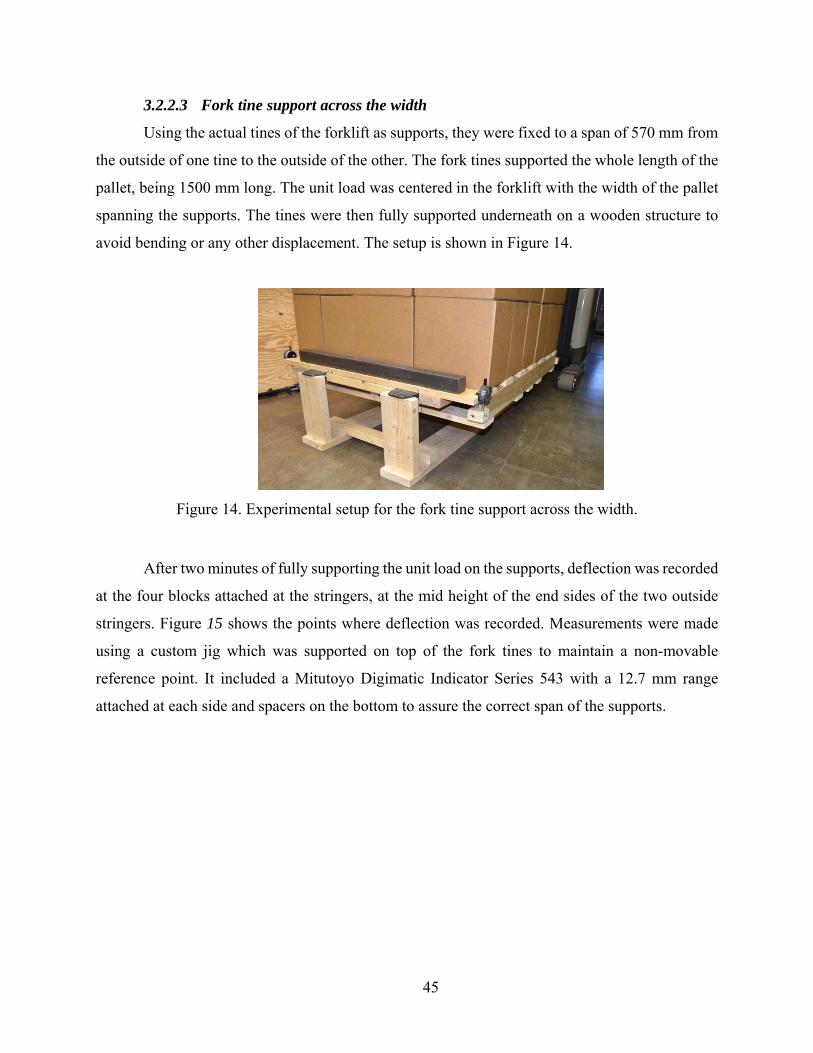
45
3.2.2.3 Fork tine support across the width
Using the actual tines of the forklift as supports, they were fixed to a span of 570 mm from
the outside of one tine to the outside of the other. The fork tines supported the whole length of the
pallet, being 1500 mm long. The unit load was centered in the forklift with the width of the pallet
spanning the supports. The tines were then fully supported underneath on a wooden structure to
avoid bending or any other displacement. The setup is shown in Figure 14.
Figure 14. Experimental setup for the fork tine support across the width.
After two minutes of fully supporting the unit load on the supports, deflection was recorded
at the four blocks attached at the stringers, at the mid height of the end sides of the two outside
stringers. Figure 15 shows the points where deflection was recorded. Measurements were made
using a custom jig which was supported on top of the fork tines to maintain a non-movable
reference point. It included a Mitutoyo Digimatic Indicator Series 543 with a 12.7 mm range
attached at each side and spacers on the bottom to assure the correct span of the supports.
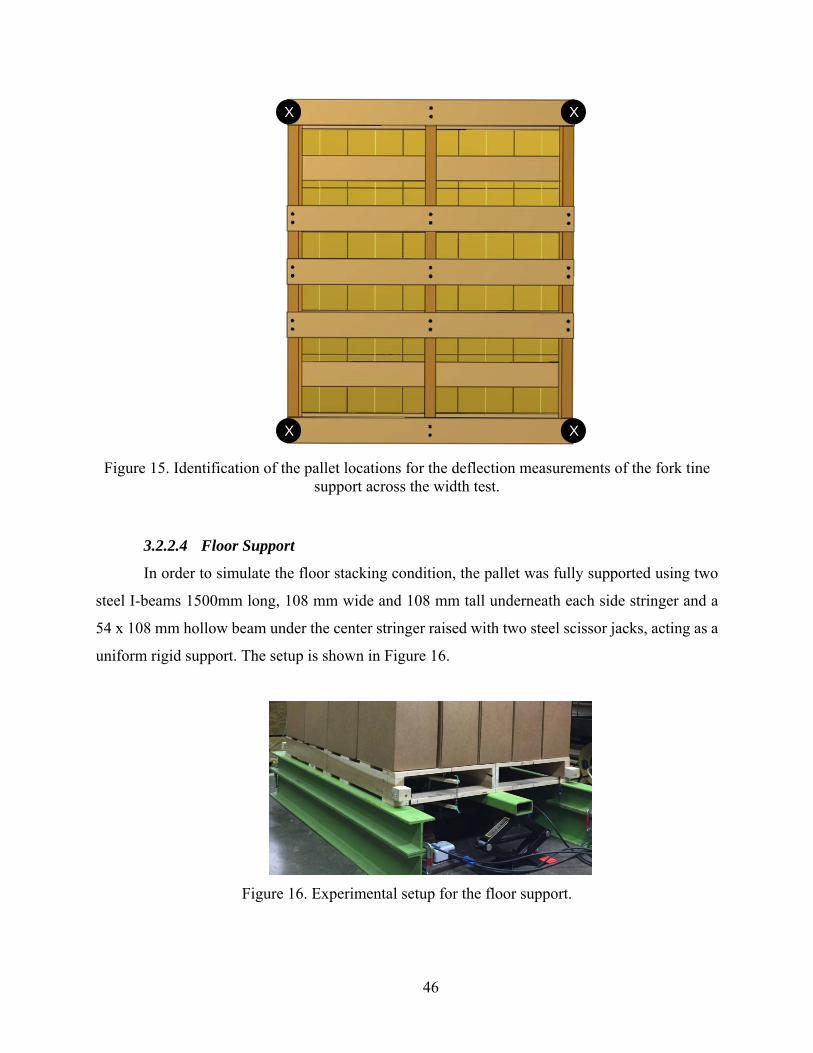
46
Figure 15. Identification of the pallet locations for the deflection measurements of the fork tine support across the width test.
3.2.2.4 Floor Support
In order to simulate the floor stacking condition, the pallet was fully supported using two
steel I-beams 1500mm long, 108 mm wide and 108 mm tall underneath each side stringer and a
54 x 108 mm hollow beam under the center stringer raised with two steel scissor jacks, acting as a
uniform rigid support. The setup is shown in Figure 16.
Figure 16. Experimental setup for the floor support.
X
X X
X

47
Two minutes after the application of the payload the deflection was measured using a string
potentiometer connected to each pallet location using an eye hook. Figure 17 shows the points
where deflection was recorded.
Figure 17. Identification of the pallet locations for the deflection measurements of the floor support test.
3.3 Experimental Design
Twelve one-way factorial experimental designs were conducted with one independent
categorical variable (stacking pattern) with five levels. All treatment combinations were replicated
3 times. In order to evaluate, independently, the effect of the treatments under different support
conditions and pallet design, the experimental design was run, individually, for each of four
support conditions (floor stacking, fork tine support across the width, warehouse free span rack
support across the length (RAL) and across the Width (RAW)) and three pallet designs (low,
medium and high stiffness).
Table 12 shows the experimental designs performed. For each of the experiments a one-
way analysis of variance (ANOVA) was conducted along with a multiple comparison post-hoc
X
X
X
X X
X
X
X

48
analysis using the Tukey’s Honest Significant Difference (HSD) to find differences between each
of the treatment levels.
Table 12. Experimental Designs for the Unit Load Deflection.
Pallet Design Stacking Pattern Replicates per Support Condition Floor
StackingFork Tine RAL RAW
Low Stiffness
Column (P1) 3 3 3 3 Split Row IL (P2) 3 3 3 3 Pinwheel IL (P3) 3 3 3 3
Split Row 2-top IL (P4) 3 3 3 3 Pinwheel 2 top IL (P5) 3 3 3 3
Medium Stiffness
Column (P1) 3 3 3 3 Split Row IL (P2) 3 3 3 3 Pinwheel IL (P3) 3 3 3 3
Split Row 2-top IL (P4) 3 3 3 3 Pinwheel 2 top IL (P5) 3 3 3 3
High Stiffness
Column (P1) 3 3 3 3 Split Row IL (P2) 3 3 3 3 Pinwheel IL (P3) 3 3 3 3
Split Row 2-top IL (P4) 3 3 3 3 Pinwheel 2 top IL (P5) 3 3 3 3
Total runs 45 45 45 45
The pallet deflection model used for the four experiments is shown on Equation 3.
[Equation 3]
Where is the deflection at each of the support conditions, is the grand mean
response, the effect of the level of pallet stiffness, the effect of the level of stacking
pattern, the interaction effect between the level of pallet stiffness and the level of
stacking pattern, the random errors ~Normal(0, and the subscript is the factor level of
pallet stiffness (1, 2, 3), the factor level of stacking pattern (1, 2, 3, 4, 5), the replicate index
(1, 2, 3) and the support condition (1, 2, 3, 4).

49
Chapter 4: Results and Discussion
4.1 Pallet deflection when racked across the width
Deflection measurements for warehouse racking across the width support were divided for
the analysis to separate the deflection of the center points of the pallet and the deflection at the
sides (or ends) of the pallet. Deflection at the pallet ends were averaged for each replicate to mirror
previous research on the subject. Table 13 and Figure 18 show the deflection at the center while
Table 14 shows the deflection at the ends for each pallet design tested and the comparison between
the five stacking patterns.
Table 13. Average racked across the width pallet center deflection by stacking pattern and pallet design.
Stacking Pattern
Low Stiffness Pallet Medium Stiffness Pallet High Stiffness Pallet
Average Deflection,
mm
Std. Dev, mm
Tukey HSD
Average Deflection,
mm
Std. Dev, mm
Tukey HSD
Average Deflection,
mm
Std. Dev, mm
Tukey HSD
Column (P1) 27.21 0.55 A 6.81 0.30 D 2.76 0.53 F
Split Row IL (P2) 12.84 1.78 C 4.80 0.28 E 2.45 0.16 F
Pinwheel IL (P3) 14.38 1.19 BC 5.16 0.38 E 2.23 0.38 F
Split Row mix IL (P4) 17.18 0.76 B 5.20 0.07 E 2.13 0.31 F
Pinwheel mix IL (P5) 16.16 0.58 B 5.10 0.64 E 2.10 0.41 F
Table 14. Average racked across the width pallet ends deflection by stacking pattern and pallet design.
Stacking Pattern
Low Stiffness
Pallet
Medium Stiffness
Pallet
High Stiffness
Pallet
Average Deflection
, mm
Std. Dev
, mm
Tukey
HSD
Average Deflection,
mm
Std. Dev, mm
Tukey HSD
Average Deflection,
mm
Std. Dev, mm
Tukey
HSD
Column (P1) 27.27 0.63 A 6.90 0.20 D 2.38 0.74 F
Split Row IL (P2) 12.80 1.84 C 4.95 0.29 E 2.28 0.21 F
Pinwheel IL (P3) 14.25 1.18 BC 5.27 0.27 E 2.09 0.37 F Split Row mix IL (P4)
17.19 0.79 B 5.41 0.07 E 2.11 0.31 F
Pinwheel mix IL (P5)
16.12 0.50 B 5.24 0.74 E 2.03 0.39 F

50
Figure 18. Average racked across the width pallet center deflection by stacking pattern and pallet design.
For the low stiffness (17.44 kg/mm) and medium stiffness (84.59 kg/mm) pallets, a
significant difference between the column stacking, which provided the greatest pallet deflection,
and the rest of the interlocking patterns was found. Specifically, in the low stiffness pallet, the
greatest difference in deflection from the column stacking pattern P1 was found for the split row
fully interlocking pattern P2 (53%). The average deflection on the medium stiffness pallet showed
no significant difference between the four interlocking patterns while the difference from the
column stacking pattern was 30%. No significant differences among the stacking patterns could
be identified in the high stiffness (175.24 kg/mm) pallet after conducting the one-way ANOVA.
The results are consistent with results from previous studies, as the stiffness of the critical
component is increased and no other variable changed, a reduction in the total observed load
bridging occurs (Collie, 1984; Fagan, 1982; Park et al., 2017).
A difference between the two fully interlocked patterns (P2, P3) and the partial interlocked
(P4,P5) was found in the low stiffness pallet, and two probable explanations can be given. First,
since the interlocking starts at the third layer, an asymmetric load exists for patterns P4 and P5,
which could be influencing the overall results. It can also be explained from the level of
interlocking presented in Table 11 in the Methods section. Since the two bottom layers are column
0.00
5.00
10.00
15.00
20.00
25.00
30.00
Low Stiffness Pallet Medium Stiffness Pallet High Stiffness Pallet
Deflection (mm)
Column (P1) Split Row IL (P2) Pinwheel IL (P3) Split Row mix IL (P4) Pinwheel mix IL (P5)
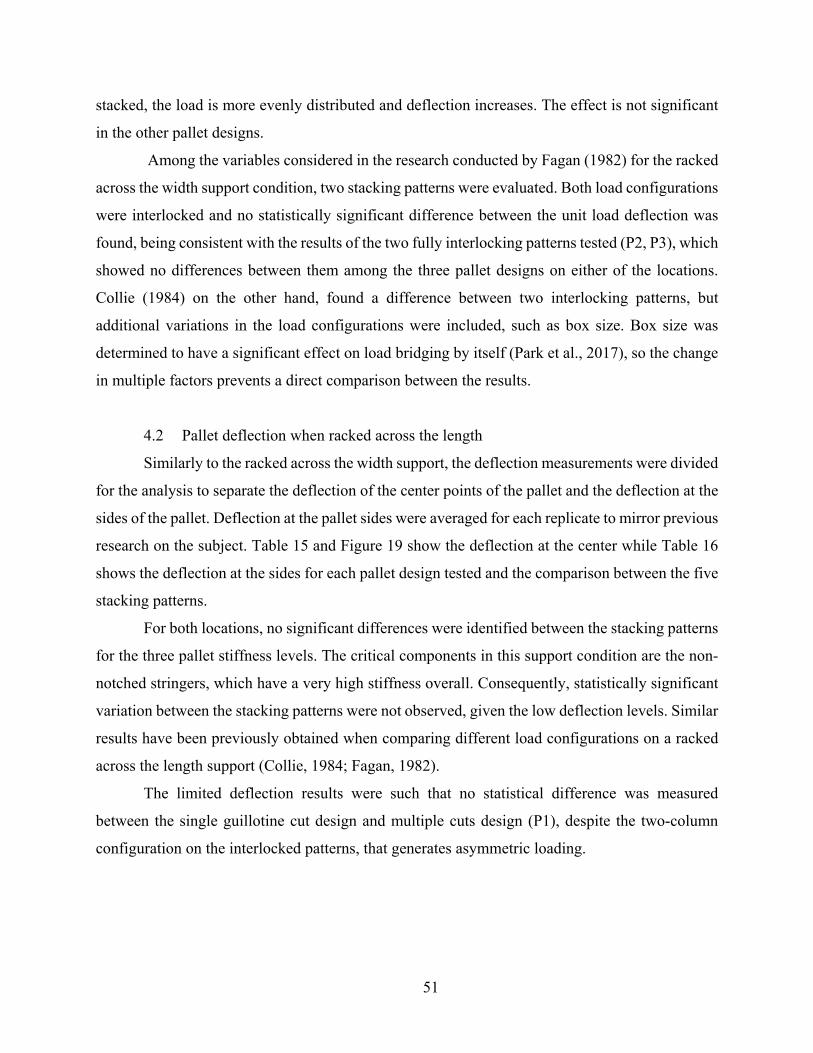
51
stacked, the load is more evenly distributed and deflection increases. The effect is not significant
in the other pallet designs.
Among the variables considered in the research conducted by Fagan (1982) for the racked
across the width support condition, two stacking patterns were evaluated. Both load configurations
were interlocked and no statistically significant difference between the unit load deflection was
found, being consistent with the results of the two fully interlocking patterns tested (P2, P3), which
showed no differences between them among the three pallet designs on either of the locations.
Collie (1984) on the other hand, found a difference between two interlocking patterns, but
additional variations in the load configurations were included, such as box size. Box size was
determined to have a significant effect on load bridging by itself (Park et al., 2017), so the change
in multiple factors prevents a direct comparison between the results.
4.2 Pallet deflection when racked across the length
Similarly to the racked across the width support, the deflection measurements were divided
for the analysis to separate the deflection of the center points of the pallet and the deflection at the
sides of the pallet. Deflection at the pallet sides were averaged for each replicate to mirror previous
research on the subject. Table 15 and Figure 19 show the deflection at the center while Table 16
shows the deflection at the sides for each pallet design tested and the comparison between the five
stacking patterns.
For both locations, no significant differences were identified between the stacking patterns
for the three pallet stiffness levels. The critical components in this support condition are the non-
notched stringers, which have a very high stiffness overall. Consequently, statistically significant
variation between the stacking patterns were not observed, given the low deflection levels. Similar
results have been previously obtained when comparing different load configurations on a racked
across the length support (Collie, 1984; Fagan, 1982).
The limited deflection results were such that no statistical difference was measured
between the single guillotine cut design and multiple cuts design (P1), despite the two-column
configuration on the interlocked patterns, that generates asymmetric loading.
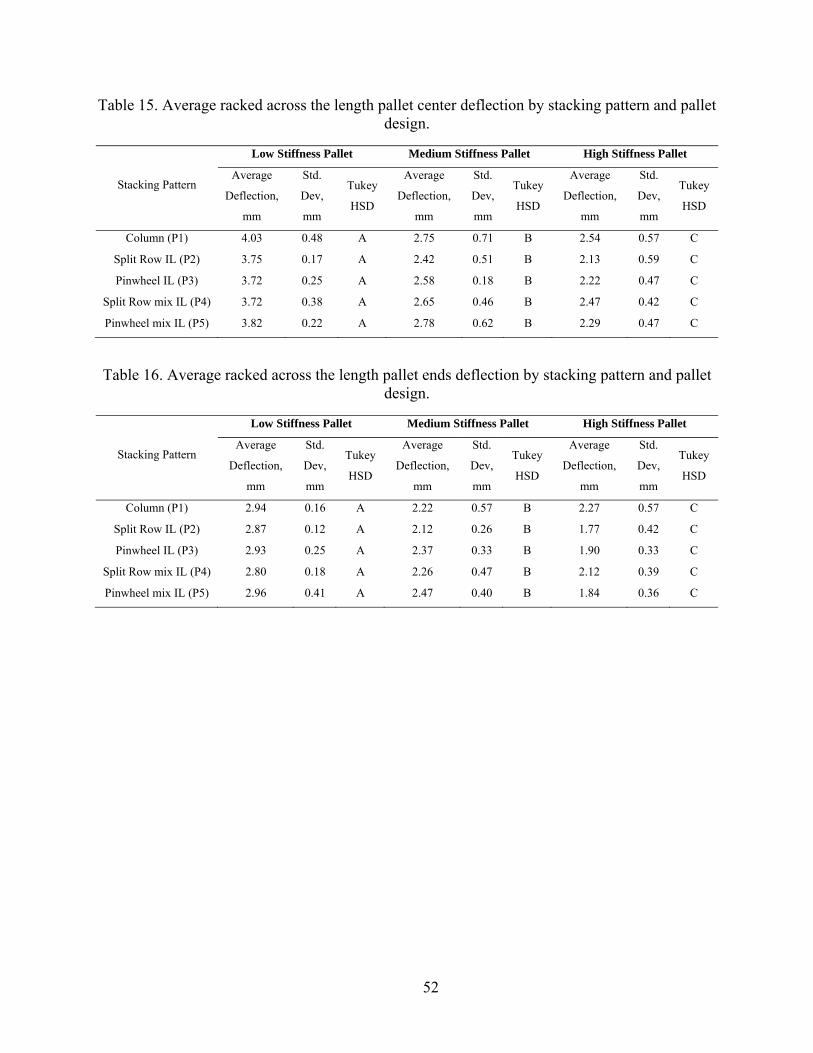
52
Table 15. Average racked across the length pallet center deflection by stacking pattern and pallet design.
Stacking Pattern
Low Stiffness Pallet Medium Stiffness Pallet High Stiffness Pallet
Average
Deflection,
mm
Std.
Dev,
mm
Tukey
HSD
Average
Deflection,
mm
Std.
Dev,
mm
Tukey
HSD
Average
Deflection,
mm
Std.
Dev,
mm
Tukey
HSD
Column (P1) 4.03 0.48 A 2.75 0.71 B 2.54 0.57 C
Split Row IL (P2) 3.75 0.17 A 2.42 0.51 B 2.13 0.59 C
Pinwheel IL (P3) 3.72 0.25 A 2.58 0.18 B 2.22 0.47 C
Split Row mix IL (P4) 3.72 0.38 A 2.65 0.46 B 2.47 0.42 C
Pinwheel mix IL (P5) 3.82 0.22 A 2.78 0.62 B 2.29 0.47 C
Table 16. Average racked across the length pallet ends deflection by stacking pattern and pallet design.
Stacking Pattern
Low Stiffness Pallet Medium Stiffness Pallet High Stiffness Pallet
Average
Deflection,
mm
Std.
Dev,
mm
Tukey
HSD
Average
Deflection,
mm
Std.
Dev,
mm
Tukey
HSD
Average
Deflection,
mm
Std.
Dev,
mm
Tukey
HSD
Column (P1) 2.94 0.16 A 2.22 0.57 B 2.27 0.57 C
Split Row IL (P2) 2.87 0.12 A 2.12 0.26 B 1.77 0.42 C
Pinwheel IL (P3) 2.93 0.25 A 2.37 0.33 B 1.90 0.33 C
Split Row mix IL (P4) 2.80 0.18 A 2.26 0.47 B 2.12 0.39 C
Pinwheel mix IL (P5) 2.96 0.41 A 2.47 0.40 B 1.84 0.36 C

53
Figure 19. Average racked across the length pallet center deflection by stacking pattern and pallet design.
4.3 Pallet deflection when supported on fork tines across the width
Deflection measurements were grouped and averaged by the sides of the pallet, along the
stringer length in order to account for the asymmetry present in the pallet stacking patterns.
For both sides, right side (Table 17, Figure 20) and left side (Table 18), a statistically
significant difference was identified between the column stacking pattern and all the interlocking
patterns for the low stiffness pallet. The medium and high stiffness pallet presented no significant
difference between all the stacking patterns. Although the support condition varies significantly
from racking, a similar trend is observed, where bridging is evident as long as the pallet shows
high levels of deformation. There was no observable difference between the effect of stacking
pattern for the two investigated sides of the pallet.
0.00
1.00
2.00
3.00
4.00
5.00
6.00
Low Stiffness Pallet Medium Stiffness Pallet High Stiffness Pallet
Deflection (mm)
Column (P1) Split Row IL (P2) Pinwheel IL (P3) Split Row mix IL (P4) Pinwheel mix IL (P5)
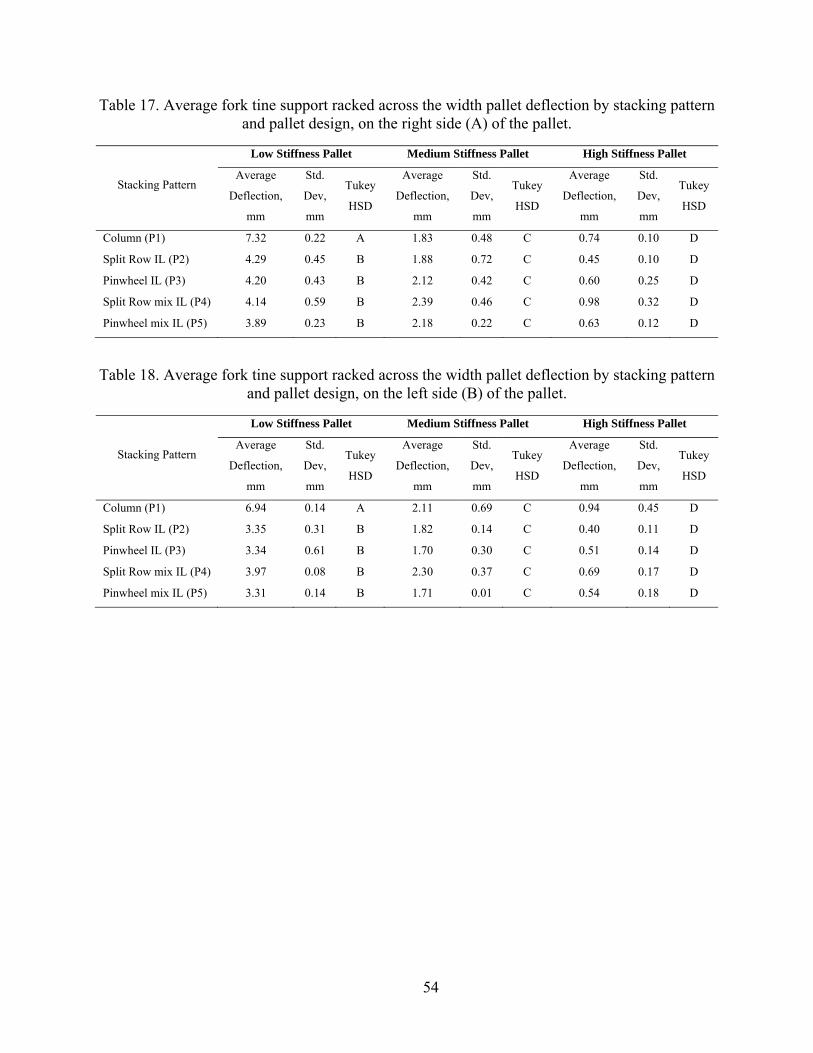
54
Table 17. Average fork tine support racked across the width pallet deflection by stacking pattern and pallet design, on the right side (A) of the pallet.
Stacking Pattern
Low Stiffness Pallet Medium Stiffness Pallet High Stiffness Pallet
Average
Deflection,
mm
Std.
Dev,
mm
Tukey
HSD
Average
Deflection,
mm
Std.
Dev,
mm
Tukey
HSD
Average
Deflection,
mm
Std.
Dev,
mm
Tukey
HSD
Column (P1) 7.32 0.22 A 1.83 0.48 C 0.74 0.10 D
Split Row IL (P2) 4.29 0.45 B 1.88 0.72 C 0.45 0.10 D
Pinwheel IL (P3) 4.20 0.43 B 2.12 0.42 C 0.60 0.25 D
Split Row mix IL (P4) 4.14 0.59 B 2.39 0.46 C 0.98 0.32 D
Pinwheel mix IL (P5) 3.89 0.23 B 2.18 0.22 C 0.63 0.12 D
Table 18. Average fork tine support racked across the width pallet deflection by stacking pattern and pallet design, on the left side (B) of the pallet.
Stacking Pattern
Low Stiffness Pallet Medium Stiffness Pallet High Stiffness Pallet
Average
Deflection,
mm
Std.
Dev,
mm
Tukey
HSD
Average
Deflection,
mm
Std.
Dev,
mm
Tukey
HSD
Average
Deflection,
mm
Std.
Dev,
mm
Tukey
HSD
Column (P1) 6.94 0.14 A 2.11 0.69 C 0.94 0.45 D
Split Row IL (P2) 3.35 0.31 B 1.82 0.14 C 0.40 0.11 D
Pinwheel IL (P3) 3.34 0.61 B 1.70 0.30 C 0.51 0.14 D
Split Row mix IL (P4) 3.97 0.08 B 2.30 0.37 C 0.69 0.17 D
Pinwheel mix IL (P5) 3.31 0.14 B 1.71 0.01 C 0.54 0.18 D
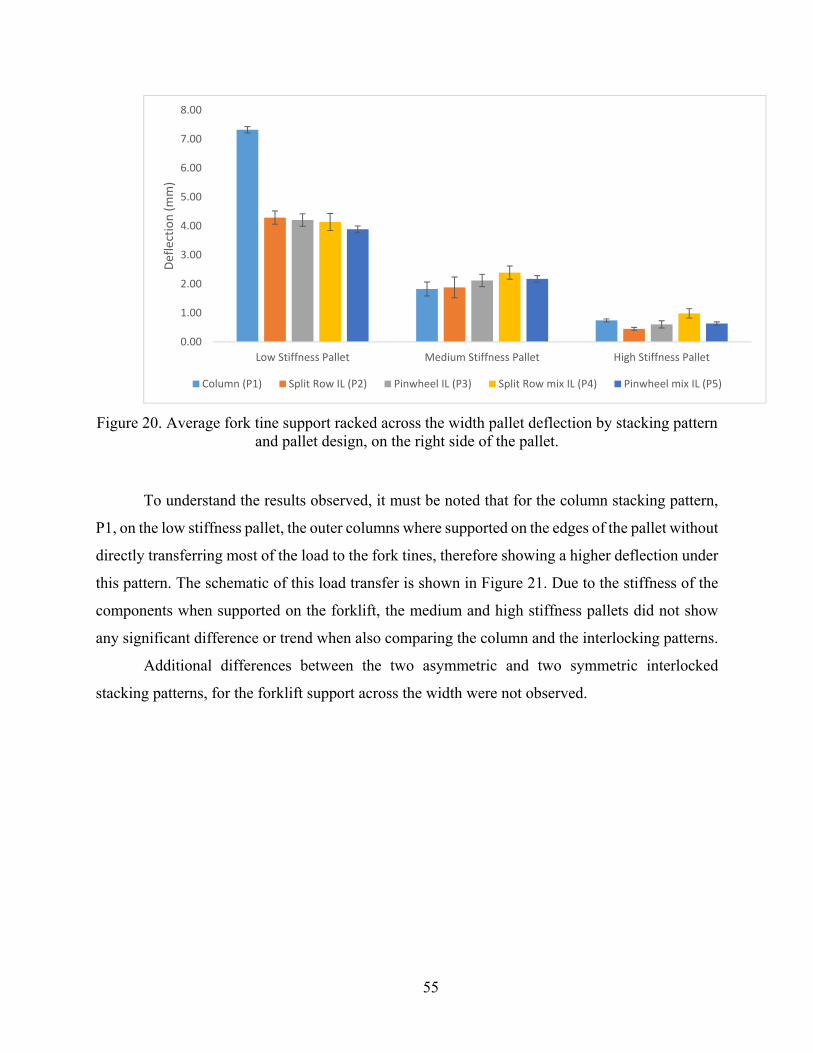
55
Figure 20. Average fork tine support racked across the width pallet deflection by stacking pattern and pallet design, on the right side of the pallet.
To understand the results observed, it must be noted that for the column stacking pattern,
P1, on the low stiffness pallet, the outer columns where supported on the edges of the pallet without
directly transferring most of the load to the fork tines, therefore showing a higher deflection under
this pattern. The schematic of this load transfer is shown in Figure 21. Due to the stiffness of the
components when supported on the forklift, the medium and high stiffness pallets did not show
any significant difference or trend when also comparing the column and the interlocking patterns.
Additional differences between the two asymmetric and two symmetric interlocked
stacking patterns, for the forklift support across the width were not observed.
0.00
1.00
2.00
3.00
4.00
5.00
6.00
7.00
8.00
Low Stiffness Pallet Medium Stiffness Pallet High Stiffness Pallet
Deflection (mm)
Column (P1) Split Row IL (P2) Pinwheel IL (P3) Split Row mix IL (P4) Pinwheel mix IL (P5)

56
Figure 21. Load transfer schematic of a column stacked Unit Load on a fork lift support across the width.
If the bottom layer of the unit load with the low stiffness pallet is analyzed to determine its
significance, it can be observed that its effect is masked by the interlocking of the layers on top.
In pattern P1, boxes are oriented on the shorter side towards the outside span, thus an effective
smaller dimension. The remainder of the patterns have two boxes facing the length and two on the
width, but their observed behavior shows a trend where the deflection did not change significantly
although the boxes orientation changed in the corners measured. The bottom layers are shown on
Table 19. These results suggest that the overall interlocking of the layers is possibly redistributing
the load in a more significant manner than any other effect from uneven box arrangement.
Table 19. Diagrams of pallet patterns for the bottom layers.
Bottom Layer Diagrams
P1 P2 and P4 P3 and P5

57
4.4 Pallet deflection when stacked on floor
Deflection was measured at eight locations across the top deckboards and the maximum of
each replicate was selected, in order to account for the different stress distributions in relation to
each stacking pattern. These results are shown in Table 20 and Figure 22.
For the load level and pallet stiffness used, no clear trend or significant difference was
identified for the different pallet stacking patterns evaluated. As it was observed in the previous
support conditions, if the deflection remains low in relation to the pallet capacity, differences
between the stacking patterns are not significant. A difference is shown for the medium stiffness
pallet between the columnar unit load (P1) and the pinwheel partially interlocked (P5). This
difference is not expected from the trends already identified and the simplest justification is the
power of the Tukey’s HSD, where a Type-I error is detecting differences where none exists, and
more replicates should be conducted to justify the difference. The ANOVA test conducted
provided a p-value of 0.0428, just slightly under the 0.05 threshold selected. Load bridging in floor
stacking has not been measured in previous investigations, except for load transfer when multiple
unit loads are stacked.
Table 20. Average of the maximum floor stacking pallet top deckboard deflection by stacking pattern and pallet design.
Stacking Pattern
Low Stiffness Pallet Medium Stiffness Pallet High Stiffness Pallet
Average
Deflection,
mm
Std.
Dev,
mm
Tukey
HSD
Average
Deflection,
mm
Std.
Dev,
mm
Tukey
HSD
Average
Deflection,
mm
Std.
Dev,
mm
Tukey
HSD
Column (P1) 4.42 0.37 A 1.89 0.17 B 0.75 0.04 D
Split Row IL (P2) 4.11 0.40 A 1.66 0.07 BC 0.62 0.04 D
Pinwheel IL (P3) 4.65 0.22 A 1.78 0.14 BC 0.71 0.11 D
Split Row mix IL (P4) 4.61 0.09 A 1.65 0.22 BC 0.60 0.01 D
Pinwheel mix IL (P5) 4.21 0.34 A 1.46 0.05 C 0.68 0.01 D

58
Figure 22. Average floor stacking pallet top deckboard deflection by stacking pattern and pallet design.
In order to better understand the reason why no differences where identified in this support
mode, an analogy between the floor stacking and warehouse racking across the width can be made,
and when analyzed as beams under load, the top deckboards have almost half of the free span
between the supports (in this case, the stringers instead of the rack) with load applied through the
edges of the boxes at only one or two locations depending on the pattern (Figure 23), generating
an overall low deflection. Smaller boxes might have applied a more uniformly distributed load and
depending on the patterns in used, would have provided higher deflection and an opportunity to
identify differences, as the ones observed in the racking across the width, but actual packages for
distribution are not commonly too small due to practical considerations.
0.00
0.50
1.00
1.50
2.00
2.50
3.00
3.50
4.00
4.50
5.00
Low Stiffness Pallet Medium Stiffness Pallet High Stiffness Pallet
Defelction (mm)
Column (P1) Split Row IL (P2) Pinwheel IL (P3) Split Row mix IL (P4) Pinwheel mix IL P5)
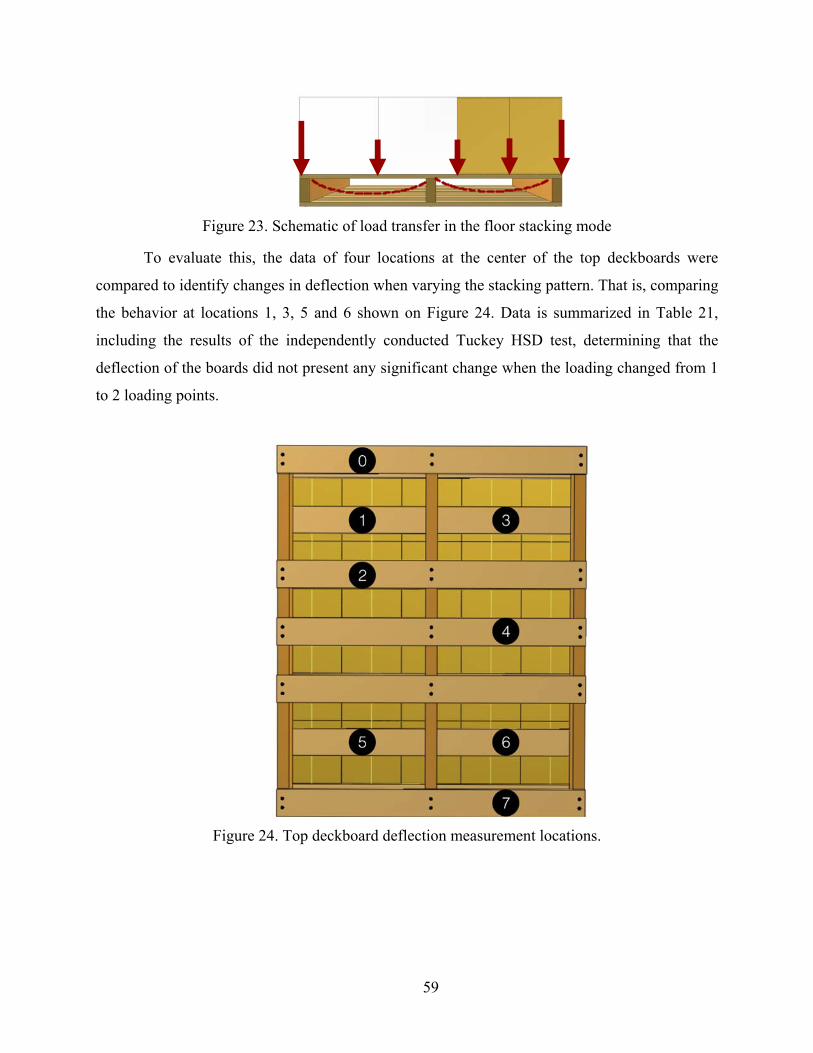
59
Figure 23. Schematic of load transfer in the floor stacking mode
To evaluate this, the data of four locations at the center of the top deckboards were
compared to identify changes in deflection when varying the stacking pattern. That is, comparing
the behavior at locations 1, 3, 5 and 6 shown on Figure 24. Data is summarized in Table 21,
including the results of the independently conducted Tuckey HSD test, determining that the
deflection of the boards did not present any significant change when the loading changed from 1
to 2 loading points.
Figure 24. Top deckboard deflection measurement locations.

60
Table 21. Deflection of top deckboards under a floor stacking support at four locations.
Location Stacking
Pattern
Average
Deflection,
mm
Std Dev,
mm Tukey HSD
1
P1 4.63 0.10 A
P2 4.25 0.54 A
P3 4.78 0.42 A
P4 5.01 0.09 A
P5 4.30 0.08 A
3
P1 3.85 0.29 A
P2 3.22 0.59 A
P3 3.16 0.35 A
P4 3.60 0.01 A
P5 3.02 0.51 A
5
P1 5.03 0.48 A
P2 4.42 0.89 A
P3 5.33 0.22 A
P4 4.01 0.20 A
P5 4.56 0.71 A
6
P1 3.34 0.27 A
P2 3.74 0.11 A
P3 3.51 0.34 A
P4 3.89 0.16 A
P5 3.40 0.78 A
4.5 Effect of pallet stiffness in load bridging
Most of the previous investigations conducted with the objective to understand the load
bridging effect, have designed specific pallets or pallet analogs, grouped them according to their
stiffness and then tested with a consistent load level (Center for Unit-Load Design, 1997; Collie,
1984; Fagan, 1982; Park, 2015; Park et al., 2017; M. S. White et al., 1999). This has provided
valuable information on the effect of the different factors on load bridging and was the basis for
the current experimental design, but a consistent observation has been made, where the load
bridging effect observed is greatest for lower stiffness pallets.
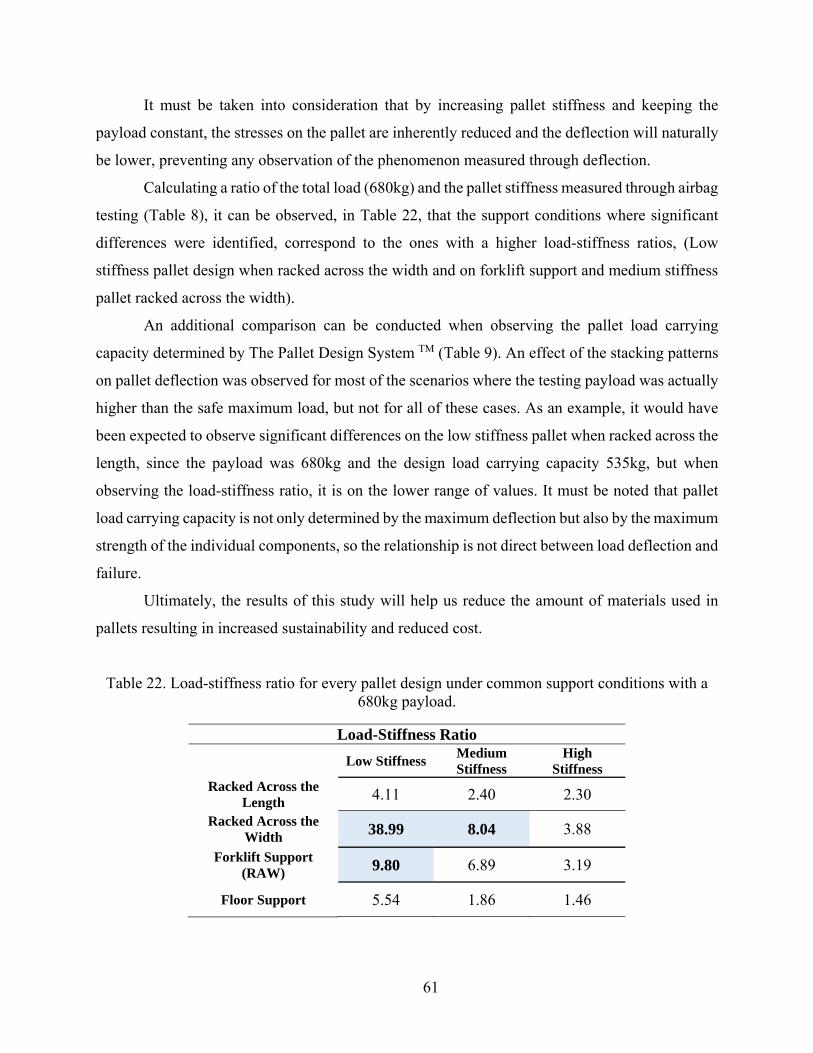
61
It must be taken into consideration that by increasing pallet stiffness and keeping the
payload constant, the stresses on the pallet are inherently reduced and the deflection will naturally
be lower, preventing any observation of the phenomenon measured through deflection.
Calculating a ratio of the total load (680kg) and the pallet stiffness measured through airbag
testing (Table 8), it can be observed, in Table 22, that the support conditions where significant
differences were identified, correspond to the ones with a higher load-stiffness ratios, (Low
stiffness pallet design when racked across the width and on forklift support and medium stiffness
pallet racked across the width).
An additional comparison can be conducted when observing the pallet load carrying
capacity determined by The Pallet Design System TM (Table 9). An effect of the stacking patterns
on pallet deflection was observed for most of the scenarios where the testing payload was actually
higher than the safe maximum load, but not for all of these cases. As an example, it would have
been expected to observe significant differences on the low stiffness pallet when racked across the
length, since the payload was 680kg and the design load carrying capacity 535kg, but when
observing the load-stiffness ratio, it is on the lower range of values. It must be noted that pallet
load carrying capacity is not only determined by the maximum deflection but also by the maximum
strength of the individual components, so the relationship is not direct between load deflection and
failure.
Ultimately, the results of this study will help us reduce the amount of materials used in
pallets resulting in increased sustainability and reduced cost.
Table 22. Load-stiffness ratio for every pallet design under common support conditions with a 680kg payload.
Load-Stiffness Ratio
Low Stiffness Medium Stiffness
High Stiffness
Racked Across the Length 4.11 2.40 2.30
Racked Across the Width 38.99 8.04 3.88
Forklift Support (RAW) 9.80 6.89 3.19
Floor Support 5.54 1.86 1.46

62
Chapter 5: Conclusions
After evaluating the effect of the interlocking of the layers, a significant reduction of unit
load deflection is generated when the load changes from a columnar stacking arrangement to any
of the interlocking patterns considered. This result only applies to the support conditions where
pallet deflection is greater, such as warehouse racking across the width for the low and medium
stiffness pallet and when supported on the fork lift across the width for the lower stiffness pallet.
After determining that the layer interlocking could have an effect under certain conditions,
it is also concluded that pallets with a low stiffness and when supported across the weakest
components (racked across the width), present a variation in deflection depending on the specific
pallet stacking pattern used.
No observable differences were identified in scenarios where the payload to stiffness ratio
was on the higher spectrum (more than 8), that is, when the pallet stiffness was high and the load
not heavy enough to produce higher deflection. On most of the scenarios with no significant
differences, the load used (680kg) was lower than the safe maximum load obtained from software
evaluation. When a pallet can safely carry a significantly higher evenly distributed load than the
actual payload, the load bridging effect is not only not observable, but loses its value for practical
applications.
Although the test conducted covered different stacking patterns and interlocking levels,
translating the results to different scenarios with other box sizes or pallet characteristics should be
done carefully, since many additional factors could influence the results and generate unaccounted
interactions. When using low stiffness pallets, interlocking the layers will provide better unit load
performance but the exact change in pallet stiffness and strength must be properly measured. The
information obtained provides a guideline for future research and packaging design but it is not
yet an adjustment factor for industry applications. When comparing the magnitude of the effect of
the load bridging factors, size can generate a potential pallet deflection reduction of 75% (Park et
al., 2017) when compared with uniform loading. The interlocking of the layers was observed to
reduce pallet deflection up to 53%, and when significant statistical differences where generated,
the interlocking level only generated an 11.6% of deflection change.

63
With this knowledge, pallet design can be improved to increase load capacity when the
payload characteristics are known. This will allow for the reduction in pallet costs and the use of
more lightweight pallets, which improve the sustainability of the supply chain operations.
64
Chapter 6: Recommendations for future research
To further explore and validate the results obtained and trends identified on this research
and with the objective to improve the understanding of the load bridging effect, the following
recommendations for future research can be made:
1) Validate the relationship between load-stiffness ratio and observable load bridging,
conducting studies where the payload is increased proportionally to the pallet stiffness,
conserving the same ratio. This must be conducted by carefully controlling every other
factor, specially box size, number of layers and unit load height. Density of the contents
could be varied to obtain this.
2) Further conduct testing to analyze the effect of the stacking patterns on load bridging, but
considering the interaction with additional load stabilizes, such as stretch wrap. The
additional containment force could generate higher rigidity of the load, reducing overall
deflection and potentially masking the differences found between the stacking patterns
and/or the interlocking of the layers.
3) Previous research identified the box sizes as a very significant factor in load bridging. The
interaction between the box sizes and the interlocking of the layers should be studied, since
the load redistribution and containment force from the interlocking could reduce the
significance of the box size effect.
4) Develop a finite element analysis model with the goal of evaluating the interactions between
the unit load components and ultimately generate a model to explain the fundamental
mechanism that causes load bridging. This information would provide the required
knowledge to translate load configuration into actual pressure distribution on the pallet.
Physical testing provides valuable knowledge for preliminary identification of factors, but
the magnitude of available options (load types, package sizes, pallet designs, etc.) require
computer models capable of processing multiple factors and their interactions.
5) Evaluate the load bridging effect on the pallet ultimate strength. Although attempts to achieve
this have been previously conducted, physical limitations from the maximum strength of
other components prevented the determination of pallet ultimate strength. Developing
computer models could help towards this goal.

65
References
ASTM. (2015). D198-15 Standard Test Methods of Static Tests of Lumber in Structural Sizes.
West Conshohocken, PA. https://doi.org/10.1520/D0198-15
ASTM International. (2009). ASTM D1185-98a(2009) Standard test methods for pallets and
related structures employed in materials handling and shipping. West Conshohocken, PA.
https://doi.org/10.1520/D1185-98AR09
Baker, M., Horvath, L., & White, M. (2016a). Effect of pallet deckboard stiffness on corrugated
box compression strength. Packaging Technology and Science, 29(4–5), 263–274.
https://doi.org/10.1002/pts.2201
Baker, M., Horvath, L., & White, M. S. (2016b). Predicting the effect of gaps between pallet
deckboards on the compression strength of corrugated boxes. Journal of Applied Packaging
Research, 8(3), 30–42. https://doi.org/10.14448/japr.08.0017
Barnett, S., & Kynch, G. J. (1967). Exact Solution of a Simple Cutting Problem. Operations
Research, 15(6), 1051–1056.
Bisha, J. V. (2008). The effect of load stabilizer selection on load shift within unit loads (Master’s
Thesis). Virginia Polytechnic Institute and State University, Blacksburg, VA.
Bisha, J. V. (2012). Correlation of the elastic properties of stretch film on unit load containment.
Virginia Polytechnic Institute and State University, Blacksburg, VA.
Browder, G. R. (1935). A Story of the Fibre Box and History of its Developments. Fibre
Containers and Paperboard Mills, 20(8).
Bush, R. J., & Araman, P. A. (2014). Trends in the use of wood products for distribution packaging
- Cooperative Agreement No. 11-CA11330142-137. Blacksburg, VA.
Carpenter, H., & Dowsland, W. B. (1985). Practical considerations of the pallet loading problem.
The Journal of the Operational Research Society, 36(6), 489–497.
https://doi.org/10.2307/2582821
Carstens, R., & Mina, S. (1988). Lock “N” Pop And Strech Wrap: Identifying the Key Decisions
In Package-Material Handling to make the best choice. Journal of Packaging Technology,
2(3), 103–105.
Center for Unit-Load Design. (1997). The effect of load bridging on unit-load deflection. Research
66
Update. Blacksburg, VA.
Clarke, J. (2004). Pallets 101 : Industry overview and wood , plastic , paper & metal options.
Retrieved from http://www.ista.org/forms/Pallets_101-Clarke_2004.pdf
Collie, S. T. (1984). Laboratory verification of pallet design procedures (Master’s Thesis).
Virginia Polytechnic Institute and State University, Blacksburg, VA.
Dekker, A. (2013). Corrugated fibreboard packaging. In M. J. Kirwan (Ed.), Handbook of Paper
and Paperboard Packaging Technology (2nd ed., pp. 313–339). London: John Wiley & Sons,
Ltd. https://doi.org/10.1002/9781118470930
DiSalvo, M. H. (1999). Interactive effects of palletizing factors on fiberboard packing strength
(Master’s Thesis). San Jose State University, San Jose, CA.
Fagan, B. (1982). Load-support conditions and computerized test apparatus for wood pallets
(Master’s Thesis). Virginia Polytechnic Institute and State University, Blacksburg, VA.
FEFCO-ESBO. (2007). International fibreboard case code. Belgium: FEFCO.
https://doi.org/10.1017/CBO9781107415324.004
Fibre Box Association. (2005). Fibre Box Handbook (22nd ed.). Elk Grove Village, IL.
Fibre Box Association. (2015). Fibre Box Handbook (75th Anniv). Elk Grove Village, IL.
Foster, G. A. (2010). Boxes, Corrugated. In K. L. Yam (Ed.), The Wiley Encyclopedia of
Packaging Technology (3rd., pp. 162–170). New York: John Wiley & Sons, Ltd.
Frank, B. (2014). Corrugated box compression-A literature survey. Packaging Technology and
Science, 27(2), 105–128. https://doi.org/10.1002/pts.2019
Frank, B., Gilgenbach, M., & Maltenfort, M. (2010). Compression testing to simulate real-world
stresses. Packaging Technology and Science, 23(5), 275–282. https://doi.org/10.1002/pts.898
Goertz, J. (1976). Unitization in Distribution. In P. M. Van Buytenen (Ed.), Business Logistics (pp.
200–217). Belgium: H.E. Stenfert Kroese B.V.
Han, J., White, M., & Hamner, P. (2007). Development of a Finite Element Model of Pallet
Deformation and Compressive Stresses on Packaging within Pallet Loads. Journal of Applied
Packaging Research, 1(3), 149–162.
Heskett, J. L., Ivie, R. M., & Glaskowsky, N. A. (1964). Business Logistics (1st.). New York: The
Ronald Press Company.
Hodgson, T. J. (1982). A combined approach to the pallet loading problem. A I I E Transactions,
14(3), 175–182. https://doi.org/10.1080/05695558208975057

67
Ievans, U. I. (1975). The effect of warehouse mishandling and stacking patterns on the
compression strength of corrugated boxes. TAPPI Journal, 58(8), 108–111.
ISO. (2003). ISO 6780:2003(E) Flat pallets for intercontinental materials handling - Principal
dimensions and tolerances. Geneva.
ISO. (2012). ISO 3394:2012 Packaging - Complete, filled transport packages and unit loads -
Dimensions of rigid rectangular packages. Geneva, Switzerland.
ISO/FDIS. (2011). ISO/FDIS 8611-1:2011(E) Pallets for materials handling — Flat pallets.
Geneva, Switzerland.
Jones, A. L. (1871). Improvement in Paper for Packing. USA: United States Patent Office.
Kellicut, K. Q. (1963). Effect of contents and load bearing surface on compressive strength and
stacking life of corrugated containers. Tappi, 46(1), 151A–154 A.
Kellicut, K. Q., & Landt, E. F. (1951). Safe stacking life of corrugated boxes. Fibre Containers,
36(9), 28–38.
Kocjan, W., & Holmström, K. (2010). Computing stable loads for pallets. European Journal of
Operational Research, 207(2), 980–985. https://doi.org/10.1016/j.ejor.2010.05.005
Koning, J. W. (1983). Corrugated Fiberboard. In R. E. Mark (Ed.), Handbook of Physical and
Mechanical Testing of Paper and Paperboard (pp. 385–408). New York: Marcel Dekker,
Inc.
Lacefield, S. K. (2015). Paper or plastic? (or maybe metal). Retrieved from
http://www.dcvelocity.com/articles/20150325-paper-or-plastic-or-maybe-metal/
LeBlanc, R., & Richardson, S. (2003). Pallets: A North American perspective (1ed.). Ontario,
Canada, Canada: PACTS Management Inc.
Loferski, J. R., Mclain, T. E., & Collie, S. T. (1988). Analysis of racked wood pallets. Wood and
Fiber Science, 20(3), 304–319.
Maltenfort, G. G. (1988). Corrugated Shipping Containers. New York: Jelmar Publishing Co.,
Inc.
Mazeika Bilbao, A., Carrano, A. L., Hewitt, M., & Thorn, B. K. (2011). On the environmental
impacts of pallet management operations. Management Research Review, 34(11), 1222–
1236. https://doi.org/10.1108/01409171111178765
McCrea, B. (2016). Pallet usage report: Pallets remain critical in the modern-day warehouse.
Retrieved March 6, 2017, from
68
http://www.mmh.com/article/pallets_remain_critical_in_the_modern_day_warehouse
McGinley, D. (2016). Wood pallets & skids production in the US (IBISWorld Industry Report
32192). Melbourne, Australia.
McKee, R. C., & Gander, J. W. (1957). Top-load compression. TAPPI, 40(1), 57–64.
McKee, R. C., Ganer, J. W., & Wachuta, J. R. (1963). Compression strenght formula for
corrugated boxes. In G. G. Maltenfort (Ed.), Performance and Evaluation of Shipping
Containers (1st ed., pp. 62–73). New York: Jelmar Publishing Co., Inc.
MH1 Committee. (2016). MH1-2016 Pallets, Slip Sheets, and Other Bases for Unit Loads.
Charlotte, NC: MH1 Secretariat.
Monaghan, J., & Marcondes, J. (1992). Technical notes: Overhang and pallet gap effects on the
performance of corrugated fiberboard boxes. Transactions of the ASAE, 35(6), 1945–1947.
https://doi.org/10.13031/2013.28820
National Wooden Pallet and Container Association. (2014). Uniform standard for wood pallets.
Alexandria, VA: NWPCA.
Park, J. (2015). Investigation of fundamental relationships to improve the sustainability of unit
loads (Doctoral dissertation). Virginia Polytechnic Institute and State University.
Park, J., Horvath, L., White, M. S., Phanthanousy, S., Araman, P., & Bush, R. J. (2017). The
influence of package size and flute type of corrugated boxes on load bridging in unit loads.
Packaging Technology and Science, 30(1–2), 33–43. https://doi.org/10.1002/pts.2279
Peleg, K., & Peleg, E. (1976). Container dimensions for optimal utilization of storage and
transportation space. Computer-Aided Design, 8(3), 175–180. https://doi.org/10.1016/0010-
4485(76)90031-2
Raballand, G., & Aldaz-Carroll, E. (2007). How do differing standards increase trade costs? The
case of pallets. The World Economy, 30(4), 685–702. https://doi.org/10.1111/j.1467-
9701.2007.01009.x
Ram, B. (1992). The pallet loading problem: A survey. International Journal of Production
Economics, 28(2), 217–225. https://doi.org/10.1016/0925-5273(92)90034-5
Rogers, L. K. (2011). Keeping it together. Modern Materials Handling, 66(7), 32–35.
Samarasinghe, S. (1987). Predicting rotation modulus for block pallet joints (Master’s Thesis).
Virginia Tech, Blacksburg, VA.
Schuster, M., Bormann, R., Steidl, D., Reynolds-Haertle, S., & Stilman, M. (2010). Stable stacking
69
for the distributor’s pallet packing problem. In 2010 IEEE/RSJ International Conference on
Intelligent Robots and Systems (pp. 3646–3651). Taipei, Taiwan: IEEE.
https://doi.org/10.1109/IROS.2010.5650217
Silva, E., Oliveira, J. F., & Wäscher, G. (2016). The pallet loading problem: A review of solution
methods and computational experiments. International Transactions in Operational
Research, 23(1–2), 147–172. https://doi.org/10.1111/itor.12099
Singh, J., Cernokus, E., Saha, K., & Roy, S. (2014). The Effect of Stretch Wrap Prestretch on
Unitized Load Containment. Packaging Technology and Science, 27(12), 944–961.
https://doi.org/10.1002/pts.2083
Singh, J., & Singh, S. P. (2011). Effect of Palletized Box Offset on Compression Strength of
Unitized and Stacked Empty Corrugated Fiberboard Boxes. Journal of Applied Packaging
Research, 5(3), 157–167.
Steadman, R. (2002). Corrugated Board. In R. E. Mark, C. C. Habeger, J. Borch, & M. B. Lyne
(Eds.), Handbook of Physical Testing of Paper (2nd ed., pp. 563–660). New York.
The Freedonia Group, I. (2008). Pallets. Cleveland, Ohio.
The Freedonia Group, I. (2015). Pallets. Cleveland, Ohio.
Twede, D. (2007). The History of Corrugated Fiberboard Shipping Containers. CHARM, 241–246.
Twede, D., Selke, S. E. M., Kamdem, D.-P., & Shires, D. (2014). Cartons, crates and corrugated
board: handbook of paper and wood packaging technology (2nd.). DEStech Publications,
Inc.
Urbanik, T. J. (1985a). A method for determining the effect of fasteners on the stiffness and
strength of wood drive-in-rack pallets. Journal of Testing and Evaluation, 13(5), 379–386.
https://doi.org/10.1520/JTE10967J
Urbanik, T. J. (1985b). Deckboard bending theory for 3-stringer wood pallets in drive-in racks.
Journal of Testing and Evaluation, 13(1), 3–8. https://doi.org/10.1520/JTE10754J
Urbanik, T. J., & Frank, B. (2006). Box compression analysis of world-wide data spanning 46
years. Wood And Fiber Science, 38(3), 399–416.
Weigel, B. T. G., & White, M. S. (1999). The Effect of Pallet Connection Stiffness, Deck Stiffness
and Static Load Level on the Resonant Response of Pallet Decks to Vibration Frequencies
Occurring in the Distribution Environment. Packaging Technology and Science, 12, 47–55.
White, B. S. (2008). Measurement of wood pallet performance subjected to uniform loading in
70
racked, fork tine, and floor stacked support conditions (Master’s Thesis). Virginia
Polytechnic Institute and State University, Blacksburg, VA.
White, M. S. (2015). The Effect of Pallet Deck Design on Package Compression. In ISTA
TransPack Forum. Orlando, Florida.
White, M. S., Dibling, W., Rupert, R., & Mcleod, J. (1999). Determining pallet maximum working
loads from nominal load measurements. Blacksburg, VA.
White, M. S., & Hamner, P. (2005). Pallets move the world: the case for developing system-based
designs for unit loads. Forest Products Journal, 55(3), 8–16.
Yoo, J. (2011). Modeling compressive stress distributions at the interface between a pallet deck
and distribution packaging (Doctoral dissertation). Virginia Tech.

71
Appendix A: Modulus of Elasticity (MOE) measurements for pallet
components
The Modulus of Elasticity (MOE) was calculated for each wood component of the pallets, conducting a
center-point loading test to determine flexural properties following the standard ASTM D198 (ASTM, 2015)
Static Tests of Lumber in Structural Sizes. With the load and bending data obtained, the MOE was calculated
using Equation 2.
4 ∆ [Equation 2]
Where is the increment of applied load on flexure specimen below proportional limit, (N), is the span
of flexure (mm), is the width of flexure specimen (mm), is the depth of rectangular flexure specimen (mm)
and ∆ is the increment of deflection of neutral axis of flexure specimen measured at midspan over distance and
corresponding load (mm).
Every test conducted for the stringer components had a span, , of 1100mm and deckboard components
of 900mm. The following tables show the data for each component, by pallet design.

72
Table A 1. Modulus of Elasticity (MOE) data for the low stiffness pallet design.
Component Type Specimen ID Deflection
∆ (mm)
Load
(N)
Component
Thickness
(mm)
Component Width
(mm)
Component Length
(mm) MOE (MPa)
Stringer S2 2.359 1,450 88.66 25.65 1,202 11,397
Stringer S8 2.127 1,291 88.84 25.61 1,202 11,205
Stringer S12 2.101 1,242 88.96 25.60 1,200 10,870
Deckboard D1-1 15.765 54 9.80 88.24 1,002 7,482
Deckboard D1-2 15.636 50 9.62 88.00 1,000 7,438
Deckboard D1-3 14.759 48 9.72 88.26 1,002 7,341
Deckboard D1-5 15.250 48 9.76 88.08 1,000 7,036
Deckboard D1-6 16.004 54 9.67 88.22 1,000 7,661
Deckboard D1-7 16.643 46 9.73 88.58 1,002 6,198
Deckboard D1-9 16.494 44 9.71 88.45 1,000 6,033
Deckboard D1-11 13.503 40 9.75 88.48 1,000 6,542
Deckboard D1-12 14.598 46 9.74 88.57 1,000 6,985
Deckboard D1-13 13.784 48 9.75 87.89 1,000 7,807
Deckboard D1-15 12.457 29 9.88 88.40 1,000 4,990
Deckboard D1-16 13.368 24 9.75 88.65 999 3,905
Deckboard D1-17 12.115 25 9.78 88.45 1,000 4,598
Deckboard D1-21 8.915 52 9.81 87.88 1,000 12,640

73
Table A 2. Modulus of Elasticity (MOE) data for the medium stiffness pallet design.
Component
Type
Specimen
ID
Deflection
∆ (mm)
Load
(N)
Component
Thickness
(mm)
Component
Width
(mm)
Component
Length
(mm)
MOE
(MPa)
Component
Type
Stringer S5 EM-D2 2.011 1,788 88.46 38.40 1,200 11,088
Stringer S10 EM-D2 1.425 1,443 88.75 38.26 1,200 12,546
Stringer S11 EM-D2 1.536 1,399 88.79 38.29 1,202 11,261
Deckboard D2-1 EM-D2 6.267 116 16.09 88.18 1,002 9,154
Deckboard D2-2 EM-D2 5.332 101 16.08 87.47 1,002 9,471
Deckboard D2-3 EM-D2 6.669 115 16.13 88.33 1,000 8,426
Deckboard D2-5 EM-D2 7.402 119 16.07 88.33 1,000 7,945
Deckboard D2-6 EM-D2 8.615 143 16.07 87.45 1,000 8,295
Deckboard D2-8 EM-D2 6.575 123 16.08 88.08 1,002 9,290
Deckboard D2-10 EM-D2 6.260 118 16.09 88.07 1,002 9,348
Deckboard D2-12 EM-D2 4.821 127 16.11 86.67 1,000 13,157
Deckboard D2-13 EM-D2 6.859 128 16.09 87.70 1,000 9,260
Deckboard D2-17 EM-D2 5.975 127 16.22 88.67 1,000 10,173
Deckboard D2-18 EM-D2 4.646 130 16.25 87.58 999 13,528
Deckboard D2-19 EM-D2 6.626 122 16.19 88.67 999 8,914
Deckboard D2-20 EM-D2 5.436 139 16.18 87.82 999 12,505
Deckboard D2-21 EM-D2 6.306 123 16.17 88.73 999 9,404

74
Table A 3. Modulus of Elasticity (MOE) data for the high stiffness pallet design.
Component
Type
Specimen
ID
Deflection ∆
(mm)
Load
(N)
Component
Thickness
(mm)
Component
Width
(mm)
Component
Length
(mm)
MOE
(MPa)
Component
Type
Stringer S3 EM-D3 1.541 1,635 88.72 44.72 1,202 11,261
Stringer S4 EM-D3 1.444 1,630 88.82 44.75 1,200 11,938
Stringer S6 EM-D3 3.332 4,277 89.31 44.75 1,202 13,344
Deckboard D3-3 EM-D3 3.537 210 22.31 87.41 1,002 11,079
Deckboard D3-4 EM-D3 3.438 247 22.31 88.02 1,000 13,300
Deckboard D3-6 EM-D3 3.546 223 22.22 87.77 1,000 11,860
Deckboard D3-7 EM-D3 4.128 206 22.27 87.62 1,000 9,343
Deckboard D3-9 EM-D3 4.051 209 22.26 87.85 1,002 9,659
Deckboard D3-10 EM-D3 3.520 224 22.28 88.45 1,000 11,771
Deckboard D3-11 EM-D3 3.578 197 22.17 87.29 1,000 10,499
Deckboard D3-12 EM-D3 3.147 193 22.38 88.05 1,002 11,294
Deckboard D3-15 EM-D3 4.605 231 22.55 88.79 1,000 8,921
Deckboard D3-17 EM-D3 3.531 259 22.50 88.43 1,000 13,191
Deckboard D3-18 EM-D3 4.593 207 22.55 88.84 999 8,037
Deckboard D3-19 EM-D3 3.990 204 22.51 86.76 1,000 9,391
Deckboard D3-20 EM-D3 3.744 248 22.52 88.17 999 11,944
Deckboard D3-22 EM-D3 4.658 254 22.50 88.52 1,000 9,819
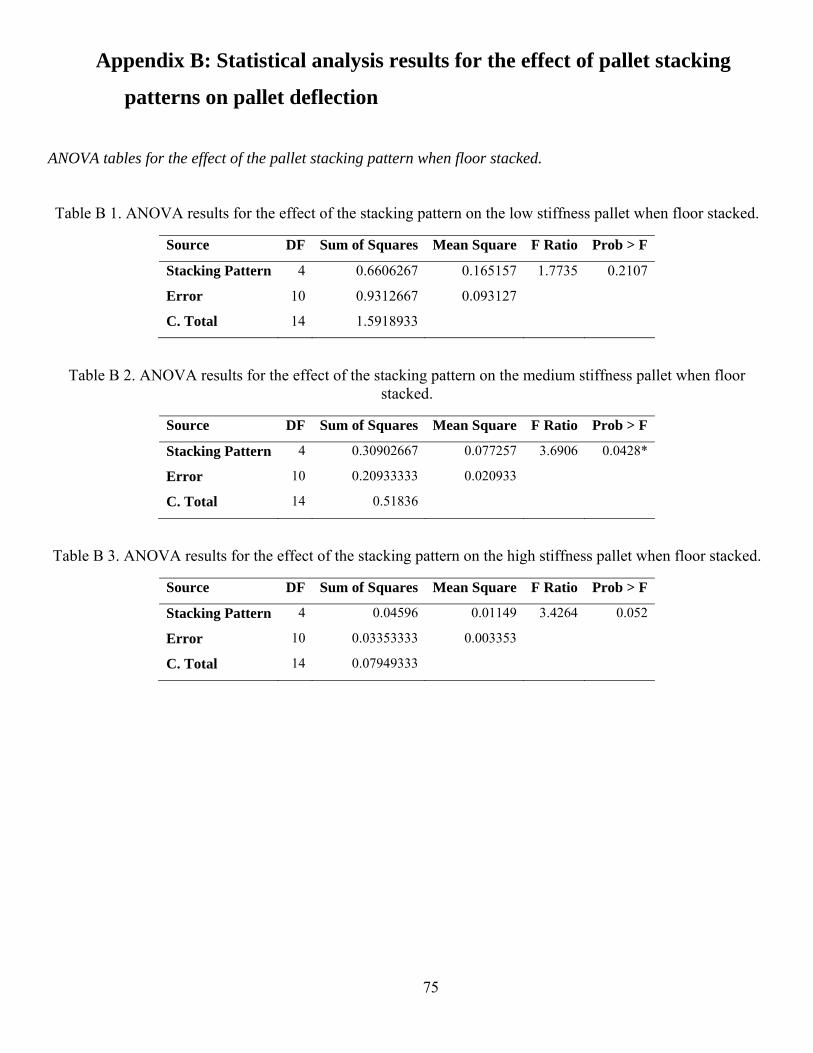
75
Appendix B: Statistical analysis results for the effect of pallet stacking
patterns on pallet deflection
ANOVA tables for the effect of the pallet stacking pattern when floor stacked.
Table B 1. ANOVA results for the effect of the stacking pattern on the low stiffness pallet when floor stacked.
Source DF Sum of Squares Mean Square F Ratio Prob > F
Stacking Pattern 4 0.6606267 0.165157 1.7735 0.2107
Error 10 0.9312667 0.093127
C. Total 14 1.5918933
Table B 2. ANOVA results for the effect of the stacking pattern on the medium stiffness pallet when floor stacked.
Source DF Sum of Squares Mean Square F Ratio Prob > F
Stacking Pattern 4 0.30902667 0.077257 3.6906 0.0428*
Error 10 0.20933333 0.020933
C. Total 14 0.51836
Table B 3. ANOVA results for the effect of the stacking pattern on the high stiffness pallet when floor stacked.
Source DF Sum of Squares Mean Square F Ratio Prob > F
Stacking Pattern 4 0.04596 0.01149 3.4264 0.052
Error 10 0.03353333 0.003353
C. Total 14 0.07949333

76
ANOVA tables for the effect of the pallet stacking pattern when racked across the width.
Table B 4. ANOVA results for the effect of the stacking pattern on the center of the low stiffness pallet when racked across the width.
Source DF Sum of Squares Mean Square F Ratio Prob > F
Stacking Pattern 4 382.6084 95.6521 82.4251 <.0001*
Error 10 11.60473 1.1605
C. Total 14 394.21313
Table B 5. ANOVA results for the effect of the stacking pattern on the sides of the low stiffness pallet when racked across the width.
Source DF Sum of Squares Mean Square F Ratio Prob > F
Stacking Pattern 4 390.20971 97.5524 80.721 <.0001*
Error 10 12.08513 1.2085
C. Total 14 402.29484
Table B 6. ANOVA results for the effect of the stacking pattern on the center of the medium stiffness pallet when racked across the width.
Source DF Sum of Squares Mean Square F Ratio Prob > F
Stacking Pattern 4 7.5762667 1.89407 12.9938 0.0006*
Error 10 1.4576667 0.14577
C. Total 14 9.0339333
Table B 7. ANOVA results for the effect of the stacking pattern on the sides of the medium stiffness pallet when racked across the width.
Source DF Sum of Squares Mean Square F Ratio Prob > F
Stacking Pattern 4 7.12484 1.78121 11.923 0.0008*
Error 10 1.4939333 0.14939
C. Total 14 8.6187733
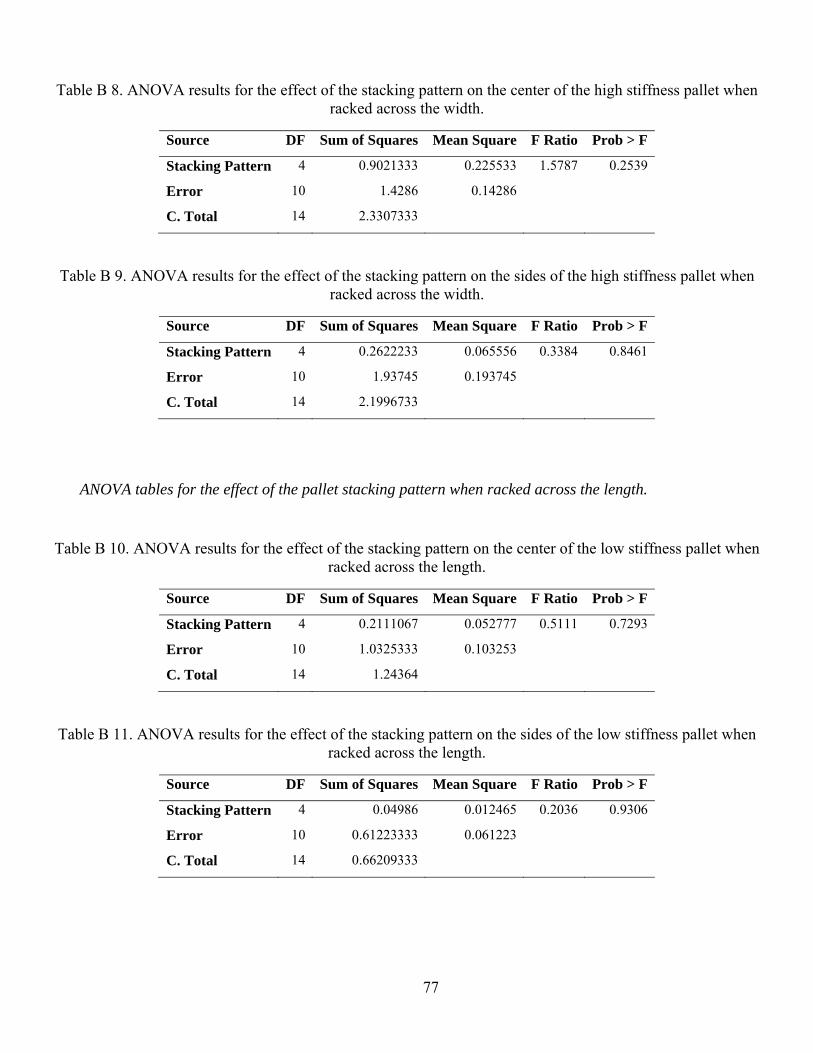
77
Table B 8. ANOVA results for the effect of the stacking pattern on the center of the high stiffness pallet when racked across the width.
Source DF Sum of Squares Mean Square F Ratio Prob > F
Stacking Pattern 4 0.9021333 0.225533 1.5787 0.2539
Error 10 1.4286 0.14286
C. Total 14 2.3307333
Table B 9. ANOVA results for the effect of the stacking pattern on the sides of the high stiffness pallet when racked across the width.
Source DF Sum of Squares Mean Square F Ratio Prob > F
Stacking Pattern 4 0.2622233 0.065556 0.3384 0.8461
Error 10 1.93745 0.193745
C. Total 14 2.1996733
ANOVA tables for the effect of the pallet stacking pattern when racked across the length.
Table B 10. ANOVA results for the effect of the stacking pattern on the center of the low stiffness pallet when racked across the length.
Source DF Sum of Squares Mean Square F Ratio Prob > F
Stacking Pattern 4 0.2111067 0.052777 0.5111 0.7293
Error 10 1.0325333 0.103253
C. Total 14 1.24364
Table B 11. ANOVA results for the effect of the stacking pattern on the sides of the low stiffness pallet when racked across the length.
Source DF Sum of Squares Mean Square F Ratio Prob > F
Stacking Pattern 4 0.04986 0.012465 0.2036 0.9306
Error 10 0.61223333 0.061223
C. Total 14 0.66209333

78
Table B 12. ANOVA results for the effect of the stacking pattern on the center of the medium stiffness pallet when racked across the length.
Source DF Sum of Squares Mean Square F Ratio Prob > F
Stacking Pattern 4 0.2547333 0.063683 0.2286 0.9161
Error 10 2.7864 0.27864
C. Total 14 3.0411333
Table B 13. ANOVA results for the effect of the stacking pattern on the sides of the medium stiffness pallet when racked across the length.
Source DF Sum of Squares Mean Square F Ratio Prob > F
Stacking Pattern 4 0.2238767 0.055969 0.321 0.8576
Error 10 1.7435167 0.174352
C. Total 14 1.9673933
Table B 14. ANOVA results for the effect of the stacking pattern on the center of the high stiffness pallet when racked across the length.
Source DF Sum of Squares Mean Square F Ratio Prob > F
Stacking Pattern 4 0.3549067 0.088727 0.3428 0.8431
Error 10 2.5884667 0.258847
C. Total 14 2.9433733
Table B 15. ANOVA results for the effect of the stacking pattern on the sides of the high stiffness pallet when racked across the length.
Source DF Sum of Squares Mean Square F Ratio Prob > F
Stacking Pattern 4 0.53146 0.132865 0.7491 0.5806
Error 10 1.7737 0.17737
C. Total 14 2.30516
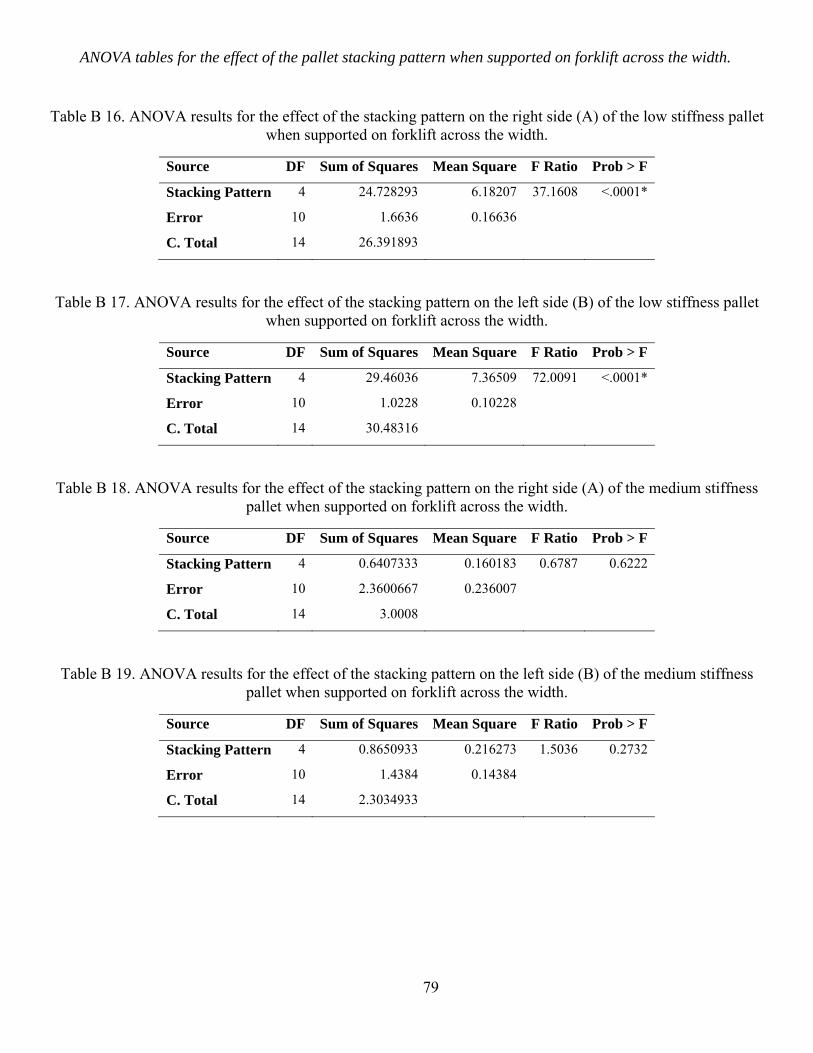
79
ANOVA tables for the effect of the pallet stacking pattern when supported on forklift across the width.
Table B 16. ANOVA results for the effect of the stacking pattern on the right side (A) of the low stiffness pallet when supported on forklift across the width.
Source DF Sum of Squares Mean Square F Ratio Prob > F
Stacking Pattern 4 24.728293 6.18207 37.1608 <.0001*
Error 10 1.6636 0.16636
C. Total 14 26.391893
Table B 17. ANOVA results for the effect of the stacking pattern on the left side (B) of the low stiffness pallet when supported on forklift across the width.
Source DF Sum of Squares Mean Square F Ratio Prob > F
Stacking Pattern 4 29.46036 7.36509 72.0091 <.0001*
Error 10 1.0228 0.10228
C. Total 14 30.48316
Table B 18. ANOVA results for the effect of the stacking pattern on the right side (A) of the medium stiffness pallet when supported on forklift across the width.
Source DF Sum of Squares Mean Square F Ratio Prob > F
Stacking Pattern 4 0.6407333 0.160183 0.6787 0.6222
Error 10 2.3600667 0.236007
C. Total 14 3.0008
Table B 19. ANOVA results for the effect of the stacking pattern on the left side (B) of the medium stiffness pallet when supported on forklift across the width.
Source DF Sum of Squares Mean Square F Ratio Prob > F
Stacking Pattern 4 0.8650933 0.216273 1.5036 0.2732
Error 10 1.4384 0.14384
C. Total 14 2.3034933

80
Table B 20. ANOVA results for the effect of the stacking pattern on the right side (A) of the high stiffness pallet when supported on forklift across the width.
Source DF Sum of Squares Mean Square F Ratio Prob > F
Stacking Pattern 4 0.47413333 0.118533 2.9081 0.0779
Error 10 0.4076 0.04076
C. Total 14 0.88173333
Table B 21. ANOVA results for the effect of the stacking pattern on the left side (B) of the high stiffness pallet when supported on forklift across the width.
Source DF Sum of Squares Mean Square F Ratio Prob > F
Stacking Pattern 4 0.5159067 0.128977 2.1895 0.1436
Error 10 0.5890667 0.058907
C. Total 14 1.1049733
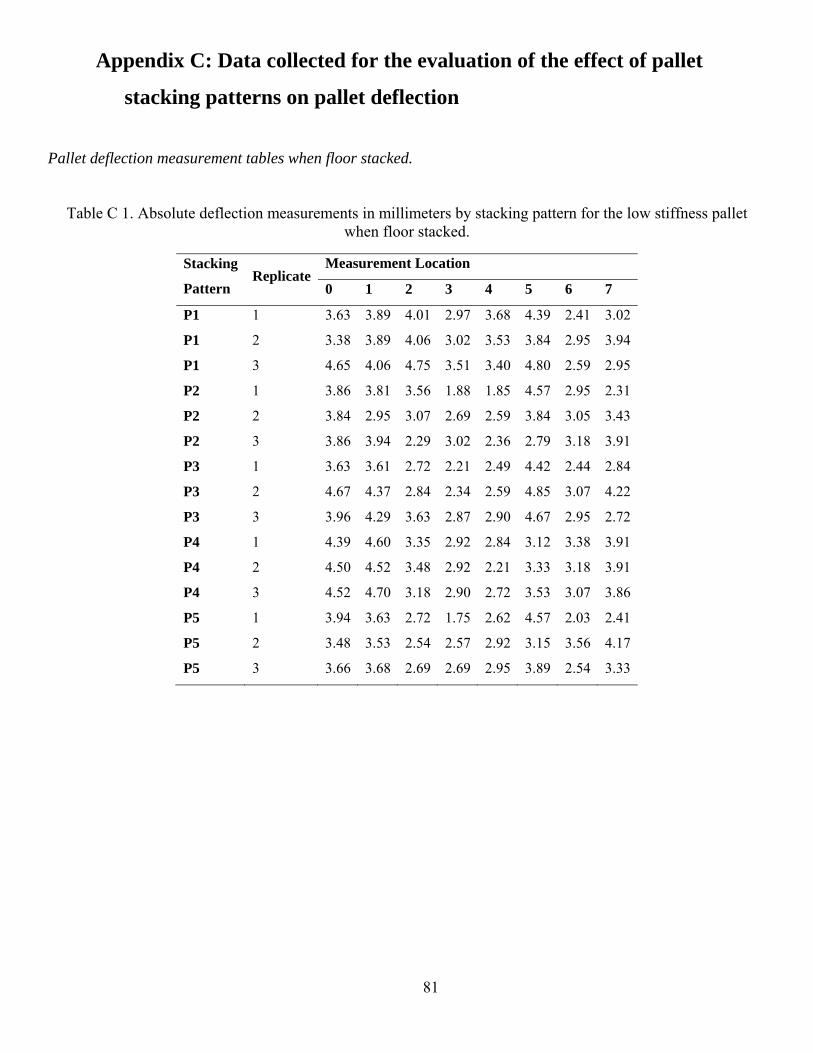
81
Appendix C: Data collected for the evaluation of the effect of pallet
stacking patterns on pallet deflection
Pallet deflection measurement tables when floor stacked.
Table C 1. Absolute deflection measurements in millimeters by stacking pattern for the low stiffness pallet when floor stacked.
Stacking
Pattern Replicate
Measurement Location
0 1 2 3 4 5 6 7
P1 1 3.63 3.89 4.01 2.97 3.68 4.39 2.41 3.02
P1 2 3.38 3.89 4.06 3.02 3.53 3.84 2.95 3.94
P1 3 4.65 4.06 4.75 3.51 3.40 4.80 2.59 2.95
P2 1 3.86 3.81 3.56 1.88 1.85 4.57 2.95 2.31
P2 2 3.84 2.95 3.07 2.69 2.59 3.84 3.05 3.43
P2 3 3.86 3.94 2.29 3.02 2.36 2.79 3.18 3.91
P3 1 3.63 3.61 2.72 2.21 2.49 4.42 2.44 2.84
P3 2 4.67 4.37 2.84 2.34 2.59 4.85 3.07 4.22
P3 3 3.96 4.29 3.63 2.87 2.90 4.67 2.95 2.72
P4 1 4.39 4.60 3.35 2.92 2.84 3.12 3.38 3.91
P4 2 4.50 4.52 3.48 2.92 2.21 3.33 3.18 3.91
P4 3 4.52 4.70 3.18 2.90 2.72 3.53 3.07 3.86
P5 1 3.94 3.63 2.72 1.75 2.62 4.57 2.03 2.41
P5 2 3.48 3.53 2.54 2.57 2.92 3.15 3.56 4.17
P5 3 3.66 3.68 2.69 2.69 2.95 3.89 2.54 3.33
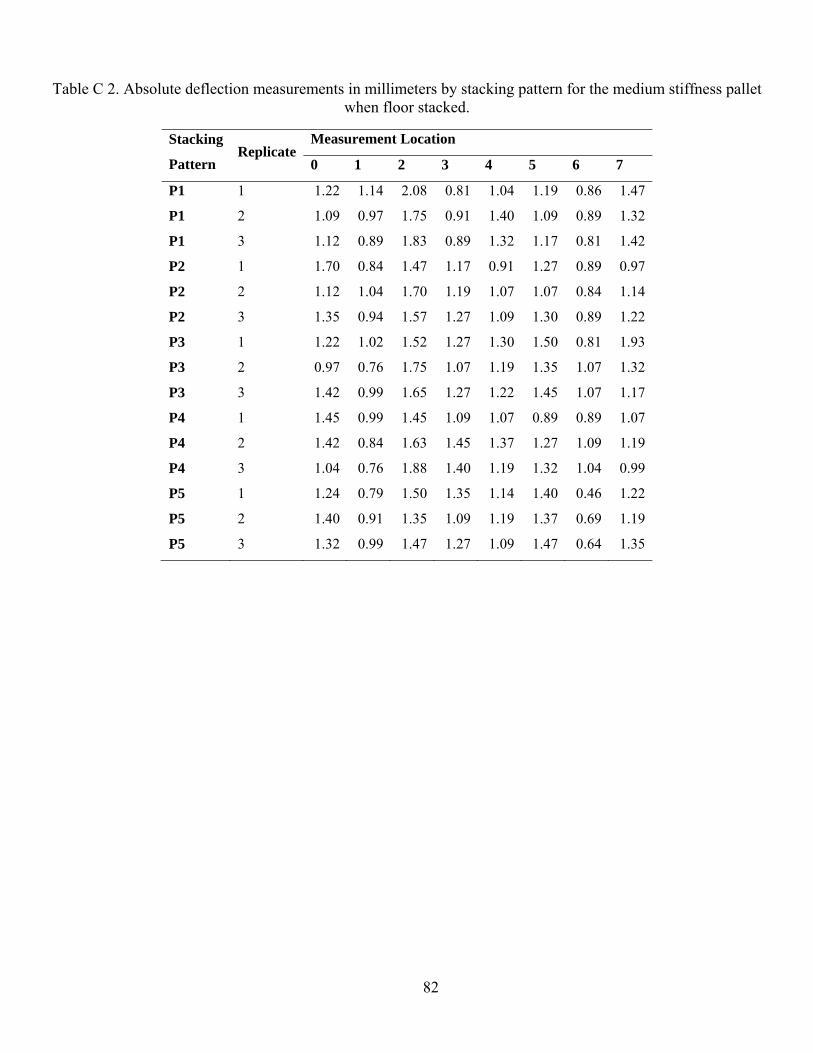
82
Table C 2. Absolute deflection measurements in millimeters by stacking pattern for the medium stiffness pallet when floor stacked.
Stacking
Pattern Replicate
Measurement Location
0 1 2 3 4 5 6 7
P1 1 1.22 1.14 2.08 0.81 1.04 1.19 0.86 1.47
P1 2 1.09 0.97 1.75 0.91 1.40 1.09 0.89 1.32
P1 3 1.12 0.89 1.83 0.89 1.32 1.17 0.81 1.42
P2 1 1.70 0.84 1.47 1.17 0.91 1.27 0.89 0.97
P2 2 1.12 1.04 1.70 1.19 1.07 1.07 0.84 1.14
P2 3 1.35 0.94 1.57 1.27 1.09 1.30 0.89 1.22
P3 1 1.22 1.02 1.52 1.27 1.30 1.50 0.81 1.93
P3 2 0.97 0.76 1.75 1.07 1.19 1.35 1.07 1.32
P3 3 1.42 0.99 1.65 1.27 1.22 1.45 1.07 1.17
P4 1 1.45 0.99 1.45 1.09 1.07 0.89 0.89 1.07
P4 2 1.42 0.84 1.63 1.45 1.37 1.27 1.09 1.19
P4 3 1.04 0.76 1.88 1.40 1.19 1.32 1.04 0.99
P5 1 1.24 0.79 1.50 1.35 1.14 1.40 0.46 1.22
P5 2 1.40 0.91 1.35 1.09 1.19 1.37 0.69 1.19
P5 3 1.32 0.99 1.47 1.27 1.09 1.47 0.64 1.35

83
Table C 3. Absolute deflection measurements in millimeters by stacking pattern for the high stiffness pallet when floor stacked.
Stacking
Pattern Replicate
Measurement Location
0 1 2 3 4 5 6 7
P1 1 0.46 0.43 0.71 0.38 0.61 0.46 0.33 0.53
P1 2 0.46 0.56 0.79 0.28 0.48 0.36 0.20 0.33
P1 3 0.38 0.51 0.74 0.48 0.58 0.48 0.36 0.41
P2 1 0.43 0.36 0.56 0.66 0.41 0.48 0.41 0.38
P2 2 0.46 0.51 0.58 0.53 0.51 0.41 0.48 0.30
P2 3 0.43 0.61 0.56 0.48 0.61 0.36 0.58 0.36
P3 1 0.51 0.51 0.58 0.64 0.66 0.76 0.38 0.51
P3 2 0.38 0.53 0.51 0.58 0.46 0.38 0.25 0.20
P3 3 0.51 0.48 0.76 0.71 0.61 0.79 0.36 0.43
P4 1 0.36 0.46 0.58 0.61 0.48 0.51 0.41 0.43
P4 2 0.23 0.41 0.53 0.61 0.53 0.51 0.43 0.53
P4 3 0.33 0.41 0.56 0.58 0.51 0.53 0.46 0.36
P5 1 0.15 0.51 0.69 0.69 0.41 0.56 0.36 0.43
P5 2 0.41 0.46 0.69 0.61 0.61 0.58 0.41 0.46
P5 3 0.33 0.56 0.66 0.53 0.61 0.64 0.30 0.38
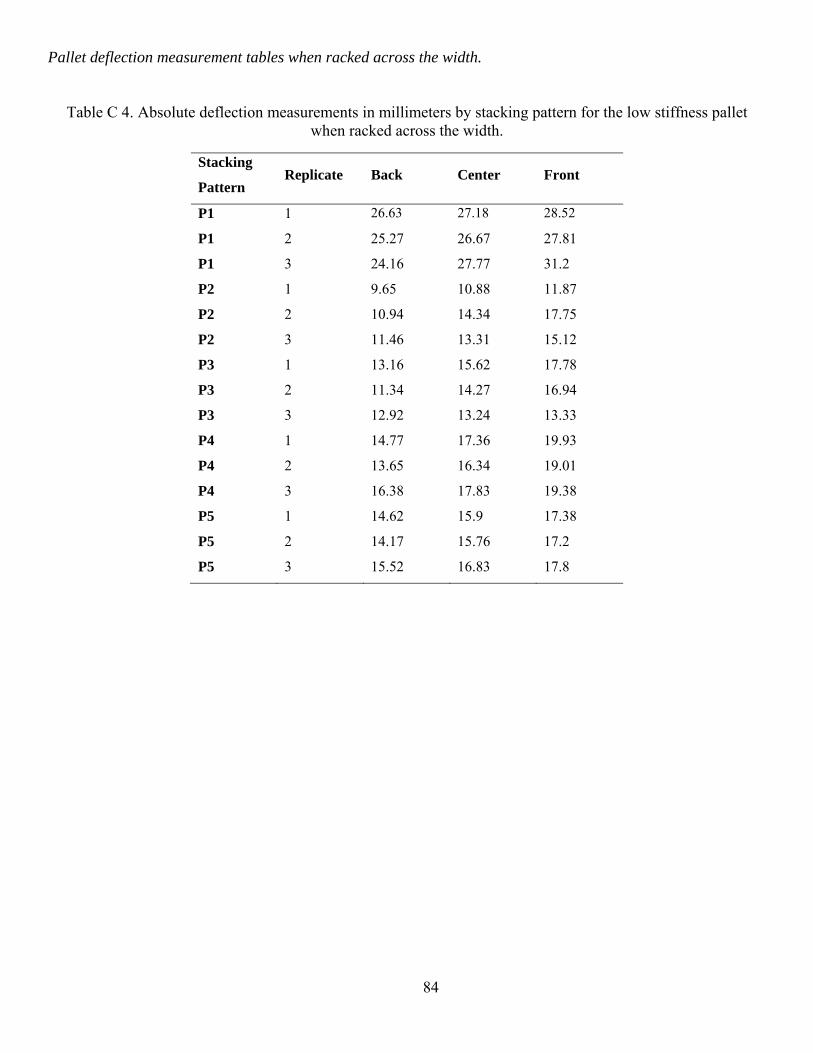
84
Pallet deflection measurement tables when racked across the width.
Table C 4. Absolute deflection measurements in millimeters by stacking pattern for the low stiffness pallet when racked across the width.
Stacking
Pattern Replicate Back Center Front
P1 1 26.63 27.18 28.52
P1 2 25.27 26.67 27.81
P1 3 24.16 27.77 31.2
P2 1 9.65 10.88 11.87
P2 2 10.94 14.34 17.75
P2 3 11.46 13.31 15.12
P3 1 13.16 15.62 17.78
P3 2 11.34 14.27 16.94
P3 3 12.92 13.24 13.33
P4 1 14.77 17.36 19.93
P4 2 13.65 16.34 19.01
P4 3 16.38 17.83 19.38
P5 1 14.62 15.9 17.38
P5 2 14.17 15.76 17.2
P5 3 15.52 16.83 17.8
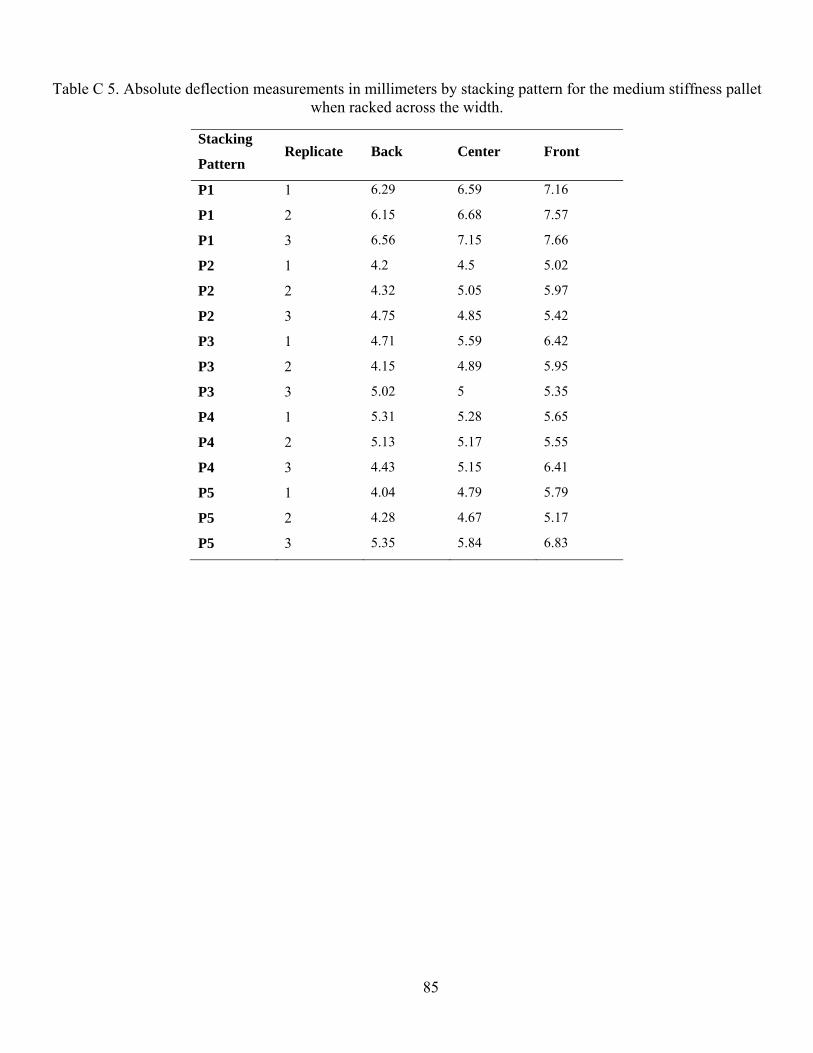
85
Table C 5. Absolute deflection measurements in millimeters by stacking pattern for the medium stiffness pallet when racked across the width.
Stacking
Pattern Replicate Back Center Front
P1 1 6.29 6.59 7.16
P1 2 6.15 6.68 7.57
P1 3 6.56 7.15 7.66
P2 1 4.2 4.5 5.02
P2 2 4.32 5.05 5.97
P2 3 4.75 4.85 5.42
P3 1 4.71 5.59 6.42
P3 2 4.15 4.89 5.95
P3 3 5.02 5 5.35
P4 1 5.31 5.28 5.65
P4 2 5.13 5.17 5.55
P4 3 4.43 5.15 6.41
P5 1 4.04 4.79 5.79
P5 2 4.28 4.67 5.17
P5 3 5.35 5.84 6.83

86
Table C 6. Absolute deflection measurements in millimeters by stacking pattern for the high stiffness pallet when racked across the width.
Stacking
Pattern Replicate Back Center Front
P1 1 2.73 3.33 3.67
P1 2 1.26 2.66 2.28
P1 3 1.85 2.29 2.51
P2 1 2.43 2.55 2.55
P2 2 1.92 2.53 2.63
P2 3 1.96 2.26 2.2
P3 1 2.37 2.49 2.44
P3 2 1.54 2.4 2.81
P3 3 1.39 1.79 1.99
P4 1 2.11 2.47 2.71
P4 2 1.75 2.08 2.5
P4 3 1.84 1.85 1.74
P5 1 2.53 2.57 2.43
P5 2 2.01 1.83 1.49
P5 3 1.75 1.9 1.97

87
Pallet deflection measurement tables when racked across the length.
Table C 7. Absolute deflection measurements in millimeters by stacking pattern for the low stiffness pallet when racked across the length.
Stacking
Pattern Replicate Back Center Front
P1 1 2.89 3.52 2.68
P1 2 2.86 4.11 2.99
P1 3 2.87 4.47 3.32
P2 1 2.65 3.64 2.84
P2 2 2.81 3.66 2.92
P2 3 2.93 3.95 3.05
P3 1 2.55 3.44 2.88
P3 2 2.90 3.80 2.82
P3 3 3.35 3.92 3.06
P4 1 2.62 3.50 2.73
P4 2 2.82 3.49 2.61
P4 3 3.00 4.16 3.02
P5 1 2.48 3.60 2.61
P5 2 3.41 4.03 3.33
P5 3 2.79 3.83 3.14
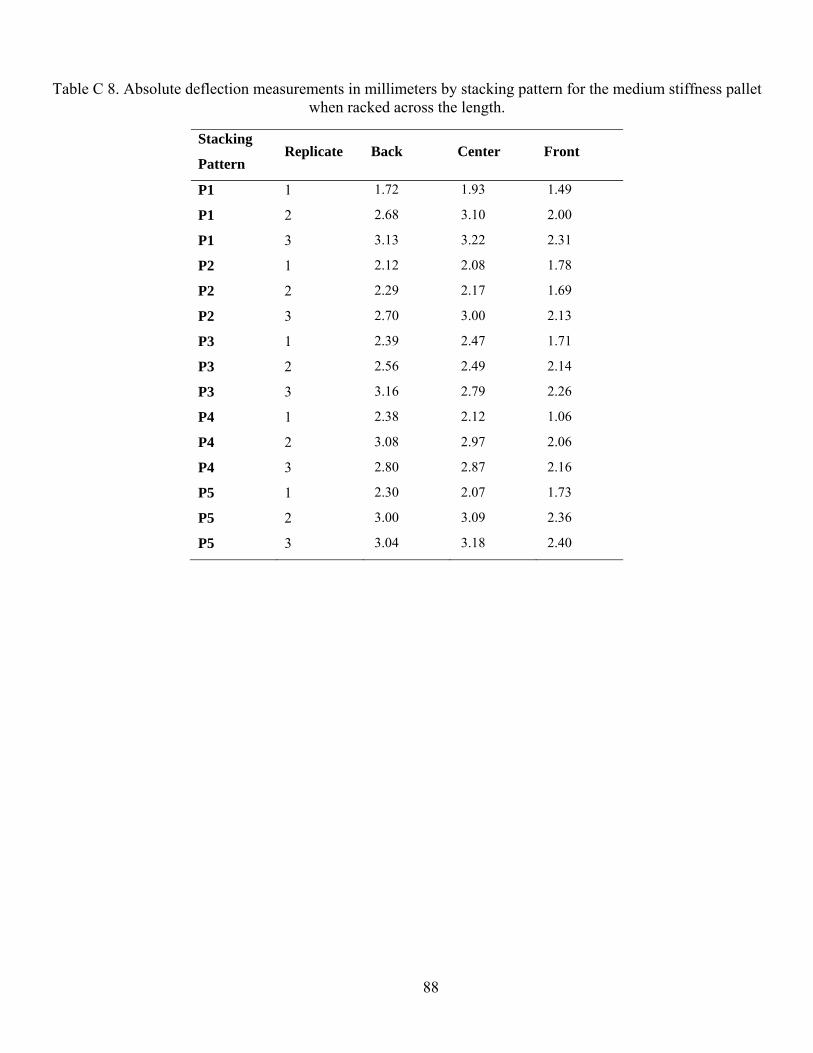
88
Table C 8. Absolute deflection measurements in millimeters by stacking pattern for the medium stiffness pallet when racked across the length.
Stacking
Pattern Replicate Back Center Front
P1 1 1.72 1.93 1.49
P1 2 2.68 3.10 2.00
P1 3 3.13 3.22 2.31
P2 1 2.12 2.08 1.78
P2 2 2.29 2.17 1.69
P2 3 2.70 3.00 2.13
P3 1 2.39 2.47 1.71
P3 2 2.56 2.49 2.14
P3 3 3.16 2.79 2.26
P4 1 2.38 2.12 1.06
P4 2 3.08 2.97 2.06
P4 3 2.80 2.87 2.16
P5 1 2.30 2.07 1.73
P5 2 3.00 3.09 2.36
P5 3 3.04 3.18 2.40
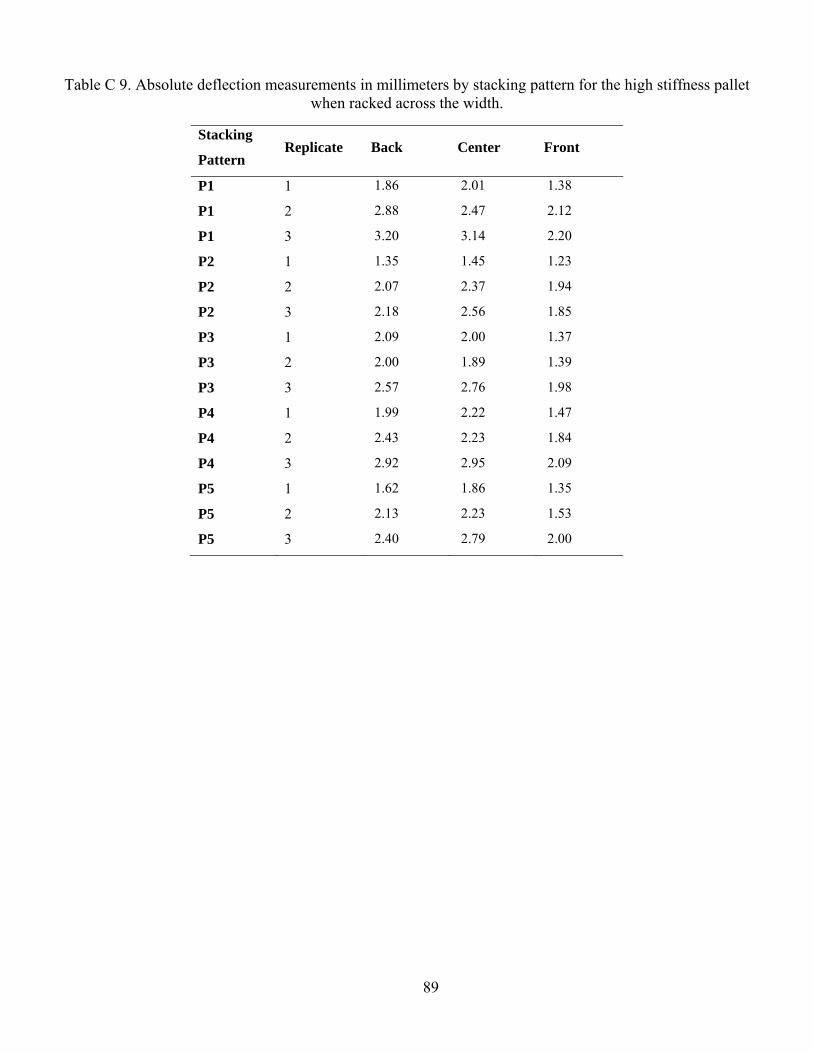
89
Table C 9. Absolute deflection measurements in millimeters by stacking pattern for the high stiffness pallet when racked across the width.
Stacking
Pattern Replicate Back Center Front
P1 1 1.86 2.01 1.38
P1 2 2.88 2.47 2.12
P1 3 3.20 3.14 2.20
P2 1 1.35 1.45 1.23
P2 2 2.07 2.37 1.94
P2 3 2.18 2.56 1.85
P3 1 2.09 2.00 1.37
P3 2 2.00 1.89 1.39
P3 3 2.57 2.76 1.98
P4 1 1.99 2.22 1.47
P4 2 2.43 2.23 1.84
P4 3 2.92 2.95 2.09
P5 1 1.62 1.86 1.35
P5 2 2.13 2.23 1.53
P5 3 2.40 2.79 2.00
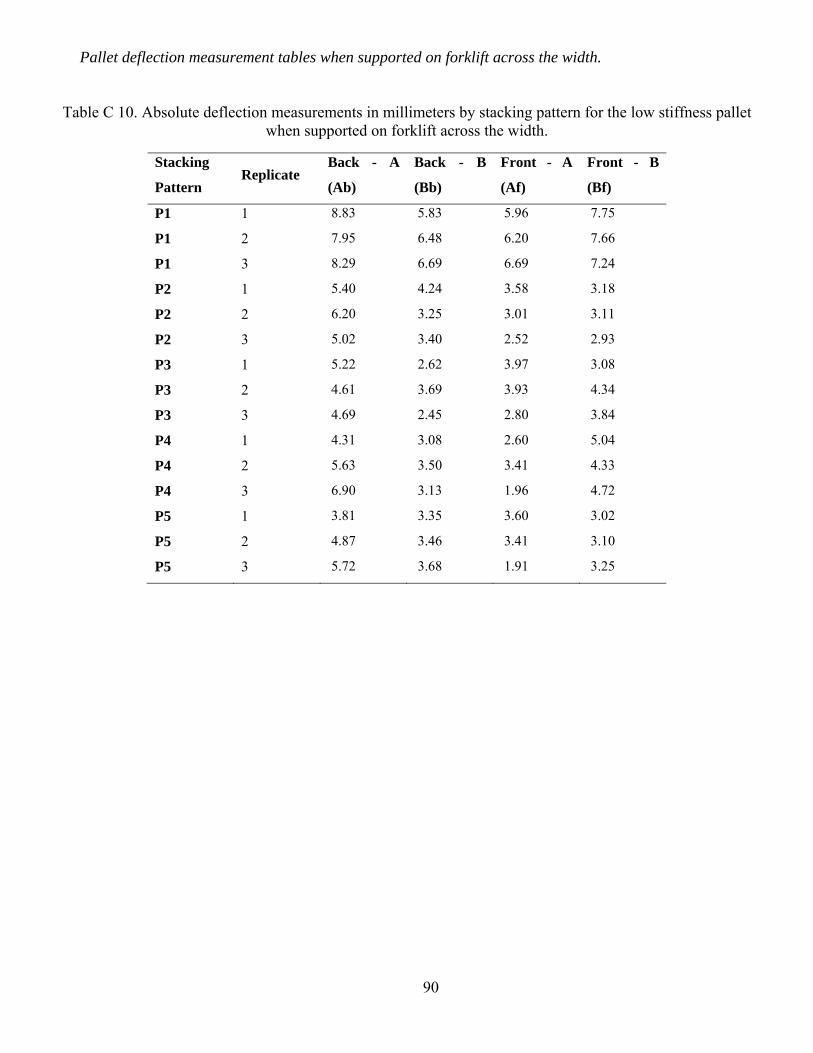
90
Pallet deflection measurement tables when supported on forklift across the width.
Table C 10. Absolute deflection measurements in millimeters by stacking pattern for the low stiffness pallet when supported on forklift across the width.
Stacking
Pattern Replicate
Back - A
(Ab)
Back - B
(Bb)
Front - A
(Af)
Front - B
(Bf)
P1 1 8.83 5.83 5.96 7.75
P1 2 7.95 6.48 6.20 7.66
P1 3 8.29 6.69 6.69 7.24
P2 1 5.40 4.24 3.58 3.18
P2 2 6.20 3.25 3.01 3.11
P2 3 5.02 3.40 2.52 2.93
P3 1 5.22 2.62 3.97 3.08
P3 2 4.61 3.69 3.93 4.34
P3 3 4.69 2.45 2.80 3.84
P4 1 4.31 3.08 2.60 5.04
P4 2 5.63 3.50 3.41 4.33
P4 3 6.90 3.13 1.96 4.72
P5 1 3.81 3.35 3.60 3.02
P5 2 4.87 3.46 3.41 3.10
P5 3 5.72 3.68 1.91 3.25

91
Table C 11. Absolute deflection measurements in millimeters by stacking pattern for the medium stiffness pallet when supported on forklift across the width.
Stacking
Pattern Replicate
Back - A
(Ab)
Back - B
(Bb)
Front - A
(Af)
Front - B
(Bf)
P1 1 1.62 1.91 1.09 1.40
P1 2 2.08 2.17 1.52 1.38
P1 3 2.43 3.28 2.21 2.53
P2 1 1.85 2.00 0.29 1.88
P2 2 3.45 1.52 1.41 1.82
P2 3 2.34 1.63 1.94 2.05
P3 1 3.42 1.63 1.18 1.06
P3 2 3.61 1.17 1.24 2.56
P3 3 1.45 1.82 1.82 1.93
P4 1 3.45 2.32 2.33 2.41
P4 2 2.16 2.84 1.83 2.42
P4 3 3.09 2.08 1.48 1.73
P5 1 2.68 2.33 1.77 1.06
P5 2 3.04 1.89 0.82 1.55
P5 3 3.56 1.42 1.18 2.00

92
Table C 12. Absolute deflection measurements in millimeters by stacking pattern for the high stiffness pallet when supported on forklift across the width.
Stacking
Pattern Replicate
Back - A
(Ab)
Back - B
(Bb)
Front - A
(Af)
Front - B
(Bf)
P1 1 0.84 2.33 0.78 0.58
P1 2 0.48 0.63 0.76 0.77
P1 3 0.82 1.24 0.76 0.07
P2 1 0.50 0.50 0.60 0.05
P2 2 0.27 0.29 0.43 0.67
P2 3 0.30 0.67 0.60 0.23
P3 1 0.09 0.37 1.50 0.59
P3 2 0.13 0.81 0.51 0.53
P3 3 0.56 0.65 0.83 0.13
P4 1 0.72 0.84 0.56 0.21
P4 2 1.60 1.07 0.47 0.67
P4 3 1.75 0.71 0.80 0.65
P5 1 0.67 0.57 0.79 0.24
P5 2 0.81 0.91 0.19 0.57
P5 3 0.68 0.03 0.65 0.93