
Investigation of Genetic Variation in Scavenger Receptor Class B, Member 1 (SCARB1) and Association...
9
Investigation of Genetic Variation in Scavenger Receptor Class B, Member 1 (SCARB1) and Association with Serum Carotenoids Gareth J. McKay, BSc, PhD, 1 Edward Loane, PhD, MRCOphth, 2 John M. Nolan, BSc, PhD, 3 Christopher C. Patterson, BSc, PhD, 1 Kristin J. Meyers, MPH, PhD, 4 Julie A. Mares, MSPH, PhD, 4 Ekaterina Yonova-Doing, BSc, 5 Christopher J. Hammond, MD, FRCOphth, 5 Stephen Beatty, MD, FRCOphth, 3 Giuliana Silvestri, MD, FRCOphth 6 Objective: To investigate association of scavenger receptor class B, member 1 (SCARB1) genetic variants with serum carotenoid levels of lutein (L) and zeaxanthin (Z) and macular pigment optical density (MPOD). Design: A cross-sectional study of healthy adults aged 20 to 70. Participants: We recruited 302 participants after local advertisement. Methods: We measured MPOD by customized heterochromatic flicker photometry. Fasting blood samples were taken for serum L and Z measurement by high-performance liquid chromatography and lipoprotein analysis by spectrophotometric assay. Forty-seven single nucleotide polymorphisms (SNPs) across SCARB1 were genotyped using Sequenom technology. Association analyses were performed using PLINK to compare allele and haplotype means, with adjustment for potential confounding and correction for multiple comparisons by permutation testing. Replication analysis was performed in the TwinsUK and Carotenoids in Age-Related Eye Disease Study (CAREDS) cohorts. Main Outcome Measures: Odds ratios for MPOD area, serum L and Z concentrations associated with genetic variations in SCARB1 and interactions between SCARB1 and gender. Results: After multiple regression analysis with adjustment for age, body mass index, gender, high-density lipoprotein cholesterol, low-density lipoprotein cholesterol, triglycerides, smoking, and dietary L and Z levels, 5 SNPs were significantly associated with serum L concentration and 1 SNP with MPOD (P0.01). Only the association between rs11057841 and serum L withstood correction for multiple comparisons by permutation testing (P0.01) and replicated in the TwinsUK cohort (P 0.014). Independent replication was also observed in the CAREDS cohort with rs10846744 (P 210 4 ), an SNP in high linkage disequilibrium with rs11057841 (r 2 0.93). No interactions by gender were found. Haplotype analysis revealed no stronger association than obtained with single SNP analyses. Conclusions: Our study has identified association between rs11057841 and serum L concentration (24% increase per T allele) in healthy subjects, independent of potential confounding factors. Our data supports further evaluation of the role for SCARB1 in the transport of macular pigment and the possible modulation of age-related macular degeneration risk through combating the effects of oxidative stress within the retina. Financial Disclosure(s): Proprietary or commercial disclosures may be found after the references. Ophthalmology 2013;xx:xxx © 2013 by the American Academy of Ophthalmology. Age-related macular degeneration (AMD; MIM# 603075) is the most common form of visual impairment among older people of European descent, 1 accounting for more than half of all new cases of registered blindness. 2 The socioeco- nomic burden associated with AMD continues to challenge our aging society with almost 30% of those aged 75 years showing early signs of disease. 3 Although the specifics of the etiology remain largely unresolved, AMD is a common multifactorial disorder of complex etiology with multiple genetic, environmental, and lifestyle risk factors. By defi- nition, AMD specifically affects the macular region of the retina, an area responsible for detailed central vision. Macular pigment (MP) accumulates in the central retina and is composed of the carotenoids, lutein (L), zeaxanthin (Z) and meso-Z, which give the macula its characteristic yellow color. In humans, L and Z are not synthesized de novo and are of dietary origin (mostly fruit and vegetables), whereas meso-Z has been reported to be predominantly nondietary and formed after conversion from L in the ret- ina, 4 although the exact process of conversion from L to 1 © 2013 by the American Academy of Ophthalmology ISSN 0161-6420/13/$–see front matter Published by Elsevier Inc. http://dx.doi.org/10.1016/j.ophtha.2013.01.030
Transcript of Investigation of Genetic Variation in Scavenger Receptor Class B, Member 1 (SCARB1) and Association...
Investigation of Genetic Variation inScavenger Receptor Class B, Member 1(SCARB1) and Association withSerum Carotenoids
Gareth J. McKay, BSc, PhD,1 Edward Loane, PhD, MRCOphth,2 John M. Nolan, BSc, PhD,3
Christopher C. Patterson, BSc, PhD,1 Kristin J. Meyers, MPH, PhD,4 Julie A. Mares, MSPH, PhD,4
Ekaterina Yonova-Doing, BSc,5 Christopher J. Hammond, MD, FRCOphth,5 Stephen Beatty, MD, FRCOphth,3
Giuliana Silvestri, MD, FRCOphth6
Objective: To investigate association of scavenger receptor class B, member 1 (SCARB1) genetic variantswith serum carotenoid levels of lutein (L) and zeaxanthin (Z) and macular pigment optical density (MPOD).
Design: A cross-sectional study of healthy adults aged 20 to 70.Participants: We recruited 302 participants after local advertisement.Methods: We measured MPOD by customized heterochromatic flicker photometry. Fasting blood samples
were taken for serum L and Z measurement by high-performance liquid chromatography and lipoprotein analysisby spectrophotometric assay. Forty-seven single nucleotide polymorphisms (SNPs) across SCARB1 weregenotyped using Sequenom technology. Association analyses were performed using PLINK to compare alleleand haplotype means, with adjustment for potential confounding and correction for multiple comparisons bypermutation testing. Replication analysis was performed in the TwinsUK and Carotenoids in Age-Related EyeDisease Study (CAREDS) cohorts.
Main Outcome Measures: Odds ratios for MPOD area, serum L and Z concentrations associated withgenetic variations in SCARB1 and interactions between SCARB1 and gender.
Results: After multiple regression analysis with adjustment for age, body mass index, gender, high-densitylipoprotein cholesterol, low-density lipoprotein cholesterol, triglycerides, smoking, and dietary L and Z levels, 5SNPs were significantly associated with serum L concentration and 1 SNP with MPOD (P�0.01). Only theassociation between rs11057841 and serum L withstood correction for multiple comparisons by permutationtesting (P�0.01) and replicated in the TwinsUK cohort (P � 0.014). Independent replication was also observedin the CAREDS cohort with rs10846744 (P � 2�10�4), an SNP in high linkage disequilibrium with rs11057841(r2 � 0.93). No interactions by gender were found. Haplotype analysis revealed no stronger association thanobtained with single SNP analyses.
Conclusions: Our study has identified association between rs11057841 and serum L concentration (24%increase per T allele) in healthy subjects, independent of potential confounding factors. Our data supports furtherevaluation of the role for SCARB1 in the transport of macular pigment and the possible modulation of age-relatedmacular degeneration risk through combating the effects of oxidative stress within the retina.
Financial Disclosure(s): Proprietary or commercial disclosures may be found after the references.Ophthalmology 2013;xx:xxx © 2013 by the American Academy of Ophthalmology.
nr
a(ynwn
Age-related macular degeneration (AMD; MIM# 603075) isthe most common form of visual impairment among olderpeople of European descent,1 accounting for more than halfof all new cases of registered blindness.2 The socioeco-nomic burden associated with AMD continues to challengeour aging society with almost 30% of those aged �75 yearsshowing early signs of disease.3 Although the specifics ofthe etiology remain largely unresolved, AMD is a commonmultifactorial disorder of complex etiology with multiple
genetic, environmental, and lifestyle risk factors. By defi- i© 2013 by the American Academy of OphthalmologyPublished by Elsevier Inc.
ition, AMD specifically affects the macular region of theetina, an area responsible for detailed central vision.
Macular pigment (MP) accumulates in the central retinand is composed of the carotenoids, lutein (L), zeaxanthinZ) and meso-Z, which give the macula its characteristicellow color. In humans, L and Z are not synthesized deovo and are of dietary origin (mostly fruit and vegetables),hereas meso-Z has been reported to be predominantlyondietary and formed after conversion from L in the ret-
na,4 although the exact process of conversion from L to1ISSN 0161-6420/13/$–see front matterhttp://dx.doi.org/10.1016/j.ophtha.2013.01.030

rApifib(tdcsp
F
DsGqs
M
WhvwlmMotws
vmrcainwWttee(bScettmptit
Ophthalmology Volume xx, Number x, Month 2013
meso-Z has still to be elucidated.5 Dietary L and Z areabsorbed with fats in the gut and are transported to the liver,whereupon they form carotenoid–lipoprotein complexesthat facilitate their transport through the vascular system.6
Macular pigment confers powerful antioxidant protectionand also filters actinic short wavelength, blue light, limitingthe (photo-)oxidative damage to retinal cells.7 These prop-erties of MP are believed to limit the development and/orprogression of AMD.8 Although MP is dietary derived, itsconcentration at the macula is, in part, determined by ge-netic factors with heritability estimated at 67% to 85% in across-sectional study of individual MP levels.9 More re-cently, longitudinal response to L and Z supplementationhas estimated genetic influence approximating 27%, al-though this may have been influenced by the composition ofthe L supplement used.10
Genetic variation in scavenger receptor class B, member1 (SCARB1) has previously been reported in associationwith AMD, implicating a role for cholesterol and MP me-tabolism in the disease process.11 The gene, located at12q24.31, is a region of interest for AMD originating fromlinkage analysis.12,13 The SCARB1 gene encodes a multili-gand cell-surface receptor that mediates selective choles-terol uptake and efflux.14,15 Reverse cholesterol transport isa major process required for the clearance of excess cho-lesterol from the body and the high-density lipoproteincholesterol (HDLc) pathway genes, LIPC and CETP, havebeen implicated in AMD pathogenesis through large ge-nome-wide association studies.16,17 Other studies have alsoreported common variants in SCARB1 in association withdevelopment of coronary heart disease18 and lipid profi-les,19,20 with several studies providing evidence of a gender-related effect.21–23 Both coronary heart disease and dyslip-idemia have been reported to share common pathogenicpathways with AMD.24,25 In addition, SRB1, the proteinencoded by SCARB1, has also been detected in the retinalpigment epithelium26,27 and in intestine cells where it me-diates cholesterol efflux and xanthophyll uptake.28
In light of the strong evidence implicating cholesterolmetabolism in AMD pathogenesis, coupled with a relativelack of MP in association with a clinically confirmed familyhistory of AMD,29 we sought to evaluate common geneticpolymorphisms within SCARB1 and how they might con-tribute to variation of this putatively protective pigment.
Materials and Methods
ParticipantsThree hundred two subjects were recruited for this study, whichwas carried out in the Macular Pigment Research Group laboratoryat Waterford Institute of Technology, Ireland. Subjects were re-cruited after local advertisement in various media. This study wasapproved by the Research Ethics Committee of Waterford Instituteof Technology, and subjects gave written informed consent beforeparticipation. All experimental procedures adhered to the tenets ofthe Declaration of Helsinki.
Inclusion criteria for participation in this study were the fol-lowing: age between 20 and 70 years, no clinical evidence ofocular pathology, no dietary supplementation with the MP carote-
noids, and visual acuity of �20/40. The following information was2
ecorded for each subject: demographic details, family history ofMD (confirmed in writing by the diagnosing ophthalmologist),ersonal smoking history measured in pack-years, and dietaryntake of L and Z, assessed using a validated 170-item foodrequency questionnaire (FFQ). Examination included visual acu-ty (Snellen and logarithm of the minimum angle of resolution),ody mass index (BMI [calculated as kg/m2]), MP optical densityMPOD) measurement by customized heterochromatic flicker pho-ometry (cHFP) using the Macular Densitometer, nonmydriatic fun-us photography using a NIDEK AFC-210 nonmydriatic auto fundusamera to screen for ocular pathology, and 12-hour fasting bloodamples to quantify serum concentrations of L and Z using high-erformance liquid chromatography and for genotyping.
FQ
ietary intake of L and Z was assessed by a self-administered,emiquantitative FFQ developed by the Scottish Collaborativeroup at the University of Aberdeen, Scotland, UK. This semi-uantitative FFQ, including validation, is described in detail in aeparate study.30
easurement of MPOD
e measured MPOD psychophysically by cHFP, a technique thatas been validated against the absorption spectrum of MP initro.31 The cHFP is based on the fact that MP absorbs short-avelength blue light, with peak absorption occurring at a wave-
ength of 458 nm. The subject is required to make isoluminanceatches between 2 flickering lights, a green light (not absorbed byP) and a blue light (maximally absorbed by MP). The log ratio
f the amount of blue light absorbed centrally, where MP peaks, tohat absorbed at a peripheral retinal locus (the “reference point,”here MPOD is assumed to be zero), gives a measure of the
ubject’s MPOD.In this study, we used the Macular Densitometer (Brown Uni-
ersity, Providence, RI),32 a cHFP instrument that is slightlyodified from a device described previously.32 The subject is
equired to observe a flickering target, alternating in square-waveounterphase between a green light (with a wavelength of 564 nm)nd a blue light (with a wavelength of 460 nm), and to makesoluminance matches between these flickering lights. The lumi-ance of the green and blue lights is varied in a yoked manner,hich avoids a change in the overall luminance of the test target.hen an isoluminant (“null flicker”) match has been made be-
ween these flickering lights, flicker is no longer perceived, andhis is the desired endpoint of the test. Different sized targetsnable measurement of MPOD at 0.25°, 0.5°, 1°, and 1.75° retinalccentricity, relative to a reference point at 7° retinal eccentricitywhere MPOD is assumed to be zero). Targets are presented on alue background test field (wavelength 468 nm) that saturates the-cone pathway. A minimum of 3 null-flicker readings, with aoefficient of variance �10%, were recorded for each subject atach of the test loci (0.25°, 0.5°, 1°, 1.75°, and 7° retinal eccen-ricity). Measurement of MPOD at these points of retinal eccen-ricity enabled us to plot the spatial profile of MP across theacula. We then calculated the area of MPOD under the spatial
rofile (MPODArea), using the trapezium rule, which approximateshe area by a series of trapeziums constructed by assuming linear-ty in the relationship between MPOD values and retinal eccen-ricity between adjacent measurement angles:
MPODArea � [0.25 * ((MPOD0.25º � MPOD0.5º) ⁄ 2)� 0.50 * ((MPOD0.5º � MPOD1º) ⁄ 2) � 0.75 * ((MPOD1º
� MPOD1.75º) ⁄ 2) � 5.25 * ((MPOD1.75º � MPOD7º) ⁄ 2)].
awsy
S
Lfmswatfwciar
S
C(Cebvstfd
nir(
easu
McKay et al � SCARB1 Variation and Serum Lutein Concentration
The MPODArea, a weighted average of the MPOD value at thevarious points of retinal eccentricity, should offer improved accu-racy of the quantity of MP across the macula compared with asingle eccentricity measurement alone. We measured MPOD un-der conditions of dimmed light (ambient illuminance: 4 lux, asmeasured with an Iso-Tech ILM 350 Lux Meter; RS Components,Corby, UK) at a viewing distance of 18.5 inches (47 cm).
The major advantage of cHFP over standard HFP instrumentsis that the flicker frequency of each test target is customized foreach individual subject, minimizing variance between consecutivemeasurements and thus increasing the accuracy and ease of use ofthe test. Further information on the technique and advantages ofcHFP has been published previously.33
Blood Sample Collection
A 12-hour fasting blood sample was collected from each subject ina 4-ml Z Serum Sep Clot Activator Vacuette tube (Greiner Bio-One GmbH, Kremsmünster, Austria) at the beginning of the studyvisit. This whole blood sample was immediately refrigerated at2°C to 8°C, before centrifugation at approximately 1800g for 10minutes. Centrifugation was performed within 4 hours of phlebot-omy. After centrifugation, the supernatant serum sample was ali-quoted into 1.5-ml amber (light-sensitive) microcentrifuge tubes(Brand GmbH, Wertheim, Germany) and stored at minus 70°Cbefore analysis.
Serum L and Z Analysis
Serum L and Z were quantified using reverse phase high-performance liquid chromatography. We used an Agilent 1200series LC system (Agilent Technologies Ireland Ltd, Dublin,Ireland), with photodiode array detection at 295 nm (detectionof the internal standard, alpha tocopherol acetate) and 450 nm(detection of L and Z). A 5-�m analytical/preparative 4.6�250mm 201TP specialty reverse phase column (Vydac, Hesperia,CA) was used with an in-line guard column. The mobile phaseconsisted of 97% methanol and 3% tetrahydrofuran, and was
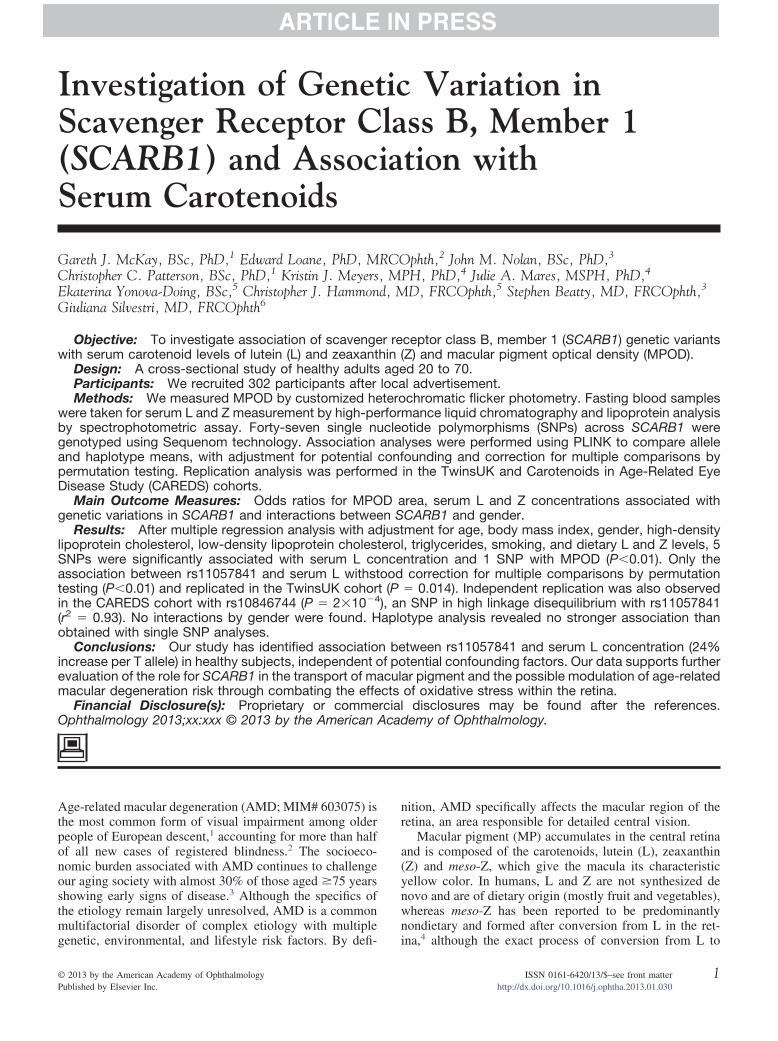
Figure 1. Schematic representation of SCARB1, linkage disequilibrium (m
degassed using an in-line degasser. The flow rate was 1 ml/min, e
nd the total run time was 15 minutes. All carotenoid peaksere integrated and quantified using Agilent Chem Station
oftware. Further detail on the methodology used for this anal-sis is provided in a separate publication.30
erum Lipoprotein Analysis
ipoprotein analysis (HDLc, LDLc, triglycerides [TGs]) was per-ormed using the ACE Clinical Chemistry System (Alfa Wasser-ann, Woerden, The Netherlands) with reagents and consumables
upplied by Randox Laboratories Ltd (Antrim, UK). Analysesere performed on 200-�L serum samples by spectrophotometric
nalysis at 37°C. The analysis module uses a holographic diffrac-ion grating spectrophotometer to measure absorbance at 16 dif-erent wavelengths. Measurements for each assay were recorded atavelengths and times preprogrammed for each test with results
alculated as specified by the test parameters. The protocol usedncluded daily, 2-level quality control assessments and duplicatenalyses on 50 (16.6%) samples, to ensure the precision of theesults.
NP Selection and Genotyping
ommon variants were selected from Phase III, release 2 HapMapavailable at http://www.hapmap.org; accessed October 30, 2009)EPH data (Utah residents with ancestry in northern and west-rn Europe; CEU) using Haploview (available at http://www.roadinstitute.org/haploview; accessed October 30, 2009) toisualize linkage disequilibrium (Fig 1A). Tag SNPs wereelected using multimarker tagging where r2�0.8 (log of oddshreshold 3.0) for all downloaded SNPs with a minor allelerequency �5%, genotype call rate �95%, and no significanteviation from Hardy–Weinberg equilibrium.
Genotyping was performed by MassARRAY iPLEX (Seque-om, San Diego, CA) assays according to the manufacturer’snstructions. Quality filters for exclusion of SNPs included callates below 95% and deviation from Hardy–Weinberg equilibriumP�0.001). DNA samples were excluded if missing genotypes
red by r2; A) and putative haplotype block structure across the gene (B).
xceeded 10%. Other quality control measures included duplicates
3

Ophthalmology Volume xx, Number x, Month 2013
4
SapTbditwcriCSttas
R
G(htHto
ile ra
McKay et al � SCARB1 Variation and Serum Lutein Concentration
on plates, random sample allocation to plates, independent scoringof problematic genotypes by 2 individuals, and resequencing ofselected DNAs to validate genotypes.
Replication Cohorts
Replication of the most significant SNP was undertaken in theTwinsUK adult twin cohort (n � 199) and in the Carotenoids inAge-Related Eye Disease Study (CAREDS; n � 1643), an ancil-lary study of the Women’s Health Initiative Observational Study.34
TwinsUK genotyping had been undertaken previously using anIllumina HumanHap 610 Quad array35 and the CAREDS cohortusing a customized Illumina array. In CAREDS, MPOD wasestimated using cHFP,36 using protocols similar to those imple-mented in the discovery cohort described, and serum samples wereanalyzed for concentrations of trans-L and -Z at Tufts Universityby a reverse phase high-performance liquid chromatography anal-ysis.37 The TwinsUK study used HFP (Maculometer) and animaging method (2-wavelength fundus autofluorescence) to esti-mate MPOD with serum analysis in the same laboratory as thatimplemented in the discovery cohort.10 All procedures conformedto the Declaration of Helsinki and were approved by the institu-tional review board at each university.
Statistical Analysis
Chi-square tests and 1-way analysis of variance tests for trendwere used to investigate differences in qualitative and quantitativetraits, respectively, between genotype subgroups. Analyses wereperformed using an additive genotypic model (SPSS, version 18,
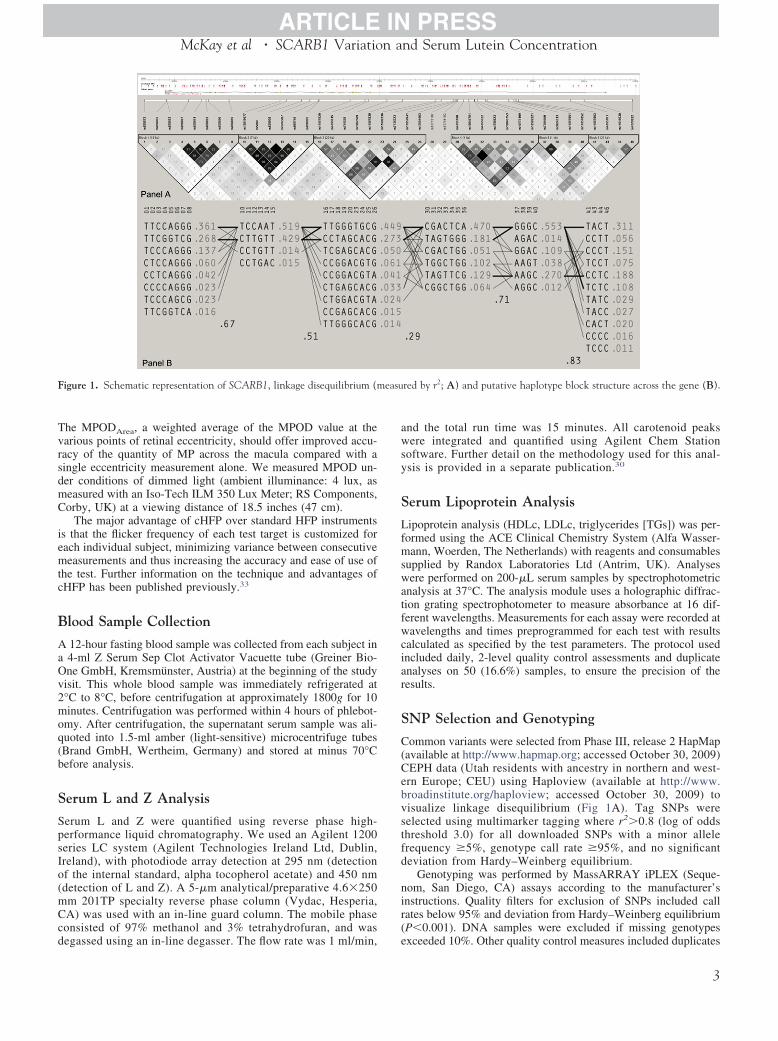
4™™™™™™™™™™™™™™™™™™™™™™™™™™™™™™™™™™™™™™™™™™™Figure 2. Regional association plots are presented for single nucleotide poloptical density (MPOD area), (2) serum zeaxanthin, and (3) serum luteinthe index SNP, rs11057841, which is colored purple (http://csg.sph.umich.e
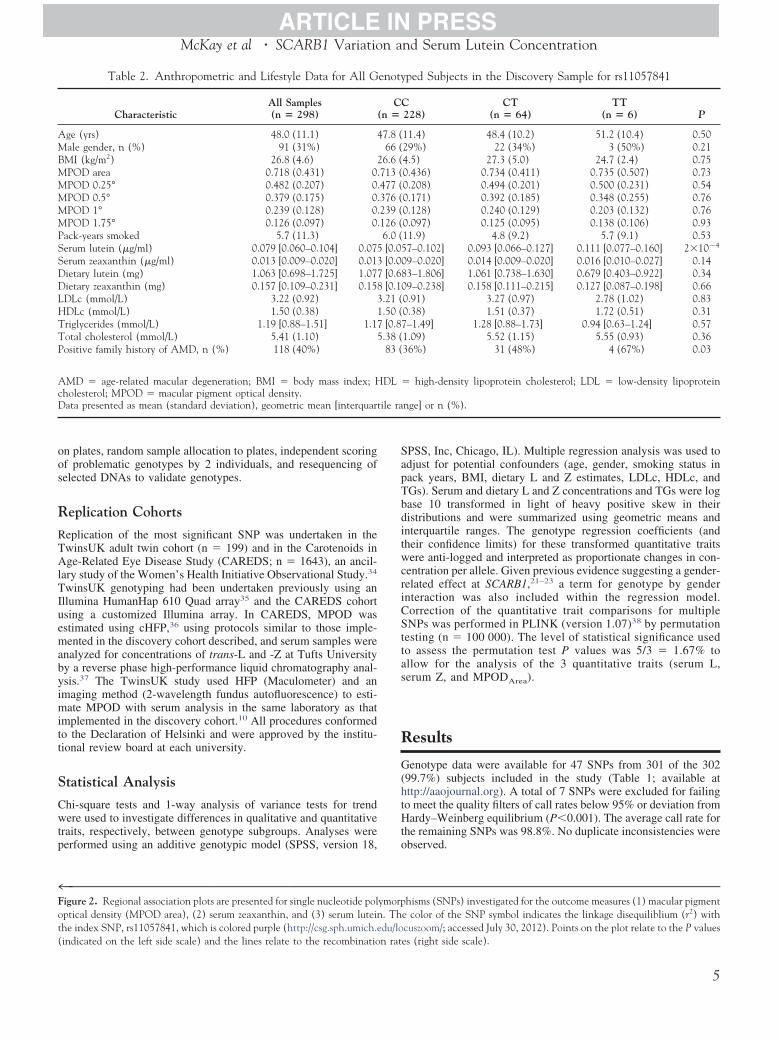
Table 2. Anthropometric and Lifestyle Data for All G
CharacteristicAll Samples(n � 298) (
Age (yrs) 48.0 (11.1) 4Male gender, n (%) 91 (31%)BMI (kg/m2) 26.8 (4.6) 2MPOD area 0.718 (0.431) 0.MPOD 0.25° 0.482 (0.207) 0.MPOD 0.5° 0.379 (0.175) 0.MPOD 1° 0.239 (0.128) 0.MPOD 1.75° 0.126 (0.097) 0.Pack-years smoked 5.7 (11.3)Serum lutein (�g/ml) 0.079 [0.060–0.104] 0.075Serum zeaxanthin (�g/ml) 0.013 [0.009–0.020] 0.013Dietary lutein (mg) 1.063 [0.698–1.725] 1.077Dietary zeaxanthin (mg) 0.157 [0.109–0.231] 0.158LDLc (mmol/L) 3.22 (0.92) 3HDLc (mmol/L) 1.50 (0.38) 1Triglycerides (mmol/L) 1.19 [0.88–1.51] 1.17Total cholesterol (mmol/L) 5.41 (1.10) 5Positive family history of AMD, n (%) 118 (40%)
AMD � age-related macular degeneration; BMI � body mass index; Hcholesterol; MPOD � macular pigment optical density.Data presented as mean (standard deviation), geometric mean [interquart
(indicated on the left side scale) and the lines relate to the recombination rat
PSS, Inc, Chicago, IL). Multiple regression analysis was used todjust for potential confounders (age, gender, smoking status inack years, BMI, dietary L and Z estimates, LDLc, HDLc, andGs). Serum and dietary L and Z concentrations and TGs were logase 10 transformed in light of heavy positive skew in theiristributions and were summarized using geometric means andnterquartile ranges. The genotype regression coefficients (andheir confidence limits) for these transformed quantitative traitsere anti-logged and interpreted as proportionate changes in con-
entration per allele. Given previous evidence suggesting a gender-elated effect at SCARB1,21–23 a term for genotype by gendernteraction was also included within the regression model.orrection of the quantitative trait comparisons for multipleNPs was performed in PLINK (version 1.07)38 by permutation
esting (n � 100 000). The level of statistical significance usedo assess the permutation test P values was 5/3 � 1.67% tollow for the analysis of the 3 quantitative traits (serum L,erum Z, and MPODArea).
esults
enotype data were available for 47 SNPs from 301 of the 30299.7%) subjects included in the study (Table 1; available atttp://aaojournal.org). A total of 7 SNPs were excluded for failingo meet the quality filters of call rates below 95% or deviation fromardy–Weinberg equilibrium (P�0.001). The average call rate for
he remaining SNPs was 98.8%. No duplicate inconsistencies werebserved.
™™™™™™™™™™™™™™™™™™™™™™™™™™™™™™™™™™™™™™™™™™™hisms (SNPs) investigated for the outcome measures (1) macular pigment
e color of the SNP symbol indicates the linkage disequiliblium (r2) withcuszoom/; accessed July 30, 2012). Points on the plot relate to the P values
ped Subjects in the Discovery Sample for rs11057841
228)CT
(n � 64)TT
(n � 6) P
11.4) 48.4 (10.2) 51.2 (10.4) 0.5029%) 22 (34%) 3 (50%) 0.214.5) 27.3 (5.0) 24.7 (2.4) 0.750.436) 0.734 (0.411) 0.735 (0.507) 0.730.208) 0.494 (0.201) 0.500 (0.231) 0.540.171) 0.392 (0.185) 0.348 (0.255) 0.760.128) 0.240 (0.129) 0.203 (0.132) 0.760.097) 0.125 (0.095) 0.138 (0.106) 0.9311.9) 4.8 (9.2) 5.7 (9.1) 0.537–0.102] 0.093 [0.066–0.127] 0.111 [0.077–0.160] 2�10�4
9–0.020] 0.014 [0.009–0.020] 0.016 [0.010–0.027] 0.143–1.806] 1.061 [0.738–1.630] 0.679 [0.403–0.922] 0.349–0.238] 0.158 [0.111–0.215] 0.127 [0.087–0.198] 0.66
0.91) 3.27 (0.97) 2.78 (1.02) 0.830.38) 1.51 (0.37) 1.72 (0.51) 0.31–1.49] 1.28 [0.88–1.73] 0.94 [0.63–1.24] 0.57
1.09) 5.52 (1.15) 5.55 (0.93) 0.3636%) 31 (48%) 4 (67%) 0.03
high-density lipoprotein cholesterol; LDL � low-density lipoprotein
nge] or n (%).
™™™ymorp. Thdu/lo
enoty
CCn �
7.8 (66 (6.6 (713 (477 (376 (239 (126 (6.0 ([0.05[0.00[0.68[0.10.21 (.50 ([0.87.38 (83 (
DL �
es (right side scale).
5

t[rd
ERRturetd(JoP
D
AdrhnsdsvaTrvmarbppaHii
Ophthalmology Volume xx, Number x, Month 2013
In a univariate analysis, 5 SNPs were significantly associatedwith serum L (rs11057841, P � 2�10�4; rs10773109, P � 0.001;rs11057830, P � 0.002; rs11608336, P � 0.001; rs12581963, P �0.003), although only rs11057841 was significant (P�0.0167)after correction for multiple testing by permutation. Multiple re-gression analysis was performed on MPOD area, serum L and Zconcentrations both before and after adjustment for age, BMI,gender, HDLc, LDLc, TGs, smoking status, and dietary L and Zestimates (Table 1; Fig 2; MPOD area, serum Z and serum L). OneSNP (rs11057820, P � 0.008) was associated with MPOD, al-though this did not remain significant after correction for multipletesting. No significant interactions by gender were found. Haplo-type analysis revealed no stronger associations than were obtainedwith the single SNP analysis. No associations were identified forserum Z.
Anthropometric and lifestyle data are presented in relation tors11057841 genotype for all 298 successfully genotyped subjects(Table 2). The mean values � standard deviation (range) for agewas 48.0�11.1 years (range, 21–66) and 69% were female. Therewas no significant difference between rs11057841 genotypes forany of the following variables: age, BMI, cigarette smoking,dietary L intake, dietary Z intake, serum Z concentration, HDLc,LDLc, and TGs (1-way analysis of variance P�0.05). Neither wasthere any significant difference in the male:female ratio betweenthe genotype groups. Significant differences in serum L concen-
Figure 3. Plots of serum lutein showing geometric means and 95% con-fidence intervals against rs11057841 genotype.
Table 3. Genotype Effect Size for rs1
Cohort Allele MAF n
Waterford (Discovery) T 0.13 298TwinsUK (Replication) T 0.09 199CAREDS (Replication)† C 0.15 1640
CI � 95% confidence intervals; MAF � minor allele frequency; SE � stThe effect on serum lutein concentration (log base 10 scale) was estimatedand replication cohorts.*Genotype regression coefficients (and their confidence limits) were anti-per allele.†Genotype data were not available for rs11057841 for the Carotenoids inwas estimated using rs10846744, reported to be in high linkage disequili
(http://www.1000genomes.org/; accessed July 30, 2012). Note the T allele at rs6
ration (increase in geometric mean per T allele by a factor of 1.2495% confidence interval, 1.11–1.39]; P � 2�10�4) and in theatio of positive:negative family history of AMD (P � 0.03) wereetected between the 3 rs11057841 genotypes (Table 2; Fig 3).
valuation of rs11057841 in the Independenteplication Cohortseplication of association for rs11057841 with serum L concen-
ration was undertaken in the TwinsUK adult cohort (n � 199)sing a likelihood ratio chi-square test accounting for familialelatedness with support for the association detected in the discov-ry cohort (Table 3; beta coefficient � 0.252, P � 0.014). Al-hough CAREDS did not genotype rs11057841 directly, there wasata available for rs10846744, a SNP in high LD with rs11057841r2 � 0.93; available at http://www.1000genomes.org/; accesseduly 30, 2012), providing further support to the size and directionf effect observed at this locus (Table 3; beta coefficient � 0.0395,� 2�10�4).
iscussion
ge-related macular degeneration is a common, complexisease; 1 strategy proposed for a reduction in associatedisk includes modification of nutrient intake. Several studiesave shown that an increased intake of the macular carote-oids L and Z through foods rich in these nutrients (e.g.,pinach and egg yolk) tends to reduce the risk of theevelopment and/or progression of late AMD.39,40 Thistudy has investigated the relationship between commonariants in SCARB1, MPOD, and serum concentrations of Lnd Z in 302 healthy subjects aged between 21 and 66 years.he mean MPOD of all genotyped subjects recorded at 0.5°
etinal eccentricity was 0.38�0.17 optical density units, aalue comparable with previous studies that used cHFP toeasure MPOD at this eccentricity.8,29 Genotype data were
vailable on 99.7% of our sample and association ofs11057841 with serum L concentration survived correctiony permutation for multiple testing, showing a 24% increaseer T allele, further supported after replication in the inde-endent TwinsUK and CAREDS studies. Whereas Wang etl41 reported transportation of serum L preferentially onDLc, we found association of rs11057841 and serum L
ndependent of HDLc and other factors such as BMI, smok-ng, gender, LDLc, and TGs.
841 on Serum Lutein Concentration
ficient SE Change Per Allele (CI)* P
094 0.025 1.24 (1.11–1.39) 2 � 10�4
252 0.102 1.79 (1.13–2.83) 0.014040 0.011 1.10 (1.04–1.15) 2 � 10�4
d error.an additive genetic model without adjustment for covariates in discovery
and interpreted as proportionate serum lutein changes in concentration
Related Eye Disease Study (CAREDS) dataset. Effect size and direction(r2 � 0.93) with rs11057841 according to the 1000 Genomes dataset
1057
Coef
0.0.0.
andarfrom
logged
Age-brium
11057841 is in linkage disequilibrium with the C allele at rs10846744.

miovd
tiprvwlpa2i
wrLwirodmoaweiseis
w
R
McKay et al � SCARB1 Variation and Serum Lutein Concentration
Early stage AMD is characterized by hallmark lesions ofcholesterol and lipid-rich drusen and basal linear deposits,which accumulate with age between the retinal pigmentepithelium and the choroid.42,43 Bruch’s membrane formsthe inner margin of the choroid, effectively acting as avessel wall.43 During the atherosclerotic process, lipopro-teins traverse the vascular endothelium and accumulate inthe arterial wall on binding to proteoglycans, culminating indeleterious processes, which include inflammation and neo-vascularization.44 In many respects, these atheroscleroticplaques mimic the accumulation of drusen and basal lami-nar deposits in a manner similar to that observed in earlyAMD. Most studies of early AMD are often predominatedby younger adults and have reported either a protectiveassociation or no association with elevated HDLc levels, incontrast with studies of late-stage AMD, characterized byelderly participants, which have tended to report the oppo-site.45 As such, although HDLc has been widely studied andimplicated in AMD disease etiology, the mechanisms andtiming involved with respect to participant age and diseasestatus remain unresolved.
Previously reported associations of SCARB1 SNP rs5888with AMD implicated a role for cholesterol and antioxidantmetabolism, identifying L in particular, in AMD diseaseetiology.11 Recent identification of the hepatic lipase (LIPC)and cholesterylester transfer protein (CETP) genes16,17 pro-vide further evidence in support of cholesterol metabolismand AMD pathogenesis, particularly given previous associ-ation of these genes with HDLc levels in blood.45–47 Al-though multiple common alleles near CETP and LIPC havebeen independently associated with HDLc levels,45 theyhave also shown modest association in a smaller AMDcohort with less power.16
Alternatively, the associations with SCARB1 variants inthis and other studies might reflect variation in carotenoiduptake into the body and eye. There is evidence that trans-port of carotenoids in the retina27 and intestine28 is a facil-itated process mediated by the scavenger receptor class Btype I. The direct association of rs11057841 genotypes withincreasing T alleles and level of L and Z in the serum areconsistent with this possibility.
Several studies have provided evidence of a gender-related effect at this locus.21–23 In a community-based co-hort of postmenopausal women, SCARB1 polymorphismswere associated with decreased HDLc and elevated TGlevels in an estrogen-dependent manner.21,22 Although themajority of female participants in our study were likely tobe premenopausal, we found no evidence to suggest agender-specific interaction between serum L concentrationor MPOD and SCARB1 SNPs.
Interestingly, analyses originating from the Multi-EthnicStudy of Atherosclerosis has shown association betweenrs10846744 and common carotid intimal-medial arterythickness, a surrogate marker for subclinical atherosclerosis,and increased risk of cardiovascular disease.23 The associ-ation observed in our study between rs11957841 and in-creased serum L concentration is a variant known to sharehigh linkage disequilibrium with rs10846744, a proxy SNPtested in the CAREDS replication study (r2 � 0.93). Mani-
chaikul et al23 suggest that genetic variants within SCARB1ay exert cis or trans regulatory effects, possibly influenc-ng endothelial function or inflammatory pathways. In viewf the common pathways shared between AMD and cardio-ascular disease,24,25 these data implicate SCARB1 in bothisease processes.
Although our study was limited in that participants wereoo young to characterize symptoms associated with AMD,dentification of a positive family history of AMD showed aositive correlation with serum L concentration ands11957841. Although our study has identified commonariants in SCARB1 associated with serum L concentration,e were unable to assess potential effects exerted by rare or
ow frequency variants. Despite copy number variation re-orted at SCARB1 (Database of Genomic Variants, avail-ble at http://projects.tcag.ca/variation/; accessed November2, 2012), its rare observation is unlikely to have a signif-cant impact at a population level.
Given that genetic variation attenuates cholesterol levels,hich may influence drusen formation and modulate AMD
isk, and given the poor correlation observed between serumand Z concentration and MPOD in this study and else-
here,10 further studies on the influence of genetic variantsn SCARB1 on cholesterol transport and AMD are war-anted. Accumulation of MP in the central retina is reliantn a complex process originating from ingested foodstuff,igestion, absorption, and transport in the serum, and ulti-ately capture by and stabilization in the retina.10 Although
ur study examines a key gene implicated in this process,ssessment of additional genetic components of this path-ay should be undertaken and their potential influence
valuated. Our data indicates an important role for SCARB1n serum L concentration, but this seems to be a poorurrogate for MPOD. It would be particularly interesting toxamine the genetic influence of SCARB1 polymorphismsn an elderly population and their respective influences onerum L concentration and associated AMD risk.
Acknowledgments. The authors thank Dr. S.H. Melissa Liew,ho performed the TwinsUK phenotyping.
eferences
1. U.S. Centers for Disease Control and Prevention (CDC).Prevalence of visual impairment and selected eye diseasesamong persons aged � 50 years with and without diabetes-United States, 2002. MMWR Morb Mortal Wkly Rep 2004;53:1069–71.
2. Bunce C, Xing W, Wormald R. Causes of blind and partialsight certifications in England and Wales: April 2007-March2008. Eye (Lond) 2010;24:1692–9.
3. Klein R, Klein B, Linton K. Prevalence of age-relatedmaculopathy: the Beaver Dam Eye study. Ophthalmology1992;99:933–43.
4. Bone RA, Landrum JT, Hime GW, et al. Stereochemistry ofthe human macular carotenoids. Invest Ophthalmol Vis Sci1993;34:2033–40.
5. Thurnham DI, Trémel A, Howard AN. A supplementa-tion study in human subjects with a combination of meso-zeaxanthin, (3R,3=R)-zeaxanthin and (3R,3=R,6=R)-lutein.Br J Nutr 2008;100:1307–14.
6. Parker RS. Absorption, metabolism, and transport of carote-
noids. FASEB J 1996;10:542–51.7

2
2
2
2
2
2
3
3
3
3
3
3
3
3
3
3
4
4
4
Ophthalmology Volume xx, Number x, Month 2013
7. Snodderly DM. Evidence for protection against age-relatedmacular degeneration by carotenoids and antioxidant vita-mins. Am J Clin Nutr 1995;62(suppl):1448S–61S.
8. Beatty S, Murray IJ, Henson DB, et al. Macular pigment andrisk for age-related macular degeneration in subjects from aNorthern European population. Invest Ophthalmol Vis Sci2001;42:439–46.
9. Liew SH, Gilbert CE, Spector TD, et al. Heritability of mac-ular pigment: a twin study. Invest Ophthalmol Vis Sci 2005;46:4430–6.
10. Hammond CJ, Liew SM, Van Kuijk FJ, et al. The heritabilityof macular response to supplemental lutein and zeaxanthin: aclassical twin study. Invest Ophthalmol Vis Sci 2012;53:4963–8.
11. Zerbib J, Seddon JM, Richard F, et al. rs5888 variant ofSCARB1 gene is a possible susceptibility factor for age-related macular degeneration. PLoS One [serial online] 2009;4:e7341. Available at: http://www.plosone.org/article/info%3Adoi%2F10.1371%2Fjournal.pone.0007341. Accessed De-cember 12, 2012.
12. Weeks DE, Conley YP, Mah TS, et al. A full genome scan forage-related maculopathy. Hum Mol Genet 2000;22:1329–49.
13. Schick JH, Iyengar SK, Klein BE, et al. A whole-genomescreen of a quantitative trait of age-related maculopathy insibships from the Beaver Dam Eye Study. Am J Hum Genet2003;72:1412–24.
14. Ji Y, Jian B, Wang N, et al. Scavenger receptor BI promoteshigh density lipoprotein-mediated cellular cholesterol efflux.J Biol Chem 1997;272:20982–5.
15. Acton S, Rigotti A, Landschulz KT, et al. Identification ofscavenger receptor SR-BI as a high density lipoprotein recep-tor. Science 1996;271:518–20.
16. Neale BM, Fagerness J, Reynolds R, et al. Genome-wideassociation study of advanced age-related macular degenera-tion identifies a role of the hepatic lipase gene (LIPC). ProcNatl Acad Sci U S A 2010;107:7395–400.
17. Chen W, Stambolian D, Edwards AO, et al, Complications ofAge-Related Macular Degeneration Prevention Trial (CAPT)Research Group. Genetic variants near TIMP3 and high-density lipoprotein-associated loci influence susceptibility toage-related macular degeneration. Proc Natl Acad Sci U S A2010;107:7401–6.
18. Rodríguez-Esparragón F, Rodríguez-Pérez JC, Hernández-Trujillo Y, et al. Allelic variants of the human scavengerreceptor class B type 1 and paraoxonase 1 on coronary heartdisease: genotype-phenotype correlations. Arterioscler ThrombVasc Biol 2005;25:854–60.
19. Acton S, Osgood D, Donoghue M, et al. Association ofpolymorphisms at the SR-BI gene locus with plasma lipidlevels and body mass index in a white population. ArteriosclerThromb Vasc Biol 1999;19:1734–43.
20. Morabia A, Ross BM, Costanza MC, et al. Population-basedstudy of SR-BI genetic variation and lipid profile. Atheroscle-rosis 2004;175:159–68.
21. McCarthy JJ, Somji A, Weiss LA, et al. Polymorphisms of thescavenger receptor class B member 1 are associated withinsulin resistance with evidence of gene by sex interaction.J Clin Endocrinol Metab 2009;94:1789–96.
22. Chiba-Falek O, Nichols M, Suchindran S, et al. Impact of genevariants on sex-specific regulation of human Scavenger recep-tor class B type 1 (SR-BI) expression in liver and associationwith lipid levels in a population-based study. BMC Med Genet[serial online] 2010;11:9. Available at: http://www.biomedcentral.com/1471–2350/11/9. Accessed December 12, 2012.
23. Manichaikul A, Naj AC, Herrington D, et al. Association of
SCARB1 variants with subclinical atherosclerosis and inci-8
dent cardiovascular disease: the Multi-Ethnic Study ofAtherosclerosis. Arterioscler Thromb Vasc Biol 2012;32:1991–9.
4. Snow KK, Seddon JM. Do age-related macular degenerationand cardiovascular disease share common antecedents? Oph-thalmic Epidemiol 1999;6:125–43.
5. Klein R, Deng Y, Klein BE, et al. Cardiovascular disease, itsrisk factors and treatment, and age-related macular dege-neration: Women’s Health Initiative Sight Exam ancillarystudy. Am J Ophthalmol 2007;143:473–83.
6. Duncan KG, Bailey KR, Kane JP, Schwartz DM. Humanretinal pigment epithelial cells express scavenger receptors BIand BII. Biochem Biophys Res Commun 2002;292:1017–22.
7. During A, Doraiswamy S, Harrison EH. Xanthophylls are preferen-tially taken up compared with beta-carotene by retinal cells via aSRBI-dependent mechanism. J Lipid Res 2008;49:1715–24.
8. Reboul E, Abou L, Mikail C, et al. Lutein transport by Caco-2TC-7 cells occurs partly by a facilitated process involving thescavenger receptor class B type I (SR-BI). Biochem J 2005;387:455–61.
9. Nolan JM, Stack J, O’Donovan O, et al. Risk factors forage-related maculopathy are associated with a relative lack ofmacular pigment. Exp Eye Res 2007;84:61–74.
0. Loane E, McKay GJ, Nolan JM, Beatty S. Apolipoprotein Egenotype is associated with macular pigment optical density.Invest Ophthalmol Vis Sci 2010;51:2636–43.
1. Bone RA, Landrum JT, Cains A. Optical density spectra of themacular pigment in vivo and in vitro. Vision Res 1992;32:105–10.
2. Wooten BR, Hammond BR Jr, Land RI, Snodderly DM. Apractical method for measuring macular pigment optical den-sity. Invest Ophthalmol Vis Sci 1999;40:2481–9.
3. Nolan JM, Stringham JM, Beatty S, Snodderly DM. Spatialprofile of macular pigment and its relationship to foveal ar-chitecture. Invest Ophthalmol Vis Sci 2008;49:2134–42.
4. Women’s Health Initiative Study Group. Design of the Women’sHealth Initiative clinical trial and observational study. ControlClin Trials 1998;19:61–109.
5. Hysi PG, Young TL, Mackey DA, et al. A genome-wideassociation study for myopia and refractive error identifies asusceptibility locus at 15q25. Nat Genet 2010;42:902–5.
6. Mares JA, LaRowe TL, Snodderly DM, et al, CAREDS Mac-ular Pigment Study Group and Investigators. Predictors ofoptical density of lutein and zeaxanthin in retinas of olderwomen in the Carotenoids in Age-Related Eye Disease Study,an ancillary study of the Women’s Health Initiative. Am J ClinNutr 2006;84:1107–22.
7. Yeum KJ, Booth SL, Sadowski JA, et al. Human plasmacarotenoid response to the ingestion of controlled diets high infruits and vegetables. Am J Clin Nutr 1996;64:594–602.
8. Purcell S, Neale B, Todd-Brown K, et al. PLINK: a tool set forwhole-genome association and population-based linkage anal-yses. Am J Hum Genet 2007;81:559–75.
9. Seddon JM, Ajani UA, Sperduto RD, et al, Eye DiseaseCase-Control Study Group. Dietary carotenoids, vitamins A,C, and E, and advanced age-related macular degeneration.JAMA 1994;272:1413–20.
0. Loane E, Kelliher C, Beatty S, Nolan JM. The rationale andevidence base for a protective role of macular pigment inage-related maculopathy. Br J Ophthalmol 2008;92:1163–8.
1. Wang W, Connor SL, Johnson EJ, et al. Effect of dietarylutein and zeaxanthin on plasma carotenoids and their trans-port in lipoproteins in age-related macular degeneration. Am JClin Nutr 2007;85:762–9.
2. Mullins RF, Russell SR, Anderson DH, Hageman GS. Drusenassociated with aging and age-related macular degeneration
contain proteins common to extracellular deposits associated
4
4
4
McKay et al � SCARB1 Variation and Serum Lutein Concentration
with atherosclerosis, elastosis, amyloidosis, and dense depositdisease. FASEB J 2000;14:835–46.
43. Curcio CA, Johnson M, Rudolf M, Huang JD. The oil spillin ageing Bruch membrane. Br J Ophthalmol 2011;95:1638 – 45.
44. Tabas I, Williams KJ, Borén J. Subendothelial lipoproteinretention as the initiating process in atherosclerosis: up-date and therapeutic implications. Circulation 2007;116:
1832– 44.Footnotes and Financial Disclosures
and Stephen Beatty do consultancy work for nutraceutical companies,
iL
Sfw(bacTCNtaI
CGBR
5. Klein R, Cruickshanks KJ, Nash SD, et al. The prevalence ofage-related macular degeneration and associated risk factors.Arch Ophthalmol 2010;128:750–8.
6. Willer CJ, Sanna S, Jackson AU, et al. Newly identified locithat influence lipid concentrations and risk of coronary arterydisease. Nat Genet 2008;40:161–9.
7. Kathiresan S, Willer CJ, Peloso GM, et al. Common variantsat 30 loci contribute to polygenic dyslipidemia. Nat Genet
2009;41:56–65.Originally received: October 8, 2012.Final revision: January 7, 2013.Accepted: January 7, 2013.Available online: ●●●. Manuscript no. 2012-1525.1 Centre for Public Health, Royal Victoria Hospital, Queen’s UniversityBelfast, Belfast, Northern Ireland.2 Ophthalmology Department, Royal Victoria Eye and Ear Hospital, Dub-lin, Ireland.3 Macular Pigment Research Group, Department of Chemical and LifeSciences, Waterford Institute of Technology, Waterford, Ireland.4 Department of Ophthalmology and Visual Sciences, University of Wis-consin, Madison, Wisconsin.5 Department of Twin Research and Genetic Epidemiology, King’s Col-lege London, London, UK.6 Centre for Vision and Vascular Science, Royal Victoria Hospital,Queen’s University Belfast, Belfast, Northern Ireland.
Financial Disclosure(s):The author(s) have made the following disclosure(s): John M. Nolan
n a personal capacity, and as directors of Nutrasight Consultancyimited.
upported in part by Bausch and Lomb, Ireland, and EU Strand 1 researchunding. The TwinsUK authors received funding from the Wellcome Trustith genotyping supported in part by US National Institutes of Health
NIH)/National Eye Institute (NEI) grant 1RO1EY018246 and performedy the NIH Center for Inherited Disease Research. The TwinsUK studylso received support from the National Institute for Health Researchomprehensive Biomedical Research Centre award to Guy’s and St.homas’ National Health Service Foundation Trust partnering with King’sollege London. The CAREDS authors received funding from the NIH,EI [grants EY013018, EY016886], Research to Prevent Blindness, and
he Women’s Health Initiative (WHI), of which CAREDS is ancillary to,nd is supported by contracts from the National Heart, Lung and Bloodnstitute, NIH.
orrespondence:areth McKay, Centre for Public Health, The Queen’s University ofelfast, Institute of Clinical Science, Royal Victoria Hospital, Grosvenor
oad, Belfast BT12 6BJ, Northern Ireland. E-mail: [email protected].9