Macular carotenoids and cognitive function - MIMH...
112
Macular carotenoids and cognitive function Lisa M. Renzi Hammond, Ph.D. Behavioral and Brain Sciences Program Human Biofactors and Vision Sciences Laboratory Department of Psychology The University of Georgia; Athens, GA, USA [email protected]
Transcript of Macular carotenoids and cognitive function - MIMH...
Macular carotenoids and cognitive
function
Lisa M. Renzi Hammond, Ph.D.
Behavioral and Brain Sciences Program
Human Biofactors and Vision Sciences
Laboratory
Department of Psychology
The University of Georgia; Athens, GA, USA

Disclosures
• This presentation has been approved for Category “A”
continuing education for eyecare professionals.
• These slides were developed solely by the speaker.
• Dr. Renzi Hammond has served as a consultant for the
following eyecare businesses:
– Johnson and Johnson Vision Care, Inc.
– Alcon Laboratories
– MacuHealth
– Transitions Optical / Essilor
– Abbott Laboratories

The natural history of vision

Other primates
Pan paniscus, (bonobos) in the DRC
Image: Wildlife
Times

Other primates
Mountain gorilla (Gorilla beringei beringi) Image: African
Wildlife Foundation
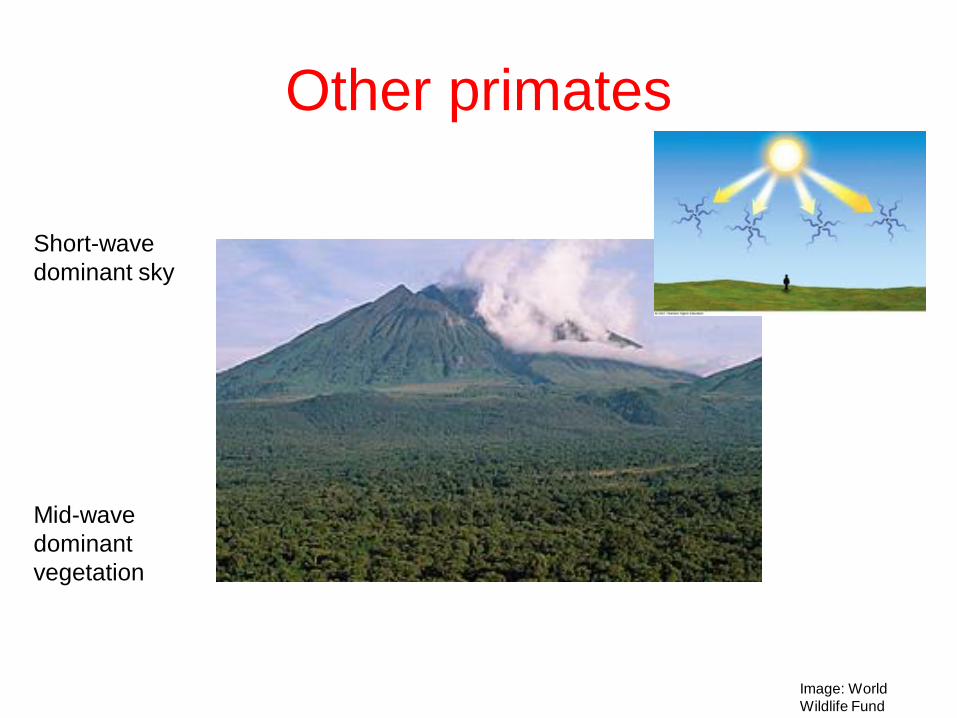
Other primates
Image: World
Wildlife Fund
Short-wave
dominant sky
Mid-wave
dominant
vegetation

Chromatic aberration
Image: Wikipedia
Commons
Extreme ends of the visible
spectrum are more than 1
diopter out of focus
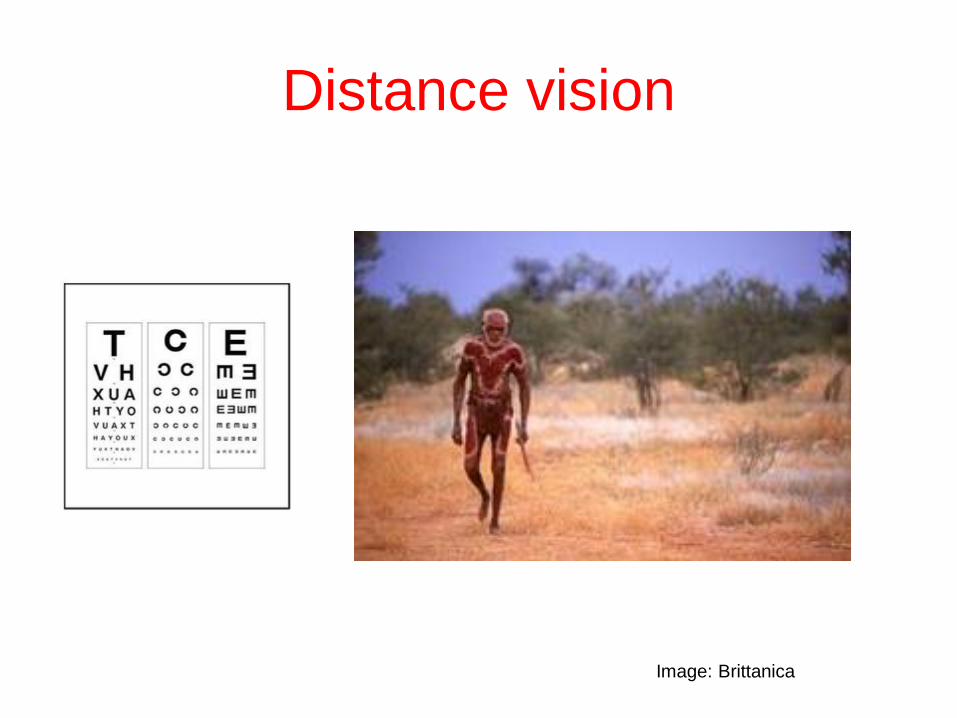
Distance vision
Image: Brittanica

Motion cues
Image: Harvard University
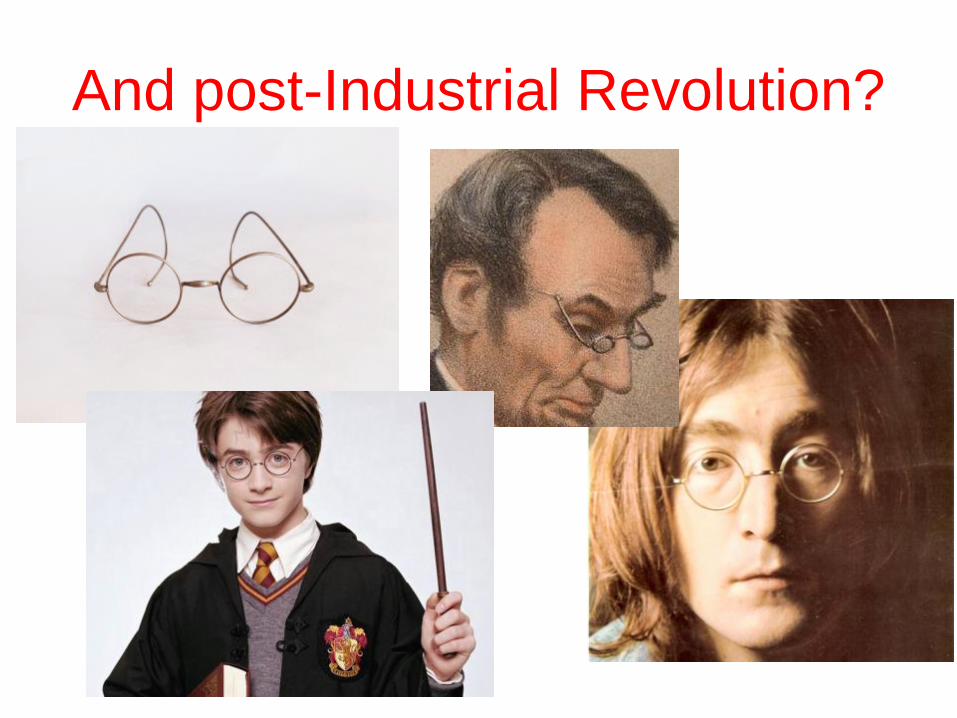
And post-Industrial Revolution?
11

Incidence of Myopia in the USA (12-54 yrs)
The pandemic of myopia
Vitale et al., 2009
Arch. Ophthalmol
0
5
10
15
20
25
30
35
40
45
Myo
pia
(%
)
1908 1971-72 1999-2004
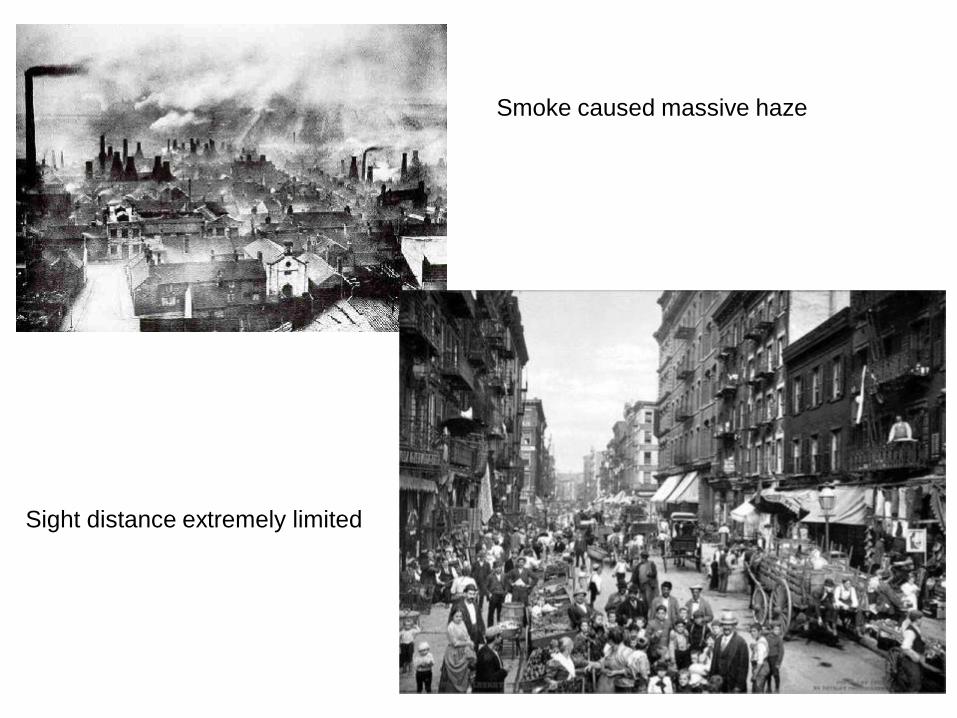
Smoke caused massive haze
Sight distance extremely limited


http://www.aoa.org/ne
ws/inside-
optometry/screen-time-
how-device-use-
affects-childrens-
vision?sso=y

Myopia is, in part, an example
of a mismatch between
lifestyle and biology.
What about other lifestyle factors
and disease?
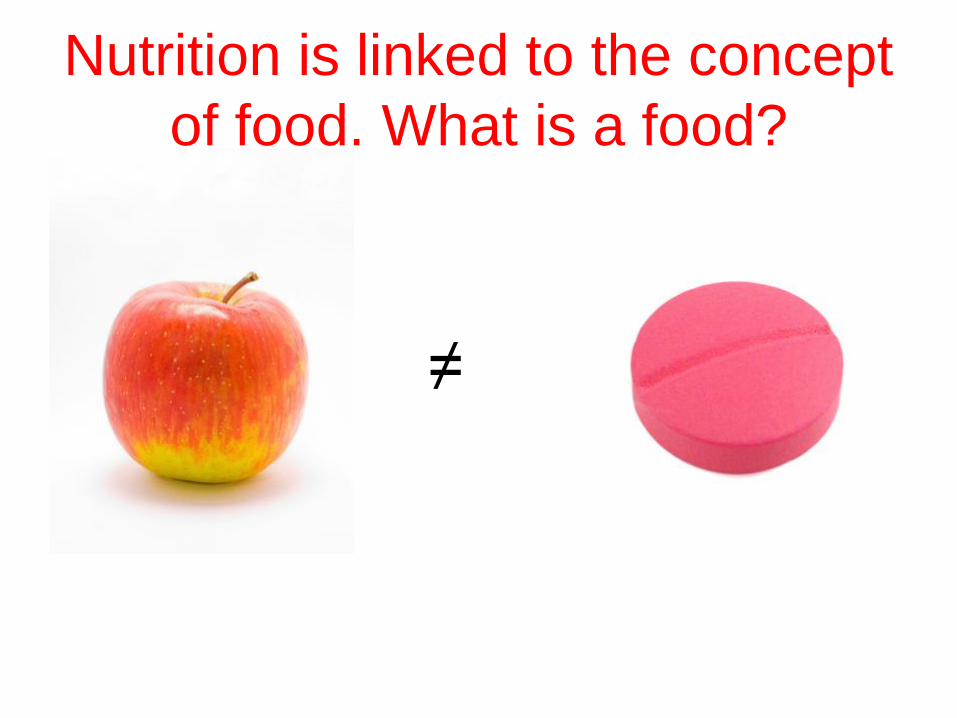
Nutrition is linked to the concept
of food. What is a food?
≠
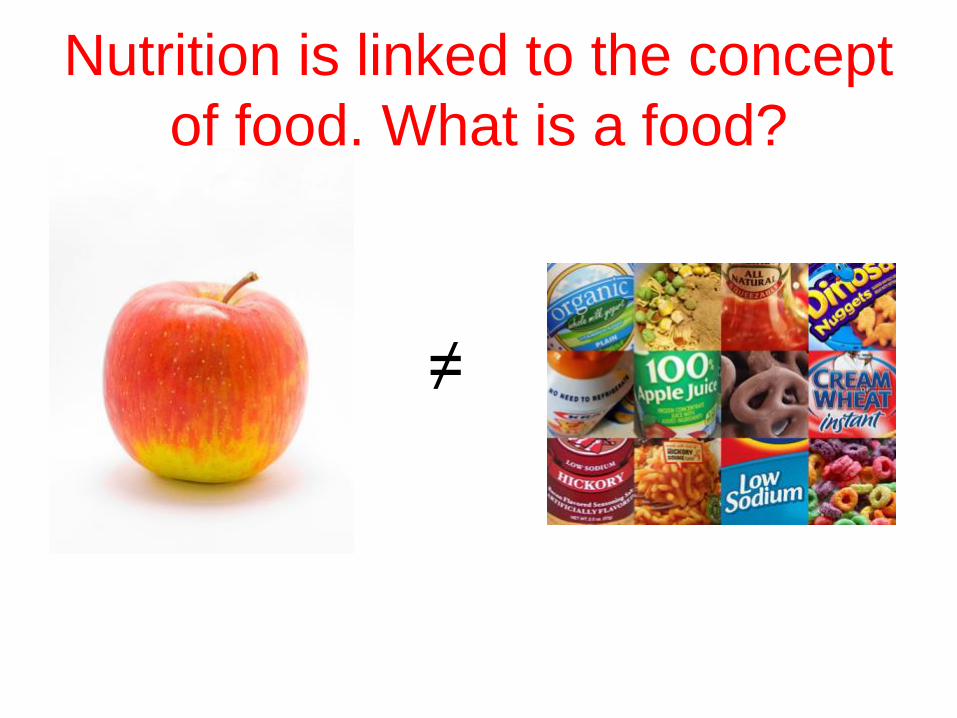
Nutrition is linked to the concept
of food. What is a food?
≠
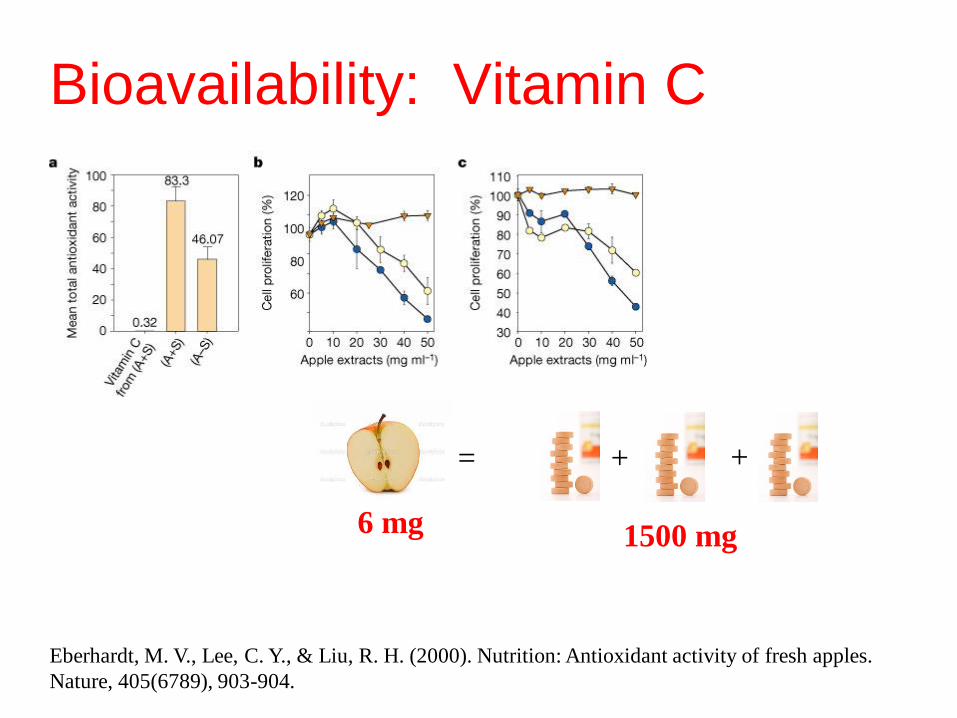
Bioavailability: Vitamin C
Eberhardt, M. V., Lee, C. Y., & Liu, R. H. (2000). Nutrition: Antioxidant activity of fresh apples.
Nature, 405(6789), 903-904.
= + +
6 mg 1500 mg


Bolivian forager-horticulturalists: Tsimane
Diet:
freshwater fish
hunted game
Plantains
Rice
Manioc (yuca)
fruit
Martin et al. Maternal & Child Nutrition 2012;8:404-418
Ideal diet?

United States: The Revis family of North Carolina.

Mexico: The Casales family of Cuernavaca.
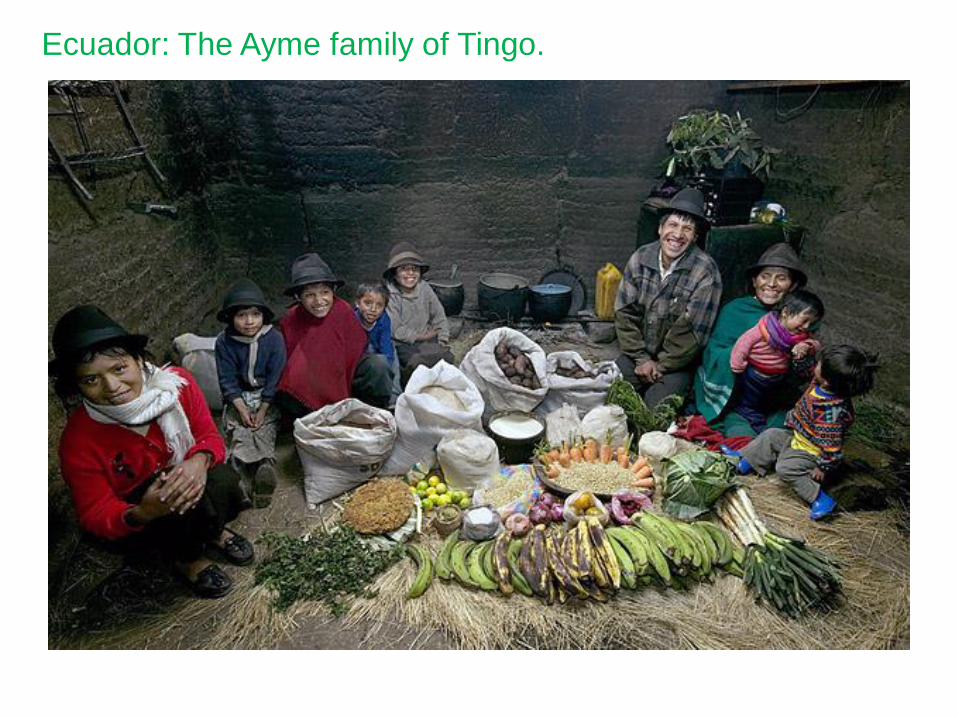
Ecuador: The Ayme family of Tingo.

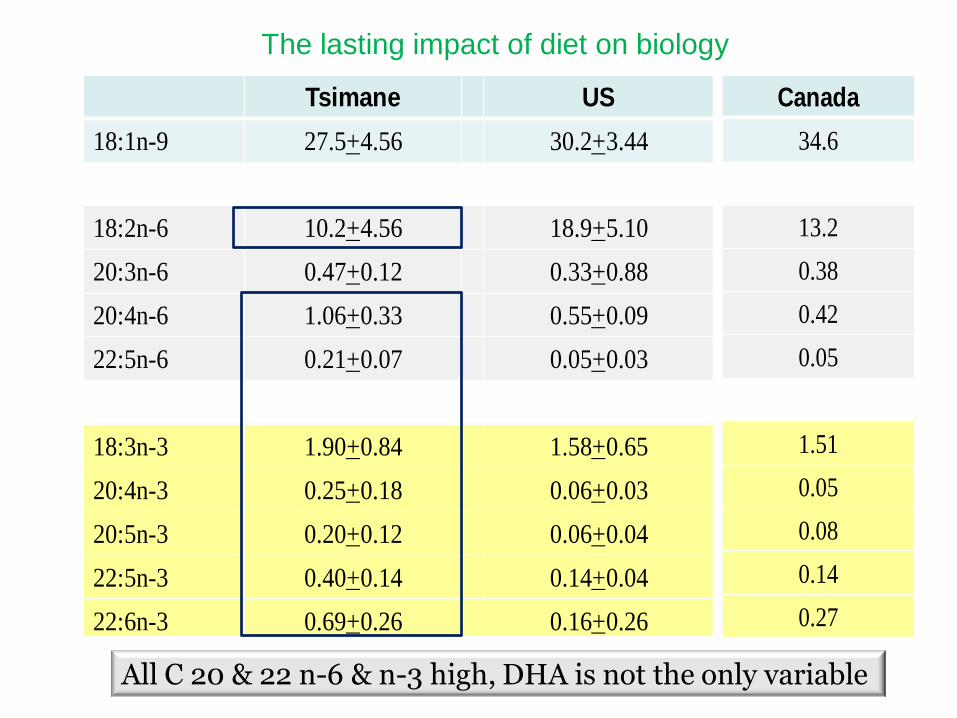
Tsimane US
18:1n-9 27.5+4.56 30.2+3.44
18:2n-6 10.2+4.56 18.9+5.10
20:3n-6 0.47+0.12 0.33+0.88
20:4n-6 1.06+0.33 0.55+0.09
22:5n-6 0.21+0.07 0.05+0.03
18:3n-3 1.90+0.84 1.58+0.65
20:4n-3 0.25+0.18 0.06+0.03
20:5n-3 0.20+0.12 0.06+0.04
22:5n-3 0.40+0.14 0.14+0.04
22:6n-3 0.69+0.26 0.16+0.26
Canada
34.6
13.2
0.38
0.42
0.05
1.51
0.05
0.08
0.14
0.27
All C 20 & 22 n-6 & n-3 high, DHA is not the only variable
The lasting impact of diet on biology

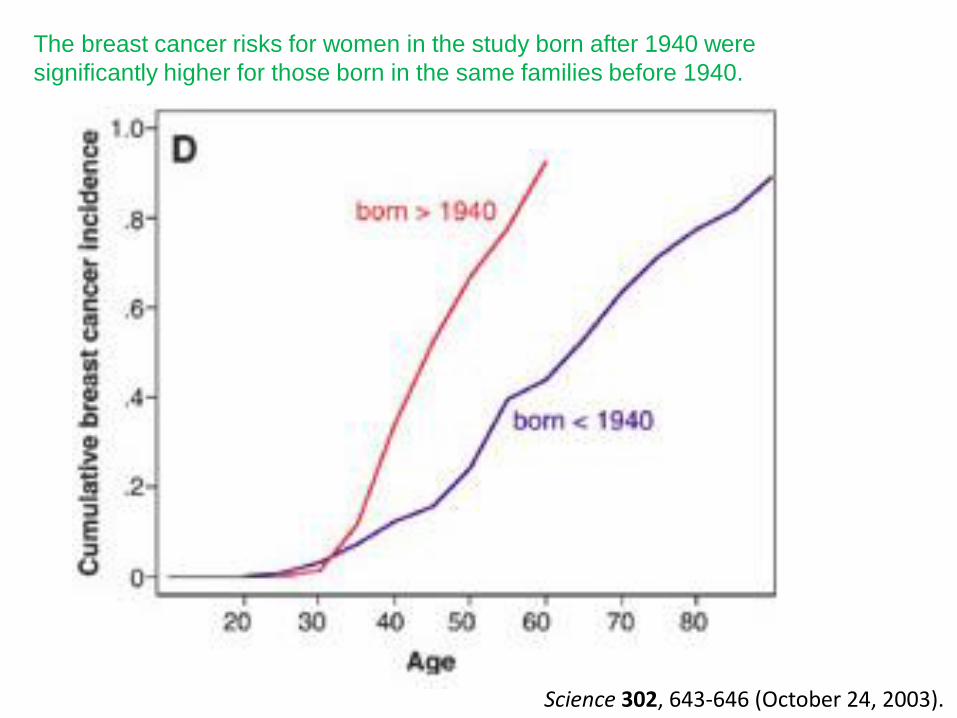
The breast cancer risks for women in the study born after 1940 were
significantly higher for those born in the same families before 1940.
Science 302, 643-646 (October 24, 2003).

Cancer is a disease of the Western Lifestyle

San Francisco
Shanghai
Waterhouse, Muir, et al., 2003
Breast cancer/ 100,000
Breast cancer rates
among Chinese
women who moved
to San Francisco
compared to
Chinese women who
stayed in China
45 55 65 75 Age
Many other diseases seem to
be linked to Western lifestyle,
rather like myopia.
At least we can treat myopia.
What about AMD? Alzheimer’s
disease?

Retina is one of the most metabolically
active tissues in the body
e.g., Cohen & Noell, 1965; Anderson & Satlzman, 1964; Ames, 1992.
Images: Azzopardi & Petkov, 2011; Michalewska et al, 2013

Retina is one of the most neurologically
dense tissues in the body
Optic nerve: 1,200,000 fibers.
Next most dense cranial nerve: 140,000 fibers (sensory root of trigeminal nerve)
2500 mm2 area, 120 microns thick 148.2 million receptors and ganglia
Image © Leung and Snodderly, 2006
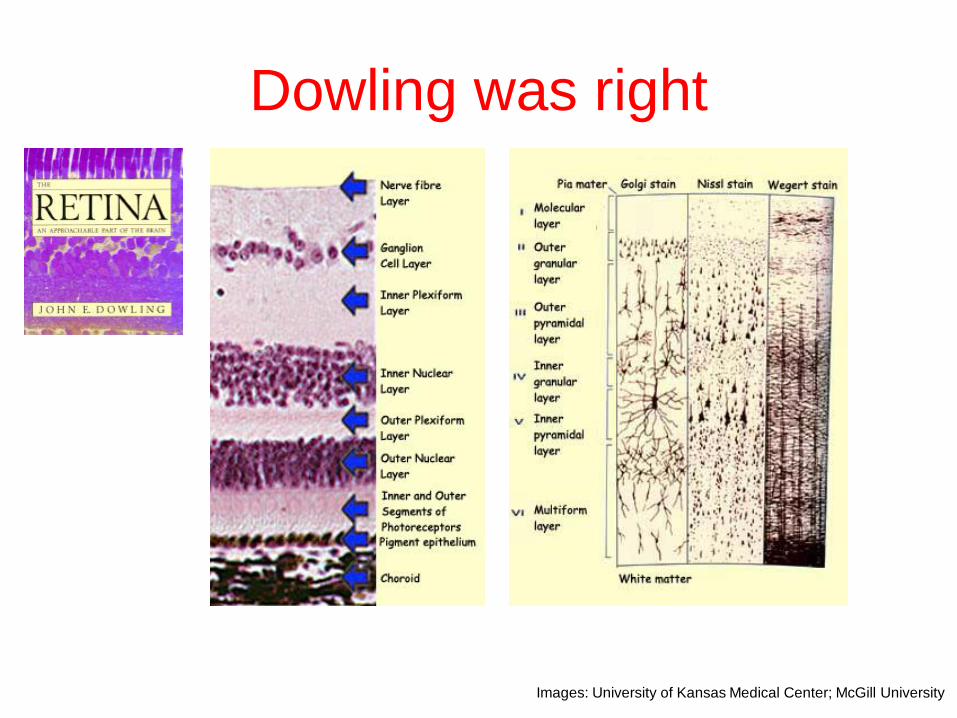
Dowling was right
Images: University of Kansas Medical Center; McGill University
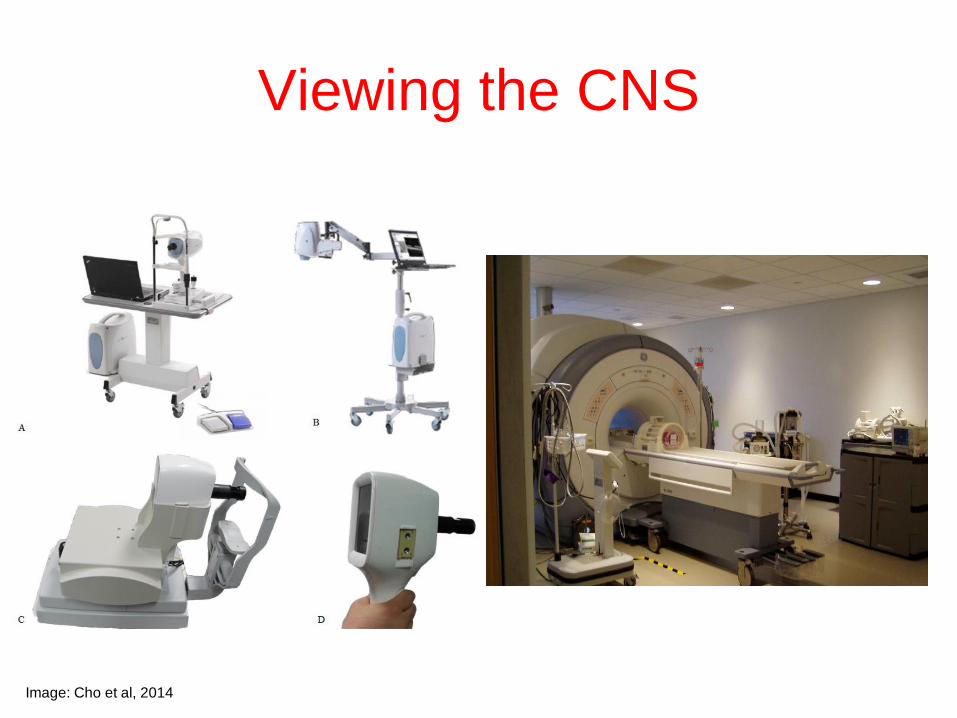
Viewing the CNS
Image: Cho et al, 2014

Retinal change as a predictor
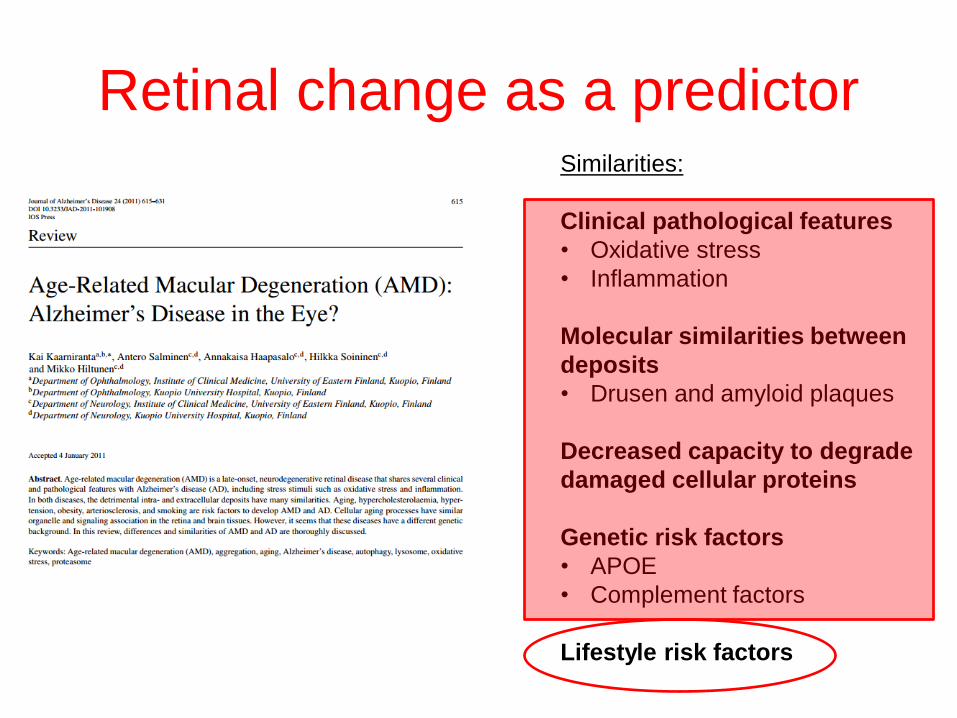
Retinal change as a predictor Similarities:
Clinical pathological features
• Oxidative stress
• Inflammation
Molecular similarities between
deposits
• Drusen and amyloid plaques
Decreased capacity to degrade
damaged cellular proteins
Genetic risk factors
• APOE
• Complement factors
Lifestyle risk factors
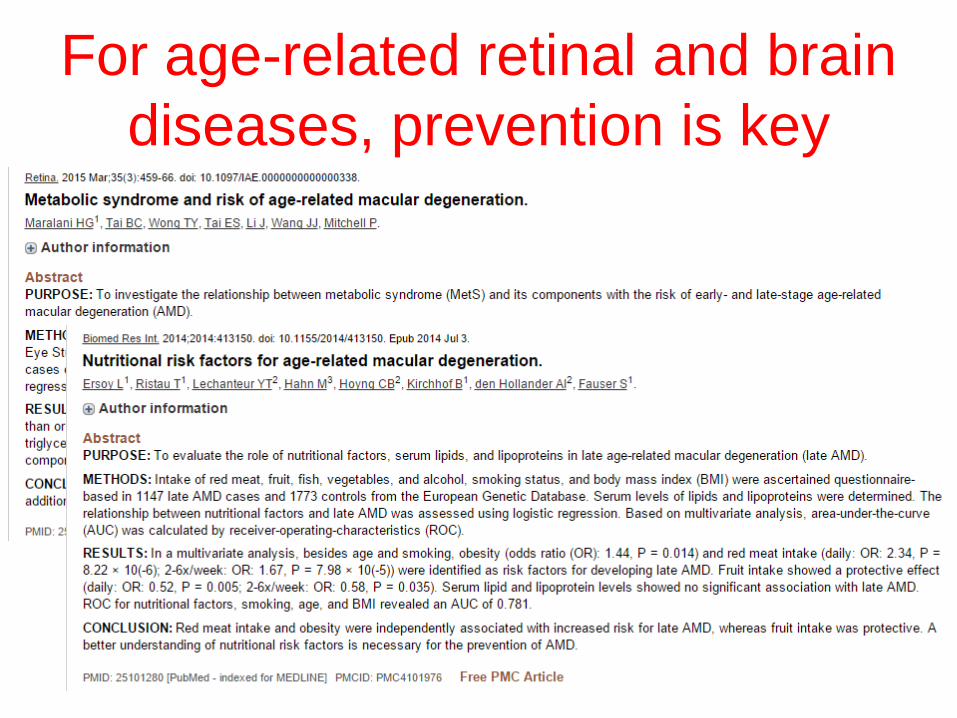
For age-related retinal and brain
diseases, prevention is key
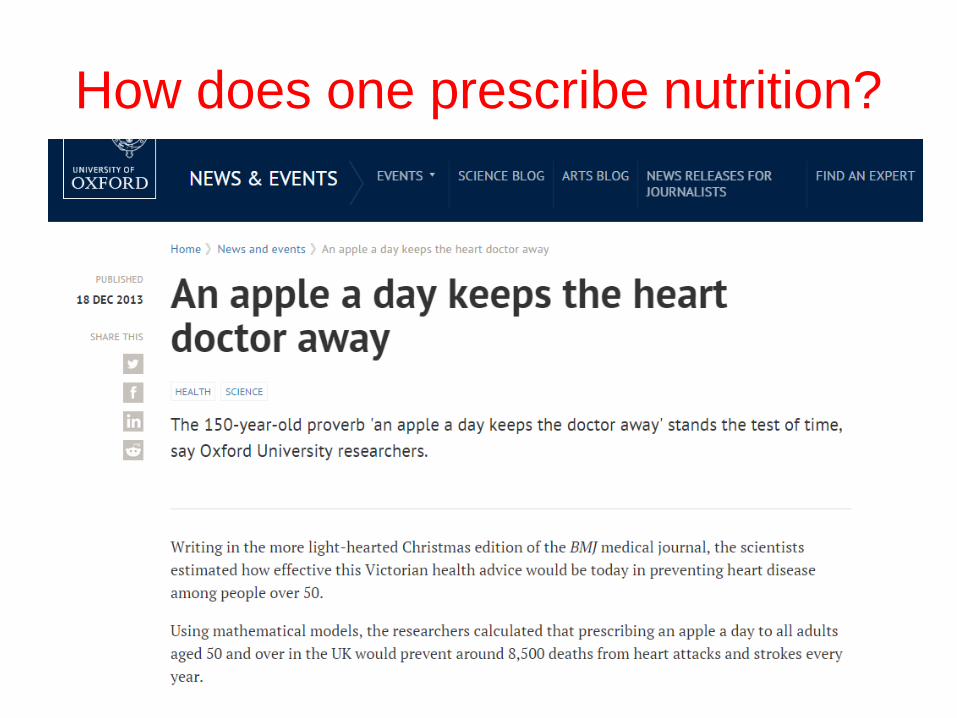
How does one prescribe nutrition?

Introduction to dietary
carotenoids
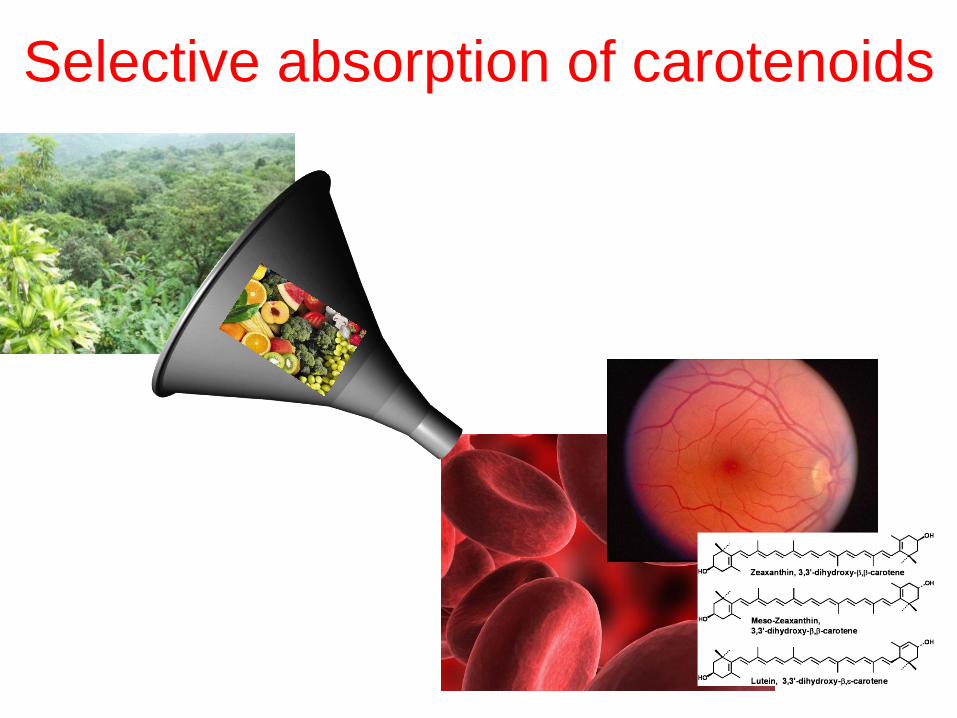
Selective absorption of carotenoids

Macular Pigment (MP)
MP is comprised of lutein (L) and zeaxanthin (Z), and their
isomer, meso-zeaxanthin (MZ).
Image: Martha Neuringer
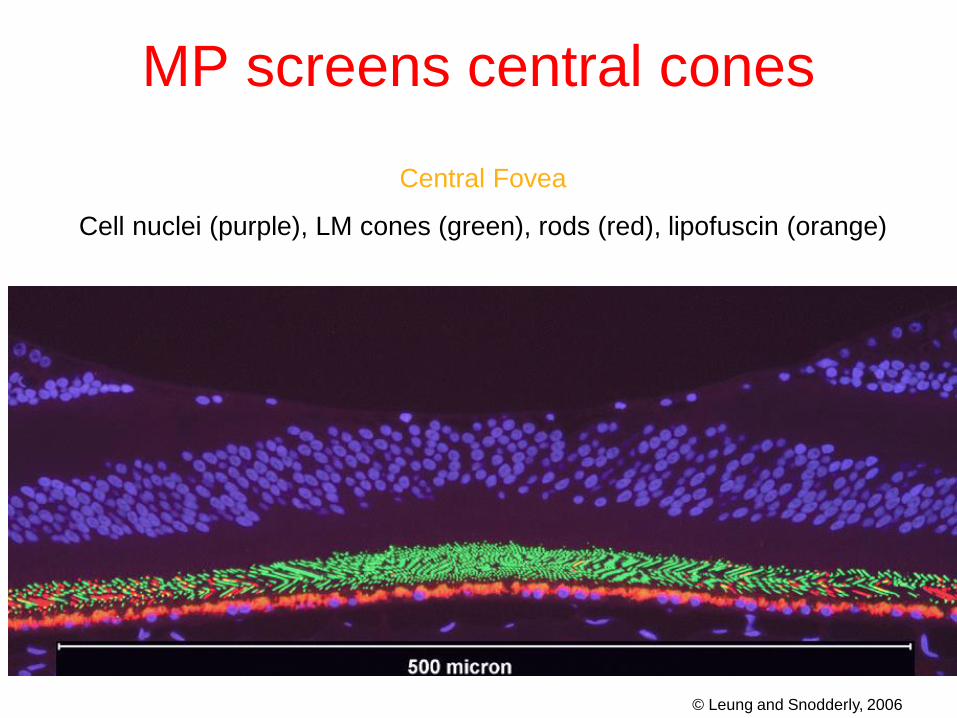
Central Fovea
Cell nuclei (purple), LM cones (green), rods (red), lipofuscin (orange)
© Leung and Snodderly, 2006
MP screens central cones

MP absorbs short-wave light
Image: D. Max Snodderly


Xanthophylls are antioxidants
Light
Photosensitizer + O2
1O2 3O2
Heat
Lipid Peroxidation DHA
Lutein
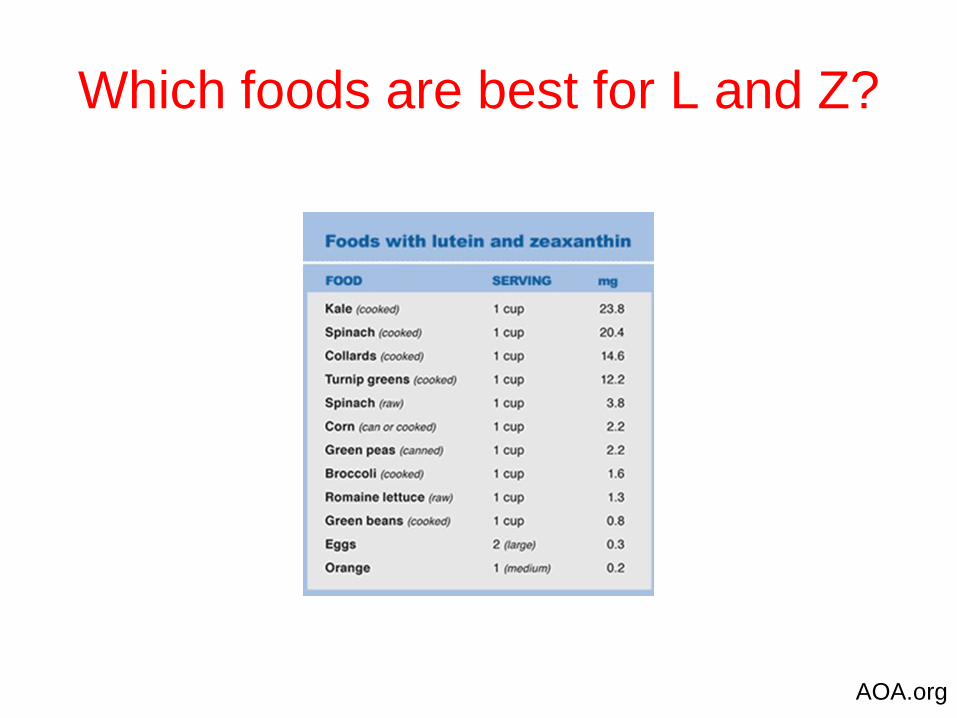
Which foods are best for L and Z?
AOA.org
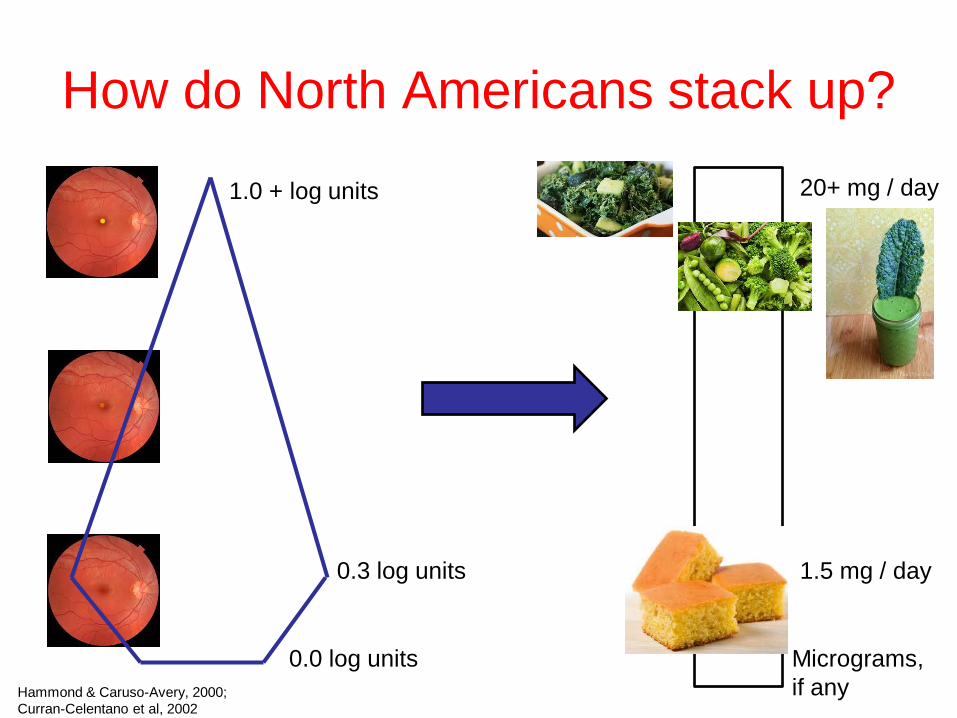
How do North Americans stack up?
1.0 + log units
0.3 log units
0.0 log units
1.5 mg / day
Micrograms,
if any
20+ mg / day
Hammond & Caruso-Avery, 2000;
Curran-Celentano et al, 2002

Carotenoids and visual
function: the evidence

Visual function?
vs.
Pigments absorb short-wave light.
Tungsten sources make bad test lights.
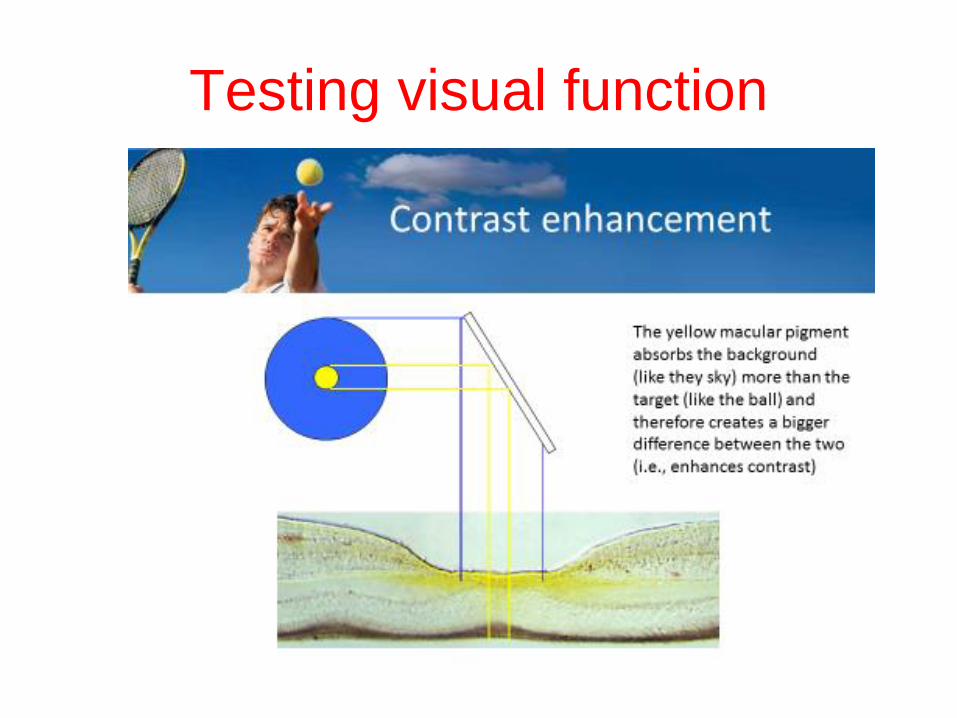
Testing visual function
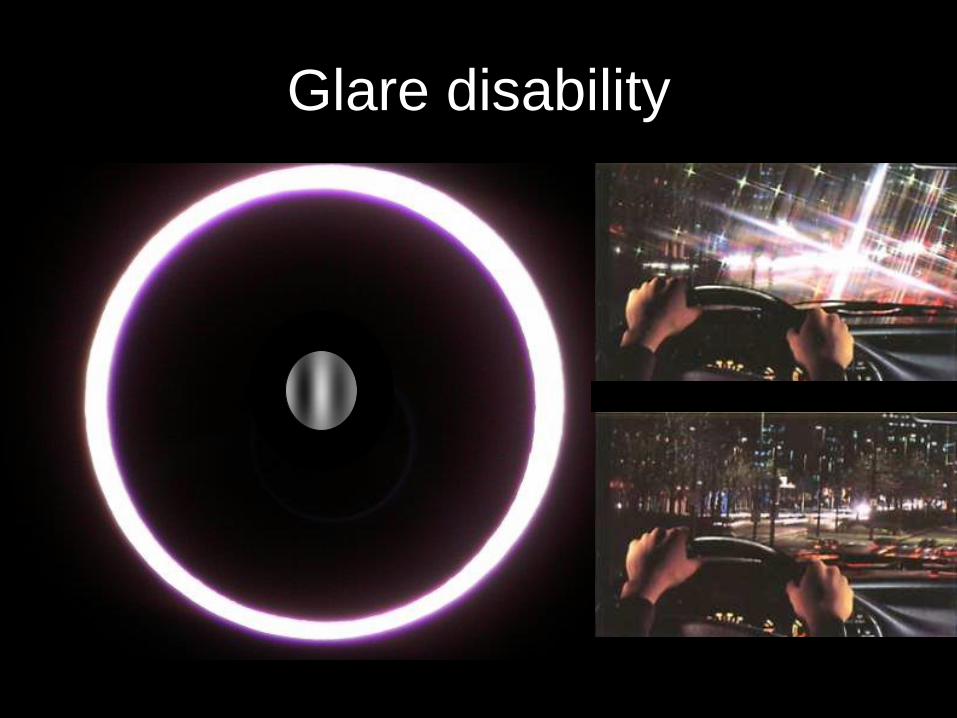
Glare Disability Glare disability


Photostress recovery

Photostress recovery
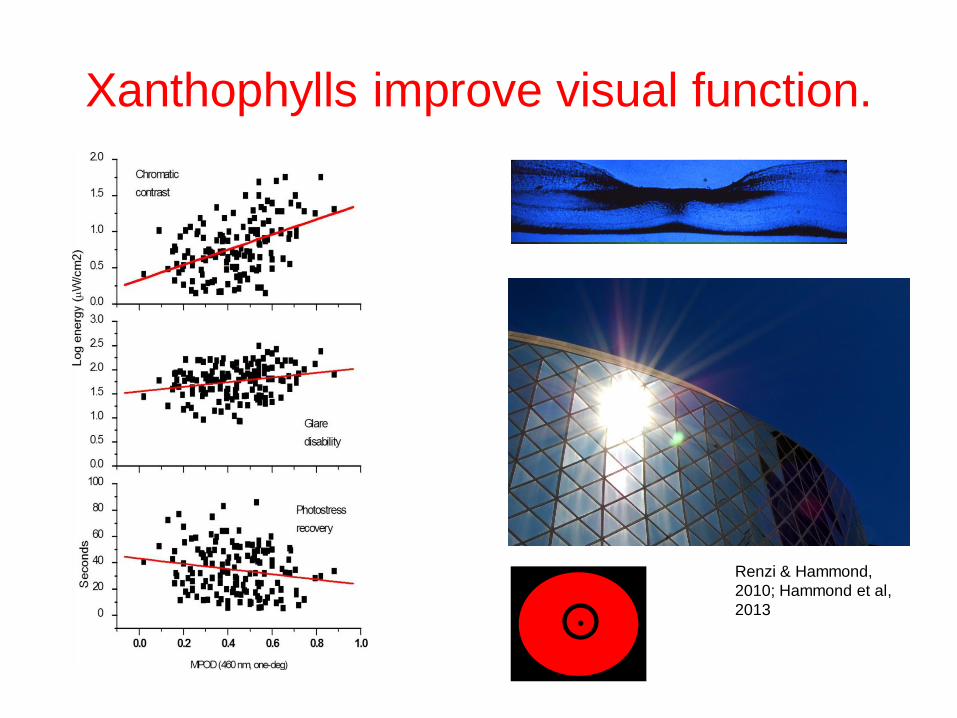
Xanthophylls improve visual function.
Renzi & Hammond,
2010; Hammond et al,
2013
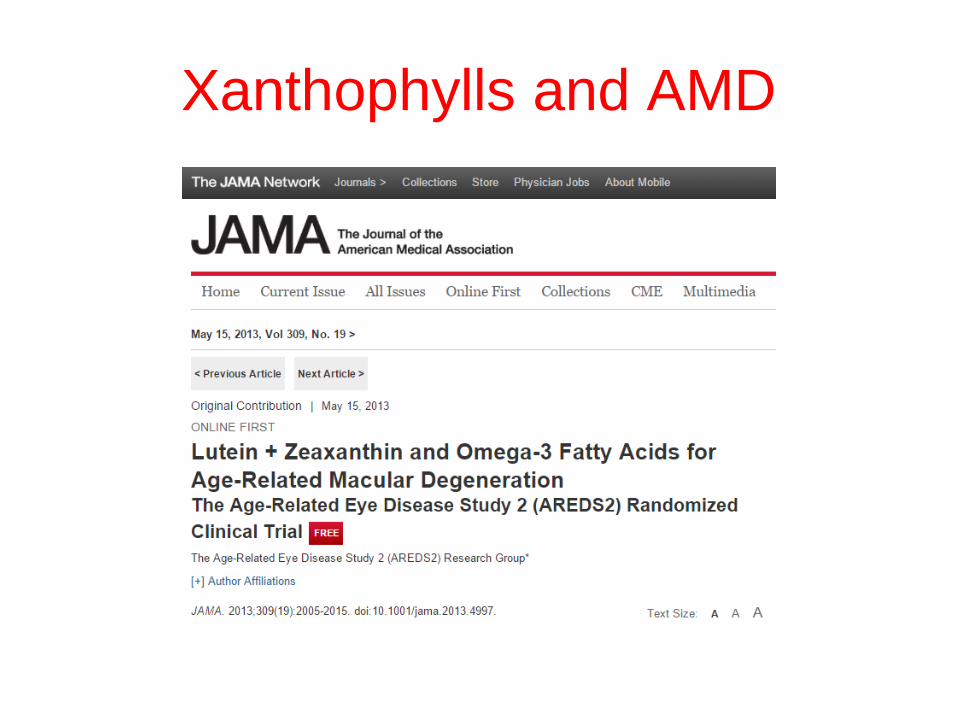
Xanthophylls and AMD

Carotenoids and cognitive
function: the evidence
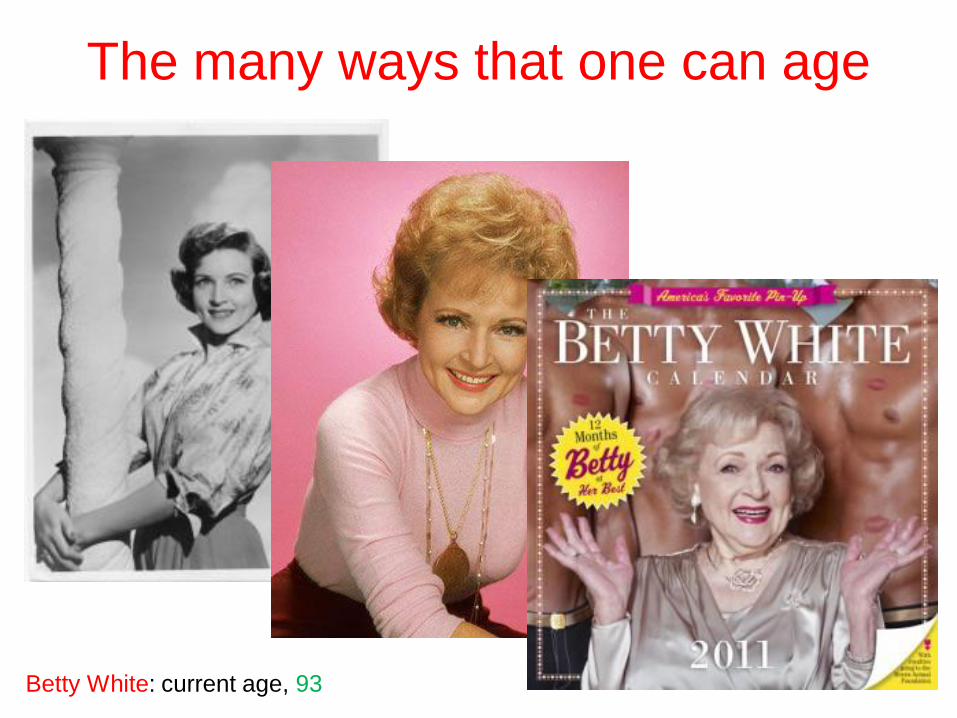
The many ways that one can age
Betty White: current age, 93

The many ways that one can age
Marlon Brando: died age 80, liver failure, congestive
heart failure, obesity, diabetes, pulmonary fibrosis
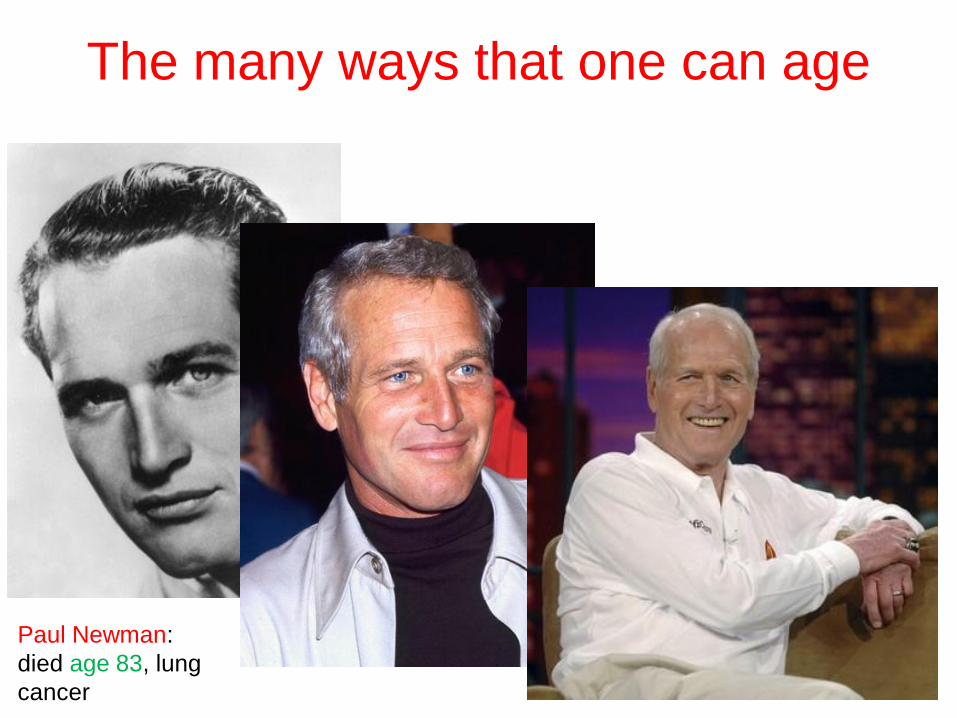
The many ways that one can age
Paul Newman:
died age 83, lung
cancer

Successful aging?
"You start to lose your memory, you
start to lose your confidence, you start
to lose your invention. So I think that's
pretty much a closed book for me.“
-- Paul Newman, 2007, on retiring from acting

Cognition?

Cognition? Altered sensory
input with age

Cognition? Altered sensory
input with age
Loss of cortical
volume

Cognition? Altered sensory
input with age
Loss of cortical
volume
Alterations in
processing
strategy
Raz et al, 2004
Peelle et al, 2013
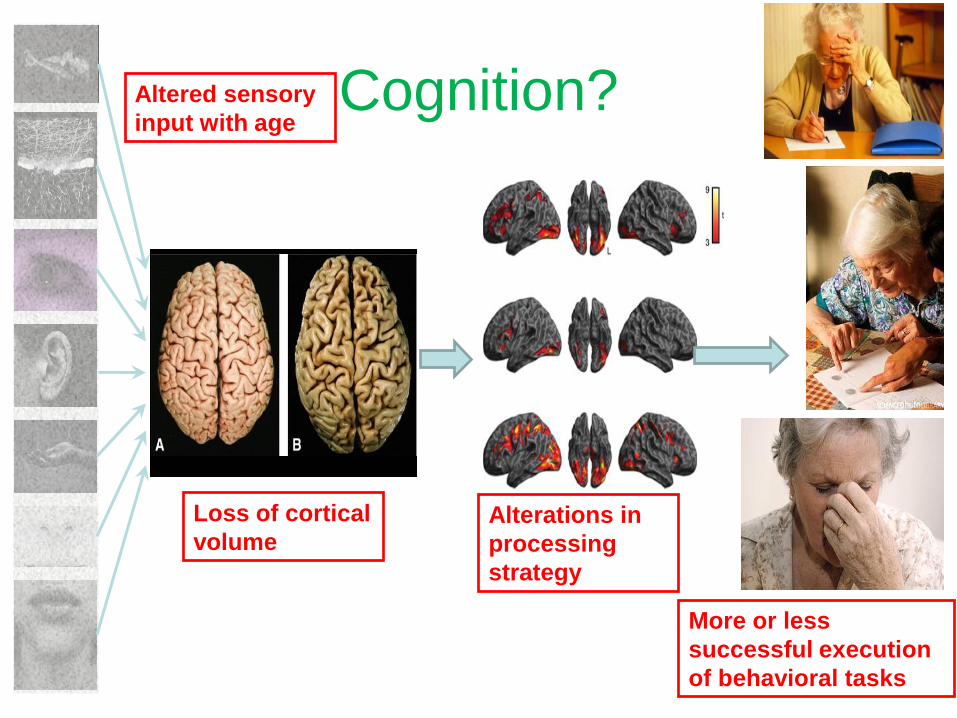
Cognition? Altered sensory
input with age
Loss of cortical
volume Alterations in
processing
strategy
More or less
successful execution
of behavioral tasks
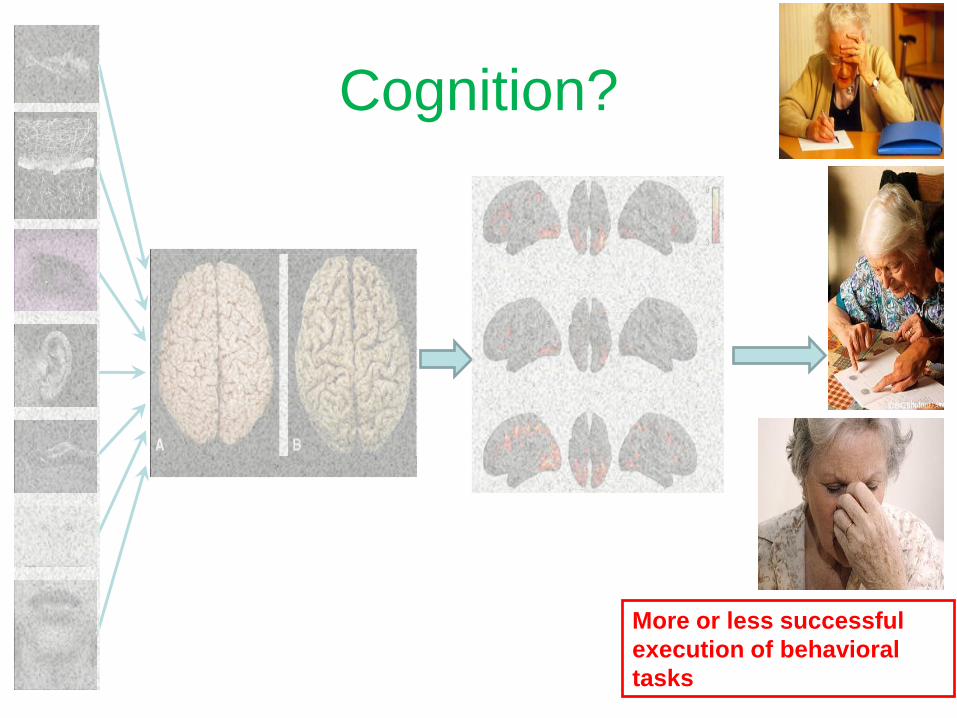
Cognition?
More or less successful
execution of behavioral
tasks

Measuring behavior
Category confusion: staging decline vs. direct measures of function vs. cognitive
functional reductionism
Boston University Rehabilitation Outcomes
Center
Gulbinaite et al, 2014
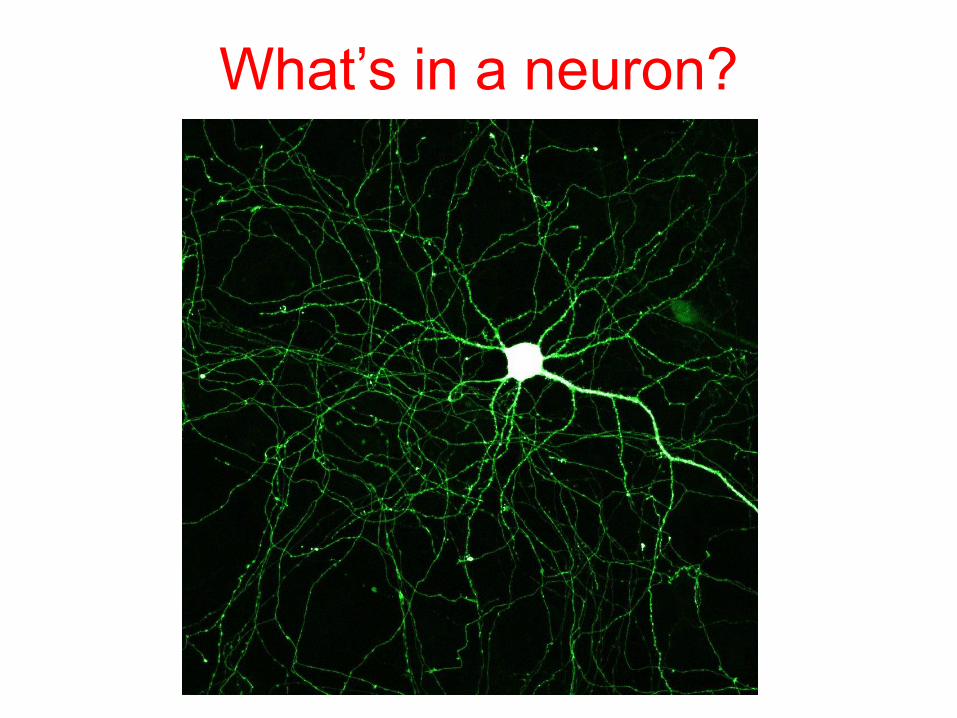
What’s in a neuron?

What’s in a neuron?
Fatty acids (lipid bilayers)
What’s in a neuron?
Fatty acids (lipid bilayers)
Electrolytes (ion
channels)

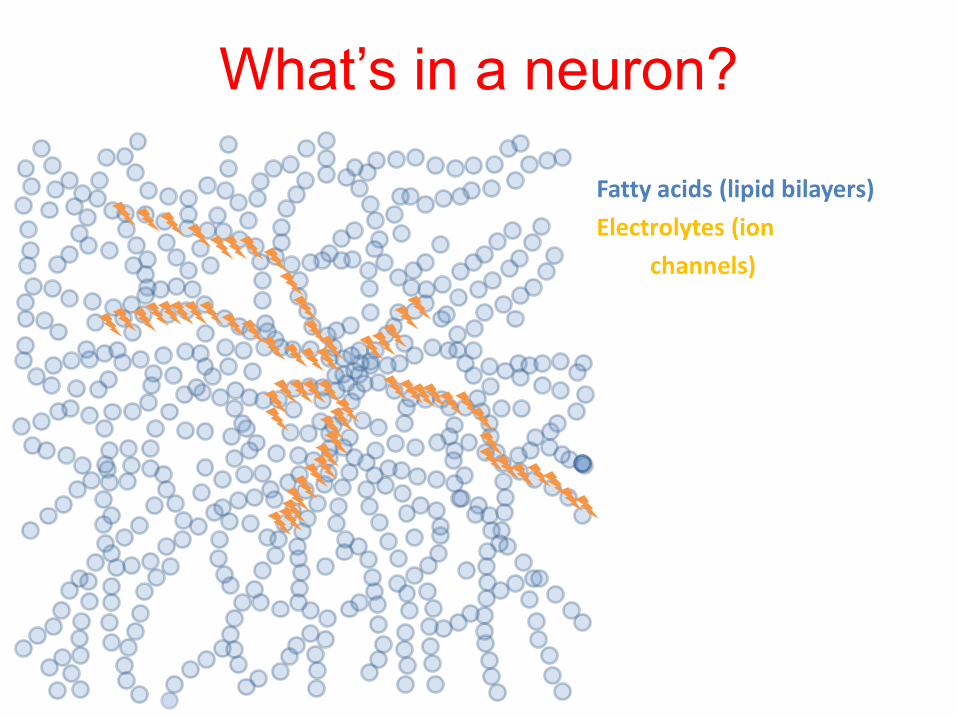
What’s in a neuron?
Fatty acids (lipid bilayers)
Electrolytes (ion
channels)
Vitamins (fat and water soluble)

What’s in a neuron?
Fatty acids (lipid bilayers)
Electrolytes (ion
channels)
Vitamins (fat and water soluble, aqueous and lipid compartments)
Proteins and carbohydrates ( (cytoskeleton, receptors)
Carotenoids?
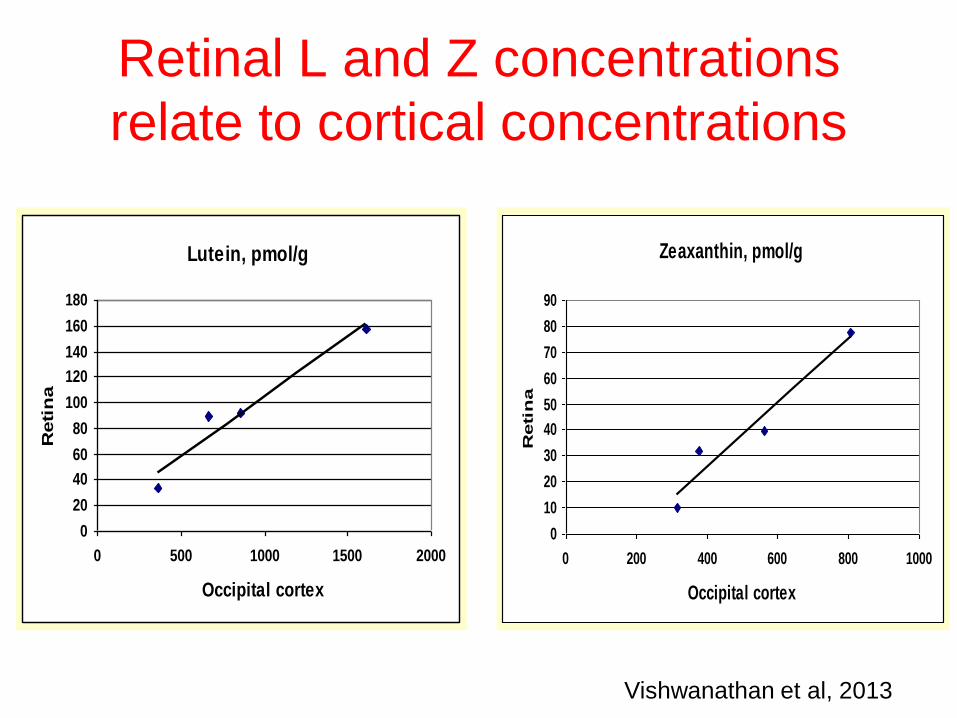
Retinal L and Z concentrations
relate to cortical concentrations
Lutein, pmol/g
0
20
40
60
80
100
120
140
160
180
0 500 1000 1500 2000
Occipital cortex
Reti
na
Zeaxanthin, pmol/g
0
10
20
30
40
50
60
70
80
90
0 200 400 600 800 1000
Occipital cortex
Reti
na
Vishwanathan et al, 2013
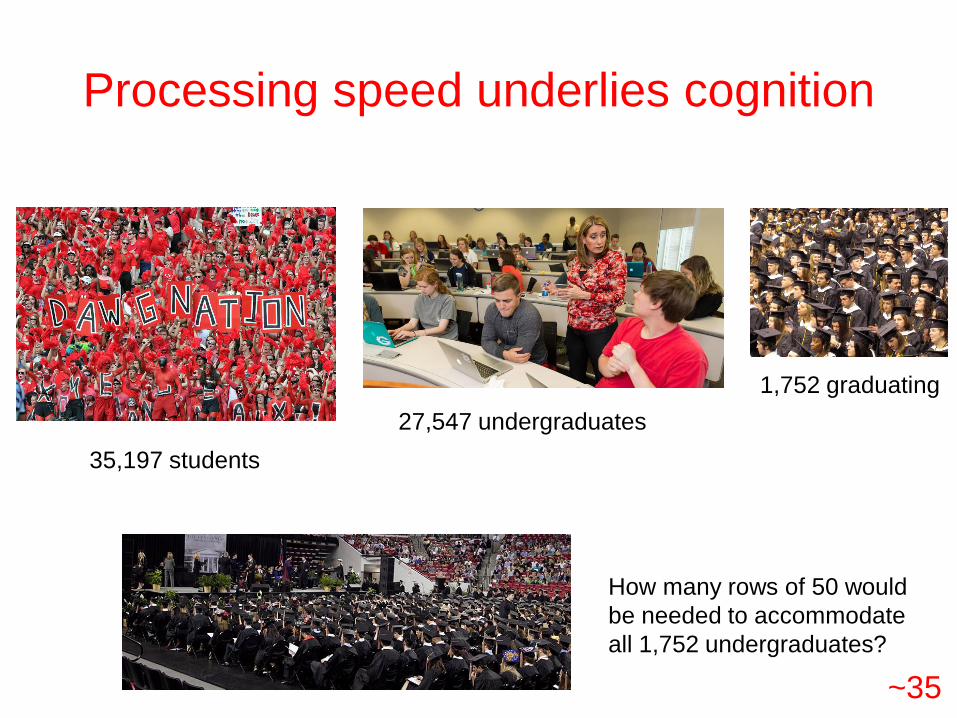
Processing speed underlies cognition
35,197 students
27,547 undergraduates
1,752 graduating
How many rows of 50 would
be needed to accommodate
all 1,752 undergraduates?
~35

And what if I read that out loud?
1. Hearing
2. Sensory processing
3. Working memory
4. Conversion to
long-term storage 5. Permanence

Measuring processing speed
Processing speed is the pace at which a person takes in information from the world.
Critical Flicker Fusion
Frequency (CFF)

19
19.5
20
20.5
21
21.5
22
22.5
23
1 2 3
Low MP
(0.0-
0.20)
Medium
MP
(0.21-0.40)
High MP
(0.41-
0.81)
Cri
tical
Flicker
Fu
sio
n T
hre
sh
old
(H
Z)
n = 355
Lutein levels relate to processing speed
Hammond & Wooten, 2005
Renzi & Hammond, 2010

When young people supplement lutein and zeaxanthin,
CFF improves significantly.
Supplementation with lutein and zeaxanthin
improves CFF

As CFF improves, reaction times also improve.
Supplementation also improves
reaction times
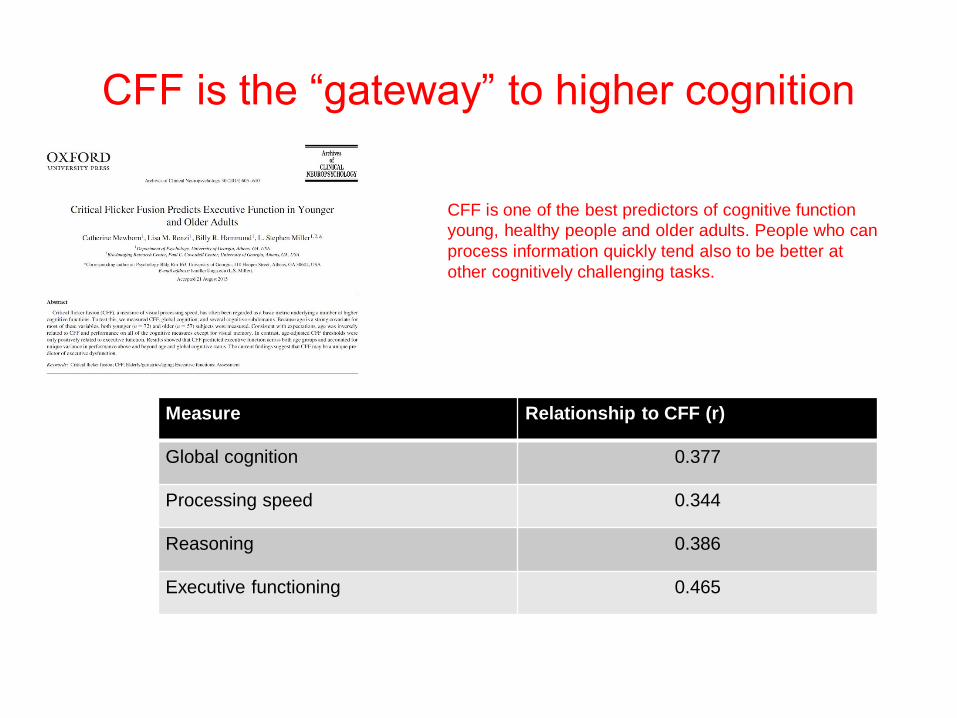
Measure Relationship to CFF (r)
Global cognition 0.377
Processing speed 0.344
Reasoning 0.386
Executive functioning 0.465
CFF is one of the best predictors of cognitive function
young, healthy people and older adults. People who can
process information quickly tend also to be better at
other cognitively challenging tasks.
CFF is the “gateway” to higher cognition

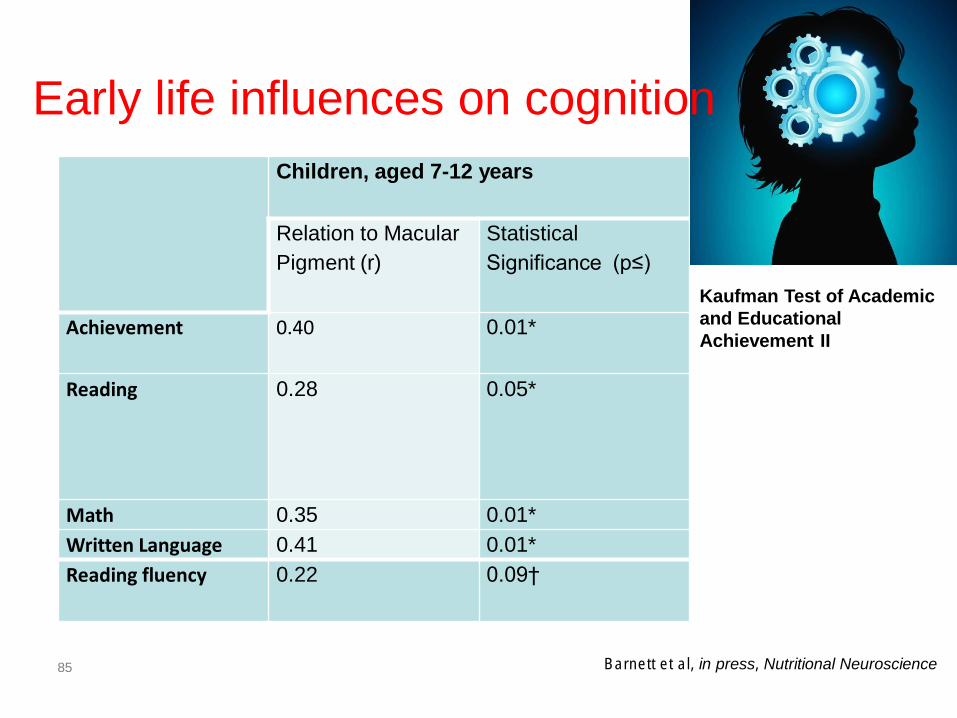
Early life influences on cognition
Hassevoort et al, 2017,
Journal of Pediatrics
N = 40
p = 0.007
85
Children, aged 7-12 years
Relation to Macular
Pigment (r)
Statistical
Significance (p≤)
Achievement 0.40 0.01*
Reading 0.28 0.05*
Math 0.35 0.01*
Written Language 0.41 0.01*
Reading fluency 0.22 0.09†
Barnett et al, in press, Nutritional Neuroscience
Kaufman Test of Academic
and Educational
Achievement II
Early life influences on cognition
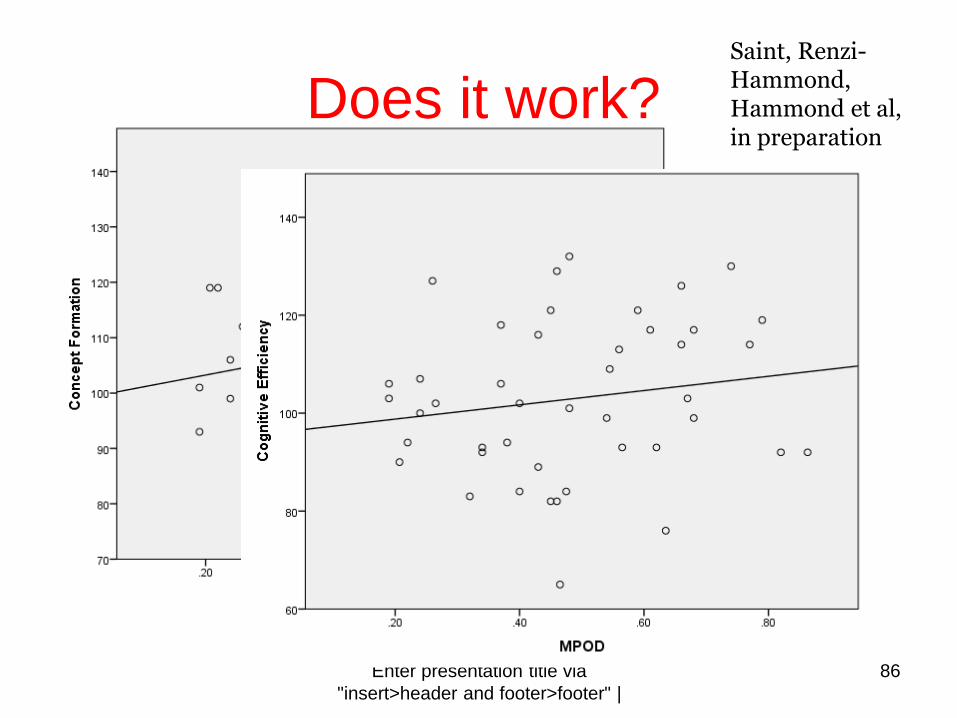
Does it work?
Enter presentation title via
"insert>header and footer>footer" |
86
Saint, Renzi-Hammond, Hammond et al, in preparation
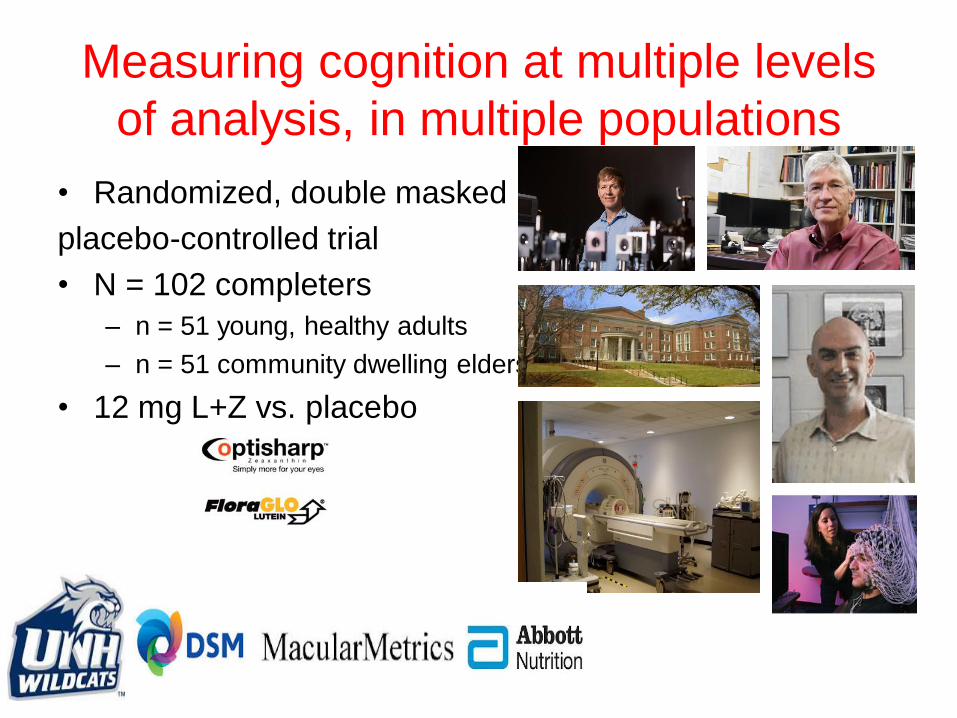
Measuring cognition at multiple levels
of analysis, in multiple populations
• Randomized, double masked
placebo-controlled trial
• N = 102 completers
– n = 51 young, healthy adults
– n = 51 community dwelling elders
• 12 mg L+Z vs. placebo
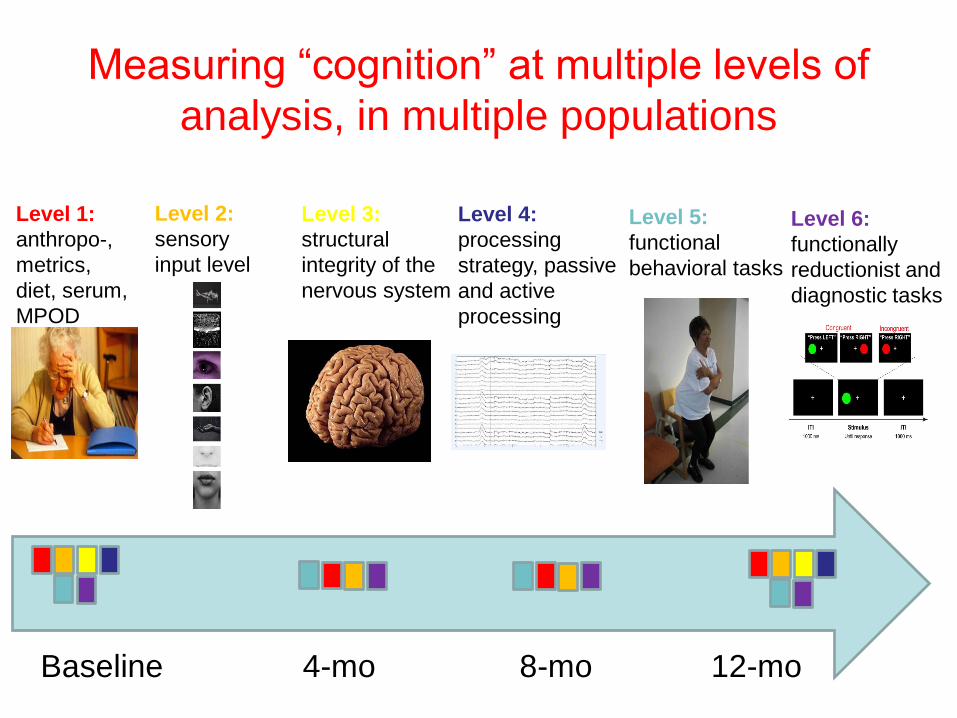
Measuring “cognition” at multiple levels of
analysis, in multiple populations
Baseline 4-mo 8-mo 12-mo
Level 2:
sensory
input level
Level 3:
structural
integrity of the
nervous system
Level 4:
processing
strategy, passive
and active
processing
Level 5:
functional
behavioral tasks
Level 6:
functionally
reductionist and
diagnostic tasks
Level 1:
anthropo-,
metrics,
diet, serum,
MPOD
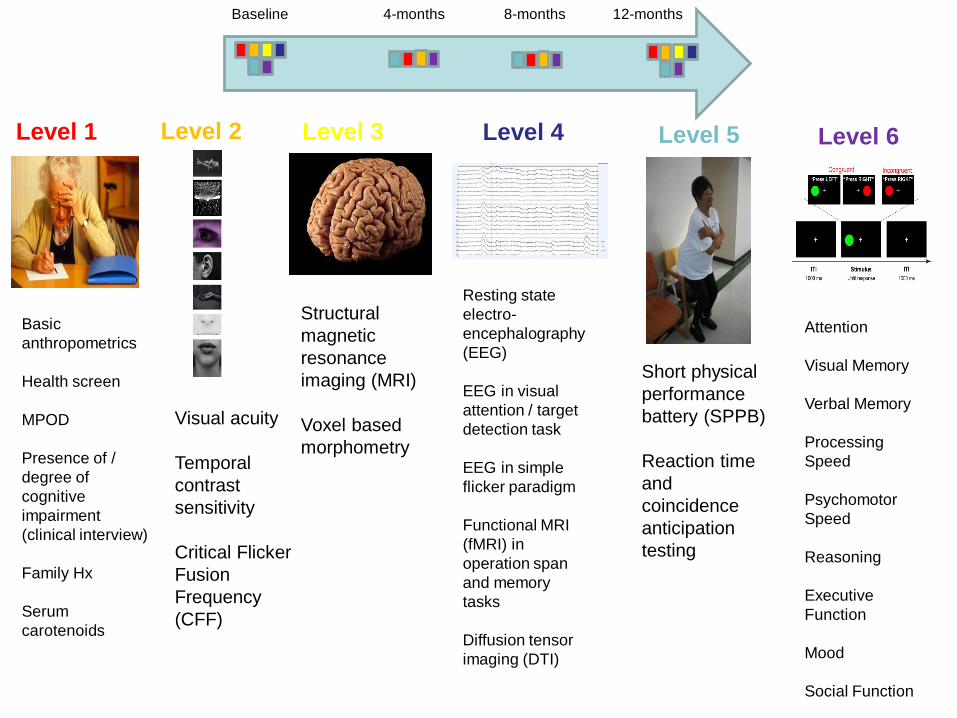
Level 2 Level 3 Level 4 Level 5 Level 6 Level 1
Basic
anthropometrics
Health screen
MPOD
Presence of /
degree of
cognitive
impairment
(clinical interview)
Family Hx
Serum
carotenoids
Visual acuity
Temporal
contrast
sensitivity
Critical Flicker
Fusion
Frequency
(CFF)
Structural
magnetic
resonance
imaging (MRI)
Voxel based
morphometry
Resting state
electro-
encephalography
(EEG)
EEG in visual
attention / target
detection task
EEG in simple
flicker paradigm
Functional MRI
(fMRI) in
operation span
and memory
tasks
Diffusion tensor
imaging (DTI)
Short physical
performance
battery (SPPB)
Reaction time
and
coincidence
anticipation
testing
Attention
Visual Memory
Verbal Memory
Processing
Speed
Psychomotor
Speed
Reasoning
Executive
Function
Mood
Social Function
Baseline 4-months 8-months 12-months

Testing cognitive function
Visual Memory
Remember this
image
Remember this
image
Press the SPACE
BAR if you were asked
to remember this
image
Press the SPACE
BAR if you were asked
to remember this
image
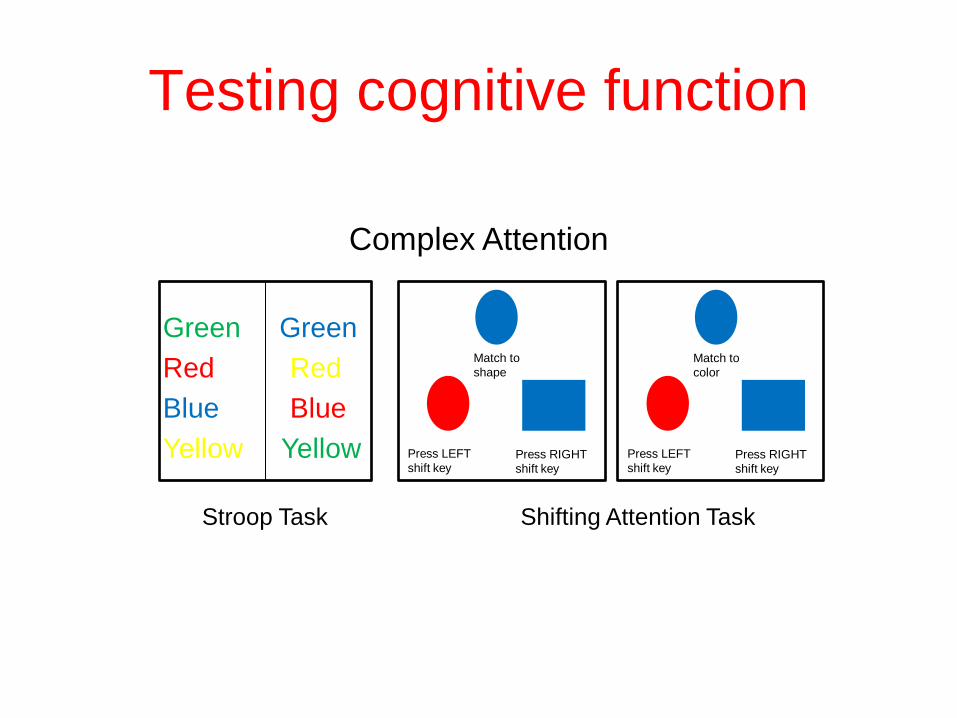
Testing cognitive function
Complex Attention
Green Green
Red Red
Blue Blue
Yellow Yellow
Match to
shape
Press LEFT
shift key Press RIGHT
shift key
Match to
color
Press LEFT
shift key Press RIGHT
shift key
Stroop Task Shifting Attention Task
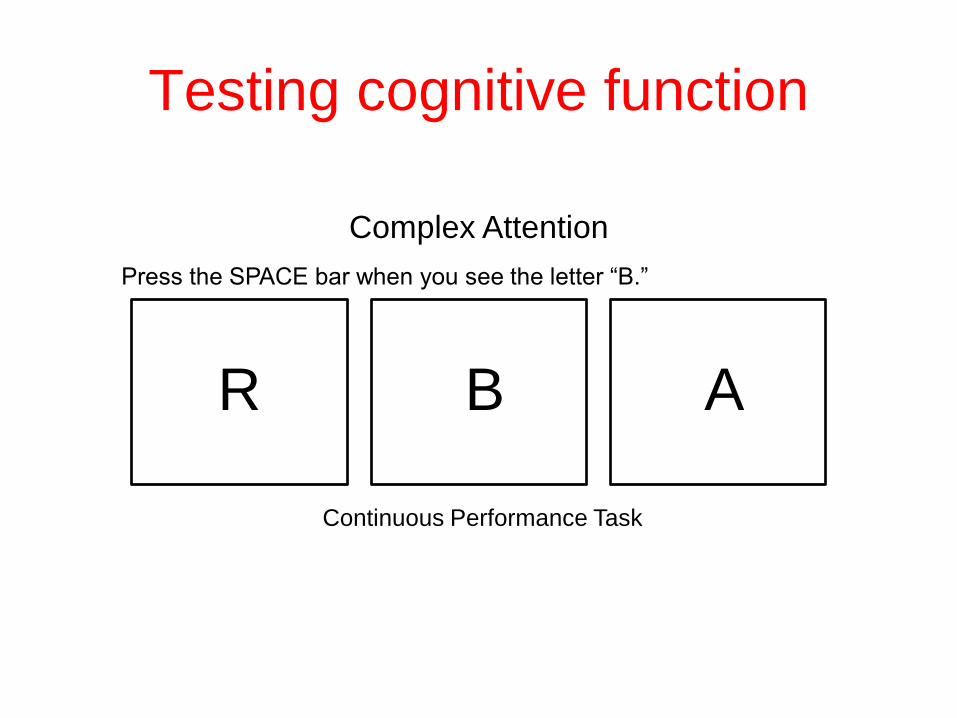
Testing cognitive function
Complex Attention
Press the SPACE bar when you see the letter “B.”
R B A
Continuous Performance Task

Testing cognitive function
Reasoning ability: choose the option that best completes the pattern.
1
.
2
.
3
.
4
.
5
.

19
19.5
20
20.5
21
21.5
22
22.5
23
1 2 3
Low MP
(0.0-
0.20)
Medium
MP
(0.21-0.40)
High MP
(0.41-
0.81)
Cri
tical
Flicker
Fu
sio
n T
hre
sh
old
(H
Z)
n = 355
Lutein levels relate to
processing speed
Hammond & Wooten, 2005
Renzi & Hammond, 2010
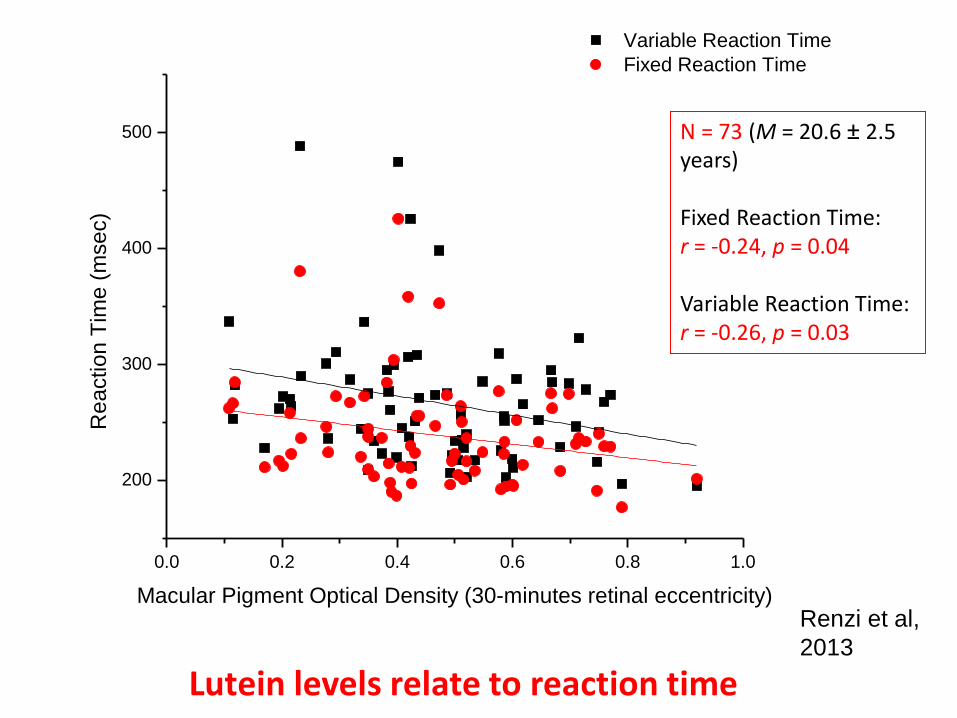
0.0 0.2 0.4 0.6 0.8 1.0
200
300
400
500
Variable Reaction Time
Fixed Reaction Time
Re
actio
n T
ime
(m
se
c)
Macular Pigment Optical Density (30-minutes retinal eccentricity)
N = 73 (M = 20.6 ± 2.5 years) Fixed Reaction Time: r = -0.24, p = 0.04 Variable Reaction Time: r = -0.26, p = 0.03
Lutein levels relate to reaction time
Renzi et al,
2013

Younger adults, by supplement
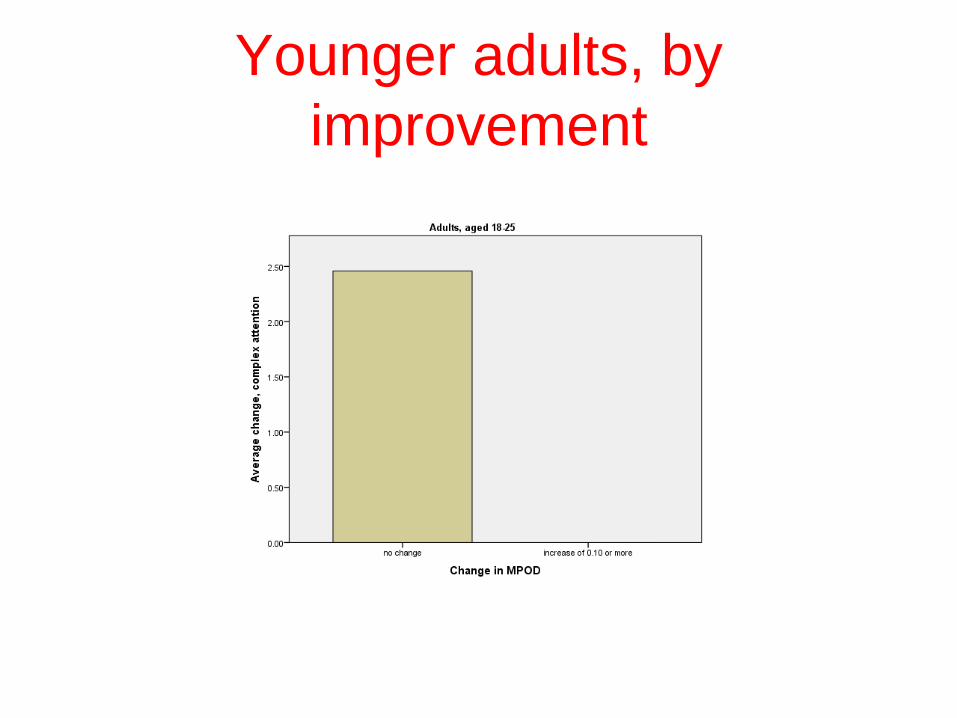
Younger adults, by
improvement
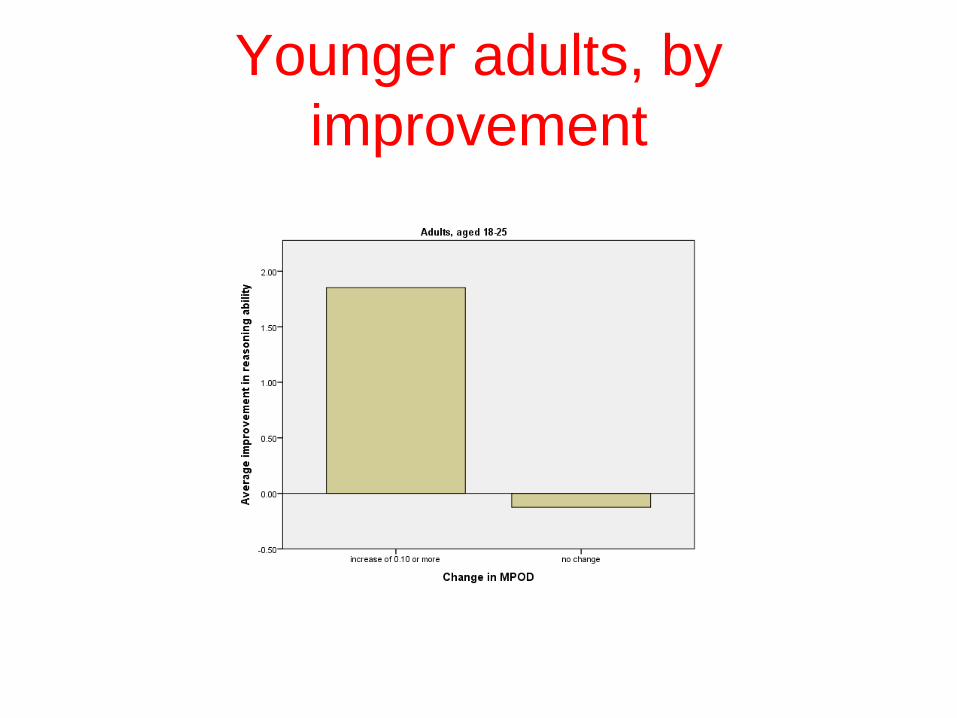
Younger adults, by
improvement

Older adults, by supplement

Older adults, by supplement

Older adults, by supplement

Brain activation, at rest
High
MPOD =
0.69
average
Low MPOD
= 0.28
average
12-15 Hz,
p = 0.031
Thorne et al,
2015

Brain activation, with noise
Unattended image
Middle bar
Peripheral bar
Outside bar
High
MPOD =
0.69
average
Low MPOD
= 0.28
average
Frequency
(Hz)
Po
we
r (1
0*lo
g10(μ
V2) )
Low
High
p < 0.02
p < 0.05
Oliver et al,
2015

Functional scans, verbal domain
Low levels of macular xanthophylls relate to increased
utilization of compensatory processing mechanisms. Terry et al,
2014
N = 35

Functional scans, visual domain
Left middle frontal gyrus and right superior parietal lobe show
activation differences in adults with high macular xanthophylls.
Terry et al,
2014
Press RIGHT if
even, LEFT if
uneven
Press RIGHT if top
and bottom match,
LEFT if no match
N =
36
Left middle
frontal
gyrus; Right
superior
parietal

Cognitively impaired older adults
Cognitive Status RBANS Cognitive
Domain
Relation to MPOD
(r value)
p value
All participants
Attentional 0.024 0.441
Visuospatial 0.251 0.057
Unimpaired
participants
Attentional -0.088 0.334
Visuospatial 0.091 0.329
Impaired
participants
Attentional 0.466 0.04
Visuospatial 0.429 0.056 Renzi et al,
2013

Conclusions and
recommendations for patient care
Having the hard conversation
• Asking about diet is awkward
• Patients have selective memories
• Modeling good behavior
• Track lifestyle
• Practice expansion / value add
– OD is the new GP
• Nutrition is (needlessly) confusing

Eggs are good, eggs are bad… might as well eat a donut
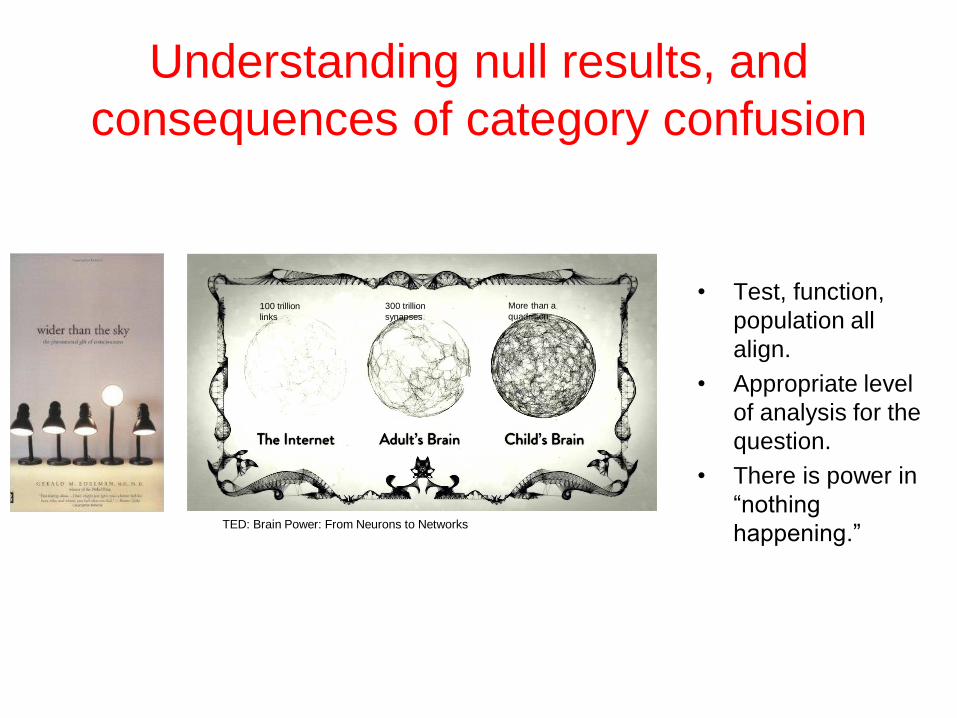
Understanding null results, and
consequences of category confusion
• Test, function,
population all
align.
• Appropriate level
of analysis for the
question.
• There is power in
“nothing
happening.”
100 trillion
links
300 trillion
synapses
More than a
quadrillion
TED: Brain Power: From Neurons to Networks
• Collaborators – UGA: Billy Hammond, L. Stephen Miller, Brett Clementz,
Janet Frick
– Macular Metrics: Billy WootenUNH: Joanne Curran-Celentano
– UIUC: Naiman Khan, Arthur Kramer, Neal Cohen
– Northwestern University: Chuck Hillman
– SUNY Oneonta: Emily Bovier
• Current and former graduate students – S. Anna Thorne, William Oliver, Cutter Lindbergh, Douglas Terry,
Catherine Mewborn, Kevin O’Brien, Laura Fletcher, Sarah Saint
• Laboratory Employees and Research Assistants – Medina Bello, Samy Gabriel, David Cromer, Kodiak Sauer, Jason
Champ, Craig Brown, Harrison Cloud, Jacob Beckham, Eli Chlan, Haleigh Randazzo, Stephanie Nguyen, Frances Kittle, Stephen White
• Abbott Nutrition
• DSM
• ZeaVision
Acknowledgements