INVESTIGATING THE IMPACTS OF STATE HIGHER EDUCATION ...
86
INVESTIGATING THE IMPACTS OF STATE HIGHER EDUCATION APPROPRIATIONS AND FINANCIAL AID KRISTEN CUMMINGS SOPHIA LADERMAN JASON LEE DAVID TANDBERG DUSTIN WEEDEN MAY 2021
Transcript of INVESTIGATING THE IMPACTS OF STATE HIGHER EDUCATION ...

INVESTIGATING THE IMPACTS OF STATE HIGHER EDUCATION APPROPRIATIONS AND FINANCIAL AID
KRISTEN CUMMINGS
SOPHIA LADERMAN
JASON LEE
DAVID TANDBERG
DUSTIN WEEDEN
MAY 2021
SHEEO INVESTIGATING THE IMPACTS OF STATE HIGHER EDUCATION APPROPRIATIONS AND FINANCIAL AID2
copy 2021 by the State Higher Education Executive Officers Association (SHEEO)
TABLE OF CONTENTSIndex of Figures 3
Index of Tables 4
Abstract 5
Acknowledgments 6
Executive Summary 7
Introduction 16
Current and Historical Context of State Support for Higher Education 20
Prior Literature on the Effects of State Appropriations 35
Prior Literature on the Effects of Grant Aid 52
Simulated Impacts of State Appropriations and Financial Aid 61
Conclusion 69
References 73
Appendix A82
Appendix B 84
SHEEO INVESTIGATING THE IMPACTS OF STATE HIGHER EDUCATION APPROPRIATIONS AND FINANCIAL AID3
copy 2021 by the State Higher Education Executive Officers Association (SHEEO)
INDEX OF FIGURES1 State General Public Operating Appropriations per FTE and FTE Enrollment (Constant $)
US 2001-201922
2 Change in Education Appropriations per FTE Following Economic Recessions (Constant $) US 1980-2019 23
3 Change in State General Operating Appropriations FY 2001-2019 by State 24
4 State and Local Appropriations per FTE and FTE Enrollment at Two- and Four-Year Institutions (Constant $) US 2001-2017 26
5 State Grant Aid for Need- and Non-Need Programs (Constant $) US 2001-2019 28
6 Changes in Total State Grant Aid (Constant $) US 2001-2019 29
7 State Grant Aid and FTE Enrollment at Two- and Four-Year Institutions (Constant $) US 2001-2017 30
8 Change in State General Operating and Grant Aid per FTE Following Economic Recessions (Constant $) US 1980-2019 31
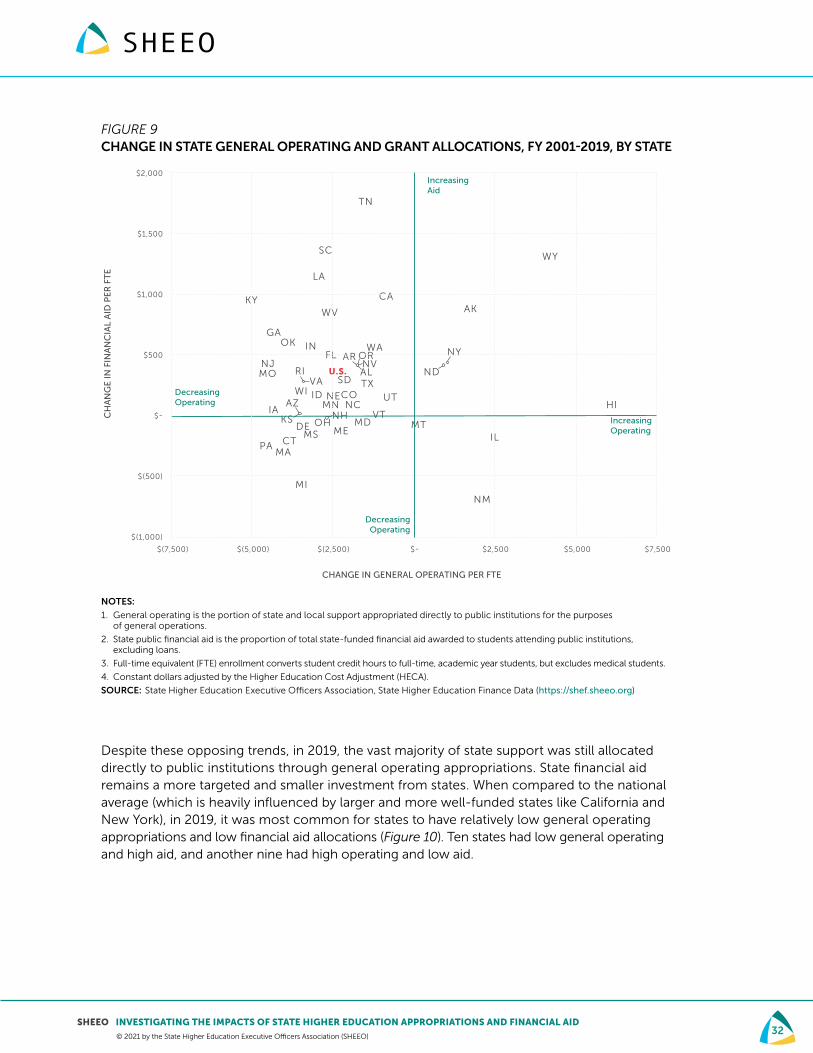
9 Change in State General Operating and Grant Allocations FY 2001-2019 by State 32
10 Comparison to US Average in State General Operating and Grant Aid Allocations FY 2019 by State 33
11 Breakdown of Total Public Higher Education Revenues US FY 2001-2019 34
12 Flowchart of Review Criteria for State Appropriations Literature Review 36
13 State and Local Appropriations per FTE at Public Institutions by Carnegie Classification (Constant $) US 2001-2017 48
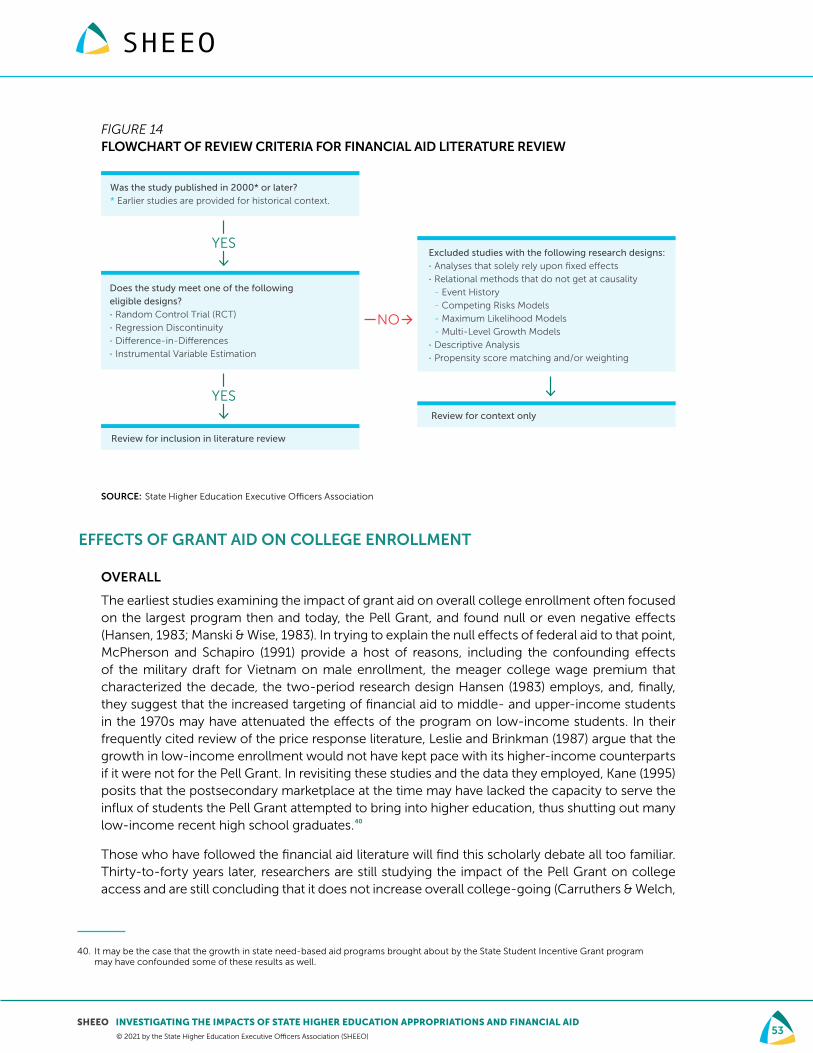
14 Flowchart of Review Criteria for Financial Aid Literature Review 53
B1 Comparing Cumulative Percent Change in Multiple Measures of State Support for Public Higher Education Over Time 84
SHEEO INVESTIGATING THE IMPACTS OF STATE HIGHER EDUCATION APPROPRIATIONS AND FINANCIAL AID4
copy 2021 by the State Higher Education Executive Officers Association (SHEEO)
INDEX OF TABLES1 Impact of Inflation and Enrollment on State General Public Operating Appropriations
and FTE Enrollment in Key Years US 2001-2019 21
2 Summary of State Appropriations Literature Review 46
3 Summary of Student Grant Aid Literature Review 59
4 Simulations Based on Statistically Significant Findings from Deming and Walters (2018) ndash A $1000 Increase in State Appropriations per FTE 63
5 Simulations Based on Statistically Significant Findings from Bound et al (2019) - A $1000 Increase in State Appropriations per FTE 64
6 Simulations Based on Statistically Significant Findings from Zhao (2018) - A $1000 Increase in State Appropriations 64
7 Simulations Based on Nguyen et alrsquos (2019) Meta-Analytic Review - Increase of $1000 Per Pell Grant Recipient 66
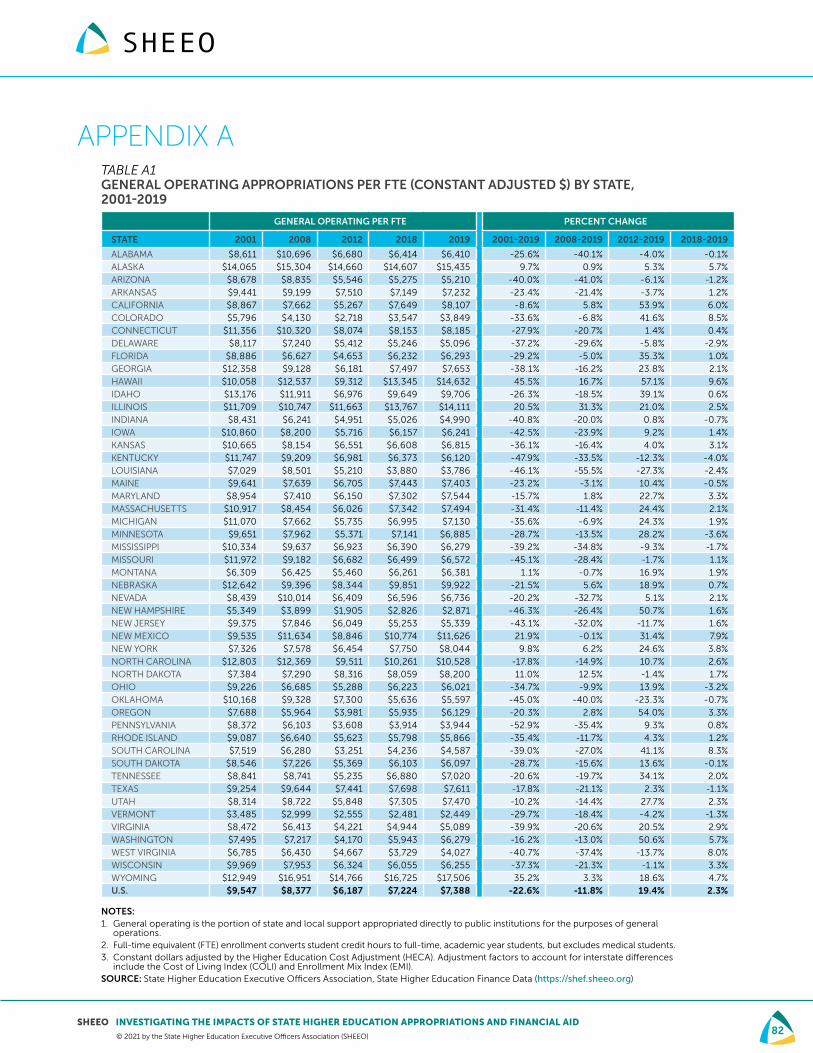
A1 General Operating Appropriations per FTE (Constant Adjusted $) by State 2001-2019 82
A2 State Grant Aid (Constant Adjusted $) by State 2001-2019 83
SHEEO INVESTIGATING THE IMPACTS OF STATE HIGHER EDUCATION APPROPRIATIONS AND FINANCIAL AID5
copy 2021 by the State Higher Education Executive Officers Association (SHEEO)
ABSTRACT
States invest in public higher education in two primary ways through direct funds to institutions (general operating support) and direct funds to students in the form of state financial aid programs (student grant aid) General operating support is the larger of the two funding categories totaling $808 billion in 2019 while state financial aid allocations totaled $123 billion To gain a deeper understanding of the impacts this state investment in higher education has on student outcomes we examine the historical data and empirical literature on state support for higher education We find clear evidence that increased financial investmentsmdashspecifically increased state general operating and student financial aidmdashare directly tied to student success in higher education These findings suggest that states will not meet their attainment goals or the workforce demands of the modern economy without sustained investment in the public higher education sector We conclude with finance policy solutions that states and the federal government can adopt to support their efforts to reach state postsecondary attainment goals and close equity gaps in degree attainment and college completion
SHEEO INVESTIGATING THE IMPACTS OF STATE HIGHER EDUCATION APPROPRIATIONS AND FINANCIAL AID6
copy 2021 by the State Higher Education Executive Officers Association (SHEEO)
ACKNOWLEDGMENTS
The authors would like to thank Celeste Carruthers Patrick Crane Jacob Fowles and Robert Toutkoushian for reviewing an earlier draft of this paper and for their thoughtful suggestions for improvement We would also like to thank Nick Hillman and Carlos Santiago for serving as discussants when we presented this paper as part of SHEEOrsquos webinar series on state higher education finance A special thank you goes out to Sameer Gadkaree who not only served as our program officer at the Joyce Foundation but who also served as an important thought partner on this project and whose suggestions greatly improved the final product This project was funded by the Joyce Foundation Finally wersquod like to thank Gloria Auer Caitlin Dennis Kelsey Heckert and Annahita Jimmerson at SHEEO whose efforts made this work possible The contents including all opinions conclusions and any errors are the responsibility of the authors alone
SHEEO INVESTIGATING THE IMPACTS OF STATE HIGHER EDUCATION APPROPRIATIONS AND FINANCIAL AID7
copy 2021 by the State Higher Education Executive Officers Association (SHEEO)
EXECUTIVE SUMMARY
What happens to student outcomes if a state increases (or decreases) public funding for higher education What portion of state higher education funding should be allocated to general operating support for institutions that may mitigate tuition rate increases for all students and what portion should be allocated to financial aid programs that target low-income students To what extent do each of these finance strategies impact enrollment graduation rates credential completion and other important outcomes State policymakers must consider these questions (among others) each budget cycle as they make difficult decisions about where to allocate scarce public dollars With the COVID-19 pandemic creating unprecedented health and economic challenges demand for public services will likely outpace available tax revenues in the coming years making these decisions even more difficult This paper seeks to provide some guidance to policymakers as we find clear evidence in the empirical literature that increased financial investmentsmdashspecifically increased state general operating and student financial aidmdashare directly tied to student success in higher education
While individuals accrue significant benefits from earning higher education credentials (eg higher wages) evidence suggests that the public benefits accrued by society are greater than the private benefits enjoyed by individuals (McMahon 2009) These public benefits such as increased democratic engagement reduced crime and health-care costs lower poverty rates and higher state tax revenues (Ma et al 2019b) are a primary reason states collectively allocated more than $100 billion for higher education in 2019 (Laderman amp Weeden 2020) and have established goals to increase educational attainment rates
States invest in public higher education in two primary ways through direct funds to institutions (general operating support) and direct funds to students in the form of state financial aid programs (student grant aid) General operating support is the larger of the two funding categories totaling $808 billion in 2019 while state financial allocations totaled $123 billion1 States have steadily increased funding for each category over the last few years however on a per-student basis general operating appropriations are 118 lower than in fiscal year 2008 when the Great Recession began while financial aid allocations per student are 30 greater
State funding for public higher education may be more important now than ever as we have never entered a recession with such a low level of state operating support This low level of funding comes as income inequality equity gaps low graduation rates persistent access challenges a rapidly changing economy and increased global competition all demand a more robust public higher education system States will not be able to meet these challenges without investing in their public institutions
This paper documents the importance of state higher education funding by synthesizing the available data and empirical literature on student and other outcomes We begin by discussing the current and historical context of state funding for general operating support and student financial aid Next we review the findings from our systematic review of the empirical literature on the impact of public investment on a wide range of institutional and student outcomes including
1 States also allocate funding for research agriculture extension programs and medical education that is not included in the general operating support amount Please see SHEEOrsquos annual State Higher Education Finance report for additional details (Laderman amp Weeden 2020)
SHEEO INVESTIGATING THE IMPACTS OF STATE HIGHER EDUCATION APPROPRIATIONS AND FINANCIAL AID8
copy 2021 by the State Higher Education Executive Officers Association (SHEEO)
enrollment completion and post-collegiate outcomes Using elasticities from the most rigorous research findings we simulate the effects of increasing general operating support and financial aid on student outcomes We close by providing recommendations for policymakers at the state and federal levels
CURRENT AND HISTORICAL CONTEXT OF STATE SUPPORT FOR HIGHER EDUCATION
NATIONAL TRENDS IN APPROPRIATIONS FOR GENERAL OPERATIONS
General operating appropriations at public institutions (which excludes financial aid research and medical appropriations) follow changes in the economic cycle rising during economic expansions and decreasing at greater rates than other budget categories during recessionary periods (Hovey 1999 Delaney amp Doyle 2011) Data from the State Higher Education Finance (SHEF) report highlight the following trends
bull First declines in state support per student have grown steeper and recoveries have become slower and less complete with each recession since 1980
bull Second even though general operating support increases during economic expansions it has not kept pace with enrollment increases and inflation Comparing general operating appropriations (in constant dollars) and full-time equivalent (FTE) student enrollment in 2019 with the fiscal years in which the two recessions of the 2000s began to show we find
ndash In 2001 public institutions enrolled 87 million students and received $826 billion in general operating support ($9547 per FTE student)
ndash In 2008 public institutions enrolled 102 million students and received $856 billion in general operating support ($8377 per FTE student)
ndash In 2019 public institutions enrolled 109 million students and received $808 billion in general operating support ($7388 per FTE student)
NATIONAL TRENDS IN STATE GRANT AID
Using data collected from the National Association of State Student Grant and Aid Programs (NASSGAP) annual survey we find that state support for student grant aid is less correlated with the economic cycle Since 2001 state grant aid has
bull Increased approximately 72 in inflation-adjusted dollars with over $123 billion awarded in the most recent year
bull Increased in every year throughout this time period with the exception of a slight decrease during the 2012 fiscal year
Grant aid programs are more targeted than general operating appropriations Many state financial aid programs are primarily need-based or at least have a need-based component however in recent years non-need-based programs have proliferated Trends in need-based and non-need-based aid between 2001-2019 show
bull The proportion of need-based grant aid awarded oscillates between 70 and 77 with the $91 billion awarded on the basis of need in 2019 representing approximately 74 of the share of state grant aid
SHEEO INVESTIGATING THE IMPACTS OF STATE HIGHER EDUCATION APPROPRIATIONS AND FINANCIAL AID9
copy 2021 by the State Higher Education Executive Officers Association (SHEEO)
bull The amount of need-based grant aid increased 69 while non-need-based grant aid increased at a rate of almost 83 albeit from a much lower base ($18 vs $54 billion)
COMPARISON OF TRENDS IN GENERAL APPROPRIATIONS AND FINANCIAL AID
Unlike general operating appropriations which increase and decrease in tandem with the business cycle state aid per FTE on a national basis has steadily increased independent of broader economic trends As a result state financial aid increased from 44 to 99 of all public education appropriations (a broad measure of state and local support) between 2001 and 2019
State-level trends support the national picture (on a per-FTE basis after adjusting for inflation) Between 2001 and 2019
bull 29 states decreased general operating appropriations but increased financial aid allocations
bull 11 states decreased general operating and financial aid appropriations
bull 5 states increased both general operating and financial aid appropriations
bull 2 states increased general operating appropriations but decreased financial aid allocations
bull 2 states decreased general operating appropriations and held financial aid allocations flat
bull 1 state held general operating appropriations flat but decreased state financial aid allocations
PRIOR LITERATURE ON THE EFFECTS OF STATE APPROPRIATIONS
To quantify the effects of state appropriations we identified and systematically reviewed 81 studies that examined how changes in state appropriations affect student outcomes From this literature review we identified the following key findings
GENERAL OPERATING APPROPRIATIONS AFFECT TUITION AND EXPENDITURE
ALLOCATIONS
Public institutions respond to declines in state appropriations in two main ways
CHANGES IN TUITION REVENUE
bull Public four-year institutions increase tuition to offset reductions in state apportions however these increases are not large enough to entirely offset the state funding reductions (Webber 2017)
bull Institutions raise tuition revenue by increasing out-of-state and international enrollments (Jaquette amp Curs 2015)
bull This strategy of raising alternative revenues is most prevalent at doctoral institutions (especially state flagship universities) followed by masterrsquos and bachelorrsquos institutions (Bound et al 2019 Jaquette amp Curs 2015)
bull The evidence is mixed on whether two-year colleges respond to state appropriation declines by increasing tuition (Goodman amp Volz 2020 Zhao 2018a)
SHEEO INVESTIGATING THE IMPACTS OF STATE HIGHER EDUCATION APPROPRIATIONS AND FINANCIAL AID10
copy 2021 by the State Higher Education Executive Officers Association (SHEEO)
CHANGES IN INSTITUTIONAL EXPENDITURES
bull Institutions that are unable to raise tuition and fees to the extent needed to offset state funding reductions respond by decreasing expenditures The largest impact is on education and related expenditures essential for student success (ie instruction academic support and student services) (Deming amp Walters 2018)
bull Reducing educational expenditures is most prevalent at two-year institutions and least common at doctoral institutions (Zhao 2018a) Since research universities have a wider range of alternative revenue sources (eg increasing tuition increasing enrollment of out-of-state students) community colleges experience the most detrimental cuts to institutional expenditures
GENERAL OPERATING APPROPRIATIONS AFFECT STUDENT OUTCOMES
The research shows clear relationships between state higher education funding and student outcomes As states seek to improve educational attainment rates and close equity gaps these findings suggest state funding has an important role in these efforts
ENROLLMENT OUTCOMES
bull Decreases in state appropriations lead to decreased in-state undergraduate enrollment with these effects lasting several years Additionally increases in state funding lead to increases in enrollment (Trostel 2012)
bull Enrollment is not impacted equally across all types of institutional control following state funding reductions students who would likely have enrolled at a public institution choose to enroll at a for-profit institution (Goodman amp Volz 2020)
bull Some public four-year institutions (predominantly research universities) respond to state appropriation reductions by increasing their enrollment of out-of-state undergraduate students and decreasing the share of low-income and underrepresented minority students (Jaquette et al 2016) which suggests reductions in state funding may induce institutions to shift their focus away from serving underrepresented students of color and toward students with the ability to pay the most tuition
GRADUATION RATES AND COMPLETIONS
bull The research overwhelmingly finds evidence that cutting state appropriations leads to detrimental credential outcomes both in graduation rates and the quantity of credentials awarded (Bound et al 2019 Zhao 2018a)
bull Community colleges experience the most detrimental impact to their degree productivity in part because these institutions are unable to increase tuition and must endure the bulk of the impact of state appropriation cuts in the form of decreased education expenditures
bull Increases in state appropriations help shorten time to degree among students attending four-year institutions and increase the likelihood of community college students transferring to four-year institutions (Chakrabarti et al 2020)
SHEEO INVESTIGATING THE IMPACTS OF STATE HIGHER EDUCATION APPROPRIATIONS AND FINANCIAL AID11
copy 2021 by the State Higher Education Executive Officers Association (SHEEO)
POST-COLLEGIATE OUTCOMES
Changes in state appropriations have impacts that extend beyond college success The results below represent outcomes for students in their 20s and 30s
bull For students beginning at both two- and four-year institutions experiencing an increase in state appropriations while enrolled decreased the probability of ever originating a student loan For students enrolled at two-year institutions the increase in appropriations also decreased the likelihood of having a student loan in default or delinquent status (Chakrabarti et al 2020)
bull For students who started at a two-year institution experiencing an increase in state appropriations while enrolled led to an increased likelihood of having an auto loan a lower likelihood of having delinquent car debt an increased credit score and an increased adjusted gross income by zip code of residence (Chakrabarti et al 2020)
GENERAL OPERATING APPROPRIATIONS ARE INEQUITABLY DISTRIBUTED
Key themes throughout the literature are the large variation between institution types in baseline amounts of state appropriations received institutional responses to changes in state appropriations and the effects of these changes Public two-year institutions and open-access four-year institutions which serve the bulk of underrepresented students of color (defined as American IndianAlaska Native Black Latinx and Native Hawaiian or Other Pacific Islander) receive the lowest amount of funding and experience the most adverse effects of funding cuts (Ahlman 2019 Hillman 2020 Carnevale amp Strohl 2013) These institutions are also often the most reliant on state funding and therefore would be disproportionately impacted by across-the-board state funding cuts Conversely doctoral universities which typically have the most resources disproportionately educate the most advantaged (full-time white affluent) students (Mugglestone et al 2019) These patterns suggest that the funding disparities between institution types may not only be unequal but inequitable as well
PRIOR LITERATURE ON THE EFFECTS OF STATE GRANT AID
The literature quantifying the effects of grant aid on student outcomes has grown considerably in recent decades and is more developed than research on state appropriations After our systematic literature search we identified 91 studies for review
States have developed a wide variety of financial aid programs that target different students Many of the initial state aid programs established in the 1960s and 1970s included a need-based component that targeted aid toward lower-income students Broad-based merit-aid programs which became popular in the 1990s and 2000s were ostensibly developed to keep the best and brightest students in state and provide high school benchmarks for all students to attain but much of this aid flows to students from wealthier families More recently states have developed promise programs intended to provide universal access to at least the two-year sector Many of these newer promise programs also include a minimal merit component andor income caps to help keep costs down and better target aid
SHEEO INVESTIGATING THE IMPACTS OF STATE HIGHER EDUCATION APPROPRIATIONS AND FINANCIAL AID12
copy 2021 by the State Higher Education Executive Officers Association (SHEEO)
POLICY DESIGN MATTERS FOR STUDENT BEHAVIOR AND STATE GOALS
Because the choice of program will dictate which students receive state aid it is important for states to ensure their aid programs reinforce state goals While there is evidence that merit-aid programs are successful in keeping the target student population in the state while they are enrolled the evidence also suggests merit programs do little to increase state-specific postsecondary attainment rates as many merit-aid recipients leave the state after graduation (Fitzpatrick amp Jones 2016 Sjoquist amp Winters 2013 Sjoquist amp Winters 2014) Consequently a need-based program or promise program that includes student supports may be more effective at reaching students who would not otherwise attend a postsecondary institution and thus be more effective at raising state educational attainment levels Likewise programs that are easily understood widely publicized and paired with critical student supports have been shown to be effective in positively impacting student outcomes (Angrist et al 2020 Carruthers amp Fox 2016 Gurantz 2018 Miller et al 2020 Page et al 2019b) With limited resources to allocate to financial aid states will need to think carefully about how their financial aid allocations support progress toward achieving state goals
SIMULATED IMPACTS OF STATE APPROPRIATIONS AND FINANCIAL AID
State appropriations and financial aid likely work together to improve student outcomes and in reality states must consider the relative impacts of each funding strategy and make decisions regarding both appropriations and grant aid in concert We use the research findings to simulate the impacts of increased general operating appropriations (often conceptualized as increased institutional resources or spending) and the impacts of state-funded student financial aid programs These simulations are intended to provide context and real numbers for the findings discussed in our literature review
SIMULATION 1 WHAT IS GAINED BY INVESTING IN HIGHER EDUCATION THROUGH
OPERATING SUPPORT
For this simulation we use the results from Deming and Walters (2018) and assume a consistent effect in all states to estimate an across-the-board $1000 per FTE change in state appropriations on overall outcomes at the US level At public two-year institutions a $1000 increase in state funding per FTE would result in 216029 more associate degrees being awarded in the following year and 216623 more associate degrees awarded two years later At public four-year institutions the same $1000 increase in state appropriations per FTE would result in an estimated 75046 more bachelorrsquos degrees awarded two years later and 73738 more bachelorrsquos degrees awarded three years later
SIMULATION 2 WHAT IS GAINED BY INVESTING IN HIGHER EDUCATION THROUGH
FINANCIAL AID
We rely upon Nguyen et alrsquos (2019) evaluation of the impact of merit- and need-based aid on persistence and degree completion to project what a change in financial aid spending may mean for degree production in the United States Due to data limitations we use national Pell Grant cohort data to conduct the simulation An increase of $1000 per student in grant aid would result in around 11000 additional credentials among Pell Grant recipients in four-year public institutions each year and between 8000 and 9500 additional credentials among Pell Grant recipients in public two-year institutions
SHEEO INVESTIGATING THE IMPACTS OF STATE HIGHER EDUCATION APPROPRIATIONS AND FINANCIAL AID13
copy 2021 by the State Higher Education Executive Officers Association (SHEEO)
POLICY RECOMMENDATIONS
We conclude with several finance policy solutions that states and the federal government can adopt to support their efforts to reach state postsecondary attainment goals and close equity gaps in degree attainment and college completion
STATE POLICY
At the state level policy decisions frequently come down to the amount of funding available States rarely have adequate budget resources to fully fund every priority and the decisions states make about how to allocate scarce resources can propel progress toward achieving postsecondary goals or create unintended roadblocks that derail progress toward these goals
1 Increase State Support While we recognize that significant increases in state support for institutions are not likely in the next year or two states should invest more in their public institutions when possible States are not likely to see significant gains in their postsecondary completion numbers and attainment rates without increased investment in their institutions As the literature reviewed attests and as shown in our simulations such investments are likely to pay significant dividends through increased enrollment persistence and completions The overall increase in educational attainment that comes with state investment in their institutions will help states meet dynamic workforce needs of the post-pandemic economy provide many additional societal benefits (McMahon 2009) and increase state income tax revenue (Chakrabarti 2020) Likewise most studies we reviewed consistently point toward additional financial aid dollars influencing student behavior Moreover the dollars invested in these programs have a large return on investment for state and federal governments through increased student persistence and credential attainment as well as increased income tax revenue (Anderson 2020 Denning et al 2019) Because the form that general operating and financial aid appropriations come in and the overall purposes of both strategies vary it is difficult if not impossible to determine the appropriate ratio of total higher education funding each should receive However because state operating appropriations serve to support the entire mission of institutions contribute to the overall quality of the education experience and directly impact student access and success support for state financial aid programs should not come at the expense of general operating support
2 State Funding Equity Audit In a recent report Hillman (2020) proposes that policymakers should consider conducting funding equity audits in order to understand current trends in state funding gaps in funding between institution types and how these patterns overlap with race- and income-based patterns of student enrollment While there are significant challenges to isolating the instructional spending at institutions as Hillman recommends the exercise could still provide new and useful information for policymakers to consider Hillman stresses that states should be transparent about the results of these audits and make the audits widely accessible to the public Readers interested in learning more about what a state funding equity audit might look like and how policymakers could use such an audit to address current funding inequities in their states should read Hillmanrsquos recent Third Way report2
2 Hillman N (2020) Why rich colleges get richer amp poor colleges get poorer The case for equity-based funding in higher education Third Way httpswwwthirdwayorgreportwhy-rich-colleges-get-richer-poor-colleges-get-poorer-the-case-for-equity-based-funding-in-higher-education
SHEEO INVESTIGATING THE IMPACTS OF STATE HIGHER EDUCATION APPROPRIATIONS AND FINANCIAL AID14
copy 2021 by the State Higher Education Executive Officers Association (SHEEO)
3 Adjust Funding to Promote Equity Completions and Attainment Ensure institutions that serve the bulk of underrepresented students of color and low-income students are funded appropriately and attempt to correct historical underfunding Funding allocation models should promote access and success for underrepresented students States should adjust their funding allocation strategies to be consistent with articulated state goals of reducing equity gaps and increasing educational attainment Prioritizing increases to the base allocation for institutions serving the statersquos priority populations (eg students of color low-income students and adult learners) will help achieve these goals
4 Alternative Revenues Matter Decreases in state appropriations lead to cuts in institutional spending on services essential for student success (eg instruction academic support student services) Since public four-year institutions particularly research universities have a wider range of alternative revenue sources (eg increasing tuition increasing enrollment of out-of-state students) community colleges experience the most detrimental cuts to institutional expenditures as a result of declining state appropriations States should consider all institutional revenues and make strategic decisions regarding state appropriations in concert with decisions about tuition rates and out-of-state tuition caps
5 Financial Aid Messaging Matters There is currently a tradeoff between targeting financial aid funds to those who would be most influenced by receiving additional aid dollars (eg low-income students) and the messaging of simple eligibility requirements (eg state and local promise programs) It may behoove states who are able to fully or mostly fund their need-based financial aid to invest resources in marketing the program to students who have traditionally been unaware of state and even federal aid In fact research by Gurantz (2018) suggests these types of initiatives for targeted aid can be successful
6 Student Supports Matter The financial aid programs that are most successful invest in aid dollars as well as in supports for students For instance in Tennessee the free college program conveys a simple message to state residents and provides support for students considering college through governmental agencies as well as with significant support from philanthropic organizations Other programs with successful track records such as the Dell Scholars program invest significant time and money into their students (Page et al 2019b) as do the Susan Thompson Buffett Foundation in Nebraska (Angrist et al 2020) and the ASAP program in a number of states (Miller et al 2020)
FEDERAL POLICY
While this paper focuses on state funding and policy the federal government has had an increasing role in higher education finance and is uniquely positioned to provide stabilizing support and incentives for states to increase funding for higher education We propose two potential federal solutions to the problems discussed in this paper
1 A Federal-State Partnership for College Affordability The economic impact of the coronavirus pandemic has already resulted in increasingly strained state budgets and unlike at the federal level states do not have the ability to run a deficit with their budgets The two levels of government can share financial responsibility for increasing government investment in higher education and making college more affordable for low-income students Tandberg et al (2017) have proposed a measure of affordability and a federal-state partnership with this goal in mind Under this proposal any
SHEEO INVESTIGATING THE IMPACTS OF STATE HIGHER EDUCATION APPROPRIATIONS AND FINANCIAL AID15
copy 2021 by the State Higher Education Executive Officers Association (SHEEO)
additional state funding given to support low-income students would be matched with federal funds with a goal of students devoting no more than 10 of their discretionary income toward student loan repayment Readers interested in learning more about what this federal-state partnership might look like should read their proposal3
2 Title I-Type Program for Higher Education The federal Title I program provides K-12 schools serving a large proportion of low-income students with additional funding for extra educational services A parallel grant program could be designed for higher education with eligibility determined based on serving a large sharenumber of low-income students or a combination of income- and raceethnicity-based eligibility thresholds Current K-12 Title I programs require that federal dollars supplement rather than replace state and local funding and a similar requirement could be written into a higher education Title I program Readers interested in learning more about what a potential design of such a program might look like should read Third Wayrsquos (Hiler amp Whistle 2018) proposed program design4
3 Tandberg D Laderman S amp Carlson A (2017) A federal-state partnership for true college affordability State Higher Education Executive Officers Association httpssheeoorgwp-contentuploads201903Federal-State_Partnership_for_True_College_Affordabilitypdf
4 Hiler T amp Whistle W (2018) Creating a ldquoTitle Irdquo for higher ed Third Way httpswwwthirdwayorgmemocreating-a-title-i- for-higher-ed
SHEEO INVESTIGATING THE IMPACTS OF STATE HIGHER EDUCATION APPROPRIATIONS AND FINANCIAL AID16
copy 2021 by the State Higher Education Executive Officers Association (SHEEO)
INTRODUCTION
Public higher education which educates approximately 75 of all postsecondary students5 is in the midst of cuts in state funding as the economic impact of the COVID-19 pandemic wreaks havoc on state budgets The majority of states have failed to recover funding for higher education since the last major economic downturn the Great Recession of 2008 After more than $2000 in per-student funding reductions during the Great Recession inflation-adjusted average per-student educational appropriations (the sum of general operating appropriations to institutions and state financial aid awards to students) in 2019 were $8196 87 below their pre-recession level6 More than a decade after the start of the Great Recession this pandemic and its effects on state budgets likely marks the end of the seven straight years of per full-time equivalent (FTE) increases in education appropriations and the start of a new set of substantial cuts to public higher education funding that may take decades to recover from
We have already begun to feel the economic impact of the pandemic on higher education funding Early evidence shows that state tax appropriations declined 18 percent from 2020 to 2021 not accounting for inflation7 For context higher education funding often serves as a ldquobalance wheelrdquo in state budgets (Hovey 1999 Delaney amp Doyle 2011) which means that in economic downturns such as those following the dot-com bubble in 20018 and the Great Recession in 2008 higher education funding takes a back seat to other areas with constitutionally required or federally matched funding such as K-12 education and Medicaid The deprioritization of higher education as a state budget priority appears to be occurring once again as many states made midyear cuts to their higher education spending as they grapple with how to mitigate budget shortfalls driven by the pandemic9
The pandemic has also led to public colleges and universities losing revenue from decreased fundraising and typical auxiliary revenues such as summer camps The shift to online learning during the spring 2020 semester led to both increasing costs and loss of revenue as institutions provided students with refunds on unused campus services such as dining plans and student housing During the summer 2020 semester institutions lost nearly all auxiliary revenue from camps events and other programming that they have become dependent on to help fund their operations Likewise they spent a considerable amount of money on technology and protective measures in preparing for the fall The fall 2020 semester continued this pattern of increased costs and decreased revenue Perhaps most critical and unlike past recessions enrollments have not increased but are actually lower on average with the largest declines experienced at community colleges Among first-time students higher education saw a substantial decline of 13 Community colleges had the steepest decline (-189) followed by public four-year colleges (-105) (National Student Clearinghouse 2020)
5 Based on authorsrsquo calculation of IPEDS data
6 This is part of a longer trend ndash appropriations per student are $2000 below 2001 levels before the dot-com bubble
7 Laderman S amp Tandberg D (2021) SHEEO analysis of fiscal year 2021 state funding for higher education State Higher Education Executive Officers Association httpssheeoorgwp-contentuploads202103SHEEO_Analysis_FiscalYear2021_State_Fundingpdf
8 For a more in-depth account of the dot-com bubble please see httpswwwnberorgsystemfileschaptersc0124c0124pdf
9 See examples in Missouri (httpswwwkansascitycomnewspolitics-governmentarticle243172006html) and Colorado (httpscochalkbeatorg202051921264509lawmakers-cut-58-percent-from-colorado-public-colleges-3-3-billion-budget-hole)
SHEEO INVESTIGATING THE IMPACTS OF STATE HIGHER EDUCATION APPROPRIATIONS AND FINANCIAL AID17
copy 2021 by the State Higher Education Executive Officers Association (SHEEO)
With the decline in other revenue sources state funding for public higher education may be more important now than ever States invest in public higher education in two primary ways through direct funds to institutions (general operating support) and direct funds to individuals who can then choose which in-state institution to take those dollars to10 (student financial aid) On a per-student level support for public higher education has declined over time In addition the relative size of these two components of state support have changed over time State student financial aid per-FTE has increased 341 since the start of the Great Recession and is now at an all-time high comprising 99 of total state support11 In contrast general operating support dropped substantially at the start of the Great Recession and remains 118 below pre-recession levels There is substantial heterogeneity between states in the amount and distribution of state investment in higher education as well as in the degree to which states have recovered from cuts made during the Great Recession
Both sources of state funding are important factors in educating todayrsquos students Student financial aid has been shown to directly impact student access (the likelihood of the student enrolling in college at all) and choice (where the student enrolls) (Bruce amp Carruthers 2014 Cohodes amp Goodman 2014 Castleman amp Long 2016) Financial aid has been shown to increase college completion and attainment in some states (Dynarski 2008 Scott-Clayton 2011 Zhang Hu amp Sensenig 2013) but not in others (Welch 2014 Sjoquist amp Winters 2015) General operating appropriations are a critical resource that public institutions rely on to fund the education and direct services students receive and make the price of attending college more affordable to state residents The weak recovery of and anticipated future cuts to state higher education general operating funds are worrisome since this general institutional funding is directly tied to what students learn and experience while they are enrolled and ultimately the likelihood of their successful completion (Deming amp Walters 2018 Bound et al 2019)
HISTORICAL CONTEXT
The effort to determine the ideal structure of public funding for higher education is not new but has shifted focus in the face of an overall declining reliance on state support for public institutional revenues In the late 1960s and into the 1970s researchers and policymakers were concerned that using state dollars to broadly fund higher education was regressive as students from higher income families still disproportionately attended college and families across the income spectrum funded state subsidies (Hansen amp Weisbrod 1969 Peltzman 1973)
In the 1980s the choice between general operating appropriations and state financial aid was framed as a debate between two schools of thought (Hearn amp Longanecker 1985) Traditionalists advocated for broad public subsidies through general operating appropriations based on a belief that the public benefits of a public system of higher education justified the costs while revisionists argued that because there are both public and private (individual) benefits to higher education the public and individuals should share the cost Additionally revisionists focused on establishing the most efficient use of state funds to generate desired outcomes (Hearn amp Longanecker 1985) By the 1990s this debate had reached ldquoalmost mythic proportionsrdquo (Hossler et al 1997 p 162)
10 States vary in the restrictions of state student financial aid Some states such as Tennessee and Florida allow students to use these funds at in-state public or private institutions whereas other states such as New York restrict these funds to in-state public schools only
11 Calculations based on the State Higher Education Finance (SHEF) 2019 report State student financial aid per-FTE excludes financial aid to students attending out-of-state institutions (less than 1 of all state financial aid) Total state support is the sum of American Recovery and Reinvestment Act (ARRA) funds tax appropriations non-tax support non-appropriated support state-funded endowment earnings and other state funds net of any funds not available for use
SHEEO INVESTIGATING THE IMPACTS OF STATE HIGHER EDUCATION APPROPRIATIONS AND FINANCIAL AID18
copy 2021 by the State Higher Education Executive Officers Association (SHEEO)
Advocates of the two funding models discussed theoretical economic trade-offs but little evidence existed on the extent to which the funding structure mattered for states and students (Hossler et al 1997)
Empirical interest in the trade-offs between allocating state funding to institutions versus students waned in the early 2000s State funding began to decline following the 2001 recession and has never fully recovered (Laderman amp Weeden 2020) Tuition rates and revenues increased in response and the attention of many researchers and advocates turned to these concerns Much of the research reviewed in this paper focused exclusively on either appropriations or grant aid rather than discussing the relative advantages of the two
CURRENT CONTEXT
Nationally we face a shortage of workers with postsecondary degrees and high-quality credentials as well as a growing wage gap between those with and without a postsecondary education (Hershbein Kearney amp Pardue 2020 Lumina Foundation 2019) Most states have specific attainment goals to reduce these shortages both to ensure that their workforce has the skills needed for an increasingly technical labor market and to address individual-level income inequality To reach these goals states not only need to get more residents in the doors of postsecondary institutions they also need to focus on providing the financial support needed to increase the proportion of postsecondary students who successfully complete degrees and high-quality credentials Further states must continue to or start prioritizing reducing raceethnicity- and socioeconomic-based attainment and completion gaps that exist due to higher educationrsquos history of excluding and underserving specific populations of students12 States must think critically about which students and institutions are likely to be most harmed by this economic downtown including students from lower-income families and historically minoritized students as well as regional public universities and community colleges and how they can best support these groups While raceethnicity-based equity gaps have been declining in some states they are growing in many others13 States need to remain attentive to how they can invest their higher education dollars to ensure that these gaps start or continue to shrink rather than grow
Many of the resources that can help move the needle on increasing overall completion rates and decreasing equity gaps rely on states providing institutions with adequate general operating support With students and families questioning the quality of the fully online and hybrid approaches that many state institutions implemented in fall 2020 and continued through spring 2021 due to the pandemic institutions have had limited ability to react to decreasing state investment with an increase in tuition and fees a strategy often utilized by institutions in the past In this context state appropriations will be crucial to public institutionsrsquo ability to provide students with a quality and affordable education
12 See Lorelle L Espinosa Jonathon M Turk Morgan Taylor and Hollie M Chessman Race and ethnicity in higher education A status report ( 2019) American Council on Education httpswwwequityinhigheredorg Suzanne Kahn Mark Huelsman and Jen Mishory Bridging progressive policy debates How student debt and the racial wealth gap reinforce each other September 2019 The Roosevelt Institute The Century Foundation and Demos httpstcforgcontentreportbridging-progressive-policy-debates-student-debt- racial-wealth-gap-reinforce
13 See Andrew Howard Nichols and J Oliver Schak Degree attainment for Black adults National and state trends 2017 The Education Trust httpsedtrustorgresourcenational-state-trends-degree-attainment-black-adults and Andrew Howard Nichols and J Oliver Schak Degree attainment for Latino adults National and state trendsrdquo 2017 The Education Trust httpsedtrustorgresourcenational-state-trends-in-degree-attainment-latino-adults
SHEEO INVESTIGATING THE IMPACTS OF STATE HIGHER EDUCATION APPROPRIATIONS AND FINANCIAL AID19
copy 2021 by the State Higher Education Executive Officers Association (SHEEO)
The paper is organized as follows First we discuss the current and historical context of state support for higher education Next is a summary of literature related to the impact of each of the two main state higher education funding sourcesmdashdirect operating support and student financial aidmdashon student success This is followed by a comparison of the relative impact of each of these funding sources including simulations using elasticities from the literature review We end by charting a path forward that calls for adequate state-sponsored direct support for public postsecondary institutions We find clear evidence in the extant literature that increased financial resourcesmdashspecifically increased state general operating and student financial aidmdashare directly tied to student success in higher education The overarching aim of this paper is to provide evidence of the importance of states investing directly in their public institutions through general operating support in order to maintain funding for crucial services that support students and to prevent large increases in tuition As states struggle to reconcile how they will afford to provide adequate funding to higher education institutions amidst a pandemic we urge states to think critically about the cost of failing to do so
SHEEO INVESTIGATING THE IMPACTS OF STATE HIGHER EDUCATION APPROPRIATIONS AND FINANCIAL AID20
copy 2021 by the State Higher Education Executive Officers Association (SHEEO)
CURRENT AND HISTORICAL CONTEXT OF STATE SUPPORT FOR HIGHER EDUCATION
PURPOSE OF STATE FUNDING FOR HIGHER EDUCATION
State governments created and funded public higher education institutions to improve the social and economic well-being of their residents (Enders amp Jongbloed 2007 Singh 2012 Williams 2016) The public benefits of higher education include increasing voting rates and democratic engagement supporting local communities reducing crime and health-care costs reducing poverty and reliance on government funding reducing income inequality increasing state tax revenues and providing an educated workforce and producing research that benefits society (Dee 2004 Chetty et al 2017 Kezar 2005 Lochner 2004 London 2006 Ma et al 2019b Saltmarsh amp Hartley 2011 Singh 2012 Trostel 2010 Williams 2016) The public benefits of higher education line up with the purpose of state funding States fund institutions to develop an educated workforce and improve their economies develop local communities and ensure access to education for all citizens regardless of their life circumstances (Colorado Department of Higher Education nd HECC nd Lingenfelter 2018 Rhode Island Office of the Postsecondary Commissioner nd Virginia Advisory Legislative Council 1955) In the following section we discuss trends in state funding for higher education set within this context of the numerous public benefits and purposes of higher education
NATIONAL TRENDS IN APPROPRIATIONS FOR GENERAL OPERATIONS
As the balance wheel for state budgets (Delaney amp Doyle 2011) general operating appropriations at public institutions follow the trends of the economic cycle as shown in Figure 1 General operating appropriations consist of state and local tax- and non-tax appropriations to public institutions excluding student financial aid and any funds allocated to non-credit or continuing education research agricultural extension and medical programs During economic recessions state general operating appropriations decline for two reasons States cut higher education appropriations andor states are unable to increase appropriations alongside inflation and rapid increases in student enrollment (which occurs during recessions) In 2001 the earliest year for which data are available general operating support totaled $826 billion after adjusting for inflation (Table 1) These funds served 86 million full-time equivalent (FTE) enrolled students in 2001 resulting in an average appropriation of $9547 per FTE for public colleges and universities Appropriations declined both in total and on a per-student basis in the early 2000s following a small recession reaching a low of $759 billion or $7666 per FTE in 2005 After three short years of economic recovery the Great Recession led to the largest and steepest decline in general operating appropriations for public institutions while enrollment rapidly increased Enrollment increased 129 from 102 million in 2008 to 115 million in 2012 (Table 1) During this same time frame general public operating appropriations declined from $856 billion or $8377 per FTE to an all-time low of $713 billion or $6176 per FTE General operating appropriations were supplemented by federal American Reinvestment and Recovery Act (ARRA) funds from 2009 through 2012 but these funds (shown in Figure 1) did not fully mitigate the impacts of state and local funding declines during the Great Recession
SHEEO INVESTIGATING THE IMPACTS OF STATE HIGHER EDUCATION APPROPRIATIONS AND FINANCIAL AID21
copy 2021 by the State Higher Education Executive Officers Association (SHEEO)
Since the low point in 2012 general operating support has increased incrementally to $808 billion in 2019 and student enrollment has declined 52 resulting in a 2019 per-student general operating appropriation of $7388 On a national level general operating funding in 2019 remains 118 below 2008 levels and 226 below 2001 on a per-student basis On average public institutions in 2019 received an inflation-adjusted $2160 less in state and local general operating appropriations per FTE student than in 200114
TABLE 1 IMPACT OF INFLATION AND ENROLLMENT ON STATE GENERAL PUBLIC OPERATING APPROPRIATIONS AND FTE ENROLLMENT IN KEY YEARS US 2001-2019
FY GENERAL OPERATING
UNADJUSTEDHECA INFLATION
ADJUSTMENTGENERAL OPERATING INFLATION ADJUSTED
FULL-TIME EQUIVALENT (FTE)
ENROLLMENT
GENERAL OPERATING PER FTE INFLATION
ADJUSTED
2001 $53457884356 06473 $82588627711 8650554 $9547
2008 $69311140425 08097 $85604396401 10218587 $8377
2012 $62017677800 08681 $71438567443 11546001 $6187
2019 $80783615453 10000 $80783615453 10934890 $7388
NOTES 1 Key years shown in this table are pre-recession high points in state funding (2001 and 2008) the all-time low point in
per-student funding during the last recession (2012) and the latest available data (2019) 2 General operating is the portion of state and local support appropriated directly to public institutions for the purposes
of general operations3 Full-time equivalent (FTE) enrollment converts student credit hours to full-time academic year students but excludes
medical students4 Constant dollars adjusted by the Higher Education Cost Adjustment (HECA)
SOURCE State Higher Education Executive Officers Association State Higher Education Finance Data (httpsshefsheeoorg)
14 Recent reports have used SHEEOrsquos data to question whether state funding for higher education has truly declined over time State higher education finance data can be looked at in many ways (per FTE per capita as a percentage of state budgets including or excluding certain funds using different inflation adjustments and in comparison to different points in history) Most reasonable analyses show a state funding decline but data can be cherry-picked to support a different narrative for those with an agenda Readers curious about the veracity of these claims can find additional information in Appendix B
SHEEO INVESTIGATING THE IMPACTS OF STATE HIGHER EDUCATION APPROPRIATIONS AND FINANCIAL AID22
copy 2021 by the State Higher Education Executive Officers Association (SHEEO)
FIGURE 1STATE GENERAL PUBLIC OPERATING APPROPRIATIONS PER FTE AND FTE ENROLLMENT (CONSTANT $) US 2001-2019
0
2
4
6
8
10
12
14
$-
$1000
$2000
$3000
$4000
$5000
$6000
$7000
$8000
$9000
$100002
00
1
20
02
20
03
20
04
20
05
20
06
20
07
20
08
20
09
20
10
20
11
20
12
20
13
20
14
20
15
20
16
20
17
20
18
20
19
NE
T F
TE
EN
RO
LLM
EN
T M
ILLI
ON
S
DO
LLA
RS
PE
R F
TE
GENERAL PUBLIC OPERATING PER FTE ARRA PER FTE FTE ENROLLMENT
$9
54
7
$9
15
2
$8
40
5
$7
793
$7
68
6
$8
08
2
$8
22
8
$8
377
$7
52
2
$6
74
9
$6
55
4
$6
176
$6
29
6
$6
65
3
$6
92
0
$7
09
7
$7
271
$7
22
4
$7
38
8
NOTES
1 General operating is the portion of state and local support appropriated directly to public institutions for the purposes of general operations
2 Federal American Reinvestment and Recovery Act (ARRA) revenue was provided during the Great Recession to stabilize state and local sources of revenue for higher education
3 Full-time equivalent (FTE) enrollment converts student credit hours to full-time academic year students but excludes medical students
4 Constant dollars adjusted by the Higher Education Cost Adjustment (HECA)
SOURCE State Higher Education Executive Officers Association State Higher Education Finance Data (httpsshefsheeoorg)
With each recession declines in state support per FTE have grown steeper and recoveries have become slower and less complete Figure 2 shows the trend in state funding since the start of each of the last four economic recessions Due to data limitations in years before 2001 these data include general operating appropriations and state financial aid to public institutions However general operating appropriations are shown for the two most recent recessions and have very similar (albeit more negative) trends in total education appropriations
SHEEO INVESTIGATING THE IMPACTS OF STATE HIGHER EDUCATION APPROPRIATIONS AND FINANCIAL AID23
copy 2021 by the State Higher Education Executive Officers Association (SHEEO)
FIGURE 2CHANGE IN EDUCATION APPROPRIATIONS PER FTE FOLLOWING ECONOMIC RECESSIONS (CONSTANT $) US 1980-2019
10
3
-35
-30
-25
-20
-15
-10
-5
0
5
10
15
198
0
198
1
198
2
198
3
198
4
198
5
198
6
198
7
198
8
198
9
199
0
199
1
199
2
199
3
199
4
199
5
199
6
199
7
199
8
199
9
20
00
20
01
20
02
20
03
20
04
20
05
20
06
20
07
20
08
20
09
20
10
20
11
20
12
20
13
20
14
20
15
20
16
20
17
20
18
20
19
-8
-11-11
-14
EDUCATION APPROPRIATIONSRECESSION GENERAL OPERATING
PE
RC
EN
T C
HA
NG
E
NOTES
1 Cumulative percentage change calculated since the start of each recession (1980 1990 2001 and 2008)
2 Education appropriations include general operating support and state financial aid to students attending public institutions General operating is the portion of state and local support appropriated directly to public institutions for the purposes of general operations Both measures include Federal American Reinvestment and Recovery Act (ARRA) revenue provided during the Great Recession to stabilize state and local sources of revenue for higher education
3 Full-time equivalent (FTE) enrollment converts student credit hours to full-time academic year students but excludes medical students
4 Constant dollars adjusted by the Higher Education Cost Adjustment (HECA)
SOURCE State Higher Education Executive Officers Association State Higher Education Finance Data (httpsshefsheeoorg)
STATE TRENDS IN APPROPRIATIONS FOR GENERAL OPERATIONS
National figures mask considerable variation in general operating appropriations across states On a per-FTE basis and after adjusting for differences in cost of living enrollment mix across institution types and inflation general operating appropriations in 2019 ranged from $2449 in Vermont to $17506 in Wyoming The US average is enrollment weighted meaning that larger states such as California New York and Texas with higher than average appropriations disproportionately impact the US average As a result 32 states had below average general operating appropriations in 2019
In addition 42 states have had declines in per-FTE funding since 2001 and public institutions in 40 states received less funding per FTE than in 2008 (after adjusting for inflation) In 14 states general operating appropriations failed to recover at all after the Great Recession and remain below 2012 levels (Appendix A Table 1) Changing trends in general operating appropriations across time are shown in Figure 3 which shows the percentage change and changing dollar amount in inflation-adjusted general operating appropriations per FTE since 2001
SHEEO INVESTIGATING THE IMPACTS OF STATE HIGHER EDUCATION APPROPRIATIONS AND FINANCIAL AID24
copy 2021 by the State Higher Education Executive Officers Association (SHEEO)
FIGURE 3CHANGE IN STATE GENERAL OPERATING APPROPRIATIONS FY 2001-2019 BY STATE
-26
10
45
-40-23
-9-34
-29
-38
-26
21 -41
-43
-36-48
-46
-23
-36
-29
-39
-45
1
-22-20
22
10
-18
11
-35
-45
-20
-53
-39
-29
-21
-18
-10
-30
-28
-43
-37-16
-35
-31
-46
-40
-16
-41
-37
35
NOTES
1 General operating is the portion of state and local support appropriated directly to public institutions for the purposes of general operations Both measures include Federal American Reinvestment and Recovery Act (ARRA) revenue provided during the Great Recession to stabilize state and local sources of revenue for higher education
2 Full-time equivalent (FTE) enrollment converts student credit hours to full-time academic year students but excludes medical students
3 Constant dollars adjusted by the Higher Education Cost Adjustment (HECA)
SOURCE State Higher Education Executive Officers Association State Higher Education Finance Data (httpsshefsheeoorg)
SECTOR-LEVEL TRENDS IN APPROPRIATIONS FOR GENERAL OPERATIONS15
Figure 4 shows sizable differences in the sources and levels of general operating support16
between two-year and four-year institutions The first major difference is in each sectorrsquos reliance on local appropriations In 2017 local appropriations accounted for 42 of general operating appropriations at two-year colleges a 9 percentage-point increase since 2001 After adjusting for inflation local appropriations per FTE were $2783 in 2017 approximately $740 more than in 2001 The increasing reliance on local appropriations has been partly driven by fluctuations in state support17 In 2017 state appropriations per FTE at two-year public institutions were $3849
15 Due to limitations in SHEEOrsquos sector-level data for prior years sector-level analyses in this section are based on data from the Integrated Postsecondary Education Data System (IPEDS) These data have slightly different definitions and should not be directly compared to the SHEEO data shared above The finance data presented in Figure 4 include all state and local appropriations to public institutions funding for non-credit medical agriculture and research are included but state-funded financial aid is not included Due to the structure of IPEDS finance data any grants or contracts allocated to public institutions for general operating could not be included In addition the 12-month FTE enrollment in Figure 4 includes all non-credit and medical students (unlike prior figures) and is estimated for 2001 and 2002 using prior ratios of fall to 12-month FTE
16 In this section general operating support refers to IPEDS state and local appropriations which includes funding for non-credit medical agricultural and research
17 While state funding relies on volatile income and consumption tax bases and can be crowded out by other budget categories local funding predominately comes from property taxes which have a very stable tax base and are a dedicated revenue source for higher education institutions
SHEEO INVESTIGATING THE IMPACTS OF STATE HIGHER EDUCATION APPROPRIATIONS AND FINANCIAL AID25
copy 2021 by the State Higher Education Executive Officers Association (SHEEO)
approximately $330 below 2001 levels At four-year institutions local appropriations accounted for a much smaller proportion of state and local operating funding Local appropriations at four-year institutions increased from $20 per FTE in 2001 to $55 per FTE in 2017 but this amount remains less than 1 of general operating appropriations
The two- and four-year sectors also differ in the amount of state appropriations they receive per student While the four-year sector has consistently received greater state appropriations than the two-year sector over time the gap has narrowed (Figure 4) In 2001 four-year institutions received on average $7191 (172) more per FTE in state appropriations than two-year institutions However following the 2001 recession the funding gap between two- and four-year institutions narrowed The 2001 recession led to declines of 14 and 16 at two- and four-year institutions respectively By 2007 funding at two-year institutions had completely recovered while state appropriations per FTE at four-year institutions remained 14 below 2001 levels
When the Great Recession hit two- and four-year institutions faced similar declines State appropriations declined an inflation-adjusted 20 at two-year institutions and 23 at four-year institutions between 2007 and 2012 After considering enrollment growth there was a 28 decline in both sectors ($1202 per FTE at two-year institutions and $2779 per FTE at four-year institutions) Since 2012 state appropriations have increased 10 and 16 at two- and four-year institutions respectively
Although four-year institutions saw greater growth in total appropriations enrollment has continued to grow at four-year institutions while declining at two-year institutions As a result the funding gap between sectors in state appropriations per FTE continued to narrow during the economic recovery following the Great Recession Since 2012 state appropriations per FTE have increased 257 for the two-year sector but only 87 for the four-year sector Yet funding disparities remain Even with these post-recession appropriation increases state appropriations per FTE remain 10 below 2007 levels for the two-year sector and 22 lower for the four-year sector By 2017 four-year institutions still received $3772 (98) more than two-year institutions in state appropriations per FTE
While the two-year sector appears to have fared better in the aftermath of the Great Recession the recovery in appropriations per FTE at two-year institutions is driven more by declines in enrollment and steady increases in local funding than increases in state appropriations Between 2012 and 2017 enrollment in the two-year sector declined 13 while inflation-adjusted local appropriations increased 16 and state appropriations increased 10 In the four-year sector enrollment increased 7 and total state funding increased 16 Unlike in the two-year sector where enrollment declines and funding increases worked together to result in a full recovery of per-FTE appropriations the increase in four-year funding was not large enough to offset new enrollment growth and make up for state funding declines during the Great Recession
SHEEO INVESTIGATING THE IMPACTS OF STATE HIGHER EDUCATION APPROPRIATIONS AND FINANCIAL AID26
copy 2021 by the State Higher Education Executive Officers Association (SHEEO)
FIGURE 4STATE AND LOCAL APPROPRIATIONS PER FTE AND FTE ENROLLMENT AT TWO- AND FOUR-YEAR INSTITUTIONS (CONSTANT $) US 2001-2017
$4
18
3
$3
74
0
$3
58
4
$3
92
2
$4
12
1
$4
28
9
$4
26
4
$3
80
8
$3
19
1
$3
13
2
$3
02
6
$3
06
2
$3
29
4
$3
477
$3
64
8
$3
678
$3
84
9
$11
373
$10
40
2
$9
65
5
$9
53
4
$9
38
1
$9
56
2
$9
78
8
$8
70
2
$7
83
1
$7
63
0
$7
04
9
$7
00
9
$7
38
2
$7
40
9
$7
33
2
$7
35
3 $
20
40
$2
08
3
$2
13
1
$2
26
1
$2
34
3
$2
40
8
$2
33
1
$2
22
9
$2
016
$1
971
$2
03
8
$2
18
7
$2
28
0
$2
32
5
$2
58
6
$2
70
0
$2
78
3
0
1
2
3
4
5
6
$-
$2000
$4000
$6000
$8000
$10000
$12000
20
01
20
02
20
03
20
04
20
05
20
06
20
07
20
08
20
09
20
10
20
11
20
12
20
13
20
14
20
15
20
16
20
17
20
01
20
02
20
03
20
04
20
05
20
06
20
07
20
08
20
09
20
10
20
11
20
12
20
13
20
14
20
15
20
16
20
17
FTE
EN
RO
LLM
EN
T M
ILLI
ON
S
DO
LLA
RS
PE
R F
TE
TWO-YEAR FOUR-YEAR
STATE APPROPRIATIONS PER FTE LOCAL APPROPRIATIONS PER FTE FTE ENROLLMENT
$7
62
0
NOTES
1 In all years local appropriations to four-year institutions were less than $60 per FTE
2 Institution type is based on Carnegie classification Baccalaureate and above are considered four-year institutions mixed institutions are classified according to their previous designation and institutions outside of the US or those with a special classification are excluded
3 Estimated 2001 and 2002 12-month FTE using available fall FTE data and 12-month as a proportion of fall FTE for the earliest available year(s)
4 Constant 2017 dollars adjusted by the Higher Education Cost Adjustment (HECA)
SOURCES IPEDS Finance Survey 2001-2017 IPEDS Directory 2001-2017 Carnegie Classifications 2000-2015
NATIONAL TRENDS IN STATE GRANT AID
In stark contrast to the cyclical trends that characterize the general operating appropriations funding patterns presented above state support for student grant aid has consistently increased during the last two decades Using data collected from the National Association of State Student Grant and Aid Programs (NASSGAP) annual survey Figure 5 shows that total state grant aid increased approximately 72 in inflation-adjusted dollars from 2001 to 2019 with over $123 billion awarded in the most recent year18 In fact state grant aid increased every year throughout this time period with the exception of a slight decrease (13 or $14 million) from 2011 to 2012 Statesrsquo commitments to grant aid programs have well outpaced inflation in the 2000s yet aid remains a small proportion of total state support for public institutions The $123 billion awarded in 2019 amounts to approximately 15 of the $808 billion of general operating support provided the same year
18 Due to the targeted nature of state financial aid programs wherein financial aid dollars do not evenly support all students the analyses of financial aid data focus on total dollars awarded rather than standardizing by FTE Yet even after adjusting for increased enrollment state support for student grant aid has increased substantially from FY 2001 through FY 2019 (Trends in Student Aid 2020)
SHEEO INVESTIGATING THE IMPACTS OF STATE HIGHER EDUCATION APPROPRIATIONS AND FINANCIAL AID27
copy 2021 by the State Higher Education Executive Officers Association (SHEEO)
Historically state grant aid has been less vulnerable to economic recessions than general operating support as states have prioritized maintaining or increasing funding for financial aid during economic recessions However eligibility requirements attached to state grant aid programs have changed over time and do at times become less generous in the size of the award or the number of students served Many of the largest state financial aid programs began in the 1970s and were primarily need-based or at least had a need-based component but in recent years non-need-based programs have proliferated19 Many of these programs are described as merit-based student grant aid programs though more widely available promise programs have gained national attention more recently In examining the trends in need- and non-need-based grant aid presented in Figure 5 it is clear that need-based grant aid far exceeds its counterpart throughout the time series presented The proportion of need-based grant aid oscillates between 70 and 77 with the $91 billion awarded on the basis of need in 2019 representing approximately 74 of the share of state grant aid From 2001 to 2019 need-based grant aid increased 69 while non-need-based grant aid increased at a rate of almost 83 albeit from a much lower base ($18 vs $54 billion) As expected the growth in non-need-based grant aid primarily resulted from the adoption of new financial aid programs often funded by state lotteries while the increase in need-based grant aid came about through the increased funding of longstanding need-based grant aid programs In fact increased investments in need-based aid in some of the most populous states such as California and Texas account for a sizable portion of the national gains reported (eg $23 billion) These increased investments have primarily come in the form of providing aid to additional students Though NASSGAP has an imperfect measure of the number of students receiving financial aid dollars we can use their data to see that the number of financial aid awards has increased at a rate which exceeds the average amount per award with need-based aid driving much of that growth20
19 See for instance Table 9 of NASSGAPrsquos 1992-93 Annual Survey Report for a list of state financial aid programs their characteristics and the year each was initiated For a discussion of the more recent non-need-based programs see Doyle WR (2006) Adoption of merit-based student grant programs An event history analysis Educational Evaluation and Policy Analysis 28(3) 259-285
20 Itrsquos also important to point out that while the dichotomy of need-based and non-need-based grant aid helps examine trends in state grant aid there are more nuances than that dichotomy allows For instance many financial aid programs award aid on the basis of need and merit These hybrid need-only and merit-only programs represent 36 45 and 19 of all undergraduate financial aid in the most recent data available from NASSGAPrsquos 2017-18 annual report Often a program with any need-based component is classified as need-based in the NASSGAP data
SHEEO INVESTIGATING THE IMPACTS OF STATE HIGHER EDUCATION APPROPRIATIONS AND FINANCIAL AID28
copy 2021 by the State Higher Education Executive Officers Association (SHEEO)
FIGURE 5STATE GRANT AID FOR NEED- AND NON-NEED PROGRAMS (CONSTANT $) US 2001-2019
$0
$2
$4
$6
$8
$10
$12
$142
00
1
20
02
20
03
20
04
20
05
20
06
20
07
20
08
20
09
20
10
20
11
20
12
20
13
20
14
20
15
20
16
20
17
20
18
20
19
DO
LLA
RS
AW
AR
DE
D B
ILLI
ON
S
RECESSION
TOTAL GRANT AID$12 BILLION
NEED-BASED AID$9 BILLION
NON-NEED-BASED AID$3 BILLION
NOTES
1 State grant aid includes all scholarship and grant aid awarded to undergraduate and graduate students including the small portion of aid allocated to non-public institutions
2 Constant dollars adjusted by the Higher Education Cost Adjustment (HECA)
SOURCE National Association of State Student Grant and Aid Programs 2001 through 2018 data pulled from NASSGAPrsquos Annual Survey data query tool 2019 pulled from Table 3 History 2009-2019
STATE TRENDS IN STATE GRANT AID
States vary considerably in how they approach grant or scholarship aid Some invest general fund dollars into large need-based programs while others invest lottery funds into non-need-based programs and others still do not invest in their programs For example Georgia Florida and Tennessee invest heavily in state financial aid primarily through non-need-based aid and those three states make up more than half of the nationrsquos non-need-based total ($17 billion) in 2019 California Texas and New York on the other hand comprise more than 45 ($41 billion) of the $91 billion awarded based primarily on need in 2019
Though the national trends in state grant aid suggest unmitigated growth 12 states experienced decreases in their inflation-adjusted total grant aid from 2001 to 201921 As shown in Figure 6 many of those states were concentrated in the Northeast and Midwest including Illinois Massachusetts and Ohio which have generous financial aid programs but experienced sharp declines Other states like New York and Pennsylvania saw large absolute decreases but had large enough programs that they still operated two of the largest need-based aid programs in 2019 These reductions in grant aid often occur because of reduced investment in need-based grant aid as these programs are often oversubscribed For instance in Illinois they cut their primary need-based aid program due to statewide budget shortfalls (Center for Tax and Budget Accountability 2017)
21 See Appendix A Table 2 for a more complete picture of the trends in grant aid by state
SHEEO INVESTIGATING THE IMPACTS OF STATE HIGHER EDUCATION APPROPRIATIONS AND FINANCIAL AID29
copy 2021 by the State Higher Education Executive Officers Association (SHEEO)
On the other hand 21 states more than doubled the amount of dollars awarded in the form of grants between 2001 and 2019 Some states like Oregon and West Virginia had modestly sized programs in 2001 but increased more than threefold by 2019 Other states like North Dakota Delaware and Idaho experienced some of the largest proportional gains but expended so few dollars in 2001 that they are still in the bottom quintile of dollars awarded in 2019 And some states like Tennessee Texas California and Virginia saw some of the largest absolute and proportional gains in grant aid dollars awarded
FIGURE 6CHANGES IN TOTAL STATE GRANT AID (CONSTANT $) US 2001-2019
597
622
51188
21271
85
78
714
-34 95
-26
-11148
135
-17
-26
19
33
90
-91
106135
30
-8
40
1003
-50
96
206
-22
177
811
469
255
201
153
217
7
-8
51
59
78034
5
43
112
NOTES
1 State grant aid includes all scholarship and grant aid awarded to undergraduate and graduate students including the small portion of aid allocated to non-public institutions
2 Values presented represent the change from 2001 to 2019
3 States without a percentage listed are those that did not have a program in 2001 (eg Wyoming North Dakota)
4 Constant dollars adjusted by the Higher Education Cost Adjustment (HECA)
SOURCE National Association of State Student Grant and Aid Programs 2001 through 2018 data pulled from NASSGAPrsquos Annual Survey data query tool 2019 pulled from Table 3 History 2009-2019
SECTOR-LEVEL TRENDS IN STATE FINANCIAL AID
As with general operating appropriations there are sizable differences in the allocation of state financial aid across sectors Figure 7 22 shows that in inflation-adjusted dollars four-year institutions received almost twice as much grant aid in the first year of our panel (2001) than two-year institutions received in the last year of the panel (2017) It should be noted that the largest
22 To be consistent with the other parts of this report IPEDS Finance Survey data were used for the sector-level comparisons Unfortunately the IPEDS data and NASSGAP data do not perfectly align as there is approximately $1 billion in state grant aid unaccounted for between the two data sources in 2017 That said the trends in state grant aid dollars are similar across both sources and are the focus of this section It is likely that the discrepant dollars are proportionally distributed across the two- and four-year sectors but even if they are not and instead fall entirely within the two-year realm the inferences drawn from the data remain relatively unchanged
SHEEO INVESTIGATING THE IMPACTS OF STATE HIGHER EDUCATION APPROPRIATIONS AND FINANCIAL AID30
copy 2021 by the State Higher Education Executive Officers Association (SHEEO)
grant aid program in the country (not included in Figure 7) the federal Pell Grant is awarded disproportionately to students enrolled in the two-year sector which may at least partially explain why state policy has allowed such a chasm to exist and grow between the two sectors On the other hand many non-need-based aid programs have merit components that are more likely to flow to students in the four-year sector and a non-negligible number of state financial aid programs provide larger grants to students who choose to enroll in a four-year institution It is also important to point out that financial aid programs often have a minimum credit hour requirement or even a prorated award for those students enrolling part time which would also favor students enrolling in the four-year sector
Though a sizable gap between the sectors exists it is important to point out the growth found in the national trends reflected in Figure 7 Across both sectors students are receiving considerably more state grant aid in 2017 than in 2001 even after accounting for inflation Moreover while the total dollars awarded track with the increases in FTE enrollment within the four-year sector it seems that the two-year sector received substantially more state grant aid dollars even after its enrollment declined following the Great Recession
FIGURE 7STATE GRANT AID AND FTE ENROLLMENT AT TWO- AND FOUR-YEAR INSTITUTIONS (CONSTANT $) US 2001-2017
$1
19
$1
34
$1
36
$1
55
$1
55
$1
61
$1
68
$1
78
$1
75
$1
73
$1
86
$1
92
$2
19
$2
18
$2
21
$2
19
$2
33
$4
46
$4
68
$4
81
$5
42
$5
71
$5
94
$6
14
$6
27
$6
82
$7
00
$7
14
$6
65
$7
05
$7
25
$7
19
$7
27
$7
49
0
1
2
3
4
5
6
$B
$1B
$2B
$3B
$4B
$5B
$6B
$7B
$8B
20
01
20
02
20
03
20
04
20
05
20
06
20
07
20
08
20
09
20
10
20
11
20
12
20
13
20
14
20
15
20
16
20
17
20
01
20
02
20
03
20
04
20
05
20
06
20
07
20
08
20
09
20
10
20
11
20
12
20
13
20
14
20
15
20
16
20
17
FTE
EN
RO
LLM
NE
T M
ILLI
ON
S
GR
AN
T A
ID B
ILLI
ON
S
TWO-YEAR FOUR-YEAR
FTE ENROLLMENTSTATE GRANT AID
NOTES
1 Institution type is based on Carnegie classification Baccalaureate and above are considered four-year institutions mixed institutions are classified according to their previous designation and institutions outside of the US or those with a special classification are excluded
2 Estimated 2001 and 2002 12-month FTE using available fall FTE data and 12-month as a proportion of fall FTE for the earliest available year(s)
3 Constant 2017 dollars adjusted by the Higher Education Cost Adjustment (HECA)
SOURCES IPEDS Finance Survey 2001-2017 IPEDS Directory 2001-2017 Carnegie Classifications 2000-2015
SHEEO INVESTIGATING THE IMPACTS OF STATE HIGHER EDUCATION APPROPRIATIONS AND FINANCIAL AID31
copy 2021 by the State Higher Education Executive Officers Association (SHEEO)
COMPARISON OF TRENDS IN STATE GENERAL OPERATING AND GRANT AIDIn this section we examine differences in the trends of general operating appropriations and state financial aid awards to students attending public institutions To make comparisons possible we look at each metric on a per-FTE basis23 It is important to note that for financial aid a change in funding per-FTE is substantially different than a change in total funding or even funding per awardee Increasing allocations could be due to an increase in the proportion of all students receiving awards andor an increase in award size
Figure 8 shows a modified version of Figure 2 from the general operating trends section Here we have added the cumulative percentage change in state financial aid to public institutions following the last two economic recessions Unlike general operating appropriations state aid per FTE increased steadily during and immediately following each recession Increases in state aid per FTE could be due to the introduction of new financial aid programs in states the expansion of existing programs to cover more students or increases in the average student award As a result state financial aid increased from 44 to 99 of all education appropriations between 2001 and 2019
FIGURE 8CHANGE IN STATE GENERAL OPERATING AND GRANT AID PER FTE FOLLOWING ECONOMIC RECESSIONS (CONSTANT $) US 1980-2019
10
3
-11-8
-14-11
2730
-40
-30
-20
-10
0
10
20
30
40
198
0
198
1
198
2
198
3
198
4
198
5
198
6
198
7
198
8
198
9
199
0
199
1
199
2
199
3
199
4
199
5
199
6
199
7
199
8
199
9
20
00
20
01
20
02
20
03
20
04
20
05
20
06
20
07
20
08
20
09
20
10
20
11
20
12
20
13
20
14
20
15
20
16
20
17
20
18
20
19
RECESSION EDUCATION APPROPRIATIONS GENERAL OPERATING STATE FINANCIAL AID
CU
MU
LAT
IVE
PE
RC
EN
T C
HA
NG
E
NOTES
1 Cumulative percentage change calculated since the start of each recession (1980 1990 2001 and 2008)
2 Education appropriations include general operating support and state financial aid to students attending public institutions General operating is the portion of state and local support appropriated directly to public institutions for the purposes of general operations Both measures include Federal American Reinvestment and Recovery Act (ARRA) revenue provided during the Great Recession to stabilize state and local sources of revenue for higher education
3 State public financial aid is the proportion of total state-funded financial aid awarded to students attending public institutions excluding loans
4 Full-time equivalent (FTE) enrollment converts student credit hours to full-time academic year students but excludes medical students
5 Constant dollars adjusted by the Higher Education Cost Adjustment (HECA)
SOURCE State Higher Education Executive Officers Association State Higher Education Finance Data (httpsshefsheeoorg)
State-level trends support the national picture In over half of all states general operating appropriations have decreased while state financial aid allocations have increased since 2001 (on a per-FTE basis after adjusting for inflation) However in 11 states state funding has declined across the board and in another five both general operating and financial aid allocations have increased over time (Figure 9) Only two states show an increase in general operating appropriations and a decrease in financial aid Illinois and New Mexico24
23 Trends and comparisons in this section use SHEF (not NASSGAP) data on financial aid to students attending public institutions
24 The general operating increase in Illinois is due to the statersquos efforts to address its historically underfunded pension system While funding has increased the bulk of that increase has been used for past payments For more information see httpsshefsheeoorg wp-contentuploads202004SHEEO_SHEF_FY18_IB_Illinoispdf
SHEEO INVESTIGATING THE IMPACTS OF STATE HIGHER EDUCATION APPROPRIATIONS AND FINANCIAL AID32
copy 2021 by the State Higher Education Executive Officers Association (SHEEO)
FIGURE 9CHANGE IN STATE GENERAL OPERATING AND GRANT ALLOCATIONS FY 2001-2019 BY STATE
AL
AK
AZ
AR
CA
CO
CT
DE
FL
GA
HIID
IL
IN
IAKS
KY
LA
MEMD
MA
MI
MN
MS
MO
MT
NE
NV
NH
NJ
NM
NY
NC
ND
OH
OKOR
PA
RI
SC
SD
TN
TX
UT
VT
VA
WA
WV
WI
WY
US
$(1000)
$(500)
$-
$500
$1000
$1500
$2000
$(7500) $(5000) $(2500) $- $2500 $5000 $7500
CH
AN
GE
IN F
INA
NC
IAL
AID
PE
R F
TE
CHANGE IN GENERAL OPERATING PER FTE
IncreasingAid
DecreasingOperating
IncreasingOperating
DecreasingOperating
NOTES
1 General operating is the portion of state and local support appropriated directly to public institutions for the purposes of general operations
2 State public financial aid is the proportion of total state-funded financial aid awarded to students attending public institutions excluding loans
3 Full-time equivalent (FTE) enrollment converts student credit hours to full-time academic year students but excludes medical students
4 Constant dollars adjusted by the Higher Education Cost Adjustment (HECA)
SOURCE State Higher Education Executive Officers Association State Higher Education Finance Data (httpsshefsheeoorg)
Despite these opposing trends in 2019 the vast majority of state support was still allocated directly to public institutions through general operating appropriations State financial aid remains a more targeted and smaller investment from states When compared to the national average (which is heavily influenced by larger and more well-funded states like California and New York) in 2019 it was most common for states to have relatively low general operating appropriations and low financial aid allocations (Figure 10) Ten states had low general operating and high aid and another nine had high operating and low aid
SHEEO INVESTIGATING THE IMPACTS OF STATE HIGHER EDUCATION APPROPRIATIONS AND FINANCIAL AID33
copy 2021 by the State Higher Education Executive Officers Association (SHEEO)
FIGURE 10COMPARISON TO US AVERAGE IN STATE GENERAL OPERATING AND GRANT AID ALLOCATIONS FY 2019 BY STATE
AL
AK
AZ
AR
CA
CO
CTDE
FL
GA
HI
ID
IL
IN
IA KS
KY
LA
ME
MD
MA
MI
MN
MS
MO
MT
NE
NV
NH
NJ
NM
NY
NC
ND
OH
OK
ORPA
RI
SC
SD
TN
TXUT
VT
VA
WAWV
WI
WY
US
$-
$500
$1000
$1500
$2000
$2500
$- $2500 $5000 $7500 $10000 $12500 $15000 $17500 $20000
FIN
AN
CIA
L A
ID P
ER
FT
E
GENERAL OPERATING PER FTE
HighOperating
HighAid
LowOperating
LowOperating
NOTES
1 General operating is the portion of state and local support appropriated directly to public institutions for the purposes of general operations
2 State public financial aid is the proportion of total state-funded financial aid awarded to students attending public institutions excluding loans
3 Full-time equivalent (FTE) enrollment converts student credit hours to full-time academic year students but excludes medical students
4 Constant dollars adjusted by the Higher Education Cost Adjustment (HECA)
5 Adjusted to account for interstate differences using the Cost of Living Index (COLI) and Enrollment Mix Index (EMI)
SOURCE State Higher Education Executive Officers Association State Higher Education Finance Data (httpsshefsheeoorg)
It is important to note that state funding is not the only source of revenue for public institutions Institutions also receive substantial funding through tuition and fee revenues (Figure 11) Since 2001 per-student tuition revenue from in-state and out-of-state students has increased enough to more than offset declines in state funding As a result the average US institution has more total revenue in 2019 than in 2001 before funding started to decline However total revenue varies widely by institution type and many of the gains in total revenue have occurred at four-year research universities which have a greater ability to attract students in particular out-of-state students and increase tuition rates (Hillman 2020 Jaquette amp Curs 2015)
SHEEO INVESTIGATING THE IMPACTS OF STATE HIGHER EDUCATION APPROPRIATIONS AND FINANCIAL AID34
copy 2021 by the State Higher Education Executive Officers Association (SHEEO)
FIGURE 11BREAKDOWN OF TOTAL PUBLIC HIGHER EDUCATION REVENUES US FY 2001-2019
$14K$14K
$13K$13K $13K
$14K $14K $14K$13K
$13K $13K $13K$13K
$14K$14K
$15K$15K $15K $15K
$-
$2000
$4000
$6000
$8000
$10000
$12000
$14000
$16000
20
01
20
02
20
03
20
04
20
05
20
06
20
07
20
08
20
09
20
10
20
11
20
12
20
13
20
14
20
15
20
16
20
17
20
18
20
19
STATE GENERAL OPERATING STATE PUBLIC AID LOCAL APPROPRIATIONS NET TUITION REVENUE
TO
TA
L R
EV
EN
UE
S P
ER
FT
E
NOTES
1 Labels at the top of each bar show total education revenue per FTE enrollment at public institutions Total education revenue is the sum of state general operating state financial aid local appropriations and net tuition revenue Net tuition revenue excludes medical tuition but includes federal financial aid and student loans
2 Constant dollars adjusted by the Higher Education Cost Adjustment (HECA)
SOURCE State Higher Education Executive Officers Association State Higher Education Finance Data (httpsshefsheeoorg)
In the next sections we outline our research methodology and then provide a detailed review of the known impacts of general operating appropriations and state financial aid on student outcomes Understanding what researchers have discovered about the impact of these funding strategies can help states and policymakers determine how best to allocate scarce resources
SHEEO INVESTIGATING THE IMPACTS OF STATE HIGHER EDUCATION APPROPRIATIONS AND FINANCIAL AID35
copy 2021 by the State Higher Education Executive Officers Association (SHEEO)
PRIOR LITERATURE ON THE EFFECTS OF STATE APPROPRIATIONS
In this section we describe the most rigorous existing research on the effects of state appropriations First we outline the methodology used to find and select prior research We begin our review with the impacts of state appropriations on institutions from changes in tuition institutional expenditures and research activity Next we turn to a longer discussion of the impacts of state appropriations on student outcomes We examine impacts on student enrollment credential outcomes and additional financial outcomes We also discuss differences across institutional sectors in existing inequities in the allocation of state appropriations
RESEARCH REVIEW METHODS
Studies were collected and reviewed over two phases We conducted an initial search on the topic several years ago which resulted in 40 studies We reviewed these studies using our inclusion criteria described below resulting in six studies that met our inclusion criteria Our second phase occurred during February and March 2020 During this second phase we limited our search to studies that were published in 2010 or later We first reviewed the references of the eight articles from the first phase as well as studies that have cited these articles Next we conducted a targeted author search of the authors of the first eight studies which consisted of reviewing their published work as available on their Google Scholar ResearchGate pages and publicly available CVs Lastly we conducted searches in the ERIC JSTOR and Web of Science electronic databases and reviewed all titles and the abstracts of relevant titles We conducted a search in Google Scholar and reviewed titles and abstracts until we felt confident we had reached the end of relevant articles (15+ pages) These search strategies resulted in an additional 41 studies that we reviewed in detail of which seven met our inclusion criteria
We systematically reviewed the 81 studies that resulted from our two phases of literature searching with a set of inclusion criteria Since we are focused on the relationship between state appropriations and student outcomes we focused on studies that included as their independent variable a change in state appropriations (at the state or institution level) Our inclusion criteria also required studies to meet certain methodological rigor Studies were required to have used one of the following eligible designs randomized control trial regression discontinuity difference-in-differences instrumental variables estimation fixed or random effects or decomposition analysis We delimited the studies in this way in order to get closer to the true causal estimate of how state appropriations affect a series of outcomes Ideally we would employ the same inclusion criteria as the Department of Educationrsquos What Works Clearinghouse25 and include only those studies using an experimental or quasi-experimental design similar to our approach in the subsequent grant aid literature review However due to the nascent nature of the state appropriations literature and the challenges of designing an experimental or quasi-experimental setup that isolates the effect of state appropriations we found no randomized control trial or regression discontinuity studies and only one generalized difference-in-differences study This prompted us to expand the criteria for the state appropriations literature review For context these criteria resulted in 81
25 See httpsiesedgovnceewwcStudyReviewGuide for details on the Department of Educationrsquos What Works Clearinghouse Study Review Guides
SHEEO INVESTIGATING THE IMPACTS OF STATE HIGHER EDUCATION APPROPRIATIONS AND FINANCIAL AID36
copy 2021 by the State Higher Education Executive Officers Association (SHEEO)
state appropriations studies for review compared to the 91 grant aid studies collected (in the subsequent section) using a much more constrained set of criteria (ie experimental and quasi-experimental) See Figure 12 for a flowchart of the review criteria used for the state appropriations literature review including examples of the types of studies that were excluded from review
FIGURE 12FLOWCHART OF REVIEW CRITERIA FOR STATE APPROPRIATIONS LITERATURE REVIEW
designs
Excluded studies thatmiddot Included a change in state appropriations as
the dependent variable
middot Focused on the eects of performance-based
fundingmiddotIncluded as the dependent variable a
breakdown of spending per revenue category
middot Included as the independent variable a change in
institutional resources (eg student-faculty ratio)
Excluded studies with the following researchmiddot Analyses that use regression methods without
fixed or random eects
- Tobit and Probit Models
- Quantile Regression
- Ordinary Least Squares (OLS)
middot Relational methods that do not get at causality
- Event History
- Competing Risks Models
- Maximum Likelihood Models
- Multi-level Growth Models
middot Stochastic Frontier Analysis
middot Descriptive Analysis
Does the study meet one of the following eligible designsmiddot Random Control Trial (RCT)
middot Regression Discontinuity
middot Dierence-in-Dierences
middot Instrumental Variable Estimation
middot Fixed or Random Eects
middot Decomposition Analysis
Is independent variable a change in state appropriations (at the state or institution level)
Review for inclusion in literature review
YES
YES
Review for context only
YES
NO
NO
Was the study published in 2010 or later We made one exception to this rule Zhang (2009) which was collected during our initial collection phase is included in our literature review
SOURCE State Higher Education Executive Officers Association
It is important to note that some of the studies described in this section did not isolate general operating appropriations from total state appropriations In particular studies using Grapevine data on state support after 2010 likely included state financial aid allocations in their analyses26 However state financial aid has historically made up a small portion of total appropriations (less than 10)
26 Illinois State University College of Education (2020) About the Grapevine data Method httpseducationillinoisstateedugrapevineaboutmethodphp
SHEEO INVESTIGATING THE IMPACTS OF STATE HIGHER EDUCATION APPROPRIATIONS AND FINANCIAL AID37
copy 2021 by the State Higher Education Executive Officers Association (SHEEO)
EFFECTS OF STATE APPROPRIATIONS ON INSTITUTIONS
There are two main ways that public institutions respond to declining state appropriationsmdashby raising tuition revenues or by decreasing institutional expenditures Here we review the recent literature related to both mechanisms and include a summary of several studies that examined the relationship between state appropriations and university research activity
CHANGES IN TUITION
Extant research provides evidence that state appropriations are inversely related to tuition prices at four-year institutions Goodman and Volz (2020) use Delta Cost Project data from academic years 2000 to 2010 and a generalized difference-in-differences model to examine the state-level impact of declining state appropriations on in-state tuition They find that at public four-year institutions a 10 reduction in state funding leads to a 11 increase in enrollment-weighted tuition and a 07 increase in sticker price The impact is slightly higher at state flagship institutions where the result of a 10 state funding cut is a 13 increase in sticker price
Using a panel data model with institution and year fixed effects applied to Delta Cost Project data from 1987-2012 Zhao (2018a) adds additional nuance to these findings by estimating the impact of funding cuts on both in- and out-of-state tuition separately by institution type (ie doctoral masterrsquos bachelorrsquos) He uses a number of alternative outcome measures to test the robustness of his results including sticker price average tuition and net tuition and fees per FTE student and finds across all of his definitions that a decline in state appropriations is accompanied by an increase in tuition and fees He finds that public doctoral institutions respond to decreases in state appropriations by increasing tuition for both in-state and out-of-state students but tuition increases at a higher rate for out-of-state students Doctoral institutions do not raise tuition enough to fully make up for the funding lost in the state appropriation cuts but they raise tuition at a higher rate compared to other institution types and flagship institutions increase tuition and fees the most In terms of changes in average tuition for full-time undergraduate students at doctoral institutions a $1 decline in state appropriations per FTE leads to a $016 increase in average tuition and fees for in-state students and a $032 increase for out-of-state students27 Masterrsquos institutions respond to state funding cuts by increasing in-state tuition responding to a $1 decrease in state appropriations per FTE by increasing average in-state tuition by $011 There is some evidence (limited due to small sample size) that bachelorrsquos institutions respond by increasing out-of-state tuition at these institutions a $1 decrease in state appropriations leads to an increase in average out-of-state tuition of $044
Webber (2017) uses an instrumental variables fixed-effects identification strategy to estimate how much of a cut in state appropriations per FTE is passed through to students attending public four-year institutions via higher tuition and fees Using data from 1987-2014 Webber uses the total appropriations at the state level to instrument for appropriations at a specific institution in a given year an approach that accounts for endogenous state budget decisions while also taking into account institution-specific factors28 His model includes institution and year fixed effects and
27 At flagship institutions these numbers were slightly larger with a $1 cut in state appropriations per FTE resulting in an $018 increase in average tuition and fees for in-state students and a $033 increase for out-of-state students
28 Recent work on the public funding of higher education (Bound et al 2019 Chakrabarti et al 2020 Deming amp Walters 2018 Webber 2017) has made use of this shift-share instrumental variables approach first proposed by Bartik (1991) As Chakrabarti et al (2020) point out ldquothis instrument leverages the fact that state-wide changes in appropriations for higher education will have different effects on postsecondary institutions based on their underlying reliance on state fundsrdquo (p 13) All of the aforementioned studies include detailed descriptions of the Bartik instrument within the context of higher education For a more detailed description of its historical use assumptions and limitations see Goldsmith-Pinkham et al (2019)
SHEEO INVESTIGATING THE IMPACTS OF STATE HIGHER EDUCATION APPROPRIATIONS AND FINANCIAL AID38
copy 2021 by the State Higher Education Executive Officers Association (SHEEO)
controls for the existence of state laws that cap tuition increases or implement tuition freezes Since institutions frequently engage in tuition discounting that leads to a unique price paid by each student Webber uses average tuition and fees rather than sticker price as the dependent variable in his model Webber finds that over the time period covered the pass-through rate is 257 meaning that a $1000 reduction in per FTE student state appropriations would result in the average student paying an additional $257 in tuition and fees29 Notably Webber finds that the proportion of state funding cuts borne by students has increased over time The pass-through rate has increased from 103 pre-2000 to 318 post-2000 and 412 in the time since the start of the Great Recession in 2008 Webber suggests that this increase ldquosignals that the low-hanging fruit of spending reduction is considerably diminished (if not exhausted entirely)rdquo (p 3) and that institutions increasingly rely on tuition dollars to replace lost state dollars to avoid having to make spending cuts to their core functions
There are multiple potential mechanisms through which increases in tuition are passed along to students The increased tuition could be distributed evenly across all students wealthier students may absorb a higher proportion of the tuition increases if the increases are accompanied by additional tuition discounting for lower-income students or the institution could shift the makeup of the student population by enrolling more out-of-state and international students who face higher tuition rates (Webber 2017) Although there is limited exploration of these mechanisms in the studies reviewed there is some evidence that doctoral institutions increase tuition for out-of-state students at a higher rate than for in-state students (Zhao 2018a) and that public four-year institutions particularly doctoral institutions respond to declining state appropriations by increasing enrollment of out-of-state students (Jaquette and Curs 2015)
The evidence is mixed on whether changes in state appropriations impact community college tuition While Zhao (2018a) finds no effect of state funding cuts on community college tuition for any of his measures (sticker price average tuition or net tuition and fees) Goodman and Volz (2020) find that a 10 cut in state funding causes a 22 increase in enrollment-weighted community college tuition This difference in findings may be driven by the different time horizons of the two studies Zhao (2018a) examines changes from 1987 to 2012 while Goodman and Volz (2020) focus on 2000 to 2010 If the increase in tuition pass-through rate pre-and post-2000 observed in the four-year sector (Webber 2017) also occurred at the community college level then the significant effects found by Goodman and Volz may be reflective of their analysis focusing on more recent years Another notable difference between the two studies is the methodology employed Goodman and Volzrsquos (2020) generalized difference-in-differences study relies on state-level aggregate data and represents state-level changes in community college tuition prices whereas Zhaorsquos (2018a) panel data model uses institution-level data and institution-fixed effects meaning the overall effect on tuition is calculated from institution-specific estimates
29 The pass-through rate varies among institution types with the highest pass-through rate occurring at doctoral institutions (266) followed by masterrsquos institutions (262) and the lowest at bachelorrsquos institutions (183) Presumably this means that the inverse pattern is occurring by institution type in terms of spending cuts
SHEEO INVESTIGATING THE IMPACTS OF STATE HIGHER EDUCATION APPROPRIATIONS AND FINANCIAL AID39
copy 2021 by the State Higher Education Executive Officers Association (SHEEO)
CHANGES IN INSTITUTIONAL EXPENDITURES
Institutions that are unable to raise tuition and fee revenue to the extent necessary to offset state funding declines respond to cuts by decreasing expenditures30 Looking at the public sector as a whole Goodman and Volz (2020) find that cuts in state appropriations result in decreased spending on student services and academic support but do not impact spending on instruction They find that a 10 decrease in appropriations at public institutions leads to a 14 decrease in per-FTE academic support spending and a 15 decrease in per-FTE student services spending Deming and Walters (2018) find that when institutions respond to changes in state appropriations by adjusting their spending they make changes across all three spending categories Across all public institutions a 10 increase in state appropriations increases instructional spending by 97 academic support spending by 172 and student services spending by 104 The extent to which institutions rely on making spending cuts as well as the types of cuts made varies between institution types with community colleges experiencing the largest impacts across almost all expenditure areas compared to public four-year institutions (Zhao 2018a)
Zhao (2018a) finds that across institution types declines in state appropriations negatively affect almost all expenditure categories with the largest impact on education and related expenditures which refers to spending on direct educational costs including instruction academic support and student services The effect of a $1 decline in state appropriations ranges from a $049 average decrease in education and related expenditures at public doctoral institutions up to a $102 decrease at associatersquos institutions31 Doctoral and masterrsquos institutions both experience a decline in public service expenditures with a $1 decrease in state appropriations associated with a 07 and 04 decrease in public service expenditures respectively Doctoral institutions also experience a significant hit to their research expenditures reducing their spending in this area by $010 for every $1 decrease in state appropriations
In her dissertation Frye (2015) finds complementary evidence that institutions respond to declining state funding by making changes to the composition of their academic workforce Using a two-way fixed effects regression model applied to IPEDS data from 1994-2013 she finds that as states have cut funding for higher education public institutions have decreased the number of tenure track faculty employed and increased their employment of contingent faculty Goodman and Volz (2020) find no significant changes in the number of full- or part-time faculty at public institutions resulting from cuts in state appropriations but they find an inverse relationship between state funding shocks and the proportion of public institution faculty employed part time They report that a 10 decrease in state appropriations is associated with a 23 percentage point increase in the fraction of part-time public school faculty
30 When state appropriations decline institutions respond to the loss in total revenue by increasing alternative revenue sources (such as tuition revenue) or by decreasing total expenditures Reductions in state support may lead to reductions in institutional spending which impacts student outcomes Total revenue is not held constant in such studies We focus our paper specifically on the unique and independent role that state appropriations play in advancing important outcomes because determining state appropriations is one of the primary finance tools held by state higher education governing policy and coordinating boards
31 One way this cut manifests is in the instructional faculty to student ratio and a state appropriation per FTE student decrease of one standard deviation leads to a decrease in instructional faculty per 100 FTE students of 070 for associatersquos institutions 036 for masterrsquos institutions and 042 for doctoral institutions One standard deviation of state appropriations is $2962 for associatersquos institutions $2881 for masterrsquos institutions and $5338 for doctoral institutions These numbers vary slightly from the standard deviations reported below for the degree completion outcomes because a larger set of institutions was used in the degree completion calculations
SHEEO INVESTIGATING THE IMPACTS OF STATE HIGHER EDUCATION APPROPRIATIONS AND FINANCIAL AID40
copy 2021 by the State Higher Education Executive Officers Association (SHEEO)
CHANGES IN RESEARCH ACTIVITY
Although less tied to student outcomes declines in state funding may also impact research activity at public research universities Zhao (2018b) Husted and Kenny (2018) and Bound et al (2019) provide additional evidence that cuts in state appropriations lead to declines in research productivity at public research universities Using data from the Delta Cost Project and the US Patent and Trademark Office and both a panel data fixed effects model and two different instrumental variables models Zhao (2018b) operationalizes research output as the number of patent applications filed by an institution in a given year that are eventually approved by the US Patent and Trademark Office He finds that one additional approved patent application results from an additional $13 million to $42 million in state appropriations (results vary based on model used) Husted and Kenny (2018) limit their analysis to the 152 public institutions that have steady research output in economics measured as those institutions that had faculty publish in a top-50 economics journal throughout the analysis period Using an instrumental variables method and data from IPEDS and the National Institutes of Health (NIH) they measure four different research outputs number and value of NIH grants awarded to the university number of publications by economists in the university and whether the university was in the top 120 universities obtaining federal revenues Using an instrumental variable approach that acknowledges the possibility that state appropriations to individual universities and research outputs may be determined jointly and that isolates the impact of appropriations the authors find a positive relationship between state appropriations and research productivity An increase in state appropriations of one standard deviation ($3827) increases the probability of being in the top 120 universities getting money from the federal government by 69 percentage points a 145-page increase in the number of pages published in a top-50 economics journal a $198 million increase in the value of NIH grants awarded and an increase of 62 in the number of NIH grants received Bound et al (2019) find no statistically significant effect of changes in state appropriations on number of patents granted for their full sample of public research universities but do find an effect for public research universities that are members of the American Association of Universities (AAU) generally considered the most research-intensive institutions A 10 cut in state appropriations at AAU public universities reduces the number of patents awarded by 84
The studies reviewed in this section discuss the two main mechanisms changes in tuition revenues and institutional spending through which changes in state appropriations may affect student enrollment and completion outcomes Changes in tuition revenues may manifest as changes in the price that students must pay to attend college or as a shift in institutional priorities toward enrolling more high-paying students (eg out-of-state students higher-income students) The studies discussed in the next section explore the relationship between changes in state appropriations and student outcomes with some of the studies further examining the role that these mechanisms play in this relationship
EFFECTS OF STATE APPROPRIATIONS ON STUDENT OUTCOMES
IMPACTS ON ENROLLMENTS
Trostel (2012) uses over twenty years of SHEF and IPEDS data (1985-2006) to examine the impact of changes in state and local appropriations per recent high school graduate on FTE enrollment in public postsecondary institutions He uses a two-stage instrumental variables approach with fixed effects which accounts for the potentially endogenous relationship between predicted college enrollment and state appropriations Using state- and local-government tax revenues
SHEEO INVESTIGATING THE IMPACTS OF STATE HIGHER EDUCATION APPROPRIATIONS AND FINANCIAL AID41
copy 2021 by the State Higher Education Executive Officers Association (SHEEO)
as an instrument he finds a positive relationship between state appropriations and in-state enrollment A $1000 increase in state funding per recent high school graduate is associated with a 55 percentage point increase in public postsecondary enrollment per potential college student (based on the number of high school graduates in the previous four years)
Goodman and Volz (2020) examine how changes over time in state and local appropriations and state and local grants and contracts have affected overall enrollment at the state level as well as within individual sectors (ie public for-profit private nonprofit) Cuts to state appropriations do not change overall postsecondary enrollment across all three sectors instead they lead to students enrolling in the for-profit sector when they would have likely enrolled in a public college A 10 drop in appropriations (the approximate decline during the studyrsquos time frame) leads to a 3 decrease in enrollments at public colleges a 2 increase in for-profit enrollments and no change in enrollments at private nonprofits Evidence from other studies suggest less favorable labor market outcomes for students who graduate from for-profit institutions compared to community colleges such as lower earnings (Cellini amp Chaudhary 2014) and being viewed less favorably by employers (Deming et al 2016) making this shift in enrollments from the nonprofit to the for-profit sector a concerning trend
Unlike the previous two studies in which the authors examine changes in state appropriations at the state level Deming and Walters (2018) study the relationship between state funding and enrollments at the institutional level The authors use SHEEO Grapevine data on state appropriations and IPEDS enrollment data both from 1990-2013 to create a budget shock measure that interacts each institutionrsquos historical reliance on state appropriations (based on 1990 levels) with their yearly state appropriations per college-aged individuals in the state (age 19-23) Using an instrumental variables approach with this budget shock instrument accounts for the fact that a certain percentage cut in higher education appropriations at the state level will have differential impacts on individual institutions since institutions vary in their reliance on state funding Deming and Walters (2018) find that a budget increase has a positive impact on enrollments in the current and subsequent years The authors use data on institutional expenditures and tuition caps and freezes to explore whether the effect of state appropriations on enrollments is driven by changes in spending or tuition and find evidence of the former A 10 increase in total institutional spending in a given year leads to a 33 increase in current year total fall enrollment and an 8-85 increase in total fall enrollment in each of the subsequent three years32
Using instrumental variables estimation with institution and year fixed effects on IPEDS data Bound et al (2019) provide additional evidence that cuts in state appropriations lead to a decrease in in-state undergraduate enrollment at public four-year institutions The authors instrument for institutional appropriations using overall state appropriations and estimate separately the effects for research and non-research public universities They find that a 10 drop in appropriations at research universities leads to a 17 decrease in overall in-state undergraduate enrollment and a 10 drop in appropriations at non-research universities reduces in-state undergraduate enrollment by 15 There were no statistically significant effects on first-year enrollment at either institution type though they were similar in magnitude and direction
32 These findings are driven by two-year institutions where a 10 increase in institutional spending leads to a 95-10 increase in total fall enrollment in each of the subsequent three years (although no change in current year fall enrollment) A 10 increase in total institutional spending at four-year institutions leads to a 24 increase in current year fall enrollments and a 47 66 and 57 increase in years t+1 through t+3 respectively
SHEEO INVESTIGATING THE IMPACTS OF STATE HIGHER EDUCATION APPROPRIATIONS AND FINANCIAL AID42
copy 2021 by the State Higher Education Executive Officers Association (SHEEO)
A key mission of public postsecondary institutions is to educate residents of the state However empirical studies have shown that declining state appropriations can lead public institutions to stray from this part of their mission and seek out student populations who contribute high levels of tuition revenue that can replace some of this lost funding Using IPEDS data and a two-way fixed effects panel model which compares changes within institutions over time while accounting for time-varying trends that affect all institutions (eg the Recession) Jaquette and Curs (2015) explore the relationship between state appropriations and nonresident freshman enrollment at all US public baccalaureate granting institutions between the 2003 and 2013 academic years The authors find that as state appropriations increase nonresident freshmen enrollment decreases with this relationship strongest at research universities The authors find no relationship between state appropriations and changes in resident enrollment However other research by the authors (Jaquette et al 2016) finds that growth in the share of nonresident students at public research universities is associated with a decreasing share of low-income and underrepresented minority students with this relationship strongest at the most prestigious universities These results provide evidence that state disinvestment in public higher education may induce institutions to shift their focus away from serving underrepresented students toward students with the ability to pay the most tuition
Although Jaquette and Curs (2015) find that research universities are the most likely public universities to adopt an out-of-state student enrollment strategy to replace lost funds from decreasing state appropriations other types of public universities may be adopting different strategies Jaquette (2019) explores one such strategy the increasing enrollment of masterrsquos students who typically pay out of pocket for their tuition (unlike doctoral students) and face higher tuition than in undergraduate programs Jaquette (2019) focuses on public masterrsquos universities those that award masterrsquos degrees but few doctorates and explores the relationship between state appropriations and growth in masterrsquos student enrollment Using fixed effects panel models on data spanning the 1993 to 2015 academic years Jaquette finds a positive relationship between state appropriations and masterrsquos student enrollment largely driven by a strong positive relationship in the 1990s that dropped off in the 2000s Unlike the negative relationship between state appropriations and out-of-state student enrollment increases in state appropriations were associated with growth in graduate enrollment
IMPACTS ON GRADUATION RATES AND COMPLETIONS
The research overwhelmingly finds evidence that cutting state appropriations leads to detrimental credential outcomes both in graduation rates and the quantity of credentials awarded The vast majority of studies reviewed in this section use institution-level data from IPEDS and state-level data from SHEEO to estimate the relationship between state appropriations and either graduation rates or degree completions Graduation rates represent the proportion of full-time students in a given entering cohort who complete their credential in a certain time frame (typically 100 or 150 time) The graduation rate measure found in IPEDS excludes students who began part time or transferred into an institution Further it considers students who transfer institutions prior to completing their credential to be non-completers regardless of whether these students go on to earn a credential at a different institution than where they began The other predominant metric used in this section completions measures the total number of students or total number of credentials earned in a given time period Although this measure is inclusive of credentials earned by all students at a given institution (eg part-time and transfer students) it is not informative about the proportion of students who finished their credential Although neither measure provides a perfect estimate of the effect that changes in state appropriations have on students
SHEEO INVESTIGATING THE IMPACTS OF STATE HIGHER EDUCATION APPROPRIATIONS AND FINANCIAL AID43
copy 2021 by the State Higher Education Executive Officers Association (SHEEO)
successfully completing their degree the clear takeaway from the extant literature is that cutting state appropriations leads to unfavorable degree outcomes (possibly due to declining institutional spending discussed above)
GRADUATION RATES
Zhang (2009) examines the effects of changes in state funding on six-year (150 time) graduation rates at public four-year institutions also focusing on a pre-Recession time period (1992-1999) Using panel data fixed effects models which allows him to analyze changes within institutions over time while controlling for a number of potentially confounding variables Zhang estimates the overall effects for all institutions as well as separate effects by institution type (ie researchdoctoral masterrsquos liberal arts) and by level of funding (eg increase in funding decrease in funding) When other factors are held constant a 10 increase in state appropriations per FTE student at a four-year public institution is associated with approximately a 064 percentage point increase in graduation rates Zhang separately estimated the effect of a 10 change in state funding on institutions that experienced an increase in state appropriations from the first to second half of his study period and those that experienced a decrease in funding Zhang finds that increases in state funding have a larger impact on graduation rates than state funding cuts A 10 increase in state funding per FTE is associated with a 75 percentage point increase in graduation rates while a 10 decrease in state funding is associated with a 56 percentage point decrease in graduation rates33
COMPLETIONS
Using the budget shock instrument discussed above Deming and Walters (2018) find that an increase in state appropriations to an institution has no impact on the total number of credentials awarded (certificates and degrees) in that year but has a positive effect on total awards in subsequent years A 10 increase in institutional spending increased credentials awarded at community colleges by 145 and BA attainment at four-year institutions by 4534 Just as with the effect on enrollments the authors find that the effect of state appropriation changes on total awards is driven by changes in spending rather than changes in tuition
Bound et al (2019) provide additional evidence that cuts in state appropriations negatively impact degree attainment separately estimating the effects for research and non-research public universities on number of bachelorrsquos degrees masterrsquos degrees and doctorates awarded Among public research universities a 10 decrease in state appropriations per FTE leads to a 36 drop in bachelorrsquos degree attainment and a 72 decrease in PhD attainment35 There are no statistically significant changes in degree attainment at non-research universities as a result of changes in state funding
Zhao (2018a) provides further evidence that cuts in state appropriations are associated with a decrease in degree completion at public institutions and explores variation among institution types
33 Zhang examines the heterogeneity in results between institution types and finds that a 10 increase in state funding per FTE is associated with approximately a 1 percentage point increase in graduation rates at researchdoctoral institutions At masterrsquos institutions the estimated effect is approximately half as large The estimated effect for state funding at liberal arts institutions is of similar magnitude to masterrsquos institutions although it is not statistically significant
34 At community colleges a 10 increase in institutional spending increased awards by 145 in year t+1 and 146 in year t+2 At four-year institutions a 10 increase in institutional spending in year t caused BA attainment to increase by 46 in year t+2 and 45 in year t+3
35 This effect is strongest for STEM graduate degrees with a 10 decrease in appropriations resulting in a 5 decrease in STEM masterrsquos degrees and a 102 decrease in STEM PhDs
SHEEO INVESTIGATING THE IMPACTS OF STATE HIGHER EDUCATION APPROPRIATIONS AND FINANCIAL AID44
copy 2021 by the State Higher Education Executive Officers Association (SHEEO)
He estimates the impacts using a panel data model with institution and year fixed effects run on data from 1987 to 2012 Since different types of institutions (ie doctoral institutions masterrsquos institutions bachelorrsquos institutions and community colleges) vary in their ability to respond to cuts in state funding with increased tuition and fees andor increased enrollment of out-of-state students Zhao calculates the estimation equation separately by institution type This allows the coefficients of each explanatory variable to vary between institution type and enables a better understanding of how cuts in state appropriations differentially impact different types of institutions At doctoral institutions a one standard deviation decrease in state appropriations per FTE ($5338) led to a 007 and 043 per 100 FTE students reduction in doctoral and masterrsquos degrees awarded respectively There is no statistically significant effect on undergraduate degree production which the author notes may be due to doctoral institutions responding to state cuts by shifting resources away from graduate students to protect undergraduate education At masterrsquos institutions a one standard deviation decrease in state appropriations per FTE student ($2811) reduced bachelorrsquos degree productivity by 044 per 100 FTE students and did not statistically impact graduate degree productivity Although the coefficients for the impact of a one standard deviation decrease in appropriations per FTE at bachelorrsquos institutions ($3178) were similar to those for masterrsquos institutions these results were not statistically significant Community colleges faced the most detrimental impact in their degree productivity with a one standard deviation decrease in state appropriations per FTE student ($2962) resulting in a 168 per 100 FTE students reduction in associate degrees conferred Doctoral institutions and to a lesser degree masterrsquos institutions respond to lost state appropriations with a combination of tuition increases and spending cuts Community colleges are unable to increase their tuition and instead the bulk of the impact of state appropriation cuts is in the form of decreased education expenditures Zhao posits that this disproportionate impact on education expenditures concentrated most heavily in instructional spending is why community college degree production is hit hardest by an equivalent decrease in state funding cuts per FTE
Using a similar approach as Deming and Walters (2018) Chakrabarti et al (2020) estimate the effect of a change in state appropriations while a student is enrolled in college on degree completion and transfer behavior Chakrabarti et al use data from the New York Federal Consumer Credit Panel (CCP) which includes individual-level consumer credit records from a 5 random sample of US individuals with credit To this student-level financial data the authors merge individual student-level postsecondary education records from the National Student Clearinghouse and institutional-level IPEDS data The authors use a shift-share instrument approach in order to mitigate the introduction of bias caused by the correlation of an institutionrsquos share of state appropriations and institutional qualitystudent characteristics The measure interacts the historical share of an institutionrsquos revenue coming from state appropriations (based on 1986) with the total state appropriations in the year when a student was enrolled in their second year of college The authors find that for students who first enrolled at a four-year institution experiencing a $1000 per FTE increase in state appropriations while enrolled increases the likelihood of earning a bachelorrsquos degree by age 25 by 15 percentage points but has no effect on the likelihood of earning a bachelorrsquos degree by age 30 suggestive that increases in state appropriations help shorten time to degree Among students who started at a two-year college each $1000 increase in state appropriations while enrolled increases the likelihood of transferring to a four-year institution by age 30 by 31 percentage points Similar to the results for four-year enrollees a $1000 increase in state appropriations increases the likelihood of earning a bachelorrsquos degree by age 25 by 39 percentage points but has no statistically significant effect on likelihood of completing a bachelorrsquos degree by age 30 In their exploration into the mechanisms at play Chakrabarti et al find evidence that four-year institutions respond to increases in state appropriations by decreasing tuition but do not alter their institutional spending on instruction student services or academic support The authors find that two-year institutions respond to increases in state appropriations with price and quality responses both decreasing tuition and increasing institutional spending
SHEEO INVESTIGATING THE IMPACTS OF STATE HIGHER EDUCATION APPROPRIATIONS AND FINANCIAL AID45
copy 2021 by the State Higher Education Executive Officers Association (SHEEO)
STATEWIDE DEGREE ATTAINMENT
Trostel (2012) introduced in the enrollment section uses SHEF and IPEDS state-level data from 1985 through 2006 to measure the impact of changes in state support for higher education on degree attainment The results of his two-stage instrumental variables model show that a $1000 increase in state funding per recent high school graduate is associated with a 32 percentage point increase in degree attainment defined as the percentage of the state population aged 35-64 with a bachelorrsquos degree He examines the relative effects of a change in state support and a change in tuition and finds that the effect of state and local appropriations on degree attainment is larger than that of a change in college price
EFFECTS OF STATE APPROPRIATIONS ON ADDITIONAL FINANCIAL OUTCOMES
Several studies examined the effect of changes in state appropriations on outcomes that impact students beyond the time they leave postsecondary education Chakrabarti et al (2020) studied the long-run financial and credit outcomes of state appropriation shocks while students are enrolled in college The authors predominantly focus on outcomes for 25-30 and 30-35-year-olds separately based on whether a student first enrolled at a two- or four-year institution For certain outcomes the authors separately examine outcomes for 22 25 30 and 35-year-olds Chakrabarti et al find that among students who first enrolled at a four-year institution experiencing a $1000 increase in state appropriations while enrolled decreased the probability of ever originating a student loan by approximately 2 percentage points across all age groups (although the result was not statistically significant for 35-year-olds) and decreased the total amount of loans borrowed with results ranging from a $640 reduction by age 22 and a $5363 reduction by age 35 Among four-year students experiencing a positive state appropriation shock during college had little effect on other long-run financial outcomes measured such as credit score presence and amount of auto loan presence and amount of home loan and average adjusted gross income (AGI) of current neighborhood For students who first enrolled at a two-year school experiencing a $1000 increase in state appropriations while enrolled decreased the likelihood of ever originating a student loan with estimates ranging from 14 to 61 percentage points among the various age groups State appropriation increases had little statistically significant effect on total amount borrowed but considerably decreased the likelihood of default or delinquency In contrast to the findings for four-year enrollees experiencing an increase in state appropriations while enrolled had a positive effect on the long-run financial outcomes of individuals who first enrolled at a two-year college with many of the effects stronger among the older cohort For these students experiencing an increase in state appropriations while enrolled led to an increased likelihood of having an auto loan a lower likelihood of having delinquent car debt an increased credit score and an increased AGI by zip code of residence
Goodman and Volz (2020) provide some additional evidence that cuts to state appropriations lead to an increase in student borrowing although their results represent changes in state-level student borrowing They find that between academic years 2000-2010 a 10 cut in state appropriations led to a 69 increase in student borrowing at public and for-profit institutions This increase was driven by a growth in enrollments in the for-profit sector (a sector with higher borrowing behavior) as well as increases in net tuition paid at public institutions
SHEEO INVESTIGATING THE IMPACTS OF STATE HIGHER EDUCATION APPROPRIATIONS AND FINANCIAL AID46
copy 2021 by the State Higher Education Executive Officers Association (SHEEO)
For an overview of the findings presented in this section please see Table 2 For a more detailed examination of each study see Public Investment in Higher Education Research Strategies and Policy Implications project page36
TABLE 2 SUMMARY OF STATE APPROPRIATIONS LITERATURE REVIEW
EFFECTS OF DECREASES IN STATE APPROPRIATIONS ON INSTITUTIONS
Public institutions respond to declines in state appropriations in two main ways (1) raising tuition revenues and (2) decreasing institutional expenditures
CHANGES IN TUITION CHANGES IN INSTITUTIONAL EXPENDITURES
middot State appropriations are inversely related to tuition rates
at public four-year institutions
middot Institutions that are unable to raise tuition and fees to the extent
needed to offset state funding cuts respond to cuts
in state appropriations by decreasing expenditures
middot Institutions raise tuition revenue by increasing out-of-state
and international enrollments
middot The largest impact is on education and related expenditures
(instruction academic support and student services)
middot This strategy of raising alternative revenues is most prevalent
at doctoral institutions (especially state flagships) followed
by masterrsquos and bachelorrsquos institutions
middot This response is most prevalent at two-year institutions
and least common at doctoral institutions
middot The evidence is mixed on whether two-year colleges respond
to cuts by increasing tuition
EFFECTS OF DECREASES IN STATE APPROPRIATIONS ON STUDENT OUTCOMES
Through the mechanisms of changes in tuition and institutional expenditures cuts in state appropriations have a negative impact on student enrollment and graduation ratescompletion outcomes
STUDENT ENROLLMENT GRADUATION RATES AND COMPLETIONS
middot Decrease of in-state undergraduate enrollment with these
effects lasting several years
middot A decrease in degrees and certificates awarded at two-
and four-year institutions
middot Enrollment is not impacted equally across all sectors
students move from the public to for-profit sector
middot A decrease in graduation rates at four-year colleges
with the largest impact at researchdoctoral institutions
middot Some public four-year institutions (predominantly research
universities) respond to state appropriations cuts by increasing
their enrollment of out-of-state undergraduate students
middot A decrease in statewide bachelorrsquos degree attainment
SOURCE State Higher Education Executive Officers Association
HETEROGENEITY IN OUTCOMES
The research presented here suggests that changes in state appropriations have substantial impacts on institutional and student outcomes at the national level However conducting analyses at the national level masks the wide variation between states in funding levels and the extent to which public institutions depend on state funding The findings described here may vary across individual states given their different funding contexts both with the level of state funding on a per-student basis and the proportion of institutional revenues that come from the state
36 httpssheeoorgprojectpublic-investment-in-higher-education-research-strategies-and-policy-implications
SHEEO INVESTIGATING THE IMPACTS OF STATE HIGHER EDUCATION APPROPRIATIONS AND FINANCIAL AID47
copy 2021 by the State Higher Education Executive Officers Association (SHEEO)
Within individual states there is wide variation in funding trends and contexts Likewise several articles in this section provide evidence that institutional responses to cuts in state funding differ between institution types Community colleges respond by adjusting institutional expenditures including spending on core functions such as instruction academic support and student services (Chakrabarti et al 2020 Zhao 2018a) Although expenditures at public four-year institutions are also impacted by shifts in state funding (Deming amp Walters 2018 Zhao 2018a) these institutions have far greater ability to replace lost state dollars in part through tuition increases (Webber 2017 Zhao 2018a) Public doctoral institutions respond to declines in state funding with the largest increases in tuition followed by masterrsquos institutions and to a lesser extent bachelorrsquos institutions Further as referenced before Jaquette and Curs (2015) find that research universities are the most likely public universities to adopt an out-of-state student enrollment strategy to replace lost funds from decreasing state appropriations
There is also heterogeneity between institution types in the impact of changes in state funding on student outcomes Decreases in state appropriations are most detrimental to credential completion at community colleges (Deming and Walters 2018 Zhao 2018a) However the literature is mixed on the effect among types of public four-year institutions Zhao (2018a) finds that a decline in state appropriations leads to a decrease in bachelorrsquos degree completion at masterrsquos institutions but has no statistically significant effect on undergraduate degree completion at doctoral or bachelorrsquos institutions Meanwhile Bound et al (2019) find the opposite Cuts in state funding lead to a decrease in bachelorrsquos degree completion at public research universities but have no effect on degree production at non-research public four-year colleges
The studies reviewed in this section discuss the impact of a given percentage change in state funding but there are vast discrepancies between institution types in the amount of per-student state funding received In the next section we review the evidence on disparities in public funding across institution types
INEQUALITIES BUILT INTO THE CURRENT FUNDING SYSTEM
Much of what we know about inequalities built into the current state funding system for higher education comes from descriptive analyses As previously discussed the distribution of state and local funding to public institutions differs by level with four-year institutions receiving considerably more funding but with a stronger recovery of public funding at two-year institutions having occurred following the Great Recession In most states four-year doctoral research-extensive institutions receive the most funding while four-year doctoral masterrsquos and baccalaureate institutions receive less While associate-granting institutions were the lowest funded in 2001 funding at non-research four-year institutions has declined enough over time that their current state and local funding levels are comparable on a per-FTE basis (Figure 13)
SHEEO INVESTIGATING THE IMPACTS OF STATE HIGHER EDUCATION APPROPRIATIONS AND FINANCIAL AID48
copy 2021 by the State Higher Education Executive Officers Association (SHEEO)
FIGURE 13STATE AND LOCAL APPROPRIATIONS PER FTE AT PUBLIC INSTITUTIONS BY CARNEGIE CLASSIFICATION (CONSTANT $) US 2001-2017
$0
$2000
$4000
$6000
$8000
$10000
$12000
$14000
$160002
00
1
20
02
20
03
20
04
20
05
20
06
20
07
20
08
20
09
20
10
20
11
20
12
20
13
20
14
20
15
20
16
20
17
FUN
DIN
G P
ER
FT
E
RECESSION ASSOCIATES BACCALAUREATE DOCTORAL RESEARCH DOCTORAL MASTERS
NOTES
1 State and local appropriations include funding for non-credit medical agriculture and research State-funded financial aid is not included Due to the structure of IPEDS finance data any grants or contracts allocated to public institutions for general operating could not be included
2 Institutions with special or mixed Carnegie classifications are excluded The doctoral research classification refers only to the highest research activity institutions
3 Estimated 2001 and 2002 12-month FTE using available fall FTE data and 12-month as a proportion of fall FTE for the earliest available year(s)
4 Constant 2017 dollars adjusted by the Higher Education Cost Adjustment (HECA)
SOURCES IPEDS Finance Survey 2001-2017 IPEDS Directory 2001-2017 Carnegie Classifications 2000 2005 2010 2015
The differences in state funding are exacerbated because four-year research institutions also have the greatest ability to increase alternative revenues for example by raising tuition rates (Ehrenberg 2006) and attracting more out-of-state students (Bound et al 2019 Jaquette amp Curs 2015) With both higher state appropriations and higher funding from other sources four-year research institutions have substantially more revenue available to spend on student instruction and are less likely to reduce expenditures when faced with state funding declines (Mugglestone et al 2019) As discussed in the previous sections additional spending and revenue have been shown to improve student outcomes on a number of measures
Inequalities across institution types are particularly concerning because of the demographics of students who attend in each sector Students of color attending public institutions are overrepresented at community colleges and less-selective institutions and these institutions tend to have fewer resources due to a combination of low state support and an inability to increase alternative revenues (Ahlman (2019) From 2006 through 2016 underrepresented students of color (defined as American IndianAlaska Native Black Latinx and Native Hawaiian or Other Pacific Islander) made up an increasing proportion of enrollment at all public institutions but were disproportionately likely to attend community collegesmdashthe public colleges with the fewest
SHEEO INVESTIGATING THE IMPACTS OF STATE HIGHER EDUCATION APPROPRIATIONS AND FINANCIAL AID49
copy 2021 by the State Higher Education Executive Officers Association (SHEEO)
resources In 2016 community colleges served over half of underrepresented public college students of color Doctoral universities which typically have the most resources disproportionately educate the most advantaged (full-time white affluent) students (Mugglestone et al 2019) These patterns suggest that institutional funding may not only be unequal but inequitable as well as states increase the existing advantages of affluent white students and provide the most resources to institutions that need them the least (thanks to their ability to raise alternative revenues)
Ahlman (2019) finds that during and following the Great Recession changes in core revenues increased inequities in core revenues across institution types Although state funding per student increased slightly at community colleges during this time period while declining at other public institutions Ahlman (2019) found that in 2016 community colleges still received $2900 less per student in state funding than doctoral institutions In addition community colleges must remain affordable and therefore receive much less tuition revenue than four-year institutions and in 2016 community colleges had about two-thirds of the total core revenue of public baccalaureate and masterrsquos institutions and only 37 of the total core revenue at public doctoral institutions Taken together this information leads to an important conclusion States provide differential levels of support to different groups of college students (Long 2016) and these trends exacerbate existing inequities (Ahlman 2019)
In addition changes in how funding is distributed can have differential impacts across institution types When Colorado adopted a voucher model for higher education funding in 2004 which effectively rerouted state appropriations from institutions to students there were negative impacts for underrepresented students At both two- and four-year public institutions fewer Hispanic students enrolled than prior to the funding model change fewer Black students enrolled in four-year public institutions and fewer low-income students enrolled in two-year institutions (Hillman et al 2014)
RECOMMENDATIONS
Research on the impacts of state appropriations is moderately well developed but in some cases conflicting results point to the need for future research Nevertheless the studies reviewed here present important evidence regarding the impacts of funding decisions made by states Such findings lead to several important recommendations for state policymakers and higher education leaders
First much of the research on state appropriations has focused on the impacts of declining appropriations on public institutions Over time institutions have increased tuition revenues and decreased expenditures in response to declining per-student state appropriations (Deming amp Walters 2018 Goodman amp Volz 2020 Webber 2017 Zhao 2018a) Declining appropriations and the resulting impact on institutional expenditures lead to tangible differences in student outcomes
bull Recommendation 1 for states Decreases in state appropriations lead to cuts in institutional spending on services that are essential for student success (eg instruction academic support student services) Since public four-year institutions particularly research universities have a wider range of alternative revenue sources (eg increasing tuition increasing enrollment of out-of-state students) and are less reliant on state appropriations regional institutions and community colleges experience the most detrimental cuts to institutional expenditures as a result of declining state appropriations (Zhao 2018a)
SHEEO INVESTIGATING THE IMPACTS OF STATE HIGHER EDUCATION APPROPRIATIONS AND FINANCIAL AID50
copy 2021 by the State Higher Education Executive Officers Association (SHEEO)
States should consider all institutional revenues and make strategic decisions regarding state appropriations in concert with decisions about tuition rates and out-of-state tuition caps
Next state funding has important impacts on enrollment and completion that must be considered Appropriation declines lead to increases in out-of-state enrollment and constrict access to in-state students particularly at public flagship institutions (Bound et al 2019 Jaquette amp Curs 2015) while funding increases are positively related to student enrollment (Deming amp Walters 2018 Jaquette 2019 Trostel 2012) Further evidence suggests that funding declines change enrollment patterns as students shift from public to private for-profit institutions (Goodman amp Volz 2020)
Changes in state appropriations have also been shown to impact graduation rates the number of credentials awarded and statewide degree attainment Declines in state appropriations lead to reductions in these measures (Bound et al 2019 Zhang 2009 Zhao 2018a) while increases have a positive effect (Chakrabarti et al 2020 Deming amp Walters 2018 Trostel 2012 Zhang 2009) In order to put these findings in context we use the point estimates from several studies in this section (Bound et al 2019 Deming amp Walters 2018 Zhao 2018a) to simulate the potential impacts that a $1000 decrease would have on todayrsquos completions These simulations found on page 61 make clear the detrimental impacts that cutting direct funding to institutions has on subsequent student completion outcomes
bull Recommendation 2 for states Direct state support to institutions has positive impacts on enrollment and completion outcomes As states continue to work toward statewide attainment goals they are unlikely to meet these goals without increased investment in their institutions Although most states are facing increasingly tight budgets in response to the coronavirus pandemic states should increase investments in their public postsecondary institutions as possible
However the effects of state appropriations on institutions and students differ by sector and by an institutionrsquos reliance on state support (Deming amp Walters 2018 Zhao 2018a) These differences exacerbate existing inequalities in state appropriations because the institutions with lower per-student appropriations are also those that struggle to increase alternative revenues in response to declining state support (Mugglestone et al 2019)
bull Recommendation 3 for states There is large variation between institution types in baseline amounts of state appropriations received institutional responses to changes in state appropriations and the effects of these changes Public two-year institutions and open-access four-year institutions which serve the bulk of underrepresented students receive the lowest amount of funding and experience the most adverse effects of funding cuts These institutions are also often the most reliant on state funding and therefore would be disproportionately impacted by across-the-board state funding cuts States should take stock of whether current funding disparities between institution types represent inequitable funding patterns through a state funding equity audit and adjust funding accordingly
SHEEO INVESTIGATING THE IMPACTS OF STATE HIGHER EDUCATION APPROPRIATIONS AND FINANCIAL AID51
copy 2021 by the State Higher Education Executive Officers Association (SHEEO)
Additional research is needed to continue informing the policymaking process surrounding state operating support to public institutions We offer the following suggestions for researchers in the field
bull Recommendation 1 for researchers The bulk of the literature on state appropriations uses aggregate data at the institution level but the field would benefit from research conducted using student-level data This will allow for the estimation of how effects differ by student subgroup including how the effects of shifts in state appropriations differ by raceethnicity and income level Chakrabarti et al (2020) utilize individual-level data from the New York Federal Consumer Credit Panel but administrative data at the student level from state data systems are also a viable data source for this level of analysis The literature on the impacts of changes in state higher education funding has become increasingly rigorous most notably with the use of a shift-share instrumental variables approach utilized by several sets of authors in this section (Bound et al 2019 Chakrabarti et al 2020 Deming amp Walters 2018 Webber 2017)
bull Recommendation 2 for researchers The field should continue to move toward more causal research designs that isolate the effect of state appropriations In addition researchers should be sure to consider the effects of tuition on student outcomes37 and should carefully consider the meaning of the standardizing metrics they use (such as per-FTE per-student or per-capita)
Embedded in much of the current literature on state appropriations is an assumption that the effect of a change in state appropriations is linear however it is likely that the given increase or decrease will have differential impacts on a state with low versus high funding levels Further states vary considerably in their level of state funding per student tuition price and tuition-setting processes and composition of postsecondary institutions and students all of which contribute to the role that state funding plays in student success
bull Recommendation 3 for researchers Gaining a more nuanced understanding of the effects of changes in state appropriations for whom in which states and institutions and at what funding levels would allow for a more intentional and targeted investment of state dollars Similarly further analysis of the heterogeneous effects of changes in state appropriations on institutions with varying reliance on state funding would help answer important questions about disparate impacts
In the next section we turn to a review of the literature on the impacts of federal and state financial aid allocations Unlike general operating appropriations financial aid is awarded directly to students (rather than institutions) and has the potential to target particular populations more directly The financial aid literature is also more well-developed than the appropriations literature allowing a more nuanced analysis of previous findings
37 Researchers will need to do so carefully as tuition is endogenous in this setting which is why it is not used in Toutkoushian amp Hillman (2012) and other studies The shift-share approach (Bound et al 2019 Chakrabarti et al 2020 Deming amp Walters 2018 Webber 2017) mentioned in footnote 27 helps mitigate this concern
SHEEO INVESTIGATING THE IMPACTS OF STATE HIGHER EDUCATION APPROPRIATIONS AND FINANCIAL AID52
copy 2021 by the State Higher Education Executive Officers Association (SHEEO)
PRIOR LITERATURE ON THE EFFECTS OF GRANT AID
The literature quantifying the effects of grant aid on student outcomes has grown considerably in recent decades and is more developed than research on state appropriations Significant advancements in econometric techniques coupled with higher quality and larger quantities of administrative data have allowed researchers to more credibly identify the causal effects of these programs improving upon the financial aid research from the 1980s and 1990s (Alon 2005 Cellini 2008) So many of these studies have been written that other researchers have already provided a service to the field by summarizing their results often concluding that reducing the price of college through grant aid leads to higher rates of college enrollment persistence and completion among other outcomes (Deming amp Dynarski 2010 Dynarski amp Scott-Clayton 2013 Herbaut amp Geven 2020 Nguyen et al 2019 Page amp Scott-Clayton 2016) Thus this review of the literature will instead focus on reconciling some of the outstanding discrepancies between recent studies in the hopes of advancing the fieldrsquos understanding of the impact of grant aid We will focus our review on the impacts of state grant aid programs and include evaluations of federal grant aid programs local promise programs and philanthropically funded programs when we believe they provide important context
This section is organized as follows After first outlining our research review methods we discuss the effects of grant aid on enrollment overall for in-state and out-of-state students and by institutional sector and control Next we turn to the impacts of receiving or losing a state grant on persistence We then discuss the impacts of grant aid on college completion and post-college outcomes We end this literature review with several recommendations for policy-focused researchers and state policymakers
RESEARCH REVIEW METHODS
Though the review to follow is not exhaustive in scope a number of studies not cited were collected and reviewed In a similar fashion to the review of the appropriations literature we began with a foundational group of studies that had been collected independently by each author Due to the maturity of the financial aid literature we limited this collection to only those studies that utilized a quasi-experimental38 or experimental research design and were published within the last decade This initial collection effort resulted in 32 studies Next we used the works cited lists from these studies and the summary articles mentioned above (Deming amp Dynarski 2010 Dynarski amp Scott-Clayton 2013 Herbaut amp Geven 2020 Nguyen et al 2019 Page amp Scott-Clayton 2016) to find additional studies that met our research design standards and were published since 2000 This search effort resulted in an additional 59 studies to be reviewed We systematically reviewed the 91 studies collected and include summary information about each in a searchable and sortable online appendix39
38 For our purposes these research designs include regression discontinuity difference-in-differences and instrumental variables though we include some foundational studies from the literature that attempt to capture the longitudinal effects of financial aid through event history modeling and other related methods to provide important context
39 httpssheeoorgprojectpublic-investment-in-higher-education-research-strategies-and-policy-implications
SHEEO INVESTIGATING THE IMPACTS OF STATE HIGHER EDUCATION APPROPRIATIONS AND FINANCIAL AID53
copy 2021 by the State Higher Education Executive Officers Association (SHEEO)
FIGURE 14FLOWCHART OF REVIEW CRITERIA FOR FINANCIAL AID LITERATURE REVIEW
Excluded studies with the following research designsmiddot Analyses that solely rely upon fixed eects
middot Relational methods that do not get at causality
- Event History
- Competing Risks Models
- Maximum Likelihood Models
- Multi-Level Growth Models
middot Descriptive Analysis
middot Propensity score matching andor weighting
Does the study meet one of the following eligible designsmiddot Random Control Trial (RCT)
middot Regression Discontinuity
middot Dierence-in-Dierences
middot Instrumental Variable Estimation
Was the study published in 2000 or later Earlier studies are provided for historical context
Review for inclusion in literature review
Review for context only
YES
YES
NO
SOURCE State Higher Education Executive Officers Association
EFFECTS OF GRANT AID ON COLLEGE ENROLLMENT
OVERALL
The earliest studies examining the impact of grant aid on overall college enrollment often focused on the largest program then and today the Pell Grant and found null or even negative effects (Hansen 1983 Manski amp Wise 1983) In trying to explain the null effects of federal aid to that point McPherson and Schapiro (1991) provide a host of reasons including the confounding effects of the military draft for Vietnam on male enrollment the meager college wage premium that characterized the decade the two-period research design Hansen (1983) employs and finally they suggest that the increased targeting of financial aid to middle- and upper-income students in the 1970s may have attenuated the effects of the program on low-income students In their frequently cited review of the price response literature Leslie and Brinkman (1987) argue that the growth in low-income enrollment would not have kept pace with its higher-income counterparts if it were not for the Pell Grant In revisiting these studies and the data they employed Kane (1995) posits that the postsecondary marketplace at the time may have lacked the capacity to serve the influx of students the Pell Grant attempted to bring into higher education thus shutting out many low-income recent high school graduates40
Those who have followed the financial aid literature will find this scholarly debate all too familiar Thirty-to-forty years later researchers are still studying the impact of the Pell Grant on college access and are still concluding that it does not increase overall college-going (Carruthers amp Welch
40 It may be the case that the growth in state need-based aid programs brought about by the State Student Incentive Grant program may have confounded some of these results as well
SHEEO INVESTIGATING THE IMPACTS OF STATE HIGHER EDUCATION APPROPRIATIONS AND FINANCIAL AID54
copy 2021 by the State Higher Education Executive Officers Association (SHEEO)
2019 Eng amp Matsudaira 2020 Marx amp Turner 2018) though it may have an impact on which type of college a student enrolls in (Denning et al 2019)41 Many have attributed these findings to the complexity of the financial aid application process42 including the onerous Free Application for Federal Student Aid (FAFSA) and its income verification process (Dynarski amp Scott-Clayton 2013) Others have argued that these federal dollars may be captured by institutions in their awarding of grant aid and thus not realize their full purchasing power (Turner 2017) Finally there are those who rightly point out that the Pell Grant program is not well advertised prior to or even after a student completes her FAFSA (Carruthers amp Welch 2019)43
Early research on state grant aid on the other hand focused on newly implemented merit aid programs and found significant overall enrollment effects using aggregated data from national sources like the Current Population Survey (CPS) and the Integrated Postsecondary Education Data System (IPEDS) These studies mostly found sizable increases in college-going amongst recent high school graduates by comparing states with programs to those without (Abraham amp Clark 2006 Cornwell et al 2006 Dynarski 2000 Dynarski 2004)44 More recent research often relying upon state administrative data and regression discontinuity (RD) research designs complicates these earlier findings as they suggest state grant aid has no discernable impact on overall college-going (Bettinger et al 2019 Bruce amp Carruthers 2014 Gurantz amp Odle 2020) Both sets of studies are well-identified and use research designs that vastly improve upon earlier work however one need only look at the descriptive statistics in the more recent RD studies to understand why they conclude these state programs do not increase college-going For instance in their evaluation of the Cal Grant Bettinger et al (2019) report that the control mean college-going rate around both the GPA and income eligibility cutoffs exceeded 80 Bruce and Carruthers (2014) report similarly large college-going rates around their ACT threshold and Gurantz and Odle (2020) report rates exceeding 90 In each instance in order to implement the RD the authors had to delimit their samples in significant ways often conditioning the high school graduate sample to include only those students who submitted a financial aid application or those who took a standardized test In each instance the authors report college-going rates that exceed the unconditional college-going rate in their respective states by at least 20 percentage points On the other hand the earlier studies using publicly available data examined college enrollment in the aggregate for the state irrespective of application status or test-taking status leveraging cross-state variation through a difference-in-differences (DD) research design resulting in distinctly different samples than the RD studies Additionally if the programs themselves increased the number of students completing financial aid applications or taking the standardized tests used to condition the samples then the RD studies may not capture all of the effects of the programs on initial enrollment
41 One exception is Seftor amp Turner (2002) They astutely point out that by 1999 more than half of the federal dollars spent on the Pell Grant program were spent on students classified as independent for the purposes of financial aid and that these students were not the focus of prior research Using data from the Current Population Survey and a difference-in-differences research design they find that the Pell Grant program increased enrollment for adult men and women by 13pp (16) and 15pp (40) respectively Notably they find even larger gains for adults when the population is limited to high school graduates
42 Evidence-based changes to the financial aid application process were just passed as part of the Consolidated Appropriations Act of 2021 These changes will take effect no later than the 2023-24 academic year and include a significant reduction in the number of questions on the FAFSA a change in awarding terminology from Expected Family Contribution to Student Aid Index and simplified eligibility requirements for the Pell Grant For more information see httpstheconversationcomfederal-financial-aid-for-college-will-be-easier-to-apply-for-and-a-bit-more-generous-152785
43 Dynarski (2003) investigates another federal program the Social Security Student Benefit program which was quite generous both in the size of the award and in the scope of the program and finds that the effect on overall college enrollment for recent high school graduates was approximately 36 percentage points for each $1000 received Importantly individuals were contacted directly by the federal government to notify them of their eligibility
44 For an instructive conceptual overview of where researchers may go looking for identifying variation to quantify the impacts of grant aid see Bettinger (2004)
SHEEO INVESTIGATING THE IMPACTS OF STATE HIGHER EDUCATION APPROPRIATIONS AND FINANCIAL AID55
copy 2021 by the State Higher Education Executive Officers Association (SHEEO)
As mentioned above early studies on the effects of state merit aid suggested increases in overall college enrollment for recent high school graduates however later research suggests that these effects may not be as large as first interpreted (Dynarski 2004 Dynarski 2008) The CPS and decennial Census data used in these studies are not necessarily well suited to answer questions about college enrollment though insights may still be had45 No data source nor study for that matter is going to be able to answer all research questions related to a given policy but more recent evidence suggests that state merit aid programs may have had more of an impact on where students enrolled rather than their likelihood of enrolling at all
The recent proliferation of local and state-level college promise programs has led to a number of rigorous studies estimating their effects on college enrollment among other outcomes aligned with the ostensible purposes of these programs Research on the Tennessee Promise program (and its more localized predecessor) suggests that promise programs can have a substantial impact on initial college enrollment (Carruthers amp Fox 2016 Nguyen 2020) even though the last-dollar nature of the award means that the low-income students induced to enroll are being paid through federal and state need-based aid that was available to them before Tennessee Promise was implemented making the program far more affordable than other financial aid initiatives from the statersquos perspective Evaluating a similar statewide effort in Oregon Gurantz (2019) finds that the program did little to move the overall college-going rate in its first year but that college-going increased substantially in year two of the program Rigorous evaluations of local promise programs are not quite as definitive but point toward an increase in overall college-going especially for those students historically underserved (Bartik et al 2020 Gaacutendara amp Li 2020 Page et al 2019)
IN-STATE VS OUT-OF-STATE
One of the primary purposes of state broad-based merit grant aid programs is to keep the highest achieving high school graduates in state for their postsecondary pursuits The preponderance of evidence on this issue suggests that state merit aid programs are successful in inducing students to stay in their home state for college (Cornwell et al 2006 Fitzpatrick amp Jones 2016 Sjoquist amp Winters 2016 Zhang et al 2013 Zhang amp Ness 2010) Importantly however studies using state administrative data from Tennessee and Florida do not find impacts of state merit aid on in-state enrollment (Bruce amp Carruthers 2014 Gurantz amp Odle 2020) In reconciling these discrepant findings one could look to the standardized test score eligibility cutoffs The cutoff exploited in Tennessee (Bruce amp Carruthers 2014) is a composite score of 21 on the ACT exam which is right around the national average for test takers Perhaps students with higher ACT scores and more out-of-state postsecondary opportunities were affected by the merit aid program but the research design employed in this study cannot tell us much about that group of students The same phenomenon may be occurring in Florida around the SAT scores for the lower scholarship threshold (ie 970980 which is near the national average) though it is somewhat surprising that no effect is found around the higher SAT cutoff score of 1270 which is firmly in the top quintile of national SAT scores (Gurantz amp Odle 2020) More research is certainly needed to understand the few discrepancies that exist across studies but as stated the evidence on this research question strongly suggests that state merit aid has been successful in diverting many students to enroll in their home states
45 For an in-depth discussion of the data limitations that characterize these early studies see Dynarski (2004)
SHEEO INVESTIGATING THE IMPACTS OF STATE HIGHER EDUCATION APPROPRIATIONS AND FINANCIAL AID56
copy 2021 by the State Higher Education Executive Officers Association (SHEEO)
SECTOR AND CONTROL
The evidence on grant aid affecting where someone enrolls extends beyond the in-state and out-of-state margin to the sector and control of institutions attended The evidence in this area is also convincing as the vast majority of studies regardless of identification strategy and data source suggest grant aid often moves students from two-year institutions into four-year institutions when aid is available in both especially academically marginal and low-income students (Angrist et al 2020 Bartik et al 2020 Bruce amp Carruthers 2014 Cornwell et al 2006 Dynarski 2004 Page et al 2019a Toutkoushian et al 2015 Zhang et al 2013) Moreover when grant aid is limited to public institutions in the state we also see a pretty sizable shift in enrollment to those in-state institutions (Andrews et al 2010 Cohodes amp Goodman 2014 Goodman 2008) At the same time when aid is limited to specific sectors in a given state therersquos evidence to suggest that students will enroll in those institutions as well (Carruthers amp Fox 2016 Cohodes amp Goodman 2014 Gurantz 2019b Nguyen 2020) Interestingly when state aid is transportable to private and public institutions therersquos some evidence to suggest that students may attend the higher cost institution (Bettinger et al 2019 Gurantz 2019a)
EFFECTS OF GRANT AID ON COLLEGE PERSISTENCE
GRANT AID RECEIPT
As states intermediary organizations and policymakers began shifting their focus from college access to college completion researchers started following suit The earliest rigorous studies on college persistence were predominantly focused on addressing the endogeneity of aid receipt in their modeling strategies and research designs (Alon 2005 Bettinger 2004) As data systems have grown and become more longitudinal more recent research has treated persistence as a mechanism on the way to quantifying degree completion and time-to-degree (Anderson 2020 Anderson et al 2019 Andrews et al 2020 Angrist et al 2020 Bartik et al 2019 Castleman amp Long 2016)
In reviewing the most rigorous recent evidence it seems apparent that receiving student grant aid strongly impacts student persistence (Anderson 2020 Angrist et al 2020 Bartik et al 2019 Bettinger 2015 Castleman amp Long 2016 Page et al 2019a Page et al 2019b Scott-Clayton 2011) though these findings are not consistent across all contexts including perhaps the two-year sector (Anderson amp Goldrick-Rab 2018 Carruthers amp Welch 2020 Welch 2014)
GRANT AID LOSS
State merit aid programs not only have high school achievement requirements on the front end they also include academic benchmarks to maintain the aid once the student is enrolled in college These benchmarks are almost always higher than the benchmarks used for federal financial aid and the vast majority of state need-based grant aid programs This benchmark is known as Satisfactory Academic Progress (SAP) and includes college GPA and credit accumulation requirements established at the campus level Evaluations of these performance-based benchmarks are much less common than studies evaluating the impact of receiving grant aid though itrsquos reasonable to assume that the effects of receipt versus loss differ
SHEEO INVESTIGATING THE IMPACTS OF STATE HIGHER EDUCATION APPROPRIATIONS AND FINANCIAL AID57
copy 2021 by the State Higher Education Executive Officers Association (SHEEO)
Scott-Clayton and Schudde (2020) provide some of the most compelling evidence on the loss of grant aid to date In short they find that amongst community college students receiving federal financial aid missing the SAP benchmark increases performance in the short term but leads to a drastic reduction in student success over a longer time horizon Moreover the effects of the financial aid policy are distributed quite inequitably with those students in the lowest income group being most adversely affected The overall findings are consistent with an earlier study of theirs examining the impact of SAP on a different unnamed community college system (2016) Finally Carruthers and Oumlzek (2016) find that losing merit aid in Tennessee reduces persistence from the first to second year
EFFECTS OF GRANT AID ON COLLEGE COMPLETION
In their recently published meta-analytic review of this literature Nguyen et al (2019) state ldquohellipgenerally our findings support continued or increased investments in grant aid by demonstrating grant aid does increase persistence and completion even after conditioning on college enrollmentrdquo (p 865) They estimate that for every $1000 dollars of grant aid degree completion increases approximately 25 percentage points46 The average effect is large but it does mask some heterogeneity across program designs and aims
Though early studies suggested merit aid increased enrollment for many of the state broad-based programs (Cornwell et al 2006 Dynarski 2000 Dynarski 2004) follow-up studies aiming to quantify the downstream effects of those increased enrollments on completions suggest no such effects exist (Fitzpatrick amp Jones 2016 Sjoquist amp Winters 2015 Sjoquist amp Winters 2012) These studies used publicly available data and cross-state variation to quantify the effects of merit aid More recent regression discontinuity evidence also suggests that these state merit programs do not move the needle on completion (Gurantz amp Odle 2020) and in some cases may reduce a studentrsquos likelihood of success (Cohodes amp Goodman 2014) A notable exception on the merit aid front is Scott-Claytonrsquos (2011) evaluation of West Virginiarsquos program however
Recent evaluations of hybrid need-based and merit-based aid programs in California and Nebraska necessarily complicate our notions of merit Angrist et al (2020) evaluate a philanthropically funded grant aid program in Nebraska where participants must earn at least a 25 high school GPA and fall below an income cap that ranges from $80000 to $100000 (Page amp Scott-Clayton 2016) to gain access to a generous financial aid package Some may consider this a broad-based merit aid program with means testing Because the aid was randomly assigned the authors do not have to worry about exploiting a discontinuity in either of the program requirements and find that the program has significant effects on degree completion primarily driven by low-income and underrepresented racial groups Similarly Bettinger et al (2019) exploit a GPA cutoff in the Cal Grant merit aid program to find that the program had substantial impacts on degree completion Importantly the students around this GPA eligibility cutoff came primarily from lower income backgrounds than the students they evaluated around the income cap Within the context of the Cal Grant it seems the program had more of an impact on degree completion for the lower income students around the GPA cutoff
46 Nguyen et al (2020) rightly point out that scaling the effect of grant aid to $1000 regardless of program size assumes a linearity in the effect of grant aid that may not exist Dynarski (2000) makes a similar point though she emphasizes that the non-linearity may exist at the low or high end of aid stating ldquoIn the presence of liquidity constraints a threshold amount of aid may be needed to affect behavior leading a large grant to have a larger per-dollar effect than a small grant It is also plausible that the marginal effect of aid falls as aid risesrdquo (p 285)
SHEEO INVESTIGATING THE IMPACTS OF STATE HIGHER EDUCATION APPROPRIATIONS AND FINANCIAL AID58
copy 2021 by the State Higher Education Executive Officers Association (SHEEO)
Other evaluations of need-based aid in Wisconsin and Florida have shown significant effects and returns on investment for their respective states (Anderson 2020 Castleman amp Long 2016) Philanthropically funded programs aimed at low-income students also seem to impact degree completion (Page et al 2019b) On the other hand recent evaluations of a need-based grant aid program aimed at Pell Grant recipients in Wisconsin did not seem to meaningfully impact college completion (Anderson amp Goldrick-Rab 2018 Anderson et al 2019) Finally while most evaluations of the Pell Grant yield null effects two recent studies suggest the program impacts college completion (Denning 2019 Denning et al 2019) Notably Denning et al (2019) leverage the threshold for families to automatically be categorized in the highest financial need group rather than the Expected Family Contribution threshold that others have used (Marx amp Turner 2018) Students and families under this threshold are not required to complete the entire FAFSA so perhaps their estimated effects are not only capturing the effects of the Pell Grant but also a reduction in the complexity often associated with applying for financial aid (Bettinger et al 2012)
EFFECTS OF GRANT AID ON POST-COLLEGIATE OUTCOMES
Early studies examining the effects of grant aid on post-collegiate outcomes primarily focused on where students in states with merit aid programs resided after college (Fitzpatrick amp Jones 2016 Sjoquist amp Winters 2013 Sjoquist amp Winters 2014) In spite of evidence suggesting that college students stayed in state after graduation (Groen 2004) each of these studies finds little to no evidence to support the claim that merit aid programs are retaining college attendees or graduates in their workforce More research in this area is needed but the evidence to date suggests that merit aid programs may not be accomplishing one of their primary goals
Advancements in data access linkages and quality have only recently allowed researchers to examine additional post-collegiate outcomes related to the receipt of grant aid Bettinger et al (2019) as well as Denning et al (2019) find significant returns to the Cal and Pell Grants with estimates suggesting grant recipients in both programs went on to earn an additional 4-5 annually Though they do not have access to income data Scott-Clayton and Zafar (2019) find that grant recipients from West Virginia live in more expensive neighborhoods and are significantly more likely to be homeowners Finally Bettinger et al (2019) and Scott-Clayton and Zafar (2019) present evidence to suggest that receiving state grant aid as an undergraduate increases graduate school degree attainment between 3-4 percentage points over relatively short time horizons
For an overview of the findings presented in this section please see Table 3
SHEEO INVESTIGATING THE IMPACTS OF STATE HIGHER EDUCATION APPROPRIATIONS AND FINANCIAL AID59
copy 2021 by the State Higher Education Executive Officers Association (SHEEO)
TABLE 3 SUMMARY OF STUDENT GRANT AID LITERATURE REVIEW
EFFECTS OF FINANCIAL AID ON COLLEGE ENROLLMENT
The effects of student grant aid on overall college enrollment are mixed Programs that offer support services in addition to financial awards are more consistently successful Student grant aid often causes marginal
students to attend more expensive institutions and institutions where theyrsquore eligible to receive aid
OVERALL COLLEGE-GOING TYPE OF INSTITUTION
middot Therersquos little evidence to suggest the federal Pell Grant the
largest student grant aid program has a consistent effect
on college-going
middot Evidence consistently suggests that student grant aid
programs successfully induce where students enroll
rather than just if they enroll
middot Grant aid programs with advising and mentoring components
are more successful in causing students to enroll in college
middot Merit- and need-based grant aid cause students to enroll
in more expensive institutions (eg four-year vs two-year)
middot Student grant aid with easy application processes simple
eligibility requirements and marketing efforts are the most
successful in inducing students to enroll
middot The preponderance of evidence suggests that state merit
aid programs successfully retain students in their home state
for college but further research is needed
EFFECTS OF FINANCIAL AID ON COLLEGE PERSISTENCE amp COMPLETION
The evidence on the effects of grant aid on college persistence and completion is much more convincing than the evidence on enrollment with most studies suggesting aid causes students to persist and graduate
at higher rates than their non-aided peers
PERSISTENCE COMPLETION
middot Receiving student grant aid causes students to remain
in college
middot Meta-analytic evidence suggests that $1000 in student
grant aid increases the probability of completion by 25
percentage points
middot Little is known about the heterogeneous effects
of grant aid on student persistence
middot Those students with the most financial need are the
most likely to benefit from student grant aid
middot Grant aid programs that invest in the program beyond
just the money given to students (eg mentors intensive
advising etc) are the programs which have been the
most successful
SOURCE State Higher Education Executive Officers Association
RECOMMENDATIONS
If nothing else it is readily apparent that the number and quality of studies evaluating the impact of grant aid have grown considerably in recent decades Researchers have done an admirable job of accomplishing the historically difficult task of producing causal estimates quantifying the effects of grant aid Moving forward what can states learn from this literature to make the most of their scarce grant dollars
bull Recommendation 1 for states Money matters Most studies reviewed point toward additional dollars influencing student behavior Moreover the dollars invested in grant aid programs likely have a large return on investment for state and federal governments
bull Recommendation 2 for states There is currently a trade-off between targeting funds at those who would be most influenced by additional aid dollars (eg low-income students) and the messaging of simple eligibility requirements (eg state and local promise programs) It may behoove states who are able to fully or mostly fund their need-based financial aid to invest resources in marketing the program to students who have traditionally been unaware of state and even federal aid In fact research by Gurantz (2018) suggests these types of initiatives for targeted aid can be successful
SHEEO INVESTIGATING THE IMPACTS OF STATE HIGHER EDUCATION APPROPRIATIONS AND FINANCIAL AID60
copy 2021 by the State Higher Education Executive Officers Association (SHEEO)
bull Recommendation 3 for states The programs that are most successful invest in aid dollars as well as in support for students For instance in Tennessee their free college program does convey a simple message to their citizens but they also provide support for students considering college through governmental agencies as well as with significant support from philanthropic organizations The Dell Scholars program invests significant time and money in their students (Page et al 2019b) as does the Susan Thompson Buffett Foundation in Nebraska (Angrist et al 2020)
And what can researchers do to inform the policymaking process at the federal and state levels
bull Recommendation 1 for researchers Estimate heterogeneous effects by student subgroups whenever possible Therersquos much to be learned about how financial aid affects students across the ability spectrum at all income levels by racialethnic group and even by the timing of applications Understanding these more nuanced effects may not only help with determining mechanisms but it may also help the research and policy communities reconcile disparate findings and discover more efficient ways to target public dollars
bull Recommendation 2 for researchers Though it is not always possible it must be seen as paramount to include financial aid from all sources or at least from sources other than the program being evaluated A number of recent studies show that understanding how these aid programs interact is necessary to evaluating their true effects (Denning et al 2019 Evans amp Nguyen 2019 Marx amp Turner 2018)
bull Recommendation 3 for researchers Advancements in causal identification are laudable but at times policymakers are interested in students who do not show up near an eligibility threshold within a regression discontinuity research design Efforts to include estimates that include as many policy-relevant parameters are paramount The Scott-Clayton and Schudde (2020) evaluation of the SAP threshold is a great example of this approach
These recommendations are only a starting point but provide important direction for states looking to make key decisions regarding limited financial aid dollars The suggestions for researchers are intended to improve the usability of research in policymaking and provide the most relevant robust and accurate findings States must also do their part in collaborating with researchers by ensuring that the necessary data are accessible Additionally as states decide where to invest additional dollars it may behoove agency staff and policymakers to consider the relative impacts of state appropriations and more targeted financial aid programs
SHEEO INVESTIGATING THE IMPACTS OF STATE HIGHER EDUCATION APPROPRIATIONS AND FINANCIAL AID61
copy 2021 by the State Higher Education Executive Officers Association (SHEEO)
SIMULATED IMPACTS OF STATE APPROPRIATIONS AND FINANCIAL AID
Thus far our review of extant research has considered state appropriations and financial aid separately However these funding sources likely work together to improve student outcomes and in reality states must consider the relative impacts of each funding strategy and make decisions regarding both appropriations and grant aid in concert In this section we unite the literature reviewed in the previous two sections and simulate the impacts of increased general operating appropriations (often conceptualized as increased institutional resources or spending) and the impacts of state-funded student financial aid programs
EXISTING COMPARISONS AND NEW SIMULATIONS
To generate reasonably valid figures for each funding source we use estimates generated from some of the more methodologically rigorous studies reviewed in this paper to simulate impacts on todayrsquos enrollment and completions These simulations are at best a thought exercise intended to provide context and real numbers for the findings discussed in our literature review Our specifications and data are not the same as the authors of these studies and are hypothetical Additionally simulations between state appropriations and financial aid should not be directly compared for several reasons First studies on the effects of appropriations tend to use institution-level data while the strongest studies on the effects of financial aid use student-level data Second financial aid does not equally apply to all students and has redistributive and varying effects across student populations not seen with state appropriations where all students are impacted With these caveats outlined we now turn to prior studies that have conducted similar simulations
Most recently using a student-level College Board and National Student Clearinghouse dataset on enrollment and degree completion Avery et al (2019) simulated policy levers to raise bachelorrsquos degree completions Like our approach the authors used prior research to determine elasticities and quantify the effects of each policy Students were assigned a probability of graduating given their sector and demographic characteristics Under each policy scenario a studentrsquos probability of graduating (and the overall degree attainment rate) changes due to changes in graduation likelihood within the sector and the probability that a student attended a two- or four-year institution which also impacts their graduation rate Avery et al (2019) found that reducing tuition at four-year public colleges and increasing funding for four-year public institutions (which leads to increased spending) each had larger effects on bachelorrsquos degree completions than free community college and eliminating undermatching
In the Avery et al (2019) simulation reducing tuition by 10 at all four-year public institutions led to a 12 percentage point increase in enrollment and a 03 percentage point increase in bachelorrsquos degree attainment The cost was estimated at $270000 per additional bachelorrsquos degree Entirely eliminating tuition and fees for students from families making up to $60000 corresponded to a 31 percentage point increase in enrollment in the sector and a 29 percentage point increase in bachelorrsquos degree attainment (for families making less than $40000) with a cost of $114000 per additional bachelorrsquos degree On the other hand increasing state funding to reduce the inequality in institutional spending between private and public four-year institutions yielded a 07 percentage point increase in enrollment in the four-year public sector and a net 11 percentage point increase in bachelorrsquos degree completion The estimated cost was $121000 per additional bachelorrsquos
SHEEO INVESTIGATING THE IMPACTS OF STATE HIGHER EDUCATION APPROPRIATIONS AND FINANCIAL AID62
copy 2021 by the State Higher Education Executive Officers Association (SHEEO)
degree The findings did not allow for direct comparisons across policies because the authors did not simulate a particular level of state investment Instead each policy had a different estimated cost per student However both tuition and fee cuts and increases in state appropriations to increase institutional spending had all-around positive effects across groups and sectors
On the enrollment side Toutkoushian and Hillman (2012) examined whether appropriations need-based grants or merit-based grants were most effective at increasing enrollment rates Using a difference-in-differences approach and a mix of IPEDS NASSGAP and Grapevine data on state support for all states from 1988 to 2008 the authors found that increasing both appropriations and merit-based grants was associated with increased college-going rates but increases in merit-based aid had a much larger effect However they found no effect from the change in need-based grants on college-going rates Toutkoushian and Hillman (2012) note that many large need-based aid programs began prior to the start of their dataset and that any gains due to such programs may have occurred prior to their analysis period Overall this study supports the idea that broad-based merit aid programs may be particularly well suited to increasing college enrollment rates and points to the need for future research to likewise examine the relative impacts of increased investment in need-based grants merit-based grants and general operating appropriations separately
In another study Toutkoushian and Shafiq (2009) created several estimates of student price sensitivity and used those estimates to simulate the effects of need-based aid and appropriations on college enrollment rates The authors argued that it is more financially efficient and in statesrsquo best interests to focus on aid rather than appropriations because holding the total amount of state funding constant but replacing general operating appropriations with financial aid for students from low-income families increases the likelihood of low-income student enrollment and does not decrease the likelihood of other student enrollment
However as the authors discussed appropriations have the potential to be a much more stable (and less political) source of funding and allow colleges the discretion to use their funding to meet state and institutional goals rather than focusing specifically on attracting students and their tuition dollars Funding exclusively to student financial aid would not help institutions meet statesrsquo workforce economic development and civic needs (Toutkoushian amp Shafiq 2009)
SIMULATION 1 WHAT IS GAINED BY INVESTING IN HIGHER EDUCATION THROUGH
OPERATING SUPPORT
Using the statistically significant results found in three studies reviewed in the state appropriations literature review section (Bound et al 2019 Deming amp Walters 2018 Zhao 2018a) we conduct a series of simulations that predict the impact that a $1000 per FTE change in state appropriations will have on degree outcomes Since we are not able to discern from the studies which states are driving the observed effects we run the simulations at the US level estimating what the effect would be of an across-the-board change in state appropriations These simulations use the point estimates found in each paper as well as the lower and upper bound based on a 95 confidence interval
For enrollment and completion data we use IPEDS data from the 2018-19 academic year the most recent data available SHEEO SHEF data are used for state funding levels Average US state appropriations in 2019 were $8196 per FTE A $1000 increase (decrease) in state appropriations would represent a 122 increase (decrease) in state appropriations
SHEEO INVESTIGATING THE IMPACTS OF STATE HIGHER EDUCATION APPROPRIATIONS AND FINANCIAL AID63
copy 2021 by the State Higher Education Executive Officers Association (SHEEO)
Based on the details available in each of the studies we assume a consistent effect in all states and estimate an across-the-board $1000 per FTE change in state appropriations on overall outcomes at the US level However we know that the reality of state appropriations is much more nuanced States have vastly different levels of state funding and this funding is often unequally distributed to different types of institutions within each state Therefore we consider the results of the following three simulations to be a thought exercise about the approximate positive effects that future investments in state funding will likely have on degree completion and attainment rather than rigorous calculations of the effects of changes in state funding
SIMULATION 1A DEMING amp WALTERS (2018)
Deming and Walters (2018) examine the effect that a 10 change in institutional spending in a given year has on number of credentials awarded in the same year and subsequent three years Although Deming and Waltersrsquo measure of awards at community colleges includes both associate degrees and certificates here we assume a consistent effect across all award types and estimate the impact on number of associate degrees awarded
TABLE 4 SIMULATIONS BASED ON STATISTICALLY SIGNIFICANT FINDINGS FROM DEMING AND WALTERS (2018) ndash A $1000 INCREASE IN STATE APPROPRIATIONS PER FTE
INSTITUTION TYPE OUTCOME ESTIMATED CHANGE IN OUTCOMES
POINT ESTIMATE LOWER BOUND UPPER BOUND
Public two-year Change in AA degrees in t+1 years 216029 35313 396745
Public two-year Change in AA degrees in t+2 years 216623 31833 401413
Public four-year Change in BA degrees in t+2 years 75046 59 150032
Public four-year Change in BA degrees in t+3 years 73738 -7658 155133
NOTES 1 Deming and Waltersrsquo (2018) results represent the Local Average Treatment Effect for institutions in states that had tuition caps
and freezes that prevented them from raising additional revenue through tuition increases beyond a specified point Therefore these projections should be interpreted as the impact of decreasing state funding by $1000 and not allowing institutions to raise tuition in response
SOURCE State Higher Education Executive Officers Association
At public two-year institutions a $1000 increase in state funding per FTE would result in 216029 more associate degrees awarded in the following year and 216623 more associate degrees awarded two years later At public four-year institutions the same $1000 increase in state appropriations per FTE would result in an estimated 75046 more bachelorrsquos degrees awarded two years later and 73738 more bachelorrsquos degrees awarded three years later A $1000 decrease in state appropriations may have the opposite effect on credentials awarded and may result in the same magnitude of decreases of awards in the years following the funding decrease
SIMULATION 1B BOUND BRAGA KHANNA AND TURNER (2019)
Bound Braga Khanna and Turner (2019) report the effect of a 10 change in state appropriations per FTE on degree attainment estimating the effect separately for bachelorrsquos masterrsquos and PhD awards at research and non-research public four-year institutions
SHEEO INVESTIGATING THE IMPACTS OF STATE HIGHER EDUCATION APPROPRIATIONS AND FINANCIAL AID64
copy 2021 by the State Higher Education Executive Officers Association (SHEEO)
TABLE 5 SIMULATIONS BASED ON STATISTICALLY SIGNIFICANT FINDINGS FROM BOUND ET AL (2019) - A $1000 INCREASE IN STATE APPROPRIATIONS PER FTE
INSTITUTION TYPE OUTCOME ESTIMATED CHANGE IN OUTCOMES
POINT ESTIMATE LOWER BOUND UPPER BOUND
Public research four-year Change in bachelorrsquos degree attainment 65918 32992 98844
Public research four-year Change in PhD attainment 7054 2766 11341
SOURCE State Higher Education Executive Officers Association
At public research four-year institutions a $1000 increase in state appropriations per FTE would result in an estimated 65918 more bachelorrsquos degrees completed and 7054 more doctorates completed Again a $1000 decrease in state funding may have the opposite effect and may result in a decrease in degrees awarded
SIMULATION 1C ZHAO (2018)
Zhao (2018) estimates the effect of changes in state appropriations on degree productivity (the change in degrees granted per 100 FTE students) at public colleges He estimates the effect separately by degree level (ie associate bachelorrsquos masterrsquos doctoral) and institution type (ie community college baccalaureate masterrsquos doctoral) For this simulation we use FTE enrollment in each institution type separated by undergraduate and graduate enrollment based on IPEDS 12-month enrollment survey data
TABLE 6 SIMULATIONS BASED ON STATISTICALLY SIGNIFICANT FINDINGS FROM ZHAO (2018) - A $1000 INCREASE IN STATE APPROPRIATIONS
INSTITUTION TYPE OUTCOME ESTIMATED CHANGE IN OUTCOMES
POINT ESTIMATE LOWER BOUND UPPER BOUND
Public two-year Change in number of associate
degrees awarded 56055 34315 77796
Public masters Change in number of bachelorrsquos
degrees awarded4117 522 7713
Public doctoral Change in number of masterrsquos
degrees awarded961 494 1427
Public doctoral Change in number of doctoral
degrees awarded151 41 262
NOTES 1 Graduate enrollment numbers are based on total graduate enrollment and are not broken out by award level
(ie masterrsquos and doctoral)
SOURCE State Higher Education Executive Officers Association
At community colleges a $1000 increase in state appropriations would result in an estimated 56055 more associate degrees awarded A $1000 increase in state appropriations at public masterrsquos institutions leads to 4117 more bachelorrsquos degrees awarded Increasing state appropriations by $1000 at public doctoral institutions results in 961 more masterrsquos degrees and 151 more doctoral degrees awarded A $1000 decrease in state appropriations may decrease the number of each type of degree awarded by the same magnitude
SHEEO INVESTIGATING THE IMPACTS OF STATE HIGHER EDUCATION APPROPRIATIONS AND FINANCIAL AID65
copy 2021 by the State Higher Education Executive Officers Association (SHEEO)
SIMULATION 2 WHAT IS GAINED BY INVESTING IN HIGHER EDUCATION THROUGH
FINANCIAL AID
The financial aid literature includes many more rigorous evaluations of programs and policies than found in the general operating and appropriations literature As such we rely upon meta-analytic evidence to project what a change in financial aid spending may mean for degree production in the United States The most comprehensive of the recent reviews is Nguyen et alrsquos (2019) evaluation of the impact of merit- and need-based aid on persistence and degree completion Though they provide a range of estimates which factor in currency inflation type of aid and various definitions of completion we chose to use their point estimate of 25 percentage points as the effect of an additional $1000 of grant aid on degree completion Of course one could run these same simulations using a number of point estimates that they present or even point estimates from the studies one might deem to be the most rigorous as Avery et al (2019) do in their comparison of public policy levers in higher education finance Nevertheless given the evidence accumulated to date the 25 percentage point parameter seems like a reasonable approximation of the effect size of another $1000 in student grant aid
The studies within the financial aid literature are almost always estimating the impact of additional aid using student-level data and looking at a much smaller sample of potentially impacted students than the studies cited in the appropriations simulations above Determining which group of students to apply this parameter to is somewhat fraught as most nationally representative data do not allow for us to make similar comparisons to those studies cited in Nguyen et al (2019) That said we leverage Pell Grant cohort data from IPEDS as these are students who are known to have financial need and given differences in graduation outcomes amongst Pell and non-Pell Grant recipients we thought might be a more reasonable projection than just applying the policy parameter identified in Nguyen et al (2019) to overall graduation rates in the United States These data of course have their limitations as they only include Pell Grant recipients who can be placed into a cohort of first-time full-time college students who are seeking a credential Likewise because our point estimate combines both need- and merit-based state aid recipients some aid recipients would not be included in the Pell Grant population Nevertheless this population of students seems to be one of the most relevant for such an exercise given the other samples at our disposal47
Table 7 shows the projected increase in credential attainment across public four-year and public two-year colleges using all four years of the Pell cohort data currently available in IPEDS The majority of credentials that make up the increase in the public four-year sector are bachelorrsquos degrees while the public two-year attainment increases are comprised of associate degrees as well as certificates As can be seen an increase of $1000 per student would result in around 11000 additional credentials among Pell Grant recipients in four-year public institutions in each of the years presented and between 8000 and 9500 additional credentials among Pell Grant recipients in public two-year institutions
47 It is notable that the number of Pell Grant recipients who fall into these categories within public four-year and two-year colleges likely only represent about 10 of recipients nationwide
SHEEO INVESTIGATING THE IMPACTS OF STATE HIGHER EDUCATION APPROPRIATIONS AND FINANCIAL AID66
copy 2021 by the State Higher Education Executive Officers Association (SHEEO)
TABLE 7 SIMULATIONS BASED ON NGUYEN ET ALrsquoS (2019) META-ANALYTIC REVIEW - INCREASE OF $1000 PER PELL GRANT RECIPIENT
INSTITUTION TYPE OUTCOME 2016 2017 2018 2019
Public two-year Increase in number of credentials awarded 9521 9004 8306 7913
Public four-year Increase in number of credentials awarded 10780 11054 10738 10953
NOTES 1 Estimates include additional degrees earned amongst first-time full-time credential-seeking Pell Grant recipients reported to IPEDS
in the Graduate Rate survey files Years represent the completion year for 150 of normal completion time in each respective sector (eg 6 years in the four-year institutions and 3 years in the two-year institutions)
SOURCE State Higher Education Executive Officers Association
As stated in the prior simulation section we believe this exercise approximates how changing investment strategies result in different outcomes for students Of course there may be unforeseen responses or general equilibrium effects that the current research doesnrsquot inform or canrsquot foresee Perhaps most importantly these estimates say nothing about the cost-benefit calculation federal and state governments must make There are however two recent studies that rigorously quantify the impact of financial aid and find that federal (Denning et al 2019) and state (Anderson 2020) income tax revenues can pay for financial aid programs over a relatively short time horizon Finally as stated above the results of this financial aid simulation are not comparable to the results of the appropriations simulations In the next section we transition to a more contextual discussion about the unique impacts of state appropriations and grant aid on student enrollment and completion
UNIQUE IMPACTS ON STUDENT ENROLLMENT AND COMPLETION
The simulations presented in the previous section show a rough estimate of the impacts of state appropriations and grant aid on the number of credentials awarded and degree attainment However without additional context it is difficult to make out the meaning of these simulations Questions about the unique impacts of state appropriations and financial aid on desired outcomes have circulated for decades and there are important caveats to consider regarding the intents objectives and broad goals of state funding for higher education In this section we share historical and current context necessary to draw conclusions about the impacts of each type of allocation
CURRENT TRENDS IN CONTEXT
Any comparison of the effects of appropriations versus financial aid should consider that the different funding sources have varied intents and objectives Not all public funding for higher education is intended to increase enrollment and completion for all students For example states may choose to target programs that increase enrollment for the lowest-income students (through need-based aid) or may be interested in retaining students who are likely to leave the state for college (through merit-based aid)
Beyond a given statersquos intended objectives one must reconcile the theories that drove decision-making for decades with the realities of the more recent research on the effects of general appropriations and financial aid In short while providing a subsidy to low-income students may be more targeted and in fact increase degree completion the confluence of studies reviewed suggest that financial aid dollars alone generally do not succeed at bringing more students into higher education It seems that more simplistic broader programs with clear messaging are far more effective at encouraging students to enroll (Carruthers amp Fox 2016 Page amp Scott-Clayton
SHEEO INVESTIGATING THE IMPACTS OF STATE HIGHER EDUCATION APPROPRIATIONS AND FINANCIAL AID67
copy 2021 by the State Higher Education Executive Officers Association (SHEEO)
2016) This may be because financial aid programs especially state and federal need-based aid programs while efficiently allocated per theory are targeted in name only Of course only subgroups of students are eligible to receive the federal Pell Grant or state-level programs like the Texas Grant or the Cal Grant yet state and federal governments often do not invest enough money in making students aware that such programs exist They do not make use of data systems with financial information from K-12 student questionnaires the FAFSA or even publicly available data on income to notify students of eligibility48 Some may argue that because these state programs are underfunded these efforts may be wasteful but it could also be argued that prospective low-income students who lack the social and cultural capital to be aware of such programs are the very students who would benefit most from those aid dollars In fact recent research from Anderson (2020) suggests that these are the very students who would individually benefit and would benefit state economies the most if they could receive the additional dollars needed to enroll in and persist through college49 At the moment it seems higher-achieving low-income students or even students closer to income cutoffs (eg lower-middle and middle-income students) are the ones taking advantage of these programs Until state and federal governments are able to make financial aid dollars more targeted in practice it may behoove policymakers to continue focusing on maintaining and increasing general appropriations as tuition prices seem to have more salience in enrollment decisions than financial aid (Kane 1995 Long 2016)
Though many financial aid programs are underfunded state governments would more wisely invest dollars into these programs by pairing them with programmatic support either at the campus level or even system-wide especially if there are economies of scale to be realized In fact research by Deming and Walters (2018) suggests that institutions use additionally appropriated dollars to accomplish these very tasks by providing additional resources for instructional spending and academic support Campuses may be using financial aid dollars that come with a student to accomplish similar tasks but again the current design of financial aid programs requires that students are aware of these programs in order to bring additional dollars to a given campus
ALIGNING STATE FUNDING WITH THE GOALS OF HIGHER EDUCATION
When choosing how to allocate money to higher education it is important to consider the broad goals for public institutions (Hearn amp Longanecker 1985 Toutkoushian amp Shafiq 2009) If the goal is simply to spend the fewest state dollars possible to increase enrollment rates financial aid is likely a more efficient use of state funds Similarly if you want to create the most progressive and redistributive system wherein tax dollars are spent on low-income students to propel them to upper-income households financial aid may be the most effective investment However states and public institutions have broad and varying goals only one of which is providing access for all students regardless of income (Lingenfelter 2018) States also fund higher education to support
48 Studies examining the impacts of merit aid often have to deal with the endogenous retaking of standardized tests as students close to the eligibility threshold are aware that they are just missing out on financial aid and retake the exam to ensure eligibility (Bruce amp Carruthers 2014 Gurantz amp Odle 2020) Interestingly when examining income eligibility thresholds we never see bunching around the income or EFC required for eligibility (Denning et al 2019 Eng amp Matsudaira 2020 Marx amp Turner 2018) Of course it is nearly impossible to manipulate an EFC or income amount to become eligible for financial aid but we would expect students who are just eligible to apply for financial aid at rates that exceed those who are ineligible if program requirements were well-known or understood Until policymakers and researchers begin seeing this type of bunching one could argue we have not done a good enough job of advertising need-based financial programs Relatedly when examining who is endogenously retaking standardized tests to become eligible researchers should begin disaggregating these McCrary tests by income and other sociodemographic factors to see which types of students are aware of and react to these thresholds
49 Anderson (2020) cleverly looks at college enrollment and degree completion for the poorest students who apply for financial aid later in the application cycle These students who file later have much lower enrollment and degree completion probabilities than their earlier-applying peers and his research shows that state grant aid has a substantial effect on their college trajectories
SHEEO INVESTIGATING THE IMPACTS OF STATE HIGHER EDUCATION APPROPRIATIONS AND FINANCIAL AID68
copy 2021 by the State Higher Education Executive Officers Association (SHEEO)
its ability to provide high-quality and competitive education generate research educate workers for state economic development in key areas reduce income inequality and increase civic and cultural engagement (Dee 2004 Ma et al 2019 Saltmarsh amp Hartley 2011 Singh 2012 Trostel 2010) Therefore state operating support for higher education remains a critical and perhaps undervalued policy tool that positively impacts student completions state attainment rates and a host of other positive outcomes In order to get the most out of higher education and advance the statesrsquo interests increased investment in higher education is necessary
SHEEO INVESTIGATING THE IMPACTS OF STATE HIGHER EDUCATION APPROPRIATIONS AND FINANCIAL AID69
copy 2021 by the State Higher Education Executive Officers Association (SHEEO)
CONCLUSION
We find ourselves in the midst of a pandemic that has wreaked havoc on state budgets If past economic downturns serve as models then we can expect that higher education funding will be on the chopping block for many states hoping to make cost saving cuts for at least two to three more years
State investment in student financial aid is at an all-time high and comprises an increasing percentage of total state support for higher education While we applaud this investment by states in support of students attending postsecondary institutions states must also recognize the critical need of direct investment in institutionsrsquo operating budgets Through the pandemic we hope that states will increase funding when possible maintain when increased investment is not possible and when cuts must be made do so wisely Wise cuts recognize that institutions vary in the extent to which they depend on the state for their operating revenue (Anderson 2020 Lumina Foundation amp Bill amp Melinda Gates Foundation 2020) Some public research universities get less than 10 of their total revenue from the state while other institutions get over 50 of their total revenue from the state Across-the-board cuts punish those institutions that are more dependent on the state
As highlighted in the literature review section on state support cutting state appropriations leads institutions to cut spending on instruction academic support and student services resulting in detrimental student enrollment and completion outcomes On the front end declines in state funding lead to decreases in the enrollment of resident undergraduate students Cuts to state appropriations also lead to negative credential outcomes including an overall decrease in statewide bachelorrsquos degree attainment a decrease in graduation rates at four-year colleges and a decrease in degrees and certificates awarded at public two- and four-year institutions The effects of declining state appropriations are particularly damaging to credentials (ie associate degrees and certificates) awarded at community colleges which educate a disproportionate number of underserved students
We encourage states to not only reconsider overall funding cuts in the wake of the pandemic but to think critically about which institutions and by default which students they target with this funding The US postsecondary education system is highly stratified even within the public sector and students of color and low-income students disproportionately attend public two-year and open-access public four-year institutions (Carnevale amp Strohl 2013) These open-access institutions spend only a fraction per student compared to selective four-year institutions (Carnevale amp Strohl 2013) and receive substantially less per student in state appropriations Long (2016) found that controlling for other factors public research universities receive approximately $2500 more per FTE in state appropriations compared to non-research four-year colleges and over $5000 more per FTE than two-year colleges
A recent report by Hillman (2020) highlights that these inequitable funding gaps are growingmdashan increasing number of Black students and students receiving Pell Grants are enrolling in the most poorly funded institutions Addressing the stark gaps in enrollment and completion outcomes between the most and least advantaged students requires intentional intervention from states and a critical examination of how to more equitably distribute state spending on higher education is an important area of focus
SHEEO INVESTIGATING THE IMPACTS OF STATE HIGHER EDUCATION APPROPRIATIONS AND FINANCIAL AID70
copy 2021 by the State Higher Education Executive Officers Association (SHEEO)
As noted in the trends section states have developed a wide variety of financial aid programs that target different students Many of the initial state aid programs included a need-based component that targeted aid toward lower-income students Merit-aid programs were developed to keep the best and brightest students in the state but much of this aid flows to students from wealthier families More recently states have developed promise programs that are intended to provide universal access to at least the two-year sector Many of these newer promise programs also include a minimal merit component andor income caps to help keep costs down and better target aid
Because the choice of program will dictate which students receive state aid it is important for states to ensure their aid programs reinforce the state goals While there is evidence that merit-aid programs are successful in keeping the target student population in the state while they are enrolled the evidence also suggests merit programs do little to increase state postsecondary attainment rates as many merit-aid recipients leave the state after graduation (Fitzpatrick amp Jones 2016 Sjoquist amp Winters 2013 Sjoquist amp Winters 2014) Consequently a need-based program or promise program that includes student supports may be more effective at reaching students who would not otherwise attend a postsecondary institution and thus may be more effective at raising state educational attainment levels Likewise programs (such as promise programs) that are easily understood widely publicized and paired with critical student supports have been shown to be effective in positively impacting student outcomes (Carruthers amp Fox 2016 Gurantz 2018 Page et al 2019b Angrist et al 2020) With limited resources to allocate to financial aid states will need to think carefully about how their financial aid allocations support progress toward achieving state goals
POLICY RECOMMENDATIONS
We conclude with several finance policy solutions that states and the federal government can adopt to support their efforts of reaching state postsecondary attainment goals and closing equity gaps in degree attainment and college completion
STATE POLICY
At the state level policy decisions frequently come down to the amount of funding available States rarely have adequate budget resources to fully fund every priority and the decisions states make about how to allocate scarce resources can propel progress toward achieving postsecondary goals or create unintended roadblocks that obstruct progress toward these goals
1 Increase State Support While we recognize that significant increases in state support for institutions are not likely in the next year or two states should invest more in their public institutions when possible States are not likely to see significant gains in their postsecondary completion numbers and attainment rates without increased investment in their institutions As the literature reviewed here attests to and as shown in our simulations such investments are likely to pay significant dividends through increased enrollment persistence and completions The overall increase in educational attainment that comes with state investment in their institutions will help states meet dynamic workforce needs of the post-pandemic economy provide many additional societal benefits (McMahon 2009) and increase state income tax revenue (Chakrabarti 2020)
SHEEO INVESTIGATING THE IMPACTS OF STATE HIGHER EDUCATION APPROPRIATIONS AND FINANCIAL AID71
copy 2021 by the State Higher Education Executive Officers Association (SHEEO)
Likewise most studies we reviewed consistently point toward additional financial aid dollars influencing student behavior Moreover the dollars invested in these programs have a large return on investment for state and federal governments through increased student persistence and credential attainment as well as increased income tax revenue (Anderson 2020 Denning et al 2019) Because the form that general operating and financial aid appropriations come in and the overall purposes of both strategies vary it is difficult if not impossible to determine the appropriate ratio of total higher education funding each should receive However because state operating appropriations serve to support the entire mission of institutions contribute to the overall quality of the education experience and directly impact student access and success support for state financial aid programs should not come at the expense of general operating support
2 State Funding Equity Audit In a recent report Hillman (2020) proposes that policymakers should consider conducting funding-equity audits in order to understand current trends in state funding gaps in funding between institution types and how these patterns overlap with race- and income-based patterns of student enrollment While there are significant challenges to isolating the instructional spending at institutions as Hillman recommends the exercise could still provide new and useful information for policymakers to consider Hillman stresses that states should be transparent about the results of these audits and make the audits widely accessible to the public Readers interested in learning more about what a state funding equity audit might look like and how policymakers could use such an audit to address current funding inequities in their states should read Hillmanrsquos recent Third Way report50
3 Adjust Funding to Promote Equity Completions and Attainment Ensure institutions that serve the bulk of underrepresented students of color and low-income students are funded appropriately and attempt to correct historical underfunding Funding allocation models should promote access and success for underrepresented students States should adjust their funding allocation strategies to be consistent with articulated state goals of reducing equity gaps and increasing educational attainment Prioritizing increases to the base allocation for institutions serving the statersquos priority populations (eg students of color low-income students and adult learners) will help achieve these goals
4 Alternative Revenues Matter Decreases in state appropriations lead to cuts in institutional spending on services that are essential for student success (eg instruction academic support student services) Since public four-year institutions particularly research universities have a wider range of alternative revenue sources (eg increasing tuition increasing enrollment of out-of-state students) community colleges experience the most detrimental cuts to institutional expenditures as a result of declining state appropriations States should consider all institutional revenues and make strategic decisions regarding state appropriations in concert with decisions about tuition rates and out-of-state tuition caps
50 Hillman N (2020) Why rich colleges get richer amp poor colleges get poorer The case for equity-based funding in higher education Washington DC Third Way httpswwwthirdwayorgreportwhy-rich-colleges-get-richer-poor-colleges-get-poorer-the case-for-equity-based-funding-in-higher-education
SHEEO INVESTIGATING THE IMPACTS OF STATE HIGHER EDUCATION APPROPRIATIONS AND FINANCIAL AID72
copy 2021 by the State Higher Education Executive Officers Association (SHEEO)
5 Financial Aid Messaging Matters There is currently a tradeoff between targeting financial aid funds to those who would be most influenced by receiving additional aid dollars (eg low-income students) and the messaging of simple eligibility requirements (eg state and local promise programs) It may behoove states who are able to fully or mostly fund their need-based financial aid to invest resources in marketing the program to students who have traditionally been unaware of state and even federal aid In fact research by Gurantz (2018) suggests these types of initiatives for targeted aid can be successful
6 Student Supports Matter The financial aid programs that are most successful invest in aid dollars as well as in supports for students For instance in Tennessee the free college program not only conveys a simple message to state residents but also provides support for students considering college through governmental agencies as well as with significant support from philanthropic organizations Other programs with successful track records such as the Dell Scholars program invest significant time and money into their students (Page et al 2019b) as does the Susan Thompson Buffett Foundation in Nebraska (Angrist et al 2020) and the ASAP program in a number of states (Miller et al 2020)
FEDERAL POLICY
While this paper is focused on state funding and policy the federal government has had an increasing role in higher education finance and is uniquely positioned to provide stabilizing support and incentives for states to increase funding for higher education We propose two potential federal solutions to the problems discussed in this paper
1 A Federal-State Partnership for College Affordability The economic impact of the coronavirus pandemic has already resulted in increasingly strained state budgets and unlike at the federal level states do not have the ability to run a deficit with their budgets The two levels of government can share financial responsibility for increasing government investment in higher education and making college more affordable for low-income students Tandberg et al (2017) have proposed a measure of affordability and a federal-state partnership with this goal in mind Under this proposal any additional state funding given to support low-income students would be matched with federal funds with a goal of students devoting no more than 10 of their discretionary income toward student loan repayment Readers interested in learning more about what this federal-state partnership might look like should read SHEEOrsquos proposal51
2 Title I-Type Program for Higher Education The federal Title I program provides K-12 schools serving a large proportion of low-income students with additional funding for extra educational services A parallel grant program could be designed for higher education with eligibility determined based on serving a large sharenumber of low-income students or a combination of income- and raceethnicity-based eligibility thresholds Current K-12 Title I programs require that federal dollars supplement rather than replace state and local funding and a similar requirement could be written into a higher education Title I program Readers interested in learning more about what a potential design of such a program might look like should read Third Wayrsquos (Hiler amp Whistle 2018) proposed program design52
51 Tandberg D Laderman S amp Carlson A (2017) A federal-state partnership for true college affordability State Higher Education Executive Officers Association httpssheeoorgwp-contentuploads201903Federal-State_Partnership_for_True_College_Affordabilitypdf
52 Hiler T amp Whistle W (2018) Creating a ldquoTitle Irdquo for higher ed Third Way httpswwwthirdwayorgmemocreating-a-title-i-for-higher-ed
SHEEO INVESTIGATING THE IMPACTS OF STATE HIGHER EDUCATION APPROPRIATIONS AND FINANCIAL AID73
copy 2021 by the State Higher Education Executive Officers Association (SHEEO)
REFERENCES
Abraham KG amp Clark MA (2006) Financial aid studentsrsquo college decisions Evidence from the District of Columbia Tuition Assistance Grant program The Journal of Human Resources 41(3) 578-610
Ahlman L (2019) Dire disparities Patterns of racially inequitable funding and student success in public postsecondary education The Institute for College Access amp Success httpsticasorgaffordability-2dire-disparities-patterns-of-racially-inequitable-funding-and-student-success-in-public-postsecondary-education
Allen D amp Wolniak GC (2019) Exploring the effects of tuition increases on racialethnic diversity at public colleges and universities Research in Higher Education 60 18-43
Alon S (2005) Model mis-specification in assessing the impact of financial aid on academic outcomes Research in Higher Education 46 109-125
Alon S (2011) Who benefits most from financial aid The heterogeneous effect of need-based grants on studentsrsquo college persistence Social Science Quarterly 92(3) 807-829
Anderson DM (2020) When financial aid is scarce The challenge of allocating college aid where it is needed most Journal of Public Economics Published online
Anderson DM amp Goldrick-Rab S (2018) Aid after enrollment Impacts of a statewide grant program at public two-year colleges Economics of Education Review 67 148-157
Anderson DM Broton KM Goldrick-Rab S amp Kelchen R (2019) Experimental evidence on the impacts of need-based financial aid Longitudinal assessment of the Wisconsin Scholars grant Journal of Policy Analysis and Management 39(3) 720-739
Anderson R E (2020) Presidentrsquos message SHEEO Member News September 2020 httpsmailchimpsheeosheeo-member-news-april-5065716e=fcbef6ef65
Andrews RJ DesJardins S amp Ranchhod V (2010) The effects of the Kalamazoo Promise on college choice Economics of Education Review 29 722-737
Andrews RJ Imberman SA amp Lovenheim MF (2020) Recruiting and supporting low-income high-achieving students at flagship universities Economics of Education Review Published online
Angrist J Autor D Pallais A (2020) Marginal effects of merit aid for low-income students (SEII Working Paper) httpsseiimiteduresearchstudymarginal-effects-of-merit-aid-for-low-income-students
Avery C Pender M Howell J amp Sacerdote B (2019) Policies and payoffs to addressing Americarsquos college graduation deficit Brookings Papers on Economic Activity
Bartik T (1991) Who benefits from state and local economic development policies WE Upjohn Institute
Bartik TJ Hershbein B amp Lachowska M (2020) The effects of the Kalamazoo Promise scholarship on college enrollment and completion The Journal of Human Resources Published online
SHEEO INVESTIGATING THE IMPACTS OF STATE HIGHER EDUCATION APPROPRIATIONS AND FINANCIAL AID74
copy 2021 by the State Higher Education Executive Officers Association (SHEEO)
Bettinger EP (2004) How financial aid affects persistence In CM Hoxby (Ed) College choices The economics of where to go when to go and how to pay for It (pp 207-233) University of Chicago Press
Bettinger EP (2015) Need-based aid and college persistence The effects of the Ohio College Opportunity Grant Educational Evaluation and Policy Analysis 37(1S) 102S-119S
Bettinger EP Gurantz O Kawano L Sacerdote BL amp Stevens M (2019) The long-run impacts of financial aid Evidence from Californiarsquos Cal Grant American Economic Journal Economic Policy 11(1) 64-94
Bettinger EP Terry Long B Oreopoulos P Sanbonmatsu L (2012) The role of application assistance and information in college decisions Results from the HampR Block FAFSA experiment The Quarterly Journal of Economics 127 1205-1242
Bound J Braga B Khanna G amp Turner S (2019) Public universities The supply side of building a skilled workforce RSF The Russell Sage Foundation Journal of the Social Sciences 5(5) 43-66
Bruce DJ amp Carruthers CK (2014) Jackpot The impact of lottery scholarships on enrollment in Tennessee Journal of Urban Economics 81 30-44
Carnevale AP amp Strohl J (2013) Separate amp unequal How higher education reinforces intergenerational reproduction of white racial privilege Center on the Education and the Workforce Georgetown University httpscewgeorgetowneduwp-contentuploadsSeparateUnequalFR_pdf
Carruthers CK amp Fox WF (2016) Aid for all College coaching financial aid and post-secondary persistence in Tennessee Economics of Education Review 51 97-112
Carruthers CK amp Oumlzek U (2016) Losing HOPE Financial aid and the line between college and work Economics of Education Review 53 1-15
Carruthers CK amp Welch JG (2019) Not whether but where Pell grants and college choices Journal of Public Economics 172 1-19
Carruthers CK amp Welch JG (2020) Financial aid for nontraditional students Take-up and estimated effects in technical colleges (Working Paper) httpsvolwebutkedu~ccarrut1Carruthers_Welch_TCAT_aid_2020-12-02
Castleman B L amp Long B T (2016) Looking beyond enrollment The causal effect of need-based grants on college access persistence and graduation Journal of Labor Economics 34(4) 1023-1073
Cellini S R amp Chaudhary L (2014) The labor market returns to a for-profit college education Economics of Education Review 43 125-140
Cellini SR (2008) Causal inference and omitted variable bias in financial aid research Assessing solutions The Review of Higher Education 31(3) 329-354
Center for Tax and Budget Accountability (2017) Illinoisrsquo significant disinvestment in higher education httpsbudgetblogctbaonlineorgillinois-significant-disinvestment-in-higher-education-e49db103c80
SHEEO INVESTIGATING THE IMPACTS OF STATE HIGHER EDUCATION APPROPRIATIONS AND FINANCIAL AID75
copy 2021 by the State Higher Education Executive Officers Association (SHEEO)
Chakrabarti R Gorton N amp Lovenheim M (2020) State investment in higher education Effects on human capital formation student debt and long-term financial outcomes of students Federal Reserve Bank of New York Staff Report 941
Chetty R Friedman J Saez E Turner N amp Yagan D (2017) Mobility report cards The role of colleges in intergenerational mobility (No w23618) National Bureau of Economic Research httpsdoiorg103386w23618
Cohodes S amp Goodman JS (2014) Merit aid college quality and college completion Massachusetts Adams Scholarship as an in-kind subsidy American Economic Journal Applied Economics 6(4) 251-285
Colorado Department of Higher Education (nd) Colorado Commission on Higher Education mission Colorado Official State Web Portal httpscdhecoloradogovcolorado-commission-higher-education-mission
Cornwell CM Mustard DB amp Sridhar DJ (2006) The enrollment effects of merit-based financial aid Evidence from Georgiarsquos HOPE program Journal of Labor Economics 24(4) 761-786
Dee T S (2004) Are there civic returns to education Journal of Public Economics 88(9) 1697ndash1720 httpsdoiorg101016jjpubeco200311002
Delaney J A amp Doyle W R (2011) State spending on higher education Testing the balance wheel over time Journal of Education Finance 36(4) 343-368
Deming D J amp C R Walters (2018) The impact of state budget cuts on US postsecondary attainment (Working Paper) httpsscholarharvardedufilesddemingfilesdw_feb2018pdf
Deming D J Yuchtman N Abulafi A Goldin C amp Katz L F (2016) The value of postsecondary credentials in the labor market An experimental study American Economic Review 106(3) 778-806
Deming D amp Dynarski SM (2010) College aid In PB Levine amp DJ Zimmerman (Eds) Targeting investments in children Fighting poverty when resources are limited (pp 283-302) University of Chicago Press
Denning JT (2019) Born under a lucky star Financial aid college completion labor supply and credit constraints The Journal of Human Resources 54(3) 760-784
Denning JT Marx BM amp Turner LJ (2019) ProPelled The effects of grants on graduation earnings and welfare American Economic Journal Applied Economics 11(3) 193-224
Dynarski SM (2000) Hope for whom Financial aid for the middle class and its impact on college attendance National Tax Journal 53(3) 629-662
Dynarski SM (2003) Does aid matter Measuring the effect of student aid on college attendance and completion American Economic Review 93(1) 279-288
Dynarski SM (2004) The new merit aid In CM Hoxby (Ed) College choices The economics of where to go when to go and how to pay for it (pp 63-97) University of Chicago Press
Dynarski SM (2008) Building the stock of college-educated labor Journal of Human Resources 43(3) 576-610
SHEEO INVESTIGATING THE IMPACTS OF STATE HIGHER EDUCATION APPROPRIATIONS AND FINANCIAL AID76
copy 2021 by the State Higher Education Executive Officers Association (SHEEO)
Dynarski SM amp Scott-Clayton J (2013) Financial aid policy Lessons from research The Future of Children 23(1) 67-91
Ehrenberg R G (2006) The perfect storm and the privatization of public higher education Change The Magazine of Higher Learning 38(1) 46-53 httpdoiorg103200CHNG38 146-53
Enders J amp Jongbloed B (2007) The public the private and the good in higher education research An introduction In J Enders amp B Jongbloed (Eds) Public-private dynamics in higher education (pp 9-36) Transcript Verlag
Eng A Matsudaira J (2020) Pell Grants and student success Evidence from the universe of federal aid recipients (Working Paper) httpsamanda-engcomassetspdfEngMatsudaira_Pellfx_20200901pdf
Espinosa L Turk JM Taylor M amp Chessman HM (2019) Race and ethnicity in higher education A status report American Council on Education httpswwwequityinhigheredorg
Evans BJ amp Nguyen TD (2019) Monetary substitution of loans earnings and need-based aid in postsecondary education The impact of Pell Grant eligibility Economics of Education Review 70 1-19
Fitzpatrick MD amp Jones D (2016) Post-baccalaureate migration and merit-based scholarships Economics of Education Review 54 155-172
Frye JR (2015) Flexibility for survival State funding and contingent faculty employment at public higher education institutions (Publication No 116724) [Doctoral dissertation University of Michigan] Deep Blue Database
Gaacutendara D amp Li A (2020) Promise for whom ldquoFree-collegerdquo programs and enrollments by race and gender classifications at public 2-year colleges Educational Evaluation and Policy Analysis Published online
Goldsmith-Pinkham P Sorkin I amp Swift H (2019) Bartik instruments What when why and how httpspaulgpgithubiopapersbartik_gpsspdf
Gonzales J (2020 May 19) Lawmakers just cut 58 from Colorado public colleges Federal money will ease the blow Chalkbeat Colorado Retrieved from httpscochalkbeatorg202051921264509lawmakers-cut-58-percent-from-colorado-public-colleges-3-3-billion-budget-hole
Goodman J (2008) Who merits financial aid Massachusettsrsquo Adams Scholarship Journal of Public Economics 92(10) 2121-2131
Goodman S amp Volz AH (2020) Attendance spillovers between public and for-profit colleges Evidence from statewide variation in appropriations for higher education Education Finance and Policy 15(3) 428-456
Gurantz O (2018) A little can go a long way The impact of advertising services on program take-up Educational Evaluation and Policy Analysis 40(3) 382-398
Gurantz O (2019a) Impacts of state aid for non-traditional students on educational and labor market outcomes (Working Paper) httpswwwedworkingpaperscomai19-150
SHEEO INVESTIGATING THE IMPACTS OF STATE HIGHER EDUCATION APPROPRIATIONS AND FINANCIAL AID77
copy 2021 by the State Higher Education Executive Officers Association (SHEEO)
Gurantz O (2019b) What does free community college buy Early impacts from the Oregon Promise Journal of Policy Analysis and Management 39(1) 11-35
Gurantz O amp Odle TK (2020) The impact of merit aid on college choice and degree attainment Reexamining Floridarsquos Bright Futures program (Working Paper) httpswwwedworkingpaperscomai20-306
Hancock J (2020 June 1) Parson cuts $141 million from Missouri K-12 budget $41 million from higher education The Kansas City Star Retrieved from httpswwwkansascitycomnewspolitics-governmentarticle243172006html
Hansen WL (1983) Impact of student financial aid on access Proceedings of the Academy of Political Science 35(2) 84-96
Hansen WL amp Weisbrod BA (1969) The distribution of costs and direct benefits of public higher education The case of California The Journal of Human Resources 4(2) 176-191
Hearn J C amp Longanecker D (1985) Enrollment effects of alternative postsecondary pricing policies The Journal of Higher Education 56(5) 485-508
HECC (nd) HECC mission vision values and beliefs State of Oregon httpswwworegongovhigheredaboutPagesmission-vision-valuesaspx
Herbaut E amp Geven K (2020) What works to reduce inequalities in higher education A systematic review of the (quasi-)experimental literature on outreach and financial aid Research in Social Stratification and Mobility 65 1-14
Hershbein B Kearney MS Pardue LW (2020) College attainment income inequality and economic security A simulation exercise (NBER Working Paper No 26747) httpwwwnberorgpapersw26747
Hiler T amp Whistle W (2018) Creating a ldquoTitle Irdquo for higher ed Third Way httpswwwthirdwayorgmemocreating-a-title-i-for-higher-ed
Hillman N (2020) Why rich colleges get richer amp poor colleges get poorer The case for equity-based funding in higher education Third Way httpswwwthirdwayorgreportwhy-rich-colleges-get-richer-poor-colleges-get-poorer-the-case-for-equity-based-funding-in-higher-education
Hillman NW Tandberg DA amp Gross JK (2014) Market-based higher education Does Colorados voucher model improve higher education access and efficiency Research in Higher Education 55 601-625
Hossler D Lund J P Ramin J Westfall S amp Irish S (1997) State funding for higher education The Sisyphean task Journal of Higher Education 68(2) 160-190
Hovey HA (1999) State spending for higher education in the next decade The battle to sustain current support National Center for Public Policy and Higher Education
SHEEO INVESTIGATING THE IMPACTS OF STATE HIGHER EDUCATION APPROPRIATIONS AND FINANCIAL AID78
copy 2021 by the State Higher Education Executive Officers Association (SHEEO)
Husted TA amp Kenny LW (2018) The effect of reduced support from state government on research in state universities Journal of Education Finance 44(2) 164-174
Jaquette O (2019) Do public universities replace state appropriations with masters students The Review of Higher Education 42(3) 1101-1144
Jaquette O amp Curs BR (2015) Creating the out-of-state university Do public universities increase nonresident freshman enrollment in response to declining state appropriations Research in Higher Education 56 535-565
Jaquette O Curs B R amp Posselt J R (2016) Tuition rich mission poor Nonresident enrollment growth and the socioeconomic and racial composition of public research universities The Journal of Higher Education 87(5) 635-673
Kahn S Huelsman M amp Mishory J (2019) Bridging progressive policy debates How student debt and the racial wealth gap reinforce each other The Roosevelt Institute The Century Foundation and Demos httpsrooseveltinstituteorgwp-contentuploads202007RI_Student-Debt-and-RWG-201909pdf
Kane TJ (1995) Rising public college tuition and college entry How well do public subsidies promote access to college (NBER Working Paper No 5164) httpswwwnberorgpapersw5164
Kezar A J (2005) Challenges for higher education in serving the public good In A J Kezar T C Chambers amp J C Burkhardt (Eds) Higher education for the public good Emerging voices from a national movement (pp 23-42) Jossey-Bass
Laderman S amp Weeden D (2020) State higher education finance fiscal 2019 State Higher Education Executive Officers Association httpsshefsheeoorgreport
Leslie LL amp Brinkman PT (1987) Student price response in higher education The student demand studies Journal of Higher Education 58(2) 181-204
Lingenfelter P (2018) The origins and evolving roles of state higher education executives in American higher education In D Tandberg B Sponsler R Hanna amp J Guilbeau (Eds) The state higher education executive officer and the public good Developing new leadership for improved policy practice and research (pp 15ndash46) Teachers College Press
Lochner L (2004) Education work and crime A human capital approach International Economic Review 45(3) 811ndash843 httpsdoiorg101111j0020-6598200400288x
London R (2006) The role of postsecondary education in welfare recipientsrsquo paths to self-sufficiency The Journal of Higher Education 77(3) 472ndash496 httpsdoiorg101353jhe20060024
Long B T (2016) State support for higher education How changing the distribution of funds could improve college completion rates Prepared for the National Commission on Financing 21st Century Higher Education Miller Center at the University of Virginia Charlottesville
Long BT amp Riley E (2007) Financial aid A broken bridge to college access Harvard Educational Review 77(1) 39-63
Lumina Foundation amp Bill amp Melinda Gates Foundation (2020) Higher ed budgets for the post-COVID era Nowrsquos our chance to do this right httpswwwluminafoundationorgresourcehigher-ed-budgets-for-the-post-covid-era
SHEEO INVESTIGATING THE IMPACTS OF STATE HIGHER EDUCATION APPROPRIATIONS AND FINANCIAL AID79
copy 2021 by the State Higher Education Executive Officers Association (SHEEO)
Lumina Foundation (2019) A stronger nation Learning beyond high school builds American talent httpswwwluminafoundationorgstronger-nationreport2020nation
Ma J Pender M amp Welch M (2019) Education pays 2019 The benefits of higher education for individuals and society The College Board httpsresearchcollegeboardorgpdfeducation-pays-2019-full-reportpdf
Manski CF amp Wise DA (1983) College choice in America Harvard University Press
Marx BM amp Turner LJ (2018) Borrowing trouble Human capital investment with opt-in costs and implications for the effectiveness of grant aid American Economic Journal Applied Economics 10(2) 163-201
McLendon MK Tandberg DA amp Hillman NW (2014) Financing college opportunity Factors influencing state spending on student financial aid and campus appropriations 1990 through 2010 The ANNALS of the American Academy of Political and Social Science 655(1) 143-162
McMahon W W (2009) Higher learning greater good The private and social benefits of higher education Johns Hopkins University Press
McPherson MS amp Schapiro MO (1991) Does student aid affect college enrollment New evidence on a persistent controversy The American Economic Review 81(1) 309-318
Miller C Headlam C Manno M amp Cullinan D (2020) Increasing community college graduation rates with a proven model MDRC httpsfilesericedgovfulltextED603027pdf
Mugglestone K Dancy K amp Voight M (2019) Opportunity lost Net price and equity at public flagship institutions Institute for Higher Education Policy httpwwwiheporgresearchpublicationsopportunity-lost-net-price-and-equity-public-flagship-institutions
National Student Clearinghouse (2020) COVID-19 Stay informed with the latest enrollment information (as of Oct 22nd) Author httpsnscresearchcenterorgstay-informed
Nguyen H (2020) Free college Assessing enrollment responses to the Tennessee Promise program Labour Economics Published online
Nguyen S Fishman R amp Weeden D (2020) The impact of COVID-19 on state higher education budgets New America httpswwwnewamericaorgeducation-policyreportsstate-budget-cuts
Nguyen TD Kramer JW Evans BJ (2019) The effects of grant aid on student persistence and degree attainment A systematic review and meta-analysis of the causal evidence Review of Educational Research 89(6) 831-874
Page LC amp Scott-Clayton J (2016) Improving college access in the United States Barriers and policy responses Economics of Education Review 51 4-22
Page LC Iritl JE Lowry DJ Anthony AM (2019b) The promise of place-based investment in postsecondary access and success Investigating the impact of the Pittsburgh Promise Education Finance and Policy 14(4) 572-600
Page LC Kehoe SS Castleman BL amp Sahadewo GA (2019a) More than dollars for scholars The impact of the Dell Scholars program on college access persistence and degree attainment The Journal of Human Resources 54(3) 683-725
SHEEO INVESTIGATING THE IMPACTS OF STATE HIGHER EDUCATION APPROPRIATIONS AND FINANCIAL AID80
copy 2021 by the State Higher Education Executive Officers Association (SHEEO)
Pallais A (2009) Taking a chance on college Is the Tennessee Education Lottery Scholarship program a winner The Journal of Human Resources 44(1) 4-22
Peltzman S (1973) The effect of government subsidies-in-kind on private expenditures The case of higher education Journal of Political Economy 81(1) 1-27
Rhode Island Office of the Postsecondary Commissioner (nd) Mission amp responsibilities RIOPC httpswwwriopcedupageOPC20mission
Saltmarsh J amp Hartley M (2011) ldquoTo serve a larger purposerdquo Engagement for democracy and the transformation of higher education Temple University Press
Scott-Clayton J (2011) On money and motivation A quasi-experimental analysis of financial incentives for college achievement The Journal of Human Resources 46(3) 614-646
Scott-Clayton J amp Schudde L (2020) The consequences of performance standards in need-based aid Evidence from community colleges The Journal of Human Resources 55(4) 1105-1136
Scott-Clayton J amp Zafar B (2019) Financial aid debt management and socioeconomic outcomes Post-college effects of merit-based aid Journal of Public Economics 170 68-82
Seftor N amp Turner SE (2002) Back to school Federal student aid policy and adult college enrollment The Journal of Human Resources 37(2) 336-352
Singh M (2012) Re-inserting the ldquopublic-goodrdquo into higher education transformation In B Leibowitz (Ed) Higher education for the public good (pp 1ndash15) Sun Press httpsdoi org1018820978192835705601
Sjoquist DL amp Winters JV (2012) Building the stock of college-educated labor revisited The Journal of Human Resources 47(1) 270-285
Sjoquist DL amp Winters JV (2014) Merit aid and post-college retention in the state Journal of Urban Economics 80 39-50
Sjoquist DL amp Winters JV (2015) State merit-based financial aid programs and college attainment Journal of Regional Science 55(3) 364-390
Sjoquist DL amp Winters JV (2016) The effects of state merit aid programs on attendance at elite colleges Southern Economic Journal 83(2) 527-549
Tandberg D Laderman S amp Carlson A (2017) A federal-state partnership for true college affordability State Higher Education Executive Officers Association httpssheeoorgwp-contentuploads201903Federal-State_Partnership_for_True_College_Affordabilitypdf
Toutkoushian R K amp Hillman N W (2012) The impact of state appropriations and grants on access to higher education and outmigration The Review of Higher Education 36(1) 51-90
Toutkoushian R K amp Shafiq M N (2009) A conceptual analysis of state support for higher education Appropriations versus need-based financial aid Research in Higher Education 51 40-64
SHEEO INVESTIGATING THE IMPACTS OF STATE HIGHER EDUCATION APPROPRIATIONS AND FINANCIAL AID81
copy 2021 by the State Higher Education Executive Officers Association (SHEEO)
Toutkoushian RK Hossler D DesJardins SL McCall B amp Gonzaacutelez Cancheacute MS (2015) The effect of participating in Indianarsquos Twenty-First Century Scholars program on college enrollments The Review of Higher Education 39(1) 59-95
Trostel P A (2010) The fiscal impacts of college attainment Research in Higher Education 51(3) 220ndash247 httpsdoiorg101007s11162-009-9156-5
Trostel P A (2012) The effect of public support on college attainment Higher Education Studies 2(4) 58-67
Turner LJ (2017) The economic incidence of federal student grant aid (Working Paper) httpslesleyjturnercomTurner_FedAidIncidence_Jan2017pdf
Virginia Advisory Legislative Council (1955) The crisis in higher education in Virginia and a solution State Council of Higher Education for Virginia httpsschevedudocsdefault-sourceabout-sectioncouncil-filesschev-1955-reportpdf
Webber D A (2017) State divestment and tuition at public institutions Economics of Education Review 60 1-4
Welch J G (2014) HOPE for community college students The impact of merit aid on persistence graduation and earnings Economics of Education Review 43 1-20
Williams J (2016) A critical exploration of changing definitions of public good in relation to higher education Studies in Higher Education 41(4) 619ndash630 httpsdoiorg101080 030750792014942270
Zhang L (2009) Does state funding affect graduation rates at public four-year colleges and universities Educational Policy 23(5) 714-731
Zhang L amp Ness E (2010) Does state merit-based aid stem brain drain Educational Evaluation and Policy Analysis 32(2) 143-165
Zhang L Hu S amp Sensenig V (2013) The effect of Floridarsquos Bright Futures program on college enrollment and degree production An aggregated-level analysis Research in Higher Education 54(7) 746-764
Zhao B (2018a) Disinvesting in the future A comprehensive examination of the effects of state appropriations for public higher education Federal Reserve Bank of Boston New England Public Policy Center
Zhao B (2018b) State disinvestment in higher education The impact on public research universities patent applications Federal Reserve Bank of Boston New England Public Policy Center
SHEEO INVESTIGATING THE IMPACTS OF STATE HIGHER EDUCATION APPROPRIATIONS AND FINANCIAL AID82
copy 2021 by the State Higher Education Executive Officers Association (SHEEO)
APPENDIX ATABLE A1 GENERAL OPERATING APPROPRIATIONS PER FTE (CONSTANT ADJUSTED $) BY STATE 2001-2019
GENERAL OPERATING PER FTE PERCENT CHANGE
STATE 2001 2008 2012 2018 2019 2001-2019 2008-2019 2012-2019 2018-2019
ALABAMA $8611 $10696 $6680 $6414 $6410 -256 -401 -40 -01
ALASKA $14065 $15304 $14660 $14607 $15435 97 09 53 57
ARIZONA $8678 $8835 $5546 $5275 $5210 -400 -410 -61 -12
ARKANSAS $9441 $9199 $7510 $7149 $7232 -234 -214 -37 12
CALIFORNIA $8867 $7662 $5267 $7649 $8107 -86 58 539 60
COLORADO $5796 $4130 $2718 $3547 $3849 -336 -68 416 85
CONNECTICUT $11356 $10320 $8074 $8153 $8185 -279 -207 14 04
DELAWARE $8117 $7240 $5412 $5246 $5096 -372 -296 -58 -29
FLORIDA $8886 $6627 $4653 $6232 $6293 -292 -50 353 10
GEORGIA $12358 $9128 $6181 $7497 $7653 -381 -162 238 21
HAWAII $10058 $12537 $9312 $13345 $14632 455 167 571 96
IDAHO $13176 $11911 $6976 $9649 $9706 -263 -185 391 06
ILLINOIS $11709 $10747 $11663 $13767 $14111 205 313 210 25
INDIANA $8431 $6241 $4951 $5026 $4990 -408 -200 08 -07
IOWA $10860 $8200 $5716 $6157 $6241 -425 -239 92 14
KANSAS $10665 $8154 $6551 $6608 $6815 -361 -164 40 31
KENTUCKY $11747 $9209 $6981 $6373 $6120 -479 -335 -123 -40
LOUISIANA $7029 $8501 $5210 $3880 $3786 -461 -555 -273 -24
MAINE $9641 $7639 $6705 $7443 $7403 -232 -31 104 -05
MARYLAND $8954 $7410 $6150 $7302 $7544 -157 18 227 33
MASSACHUSETTS $10917 $8454 $6026 $7342 $7494 -314 -114 244 21
MICHIGAN $11070 $7662 $5735 $6995 $7130 -356 -69 243 19
MINNESOTA $9651 $7962 $5371 $7141 $6885 -287 -135 282 -36
MISSISSIPPI $10334 $9637 $6923 $6390 $6279 -392 -348 -93 -17
MISSOURI $11972 $9182 $6682 $6499 $6572 -451 -284 -17 11
MONTANA $6309 $6425 $5460 $6261 $6381 11 -07 169 19
NEBRASKA $12642 $9396 $8344 $9851 $9922 -215 56 189 07
NEVADA $8439 $10014 $6409 $6596 $6736 -202 -327 51 21
NEW HAMPSHIRE $5349 $3899 $1905 $2826 $2871 -463 -264 507 16
NEW JERSEY $9375 $7846 $6049 $5253 $5339 -431 -320 -117 16
NEW MEXICO $9535 $11634 $8846 $10774 $11626 219 -01 314 79
NEW YORK $7326 $7578 $6454 $7750 $8044 98 62 246 38
NORTH CAROLINA $12803 $12369 $9511 $10261 $10528 -178 -149 107 26
NORTH DAKOTA $7384 $7290 $8316 $8059 $8200 110 125 -14 17
OHIO $9226 $6685 $5288 $6223 $6021 -347 -99 139 -32
OKLAHOMA $10168 $9328 $7300 $5636 $5597 -450 -400 -233 -07
OREGON $7688 $5964 $3981 $5935 $6129 -203 28 540 33
PENNSYLVANIA $8372 $6103 $3608 $3914 $3944 -529 -354 93 08
RHODE ISLAND $9087 $6640 $5623 $5798 $5866 -354 -117 43 12
SOUTH CAROLINA $7519 $6280 $3251 $4236 $4587 -390 -270 411 83
SOUTH DAKOTA $8546 $7226 $5369 $6103 $6097 -287 -156 136 -01
TENNESSEE $8841 $8741 $5235 $6880 $7020 -206 -197 341 20
TEXAS $9254 $9644 $7441 $7698 $7611 -178 -211 23 -11
UTAH $8314 $8722 $5848 $7305 $7470 -102 -144 277 23
VERMONT $3485 $2999 $2555 $2481 $2449 -297 -184 -42 -13
VIRGINIA $8472 $6413 $4221 $4944 $5089 -399 -206 205 29
WASHINGTON $7495 $7217 $4170 $5943 $6279 -162 -130 506 57
WEST VIRGINIA $6785 $6430 $4667 $3729 $4027 -407 -374 -137 80
WISCONSIN $9969 $7953 $6324 $6055 $6255 -373 -213 -11 33
WYOMING $12949 $16951 $14766 $16725 $17506 352 33 186 47
US $9547 $8377 $6187 $7224 $7388 -226 -118 194 23
NOTES 1 General operating is the portion of state and local support appropriated directly to public institutions for the purposes of general
operations2 Full-time equivalent (FTE) enrollment converts student credit hours to full-time academic year students but excludes medical students3 Constant dollars adjusted by the Higher Education Cost Adjustment (HECA) Adjustment factors to account for interstate differences
include the Cost of Living Index (COLI) and Enrollment Mix Index (EMI)SOURCE State Higher Education Executive Officers Association State Higher Education Finance Data (httpsshefsheeoorg)
SHEEO INVESTIGATING THE IMPACTS OF STATE HIGHER EDUCATION APPROPRIATIONS AND FINANCIAL AID83
copy 2021 by the State Higher Education Executive Officers Association (SHEEO)
TABLE A2 STATE GRANT AID (CONSTANT ADJUSTED $) BY STATE 2001-2019
STATE GRANT AID (IN MILLIONS) PERCENT CHANGE
STATE 2001 2008 2012 2018 2019 2001-2019 2008-2019 2012-2019 2018-2019
ALABAMA $1348 $3109 $2630 $12074 $9391 5966 2020 2571 -222
ALASKA $188 $070 $570 $1474 $1361 6220 18336 1386 -77
ARIZONA $446 $1458 $1765 $2854 $2726 5111 870 545 -45
ARKANSAS $7232 $5551 $21401 $14818 $13592 880 1448 -365 -83
CALIFORNIA $56406 $79418 $136074 $178418 $176169 2123 1218 295 -13
COLORADO $8090 $9187 $8001 $12723 $13831 710 506 728 87
CONNECTICUT $5616 $6467 $4913 $2906 $2746 -511 -575 -441 -55
DELAWARE $234 $1936 $2099 $2031 $2064 7804 66 -17 17
FLORIDA $46162 $65851 $55700 $71023 $85252 847 295 531 200
GEORGIA $51577 $65873 $69374 $86216 $91865 781 395 324 66
HAWAII $064 $039 $336 $375 $359 4608 8197 66 -43
IDAHO $199 $992 $821 $1371 $1623 7144 637 977 184
ILLINOIS $59042 $51180 $49280 $39938 $39010 -339 -238 -208 -23
INDIANA $18285 $29287 $31618 $38236 $35648 950 217 127 -68
IOWA $8653 $7761 $6999 $6532 $6393 -261 -176 -87 -21
KANSAS $2143 $2552 $2237 $1926 $1915 -107 -250 -144 -06
KENTUCKY $11516 $25720 $24990 $27080 $28593 1483 112 144 56
LOUISIANA $15212 $18507 $24722 $35357 $35803 1354 935 448 13
MAINE $1830 $2122 $1706 $1500 $1517 -171 -285 -110 12
MARYLAND $6628 $10625 $8997 $9363 $8900 343 -162 -11 -49
MASSACHUSETTS $15102 $8918 $8461 $8093 $8536 -435 -43 09 55
MICHIGAN $18278 $26617 $11343 $13678 $13556 -258 -491 195 -09
MINNESOTA $19399 $20155 $18153 $22062 $23097 191 146 272 47
MISSISSIPPI $3861 $3509 $3273 $4586 $5127 328 461 566 118
MISSOURI $8002 $16038 $13188 $14701 $15221 902 -51 154 35
MONTANA $535 $584 $806 $051 $050 -907 -915 -938 -22
NEBRASKA $979 $1642 $1889 $2134 $2017 1062 229 68 -55
NEVADA $2296 $5389 $6751 $5041 $5388 1347 00 -202 69
NEW HAMPSHIRE $208 $415 $- $001 $443 1123 65 479011
NEW JERSEY $27028 $32133 $35834 $42762 $43053 593 340 201 07
NEW MEXICO $6525 $9252 $11607 $8569 $8503 303 -81 -267 -08
NEW YORK $79176 $78830 $85712 $77520 $72667 -82 -78 -152 -63
NORTH CAROLINA $26584 $41664 $43542 $37576 $37124 396 -109 -147 -12
NORTH DAKOTA $187 $490 $1627 $2184 $2065 10030 3211 269 -54
OHIO $29912 $35024 $13930 $15964 $15063 -496 -570 81 -56
OKLAHOMA $5614 $10872 $12387 $11706 $10993 958 11 -112 -61
OREGON $2776 $3944 $4599 $7752 $8486 2057 1151 845 95
PENNSYLVANIA $48262 $55990 $50584 $40634 $37724 -218 -326 -254 -72
RHODE ISLAND $881 $1753 $1344 $950 $928 53 -470 -309 -22
SOUTH CAROLINA $15838 $38473 $39435 $43437 $43798 1765 138 111 08
SOUTH DAKOTA $- $328 $520 $663 $705 1147 355 63
TENNESSEE $5351 $40300 $48527 $51391 $48755 8112 210 05 -51
TEXAS $19356 $71584 $81799 $102709 $110091 4688 538 346 72
UTAH $548 $1457 $1114 $1649 $1944 2547 335 745 179
VERMONT $1997 $2284 $2181 $1856 $1846 -75 -192 -154 -05
VIRGINIA $18875 $23630 $25028 $52577 $56737 2006 1401 1267 79
WASHINGTON $14107 $23564 $31306 $34103 $35741 1534 517 142 48
WEST VIRGINIA $2898 $10502 $12354 $10707 $9183 2169 -126 -257 -142
WISCONSIN $12360 $13282 $13938 $13342 $13228 70 -04 -51 -09
WYOMING $- $023 $2017 $2041 $2048 89411 15 03
US $687807 $966354 $1037485 $1176652 $1192874 734 234 150 14
NOTES 1 State grant aid includes all scholarship and grant aid awarded to undergraduate and graduate students including the small portion
of aid allocated to non-public institutions2 Constant dollars adjusted by the Higher Education Cost Adjustment (HECA) Adjustment factors to account for interstate differences
include the Cost of Living Index (COLI) and Enrollment Mix Index (EMI)3 Asterisks () indicate a state not allocating any grant aid in one or both years of the percent change calculationSOURCE National Association of State Student Grant and Aid Programs 2001 through 2018 data pulled from NASSGAPrsquos Annual
Survey data query tool 2019 pulled from Table 3 History 2004-2019
SHEEO INVESTIGATING THE IMPACTS OF STATE HIGHER EDUCATION APPROPRIATIONS AND FINANCIAL AID84
copy 2021 by the State Higher Education Executive Officers Association (SHEEO)
APPENDIX B
HAS STATE HIGHER EDUCATION FUNDING REALLY DECLINED
Recent reports have used SHEEOrsquos data to question whether state funding for higher education has truly declined over time State higher education finance data can be looked at in many ways (per FTE per capita as a percentage of state budgets including or excluding certain funds using different inflation adjustments and in comparison to different points in history) Most reasonable analyses show a state funding decline but data can be cherry-picked to support a different narrative for those with an agenda Figure 1 below shows a sample of different higher education metrics that can be used for trend analysis While the metrics differ in their cumulative change over time the overall trends are largely stable with increases during economically prosperous times and sharp declines during economic recessions All metrics show a net decline in funding over time although the decline differs in size The largest declines across all metrics occurred during the Great Recession Note that due to data limitations all metrics dating back to 1980 include financial aid which has increased over time unlike general operating appropriations
TABLE B1COMPARING CUMULATIVE PERCENT CHANGE IN MULTIPLE MEASURES OF STATE SUPPORT FOR PUBLIC HIGHER EDUCATION OVER TIME
-8 B
-1 A
-40 F
-27 D
-20 C
-33 E
-50
-30
-10
10
30
198
0
198
1
198
2
198
3
198
4
198
5
198
6
198
7
198
8
198
9
199
0
199
1
199
2
199
3
199
4
199
5
199
6
199
7
199
8
199
9
20
00
20
01
20
02
20
03
20
04
20
05
20
06
20
07
20
08
20
09
20
10
20
11
20
12
20
13
20
14
20
15
20
16
20
17
20
18
20
19
CU
MU
LAT
IVE
PE
RC
EN
T C
HA
NG
E
LEGEND
A State Education Appropriations Per Capita (Inflation Adjusted)
B State Education Appropriations Per FTE (Inflation Adjusted)
C State General Operating Per Capita (Inflation Adjusted)
D State General Operating Per FTE (Inflation Adjusted)
E State General Operating Per $1000 Personal Income
F State Education Appropriations Per $1000 Personal Income
NOTES
1 The most recent data for funding per capita and per $1000 of personal income are fiscal 2018
2 All measures exclude local appropriations State education appropriations include financial aid while state general operating appropriations do not General operating appropriation data are not available until 2001
3 Funding per FTE and per capita are in constant dollars adjusted by the Higher Education Cost Adjustment (HECA)
SOURCE State Higher Education Executive Officers Association State Higher Education Finance Data (httpsshefsheeoorg)
SHEEO INVESTIGATING THE IMPACTS OF STATE HIGHER EDUCATION APPROPRIATIONS AND FINANCIAL AID85
copy 2021 by the State Higher Education Executive Officers Association (SHEEO)
While the type of metric used is important much of the difference in analystrsquos views of the current status of state funding for public higher education comes from the use of different time frames SHEEO regularly compares todayrsquos data to prior years in even increments (1 5 10 15 20 and 25 years) but also includes comparisons to pre-recession levels to demonstrate the magnitude of declines in higher education during economic recessions In general it is most appropriate to compare the current year to prior years at a similar point in the economic cycle The latest data from 2019 represents a high-point prior to a recessionary year (2020) and is most appropriately compared to past pre-recession high points like 2001 and 2008 Some analysts exclude all comparisons except to 1980 the first year in the SHEF dataset However 1980 is a poor starting point it was a recession year and per-student funding in 1980 had declined approximately 74 since 1978 Regardless todayrsquos per-student funding remains below pre-recession funding levels in all but one year since 1980
Inflation indices can also impact the interpretation of trends over time SHEEOrsquos analyses of higher education funding generally use the Higher Education Cost Adjustment (HECA) an inflation index specific to service-based industries However we also examine changes in higher education funding using the Consumer Price Index (CPI) and inflation index for consumer goods The indices are extremely similar over time but result in small differences when viewed over long periods of time It is important to understand when itrsquos appropriate to use each inflation index (ie for a consumer versus state perspective) Both HECA and CPI measure increases in the price of certain items over time CPI is focused on consumer goods like milk and gasoline and does not show the true impact of inflation in service areas that rely more heavily on personnel than consumer goods Higher education is a service about 75 of the cost of higher education goes to personnel so we weight our inflation index accordingly with 75 personnel costs and 25 non-service goods The personnel costs in HECA are not specific to higher education employees and it is not self-referential The inclusion of personnel is important because unlike manufactured goods personnel do not get more efficient and begin to cost less over time Inflation indices like CPI do not correct for this disparity between goods and services (also known as cost disease)
STATE HIGHER EDUCATION EXECUTIVE OFFICERS
3035 CENTER GREEN DRIVE SUITE 100 BOULDER COLORADO 80301 3035411600 bull SHEEOorg
- Table of Contents
- _Hlk62838259
- _Hlk62838580
- _Hlk62839938
- _Hlk57727464
- _Ref63073710
- _Hlk62837095
- _Hlk62840456
- _Hlk57719827
- _Hlk55569431
- _Hlk55567823
- _Hlk61949723
- _Hlk61950233
- _Hlk57778138
- _Hlk61950622
- _Hlk57728163
- _Hlk65158467
- _Hlk62837038
- OLE_LINK1
- OLE_LINK2
- _Hlk57782772
- _Hlk57782852
- _Hlk57778955
- State General Public Operating Appropriations per FTE and FTE Enrollment (Constant $) US 2001-2019
- Change in Education Appropriations per FTE Following Economic Recessions (Constant $) US 1980-2019
- Change in State General Operating Appropriations FY 2001-2019 by State
- State and Local Appropriations per FTE and FTE Enrollment at Two- and Four-Year Institutions (Constant $) US 2001-2017
- State Grant Aid for Need- and Non-Need Programs (Constant $) US 2001-2019
- Changes in Total State Grant Aid (Constant $) US 2001-2019
- State Grant Aid and FTE Enrollment at Two- and Four-Year Institutions (Constant $) US 2001-2017
- Change in State General Operating and Grant Aid per FTE Following Economic Recessions (Constant $) US 1980-2019
- Change in State General Operating and Grant Allocations FY 2001-2019 by State
- Comparison to US Average in State General Operating and Grant Aid Allocations FY 2019 by State
- Breakdown of Total Public Higher Education Revenues US FY 2001-2019
- Flowchart of Review Criteria for State Appropriations Literature Review
- State and Local Appropriations per FTE at Public Institutions by Carnegie Classification (Constant $) US 2001-2017
- Flowchart of Review Criteria for Financial Aid Literature Review
- Comparing Cumulative Percent Change in Multiple Measures of State Support for Public Higher Education Over Time
- Index of Figures
- Index of Tables
- Abstract
- Acknowledgments
- Executive Summary
- Introduction
- Current and Historical Context of State Support for Higher Education
- Prior Literature on the Effects of State Appropriations
- Prior Literature on the Effects of Grant Aid
- Simulated Impacts of State Appropriations and Financial Aid
- Conclusion
- References
- Appendix A
- Appendix B
-
SHEEO INVESTIGATING THE IMPACTS OF STATE HIGHER EDUCATION APPROPRIATIONS AND FINANCIAL AID2
copy 2021 by the State Higher Education Executive Officers Association (SHEEO)
TABLE OF CONTENTSIndex of Figures 3
Index of Tables 4
Abstract 5
Acknowledgments 6
Executive Summary 7
Introduction 16
Current and Historical Context of State Support for Higher Education 20
Prior Literature on the Effects of State Appropriations 35
Prior Literature on the Effects of Grant Aid 52
Simulated Impacts of State Appropriations and Financial Aid 61
Conclusion 69
References 73
Appendix A82
Appendix B 84
SHEEO INVESTIGATING THE IMPACTS OF STATE HIGHER EDUCATION APPROPRIATIONS AND FINANCIAL AID3
copy 2021 by the State Higher Education Executive Officers Association (SHEEO)
INDEX OF FIGURES1 State General Public Operating Appropriations per FTE and FTE Enrollment (Constant $)
US 2001-201922
2 Change in Education Appropriations per FTE Following Economic Recessions (Constant $) US 1980-2019 23
3 Change in State General Operating Appropriations FY 2001-2019 by State 24
4 State and Local Appropriations per FTE and FTE Enrollment at Two- and Four-Year Institutions (Constant $) US 2001-2017 26
5 State Grant Aid for Need- and Non-Need Programs (Constant $) US 2001-2019 28
6 Changes in Total State Grant Aid (Constant $) US 2001-2019 29
7 State Grant Aid and FTE Enrollment at Two- and Four-Year Institutions (Constant $) US 2001-2017 30
8 Change in State General Operating and Grant Aid per FTE Following Economic Recessions (Constant $) US 1980-2019 31
9 Change in State General Operating and Grant Allocations FY 2001-2019 by State 32
10 Comparison to US Average in State General Operating and Grant Aid Allocations FY 2019 by State 33
11 Breakdown of Total Public Higher Education Revenues US FY 2001-2019 34
12 Flowchart of Review Criteria for State Appropriations Literature Review 36
13 State and Local Appropriations per FTE at Public Institutions by Carnegie Classification (Constant $) US 2001-2017 48
14 Flowchart of Review Criteria for Financial Aid Literature Review 53
B1 Comparing Cumulative Percent Change in Multiple Measures of State Support for Public Higher Education Over Time 84
SHEEO INVESTIGATING THE IMPACTS OF STATE HIGHER EDUCATION APPROPRIATIONS AND FINANCIAL AID4
copy 2021 by the State Higher Education Executive Officers Association (SHEEO)
INDEX OF TABLES1 Impact of Inflation and Enrollment on State General Public Operating Appropriations
and FTE Enrollment in Key Years US 2001-2019 21
2 Summary of State Appropriations Literature Review 46
3 Summary of Student Grant Aid Literature Review 59
4 Simulations Based on Statistically Significant Findings from Deming and Walters (2018) ndash A $1000 Increase in State Appropriations per FTE 63
5 Simulations Based on Statistically Significant Findings from Bound et al (2019) - A $1000 Increase in State Appropriations per FTE 64
6 Simulations Based on Statistically Significant Findings from Zhao (2018) - A $1000 Increase in State Appropriations 64
7 Simulations Based on Nguyen et alrsquos (2019) Meta-Analytic Review - Increase of $1000 Per Pell Grant Recipient 66
A1 General Operating Appropriations per FTE (Constant Adjusted $) by State 2001-2019 82
A2 State Grant Aid (Constant Adjusted $) by State 2001-2019 83
SHEEO INVESTIGATING THE IMPACTS OF STATE HIGHER EDUCATION APPROPRIATIONS AND FINANCIAL AID5
copy 2021 by the State Higher Education Executive Officers Association (SHEEO)
ABSTRACT
States invest in public higher education in two primary ways through direct funds to institutions (general operating support) and direct funds to students in the form of state financial aid programs (student grant aid) General operating support is the larger of the two funding categories totaling $808 billion in 2019 while state financial aid allocations totaled $123 billion To gain a deeper understanding of the impacts this state investment in higher education has on student outcomes we examine the historical data and empirical literature on state support for higher education We find clear evidence that increased financial investmentsmdashspecifically increased state general operating and student financial aidmdashare directly tied to student success in higher education These findings suggest that states will not meet their attainment goals or the workforce demands of the modern economy without sustained investment in the public higher education sector We conclude with finance policy solutions that states and the federal government can adopt to support their efforts to reach state postsecondary attainment goals and close equity gaps in degree attainment and college completion
SHEEO INVESTIGATING THE IMPACTS OF STATE HIGHER EDUCATION APPROPRIATIONS AND FINANCIAL AID6
copy 2021 by the State Higher Education Executive Officers Association (SHEEO)
ACKNOWLEDGMENTS
The authors would like to thank Celeste Carruthers Patrick Crane Jacob Fowles and Robert Toutkoushian for reviewing an earlier draft of this paper and for their thoughtful suggestions for improvement We would also like to thank Nick Hillman and Carlos Santiago for serving as discussants when we presented this paper as part of SHEEOrsquos webinar series on state higher education finance A special thank you goes out to Sameer Gadkaree who not only served as our program officer at the Joyce Foundation but who also served as an important thought partner on this project and whose suggestions greatly improved the final product This project was funded by the Joyce Foundation Finally wersquod like to thank Gloria Auer Caitlin Dennis Kelsey Heckert and Annahita Jimmerson at SHEEO whose efforts made this work possible The contents including all opinions conclusions and any errors are the responsibility of the authors alone
SHEEO INVESTIGATING THE IMPACTS OF STATE HIGHER EDUCATION APPROPRIATIONS AND FINANCIAL AID7
copy 2021 by the State Higher Education Executive Officers Association (SHEEO)
EXECUTIVE SUMMARY
What happens to student outcomes if a state increases (or decreases) public funding for higher education What portion of state higher education funding should be allocated to general operating support for institutions that may mitigate tuition rate increases for all students and what portion should be allocated to financial aid programs that target low-income students To what extent do each of these finance strategies impact enrollment graduation rates credential completion and other important outcomes State policymakers must consider these questions (among others) each budget cycle as they make difficult decisions about where to allocate scarce public dollars With the COVID-19 pandemic creating unprecedented health and economic challenges demand for public services will likely outpace available tax revenues in the coming years making these decisions even more difficult This paper seeks to provide some guidance to policymakers as we find clear evidence in the empirical literature that increased financial investmentsmdashspecifically increased state general operating and student financial aidmdashare directly tied to student success in higher education
While individuals accrue significant benefits from earning higher education credentials (eg higher wages) evidence suggests that the public benefits accrued by society are greater than the private benefits enjoyed by individuals (McMahon 2009) These public benefits such as increased democratic engagement reduced crime and health-care costs lower poverty rates and higher state tax revenues (Ma et al 2019b) are a primary reason states collectively allocated more than $100 billion for higher education in 2019 (Laderman amp Weeden 2020) and have established goals to increase educational attainment rates
States invest in public higher education in two primary ways through direct funds to institutions (general operating support) and direct funds to students in the form of state financial aid programs (student grant aid) General operating support is the larger of the two funding categories totaling $808 billion in 2019 while state financial allocations totaled $123 billion1 States have steadily increased funding for each category over the last few years however on a per-student basis general operating appropriations are 118 lower than in fiscal year 2008 when the Great Recession began while financial aid allocations per student are 30 greater
State funding for public higher education may be more important now than ever as we have never entered a recession with such a low level of state operating support This low level of funding comes as income inequality equity gaps low graduation rates persistent access challenges a rapidly changing economy and increased global competition all demand a more robust public higher education system States will not be able to meet these challenges without investing in their public institutions
This paper documents the importance of state higher education funding by synthesizing the available data and empirical literature on student and other outcomes We begin by discussing the current and historical context of state funding for general operating support and student financial aid Next we review the findings from our systematic review of the empirical literature on the impact of public investment on a wide range of institutional and student outcomes including
1 States also allocate funding for research agriculture extension programs and medical education that is not included in the general operating support amount Please see SHEEOrsquos annual State Higher Education Finance report for additional details (Laderman amp Weeden 2020)
SHEEO INVESTIGATING THE IMPACTS OF STATE HIGHER EDUCATION APPROPRIATIONS AND FINANCIAL AID8
copy 2021 by the State Higher Education Executive Officers Association (SHEEO)
enrollment completion and post-collegiate outcomes Using elasticities from the most rigorous research findings we simulate the effects of increasing general operating support and financial aid on student outcomes We close by providing recommendations for policymakers at the state and federal levels
CURRENT AND HISTORICAL CONTEXT OF STATE SUPPORT FOR HIGHER EDUCATION
NATIONAL TRENDS IN APPROPRIATIONS FOR GENERAL OPERATIONS
General operating appropriations at public institutions (which excludes financial aid research and medical appropriations) follow changes in the economic cycle rising during economic expansions and decreasing at greater rates than other budget categories during recessionary periods (Hovey 1999 Delaney amp Doyle 2011) Data from the State Higher Education Finance (SHEF) report highlight the following trends
bull First declines in state support per student have grown steeper and recoveries have become slower and less complete with each recession since 1980
bull Second even though general operating support increases during economic expansions it has not kept pace with enrollment increases and inflation Comparing general operating appropriations (in constant dollars) and full-time equivalent (FTE) student enrollment in 2019 with the fiscal years in which the two recessions of the 2000s began to show we find
ndash In 2001 public institutions enrolled 87 million students and received $826 billion in general operating support ($9547 per FTE student)
ndash In 2008 public institutions enrolled 102 million students and received $856 billion in general operating support ($8377 per FTE student)
ndash In 2019 public institutions enrolled 109 million students and received $808 billion in general operating support ($7388 per FTE student)
NATIONAL TRENDS IN STATE GRANT AID
Using data collected from the National Association of State Student Grant and Aid Programs (NASSGAP) annual survey we find that state support for student grant aid is less correlated with the economic cycle Since 2001 state grant aid has
bull Increased approximately 72 in inflation-adjusted dollars with over $123 billion awarded in the most recent year
bull Increased in every year throughout this time period with the exception of a slight decrease during the 2012 fiscal year
Grant aid programs are more targeted than general operating appropriations Many state financial aid programs are primarily need-based or at least have a need-based component however in recent years non-need-based programs have proliferated Trends in need-based and non-need-based aid between 2001-2019 show
bull The proportion of need-based grant aid awarded oscillates between 70 and 77 with the $91 billion awarded on the basis of need in 2019 representing approximately 74 of the share of state grant aid
SHEEO INVESTIGATING THE IMPACTS OF STATE HIGHER EDUCATION APPROPRIATIONS AND FINANCIAL AID9
copy 2021 by the State Higher Education Executive Officers Association (SHEEO)
bull The amount of need-based grant aid increased 69 while non-need-based grant aid increased at a rate of almost 83 albeit from a much lower base ($18 vs $54 billion)
COMPARISON OF TRENDS IN GENERAL APPROPRIATIONS AND FINANCIAL AID
Unlike general operating appropriations which increase and decrease in tandem with the business cycle state aid per FTE on a national basis has steadily increased independent of broader economic trends As a result state financial aid increased from 44 to 99 of all public education appropriations (a broad measure of state and local support) between 2001 and 2019
State-level trends support the national picture (on a per-FTE basis after adjusting for inflation) Between 2001 and 2019
bull 29 states decreased general operating appropriations but increased financial aid allocations
bull 11 states decreased general operating and financial aid appropriations
bull 5 states increased both general operating and financial aid appropriations
bull 2 states increased general operating appropriations but decreased financial aid allocations
bull 2 states decreased general operating appropriations and held financial aid allocations flat
bull 1 state held general operating appropriations flat but decreased state financial aid allocations
PRIOR LITERATURE ON THE EFFECTS OF STATE APPROPRIATIONS
To quantify the effects of state appropriations we identified and systematically reviewed 81 studies that examined how changes in state appropriations affect student outcomes From this literature review we identified the following key findings
GENERAL OPERATING APPROPRIATIONS AFFECT TUITION AND EXPENDITURE
ALLOCATIONS
Public institutions respond to declines in state appropriations in two main ways
CHANGES IN TUITION REVENUE
bull Public four-year institutions increase tuition to offset reductions in state apportions however these increases are not large enough to entirely offset the state funding reductions (Webber 2017)
bull Institutions raise tuition revenue by increasing out-of-state and international enrollments (Jaquette amp Curs 2015)
bull This strategy of raising alternative revenues is most prevalent at doctoral institutions (especially state flagship universities) followed by masterrsquos and bachelorrsquos institutions (Bound et al 2019 Jaquette amp Curs 2015)
bull The evidence is mixed on whether two-year colleges respond to state appropriation declines by increasing tuition (Goodman amp Volz 2020 Zhao 2018a)
SHEEO INVESTIGATING THE IMPACTS OF STATE HIGHER EDUCATION APPROPRIATIONS AND FINANCIAL AID10
copy 2021 by the State Higher Education Executive Officers Association (SHEEO)
CHANGES IN INSTITUTIONAL EXPENDITURES
bull Institutions that are unable to raise tuition and fees to the extent needed to offset state funding reductions respond by decreasing expenditures The largest impact is on education and related expenditures essential for student success (ie instruction academic support and student services) (Deming amp Walters 2018)
bull Reducing educational expenditures is most prevalent at two-year institutions and least common at doctoral institutions (Zhao 2018a) Since research universities have a wider range of alternative revenue sources (eg increasing tuition increasing enrollment of out-of-state students) community colleges experience the most detrimental cuts to institutional expenditures
GENERAL OPERATING APPROPRIATIONS AFFECT STUDENT OUTCOMES
The research shows clear relationships between state higher education funding and student outcomes As states seek to improve educational attainment rates and close equity gaps these findings suggest state funding has an important role in these efforts
ENROLLMENT OUTCOMES
bull Decreases in state appropriations lead to decreased in-state undergraduate enrollment with these effects lasting several years Additionally increases in state funding lead to increases in enrollment (Trostel 2012)
bull Enrollment is not impacted equally across all types of institutional control following state funding reductions students who would likely have enrolled at a public institution choose to enroll at a for-profit institution (Goodman amp Volz 2020)
bull Some public four-year institutions (predominantly research universities) respond to state appropriation reductions by increasing their enrollment of out-of-state undergraduate students and decreasing the share of low-income and underrepresented minority students (Jaquette et al 2016) which suggests reductions in state funding may induce institutions to shift their focus away from serving underrepresented students of color and toward students with the ability to pay the most tuition
GRADUATION RATES AND COMPLETIONS
bull The research overwhelmingly finds evidence that cutting state appropriations leads to detrimental credential outcomes both in graduation rates and the quantity of credentials awarded (Bound et al 2019 Zhao 2018a)
bull Community colleges experience the most detrimental impact to their degree productivity in part because these institutions are unable to increase tuition and must endure the bulk of the impact of state appropriation cuts in the form of decreased education expenditures
bull Increases in state appropriations help shorten time to degree among students attending four-year institutions and increase the likelihood of community college students transferring to four-year institutions (Chakrabarti et al 2020)
SHEEO INVESTIGATING THE IMPACTS OF STATE HIGHER EDUCATION APPROPRIATIONS AND FINANCIAL AID11
copy 2021 by the State Higher Education Executive Officers Association (SHEEO)
POST-COLLEGIATE OUTCOMES
Changes in state appropriations have impacts that extend beyond college success The results below represent outcomes for students in their 20s and 30s
bull For students beginning at both two- and four-year institutions experiencing an increase in state appropriations while enrolled decreased the probability of ever originating a student loan For students enrolled at two-year institutions the increase in appropriations also decreased the likelihood of having a student loan in default or delinquent status (Chakrabarti et al 2020)
bull For students who started at a two-year institution experiencing an increase in state appropriations while enrolled led to an increased likelihood of having an auto loan a lower likelihood of having delinquent car debt an increased credit score and an increased adjusted gross income by zip code of residence (Chakrabarti et al 2020)
GENERAL OPERATING APPROPRIATIONS ARE INEQUITABLY DISTRIBUTED
Key themes throughout the literature are the large variation between institution types in baseline amounts of state appropriations received institutional responses to changes in state appropriations and the effects of these changes Public two-year institutions and open-access four-year institutions which serve the bulk of underrepresented students of color (defined as American IndianAlaska Native Black Latinx and Native Hawaiian or Other Pacific Islander) receive the lowest amount of funding and experience the most adverse effects of funding cuts (Ahlman 2019 Hillman 2020 Carnevale amp Strohl 2013) These institutions are also often the most reliant on state funding and therefore would be disproportionately impacted by across-the-board state funding cuts Conversely doctoral universities which typically have the most resources disproportionately educate the most advantaged (full-time white affluent) students (Mugglestone et al 2019) These patterns suggest that the funding disparities between institution types may not only be unequal but inequitable as well
PRIOR LITERATURE ON THE EFFECTS OF STATE GRANT AID
The literature quantifying the effects of grant aid on student outcomes has grown considerably in recent decades and is more developed than research on state appropriations After our systematic literature search we identified 91 studies for review
States have developed a wide variety of financial aid programs that target different students Many of the initial state aid programs established in the 1960s and 1970s included a need-based component that targeted aid toward lower-income students Broad-based merit-aid programs which became popular in the 1990s and 2000s were ostensibly developed to keep the best and brightest students in state and provide high school benchmarks for all students to attain but much of this aid flows to students from wealthier families More recently states have developed promise programs intended to provide universal access to at least the two-year sector Many of these newer promise programs also include a minimal merit component andor income caps to help keep costs down and better target aid
SHEEO INVESTIGATING THE IMPACTS OF STATE HIGHER EDUCATION APPROPRIATIONS AND FINANCIAL AID12
copy 2021 by the State Higher Education Executive Officers Association (SHEEO)
POLICY DESIGN MATTERS FOR STUDENT BEHAVIOR AND STATE GOALS
Because the choice of program will dictate which students receive state aid it is important for states to ensure their aid programs reinforce state goals While there is evidence that merit-aid programs are successful in keeping the target student population in the state while they are enrolled the evidence also suggests merit programs do little to increase state-specific postsecondary attainment rates as many merit-aid recipients leave the state after graduation (Fitzpatrick amp Jones 2016 Sjoquist amp Winters 2013 Sjoquist amp Winters 2014) Consequently a need-based program or promise program that includes student supports may be more effective at reaching students who would not otherwise attend a postsecondary institution and thus be more effective at raising state educational attainment levels Likewise programs that are easily understood widely publicized and paired with critical student supports have been shown to be effective in positively impacting student outcomes (Angrist et al 2020 Carruthers amp Fox 2016 Gurantz 2018 Miller et al 2020 Page et al 2019b) With limited resources to allocate to financial aid states will need to think carefully about how their financial aid allocations support progress toward achieving state goals
SIMULATED IMPACTS OF STATE APPROPRIATIONS AND FINANCIAL AID
State appropriations and financial aid likely work together to improve student outcomes and in reality states must consider the relative impacts of each funding strategy and make decisions regarding both appropriations and grant aid in concert We use the research findings to simulate the impacts of increased general operating appropriations (often conceptualized as increased institutional resources or spending) and the impacts of state-funded student financial aid programs These simulations are intended to provide context and real numbers for the findings discussed in our literature review
SIMULATION 1 WHAT IS GAINED BY INVESTING IN HIGHER EDUCATION THROUGH
OPERATING SUPPORT
For this simulation we use the results from Deming and Walters (2018) and assume a consistent effect in all states to estimate an across-the-board $1000 per FTE change in state appropriations on overall outcomes at the US level At public two-year institutions a $1000 increase in state funding per FTE would result in 216029 more associate degrees being awarded in the following year and 216623 more associate degrees awarded two years later At public four-year institutions the same $1000 increase in state appropriations per FTE would result in an estimated 75046 more bachelorrsquos degrees awarded two years later and 73738 more bachelorrsquos degrees awarded three years later
SIMULATION 2 WHAT IS GAINED BY INVESTING IN HIGHER EDUCATION THROUGH
FINANCIAL AID
We rely upon Nguyen et alrsquos (2019) evaluation of the impact of merit- and need-based aid on persistence and degree completion to project what a change in financial aid spending may mean for degree production in the United States Due to data limitations we use national Pell Grant cohort data to conduct the simulation An increase of $1000 per student in grant aid would result in around 11000 additional credentials among Pell Grant recipients in four-year public institutions each year and between 8000 and 9500 additional credentials among Pell Grant recipients in public two-year institutions
SHEEO INVESTIGATING THE IMPACTS OF STATE HIGHER EDUCATION APPROPRIATIONS AND FINANCIAL AID13
copy 2021 by the State Higher Education Executive Officers Association (SHEEO)
POLICY RECOMMENDATIONS
We conclude with several finance policy solutions that states and the federal government can adopt to support their efforts to reach state postsecondary attainment goals and close equity gaps in degree attainment and college completion
STATE POLICY
At the state level policy decisions frequently come down to the amount of funding available States rarely have adequate budget resources to fully fund every priority and the decisions states make about how to allocate scarce resources can propel progress toward achieving postsecondary goals or create unintended roadblocks that derail progress toward these goals
1 Increase State Support While we recognize that significant increases in state support for institutions are not likely in the next year or two states should invest more in their public institutions when possible States are not likely to see significant gains in their postsecondary completion numbers and attainment rates without increased investment in their institutions As the literature reviewed attests and as shown in our simulations such investments are likely to pay significant dividends through increased enrollment persistence and completions The overall increase in educational attainment that comes with state investment in their institutions will help states meet dynamic workforce needs of the post-pandemic economy provide many additional societal benefits (McMahon 2009) and increase state income tax revenue (Chakrabarti 2020) Likewise most studies we reviewed consistently point toward additional financial aid dollars influencing student behavior Moreover the dollars invested in these programs have a large return on investment for state and federal governments through increased student persistence and credential attainment as well as increased income tax revenue (Anderson 2020 Denning et al 2019) Because the form that general operating and financial aid appropriations come in and the overall purposes of both strategies vary it is difficult if not impossible to determine the appropriate ratio of total higher education funding each should receive However because state operating appropriations serve to support the entire mission of institutions contribute to the overall quality of the education experience and directly impact student access and success support for state financial aid programs should not come at the expense of general operating support
2 State Funding Equity Audit In a recent report Hillman (2020) proposes that policymakers should consider conducting funding equity audits in order to understand current trends in state funding gaps in funding between institution types and how these patterns overlap with race- and income-based patterns of student enrollment While there are significant challenges to isolating the instructional spending at institutions as Hillman recommends the exercise could still provide new and useful information for policymakers to consider Hillman stresses that states should be transparent about the results of these audits and make the audits widely accessible to the public Readers interested in learning more about what a state funding equity audit might look like and how policymakers could use such an audit to address current funding inequities in their states should read Hillmanrsquos recent Third Way report2
2 Hillman N (2020) Why rich colleges get richer amp poor colleges get poorer The case for equity-based funding in higher education Third Way httpswwwthirdwayorgreportwhy-rich-colleges-get-richer-poor-colleges-get-poorer-the-case-for-equity-based-funding-in-higher-education
SHEEO INVESTIGATING THE IMPACTS OF STATE HIGHER EDUCATION APPROPRIATIONS AND FINANCIAL AID14
copy 2021 by the State Higher Education Executive Officers Association (SHEEO)
3 Adjust Funding to Promote Equity Completions and Attainment Ensure institutions that serve the bulk of underrepresented students of color and low-income students are funded appropriately and attempt to correct historical underfunding Funding allocation models should promote access and success for underrepresented students States should adjust their funding allocation strategies to be consistent with articulated state goals of reducing equity gaps and increasing educational attainment Prioritizing increases to the base allocation for institutions serving the statersquos priority populations (eg students of color low-income students and adult learners) will help achieve these goals
4 Alternative Revenues Matter Decreases in state appropriations lead to cuts in institutional spending on services essential for student success (eg instruction academic support student services) Since public four-year institutions particularly research universities have a wider range of alternative revenue sources (eg increasing tuition increasing enrollment of out-of-state students) community colleges experience the most detrimental cuts to institutional expenditures as a result of declining state appropriations States should consider all institutional revenues and make strategic decisions regarding state appropriations in concert with decisions about tuition rates and out-of-state tuition caps
5 Financial Aid Messaging Matters There is currently a tradeoff between targeting financial aid funds to those who would be most influenced by receiving additional aid dollars (eg low-income students) and the messaging of simple eligibility requirements (eg state and local promise programs) It may behoove states who are able to fully or mostly fund their need-based financial aid to invest resources in marketing the program to students who have traditionally been unaware of state and even federal aid In fact research by Gurantz (2018) suggests these types of initiatives for targeted aid can be successful
6 Student Supports Matter The financial aid programs that are most successful invest in aid dollars as well as in supports for students For instance in Tennessee the free college program conveys a simple message to state residents and provides support for students considering college through governmental agencies as well as with significant support from philanthropic organizations Other programs with successful track records such as the Dell Scholars program invest significant time and money into their students (Page et al 2019b) as do the Susan Thompson Buffett Foundation in Nebraska (Angrist et al 2020) and the ASAP program in a number of states (Miller et al 2020)
FEDERAL POLICY
While this paper focuses on state funding and policy the federal government has had an increasing role in higher education finance and is uniquely positioned to provide stabilizing support and incentives for states to increase funding for higher education We propose two potential federal solutions to the problems discussed in this paper
1 A Federal-State Partnership for College Affordability The economic impact of the coronavirus pandemic has already resulted in increasingly strained state budgets and unlike at the federal level states do not have the ability to run a deficit with their budgets The two levels of government can share financial responsibility for increasing government investment in higher education and making college more affordable for low-income students Tandberg et al (2017) have proposed a measure of affordability and a federal-state partnership with this goal in mind Under this proposal any
SHEEO INVESTIGATING THE IMPACTS OF STATE HIGHER EDUCATION APPROPRIATIONS AND FINANCIAL AID15
copy 2021 by the State Higher Education Executive Officers Association (SHEEO)
additional state funding given to support low-income students would be matched with federal funds with a goal of students devoting no more than 10 of their discretionary income toward student loan repayment Readers interested in learning more about what this federal-state partnership might look like should read their proposal3
2 Title I-Type Program for Higher Education The federal Title I program provides K-12 schools serving a large proportion of low-income students with additional funding for extra educational services A parallel grant program could be designed for higher education with eligibility determined based on serving a large sharenumber of low-income students or a combination of income- and raceethnicity-based eligibility thresholds Current K-12 Title I programs require that federal dollars supplement rather than replace state and local funding and a similar requirement could be written into a higher education Title I program Readers interested in learning more about what a potential design of such a program might look like should read Third Wayrsquos (Hiler amp Whistle 2018) proposed program design4
3 Tandberg D Laderman S amp Carlson A (2017) A federal-state partnership for true college affordability State Higher Education Executive Officers Association httpssheeoorgwp-contentuploads201903Federal-State_Partnership_for_True_College_Affordabilitypdf
4 Hiler T amp Whistle W (2018) Creating a ldquoTitle Irdquo for higher ed Third Way httpswwwthirdwayorgmemocreating-a-title-i- for-higher-ed
SHEEO INVESTIGATING THE IMPACTS OF STATE HIGHER EDUCATION APPROPRIATIONS AND FINANCIAL AID16
copy 2021 by the State Higher Education Executive Officers Association (SHEEO)
INTRODUCTION
Public higher education which educates approximately 75 of all postsecondary students5 is in the midst of cuts in state funding as the economic impact of the COVID-19 pandemic wreaks havoc on state budgets The majority of states have failed to recover funding for higher education since the last major economic downturn the Great Recession of 2008 After more than $2000 in per-student funding reductions during the Great Recession inflation-adjusted average per-student educational appropriations (the sum of general operating appropriations to institutions and state financial aid awards to students) in 2019 were $8196 87 below their pre-recession level6 More than a decade after the start of the Great Recession this pandemic and its effects on state budgets likely marks the end of the seven straight years of per full-time equivalent (FTE) increases in education appropriations and the start of a new set of substantial cuts to public higher education funding that may take decades to recover from
We have already begun to feel the economic impact of the pandemic on higher education funding Early evidence shows that state tax appropriations declined 18 percent from 2020 to 2021 not accounting for inflation7 For context higher education funding often serves as a ldquobalance wheelrdquo in state budgets (Hovey 1999 Delaney amp Doyle 2011) which means that in economic downturns such as those following the dot-com bubble in 20018 and the Great Recession in 2008 higher education funding takes a back seat to other areas with constitutionally required or federally matched funding such as K-12 education and Medicaid The deprioritization of higher education as a state budget priority appears to be occurring once again as many states made midyear cuts to their higher education spending as they grapple with how to mitigate budget shortfalls driven by the pandemic9
The pandemic has also led to public colleges and universities losing revenue from decreased fundraising and typical auxiliary revenues such as summer camps The shift to online learning during the spring 2020 semester led to both increasing costs and loss of revenue as institutions provided students with refunds on unused campus services such as dining plans and student housing During the summer 2020 semester institutions lost nearly all auxiliary revenue from camps events and other programming that they have become dependent on to help fund their operations Likewise they spent a considerable amount of money on technology and protective measures in preparing for the fall The fall 2020 semester continued this pattern of increased costs and decreased revenue Perhaps most critical and unlike past recessions enrollments have not increased but are actually lower on average with the largest declines experienced at community colleges Among first-time students higher education saw a substantial decline of 13 Community colleges had the steepest decline (-189) followed by public four-year colleges (-105) (National Student Clearinghouse 2020)
5 Based on authorsrsquo calculation of IPEDS data
6 This is part of a longer trend ndash appropriations per student are $2000 below 2001 levels before the dot-com bubble
7 Laderman S amp Tandberg D (2021) SHEEO analysis of fiscal year 2021 state funding for higher education State Higher Education Executive Officers Association httpssheeoorgwp-contentuploads202103SHEEO_Analysis_FiscalYear2021_State_Fundingpdf
8 For a more in-depth account of the dot-com bubble please see httpswwwnberorgsystemfileschaptersc0124c0124pdf
9 See examples in Missouri (httpswwwkansascitycomnewspolitics-governmentarticle243172006html) and Colorado (httpscochalkbeatorg202051921264509lawmakers-cut-58-percent-from-colorado-public-colleges-3-3-billion-budget-hole)
SHEEO INVESTIGATING THE IMPACTS OF STATE HIGHER EDUCATION APPROPRIATIONS AND FINANCIAL AID17
copy 2021 by the State Higher Education Executive Officers Association (SHEEO)
With the decline in other revenue sources state funding for public higher education may be more important now than ever States invest in public higher education in two primary ways through direct funds to institutions (general operating support) and direct funds to individuals who can then choose which in-state institution to take those dollars to10 (student financial aid) On a per-student level support for public higher education has declined over time In addition the relative size of these two components of state support have changed over time State student financial aid per-FTE has increased 341 since the start of the Great Recession and is now at an all-time high comprising 99 of total state support11 In contrast general operating support dropped substantially at the start of the Great Recession and remains 118 below pre-recession levels There is substantial heterogeneity between states in the amount and distribution of state investment in higher education as well as in the degree to which states have recovered from cuts made during the Great Recession
Both sources of state funding are important factors in educating todayrsquos students Student financial aid has been shown to directly impact student access (the likelihood of the student enrolling in college at all) and choice (where the student enrolls) (Bruce amp Carruthers 2014 Cohodes amp Goodman 2014 Castleman amp Long 2016) Financial aid has been shown to increase college completion and attainment in some states (Dynarski 2008 Scott-Clayton 2011 Zhang Hu amp Sensenig 2013) but not in others (Welch 2014 Sjoquist amp Winters 2015) General operating appropriations are a critical resource that public institutions rely on to fund the education and direct services students receive and make the price of attending college more affordable to state residents The weak recovery of and anticipated future cuts to state higher education general operating funds are worrisome since this general institutional funding is directly tied to what students learn and experience while they are enrolled and ultimately the likelihood of their successful completion (Deming amp Walters 2018 Bound et al 2019)
HISTORICAL CONTEXT
The effort to determine the ideal structure of public funding for higher education is not new but has shifted focus in the face of an overall declining reliance on state support for public institutional revenues In the late 1960s and into the 1970s researchers and policymakers were concerned that using state dollars to broadly fund higher education was regressive as students from higher income families still disproportionately attended college and families across the income spectrum funded state subsidies (Hansen amp Weisbrod 1969 Peltzman 1973)
In the 1980s the choice between general operating appropriations and state financial aid was framed as a debate between two schools of thought (Hearn amp Longanecker 1985) Traditionalists advocated for broad public subsidies through general operating appropriations based on a belief that the public benefits of a public system of higher education justified the costs while revisionists argued that because there are both public and private (individual) benefits to higher education the public and individuals should share the cost Additionally revisionists focused on establishing the most efficient use of state funds to generate desired outcomes (Hearn amp Longanecker 1985) By the 1990s this debate had reached ldquoalmost mythic proportionsrdquo (Hossler et al 1997 p 162)
10 States vary in the restrictions of state student financial aid Some states such as Tennessee and Florida allow students to use these funds at in-state public or private institutions whereas other states such as New York restrict these funds to in-state public schools only
11 Calculations based on the State Higher Education Finance (SHEF) 2019 report State student financial aid per-FTE excludes financial aid to students attending out-of-state institutions (less than 1 of all state financial aid) Total state support is the sum of American Recovery and Reinvestment Act (ARRA) funds tax appropriations non-tax support non-appropriated support state-funded endowment earnings and other state funds net of any funds not available for use
SHEEO INVESTIGATING THE IMPACTS OF STATE HIGHER EDUCATION APPROPRIATIONS AND FINANCIAL AID18
copy 2021 by the State Higher Education Executive Officers Association (SHEEO)
Advocates of the two funding models discussed theoretical economic trade-offs but little evidence existed on the extent to which the funding structure mattered for states and students (Hossler et al 1997)
Empirical interest in the trade-offs between allocating state funding to institutions versus students waned in the early 2000s State funding began to decline following the 2001 recession and has never fully recovered (Laderman amp Weeden 2020) Tuition rates and revenues increased in response and the attention of many researchers and advocates turned to these concerns Much of the research reviewed in this paper focused exclusively on either appropriations or grant aid rather than discussing the relative advantages of the two
CURRENT CONTEXT
Nationally we face a shortage of workers with postsecondary degrees and high-quality credentials as well as a growing wage gap between those with and without a postsecondary education (Hershbein Kearney amp Pardue 2020 Lumina Foundation 2019) Most states have specific attainment goals to reduce these shortages both to ensure that their workforce has the skills needed for an increasingly technical labor market and to address individual-level income inequality To reach these goals states not only need to get more residents in the doors of postsecondary institutions they also need to focus on providing the financial support needed to increase the proportion of postsecondary students who successfully complete degrees and high-quality credentials Further states must continue to or start prioritizing reducing raceethnicity- and socioeconomic-based attainment and completion gaps that exist due to higher educationrsquos history of excluding and underserving specific populations of students12 States must think critically about which students and institutions are likely to be most harmed by this economic downtown including students from lower-income families and historically minoritized students as well as regional public universities and community colleges and how they can best support these groups While raceethnicity-based equity gaps have been declining in some states they are growing in many others13 States need to remain attentive to how they can invest their higher education dollars to ensure that these gaps start or continue to shrink rather than grow
Many of the resources that can help move the needle on increasing overall completion rates and decreasing equity gaps rely on states providing institutions with adequate general operating support With students and families questioning the quality of the fully online and hybrid approaches that many state institutions implemented in fall 2020 and continued through spring 2021 due to the pandemic institutions have had limited ability to react to decreasing state investment with an increase in tuition and fees a strategy often utilized by institutions in the past In this context state appropriations will be crucial to public institutionsrsquo ability to provide students with a quality and affordable education
12 See Lorelle L Espinosa Jonathon M Turk Morgan Taylor and Hollie M Chessman Race and ethnicity in higher education A status report ( 2019) American Council on Education httpswwwequityinhigheredorg Suzanne Kahn Mark Huelsman and Jen Mishory Bridging progressive policy debates How student debt and the racial wealth gap reinforce each other September 2019 The Roosevelt Institute The Century Foundation and Demos httpstcforgcontentreportbridging-progressive-policy-debates-student-debt- racial-wealth-gap-reinforce
13 See Andrew Howard Nichols and J Oliver Schak Degree attainment for Black adults National and state trends 2017 The Education Trust httpsedtrustorgresourcenational-state-trends-degree-attainment-black-adults and Andrew Howard Nichols and J Oliver Schak Degree attainment for Latino adults National and state trendsrdquo 2017 The Education Trust httpsedtrustorgresourcenational-state-trends-in-degree-attainment-latino-adults
SHEEO INVESTIGATING THE IMPACTS OF STATE HIGHER EDUCATION APPROPRIATIONS AND FINANCIAL AID19
copy 2021 by the State Higher Education Executive Officers Association (SHEEO)
The paper is organized as follows First we discuss the current and historical context of state support for higher education Next is a summary of literature related to the impact of each of the two main state higher education funding sourcesmdashdirect operating support and student financial aidmdashon student success This is followed by a comparison of the relative impact of each of these funding sources including simulations using elasticities from the literature review We end by charting a path forward that calls for adequate state-sponsored direct support for public postsecondary institutions We find clear evidence in the extant literature that increased financial resourcesmdashspecifically increased state general operating and student financial aidmdashare directly tied to student success in higher education The overarching aim of this paper is to provide evidence of the importance of states investing directly in their public institutions through general operating support in order to maintain funding for crucial services that support students and to prevent large increases in tuition As states struggle to reconcile how they will afford to provide adequate funding to higher education institutions amidst a pandemic we urge states to think critically about the cost of failing to do so
SHEEO INVESTIGATING THE IMPACTS OF STATE HIGHER EDUCATION APPROPRIATIONS AND FINANCIAL AID20
copy 2021 by the State Higher Education Executive Officers Association (SHEEO)
CURRENT AND HISTORICAL CONTEXT OF STATE SUPPORT FOR HIGHER EDUCATION
PURPOSE OF STATE FUNDING FOR HIGHER EDUCATION
State governments created and funded public higher education institutions to improve the social and economic well-being of their residents (Enders amp Jongbloed 2007 Singh 2012 Williams 2016) The public benefits of higher education include increasing voting rates and democratic engagement supporting local communities reducing crime and health-care costs reducing poverty and reliance on government funding reducing income inequality increasing state tax revenues and providing an educated workforce and producing research that benefits society (Dee 2004 Chetty et al 2017 Kezar 2005 Lochner 2004 London 2006 Ma et al 2019b Saltmarsh amp Hartley 2011 Singh 2012 Trostel 2010 Williams 2016) The public benefits of higher education line up with the purpose of state funding States fund institutions to develop an educated workforce and improve their economies develop local communities and ensure access to education for all citizens regardless of their life circumstances (Colorado Department of Higher Education nd HECC nd Lingenfelter 2018 Rhode Island Office of the Postsecondary Commissioner nd Virginia Advisory Legislative Council 1955) In the following section we discuss trends in state funding for higher education set within this context of the numerous public benefits and purposes of higher education
NATIONAL TRENDS IN APPROPRIATIONS FOR GENERAL OPERATIONS
As the balance wheel for state budgets (Delaney amp Doyle 2011) general operating appropriations at public institutions follow the trends of the economic cycle as shown in Figure 1 General operating appropriations consist of state and local tax- and non-tax appropriations to public institutions excluding student financial aid and any funds allocated to non-credit or continuing education research agricultural extension and medical programs During economic recessions state general operating appropriations decline for two reasons States cut higher education appropriations andor states are unable to increase appropriations alongside inflation and rapid increases in student enrollment (which occurs during recessions) In 2001 the earliest year for which data are available general operating support totaled $826 billion after adjusting for inflation (Table 1) These funds served 86 million full-time equivalent (FTE) enrolled students in 2001 resulting in an average appropriation of $9547 per FTE for public colleges and universities Appropriations declined both in total and on a per-student basis in the early 2000s following a small recession reaching a low of $759 billion or $7666 per FTE in 2005 After three short years of economic recovery the Great Recession led to the largest and steepest decline in general operating appropriations for public institutions while enrollment rapidly increased Enrollment increased 129 from 102 million in 2008 to 115 million in 2012 (Table 1) During this same time frame general public operating appropriations declined from $856 billion or $8377 per FTE to an all-time low of $713 billion or $6176 per FTE General operating appropriations were supplemented by federal American Reinvestment and Recovery Act (ARRA) funds from 2009 through 2012 but these funds (shown in Figure 1) did not fully mitigate the impacts of state and local funding declines during the Great Recession
SHEEO INVESTIGATING THE IMPACTS OF STATE HIGHER EDUCATION APPROPRIATIONS AND FINANCIAL AID21
copy 2021 by the State Higher Education Executive Officers Association (SHEEO)
Since the low point in 2012 general operating support has increased incrementally to $808 billion in 2019 and student enrollment has declined 52 resulting in a 2019 per-student general operating appropriation of $7388 On a national level general operating funding in 2019 remains 118 below 2008 levels and 226 below 2001 on a per-student basis On average public institutions in 2019 received an inflation-adjusted $2160 less in state and local general operating appropriations per FTE student than in 200114
TABLE 1 IMPACT OF INFLATION AND ENROLLMENT ON STATE GENERAL PUBLIC OPERATING APPROPRIATIONS AND FTE ENROLLMENT IN KEY YEARS US 2001-2019
FY GENERAL OPERATING
UNADJUSTEDHECA INFLATION
ADJUSTMENTGENERAL OPERATING INFLATION ADJUSTED
FULL-TIME EQUIVALENT (FTE)
ENROLLMENT
GENERAL OPERATING PER FTE INFLATION
ADJUSTED
2001 $53457884356 06473 $82588627711 8650554 $9547
2008 $69311140425 08097 $85604396401 10218587 $8377
2012 $62017677800 08681 $71438567443 11546001 $6187
2019 $80783615453 10000 $80783615453 10934890 $7388
NOTES 1 Key years shown in this table are pre-recession high points in state funding (2001 and 2008) the all-time low point in
per-student funding during the last recession (2012) and the latest available data (2019) 2 General operating is the portion of state and local support appropriated directly to public institutions for the purposes
of general operations3 Full-time equivalent (FTE) enrollment converts student credit hours to full-time academic year students but excludes
medical students4 Constant dollars adjusted by the Higher Education Cost Adjustment (HECA)
SOURCE State Higher Education Executive Officers Association State Higher Education Finance Data (httpsshefsheeoorg)
14 Recent reports have used SHEEOrsquos data to question whether state funding for higher education has truly declined over time State higher education finance data can be looked at in many ways (per FTE per capita as a percentage of state budgets including or excluding certain funds using different inflation adjustments and in comparison to different points in history) Most reasonable analyses show a state funding decline but data can be cherry-picked to support a different narrative for those with an agenda Readers curious about the veracity of these claims can find additional information in Appendix B
SHEEO INVESTIGATING THE IMPACTS OF STATE HIGHER EDUCATION APPROPRIATIONS AND FINANCIAL AID22
copy 2021 by the State Higher Education Executive Officers Association (SHEEO)
FIGURE 1STATE GENERAL PUBLIC OPERATING APPROPRIATIONS PER FTE AND FTE ENROLLMENT (CONSTANT $) US 2001-2019
0
2
4
6
8
10
12
14
$-
$1000
$2000
$3000
$4000
$5000
$6000
$7000
$8000
$9000
$100002
00
1
20
02
20
03
20
04
20
05
20
06
20
07
20
08
20
09
20
10
20
11
20
12
20
13
20
14
20
15
20
16
20
17
20
18
20
19
NE
T F
TE
EN
RO
LLM
EN
T M
ILLI
ON
S
DO
LLA
RS
PE
R F
TE
GENERAL PUBLIC OPERATING PER FTE ARRA PER FTE FTE ENROLLMENT
$9
54
7
$9
15
2
$8
40
5
$7
793
$7
68
6
$8
08
2
$8
22
8
$8
377
$7
52
2
$6
74
9
$6
55
4
$6
176
$6
29
6
$6
65
3
$6
92
0
$7
09
7
$7
271
$7
22
4
$7
38
8
NOTES
1 General operating is the portion of state and local support appropriated directly to public institutions for the purposes of general operations
2 Federal American Reinvestment and Recovery Act (ARRA) revenue was provided during the Great Recession to stabilize state and local sources of revenue for higher education
3 Full-time equivalent (FTE) enrollment converts student credit hours to full-time academic year students but excludes medical students
4 Constant dollars adjusted by the Higher Education Cost Adjustment (HECA)
SOURCE State Higher Education Executive Officers Association State Higher Education Finance Data (httpsshefsheeoorg)
With each recession declines in state support per FTE have grown steeper and recoveries have become slower and less complete Figure 2 shows the trend in state funding since the start of each of the last four economic recessions Due to data limitations in years before 2001 these data include general operating appropriations and state financial aid to public institutions However general operating appropriations are shown for the two most recent recessions and have very similar (albeit more negative) trends in total education appropriations
SHEEO INVESTIGATING THE IMPACTS OF STATE HIGHER EDUCATION APPROPRIATIONS AND FINANCIAL AID23
copy 2021 by the State Higher Education Executive Officers Association (SHEEO)
FIGURE 2CHANGE IN EDUCATION APPROPRIATIONS PER FTE FOLLOWING ECONOMIC RECESSIONS (CONSTANT $) US 1980-2019
10
3
-35
-30
-25
-20
-15
-10
-5
0
5
10
15
198
0
198
1
198
2
198
3
198
4
198
5
198
6
198
7
198
8
198
9
199
0
199
1
199
2
199
3
199
4
199
5
199
6
199
7
199
8
199
9
20
00
20
01
20
02
20
03
20
04
20
05
20
06
20
07
20
08
20
09
20
10
20
11
20
12
20
13
20
14
20
15
20
16
20
17
20
18
20
19
-8
-11-11
-14
EDUCATION APPROPRIATIONSRECESSION GENERAL OPERATING
PE
RC
EN
T C
HA
NG
E
NOTES
1 Cumulative percentage change calculated since the start of each recession (1980 1990 2001 and 2008)
2 Education appropriations include general operating support and state financial aid to students attending public institutions General operating is the portion of state and local support appropriated directly to public institutions for the purposes of general operations Both measures include Federal American Reinvestment and Recovery Act (ARRA) revenue provided during the Great Recession to stabilize state and local sources of revenue for higher education
3 Full-time equivalent (FTE) enrollment converts student credit hours to full-time academic year students but excludes medical students
4 Constant dollars adjusted by the Higher Education Cost Adjustment (HECA)
SOURCE State Higher Education Executive Officers Association State Higher Education Finance Data (httpsshefsheeoorg)
STATE TRENDS IN APPROPRIATIONS FOR GENERAL OPERATIONS
National figures mask considerable variation in general operating appropriations across states On a per-FTE basis and after adjusting for differences in cost of living enrollment mix across institution types and inflation general operating appropriations in 2019 ranged from $2449 in Vermont to $17506 in Wyoming The US average is enrollment weighted meaning that larger states such as California New York and Texas with higher than average appropriations disproportionately impact the US average As a result 32 states had below average general operating appropriations in 2019
In addition 42 states have had declines in per-FTE funding since 2001 and public institutions in 40 states received less funding per FTE than in 2008 (after adjusting for inflation) In 14 states general operating appropriations failed to recover at all after the Great Recession and remain below 2012 levels (Appendix A Table 1) Changing trends in general operating appropriations across time are shown in Figure 3 which shows the percentage change and changing dollar amount in inflation-adjusted general operating appropriations per FTE since 2001
SHEEO INVESTIGATING THE IMPACTS OF STATE HIGHER EDUCATION APPROPRIATIONS AND FINANCIAL AID24
copy 2021 by the State Higher Education Executive Officers Association (SHEEO)
FIGURE 3CHANGE IN STATE GENERAL OPERATING APPROPRIATIONS FY 2001-2019 BY STATE
-26
10
45
-40-23
-9-34
-29
-38
-26
21 -41
-43
-36-48
-46
-23
-36
-29
-39
-45
1
-22-20
22
10
-18
11
-35
-45
-20
-53
-39
-29
-21
-18
-10
-30
-28
-43
-37-16
-35
-31
-46
-40
-16
-41
-37
35
NOTES
1 General operating is the portion of state and local support appropriated directly to public institutions for the purposes of general operations Both measures include Federal American Reinvestment and Recovery Act (ARRA) revenue provided during the Great Recession to stabilize state and local sources of revenue for higher education
2 Full-time equivalent (FTE) enrollment converts student credit hours to full-time academic year students but excludes medical students
3 Constant dollars adjusted by the Higher Education Cost Adjustment (HECA)
SOURCE State Higher Education Executive Officers Association State Higher Education Finance Data (httpsshefsheeoorg)
SECTOR-LEVEL TRENDS IN APPROPRIATIONS FOR GENERAL OPERATIONS15
Figure 4 shows sizable differences in the sources and levels of general operating support16
between two-year and four-year institutions The first major difference is in each sectorrsquos reliance on local appropriations In 2017 local appropriations accounted for 42 of general operating appropriations at two-year colleges a 9 percentage-point increase since 2001 After adjusting for inflation local appropriations per FTE were $2783 in 2017 approximately $740 more than in 2001 The increasing reliance on local appropriations has been partly driven by fluctuations in state support17 In 2017 state appropriations per FTE at two-year public institutions were $3849
15 Due to limitations in SHEEOrsquos sector-level data for prior years sector-level analyses in this section are based on data from the Integrated Postsecondary Education Data System (IPEDS) These data have slightly different definitions and should not be directly compared to the SHEEO data shared above The finance data presented in Figure 4 include all state and local appropriations to public institutions funding for non-credit medical agriculture and research are included but state-funded financial aid is not included Due to the structure of IPEDS finance data any grants or contracts allocated to public institutions for general operating could not be included In addition the 12-month FTE enrollment in Figure 4 includes all non-credit and medical students (unlike prior figures) and is estimated for 2001 and 2002 using prior ratios of fall to 12-month FTE
16 In this section general operating support refers to IPEDS state and local appropriations which includes funding for non-credit medical agricultural and research
17 While state funding relies on volatile income and consumption tax bases and can be crowded out by other budget categories local funding predominately comes from property taxes which have a very stable tax base and are a dedicated revenue source for higher education institutions
SHEEO INVESTIGATING THE IMPACTS OF STATE HIGHER EDUCATION APPROPRIATIONS AND FINANCIAL AID25
copy 2021 by the State Higher Education Executive Officers Association (SHEEO)
approximately $330 below 2001 levels At four-year institutions local appropriations accounted for a much smaller proportion of state and local operating funding Local appropriations at four-year institutions increased from $20 per FTE in 2001 to $55 per FTE in 2017 but this amount remains less than 1 of general operating appropriations
The two- and four-year sectors also differ in the amount of state appropriations they receive per student While the four-year sector has consistently received greater state appropriations than the two-year sector over time the gap has narrowed (Figure 4) In 2001 four-year institutions received on average $7191 (172) more per FTE in state appropriations than two-year institutions However following the 2001 recession the funding gap between two- and four-year institutions narrowed The 2001 recession led to declines of 14 and 16 at two- and four-year institutions respectively By 2007 funding at two-year institutions had completely recovered while state appropriations per FTE at four-year institutions remained 14 below 2001 levels
When the Great Recession hit two- and four-year institutions faced similar declines State appropriations declined an inflation-adjusted 20 at two-year institutions and 23 at four-year institutions between 2007 and 2012 After considering enrollment growth there was a 28 decline in both sectors ($1202 per FTE at two-year institutions and $2779 per FTE at four-year institutions) Since 2012 state appropriations have increased 10 and 16 at two- and four-year institutions respectively
Although four-year institutions saw greater growth in total appropriations enrollment has continued to grow at four-year institutions while declining at two-year institutions As a result the funding gap between sectors in state appropriations per FTE continued to narrow during the economic recovery following the Great Recession Since 2012 state appropriations per FTE have increased 257 for the two-year sector but only 87 for the four-year sector Yet funding disparities remain Even with these post-recession appropriation increases state appropriations per FTE remain 10 below 2007 levels for the two-year sector and 22 lower for the four-year sector By 2017 four-year institutions still received $3772 (98) more than two-year institutions in state appropriations per FTE
While the two-year sector appears to have fared better in the aftermath of the Great Recession the recovery in appropriations per FTE at two-year institutions is driven more by declines in enrollment and steady increases in local funding than increases in state appropriations Between 2012 and 2017 enrollment in the two-year sector declined 13 while inflation-adjusted local appropriations increased 16 and state appropriations increased 10 In the four-year sector enrollment increased 7 and total state funding increased 16 Unlike in the two-year sector where enrollment declines and funding increases worked together to result in a full recovery of per-FTE appropriations the increase in four-year funding was not large enough to offset new enrollment growth and make up for state funding declines during the Great Recession
SHEEO INVESTIGATING THE IMPACTS OF STATE HIGHER EDUCATION APPROPRIATIONS AND FINANCIAL AID26
copy 2021 by the State Higher Education Executive Officers Association (SHEEO)
FIGURE 4STATE AND LOCAL APPROPRIATIONS PER FTE AND FTE ENROLLMENT AT TWO- AND FOUR-YEAR INSTITUTIONS (CONSTANT $) US 2001-2017
$4
18
3
$3
74
0
$3
58
4
$3
92
2
$4
12
1
$4
28
9
$4
26
4
$3
80
8
$3
19
1
$3
13
2
$3
02
6
$3
06
2
$3
29
4
$3
477
$3
64
8
$3
678
$3
84
9
$11
373
$10
40
2
$9
65
5
$9
53
4
$9
38
1
$9
56
2
$9
78
8
$8
70
2
$7
83
1
$7
63
0
$7
04
9
$7
00
9
$7
38
2
$7
40
9
$7
33
2
$7
35
3 $
20
40
$2
08
3
$2
13
1
$2
26
1
$2
34
3
$2
40
8
$2
33
1
$2
22
9
$2
016
$1
971
$2
03
8
$2
18
7
$2
28
0
$2
32
5
$2
58
6
$2
70
0
$2
78
3
0
1
2
3
4
5
6
$-
$2000
$4000
$6000
$8000
$10000
$12000
20
01
20
02
20
03
20
04
20
05
20
06
20
07
20
08
20
09
20
10
20
11
20
12
20
13
20
14
20
15
20
16
20
17
20
01
20
02
20
03
20
04
20
05
20
06
20
07
20
08
20
09
20
10
20
11
20
12
20
13
20
14
20
15
20
16
20
17
FTE
EN
RO
LLM
EN
T M
ILLI
ON
S
DO
LLA
RS
PE
R F
TE
TWO-YEAR FOUR-YEAR
STATE APPROPRIATIONS PER FTE LOCAL APPROPRIATIONS PER FTE FTE ENROLLMENT
$7
62
0
NOTES
1 In all years local appropriations to four-year institutions were less than $60 per FTE
2 Institution type is based on Carnegie classification Baccalaureate and above are considered four-year institutions mixed institutions are classified according to their previous designation and institutions outside of the US or those with a special classification are excluded
3 Estimated 2001 and 2002 12-month FTE using available fall FTE data and 12-month as a proportion of fall FTE for the earliest available year(s)
4 Constant 2017 dollars adjusted by the Higher Education Cost Adjustment (HECA)
SOURCES IPEDS Finance Survey 2001-2017 IPEDS Directory 2001-2017 Carnegie Classifications 2000-2015
NATIONAL TRENDS IN STATE GRANT AID
In stark contrast to the cyclical trends that characterize the general operating appropriations funding patterns presented above state support for student grant aid has consistently increased during the last two decades Using data collected from the National Association of State Student Grant and Aid Programs (NASSGAP) annual survey Figure 5 shows that total state grant aid increased approximately 72 in inflation-adjusted dollars from 2001 to 2019 with over $123 billion awarded in the most recent year18 In fact state grant aid increased every year throughout this time period with the exception of a slight decrease (13 or $14 million) from 2011 to 2012 Statesrsquo commitments to grant aid programs have well outpaced inflation in the 2000s yet aid remains a small proportion of total state support for public institutions The $123 billion awarded in 2019 amounts to approximately 15 of the $808 billion of general operating support provided the same year
18 Due to the targeted nature of state financial aid programs wherein financial aid dollars do not evenly support all students the analyses of financial aid data focus on total dollars awarded rather than standardizing by FTE Yet even after adjusting for increased enrollment state support for student grant aid has increased substantially from FY 2001 through FY 2019 (Trends in Student Aid 2020)
SHEEO INVESTIGATING THE IMPACTS OF STATE HIGHER EDUCATION APPROPRIATIONS AND FINANCIAL AID27
copy 2021 by the State Higher Education Executive Officers Association (SHEEO)
Historically state grant aid has been less vulnerable to economic recessions than general operating support as states have prioritized maintaining or increasing funding for financial aid during economic recessions However eligibility requirements attached to state grant aid programs have changed over time and do at times become less generous in the size of the award or the number of students served Many of the largest state financial aid programs began in the 1970s and were primarily need-based or at least had a need-based component but in recent years non-need-based programs have proliferated19 Many of these programs are described as merit-based student grant aid programs though more widely available promise programs have gained national attention more recently In examining the trends in need- and non-need-based grant aid presented in Figure 5 it is clear that need-based grant aid far exceeds its counterpart throughout the time series presented The proportion of need-based grant aid oscillates between 70 and 77 with the $91 billion awarded on the basis of need in 2019 representing approximately 74 of the share of state grant aid From 2001 to 2019 need-based grant aid increased 69 while non-need-based grant aid increased at a rate of almost 83 albeit from a much lower base ($18 vs $54 billion) As expected the growth in non-need-based grant aid primarily resulted from the adoption of new financial aid programs often funded by state lotteries while the increase in need-based grant aid came about through the increased funding of longstanding need-based grant aid programs In fact increased investments in need-based aid in some of the most populous states such as California and Texas account for a sizable portion of the national gains reported (eg $23 billion) These increased investments have primarily come in the form of providing aid to additional students Though NASSGAP has an imperfect measure of the number of students receiving financial aid dollars we can use their data to see that the number of financial aid awards has increased at a rate which exceeds the average amount per award with need-based aid driving much of that growth20
19 See for instance Table 9 of NASSGAPrsquos 1992-93 Annual Survey Report for a list of state financial aid programs their characteristics and the year each was initiated For a discussion of the more recent non-need-based programs see Doyle WR (2006) Adoption of merit-based student grant programs An event history analysis Educational Evaluation and Policy Analysis 28(3) 259-285
20 Itrsquos also important to point out that while the dichotomy of need-based and non-need-based grant aid helps examine trends in state grant aid there are more nuances than that dichotomy allows For instance many financial aid programs award aid on the basis of need and merit These hybrid need-only and merit-only programs represent 36 45 and 19 of all undergraduate financial aid in the most recent data available from NASSGAPrsquos 2017-18 annual report Often a program with any need-based component is classified as need-based in the NASSGAP data
SHEEO INVESTIGATING THE IMPACTS OF STATE HIGHER EDUCATION APPROPRIATIONS AND FINANCIAL AID28
copy 2021 by the State Higher Education Executive Officers Association (SHEEO)
FIGURE 5STATE GRANT AID FOR NEED- AND NON-NEED PROGRAMS (CONSTANT $) US 2001-2019
$0
$2
$4
$6
$8
$10
$12
$142
00
1
20
02
20
03
20
04
20
05
20
06
20
07
20
08
20
09
20
10
20
11
20
12
20
13
20
14
20
15
20
16
20
17
20
18
20
19
DO
LLA
RS
AW
AR
DE
D B
ILLI
ON
S
RECESSION
TOTAL GRANT AID$12 BILLION
NEED-BASED AID$9 BILLION
NON-NEED-BASED AID$3 BILLION
NOTES
1 State grant aid includes all scholarship and grant aid awarded to undergraduate and graduate students including the small portion of aid allocated to non-public institutions
2 Constant dollars adjusted by the Higher Education Cost Adjustment (HECA)
SOURCE National Association of State Student Grant and Aid Programs 2001 through 2018 data pulled from NASSGAPrsquos Annual Survey data query tool 2019 pulled from Table 3 History 2009-2019
STATE TRENDS IN STATE GRANT AID
States vary considerably in how they approach grant or scholarship aid Some invest general fund dollars into large need-based programs while others invest lottery funds into non-need-based programs and others still do not invest in their programs For example Georgia Florida and Tennessee invest heavily in state financial aid primarily through non-need-based aid and those three states make up more than half of the nationrsquos non-need-based total ($17 billion) in 2019 California Texas and New York on the other hand comprise more than 45 ($41 billion) of the $91 billion awarded based primarily on need in 2019
Though the national trends in state grant aid suggest unmitigated growth 12 states experienced decreases in their inflation-adjusted total grant aid from 2001 to 201921 As shown in Figure 6 many of those states were concentrated in the Northeast and Midwest including Illinois Massachusetts and Ohio which have generous financial aid programs but experienced sharp declines Other states like New York and Pennsylvania saw large absolute decreases but had large enough programs that they still operated two of the largest need-based aid programs in 2019 These reductions in grant aid often occur because of reduced investment in need-based grant aid as these programs are often oversubscribed For instance in Illinois they cut their primary need-based aid program due to statewide budget shortfalls (Center for Tax and Budget Accountability 2017)
21 See Appendix A Table 2 for a more complete picture of the trends in grant aid by state
SHEEO INVESTIGATING THE IMPACTS OF STATE HIGHER EDUCATION APPROPRIATIONS AND FINANCIAL AID29
copy 2021 by the State Higher Education Executive Officers Association (SHEEO)
On the other hand 21 states more than doubled the amount of dollars awarded in the form of grants between 2001 and 2019 Some states like Oregon and West Virginia had modestly sized programs in 2001 but increased more than threefold by 2019 Other states like North Dakota Delaware and Idaho experienced some of the largest proportional gains but expended so few dollars in 2001 that they are still in the bottom quintile of dollars awarded in 2019 And some states like Tennessee Texas California and Virginia saw some of the largest absolute and proportional gains in grant aid dollars awarded
FIGURE 6CHANGES IN TOTAL STATE GRANT AID (CONSTANT $) US 2001-2019
597
622
51188
21271
85
78
714
-34 95
-26
-11148
135
-17
-26
19
33
90
-91
106135
30
-8
40
1003
-50
96
206
-22
177
811
469
255
201
153
217
7
-8
51
59
78034
5
43
112
NOTES
1 State grant aid includes all scholarship and grant aid awarded to undergraduate and graduate students including the small portion of aid allocated to non-public institutions
2 Values presented represent the change from 2001 to 2019
3 States without a percentage listed are those that did not have a program in 2001 (eg Wyoming North Dakota)
4 Constant dollars adjusted by the Higher Education Cost Adjustment (HECA)
SOURCE National Association of State Student Grant and Aid Programs 2001 through 2018 data pulled from NASSGAPrsquos Annual Survey data query tool 2019 pulled from Table 3 History 2009-2019
SECTOR-LEVEL TRENDS IN STATE FINANCIAL AID
As with general operating appropriations there are sizable differences in the allocation of state financial aid across sectors Figure 7 22 shows that in inflation-adjusted dollars four-year institutions received almost twice as much grant aid in the first year of our panel (2001) than two-year institutions received in the last year of the panel (2017) It should be noted that the largest
22 To be consistent with the other parts of this report IPEDS Finance Survey data were used for the sector-level comparisons Unfortunately the IPEDS data and NASSGAP data do not perfectly align as there is approximately $1 billion in state grant aid unaccounted for between the two data sources in 2017 That said the trends in state grant aid dollars are similar across both sources and are the focus of this section It is likely that the discrepant dollars are proportionally distributed across the two- and four-year sectors but even if they are not and instead fall entirely within the two-year realm the inferences drawn from the data remain relatively unchanged
SHEEO INVESTIGATING THE IMPACTS OF STATE HIGHER EDUCATION APPROPRIATIONS AND FINANCIAL AID30
copy 2021 by the State Higher Education Executive Officers Association (SHEEO)
grant aid program in the country (not included in Figure 7) the federal Pell Grant is awarded disproportionately to students enrolled in the two-year sector which may at least partially explain why state policy has allowed such a chasm to exist and grow between the two sectors On the other hand many non-need-based aid programs have merit components that are more likely to flow to students in the four-year sector and a non-negligible number of state financial aid programs provide larger grants to students who choose to enroll in a four-year institution It is also important to point out that financial aid programs often have a minimum credit hour requirement or even a prorated award for those students enrolling part time which would also favor students enrolling in the four-year sector
Though a sizable gap between the sectors exists it is important to point out the growth found in the national trends reflected in Figure 7 Across both sectors students are receiving considerably more state grant aid in 2017 than in 2001 even after accounting for inflation Moreover while the total dollars awarded track with the increases in FTE enrollment within the four-year sector it seems that the two-year sector received substantially more state grant aid dollars even after its enrollment declined following the Great Recession
FIGURE 7STATE GRANT AID AND FTE ENROLLMENT AT TWO- AND FOUR-YEAR INSTITUTIONS (CONSTANT $) US 2001-2017
$1
19
$1
34
$1
36
$1
55
$1
55
$1
61
$1
68
$1
78
$1
75
$1
73
$1
86
$1
92
$2
19
$2
18
$2
21
$2
19
$2
33
$4
46
$4
68
$4
81
$5
42
$5
71
$5
94
$6
14
$6
27
$6
82
$7
00
$7
14
$6
65
$7
05
$7
25
$7
19
$7
27
$7
49
0
1
2
3
4
5
6
$B
$1B
$2B
$3B
$4B
$5B
$6B
$7B
$8B
20
01
20
02
20
03
20
04
20
05
20
06
20
07
20
08
20
09
20
10
20
11
20
12
20
13
20
14
20
15
20
16
20
17
20
01
20
02
20
03
20
04
20
05
20
06
20
07
20
08
20
09
20
10
20
11
20
12
20
13
20
14
20
15
20
16
20
17
FTE
EN
RO
LLM
NE
T M
ILLI
ON
S
GR
AN
T A
ID B
ILLI
ON
S
TWO-YEAR FOUR-YEAR
FTE ENROLLMENTSTATE GRANT AID
NOTES
1 Institution type is based on Carnegie classification Baccalaureate and above are considered four-year institutions mixed institutions are classified according to their previous designation and institutions outside of the US or those with a special classification are excluded
2 Estimated 2001 and 2002 12-month FTE using available fall FTE data and 12-month as a proportion of fall FTE for the earliest available year(s)
3 Constant 2017 dollars adjusted by the Higher Education Cost Adjustment (HECA)
SOURCES IPEDS Finance Survey 2001-2017 IPEDS Directory 2001-2017 Carnegie Classifications 2000-2015
SHEEO INVESTIGATING THE IMPACTS OF STATE HIGHER EDUCATION APPROPRIATIONS AND FINANCIAL AID31
copy 2021 by the State Higher Education Executive Officers Association (SHEEO)
COMPARISON OF TRENDS IN STATE GENERAL OPERATING AND GRANT AIDIn this section we examine differences in the trends of general operating appropriations and state financial aid awards to students attending public institutions To make comparisons possible we look at each metric on a per-FTE basis23 It is important to note that for financial aid a change in funding per-FTE is substantially different than a change in total funding or even funding per awardee Increasing allocations could be due to an increase in the proportion of all students receiving awards andor an increase in award size
Figure 8 shows a modified version of Figure 2 from the general operating trends section Here we have added the cumulative percentage change in state financial aid to public institutions following the last two economic recessions Unlike general operating appropriations state aid per FTE increased steadily during and immediately following each recession Increases in state aid per FTE could be due to the introduction of new financial aid programs in states the expansion of existing programs to cover more students or increases in the average student award As a result state financial aid increased from 44 to 99 of all education appropriations between 2001 and 2019
FIGURE 8CHANGE IN STATE GENERAL OPERATING AND GRANT AID PER FTE FOLLOWING ECONOMIC RECESSIONS (CONSTANT $) US 1980-2019
10
3
-11-8
-14-11
2730
-40
-30
-20
-10
0
10
20
30
40
198
0
198
1
198
2
198
3
198
4
198
5
198
6
198
7
198
8
198
9
199
0
199
1
199
2
199
3
199
4
199
5
199
6
199
7
199
8
199
9
20
00
20
01
20
02
20
03
20
04
20
05
20
06
20
07
20
08
20
09
20
10
20
11
20
12
20
13
20
14
20
15
20
16
20
17
20
18
20
19
RECESSION EDUCATION APPROPRIATIONS GENERAL OPERATING STATE FINANCIAL AID
CU
MU
LAT
IVE
PE
RC
EN
T C
HA
NG
E
NOTES
1 Cumulative percentage change calculated since the start of each recession (1980 1990 2001 and 2008)
2 Education appropriations include general operating support and state financial aid to students attending public institutions General operating is the portion of state and local support appropriated directly to public institutions for the purposes of general operations Both measures include Federal American Reinvestment and Recovery Act (ARRA) revenue provided during the Great Recession to stabilize state and local sources of revenue for higher education
3 State public financial aid is the proportion of total state-funded financial aid awarded to students attending public institutions excluding loans
4 Full-time equivalent (FTE) enrollment converts student credit hours to full-time academic year students but excludes medical students
5 Constant dollars adjusted by the Higher Education Cost Adjustment (HECA)
SOURCE State Higher Education Executive Officers Association State Higher Education Finance Data (httpsshefsheeoorg)
State-level trends support the national picture In over half of all states general operating appropriations have decreased while state financial aid allocations have increased since 2001 (on a per-FTE basis after adjusting for inflation) However in 11 states state funding has declined across the board and in another five both general operating and financial aid allocations have increased over time (Figure 9) Only two states show an increase in general operating appropriations and a decrease in financial aid Illinois and New Mexico24
23 Trends and comparisons in this section use SHEF (not NASSGAP) data on financial aid to students attending public institutions
24 The general operating increase in Illinois is due to the statersquos efforts to address its historically underfunded pension system While funding has increased the bulk of that increase has been used for past payments For more information see httpsshefsheeoorg wp-contentuploads202004SHEEO_SHEF_FY18_IB_Illinoispdf
SHEEO INVESTIGATING THE IMPACTS OF STATE HIGHER EDUCATION APPROPRIATIONS AND FINANCIAL AID32
copy 2021 by the State Higher Education Executive Officers Association (SHEEO)
FIGURE 9CHANGE IN STATE GENERAL OPERATING AND GRANT ALLOCATIONS FY 2001-2019 BY STATE
AL
AK
AZ
AR
CA
CO
CT
DE
FL
GA
HIID
IL
IN
IAKS
KY
LA
MEMD
MA
MI
MN
MS
MO
MT
NE
NV
NH
NJ
NM
NY
NC
ND
OH
OKOR
PA
RI
SC
SD
TN
TX
UT
VT
VA
WA
WV
WI
WY
US
$(1000)
$(500)
$-
$500
$1000
$1500
$2000
$(7500) $(5000) $(2500) $- $2500 $5000 $7500
CH
AN
GE
IN F
INA
NC
IAL
AID
PE
R F
TE
CHANGE IN GENERAL OPERATING PER FTE
IncreasingAid
DecreasingOperating
IncreasingOperating
DecreasingOperating
NOTES
1 General operating is the portion of state and local support appropriated directly to public institutions for the purposes of general operations
2 State public financial aid is the proportion of total state-funded financial aid awarded to students attending public institutions excluding loans
3 Full-time equivalent (FTE) enrollment converts student credit hours to full-time academic year students but excludes medical students
4 Constant dollars adjusted by the Higher Education Cost Adjustment (HECA)
SOURCE State Higher Education Executive Officers Association State Higher Education Finance Data (httpsshefsheeoorg)
Despite these opposing trends in 2019 the vast majority of state support was still allocated directly to public institutions through general operating appropriations State financial aid remains a more targeted and smaller investment from states When compared to the national average (which is heavily influenced by larger and more well-funded states like California and New York) in 2019 it was most common for states to have relatively low general operating appropriations and low financial aid allocations (Figure 10) Ten states had low general operating and high aid and another nine had high operating and low aid
SHEEO INVESTIGATING THE IMPACTS OF STATE HIGHER EDUCATION APPROPRIATIONS AND FINANCIAL AID33
copy 2021 by the State Higher Education Executive Officers Association (SHEEO)
FIGURE 10COMPARISON TO US AVERAGE IN STATE GENERAL OPERATING AND GRANT AID ALLOCATIONS FY 2019 BY STATE
AL
AK
AZ
AR
CA
CO
CTDE
FL
GA
HI
ID
IL
IN
IA KS
KY
LA
ME
MD
MA
MI
MN
MS
MO
MT
NE
NV
NH
NJ
NM
NY
NC
ND
OH
OK
ORPA
RI
SC
SD
TN
TXUT
VT
VA
WAWV
WI
WY
US
$-
$500
$1000
$1500
$2000
$2500
$- $2500 $5000 $7500 $10000 $12500 $15000 $17500 $20000
FIN
AN
CIA
L A
ID P
ER
FT
E
GENERAL OPERATING PER FTE
HighOperating
HighAid
LowOperating
LowOperating
NOTES
1 General operating is the portion of state and local support appropriated directly to public institutions for the purposes of general operations
2 State public financial aid is the proportion of total state-funded financial aid awarded to students attending public institutions excluding loans
3 Full-time equivalent (FTE) enrollment converts student credit hours to full-time academic year students but excludes medical students
4 Constant dollars adjusted by the Higher Education Cost Adjustment (HECA)
5 Adjusted to account for interstate differences using the Cost of Living Index (COLI) and Enrollment Mix Index (EMI)
SOURCE State Higher Education Executive Officers Association State Higher Education Finance Data (httpsshefsheeoorg)
It is important to note that state funding is not the only source of revenue for public institutions Institutions also receive substantial funding through tuition and fee revenues (Figure 11) Since 2001 per-student tuition revenue from in-state and out-of-state students has increased enough to more than offset declines in state funding As a result the average US institution has more total revenue in 2019 than in 2001 before funding started to decline However total revenue varies widely by institution type and many of the gains in total revenue have occurred at four-year research universities which have a greater ability to attract students in particular out-of-state students and increase tuition rates (Hillman 2020 Jaquette amp Curs 2015)
SHEEO INVESTIGATING THE IMPACTS OF STATE HIGHER EDUCATION APPROPRIATIONS AND FINANCIAL AID34
copy 2021 by the State Higher Education Executive Officers Association (SHEEO)
FIGURE 11BREAKDOWN OF TOTAL PUBLIC HIGHER EDUCATION REVENUES US FY 2001-2019
$14K$14K
$13K$13K $13K
$14K $14K $14K$13K
$13K $13K $13K$13K
$14K$14K
$15K$15K $15K $15K
$-
$2000
$4000
$6000
$8000
$10000
$12000
$14000
$16000
20
01
20
02
20
03
20
04
20
05
20
06
20
07
20
08
20
09
20
10
20
11
20
12
20
13
20
14
20
15
20
16
20
17
20
18
20
19
STATE GENERAL OPERATING STATE PUBLIC AID LOCAL APPROPRIATIONS NET TUITION REVENUE
TO
TA
L R
EV
EN
UE
S P
ER
FT
E
NOTES
1 Labels at the top of each bar show total education revenue per FTE enrollment at public institutions Total education revenue is the sum of state general operating state financial aid local appropriations and net tuition revenue Net tuition revenue excludes medical tuition but includes federal financial aid and student loans
2 Constant dollars adjusted by the Higher Education Cost Adjustment (HECA)
SOURCE State Higher Education Executive Officers Association State Higher Education Finance Data (httpsshefsheeoorg)
In the next sections we outline our research methodology and then provide a detailed review of the known impacts of general operating appropriations and state financial aid on student outcomes Understanding what researchers have discovered about the impact of these funding strategies can help states and policymakers determine how best to allocate scarce resources
SHEEO INVESTIGATING THE IMPACTS OF STATE HIGHER EDUCATION APPROPRIATIONS AND FINANCIAL AID35
copy 2021 by the State Higher Education Executive Officers Association (SHEEO)
PRIOR LITERATURE ON THE EFFECTS OF STATE APPROPRIATIONS
In this section we describe the most rigorous existing research on the effects of state appropriations First we outline the methodology used to find and select prior research We begin our review with the impacts of state appropriations on institutions from changes in tuition institutional expenditures and research activity Next we turn to a longer discussion of the impacts of state appropriations on student outcomes We examine impacts on student enrollment credential outcomes and additional financial outcomes We also discuss differences across institutional sectors in existing inequities in the allocation of state appropriations
RESEARCH REVIEW METHODS
Studies were collected and reviewed over two phases We conducted an initial search on the topic several years ago which resulted in 40 studies We reviewed these studies using our inclusion criteria described below resulting in six studies that met our inclusion criteria Our second phase occurred during February and March 2020 During this second phase we limited our search to studies that were published in 2010 or later We first reviewed the references of the eight articles from the first phase as well as studies that have cited these articles Next we conducted a targeted author search of the authors of the first eight studies which consisted of reviewing their published work as available on their Google Scholar ResearchGate pages and publicly available CVs Lastly we conducted searches in the ERIC JSTOR and Web of Science electronic databases and reviewed all titles and the abstracts of relevant titles We conducted a search in Google Scholar and reviewed titles and abstracts until we felt confident we had reached the end of relevant articles (15+ pages) These search strategies resulted in an additional 41 studies that we reviewed in detail of which seven met our inclusion criteria
We systematically reviewed the 81 studies that resulted from our two phases of literature searching with a set of inclusion criteria Since we are focused on the relationship between state appropriations and student outcomes we focused on studies that included as their independent variable a change in state appropriations (at the state or institution level) Our inclusion criteria also required studies to meet certain methodological rigor Studies were required to have used one of the following eligible designs randomized control trial regression discontinuity difference-in-differences instrumental variables estimation fixed or random effects or decomposition analysis We delimited the studies in this way in order to get closer to the true causal estimate of how state appropriations affect a series of outcomes Ideally we would employ the same inclusion criteria as the Department of Educationrsquos What Works Clearinghouse25 and include only those studies using an experimental or quasi-experimental design similar to our approach in the subsequent grant aid literature review However due to the nascent nature of the state appropriations literature and the challenges of designing an experimental or quasi-experimental setup that isolates the effect of state appropriations we found no randomized control trial or regression discontinuity studies and only one generalized difference-in-differences study This prompted us to expand the criteria for the state appropriations literature review For context these criteria resulted in 81
25 See httpsiesedgovnceewwcStudyReviewGuide for details on the Department of Educationrsquos What Works Clearinghouse Study Review Guides
SHEEO INVESTIGATING THE IMPACTS OF STATE HIGHER EDUCATION APPROPRIATIONS AND FINANCIAL AID36
copy 2021 by the State Higher Education Executive Officers Association (SHEEO)
state appropriations studies for review compared to the 91 grant aid studies collected (in the subsequent section) using a much more constrained set of criteria (ie experimental and quasi-experimental) See Figure 12 for a flowchart of the review criteria used for the state appropriations literature review including examples of the types of studies that were excluded from review
FIGURE 12FLOWCHART OF REVIEW CRITERIA FOR STATE APPROPRIATIONS LITERATURE REVIEW
designs
Excluded studies thatmiddot Included a change in state appropriations as
the dependent variable
middot Focused on the eects of performance-based
fundingmiddotIncluded as the dependent variable a
breakdown of spending per revenue category
middot Included as the independent variable a change in
institutional resources (eg student-faculty ratio)
Excluded studies with the following researchmiddot Analyses that use regression methods without
fixed or random eects
- Tobit and Probit Models
- Quantile Regression
- Ordinary Least Squares (OLS)
middot Relational methods that do not get at causality
- Event History
- Competing Risks Models
- Maximum Likelihood Models
- Multi-level Growth Models
middot Stochastic Frontier Analysis
middot Descriptive Analysis
Does the study meet one of the following eligible designsmiddot Random Control Trial (RCT)
middot Regression Discontinuity
middot Dierence-in-Dierences
middot Instrumental Variable Estimation
middot Fixed or Random Eects
middot Decomposition Analysis
Is independent variable a change in state appropriations (at the state or institution level)
Review for inclusion in literature review
YES
YES
Review for context only
YES
NO
NO
Was the study published in 2010 or later We made one exception to this rule Zhang (2009) which was collected during our initial collection phase is included in our literature review
SOURCE State Higher Education Executive Officers Association
It is important to note that some of the studies described in this section did not isolate general operating appropriations from total state appropriations In particular studies using Grapevine data on state support after 2010 likely included state financial aid allocations in their analyses26 However state financial aid has historically made up a small portion of total appropriations (less than 10)
26 Illinois State University College of Education (2020) About the Grapevine data Method httpseducationillinoisstateedugrapevineaboutmethodphp
SHEEO INVESTIGATING THE IMPACTS OF STATE HIGHER EDUCATION APPROPRIATIONS AND FINANCIAL AID37
copy 2021 by the State Higher Education Executive Officers Association (SHEEO)
EFFECTS OF STATE APPROPRIATIONS ON INSTITUTIONS
There are two main ways that public institutions respond to declining state appropriationsmdashby raising tuition revenues or by decreasing institutional expenditures Here we review the recent literature related to both mechanisms and include a summary of several studies that examined the relationship between state appropriations and university research activity
CHANGES IN TUITION
Extant research provides evidence that state appropriations are inversely related to tuition prices at four-year institutions Goodman and Volz (2020) use Delta Cost Project data from academic years 2000 to 2010 and a generalized difference-in-differences model to examine the state-level impact of declining state appropriations on in-state tuition They find that at public four-year institutions a 10 reduction in state funding leads to a 11 increase in enrollment-weighted tuition and a 07 increase in sticker price The impact is slightly higher at state flagship institutions where the result of a 10 state funding cut is a 13 increase in sticker price
Using a panel data model with institution and year fixed effects applied to Delta Cost Project data from 1987-2012 Zhao (2018a) adds additional nuance to these findings by estimating the impact of funding cuts on both in- and out-of-state tuition separately by institution type (ie doctoral masterrsquos bachelorrsquos) He uses a number of alternative outcome measures to test the robustness of his results including sticker price average tuition and net tuition and fees per FTE student and finds across all of his definitions that a decline in state appropriations is accompanied by an increase in tuition and fees He finds that public doctoral institutions respond to decreases in state appropriations by increasing tuition for both in-state and out-of-state students but tuition increases at a higher rate for out-of-state students Doctoral institutions do not raise tuition enough to fully make up for the funding lost in the state appropriation cuts but they raise tuition at a higher rate compared to other institution types and flagship institutions increase tuition and fees the most In terms of changes in average tuition for full-time undergraduate students at doctoral institutions a $1 decline in state appropriations per FTE leads to a $016 increase in average tuition and fees for in-state students and a $032 increase for out-of-state students27 Masterrsquos institutions respond to state funding cuts by increasing in-state tuition responding to a $1 decrease in state appropriations per FTE by increasing average in-state tuition by $011 There is some evidence (limited due to small sample size) that bachelorrsquos institutions respond by increasing out-of-state tuition at these institutions a $1 decrease in state appropriations leads to an increase in average out-of-state tuition of $044
Webber (2017) uses an instrumental variables fixed-effects identification strategy to estimate how much of a cut in state appropriations per FTE is passed through to students attending public four-year institutions via higher tuition and fees Using data from 1987-2014 Webber uses the total appropriations at the state level to instrument for appropriations at a specific institution in a given year an approach that accounts for endogenous state budget decisions while also taking into account institution-specific factors28 His model includes institution and year fixed effects and
27 At flagship institutions these numbers were slightly larger with a $1 cut in state appropriations per FTE resulting in an $018 increase in average tuition and fees for in-state students and a $033 increase for out-of-state students
28 Recent work on the public funding of higher education (Bound et al 2019 Chakrabarti et al 2020 Deming amp Walters 2018 Webber 2017) has made use of this shift-share instrumental variables approach first proposed by Bartik (1991) As Chakrabarti et al (2020) point out ldquothis instrument leverages the fact that state-wide changes in appropriations for higher education will have different effects on postsecondary institutions based on their underlying reliance on state fundsrdquo (p 13) All of the aforementioned studies include detailed descriptions of the Bartik instrument within the context of higher education For a more detailed description of its historical use assumptions and limitations see Goldsmith-Pinkham et al (2019)
SHEEO INVESTIGATING THE IMPACTS OF STATE HIGHER EDUCATION APPROPRIATIONS AND FINANCIAL AID38
copy 2021 by the State Higher Education Executive Officers Association (SHEEO)
controls for the existence of state laws that cap tuition increases or implement tuition freezes Since institutions frequently engage in tuition discounting that leads to a unique price paid by each student Webber uses average tuition and fees rather than sticker price as the dependent variable in his model Webber finds that over the time period covered the pass-through rate is 257 meaning that a $1000 reduction in per FTE student state appropriations would result in the average student paying an additional $257 in tuition and fees29 Notably Webber finds that the proportion of state funding cuts borne by students has increased over time The pass-through rate has increased from 103 pre-2000 to 318 post-2000 and 412 in the time since the start of the Great Recession in 2008 Webber suggests that this increase ldquosignals that the low-hanging fruit of spending reduction is considerably diminished (if not exhausted entirely)rdquo (p 3) and that institutions increasingly rely on tuition dollars to replace lost state dollars to avoid having to make spending cuts to their core functions
There are multiple potential mechanisms through which increases in tuition are passed along to students The increased tuition could be distributed evenly across all students wealthier students may absorb a higher proportion of the tuition increases if the increases are accompanied by additional tuition discounting for lower-income students or the institution could shift the makeup of the student population by enrolling more out-of-state and international students who face higher tuition rates (Webber 2017) Although there is limited exploration of these mechanisms in the studies reviewed there is some evidence that doctoral institutions increase tuition for out-of-state students at a higher rate than for in-state students (Zhao 2018a) and that public four-year institutions particularly doctoral institutions respond to declining state appropriations by increasing enrollment of out-of-state students (Jaquette and Curs 2015)
The evidence is mixed on whether changes in state appropriations impact community college tuition While Zhao (2018a) finds no effect of state funding cuts on community college tuition for any of his measures (sticker price average tuition or net tuition and fees) Goodman and Volz (2020) find that a 10 cut in state funding causes a 22 increase in enrollment-weighted community college tuition This difference in findings may be driven by the different time horizons of the two studies Zhao (2018a) examines changes from 1987 to 2012 while Goodman and Volz (2020) focus on 2000 to 2010 If the increase in tuition pass-through rate pre-and post-2000 observed in the four-year sector (Webber 2017) also occurred at the community college level then the significant effects found by Goodman and Volz may be reflective of their analysis focusing on more recent years Another notable difference between the two studies is the methodology employed Goodman and Volzrsquos (2020) generalized difference-in-differences study relies on state-level aggregate data and represents state-level changes in community college tuition prices whereas Zhaorsquos (2018a) panel data model uses institution-level data and institution-fixed effects meaning the overall effect on tuition is calculated from institution-specific estimates
29 The pass-through rate varies among institution types with the highest pass-through rate occurring at doctoral institutions (266) followed by masterrsquos institutions (262) and the lowest at bachelorrsquos institutions (183) Presumably this means that the inverse pattern is occurring by institution type in terms of spending cuts
SHEEO INVESTIGATING THE IMPACTS OF STATE HIGHER EDUCATION APPROPRIATIONS AND FINANCIAL AID39
copy 2021 by the State Higher Education Executive Officers Association (SHEEO)
CHANGES IN INSTITUTIONAL EXPENDITURES
Institutions that are unable to raise tuition and fee revenue to the extent necessary to offset state funding declines respond to cuts by decreasing expenditures30 Looking at the public sector as a whole Goodman and Volz (2020) find that cuts in state appropriations result in decreased spending on student services and academic support but do not impact spending on instruction They find that a 10 decrease in appropriations at public institutions leads to a 14 decrease in per-FTE academic support spending and a 15 decrease in per-FTE student services spending Deming and Walters (2018) find that when institutions respond to changes in state appropriations by adjusting their spending they make changes across all three spending categories Across all public institutions a 10 increase in state appropriations increases instructional spending by 97 academic support spending by 172 and student services spending by 104 The extent to which institutions rely on making spending cuts as well as the types of cuts made varies between institution types with community colleges experiencing the largest impacts across almost all expenditure areas compared to public four-year institutions (Zhao 2018a)
Zhao (2018a) finds that across institution types declines in state appropriations negatively affect almost all expenditure categories with the largest impact on education and related expenditures which refers to spending on direct educational costs including instruction academic support and student services The effect of a $1 decline in state appropriations ranges from a $049 average decrease in education and related expenditures at public doctoral institutions up to a $102 decrease at associatersquos institutions31 Doctoral and masterrsquos institutions both experience a decline in public service expenditures with a $1 decrease in state appropriations associated with a 07 and 04 decrease in public service expenditures respectively Doctoral institutions also experience a significant hit to their research expenditures reducing their spending in this area by $010 for every $1 decrease in state appropriations
In her dissertation Frye (2015) finds complementary evidence that institutions respond to declining state funding by making changes to the composition of their academic workforce Using a two-way fixed effects regression model applied to IPEDS data from 1994-2013 she finds that as states have cut funding for higher education public institutions have decreased the number of tenure track faculty employed and increased their employment of contingent faculty Goodman and Volz (2020) find no significant changes in the number of full- or part-time faculty at public institutions resulting from cuts in state appropriations but they find an inverse relationship between state funding shocks and the proportion of public institution faculty employed part time They report that a 10 decrease in state appropriations is associated with a 23 percentage point increase in the fraction of part-time public school faculty
30 When state appropriations decline institutions respond to the loss in total revenue by increasing alternative revenue sources (such as tuition revenue) or by decreasing total expenditures Reductions in state support may lead to reductions in institutional spending which impacts student outcomes Total revenue is not held constant in such studies We focus our paper specifically on the unique and independent role that state appropriations play in advancing important outcomes because determining state appropriations is one of the primary finance tools held by state higher education governing policy and coordinating boards
31 One way this cut manifests is in the instructional faculty to student ratio and a state appropriation per FTE student decrease of one standard deviation leads to a decrease in instructional faculty per 100 FTE students of 070 for associatersquos institutions 036 for masterrsquos institutions and 042 for doctoral institutions One standard deviation of state appropriations is $2962 for associatersquos institutions $2881 for masterrsquos institutions and $5338 for doctoral institutions These numbers vary slightly from the standard deviations reported below for the degree completion outcomes because a larger set of institutions was used in the degree completion calculations
SHEEO INVESTIGATING THE IMPACTS OF STATE HIGHER EDUCATION APPROPRIATIONS AND FINANCIAL AID40
copy 2021 by the State Higher Education Executive Officers Association (SHEEO)
CHANGES IN RESEARCH ACTIVITY
Although less tied to student outcomes declines in state funding may also impact research activity at public research universities Zhao (2018b) Husted and Kenny (2018) and Bound et al (2019) provide additional evidence that cuts in state appropriations lead to declines in research productivity at public research universities Using data from the Delta Cost Project and the US Patent and Trademark Office and both a panel data fixed effects model and two different instrumental variables models Zhao (2018b) operationalizes research output as the number of patent applications filed by an institution in a given year that are eventually approved by the US Patent and Trademark Office He finds that one additional approved patent application results from an additional $13 million to $42 million in state appropriations (results vary based on model used) Husted and Kenny (2018) limit their analysis to the 152 public institutions that have steady research output in economics measured as those institutions that had faculty publish in a top-50 economics journal throughout the analysis period Using an instrumental variables method and data from IPEDS and the National Institutes of Health (NIH) they measure four different research outputs number and value of NIH grants awarded to the university number of publications by economists in the university and whether the university was in the top 120 universities obtaining federal revenues Using an instrumental variable approach that acknowledges the possibility that state appropriations to individual universities and research outputs may be determined jointly and that isolates the impact of appropriations the authors find a positive relationship between state appropriations and research productivity An increase in state appropriations of one standard deviation ($3827) increases the probability of being in the top 120 universities getting money from the federal government by 69 percentage points a 145-page increase in the number of pages published in a top-50 economics journal a $198 million increase in the value of NIH grants awarded and an increase of 62 in the number of NIH grants received Bound et al (2019) find no statistically significant effect of changes in state appropriations on number of patents granted for their full sample of public research universities but do find an effect for public research universities that are members of the American Association of Universities (AAU) generally considered the most research-intensive institutions A 10 cut in state appropriations at AAU public universities reduces the number of patents awarded by 84
The studies reviewed in this section discuss the two main mechanisms changes in tuition revenues and institutional spending through which changes in state appropriations may affect student enrollment and completion outcomes Changes in tuition revenues may manifest as changes in the price that students must pay to attend college or as a shift in institutional priorities toward enrolling more high-paying students (eg out-of-state students higher-income students) The studies discussed in the next section explore the relationship between changes in state appropriations and student outcomes with some of the studies further examining the role that these mechanisms play in this relationship
EFFECTS OF STATE APPROPRIATIONS ON STUDENT OUTCOMES
IMPACTS ON ENROLLMENTS
Trostel (2012) uses over twenty years of SHEF and IPEDS data (1985-2006) to examine the impact of changes in state and local appropriations per recent high school graduate on FTE enrollment in public postsecondary institutions He uses a two-stage instrumental variables approach with fixed effects which accounts for the potentially endogenous relationship between predicted college enrollment and state appropriations Using state- and local-government tax revenues
SHEEO INVESTIGATING THE IMPACTS OF STATE HIGHER EDUCATION APPROPRIATIONS AND FINANCIAL AID41
copy 2021 by the State Higher Education Executive Officers Association (SHEEO)
as an instrument he finds a positive relationship between state appropriations and in-state enrollment A $1000 increase in state funding per recent high school graduate is associated with a 55 percentage point increase in public postsecondary enrollment per potential college student (based on the number of high school graduates in the previous four years)
Goodman and Volz (2020) examine how changes over time in state and local appropriations and state and local grants and contracts have affected overall enrollment at the state level as well as within individual sectors (ie public for-profit private nonprofit) Cuts to state appropriations do not change overall postsecondary enrollment across all three sectors instead they lead to students enrolling in the for-profit sector when they would have likely enrolled in a public college A 10 drop in appropriations (the approximate decline during the studyrsquos time frame) leads to a 3 decrease in enrollments at public colleges a 2 increase in for-profit enrollments and no change in enrollments at private nonprofits Evidence from other studies suggest less favorable labor market outcomes for students who graduate from for-profit institutions compared to community colleges such as lower earnings (Cellini amp Chaudhary 2014) and being viewed less favorably by employers (Deming et al 2016) making this shift in enrollments from the nonprofit to the for-profit sector a concerning trend
Unlike the previous two studies in which the authors examine changes in state appropriations at the state level Deming and Walters (2018) study the relationship between state funding and enrollments at the institutional level The authors use SHEEO Grapevine data on state appropriations and IPEDS enrollment data both from 1990-2013 to create a budget shock measure that interacts each institutionrsquos historical reliance on state appropriations (based on 1990 levels) with their yearly state appropriations per college-aged individuals in the state (age 19-23) Using an instrumental variables approach with this budget shock instrument accounts for the fact that a certain percentage cut in higher education appropriations at the state level will have differential impacts on individual institutions since institutions vary in their reliance on state funding Deming and Walters (2018) find that a budget increase has a positive impact on enrollments in the current and subsequent years The authors use data on institutional expenditures and tuition caps and freezes to explore whether the effect of state appropriations on enrollments is driven by changes in spending or tuition and find evidence of the former A 10 increase in total institutional spending in a given year leads to a 33 increase in current year total fall enrollment and an 8-85 increase in total fall enrollment in each of the subsequent three years32
Using instrumental variables estimation with institution and year fixed effects on IPEDS data Bound et al (2019) provide additional evidence that cuts in state appropriations lead to a decrease in in-state undergraduate enrollment at public four-year institutions The authors instrument for institutional appropriations using overall state appropriations and estimate separately the effects for research and non-research public universities They find that a 10 drop in appropriations at research universities leads to a 17 decrease in overall in-state undergraduate enrollment and a 10 drop in appropriations at non-research universities reduces in-state undergraduate enrollment by 15 There were no statistically significant effects on first-year enrollment at either institution type though they were similar in magnitude and direction
32 These findings are driven by two-year institutions where a 10 increase in institutional spending leads to a 95-10 increase in total fall enrollment in each of the subsequent three years (although no change in current year fall enrollment) A 10 increase in total institutional spending at four-year institutions leads to a 24 increase in current year fall enrollments and a 47 66 and 57 increase in years t+1 through t+3 respectively
SHEEO INVESTIGATING THE IMPACTS OF STATE HIGHER EDUCATION APPROPRIATIONS AND FINANCIAL AID42
copy 2021 by the State Higher Education Executive Officers Association (SHEEO)
A key mission of public postsecondary institutions is to educate residents of the state However empirical studies have shown that declining state appropriations can lead public institutions to stray from this part of their mission and seek out student populations who contribute high levels of tuition revenue that can replace some of this lost funding Using IPEDS data and a two-way fixed effects panel model which compares changes within institutions over time while accounting for time-varying trends that affect all institutions (eg the Recession) Jaquette and Curs (2015) explore the relationship between state appropriations and nonresident freshman enrollment at all US public baccalaureate granting institutions between the 2003 and 2013 academic years The authors find that as state appropriations increase nonresident freshmen enrollment decreases with this relationship strongest at research universities The authors find no relationship between state appropriations and changes in resident enrollment However other research by the authors (Jaquette et al 2016) finds that growth in the share of nonresident students at public research universities is associated with a decreasing share of low-income and underrepresented minority students with this relationship strongest at the most prestigious universities These results provide evidence that state disinvestment in public higher education may induce institutions to shift their focus away from serving underrepresented students toward students with the ability to pay the most tuition
Although Jaquette and Curs (2015) find that research universities are the most likely public universities to adopt an out-of-state student enrollment strategy to replace lost funds from decreasing state appropriations other types of public universities may be adopting different strategies Jaquette (2019) explores one such strategy the increasing enrollment of masterrsquos students who typically pay out of pocket for their tuition (unlike doctoral students) and face higher tuition than in undergraduate programs Jaquette (2019) focuses on public masterrsquos universities those that award masterrsquos degrees but few doctorates and explores the relationship between state appropriations and growth in masterrsquos student enrollment Using fixed effects panel models on data spanning the 1993 to 2015 academic years Jaquette finds a positive relationship between state appropriations and masterrsquos student enrollment largely driven by a strong positive relationship in the 1990s that dropped off in the 2000s Unlike the negative relationship between state appropriations and out-of-state student enrollment increases in state appropriations were associated with growth in graduate enrollment
IMPACTS ON GRADUATION RATES AND COMPLETIONS
The research overwhelmingly finds evidence that cutting state appropriations leads to detrimental credential outcomes both in graduation rates and the quantity of credentials awarded The vast majority of studies reviewed in this section use institution-level data from IPEDS and state-level data from SHEEO to estimate the relationship between state appropriations and either graduation rates or degree completions Graduation rates represent the proportion of full-time students in a given entering cohort who complete their credential in a certain time frame (typically 100 or 150 time) The graduation rate measure found in IPEDS excludes students who began part time or transferred into an institution Further it considers students who transfer institutions prior to completing their credential to be non-completers regardless of whether these students go on to earn a credential at a different institution than where they began The other predominant metric used in this section completions measures the total number of students or total number of credentials earned in a given time period Although this measure is inclusive of credentials earned by all students at a given institution (eg part-time and transfer students) it is not informative about the proportion of students who finished their credential Although neither measure provides a perfect estimate of the effect that changes in state appropriations have on students
SHEEO INVESTIGATING THE IMPACTS OF STATE HIGHER EDUCATION APPROPRIATIONS AND FINANCIAL AID43
copy 2021 by the State Higher Education Executive Officers Association (SHEEO)
successfully completing their degree the clear takeaway from the extant literature is that cutting state appropriations leads to unfavorable degree outcomes (possibly due to declining institutional spending discussed above)
GRADUATION RATES
Zhang (2009) examines the effects of changes in state funding on six-year (150 time) graduation rates at public four-year institutions also focusing on a pre-Recession time period (1992-1999) Using panel data fixed effects models which allows him to analyze changes within institutions over time while controlling for a number of potentially confounding variables Zhang estimates the overall effects for all institutions as well as separate effects by institution type (ie researchdoctoral masterrsquos liberal arts) and by level of funding (eg increase in funding decrease in funding) When other factors are held constant a 10 increase in state appropriations per FTE student at a four-year public institution is associated with approximately a 064 percentage point increase in graduation rates Zhang separately estimated the effect of a 10 change in state funding on institutions that experienced an increase in state appropriations from the first to second half of his study period and those that experienced a decrease in funding Zhang finds that increases in state funding have a larger impact on graduation rates than state funding cuts A 10 increase in state funding per FTE is associated with a 75 percentage point increase in graduation rates while a 10 decrease in state funding is associated with a 56 percentage point decrease in graduation rates33
COMPLETIONS
Using the budget shock instrument discussed above Deming and Walters (2018) find that an increase in state appropriations to an institution has no impact on the total number of credentials awarded (certificates and degrees) in that year but has a positive effect on total awards in subsequent years A 10 increase in institutional spending increased credentials awarded at community colleges by 145 and BA attainment at four-year institutions by 4534 Just as with the effect on enrollments the authors find that the effect of state appropriation changes on total awards is driven by changes in spending rather than changes in tuition
Bound et al (2019) provide additional evidence that cuts in state appropriations negatively impact degree attainment separately estimating the effects for research and non-research public universities on number of bachelorrsquos degrees masterrsquos degrees and doctorates awarded Among public research universities a 10 decrease in state appropriations per FTE leads to a 36 drop in bachelorrsquos degree attainment and a 72 decrease in PhD attainment35 There are no statistically significant changes in degree attainment at non-research universities as a result of changes in state funding
Zhao (2018a) provides further evidence that cuts in state appropriations are associated with a decrease in degree completion at public institutions and explores variation among institution types
33 Zhang examines the heterogeneity in results between institution types and finds that a 10 increase in state funding per FTE is associated with approximately a 1 percentage point increase in graduation rates at researchdoctoral institutions At masterrsquos institutions the estimated effect is approximately half as large The estimated effect for state funding at liberal arts institutions is of similar magnitude to masterrsquos institutions although it is not statistically significant
34 At community colleges a 10 increase in institutional spending increased awards by 145 in year t+1 and 146 in year t+2 At four-year institutions a 10 increase in institutional spending in year t caused BA attainment to increase by 46 in year t+2 and 45 in year t+3
35 This effect is strongest for STEM graduate degrees with a 10 decrease in appropriations resulting in a 5 decrease in STEM masterrsquos degrees and a 102 decrease in STEM PhDs
SHEEO INVESTIGATING THE IMPACTS OF STATE HIGHER EDUCATION APPROPRIATIONS AND FINANCIAL AID44
copy 2021 by the State Higher Education Executive Officers Association (SHEEO)
He estimates the impacts using a panel data model with institution and year fixed effects run on data from 1987 to 2012 Since different types of institutions (ie doctoral institutions masterrsquos institutions bachelorrsquos institutions and community colleges) vary in their ability to respond to cuts in state funding with increased tuition and fees andor increased enrollment of out-of-state students Zhao calculates the estimation equation separately by institution type This allows the coefficients of each explanatory variable to vary between institution type and enables a better understanding of how cuts in state appropriations differentially impact different types of institutions At doctoral institutions a one standard deviation decrease in state appropriations per FTE ($5338) led to a 007 and 043 per 100 FTE students reduction in doctoral and masterrsquos degrees awarded respectively There is no statistically significant effect on undergraduate degree production which the author notes may be due to doctoral institutions responding to state cuts by shifting resources away from graduate students to protect undergraduate education At masterrsquos institutions a one standard deviation decrease in state appropriations per FTE student ($2811) reduced bachelorrsquos degree productivity by 044 per 100 FTE students and did not statistically impact graduate degree productivity Although the coefficients for the impact of a one standard deviation decrease in appropriations per FTE at bachelorrsquos institutions ($3178) were similar to those for masterrsquos institutions these results were not statistically significant Community colleges faced the most detrimental impact in their degree productivity with a one standard deviation decrease in state appropriations per FTE student ($2962) resulting in a 168 per 100 FTE students reduction in associate degrees conferred Doctoral institutions and to a lesser degree masterrsquos institutions respond to lost state appropriations with a combination of tuition increases and spending cuts Community colleges are unable to increase their tuition and instead the bulk of the impact of state appropriation cuts is in the form of decreased education expenditures Zhao posits that this disproportionate impact on education expenditures concentrated most heavily in instructional spending is why community college degree production is hit hardest by an equivalent decrease in state funding cuts per FTE
Using a similar approach as Deming and Walters (2018) Chakrabarti et al (2020) estimate the effect of a change in state appropriations while a student is enrolled in college on degree completion and transfer behavior Chakrabarti et al use data from the New York Federal Consumer Credit Panel (CCP) which includes individual-level consumer credit records from a 5 random sample of US individuals with credit To this student-level financial data the authors merge individual student-level postsecondary education records from the National Student Clearinghouse and institutional-level IPEDS data The authors use a shift-share instrument approach in order to mitigate the introduction of bias caused by the correlation of an institutionrsquos share of state appropriations and institutional qualitystudent characteristics The measure interacts the historical share of an institutionrsquos revenue coming from state appropriations (based on 1986) with the total state appropriations in the year when a student was enrolled in their second year of college The authors find that for students who first enrolled at a four-year institution experiencing a $1000 per FTE increase in state appropriations while enrolled increases the likelihood of earning a bachelorrsquos degree by age 25 by 15 percentage points but has no effect on the likelihood of earning a bachelorrsquos degree by age 30 suggestive that increases in state appropriations help shorten time to degree Among students who started at a two-year college each $1000 increase in state appropriations while enrolled increases the likelihood of transferring to a four-year institution by age 30 by 31 percentage points Similar to the results for four-year enrollees a $1000 increase in state appropriations increases the likelihood of earning a bachelorrsquos degree by age 25 by 39 percentage points but has no statistically significant effect on likelihood of completing a bachelorrsquos degree by age 30 In their exploration into the mechanisms at play Chakrabarti et al find evidence that four-year institutions respond to increases in state appropriations by decreasing tuition but do not alter their institutional spending on instruction student services or academic support The authors find that two-year institutions respond to increases in state appropriations with price and quality responses both decreasing tuition and increasing institutional spending
SHEEO INVESTIGATING THE IMPACTS OF STATE HIGHER EDUCATION APPROPRIATIONS AND FINANCIAL AID45
copy 2021 by the State Higher Education Executive Officers Association (SHEEO)
STATEWIDE DEGREE ATTAINMENT
Trostel (2012) introduced in the enrollment section uses SHEF and IPEDS state-level data from 1985 through 2006 to measure the impact of changes in state support for higher education on degree attainment The results of his two-stage instrumental variables model show that a $1000 increase in state funding per recent high school graduate is associated with a 32 percentage point increase in degree attainment defined as the percentage of the state population aged 35-64 with a bachelorrsquos degree He examines the relative effects of a change in state support and a change in tuition and finds that the effect of state and local appropriations on degree attainment is larger than that of a change in college price
EFFECTS OF STATE APPROPRIATIONS ON ADDITIONAL FINANCIAL OUTCOMES
Several studies examined the effect of changes in state appropriations on outcomes that impact students beyond the time they leave postsecondary education Chakrabarti et al (2020) studied the long-run financial and credit outcomes of state appropriation shocks while students are enrolled in college The authors predominantly focus on outcomes for 25-30 and 30-35-year-olds separately based on whether a student first enrolled at a two- or four-year institution For certain outcomes the authors separately examine outcomes for 22 25 30 and 35-year-olds Chakrabarti et al find that among students who first enrolled at a four-year institution experiencing a $1000 increase in state appropriations while enrolled decreased the probability of ever originating a student loan by approximately 2 percentage points across all age groups (although the result was not statistically significant for 35-year-olds) and decreased the total amount of loans borrowed with results ranging from a $640 reduction by age 22 and a $5363 reduction by age 35 Among four-year students experiencing a positive state appropriation shock during college had little effect on other long-run financial outcomes measured such as credit score presence and amount of auto loan presence and amount of home loan and average adjusted gross income (AGI) of current neighborhood For students who first enrolled at a two-year school experiencing a $1000 increase in state appropriations while enrolled decreased the likelihood of ever originating a student loan with estimates ranging from 14 to 61 percentage points among the various age groups State appropriation increases had little statistically significant effect on total amount borrowed but considerably decreased the likelihood of default or delinquency In contrast to the findings for four-year enrollees experiencing an increase in state appropriations while enrolled had a positive effect on the long-run financial outcomes of individuals who first enrolled at a two-year college with many of the effects stronger among the older cohort For these students experiencing an increase in state appropriations while enrolled led to an increased likelihood of having an auto loan a lower likelihood of having delinquent car debt an increased credit score and an increased AGI by zip code of residence
Goodman and Volz (2020) provide some additional evidence that cuts to state appropriations lead to an increase in student borrowing although their results represent changes in state-level student borrowing They find that between academic years 2000-2010 a 10 cut in state appropriations led to a 69 increase in student borrowing at public and for-profit institutions This increase was driven by a growth in enrollments in the for-profit sector (a sector with higher borrowing behavior) as well as increases in net tuition paid at public institutions
SHEEO INVESTIGATING THE IMPACTS OF STATE HIGHER EDUCATION APPROPRIATIONS AND FINANCIAL AID46
copy 2021 by the State Higher Education Executive Officers Association (SHEEO)
For an overview of the findings presented in this section please see Table 2 For a more detailed examination of each study see Public Investment in Higher Education Research Strategies and Policy Implications project page36
TABLE 2 SUMMARY OF STATE APPROPRIATIONS LITERATURE REVIEW
EFFECTS OF DECREASES IN STATE APPROPRIATIONS ON INSTITUTIONS
Public institutions respond to declines in state appropriations in two main ways (1) raising tuition revenues and (2) decreasing institutional expenditures
CHANGES IN TUITION CHANGES IN INSTITUTIONAL EXPENDITURES
middot State appropriations are inversely related to tuition rates
at public four-year institutions
middot Institutions that are unable to raise tuition and fees to the extent
needed to offset state funding cuts respond to cuts
in state appropriations by decreasing expenditures
middot Institutions raise tuition revenue by increasing out-of-state
and international enrollments
middot The largest impact is on education and related expenditures
(instruction academic support and student services)
middot This strategy of raising alternative revenues is most prevalent
at doctoral institutions (especially state flagships) followed
by masterrsquos and bachelorrsquos institutions
middot This response is most prevalent at two-year institutions
and least common at doctoral institutions
middot The evidence is mixed on whether two-year colleges respond
to cuts by increasing tuition
EFFECTS OF DECREASES IN STATE APPROPRIATIONS ON STUDENT OUTCOMES
Through the mechanisms of changes in tuition and institutional expenditures cuts in state appropriations have a negative impact on student enrollment and graduation ratescompletion outcomes
STUDENT ENROLLMENT GRADUATION RATES AND COMPLETIONS
middot Decrease of in-state undergraduate enrollment with these
effects lasting several years
middot A decrease in degrees and certificates awarded at two-
and four-year institutions
middot Enrollment is not impacted equally across all sectors
students move from the public to for-profit sector
middot A decrease in graduation rates at four-year colleges
with the largest impact at researchdoctoral institutions
middot Some public four-year institutions (predominantly research
universities) respond to state appropriations cuts by increasing
their enrollment of out-of-state undergraduate students
middot A decrease in statewide bachelorrsquos degree attainment
SOURCE State Higher Education Executive Officers Association
HETEROGENEITY IN OUTCOMES
The research presented here suggests that changes in state appropriations have substantial impacts on institutional and student outcomes at the national level However conducting analyses at the national level masks the wide variation between states in funding levels and the extent to which public institutions depend on state funding The findings described here may vary across individual states given their different funding contexts both with the level of state funding on a per-student basis and the proportion of institutional revenues that come from the state
36 httpssheeoorgprojectpublic-investment-in-higher-education-research-strategies-and-policy-implications
SHEEO INVESTIGATING THE IMPACTS OF STATE HIGHER EDUCATION APPROPRIATIONS AND FINANCIAL AID47
copy 2021 by the State Higher Education Executive Officers Association (SHEEO)
Within individual states there is wide variation in funding trends and contexts Likewise several articles in this section provide evidence that institutional responses to cuts in state funding differ between institution types Community colleges respond by adjusting institutional expenditures including spending on core functions such as instruction academic support and student services (Chakrabarti et al 2020 Zhao 2018a) Although expenditures at public four-year institutions are also impacted by shifts in state funding (Deming amp Walters 2018 Zhao 2018a) these institutions have far greater ability to replace lost state dollars in part through tuition increases (Webber 2017 Zhao 2018a) Public doctoral institutions respond to declines in state funding with the largest increases in tuition followed by masterrsquos institutions and to a lesser extent bachelorrsquos institutions Further as referenced before Jaquette and Curs (2015) find that research universities are the most likely public universities to adopt an out-of-state student enrollment strategy to replace lost funds from decreasing state appropriations
There is also heterogeneity between institution types in the impact of changes in state funding on student outcomes Decreases in state appropriations are most detrimental to credential completion at community colleges (Deming and Walters 2018 Zhao 2018a) However the literature is mixed on the effect among types of public four-year institutions Zhao (2018a) finds that a decline in state appropriations leads to a decrease in bachelorrsquos degree completion at masterrsquos institutions but has no statistically significant effect on undergraduate degree completion at doctoral or bachelorrsquos institutions Meanwhile Bound et al (2019) find the opposite Cuts in state funding lead to a decrease in bachelorrsquos degree completion at public research universities but have no effect on degree production at non-research public four-year colleges
The studies reviewed in this section discuss the impact of a given percentage change in state funding but there are vast discrepancies between institution types in the amount of per-student state funding received In the next section we review the evidence on disparities in public funding across institution types
INEQUALITIES BUILT INTO THE CURRENT FUNDING SYSTEM
Much of what we know about inequalities built into the current state funding system for higher education comes from descriptive analyses As previously discussed the distribution of state and local funding to public institutions differs by level with four-year institutions receiving considerably more funding but with a stronger recovery of public funding at two-year institutions having occurred following the Great Recession In most states four-year doctoral research-extensive institutions receive the most funding while four-year doctoral masterrsquos and baccalaureate institutions receive less While associate-granting institutions were the lowest funded in 2001 funding at non-research four-year institutions has declined enough over time that their current state and local funding levels are comparable on a per-FTE basis (Figure 13)
SHEEO INVESTIGATING THE IMPACTS OF STATE HIGHER EDUCATION APPROPRIATIONS AND FINANCIAL AID48
copy 2021 by the State Higher Education Executive Officers Association (SHEEO)
FIGURE 13STATE AND LOCAL APPROPRIATIONS PER FTE AT PUBLIC INSTITUTIONS BY CARNEGIE CLASSIFICATION (CONSTANT $) US 2001-2017
$0
$2000
$4000
$6000
$8000
$10000
$12000
$14000
$160002
00
1
20
02
20
03
20
04
20
05
20
06
20
07
20
08
20
09
20
10
20
11
20
12
20
13
20
14
20
15
20
16
20
17
FUN
DIN
G P
ER
FT
E
RECESSION ASSOCIATES BACCALAUREATE DOCTORAL RESEARCH DOCTORAL MASTERS
NOTES
1 State and local appropriations include funding for non-credit medical agriculture and research State-funded financial aid is not included Due to the structure of IPEDS finance data any grants or contracts allocated to public institutions for general operating could not be included
2 Institutions with special or mixed Carnegie classifications are excluded The doctoral research classification refers only to the highest research activity institutions
3 Estimated 2001 and 2002 12-month FTE using available fall FTE data and 12-month as a proportion of fall FTE for the earliest available year(s)
4 Constant 2017 dollars adjusted by the Higher Education Cost Adjustment (HECA)
SOURCES IPEDS Finance Survey 2001-2017 IPEDS Directory 2001-2017 Carnegie Classifications 2000 2005 2010 2015
The differences in state funding are exacerbated because four-year research institutions also have the greatest ability to increase alternative revenues for example by raising tuition rates (Ehrenberg 2006) and attracting more out-of-state students (Bound et al 2019 Jaquette amp Curs 2015) With both higher state appropriations and higher funding from other sources four-year research institutions have substantially more revenue available to spend on student instruction and are less likely to reduce expenditures when faced with state funding declines (Mugglestone et al 2019) As discussed in the previous sections additional spending and revenue have been shown to improve student outcomes on a number of measures
Inequalities across institution types are particularly concerning because of the demographics of students who attend in each sector Students of color attending public institutions are overrepresented at community colleges and less-selective institutions and these institutions tend to have fewer resources due to a combination of low state support and an inability to increase alternative revenues (Ahlman (2019) From 2006 through 2016 underrepresented students of color (defined as American IndianAlaska Native Black Latinx and Native Hawaiian or Other Pacific Islander) made up an increasing proportion of enrollment at all public institutions but were disproportionately likely to attend community collegesmdashthe public colleges with the fewest
SHEEO INVESTIGATING THE IMPACTS OF STATE HIGHER EDUCATION APPROPRIATIONS AND FINANCIAL AID49
copy 2021 by the State Higher Education Executive Officers Association (SHEEO)
resources In 2016 community colleges served over half of underrepresented public college students of color Doctoral universities which typically have the most resources disproportionately educate the most advantaged (full-time white affluent) students (Mugglestone et al 2019) These patterns suggest that institutional funding may not only be unequal but inequitable as well as states increase the existing advantages of affluent white students and provide the most resources to institutions that need them the least (thanks to their ability to raise alternative revenues)
Ahlman (2019) finds that during and following the Great Recession changes in core revenues increased inequities in core revenues across institution types Although state funding per student increased slightly at community colleges during this time period while declining at other public institutions Ahlman (2019) found that in 2016 community colleges still received $2900 less per student in state funding than doctoral institutions In addition community colleges must remain affordable and therefore receive much less tuition revenue than four-year institutions and in 2016 community colleges had about two-thirds of the total core revenue of public baccalaureate and masterrsquos institutions and only 37 of the total core revenue at public doctoral institutions Taken together this information leads to an important conclusion States provide differential levels of support to different groups of college students (Long 2016) and these trends exacerbate existing inequities (Ahlman 2019)
In addition changes in how funding is distributed can have differential impacts across institution types When Colorado adopted a voucher model for higher education funding in 2004 which effectively rerouted state appropriations from institutions to students there were negative impacts for underrepresented students At both two- and four-year public institutions fewer Hispanic students enrolled than prior to the funding model change fewer Black students enrolled in four-year public institutions and fewer low-income students enrolled in two-year institutions (Hillman et al 2014)
RECOMMENDATIONS
Research on the impacts of state appropriations is moderately well developed but in some cases conflicting results point to the need for future research Nevertheless the studies reviewed here present important evidence regarding the impacts of funding decisions made by states Such findings lead to several important recommendations for state policymakers and higher education leaders
First much of the research on state appropriations has focused on the impacts of declining appropriations on public institutions Over time institutions have increased tuition revenues and decreased expenditures in response to declining per-student state appropriations (Deming amp Walters 2018 Goodman amp Volz 2020 Webber 2017 Zhao 2018a) Declining appropriations and the resulting impact on institutional expenditures lead to tangible differences in student outcomes
bull Recommendation 1 for states Decreases in state appropriations lead to cuts in institutional spending on services that are essential for student success (eg instruction academic support student services) Since public four-year institutions particularly research universities have a wider range of alternative revenue sources (eg increasing tuition increasing enrollment of out-of-state students) and are less reliant on state appropriations regional institutions and community colleges experience the most detrimental cuts to institutional expenditures as a result of declining state appropriations (Zhao 2018a)
SHEEO INVESTIGATING THE IMPACTS OF STATE HIGHER EDUCATION APPROPRIATIONS AND FINANCIAL AID50
copy 2021 by the State Higher Education Executive Officers Association (SHEEO)
States should consider all institutional revenues and make strategic decisions regarding state appropriations in concert with decisions about tuition rates and out-of-state tuition caps
Next state funding has important impacts on enrollment and completion that must be considered Appropriation declines lead to increases in out-of-state enrollment and constrict access to in-state students particularly at public flagship institutions (Bound et al 2019 Jaquette amp Curs 2015) while funding increases are positively related to student enrollment (Deming amp Walters 2018 Jaquette 2019 Trostel 2012) Further evidence suggests that funding declines change enrollment patterns as students shift from public to private for-profit institutions (Goodman amp Volz 2020)
Changes in state appropriations have also been shown to impact graduation rates the number of credentials awarded and statewide degree attainment Declines in state appropriations lead to reductions in these measures (Bound et al 2019 Zhang 2009 Zhao 2018a) while increases have a positive effect (Chakrabarti et al 2020 Deming amp Walters 2018 Trostel 2012 Zhang 2009) In order to put these findings in context we use the point estimates from several studies in this section (Bound et al 2019 Deming amp Walters 2018 Zhao 2018a) to simulate the potential impacts that a $1000 decrease would have on todayrsquos completions These simulations found on page 61 make clear the detrimental impacts that cutting direct funding to institutions has on subsequent student completion outcomes
bull Recommendation 2 for states Direct state support to institutions has positive impacts on enrollment and completion outcomes As states continue to work toward statewide attainment goals they are unlikely to meet these goals without increased investment in their institutions Although most states are facing increasingly tight budgets in response to the coronavirus pandemic states should increase investments in their public postsecondary institutions as possible
However the effects of state appropriations on institutions and students differ by sector and by an institutionrsquos reliance on state support (Deming amp Walters 2018 Zhao 2018a) These differences exacerbate existing inequalities in state appropriations because the institutions with lower per-student appropriations are also those that struggle to increase alternative revenues in response to declining state support (Mugglestone et al 2019)
bull Recommendation 3 for states There is large variation between institution types in baseline amounts of state appropriations received institutional responses to changes in state appropriations and the effects of these changes Public two-year institutions and open-access four-year institutions which serve the bulk of underrepresented students receive the lowest amount of funding and experience the most adverse effects of funding cuts These institutions are also often the most reliant on state funding and therefore would be disproportionately impacted by across-the-board state funding cuts States should take stock of whether current funding disparities between institution types represent inequitable funding patterns through a state funding equity audit and adjust funding accordingly
SHEEO INVESTIGATING THE IMPACTS OF STATE HIGHER EDUCATION APPROPRIATIONS AND FINANCIAL AID51
copy 2021 by the State Higher Education Executive Officers Association (SHEEO)
Additional research is needed to continue informing the policymaking process surrounding state operating support to public institutions We offer the following suggestions for researchers in the field
bull Recommendation 1 for researchers The bulk of the literature on state appropriations uses aggregate data at the institution level but the field would benefit from research conducted using student-level data This will allow for the estimation of how effects differ by student subgroup including how the effects of shifts in state appropriations differ by raceethnicity and income level Chakrabarti et al (2020) utilize individual-level data from the New York Federal Consumer Credit Panel but administrative data at the student level from state data systems are also a viable data source for this level of analysis The literature on the impacts of changes in state higher education funding has become increasingly rigorous most notably with the use of a shift-share instrumental variables approach utilized by several sets of authors in this section (Bound et al 2019 Chakrabarti et al 2020 Deming amp Walters 2018 Webber 2017)
bull Recommendation 2 for researchers The field should continue to move toward more causal research designs that isolate the effect of state appropriations In addition researchers should be sure to consider the effects of tuition on student outcomes37 and should carefully consider the meaning of the standardizing metrics they use (such as per-FTE per-student or per-capita)
Embedded in much of the current literature on state appropriations is an assumption that the effect of a change in state appropriations is linear however it is likely that the given increase or decrease will have differential impacts on a state with low versus high funding levels Further states vary considerably in their level of state funding per student tuition price and tuition-setting processes and composition of postsecondary institutions and students all of which contribute to the role that state funding plays in student success
bull Recommendation 3 for researchers Gaining a more nuanced understanding of the effects of changes in state appropriations for whom in which states and institutions and at what funding levels would allow for a more intentional and targeted investment of state dollars Similarly further analysis of the heterogeneous effects of changes in state appropriations on institutions with varying reliance on state funding would help answer important questions about disparate impacts
In the next section we turn to a review of the literature on the impacts of federal and state financial aid allocations Unlike general operating appropriations financial aid is awarded directly to students (rather than institutions) and has the potential to target particular populations more directly The financial aid literature is also more well-developed than the appropriations literature allowing a more nuanced analysis of previous findings
37 Researchers will need to do so carefully as tuition is endogenous in this setting which is why it is not used in Toutkoushian amp Hillman (2012) and other studies The shift-share approach (Bound et al 2019 Chakrabarti et al 2020 Deming amp Walters 2018 Webber 2017) mentioned in footnote 27 helps mitigate this concern
SHEEO INVESTIGATING THE IMPACTS OF STATE HIGHER EDUCATION APPROPRIATIONS AND FINANCIAL AID52
copy 2021 by the State Higher Education Executive Officers Association (SHEEO)
PRIOR LITERATURE ON THE EFFECTS OF GRANT AID
The literature quantifying the effects of grant aid on student outcomes has grown considerably in recent decades and is more developed than research on state appropriations Significant advancements in econometric techniques coupled with higher quality and larger quantities of administrative data have allowed researchers to more credibly identify the causal effects of these programs improving upon the financial aid research from the 1980s and 1990s (Alon 2005 Cellini 2008) So many of these studies have been written that other researchers have already provided a service to the field by summarizing their results often concluding that reducing the price of college through grant aid leads to higher rates of college enrollment persistence and completion among other outcomes (Deming amp Dynarski 2010 Dynarski amp Scott-Clayton 2013 Herbaut amp Geven 2020 Nguyen et al 2019 Page amp Scott-Clayton 2016) Thus this review of the literature will instead focus on reconciling some of the outstanding discrepancies between recent studies in the hopes of advancing the fieldrsquos understanding of the impact of grant aid We will focus our review on the impacts of state grant aid programs and include evaluations of federal grant aid programs local promise programs and philanthropically funded programs when we believe they provide important context
This section is organized as follows After first outlining our research review methods we discuss the effects of grant aid on enrollment overall for in-state and out-of-state students and by institutional sector and control Next we turn to the impacts of receiving or losing a state grant on persistence We then discuss the impacts of grant aid on college completion and post-college outcomes We end this literature review with several recommendations for policy-focused researchers and state policymakers
RESEARCH REVIEW METHODS
Though the review to follow is not exhaustive in scope a number of studies not cited were collected and reviewed In a similar fashion to the review of the appropriations literature we began with a foundational group of studies that had been collected independently by each author Due to the maturity of the financial aid literature we limited this collection to only those studies that utilized a quasi-experimental38 or experimental research design and were published within the last decade This initial collection effort resulted in 32 studies Next we used the works cited lists from these studies and the summary articles mentioned above (Deming amp Dynarski 2010 Dynarski amp Scott-Clayton 2013 Herbaut amp Geven 2020 Nguyen et al 2019 Page amp Scott-Clayton 2016) to find additional studies that met our research design standards and were published since 2000 This search effort resulted in an additional 59 studies to be reviewed We systematically reviewed the 91 studies collected and include summary information about each in a searchable and sortable online appendix39
38 For our purposes these research designs include regression discontinuity difference-in-differences and instrumental variables though we include some foundational studies from the literature that attempt to capture the longitudinal effects of financial aid through event history modeling and other related methods to provide important context
39 httpssheeoorgprojectpublic-investment-in-higher-education-research-strategies-and-policy-implications
SHEEO INVESTIGATING THE IMPACTS OF STATE HIGHER EDUCATION APPROPRIATIONS AND FINANCIAL AID53
copy 2021 by the State Higher Education Executive Officers Association (SHEEO)
FIGURE 14FLOWCHART OF REVIEW CRITERIA FOR FINANCIAL AID LITERATURE REVIEW
Excluded studies with the following research designsmiddot Analyses that solely rely upon fixed eects
middot Relational methods that do not get at causality
- Event History
- Competing Risks Models
- Maximum Likelihood Models
- Multi-Level Growth Models
middot Descriptive Analysis
middot Propensity score matching andor weighting
Does the study meet one of the following eligible designsmiddot Random Control Trial (RCT)
middot Regression Discontinuity
middot Dierence-in-Dierences
middot Instrumental Variable Estimation
Was the study published in 2000 or later Earlier studies are provided for historical context
Review for inclusion in literature review
Review for context only
YES
YES
NO
SOURCE State Higher Education Executive Officers Association
EFFECTS OF GRANT AID ON COLLEGE ENROLLMENT
OVERALL
The earliest studies examining the impact of grant aid on overall college enrollment often focused on the largest program then and today the Pell Grant and found null or even negative effects (Hansen 1983 Manski amp Wise 1983) In trying to explain the null effects of federal aid to that point McPherson and Schapiro (1991) provide a host of reasons including the confounding effects of the military draft for Vietnam on male enrollment the meager college wage premium that characterized the decade the two-period research design Hansen (1983) employs and finally they suggest that the increased targeting of financial aid to middle- and upper-income students in the 1970s may have attenuated the effects of the program on low-income students In their frequently cited review of the price response literature Leslie and Brinkman (1987) argue that the growth in low-income enrollment would not have kept pace with its higher-income counterparts if it were not for the Pell Grant In revisiting these studies and the data they employed Kane (1995) posits that the postsecondary marketplace at the time may have lacked the capacity to serve the influx of students the Pell Grant attempted to bring into higher education thus shutting out many low-income recent high school graduates40
Those who have followed the financial aid literature will find this scholarly debate all too familiar Thirty-to-forty years later researchers are still studying the impact of the Pell Grant on college access and are still concluding that it does not increase overall college-going (Carruthers amp Welch
40 It may be the case that the growth in state need-based aid programs brought about by the State Student Incentive Grant program may have confounded some of these results as well
SHEEO INVESTIGATING THE IMPACTS OF STATE HIGHER EDUCATION APPROPRIATIONS AND FINANCIAL AID54
copy 2021 by the State Higher Education Executive Officers Association (SHEEO)
2019 Eng amp Matsudaira 2020 Marx amp Turner 2018) though it may have an impact on which type of college a student enrolls in (Denning et al 2019)41 Many have attributed these findings to the complexity of the financial aid application process42 including the onerous Free Application for Federal Student Aid (FAFSA) and its income verification process (Dynarski amp Scott-Clayton 2013) Others have argued that these federal dollars may be captured by institutions in their awarding of grant aid and thus not realize their full purchasing power (Turner 2017) Finally there are those who rightly point out that the Pell Grant program is not well advertised prior to or even after a student completes her FAFSA (Carruthers amp Welch 2019)43
Early research on state grant aid on the other hand focused on newly implemented merit aid programs and found significant overall enrollment effects using aggregated data from national sources like the Current Population Survey (CPS) and the Integrated Postsecondary Education Data System (IPEDS) These studies mostly found sizable increases in college-going amongst recent high school graduates by comparing states with programs to those without (Abraham amp Clark 2006 Cornwell et al 2006 Dynarski 2000 Dynarski 2004)44 More recent research often relying upon state administrative data and regression discontinuity (RD) research designs complicates these earlier findings as they suggest state grant aid has no discernable impact on overall college-going (Bettinger et al 2019 Bruce amp Carruthers 2014 Gurantz amp Odle 2020) Both sets of studies are well-identified and use research designs that vastly improve upon earlier work however one need only look at the descriptive statistics in the more recent RD studies to understand why they conclude these state programs do not increase college-going For instance in their evaluation of the Cal Grant Bettinger et al (2019) report that the control mean college-going rate around both the GPA and income eligibility cutoffs exceeded 80 Bruce and Carruthers (2014) report similarly large college-going rates around their ACT threshold and Gurantz and Odle (2020) report rates exceeding 90 In each instance in order to implement the RD the authors had to delimit their samples in significant ways often conditioning the high school graduate sample to include only those students who submitted a financial aid application or those who took a standardized test In each instance the authors report college-going rates that exceed the unconditional college-going rate in their respective states by at least 20 percentage points On the other hand the earlier studies using publicly available data examined college enrollment in the aggregate for the state irrespective of application status or test-taking status leveraging cross-state variation through a difference-in-differences (DD) research design resulting in distinctly different samples than the RD studies Additionally if the programs themselves increased the number of students completing financial aid applications or taking the standardized tests used to condition the samples then the RD studies may not capture all of the effects of the programs on initial enrollment
41 One exception is Seftor amp Turner (2002) They astutely point out that by 1999 more than half of the federal dollars spent on the Pell Grant program were spent on students classified as independent for the purposes of financial aid and that these students were not the focus of prior research Using data from the Current Population Survey and a difference-in-differences research design they find that the Pell Grant program increased enrollment for adult men and women by 13pp (16) and 15pp (40) respectively Notably they find even larger gains for adults when the population is limited to high school graduates
42 Evidence-based changes to the financial aid application process were just passed as part of the Consolidated Appropriations Act of 2021 These changes will take effect no later than the 2023-24 academic year and include a significant reduction in the number of questions on the FAFSA a change in awarding terminology from Expected Family Contribution to Student Aid Index and simplified eligibility requirements for the Pell Grant For more information see httpstheconversationcomfederal-financial-aid-for-college-will-be-easier-to-apply-for-and-a-bit-more-generous-152785
43 Dynarski (2003) investigates another federal program the Social Security Student Benefit program which was quite generous both in the size of the award and in the scope of the program and finds that the effect on overall college enrollment for recent high school graduates was approximately 36 percentage points for each $1000 received Importantly individuals were contacted directly by the federal government to notify them of their eligibility
44 For an instructive conceptual overview of where researchers may go looking for identifying variation to quantify the impacts of grant aid see Bettinger (2004)
SHEEO INVESTIGATING THE IMPACTS OF STATE HIGHER EDUCATION APPROPRIATIONS AND FINANCIAL AID55
copy 2021 by the State Higher Education Executive Officers Association (SHEEO)
As mentioned above early studies on the effects of state merit aid suggested increases in overall college enrollment for recent high school graduates however later research suggests that these effects may not be as large as first interpreted (Dynarski 2004 Dynarski 2008) The CPS and decennial Census data used in these studies are not necessarily well suited to answer questions about college enrollment though insights may still be had45 No data source nor study for that matter is going to be able to answer all research questions related to a given policy but more recent evidence suggests that state merit aid programs may have had more of an impact on where students enrolled rather than their likelihood of enrolling at all
The recent proliferation of local and state-level college promise programs has led to a number of rigorous studies estimating their effects on college enrollment among other outcomes aligned with the ostensible purposes of these programs Research on the Tennessee Promise program (and its more localized predecessor) suggests that promise programs can have a substantial impact on initial college enrollment (Carruthers amp Fox 2016 Nguyen 2020) even though the last-dollar nature of the award means that the low-income students induced to enroll are being paid through federal and state need-based aid that was available to them before Tennessee Promise was implemented making the program far more affordable than other financial aid initiatives from the statersquos perspective Evaluating a similar statewide effort in Oregon Gurantz (2019) finds that the program did little to move the overall college-going rate in its first year but that college-going increased substantially in year two of the program Rigorous evaluations of local promise programs are not quite as definitive but point toward an increase in overall college-going especially for those students historically underserved (Bartik et al 2020 Gaacutendara amp Li 2020 Page et al 2019)
IN-STATE VS OUT-OF-STATE
One of the primary purposes of state broad-based merit grant aid programs is to keep the highest achieving high school graduates in state for their postsecondary pursuits The preponderance of evidence on this issue suggests that state merit aid programs are successful in inducing students to stay in their home state for college (Cornwell et al 2006 Fitzpatrick amp Jones 2016 Sjoquist amp Winters 2016 Zhang et al 2013 Zhang amp Ness 2010) Importantly however studies using state administrative data from Tennessee and Florida do not find impacts of state merit aid on in-state enrollment (Bruce amp Carruthers 2014 Gurantz amp Odle 2020) In reconciling these discrepant findings one could look to the standardized test score eligibility cutoffs The cutoff exploited in Tennessee (Bruce amp Carruthers 2014) is a composite score of 21 on the ACT exam which is right around the national average for test takers Perhaps students with higher ACT scores and more out-of-state postsecondary opportunities were affected by the merit aid program but the research design employed in this study cannot tell us much about that group of students The same phenomenon may be occurring in Florida around the SAT scores for the lower scholarship threshold (ie 970980 which is near the national average) though it is somewhat surprising that no effect is found around the higher SAT cutoff score of 1270 which is firmly in the top quintile of national SAT scores (Gurantz amp Odle 2020) More research is certainly needed to understand the few discrepancies that exist across studies but as stated the evidence on this research question strongly suggests that state merit aid has been successful in diverting many students to enroll in their home states
45 For an in-depth discussion of the data limitations that characterize these early studies see Dynarski (2004)
SHEEO INVESTIGATING THE IMPACTS OF STATE HIGHER EDUCATION APPROPRIATIONS AND FINANCIAL AID56
copy 2021 by the State Higher Education Executive Officers Association (SHEEO)
SECTOR AND CONTROL
The evidence on grant aid affecting where someone enrolls extends beyond the in-state and out-of-state margin to the sector and control of institutions attended The evidence in this area is also convincing as the vast majority of studies regardless of identification strategy and data source suggest grant aid often moves students from two-year institutions into four-year institutions when aid is available in both especially academically marginal and low-income students (Angrist et al 2020 Bartik et al 2020 Bruce amp Carruthers 2014 Cornwell et al 2006 Dynarski 2004 Page et al 2019a Toutkoushian et al 2015 Zhang et al 2013) Moreover when grant aid is limited to public institutions in the state we also see a pretty sizable shift in enrollment to those in-state institutions (Andrews et al 2010 Cohodes amp Goodman 2014 Goodman 2008) At the same time when aid is limited to specific sectors in a given state therersquos evidence to suggest that students will enroll in those institutions as well (Carruthers amp Fox 2016 Cohodes amp Goodman 2014 Gurantz 2019b Nguyen 2020) Interestingly when state aid is transportable to private and public institutions therersquos some evidence to suggest that students may attend the higher cost institution (Bettinger et al 2019 Gurantz 2019a)
EFFECTS OF GRANT AID ON COLLEGE PERSISTENCE
GRANT AID RECEIPT
As states intermediary organizations and policymakers began shifting their focus from college access to college completion researchers started following suit The earliest rigorous studies on college persistence were predominantly focused on addressing the endogeneity of aid receipt in their modeling strategies and research designs (Alon 2005 Bettinger 2004) As data systems have grown and become more longitudinal more recent research has treated persistence as a mechanism on the way to quantifying degree completion and time-to-degree (Anderson 2020 Anderson et al 2019 Andrews et al 2020 Angrist et al 2020 Bartik et al 2019 Castleman amp Long 2016)
In reviewing the most rigorous recent evidence it seems apparent that receiving student grant aid strongly impacts student persistence (Anderson 2020 Angrist et al 2020 Bartik et al 2019 Bettinger 2015 Castleman amp Long 2016 Page et al 2019a Page et al 2019b Scott-Clayton 2011) though these findings are not consistent across all contexts including perhaps the two-year sector (Anderson amp Goldrick-Rab 2018 Carruthers amp Welch 2020 Welch 2014)
GRANT AID LOSS
State merit aid programs not only have high school achievement requirements on the front end they also include academic benchmarks to maintain the aid once the student is enrolled in college These benchmarks are almost always higher than the benchmarks used for federal financial aid and the vast majority of state need-based grant aid programs This benchmark is known as Satisfactory Academic Progress (SAP) and includes college GPA and credit accumulation requirements established at the campus level Evaluations of these performance-based benchmarks are much less common than studies evaluating the impact of receiving grant aid though itrsquos reasonable to assume that the effects of receipt versus loss differ
SHEEO INVESTIGATING THE IMPACTS OF STATE HIGHER EDUCATION APPROPRIATIONS AND FINANCIAL AID57
copy 2021 by the State Higher Education Executive Officers Association (SHEEO)
Scott-Clayton and Schudde (2020) provide some of the most compelling evidence on the loss of grant aid to date In short they find that amongst community college students receiving federal financial aid missing the SAP benchmark increases performance in the short term but leads to a drastic reduction in student success over a longer time horizon Moreover the effects of the financial aid policy are distributed quite inequitably with those students in the lowest income group being most adversely affected The overall findings are consistent with an earlier study of theirs examining the impact of SAP on a different unnamed community college system (2016) Finally Carruthers and Oumlzek (2016) find that losing merit aid in Tennessee reduces persistence from the first to second year
EFFECTS OF GRANT AID ON COLLEGE COMPLETION
In their recently published meta-analytic review of this literature Nguyen et al (2019) state ldquohellipgenerally our findings support continued or increased investments in grant aid by demonstrating grant aid does increase persistence and completion even after conditioning on college enrollmentrdquo (p 865) They estimate that for every $1000 dollars of grant aid degree completion increases approximately 25 percentage points46 The average effect is large but it does mask some heterogeneity across program designs and aims
Though early studies suggested merit aid increased enrollment for many of the state broad-based programs (Cornwell et al 2006 Dynarski 2000 Dynarski 2004) follow-up studies aiming to quantify the downstream effects of those increased enrollments on completions suggest no such effects exist (Fitzpatrick amp Jones 2016 Sjoquist amp Winters 2015 Sjoquist amp Winters 2012) These studies used publicly available data and cross-state variation to quantify the effects of merit aid More recent regression discontinuity evidence also suggests that these state merit programs do not move the needle on completion (Gurantz amp Odle 2020) and in some cases may reduce a studentrsquos likelihood of success (Cohodes amp Goodman 2014) A notable exception on the merit aid front is Scott-Claytonrsquos (2011) evaluation of West Virginiarsquos program however
Recent evaluations of hybrid need-based and merit-based aid programs in California and Nebraska necessarily complicate our notions of merit Angrist et al (2020) evaluate a philanthropically funded grant aid program in Nebraska where participants must earn at least a 25 high school GPA and fall below an income cap that ranges from $80000 to $100000 (Page amp Scott-Clayton 2016) to gain access to a generous financial aid package Some may consider this a broad-based merit aid program with means testing Because the aid was randomly assigned the authors do not have to worry about exploiting a discontinuity in either of the program requirements and find that the program has significant effects on degree completion primarily driven by low-income and underrepresented racial groups Similarly Bettinger et al (2019) exploit a GPA cutoff in the Cal Grant merit aid program to find that the program had substantial impacts on degree completion Importantly the students around this GPA eligibility cutoff came primarily from lower income backgrounds than the students they evaluated around the income cap Within the context of the Cal Grant it seems the program had more of an impact on degree completion for the lower income students around the GPA cutoff
46 Nguyen et al (2020) rightly point out that scaling the effect of grant aid to $1000 regardless of program size assumes a linearity in the effect of grant aid that may not exist Dynarski (2000) makes a similar point though she emphasizes that the non-linearity may exist at the low or high end of aid stating ldquoIn the presence of liquidity constraints a threshold amount of aid may be needed to affect behavior leading a large grant to have a larger per-dollar effect than a small grant It is also plausible that the marginal effect of aid falls as aid risesrdquo (p 285)
SHEEO INVESTIGATING THE IMPACTS OF STATE HIGHER EDUCATION APPROPRIATIONS AND FINANCIAL AID58
copy 2021 by the State Higher Education Executive Officers Association (SHEEO)
Other evaluations of need-based aid in Wisconsin and Florida have shown significant effects and returns on investment for their respective states (Anderson 2020 Castleman amp Long 2016) Philanthropically funded programs aimed at low-income students also seem to impact degree completion (Page et al 2019b) On the other hand recent evaluations of a need-based grant aid program aimed at Pell Grant recipients in Wisconsin did not seem to meaningfully impact college completion (Anderson amp Goldrick-Rab 2018 Anderson et al 2019) Finally while most evaluations of the Pell Grant yield null effects two recent studies suggest the program impacts college completion (Denning 2019 Denning et al 2019) Notably Denning et al (2019) leverage the threshold for families to automatically be categorized in the highest financial need group rather than the Expected Family Contribution threshold that others have used (Marx amp Turner 2018) Students and families under this threshold are not required to complete the entire FAFSA so perhaps their estimated effects are not only capturing the effects of the Pell Grant but also a reduction in the complexity often associated with applying for financial aid (Bettinger et al 2012)
EFFECTS OF GRANT AID ON POST-COLLEGIATE OUTCOMES
Early studies examining the effects of grant aid on post-collegiate outcomes primarily focused on where students in states with merit aid programs resided after college (Fitzpatrick amp Jones 2016 Sjoquist amp Winters 2013 Sjoquist amp Winters 2014) In spite of evidence suggesting that college students stayed in state after graduation (Groen 2004) each of these studies finds little to no evidence to support the claim that merit aid programs are retaining college attendees or graduates in their workforce More research in this area is needed but the evidence to date suggests that merit aid programs may not be accomplishing one of their primary goals
Advancements in data access linkages and quality have only recently allowed researchers to examine additional post-collegiate outcomes related to the receipt of grant aid Bettinger et al (2019) as well as Denning et al (2019) find significant returns to the Cal and Pell Grants with estimates suggesting grant recipients in both programs went on to earn an additional 4-5 annually Though they do not have access to income data Scott-Clayton and Zafar (2019) find that grant recipients from West Virginia live in more expensive neighborhoods and are significantly more likely to be homeowners Finally Bettinger et al (2019) and Scott-Clayton and Zafar (2019) present evidence to suggest that receiving state grant aid as an undergraduate increases graduate school degree attainment between 3-4 percentage points over relatively short time horizons
For an overview of the findings presented in this section please see Table 3
SHEEO INVESTIGATING THE IMPACTS OF STATE HIGHER EDUCATION APPROPRIATIONS AND FINANCIAL AID59
copy 2021 by the State Higher Education Executive Officers Association (SHEEO)
TABLE 3 SUMMARY OF STUDENT GRANT AID LITERATURE REVIEW
EFFECTS OF FINANCIAL AID ON COLLEGE ENROLLMENT
The effects of student grant aid on overall college enrollment are mixed Programs that offer support services in addition to financial awards are more consistently successful Student grant aid often causes marginal
students to attend more expensive institutions and institutions where theyrsquore eligible to receive aid
OVERALL COLLEGE-GOING TYPE OF INSTITUTION
middot Therersquos little evidence to suggest the federal Pell Grant the
largest student grant aid program has a consistent effect
on college-going
middot Evidence consistently suggests that student grant aid
programs successfully induce where students enroll
rather than just if they enroll
middot Grant aid programs with advising and mentoring components
are more successful in causing students to enroll in college
middot Merit- and need-based grant aid cause students to enroll
in more expensive institutions (eg four-year vs two-year)
middot Student grant aid with easy application processes simple
eligibility requirements and marketing efforts are the most
successful in inducing students to enroll
middot The preponderance of evidence suggests that state merit
aid programs successfully retain students in their home state
for college but further research is needed
EFFECTS OF FINANCIAL AID ON COLLEGE PERSISTENCE amp COMPLETION
The evidence on the effects of grant aid on college persistence and completion is much more convincing than the evidence on enrollment with most studies suggesting aid causes students to persist and graduate
at higher rates than their non-aided peers
PERSISTENCE COMPLETION
middot Receiving student grant aid causes students to remain
in college
middot Meta-analytic evidence suggests that $1000 in student
grant aid increases the probability of completion by 25
percentage points
middot Little is known about the heterogeneous effects
of grant aid on student persistence
middot Those students with the most financial need are the
most likely to benefit from student grant aid
middot Grant aid programs that invest in the program beyond
just the money given to students (eg mentors intensive
advising etc) are the programs which have been the
most successful
SOURCE State Higher Education Executive Officers Association
RECOMMENDATIONS
If nothing else it is readily apparent that the number and quality of studies evaluating the impact of grant aid have grown considerably in recent decades Researchers have done an admirable job of accomplishing the historically difficult task of producing causal estimates quantifying the effects of grant aid Moving forward what can states learn from this literature to make the most of their scarce grant dollars
bull Recommendation 1 for states Money matters Most studies reviewed point toward additional dollars influencing student behavior Moreover the dollars invested in grant aid programs likely have a large return on investment for state and federal governments
bull Recommendation 2 for states There is currently a trade-off between targeting funds at those who would be most influenced by additional aid dollars (eg low-income students) and the messaging of simple eligibility requirements (eg state and local promise programs) It may behoove states who are able to fully or mostly fund their need-based financial aid to invest resources in marketing the program to students who have traditionally been unaware of state and even federal aid In fact research by Gurantz (2018) suggests these types of initiatives for targeted aid can be successful
SHEEO INVESTIGATING THE IMPACTS OF STATE HIGHER EDUCATION APPROPRIATIONS AND FINANCIAL AID60
copy 2021 by the State Higher Education Executive Officers Association (SHEEO)
bull Recommendation 3 for states The programs that are most successful invest in aid dollars as well as in support for students For instance in Tennessee their free college program does convey a simple message to their citizens but they also provide support for students considering college through governmental agencies as well as with significant support from philanthropic organizations The Dell Scholars program invests significant time and money in their students (Page et al 2019b) as does the Susan Thompson Buffett Foundation in Nebraska (Angrist et al 2020)
And what can researchers do to inform the policymaking process at the federal and state levels
bull Recommendation 1 for researchers Estimate heterogeneous effects by student subgroups whenever possible Therersquos much to be learned about how financial aid affects students across the ability spectrum at all income levels by racialethnic group and even by the timing of applications Understanding these more nuanced effects may not only help with determining mechanisms but it may also help the research and policy communities reconcile disparate findings and discover more efficient ways to target public dollars
bull Recommendation 2 for researchers Though it is not always possible it must be seen as paramount to include financial aid from all sources or at least from sources other than the program being evaluated A number of recent studies show that understanding how these aid programs interact is necessary to evaluating their true effects (Denning et al 2019 Evans amp Nguyen 2019 Marx amp Turner 2018)
bull Recommendation 3 for researchers Advancements in causal identification are laudable but at times policymakers are interested in students who do not show up near an eligibility threshold within a regression discontinuity research design Efforts to include estimates that include as many policy-relevant parameters are paramount The Scott-Clayton and Schudde (2020) evaluation of the SAP threshold is a great example of this approach
These recommendations are only a starting point but provide important direction for states looking to make key decisions regarding limited financial aid dollars The suggestions for researchers are intended to improve the usability of research in policymaking and provide the most relevant robust and accurate findings States must also do their part in collaborating with researchers by ensuring that the necessary data are accessible Additionally as states decide where to invest additional dollars it may behoove agency staff and policymakers to consider the relative impacts of state appropriations and more targeted financial aid programs
SHEEO INVESTIGATING THE IMPACTS OF STATE HIGHER EDUCATION APPROPRIATIONS AND FINANCIAL AID61
copy 2021 by the State Higher Education Executive Officers Association (SHEEO)
SIMULATED IMPACTS OF STATE APPROPRIATIONS AND FINANCIAL AID
Thus far our review of extant research has considered state appropriations and financial aid separately However these funding sources likely work together to improve student outcomes and in reality states must consider the relative impacts of each funding strategy and make decisions regarding both appropriations and grant aid in concert In this section we unite the literature reviewed in the previous two sections and simulate the impacts of increased general operating appropriations (often conceptualized as increased institutional resources or spending) and the impacts of state-funded student financial aid programs
EXISTING COMPARISONS AND NEW SIMULATIONS
To generate reasonably valid figures for each funding source we use estimates generated from some of the more methodologically rigorous studies reviewed in this paper to simulate impacts on todayrsquos enrollment and completions These simulations are at best a thought exercise intended to provide context and real numbers for the findings discussed in our literature review Our specifications and data are not the same as the authors of these studies and are hypothetical Additionally simulations between state appropriations and financial aid should not be directly compared for several reasons First studies on the effects of appropriations tend to use institution-level data while the strongest studies on the effects of financial aid use student-level data Second financial aid does not equally apply to all students and has redistributive and varying effects across student populations not seen with state appropriations where all students are impacted With these caveats outlined we now turn to prior studies that have conducted similar simulations
Most recently using a student-level College Board and National Student Clearinghouse dataset on enrollment and degree completion Avery et al (2019) simulated policy levers to raise bachelorrsquos degree completions Like our approach the authors used prior research to determine elasticities and quantify the effects of each policy Students were assigned a probability of graduating given their sector and demographic characteristics Under each policy scenario a studentrsquos probability of graduating (and the overall degree attainment rate) changes due to changes in graduation likelihood within the sector and the probability that a student attended a two- or four-year institution which also impacts their graduation rate Avery et al (2019) found that reducing tuition at four-year public colleges and increasing funding for four-year public institutions (which leads to increased spending) each had larger effects on bachelorrsquos degree completions than free community college and eliminating undermatching
In the Avery et al (2019) simulation reducing tuition by 10 at all four-year public institutions led to a 12 percentage point increase in enrollment and a 03 percentage point increase in bachelorrsquos degree attainment The cost was estimated at $270000 per additional bachelorrsquos degree Entirely eliminating tuition and fees for students from families making up to $60000 corresponded to a 31 percentage point increase in enrollment in the sector and a 29 percentage point increase in bachelorrsquos degree attainment (for families making less than $40000) with a cost of $114000 per additional bachelorrsquos degree On the other hand increasing state funding to reduce the inequality in institutional spending between private and public four-year institutions yielded a 07 percentage point increase in enrollment in the four-year public sector and a net 11 percentage point increase in bachelorrsquos degree completion The estimated cost was $121000 per additional bachelorrsquos
SHEEO INVESTIGATING THE IMPACTS OF STATE HIGHER EDUCATION APPROPRIATIONS AND FINANCIAL AID62
copy 2021 by the State Higher Education Executive Officers Association (SHEEO)
degree The findings did not allow for direct comparisons across policies because the authors did not simulate a particular level of state investment Instead each policy had a different estimated cost per student However both tuition and fee cuts and increases in state appropriations to increase institutional spending had all-around positive effects across groups and sectors
On the enrollment side Toutkoushian and Hillman (2012) examined whether appropriations need-based grants or merit-based grants were most effective at increasing enrollment rates Using a difference-in-differences approach and a mix of IPEDS NASSGAP and Grapevine data on state support for all states from 1988 to 2008 the authors found that increasing both appropriations and merit-based grants was associated with increased college-going rates but increases in merit-based aid had a much larger effect However they found no effect from the change in need-based grants on college-going rates Toutkoushian and Hillman (2012) note that many large need-based aid programs began prior to the start of their dataset and that any gains due to such programs may have occurred prior to their analysis period Overall this study supports the idea that broad-based merit aid programs may be particularly well suited to increasing college enrollment rates and points to the need for future research to likewise examine the relative impacts of increased investment in need-based grants merit-based grants and general operating appropriations separately
In another study Toutkoushian and Shafiq (2009) created several estimates of student price sensitivity and used those estimates to simulate the effects of need-based aid and appropriations on college enrollment rates The authors argued that it is more financially efficient and in statesrsquo best interests to focus on aid rather than appropriations because holding the total amount of state funding constant but replacing general operating appropriations with financial aid for students from low-income families increases the likelihood of low-income student enrollment and does not decrease the likelihood of other student enrollment
However as the authors discussed appropriations have the potential to be a much more stable (and less political) source of funding and allow colleges the discretion to use their funding to meet state and institutional goals rather than focusing specifically on attracting students and their tuition dollars Funding exclusively to student financial aid would not help institutions meet statesrsquo workforce economic development and civic needs (Toutkoushian amp Shafiq 2009)
SIMULATION 1 WHAT IS GAINED BY INVESTING IN HIGHER EDUCATION THROUGH
OPERATING SUPPORT
Using the statistically significant results found in three studies reviewed in the state appropriations literature review section (Bound et al 2019 Deming amp Walters 2018 Zhao 2018a) we conduct a series of simulations that predict the impact that a $1000 per FTE change in state appropriations will have on degree outcomes Since we are not able to discern from the studies which states are driving the observed effects we run the simulations at the US level estimating what the effect would be of an across-the-board change in state appropriations These simulations use the point estimates found in each paper as well as the lower and upper bound based on a 95 confidence interval
For enrollment and completion data we use IPEDS data from the 2018-19 academic year the most recent data available SHEEO SHEF data are used for state funding levels Average US state appropriations in 2019 were $8196 per FTE A $1000 increase (decrease) in state appropriations would represent a 122 increase (decrease) in state appropriations
SHEEO INVESTIGATING THE IMPACTS OF STATE HIGHER EDUCATION APPROPRIATIONS AND FINANCIAL AID63
copy 2021 by the State Higher Education Executive Officers Association (SHEEO)
Based on the details available in each of the studies we assume a consistent effect in all states and estimate an across-the-board $1000 per FTE change in state appropriations on overall outcomes at the US level However we know that the reality of state appropriations is much more nuanced States have vastly different levels of state funding and this funding is often unequally distributed to different types of institutions within each state Therefore we consider the results of the following three simulations to be a thought exercise about the approximate positive effects that future investments in state funding will likely have on degree completion and attainment rather than rigorous calculations of the effects of changes in state funding
SIMULATION 1A DEMING amp WALTERS (2018)
Deming and Walters (2018) examine the effect that a 10 change in institutional spending in a given year has on number of credentials awarded in the same year and subsequent three years Although Deming and Waltersrsquo measure of awards at community colleges includes both associate degrees and certificates here we assume a consistent effect across all award types and estimate the impact on number of associate degrees awarded
TABLE 4 SIMULATIONS BASED ON STATISTICALLY SIGNIFICANT FINDINGS FROM DEMING AND WALTERS (2018) ndash A $1000 INCREASE IN STATE APPROPRIATIONS PER FTE
INSTITUTION TYPE OUTCOME ESTIMATED CHANGE IN OUTCOMES
POINT ESTIMATE LOWER BOUND UPPER BOUND
Public two-year Change in AA degrees in t+1 years 216029 35313 396745
Public two-year Change in AA degrees in t+2 years 216623 31833 401413
Public four-year Change in BA degrees in t+2 years 75046 59 150032
Public four-year Change in BA degrees in t+3 years 73738 -7658 155133
NOTES 1 Deming and Waltersrsquo (2018) results represent the Local Average Treatment Effect for institutions in states that had tuition caps
and freezes that prevented them from raising additional revenue through tuition increases beyond a specified point Therefore these projections should be interpreted as the impact of decreasing state funding by $1000 and not allowing institutions to raise tuition in response
SOURCE State Higher Education Executive Officers Association
At public two-year institutions a $1000 increase in state funding per FTE would result in 216029 more associate degrees awarded in the following year and 216623 more associate degrees awarded two years later At public four-year institutions the same $1000 increase in state appropriations per FTE would result in an estimated 75046 more bachelorrsquos degrees awarded two years later and 73738 more bachelorrsquos degrees awarded three years later A $1000 decrease in state appropriations may have the opposite effect on credentials awarded and may result in the same magnitude of decreases of awards in the years following the funding decrease
SIMULATION 1B BOUND BRAGA KHANNA AND TURNER (2019)
Bound Braga Khanna and Turner (2019) report the effect of a 10 change in state appropriations per FTE on degree attainment estimating the effect separately for bachelorrsquos masterrsquos and PhD awards at research and non-research public four-year institutions
SHEEO INVESTIGATING THE IMPACTS OF STATE HIGHER EDUCATION APPROPRIATIONS AND FINANCIAL AID64
copy 2021 by the State Higher Education Executive Officers Association (SHEEO)
TABLE 5 SIMULATIONS BASED ON STATISTICALLY SIGNIFICANT FINDINGS FROM BOUND ET AL (2019) - A $1000 INCREASE IN STATE APPROPRIATIONS PER FTE
INSTITUTION TYPE OUTCOME ESTIMATED CHANGE IN OUTCOMES
POINT ESTIMATE LOWER BOUND UPPER BOUND
Public research four-year Change in bachelorrsquos degree attainment 65918 32992 98844
Public research four-year Change in PhD attainment 7054 2766 11341
SOURCE State Higher Education Executive Officers Association
At public research four-year institutions a $1000 increase in state appropriations per FTE would result in an estimated 65918 more bachelorrsquos degrees completed and 7054 more doctorates completed Again a $1000 decrease in state funding may have the opposite effect and may result in a decrease in degrees awarded
SIMULATION 1C ZHAO (2018)
Zhao (2018) estimates the effect of changes in state appropriations on degree productivity (the change in degrees granted per 100 FTE students) at public colleges He estimates the effect separately by degree level (ie associate bachelorrsquos masterrsquos doctoral) and institution type (ie community college baccalaureate masterrsquos doctoral) For this simulation we use FTE enrollment in each institution type separated by undergraduate and graduate enrollment based on IPEDS 12-month enrollment survey data
TABLE 6 SIMULATIONS BASED ON STATISTICALLY SIGNIFICANT FINDINGS FROM ZHAO (2018) - A $1000 INCREASE IN STATE APPROPRIATIONS
INSTITUTION TYPE OUTCOME ESTIMATED CHANGE IN OUTCOMES
POINT ESTIMATE LOWER BOUND UPPER BOUND
Public two-year Change in number of associate
degrees awarded 56055 34315 77796
Public masters Change in number of bachelorrsquos
degrees awarded4117 522 7713
Public doctoral Change in number of masterrsquos
degrees awarded961 494 1427
Public doctoral Change in number of doctoral
degrees awarded151 41 262
NOTES 1 Graduate enrollment numbers are based on total graduate enrollment and are not broken out by award level
(ie masterrsquos and doctoral)
SOURCE State Higher Education Executive Officers Association
At community colleges a $1000 increase in state appropriations would result in an estimated 56055 more associate degrees awarded A $1000 increase in state appropriations at public masterrsquos institutions leads to 4117 more bachelorrsquos degrees awarded Increasing state appropriations by $1000 at public doctoral institutions results in 961 more masterrsquos degrees and 151 more doctoral degrees awarded A $1000 decrease in state appropriations may decrease the number of each type of degree awarded by the same magnitude
SHEEO INVESTIGATING THE IMPACTS OF STATE HIGHER EDUCATION APPROPRIATIONS AND FINANCIAL AID65
copy 2021 by the State Higher Education Executive Officers Association (SHEEO)
SIMULATION 2 WHAT IS GAINED BY INVESTING IN HIGHER EDUCATION THROUGH
FINANCIAL AID
The financial aid literature includes many more rigorous evaluations of programs and policies than found in the general operating and appropriations literature As such we rely upon meta-analytic evidence to project what a change in financial aid spending may mean for degree production in the United States The most comprehensive of the recent reviews is Nguyen et alrsquos (2019) evaluation of the impact of merit- and need-based aid on persistence and degree completion Though they provide a range of estimates which factor in currency inflation type of aid and various definitions of completion we chose to use their point estimate of 25 percentage points as the effect of an additional $1000 of grant aid on degree completion Of course one could run these same simulations using a number of point estimates that they present or even point estimates from the studies one might deem to be the most rigorous as Avery et al (2019) do in their comparison of public policy levers in higher education finance Nevertheless given the evidence accumulated to date the 25 percentage point parameter seems like a reasonable approximation of the effect size of another $1000 in student grant aid
The studies within the financial aid literature are almost always estimating the impact of additional aid using student-level data and looking at a much smaller sample of potentially impacted students than the studies cited in the appropriations simulations above Determining which group of students to apply this parameter to is somewhat fraught as most nationally representative data do not allow for us to make similar comparisons to those studies cited in Nguyen et al (2019) That said we leverage Pell Grant cohort data from IPEDS as these are students who are known to have financial need and given differences in graduation outcomes amongst Pell and non-Pell Grant recipients we thought might be a more reasonable projection than just applying the policy parameter identified in Nguyen et al (2019) to overall graduation rates in the United States These data of course have their limitations as they only include Pell Grant recipients who can be placed into a cohort of first-time full-time college students who are seeking a credential Likewise because our point estimate combines both need- and merit-based state aid recipients some aid recipients would not be included in the Pell Grant population Nevertheless this population of students seems to be one of the most relevant for such an exercise given the other samples at our disposal47
Table 7 shows the projected increase in credential attainment across public four-year and public two-year colleges using all four years of the Pell cohort data currently available in IPEDS The majority of credentials that make up the increase in the public four-year sector are bachelorrsquos degrees while the public two-year attainment increases are comprised of associate degrees as well as certificates As can be seen an increase of $1000 per student would result in around 11000 additional credentials among Pell Grant recipients in four-year public institutions in each of the years presented and between 8000 and 9500 additional credentials among Pell Grant recipients in public two-year institutions
47 It is notable that the number of Pell Grant recipients who fall into these categories within public four-year and two-year colleges likely only represent about 10 of recipients nationwide
SHEEO INVESTIGATING THE IMPACTS OF STATE HIGHER EDUCATION APPROPRIATIONS AND FINANCIAL AID66
copy 2021 by the State Higher Education Executive Officers Association (SHEEO)
TABLE 7 SIMULATIONS BASED ON NGUYEN ET ALrsquoS (2019) META-ANALYTIC REVIEW - INCREASE OF $1000 PER PELL GRANT RECIPIENT
INSTITUTION TYPE OUTCOME 2016 2017 2018 2019
Public two-year Increase in number of credentials awarded 9521 9004 8306 7913
Public four-year Increase in number of credentials awarded 10780 11054 10738 10953
NOTES 1 Estimates include additional degrees earned amongst first-time full-time credential-seeking Pell Grant recipients reported to IPEDS
in the Graduate Rate survey files Years represent the completion year for 150 of normal completion time in each respective sector (eg 6 years in the four-year institutions and 3 years in the two-year institutions)
SOURCE State Higher Education Executive Officers Association
As stated in the prior simulation section we believe this exercise approximates how changing investment strategies result in different outcomes for students Of course there may be unforeseen responses or general equilibrium effects that the current research doesnrsquot inform or canrsquot foresee Perhaps most importantly these estimates say nothing about the cost-benefit calculation federal and state governments must make There are however two recent studies that rigorously quantify the impact of financial aid and find that federal (Denning et al 2019) and state (Anderson 2020) income tax revenues can pay for financial aid programs over a relatively short time horizon Finally as stated above the results of this financial aid simulation are not comparable to the results of the appropriations simulations In the next section we transition to a more contextual discussion about the unique impacts of state appropriations and grant aid on student enrollment and completion
UNIQUE IMPACTS ON STUDENT ENROLLMENT AND COMPLETION
The simulations presented in the previous section show a rough estimate of the impacts of state appropriations and grant aid on the number of credentials awarded and degree attainment However without additional context it is difficult to make out the meaning of these simulations Questions about the unique impacts of state appropriations and financial aid on desired outcomes have circulated for decades and there are important caveats to consider regarding the intents objectives and broad goals of state funding for higher education In this section we share historical and current context necessary to draw conclusions about the impacts of each type of allocation
CURRENT TRENDS IN CONTEXT
Any comparison of the effects of appropriations versus financial aid should consider that the different funding sources have varied intents and objectives Not all public funding for higher education is intended to increase enrollment and completion for all students For example states may choose to target programs that increase enrollment for the lowest-income students (through need-based aid) or may be interested in retaining students who are likely to leave the state for college (through merit-based aid)
Beyond a given statersquos intended objectives one must reconcile the theories that drove decision-making for decades with the realities of the more recent research on the effects of general appropriations and financial aid In short while providing a subsidy to low-income students may be more targeted and in fact increase degree completion the confluence of studies reviewed suggest that financial aid dollars alone generally do not succeed at bringing more students into higher education It seems that more simplistic broader programs with clear messaging are far more effective at encouraging students to enroll (Carruthers amp Fox 2016 Page amp Scott-Clayton
SHEEO INVESTIGATING THE IMPACTS OF STATE HIGHER EDUCATION APPROPRIATIONS AND FINANCIAL AID67
copy 2021 by the State Higher Education Executive Officers Association (SHEEO)
2016) This may be because financial aid programs especially state and federal need-based aid programs while efficiently allocated per theory are targeted in name only Of course only subgroups of students are eligible to receive the federal Pell Grant or state-level programs like the Texas Grant or the Cal Grant yet state and federal governments often do not invest enough money in making students aware that such programs exist They do not make use of data systems with financial information from K-12 student questionnaires the FAFSA or even publicly available data on income to notify students of eligibility48 Some may argue that because these state programs are underfunded these efforts may be wasteful but it could also be argued that prospective low-income students who lack the social and cultural capital to be aware of such programs are the very students who would benefit most from those aid dollars In fact recent research from Anderson (2020) suggests that these are the very students who would individually benefit and would benefit state economies the most if they could receive the additional dollars needed to enroll in and persist through college49 At the moment it seems higher-achieving low-income students or even students closer to income cutoffs (eg lower-middle and middle-income students) are the ones taking advantage of these programs Until state and federal governments are able to make financial aid dollars more targeted in practice it may behoove policymakers to continue focusing on maintaining and increasing general appropriations as tuition prices seem to have more salience in enrollment decisions than financial aid (Kane 1995 Long 2016)
Though many financial aid programs are underfunded state governments would more wisely invest dollars into these programs by pairing them with programmatic support either at the campus level or even system-wide especially if there are economies of scale to be realized In fact research by Deming and Walters (2018) suggests that institutions use additionally appropriated dollars to accomplish these very tasks by providing additional resources for instructional spending and academic support Campuses may be using financial aid dollars that come with a student to accomplish similar tasks but again the current design of financial aid programs requires that students are aware of these programs in order to bring additional dollars to a given campus
ALIGNING STATE FUNDING WITH THE GOALS OF HIGHER EDUCATION
When choosing how to allocate money to higher education it is important to consider the broad goals for public institutions (Hearn amp Longanecker 1985 Toutkoushian amp Shafiq 2009) If the goal is simply to spend the fewest state dollars possible to increase enrollment rates financial aid is likely a more efficient use of state funds Similarly if you want to create the most progressive and redistributive system wherein tax dollars are spent on low-income students to propel them to upper-income households financial aid may be the most effective investment However states and public institutions have broad and varying goals only one of which is providing access for all students regardless of income (Lingenfelter 2018) States also fund higher education to support
48 Studies examining the impacts of merit aid often have to deal with the endogenous retaking of standardized tests as students close to the eligibility threshold are aware that they are just missing out on financial aid and retake the exam to ensure eligibility (Bruce amp Carruthers 2014 Gurantz amp Odle 2020) Interestingly when examining income eligibility thresholds we never see bunching around the income or EFC required for eligibility (Denning et al 2019 Eng amp Matsudaira 2020 Marx amp Turner 2018) Of course it is nearly impossible to manipulate an EFC or income amount to become eligible for financial aid but we would expect students who are just eligible to apply for financial aid at rates that exceed those who are ineligible if program requirements were well-known or understood Until policymakers and researchers begin seeing this type of bunching one could argue we have not done a good enough job of advertising need-based financial programs Relatedly when examining who is endogenously retaking standardized tests to become eligible researchers should begin disaggregating these McCrary tests by income and other sociodemographic factors to see which types of students are aware of and react to these thresholds
49 Anderson (2020) cleverly looks at college enrollment and degree completion for the poorest students who apply for financial aid later in the application cycle These students who file later have much lower enrollment and degree completion probabilities than their earlier-applying peers and his research shows that state grant aid has a substantial effect on their college trajectories
SHEEO INVESTIGATING THE IMPACTS OF STATE HIGHER EDUCATION APPROPRIATIONS AND FINANCIAL AID68
copy 2021 by the State Higher Education Executive Officers Association (SHEEO)
its ability to provide high-quality and competitive education generate research educate workers for state economic development in key areas reduce income inequality and increase civic and cultural engagement (Dee 2004 Ma et al 2019 Saltmarsh amp Hartley 2011 Singh 2012 Trostel 2010) Therefore state operating support for higher education remains a critical and perhaps undervalued policy tool that positively impacts student completions state attainment rates and a host of other positive outcomes In order to get the most out of higher education and advance the statesrsquo interests increased investment in higher education is necessary
SHEEO INVESTIGATING THE IMPACTS OF STATE HIGHER EDUCATION APPROPRIATIONS AND FINANCIAL AID69
copy 2021 by the State Higher Education Executive Officers Association (SHEEO)
CONCLUSION
We find ourselves in the midst of a pandemic that has wreaked havoc on state budgets If past economic downturns serve as models then we can expect that higher education funding will be on the chopping block for many states hoping to make cost saving cuts for at least two to three more years
State investment in student financial aid is at an all-time high and comprises an increasing percentage of total state support for higher education While we applaud this investment by states in support of students attending postsecondary institutions states must also recognize the critical need of direct investment in institutionsrsquo operating budgets Through the pandemic we hope that states will increase funding when possible maintain when increased investment is not possible and when cuts must be made do so wisely Wise cuts recognize that institutions vary in the extent to which they depend on the state for their operating revenue (Anderson 2020 Lumina Foundation amp Bill amp Melinda Gates Foundation 2020) Some public research universities get less than 10 of their total revenue from the state while other institutions get over 50 of their total revenue from the state Across-the-board cuts punish those institutions that are more dependent on the state
As highlighted in the literature review section on state support cutting state appropriations leads institutions to cut spending on instruction academic support and student services resulting in detrimental student enrollment and completion outcomes On the front end declines in state funding lead to decreases in the enrollment of resident undergraduate students Cuts to state appropriations also lead to negative credential outcomes including an overall decrease in statewide bachelorrsquos degree attainment a decrease in graduation rates at four-year colleges and a decrease in degrees and certificates awarded at public two- and four-year institutions The effects of declining state appropriations are particularly damaging to credentials (ie associate degrees and certificates) awarded at community colleges which educate a disproportionate number of underserved students
We encourage states to not only reconsider overall funding cuts in the wake of the pandemic but to think critically about which institutions and by default which students they target with this funding The US postsecondary education system is highly stratified even within the public sector and students of color and low-income students disproportionately attend public two-year and open-access public four-year institutions (Carnevale amp Strohl 2013) These open-access institutions spend only a fraction per student compared to selective four-year institutions (Carnevale amp Strohl 2013) and receive substantially less per student in state appropriations Long (2016) found that controlling for other factors public research universities receive approximately $2500 more per FTE in state appropriations compared to non-research four-year colleges and over $5000 more per FTE than two-year colleges
A recent report by Hillman (2020) highlights that these inequitable funding gaps are growingmdashan increasing number of Black students and students receiving Pell Grants are enrolling in the most poorly funded institutions Addressing the stark gaps in enrollment and completion outcomes between the most and least advantaged students requires intentional intervention from states and a critical examination of how to more equitably distribute state spending on higher education is an important area of focus
SHEEO INVESTIGATING THE IMPACTS OF STATE HIGHER EDUCATION APPROPRIATIONS AND FINANCIAL AID70
copy 2021 by the State Higher Education Executive Officers Association (SHEEO)
As noted in the trends section states have developed a wide variety of financial aid programs that target different students Many of the initial state aid programs included a need-based component that targeted aid toward lower-income students Merit-aid programs were developed to keep the best and brightest students in the state but much of this aid flows to students from wealthier families More recently states have developed promise programs that are intended to provide universal access to at least the two-year sector Many of these newer promise programs also include a minimal merit component andor income caps to help keep costs down and better target aid
Because the choice of program will dictate which students receive state aid it is important for states to ensure their aid programs reinforce the state goals While there is evidence that merit-aid programs are successful in keeping the target student population in the state while they are enrolled the evidence also suggests merit programs do little to increase state postsecondary attainment rates as many merit-aid recipients leave the state after graduation (Fitzpatrick amp Jones 2016 Sjoquist amp Winters 2013 Sjoquist amp Winters 2014) Consequently a need-based program or promise program that includes student supports may be more effective at reaching students who would not otherwise attend a postsecondary institution and thus may be more effective at raising state educational attainment levels Likewise programs (such as promise programs) that are easily understood widely publicized and paired with critical student supports have been shown to be effective in positively impacting student outcomes (Carruthers amp Fox 2016 Gurantz 2018 Page et al 2019b Angrist et al 2020) With limited resources to allocate to financial aid states will need to think carefully about how their financial aid allocations support progress toward achieving state goals
POLICY RECOMMENDATIONS
We conclude with several finance policy solutions that states and the federal government can adopt to support their efforts of reaching state postsecondary attainment goals and closing equity gaps in degree attainment and college completion
STATE POLICY
At the state level policy decisions frequently come down to the amount of funding available States rarely have adequate budget resources to fully fund every priority and the decisions states make about how to allocate scarce resources can propel progress toward achieving postsecondary goals or create unintended roadblocks that obstruct progress toward these goals
1 Increase State Support While we recognize that significant increases in state support for institutions are not likely in the next year or two states should invest more in their public institutions when possible States are not likely to see significant gains in their postsecondary completion numbers and attainment rates without increased investment in their institutions As the literature reviewed here attests to and as shown in our simulations such investments are likely to pay significant dividends through increased enrollment persistence and completions The overall increase in educational attainment that comes with state investment in their institutions will help states meet dynamic workforce needs of the post-pandemic economy provide many additional societal benefits (McMahon 2009) and increase state income tax revenue (Chakrabarti 2020)
SHEEO INVESTIGATING THE IMPACTS OF STATE HIGHER EDUCATION APPROPRIATIONS AND FINANCIAL AID71
copy 2021 by the State Higher Education Executive Officers Association (SHEEO)
Likewise most studies we reviewed consistently point toward additional financial aid dollars influencing student behavior Moreover the dollars invested in these programs have a large return on investment for state and federal governments through increased student persistence and credential attainment as well as increased income tax revenue (Anderson 2020 Denning et al 2019) Because the form that general operating and financial aid appropriations come in and the overall purposes of both strategies vary it is difficult if not impossible to determine the appropriate ratio of total higher education funding each should receive However because state operating appropriations serve to support the entire mission of institutions contribute to the overall quality of the education experience and directly impact student access and success support for state financial aid programs should not come at the expense of general operating support
2 State Funding Equity Audit In a recent report Hillman (2020) proposes that policymakers should consider conducting funding-equity audits in order to understand current trends in state funding gaps in funding between institution types and how these patterns overlap with race- and income-based patterns of student enrollment While there are significant challenges to isolating the instructional spending at institutions as Hillman recommends the exercise could still provide new and useful information for policymakers to consider Hillman stresses that states should be transparent about the results of these audits and make the audits widely accessible to the public Readers interested in learning more about what a state funding equity audit might look like and how policymakers could use such an audit to address current funding inequities in their states should read Hillmanrsquos recent Third Way report50
3 Adjust Funding to Promote Equity Completions and Attainment Ensure institutions that serve the bulk of underrepresented students of color and low-income students are funded appropriately and attempt to correct historical underfunding Funding allocation models should promote access and success for underrepresented students States should adjust their funding allocation strategies to be consistent with articulated state goals of reducing equity gaps and increasing educational attainment Prioritizing increases to the base allocation for institutions serving the statersquos priority populations (eg students of color low-income students and adult learners) will help achieve these goals
4 Alternative Revenues Matter Decreases in state appropriations lead to cuts in institutional spending on services that are essential for student success (eg instruction academic support student services) Since public four-year institutions particularly research universities have a wider range of alternative revenue sources (eg increasing tuition increasing enrollment of out-of-state students) community colleges experience the most detrimental cuts to institutional expenditures as a result of declining state appropriations States should consider all institutional revenues and make strategic decisions regarding state appropriations in concert with decisions about tuition rates and out-of-state tuition caps
50 Hillman N (2020) Why rich colleges get richer amp poor colleges get poorer The case for equity-based funding in higher education Washington DC Third Way httpswwwthirdwayorgreportwhy-rich-colleges-get-richer-poor-colleges-get-poorer-the case-for-equity-based-funding-in-higher-education
SHEEO INVESTIGATING THE IMPACTS OF STATE HIGHER EDUCATION APPROPRIATIONS AND FINANCIAL AID72
copy 2021 by the State Higher Education Executive Officers Association (SHEEO)
5 Financial Aid Messaging Matters There is currently a tradeoff between targeting financial aid funds to those who would be most influenced by receiving additional aid dollars (eg low-income students) and the messaging of simple eligibility requirements (eg state and local promise programs) It may behoove states who are able to fully or mostly fund their need-based financial aid to invest resources in marketing the program to students who have traditionally been unaware of state and even federal aid In fact research by Gurantz (2018) suggests these types of initiatives for targeted aid can be successful
6 Student Supports Matter The financial aid programs that are most successful invest in aid dollars as well as in supports for students For instance in Tennessee the free college program not only conveys a simple message to state residents but also provides support for students considering college through governmental agencies as well as with significant support from philanthropic organizations Other programs with successful track records such as the Dell Scholars program invest significant time and money into their students (Page et al 2019b) as does the Susan Thompson Buffett Foundation in Nebraska (Angrist et al 2020) and the ASAP program in a number of states (Miller et al 2020)
FEDERAL POLICY
While this paper is focused on state funding and policy the federal government has had an increasing role in higher education finance and is uniquely positioned to provide stabilizing support and incentives for states to increase funding for higher education We propose two potential federal solutions to the problems discussed in this paper
1 A Federal-State Partnership for College Affordability The economic impact of the coronavirus pandemic has already resulted in increasingly strained state budgets and unlike at the federal level states do not have the ability to run a deficit with their budgets The two levels of government can share financial responsibility for increasing government investment in higher education and making college more affordable for low-income students Tandberg et al (2017) have proposed a measure of affordability and a federal-state partnership with this goal in mind Under this proposal any additional state funding given to support low-income students would be matched with federal funds with a goal of students devoting no more than 10 of their discretionary income toward student loan repayment Readers interested in learning more about what this federal-state partnership might look like should read SHEEOrsquos proposal51
2 Title I-Type Program for Higher Education The federal Title I program provides K-12 schools serving a large proportion of low-income students with additional funding for extra educational services A parallel grant program could be designed for higher education with eligibility determined based on serving a large sharenumber of low-income students or a combination of income- and raceethnicity-based eligibility thresholds Current K-12 Title I programs require that federal dollars supplement rather than replace state and local funding and a similar requirement could be written into a higher education Title I program Readers interested in learning more about what a potential design of such a program might look like should read Third Wayrsquos (Hiler amp Whistle 2018) proposed program design52
51 Tandberg D Laderman S amp Carlson A (2017) A federal-state partnership for true college affordability State Higher Education Executive Officers Association httpssheeoorgwp-contentuploads201903Federal-State_Partnership_for_True_College_Affordabilitypdf
52 Hiler T amp Whistle W (2018) Creating a ldquoTitle Irdquo for higher ed Third Way httpswwwthirdwayorgmemocreating-a-title-i-for-higher-ed
SHEEO INVESTIGATING THE IMPACTS OF STATE HIGHER EDUCATION APPROPRIATIONS AND FINANCIAL AID73
copy 2021 by the State Higher Education Executive Officers Association (SHEEO)
REFERENCES
Abraham KG amp Clark MA (2006) Financial aid studentsrsquo college decisions Evidence from the District of Columbia Tuition Assistance Grant program The Journal of Human Resources 41(3) 578-610
Ahlman L (2019) Dire disparities Patterns of racially inequitable funding and student success in public postsecondary education The Institute for College Access amp Success httpsticasorgaffordability-2dire-disparities-patterns-of-racially-inequitable-funding-and-student-success-in-public-postsecondary-education
Allen D amp Wolniak GC (2019) Exploring the effects of tuition increases on racialethnic diversity at public colleges and universities Research in Higher Education 60 18-43
Alon S (2005) Model mis-specification in assessing the impact of financial aid on academic outcomes Research in Higher Education 46 109-125
Alon S (2011) Who benefits most from financial aid The heterogeneous effect of need-based grants on studentsrsquo college persistence Social Science Quarterly 92(3) 807-829
Anderson DM (2020) When financial aid is scarce The challenge of allocating college aid where it is needed most Journal of Public Economics Published online
Anderson DM amp Goldrick-Rab S (2018) Aid after enrollment Impacts of a statewide grant program at public two-year colleges Economics of Education Review 67 148-157
Anderson DM Broton KM Goldrick-Rab S amp Kelchen R (2019) Experimental evidence on the impacts of need-based financial aid Longitudinal assessment of the Wisconsin Scholars grant Journal of Policy Analysis and Management 39(3) 720-739
Anderson R E (2020) Presidentrsquos message SHEEO Member News September 2020 httpsmailchimpsheeosheeo-member-news-april-5065716e=fcbef6ef65
Andrews RJ DesJardins S amp Ranchhod V (2010) The effects of the Kalamazoo Promise on college choice Economics of Education Review 29 722-737
Andrews RJ Imberman SA amp Lovenheim MF (2020) Recruiting and supporting low-income high-achieving students at flagship universities Economics of Education Review Published online
Angrist J Autor D Pallais A (2020) Marginal effects of merit aid for low-income students (SEII Working Paper) httpsseiimiteduresearchstudymarginal-effects-of-merit-aid-for-low-income-students
Avery C Pender M Howell J amp Sacerdote B (2019) Policies and payoffs to addressing Americarsquos college graduation deficit Brookings Papers on Economic Activity
Bartik T (1991) Who benefits from state and local economic development policies WE Upjohn Institute
Bartik TJ Hershbein B amp Lachowska M (2020) The effects of the Kalamazoo Promise scholarship on college enrollment and completion The Journal of Human Resources Published online
SHEEO INVESTIGATING THE IMPACTS OF STATE HIGHER EDUCATION APPROPRIATIONS AND FINANCIAL AID74
copy 2021 by the State Higher Education Executive Officers Association (SHEEO)
Bettinger EP (2004) How financial aid affects persistence In CM Hoxby (Ed) College choices The economics of where to go when to go and how to pay for It (pp 207-233) University of Chicago Press
Bettinger EP (2015) Need-based aid and college persistence The effects of the Ohio College Opportunity Grant Educational Evaluation and Policy Analysis 37(1S) 102S-119S
Bettinger EP Gurantz O Kawano L Sacerdote BL amp Stevens M (2019) The long-run impacts of financial aid Evidence from Californiarsquos Cal Grant American Economic Journal Economic Policy 11(1) 64-94
Bettinger EP Terry Long B Oreopoulos P Sanbonmatsu L (2012) The role of application assistance and information in college decisions Results from the HampR Block FAFSA experiment The Quarterly Journal of Economics 127 1205-1242
Bound J Braga B Khanna G amp Turner S (2019) Public universities The supply side of building a skilled workforce RSF The Russell Sage Foundation Journal of the Social Sciences 5(5) 43-66
Bruce DJ amp Carruthers CK (2014) Jackpot The impact of lottery scholarships on enrollment in Tennessee Journal of Urban Economics 81 30-44
Carnevale AP amp Strohl J (2013) Separate amp unequal How higher education reinforces intergenerational reproduction of white racial privilege Center on the Education and the Workforce Georgetown University httpscewgeorgetowneduwp-contentuploadsSeparateUnequalFR_pdf
Carruthers CK amp Fox WF (2016) Aid for all College coaching financial aid and post-secondary persistence in Tennessee Economics of Education Review 51 97-112
Carruthers CK amp Oumlzek U (2016) Losing HOPE Financial aid and the line between college and work Economics of Education Review 53 1-15
Carruthers CK amp Welch JG (2019) Not whether but where Pell grants and college choices Journal of Public Economics 172 1-19
Carruthers CK amp Welch JG (2020) Financial aid for nontraditional students Take-up and estimated effects in technical colleges (Working Paper) httpsvolwebutkedu~ccarrut1Carruthers_Welch_TCAT_aid_2020-12-02
Castleman B L amp Long B T (2016) Looking beyond enrollment The causal effect of need-based grants on college access persistence and graduation Journal of Labor Economics 34(4) 1023-1073
Cellini S R amp Chaudhary L (2014) The labor market returns to a for-profit college education Economics of Education Review 43 125-140
Cellini SR (2008) Causal inference and omitted variable bias in financial aid research Assessing solutions The Review of Higher Education 31(3) 329-354
Center for Tax and Budget Accountability (2017) Illinoisrsquo significant disinvestment in higher education httpsbudgetblogctbaonlineorgillinois-significant-disinvestment-in-higher-education-e49db103c80
SHEEO INVESTIGATING THE IMPACTS OF STATE HIGHER EDUCATION APPROPRIATIONS AND FINANCIAL AID75
copy 2021 by the State Higher Education Executive Officers Association (SHEEO)
Chakrabarti R Gorton N amp Lovenheim M (2020) State investment in higher education Effects on human capital formation student debt and long-term financial outcomes of students Federal Reserve Bank of New York Staff Report 941
Chetty R Friedman J Saez E Turner N amp Yagan D (2017) Mobility report cards The role of colleges in intergenerational mobility (No w23618) National Bureau of Economic Research httpsdoiorg103386w23618
Cohodes S amp Goodman JS (2014) Merit aid college quality and college completion Massachusetts Adams Scholarship as an in-kind subsidy American Economic Journal Applied Economics 6(4) 251-285
Colorado Department of Higher Education (nd) Colorado Commission on Higher Education mission Colorado Official State Web Portal httpscdhecoloradogovcolorado-commission-higher-education-mission
Cornwell CM Mustard DB amp Sridhar DJ (2006) The enrollment effects of merit-based financial aid Evidence from Georgiarsquos HOPE program Journal of Labor Economics 24(4) 761-786
Dee T S (2004) Are there civic returns to education Journal of Public Economics 88(9) 1697ndash1720 httpsdoiorg101016jjpubeco200311002
Delaney J A amp Doyle W R (2011) State spending on higher education Testing the balance wheel over time Journal of Education Finance 36(4) 343-368
Deming D J amp C R Walters (2018) The impact of state budget cuts on US postsecondary attainment (Working Paper) httpsscholarharvardedufilesddemingfilesdw_feb2018pdf
Deming D J Yuchtman N Abulafi A Goldin C amp Katz L F (2016) The value of postsecondary credentials in the labor market An experimental study American Economic Review 106(3) 778-806
Deming D amp Dynarski SM (2010) College aid In PB Levine amp DJ Zimmerman (Eds) Targeting investments in children Fighting poverty when resources are limited (pp 283-302) University of Chicago Press
Denning JT (2019) Born under a lucky star Financial aid college completion labor supply and credit constraints The Journal of Human Resources 54(3) 760-784
Denning JT Marx BM amp Turner LJ (2019) ProPelled The effects of grants on graduation earnings and welfare American Economic Journal Applied Economics 11(3) 193-224
Dynarski SM (2000) Hope for whom Financial aid for the middle class and its impact on college attendance National Tax Journal 53(3) 629-662
Dynarski SM (2003) Does aid matter Measuring the effect of student aid on college attendance and completion American Economic Review 93(1) 279-288
Dynarski SM (2004) The new merit aid In CM Hoxby (Ed) College choices The economics of where to go when to go and how to pay for it (pp 63-97) University of Chicago Press
Dynarski SM (2008) Building the stock of college-educated labor Journal of Human Resources 43(3) 576-610
SHEEO INVESTIGATING THE IMPACTS OF STATE HIGHER EDUCATION APPROPRIATIONS AND FINANCIAL AID76
copy 2021 by the State Higher Education Executive Officers Association (SHEEO)
Dynarski SM amp Scott-Clayton J (2013) Financial aid policy Lessons from research The Future of Children 23(1) 67-91
Ehrenberg R G (2006) The perfect storm and the privatization of public higher education Change The Magazine of Higher Learning 38(1) 46-53 httpdoiorg103200CHNG38 146-53
Enders J amp Jongbloed B (2007) The public the private and the good in higher education research An introduction In J Enders amp B Jongbloed (Eds) Public-private dynamics in higher education (pp 9-36) Transcript Verlag
Eng A Matsudaira J (2020) Pell Grants and student success Evidence from the universe of federal aid recipients (Working Paper) httpsamanda-engcomassetspdfEngMatsudaira_Pellfx_20200901pdf
Espinosa L Turk JM Taylor M amp Chessman HM (2019) Race and ethnicity in higher education A status report American Council on Education httpswwwequityinhigheredorg
Evans BJ amp Nguyen TD (2019) Monetary substitution of loans earnings and need-based aid in postsecondary education The impact of Pell Grant eligibility Economics of Education Review 70 1-19
Fitzpatrick MD amp Jones D (2016) Post-baccalaureate migration and merit-based scholarships Economics of Education Review 54 155-172
Frye JR (2015) Flexibility for survival State funding and contingent faculty employment at public higher education institutions (Publication No 116724) [Doctoral dissertation University of Michigan] Deep Blue Database
Gaacutendara D amp Li A (2020) Promise for whom ldquoFree-collegerdquo programs and enrollments by race and gender classifications at public 2-year colleges Educational Evaluation and Policy Analysis Published online
Goldsmith-Pinkham P Sorkin I amp Swift H (2019) Bartik instruments What when why and how httpspaulgpgithubiopapersbartik_gpsspdf
Gonzales J (2020 May 19) Lawmakers just cut 58 from Colorado public colleges Federal money will ease the blow Chalkbeat Colorado Retrieved from httpscochalkbeatorg202051921264509lawmakers-cut-58-percent-from-colorado-public-colleges-3-3-billion-budget-hole
Goodman J (2008) Who merits financial aid Massachusettsrsquo Adams Scholarship Journal of Public Economics 92(10) 2121-2131
Goodman S amp Volz AH (2020) Attendance spillovers between public and for-profit colleges Evidence from statewide variation in appropriations for higher education Education Finance and Policy 15(3) 428-456
Gurantz O (2018) A little can go a long way The impact of advertising services on program take-up Educational Evaluation and Policy Analysis 40(3) 382-398
Gurantz O (2019a) Impacts of state aid for non-traditional students on educational and labor market outcomes (Working Paper) httpswwwedworkingpaperscomai19-150
SHEEO INVESTIGATING THE IMPACTS OF STATE HIGHER EDUCATION APPROPRIATIONS AND FINANCIAL AID77
copy 2021 by the State Higher Education Executive Officers Association (SHEEO)
Gurantz O (2019b) What does free community college buy Early impacts from the Oregon Promise Journal of Policy Analysis and Management 39(1) 11-35
Gurantz O amp Odle TK (2020) The impact of merit aid on college choice and degree attainment Reexamining Floridarsquos Bright Futures program (Working Paper) httpswwwedworkingpaperscomai20-306
Hancock J (2020 June 1) Parson cuts $141 million from Missouri K-12 budget $41 million from higher education The Kansas City Star Retrieved from httpswwwkansascitycomnewspolitics-governmentarticle243172006html
Hansen WL (1983) Impact of student financial aid on access Proceedings of the Academy of Political Science 35(2) 84-96
Hansen WL amp Weisbrod BA (1969) The distribution of costs and direct benefits of public higher education The case of California The Journal of Human Resources 4(2) 176-191
Hearn J C amp Longanecker D (1985) Enrollment effects of alternative postsecondary pricing policies The Journal of Higher Education 56(5) 485-508
HECC (nd) HECC mission vision values and beliefs State of Oregon httpswwworegongovhigheredaboutPagesmission-vision-valuesaspx
Herbaut E amp Geven K (2020) What works to reduce inequalities in higher education A systematic review of the (quasi-)experimental literature on outreach and financial aid Research in Social Stratification and Mobility 65 1-14
Hershbein B Kearney MS Pardue LW (2020) College attainment income inequality and economic security A simulation exercise (NBER Working Paper No 26747) httpwwwnberorgpapersw26747
Hiler T amp Whistle W (2018) Creating a ldquoTitle Irdquo for higher ed Third Way httpswwwthirdwayorgmemocreating-a-title-i-for-higher-ed
Hillman N (2020) Why rich colleges get richer amp poor colleges get poorer The case for equity-based funding in higher education Third Way httpswwwthirdwayorgreportwhy-rich-colleges-get-richer-poor-colleges-get-poorer-the-case-for-equity-based-funding-in-higher-education
Hillman NW Tandberg DA amp Gross JK (2014) Market-based higher education Does Colorados voucher model improve higher education access and efficiency Research in Higher Education 55 601-625
Hossler D Lund J P Ramin J Westfall S amp Irish S (1997) State funding for higher education The Sisyphean task Journal of Higher Education 68(2) 160-190
Hovey HA (1999) State spending for higher education in the next decade The battle to sustain current support National Center for Public Policy and Higher Education
SHEEO INVESTIGATING THE IMPACTS OF STATE HIGHER EDUCATION APPROPRIATIONS AND FINANCIAL AID78
copy 2021 by the State Higher Education Executive Officers Association (SHEEO)
Husted TA amp Kenny LW (2018) The effect of reduced support from state government on research in state universities Journal of Education Finance 44(2) 164-174
Jaquette O (2019) Do public universities replace state appropriations with masters students The Review of Higher Education 42(3) 1101-1144
Jaquette O amp Curs BR (2015) Creating the out-of-state university Do public universities increase nonresident freshman enrollment in response to declining state appropriations Research in Higher Education 56 535-565
Jaquette O Curs B R amp Posselt J R (2016) Tuition rich mission poor Nonresident enrollment growth and the socioeconomic and racial composition of public research universities The Journal of Higher Education 87(5) 635-673
Kahn S Huelsman M amp Mishory J (2019) Bridging progressive policy debates How student debt and the racial wealth gap reinforce each other The Roosevelt Institute The Century Foundation and Demos httpsrooseveltinstituteorgwp-contentuploads202007RI_Student-Debt-and-RWG-201909pdf
Kane TJ (1995) Rising public college tuition and college entry How well do public subsidies promote access to college (NBER Working Paper No 5164) httpswwwnberorgpapersw5164
Kezar A J (2005) Challenges for higher education in serving the public good In A J Kezar T C Chambers amp J C Burkhardt (Eds) Higher education for the public good Emerging voices from a national movement (pp 23-42) Jossey-Bass
Laderman S amp Weeden D (2020) State higher education finance fiscal 2019 State Higher Education Executive Officers Association httpsshefsheeoorgreport
Leslie LL amp Brinkman PT (1987) Student price response in higher education The student demand studies Journal of Higher Education 58(2) 181-204
Lingenfelter P (2018) The origins and evolving roles of state higher education executives in American higher education In D Tandberg B Sponsler R Hanna amp J Guilbeau (Eds) The state higher education executive officer and the public good Developing new leadership for improved policy practice and research (pp 15ndash46) Teachers College Press
Lochner L (2004) Education work and crime A human capital approach International Economic Review 45(3) 811ndash843 httpsdoiorg101111j0020-6598200400288x
London R (2006) The role of postsecondary education in welfare recipientsrsquo paths to self-sufficiency The Journal of Higher Education 77(3) 472ndash496 httpsdoiorg101353jhe20060024
Long B T (2016) State support for higher education How changing the distribution of funds could improve college completion rates Prepared for the National Commission on Financing 21st Century Higher Education Miller Center at the University of Virginia Charlottesville
Long BT amp Riley E (2007) Financial aid A broken bridge to college access Harvard Educational Review 77(1) 39-63
Lumina Foundation amp Bill amp Melinda Gates Foundation (2020) Higher ed budgets for the post-COVID era Nowrsquos our chance to do this right httpswwwluminafoundationorgresourcehigher-ed-budgets-for-the-post-covid-era
SHEEO INVESTIGATING THE IMPACTS OF STATE HIGHER EDUCATION APPROPRIATIONS AND FINANCIAL AID79
copy 2021 by the State Higher Education Executive Officers Association (SHEEO)
Lumina Foundation (2019) A stronger nation Learning beyond high school builds American talent httpswwwluminafoundationorgstronger-nationreport2020nation
Ma J Pender M amp Welch M (2019) Education pays 2019 The benefits of higher education for individuals and society The College Board httpsresearchcollegeboardorgpdfeducation-pays-2019-full-reportpdf
Manski CF amp Wise DA (1983) College choice in America Harvard University Press
Marx BM amp Turner LJ (2018) Borrowing trouble Human capital investment with opt-in costs and implications for the effectiveness of grant aid American Economic Journal Applied Economics 10(2) 163-201
McLendon MK Tandberg DA amp Hillman NW (2014) Financing college opportunity Factors influencing state spending on student financial aid and campus appropriations 1990 through 2010 The ANNALS of the American Academy of Political and Social Science 655(1) 143-162
McMahon W W (2009) Higher learning greater good The private and social benefits of higher education Johns Hopkins University Press
McPherson MS amp Schapiro MO (1991) Does student aid affect college enrollment New evidence on a persistent controversy The American Economic Review 81(1) 309-318
Miller C Headlam C Manno M amp Cullinan D (2020) Increasing community college graduation rates with a proven model MDRC httpsfilesericedgovfulltextED603027pdf
Mugglestone K Dancy K amp Voight M (2019) Opportunity lost Net price and equity at public flagship institutions Institute for Higher Education Policy httpwwwiheporgresearchpublicationsopportunity-lost-net-price-and-equity-public-flagship-institutions
National Student Clearinghouse (2020) COVID-19 Stay informed with the latest enrollment information (as of Oct 22nd) Author httpsnscresearchcenterorgstay-informed
Nguyen H (2020) Free college Assessing enrollment responses to the Tennessee Promise program Labour Economics Published online
Nguyen S Fishman R amp Weeden D (2020) The impact of COVID-19 on state higher education budgets New America httpswwwnewamericaorgeducation-policyreportsstate-budget-cuts
Nguyen TD Kramer JW Evans BJ (2019) The effects of grant aid on student persistence and degree attainment A systematic review and meta-analysis of the causal evidence Review of Educational Research 89(6) 831-874
Page LC amp Scott-Clayton J (2016) Improving college access in the United States Barriers and policy responses Economics of Education Review 51 4-22
Page LC Iritl JE Lowry DJ Anthony AM (2019b) The promise of place-based investment in postsecondary access and success Investigating the impact of the Pittsburgh Promise Education Finance and Policy 14(4) 572-600
Page LC Kehoe SS Castleman BL amp Sahadewo GA (2019a) More than dollars for scholars The impact of the Dell Scholars program on college access persistence and degree attainment The Journal of Human Resources 54(3) 683-725
SHEEO INVESTIGATING THE IMPACTS OF STATE HIGHER EDUCATION APPROPRIATIONS AND FINANCIAL AID80
copy 2021 by the State Higher Education Executive Officers Association (SHEEO)
Pallais A (2009) Taking a chance on college Is the Tennessee Education Lottery Scholarship program a winner The Journal of Human Resources 44(1) 4-22
Peltzman S (1973) The effect of government subsidies-in-kind on private expenditures The case of higher education Journal of Political Economy 81(1) 1-27
Rhode Island Office of the Postsecondary Commissioner (nd) Mission amp responsibilities RIOPC httpswwwriopcedupageOPC20mission
Saltmarsh J amp Hartley M (2011) ldquoTo serve a larger purposerdquo Engagement for democracy and the transformation of higher education Temple University Press
Scott-Clayton J (2011) On money and motivation A quasi-experimental analysis of financial incentives for college achievement The Journal of Human Resources 46(3) 614-646
Scott-Clayton J amp Schudde L (2020) The consequences of performance standards in need-based aid Evidence from community colleges The Journal of Human Resources 55(4) 1105-1136
Scott-Clayton J amp Zafar B (2019) Financial aid debt management and socioeconomic outcomes Post-college effects of merit-based aid Journal of Public Economics 170 68-82
Seftor N amp Turner SE (2002) Back to school Federal student aid policy and adult college enrollment The Journal of Human Resources 37(2) 336-352
Singh M (2012) Re-inserting the ldquopublic-goodrdquo into higher education transformation In B Leibowitz (Ed) Higher education for the public good (pp 1ndash15) Sun Press httpsdoi org1018820978192835705601
Sjoquist DL amp Winters JV (2012) Building the stock of college-educated labor revisited The Journal of Human Resources 47(1) 270-285
Sjoquist DL amp Winters JV (2014) Merit aid and post-college retention in the state Journal of Urban Economics 80 39-50
Sjoquist DL amp Winters JV (2015) State merit-based financial aid programs and college attainment Journal of Regional Science 55(3) 364-390
Sjoquist DL amp Winters JV (2016) The effects of state merit aid programs on attendance at elite colleges Southern Economic Journal 83(2) 527-549
Tandberg D Laderman S amp Carlson A (2017) A federal-state partnership for true college affordability State Higher Education Executive Officers Association httpssheeoorgwp-contentuploads201903Federal-State_Partnership_for_True_College_Affordabilitypdf
Toutkoushian R K amp Hillman N W (2012) The impact of state appropriations and grants on access to higher education and outmigration The Review of Higher Education 36(1) 51-90
Toutkoushian R K amp Shafiq M N (2009) A conceptual analysis of state support for higher education Appropriations versus need-based financial aid Research in Higher Education 51 40-64
SHEEO INVESTIGATING THE IMPACTS OF STATE HIGHER EDUCATION APPROPRIATIONS AND FINANCIAL AID81
copy 2021 by the State Higher Education Executive Officers Association (SHEEO)
Toutkoushian RK Hossler D DesJardins SL McCall B amp Gonzaacutelez Cancheacute MS (2015) The effect of participating in Indianarsquos Twenty-First Century Scholars program on college enrollments The Review of Higher Education 39(1) 59-95
Trostel P A (2010) The fiscal impacts of college attainment Research in Higher Education 51(3) 220ndash247 httpsdoiorg101007s11162-009-9156-5
Trostel P A (2012) The effect of public support on college attainment Higher Education Studies 2(4) 58-67
Turner LJ (2017) The economic incidence of federal student grant aid (Working Paper) httpslesleyjturnercomTurner_FedAidIncidence_Jan2017pdf
Virginia Advisory Legislative Council (1955) The crisis in higher education in Virginia and a solution State Council of Higher Education for Virginia httpsschevedudocsdefault-sourceabout-sectioncouncil-filesschev-1955-reportpdf
Webber D A (2017) State divestment and tuition at public institutions Economics of Education Review 60 1-4
Welch J G (2014) HOPE for community college students The impact of merit aid on persistence graduation and earnings Economics of Education Review 43 1-20
Williams J (2016) A critical exploration of changing definitions of public good in relation to higher education Studies in Higher Education 41(4) 619ndash630 httpsdoiorg101080 030750792014942270
Zhang L (2009) Does state funding affect graduation rates at public four-year colleges and universities Educational Policy 23(5) 714-731
Zhang L amp Ness E (2010) Does state merit-based aid stem brain drain Educational Evaluation and Policy Analysis 32(2) 143-165
Zhang L Hu S amp Sensenig V (2013) The effect of Floridarsquos Bright Futures program on college enrollment and degree production An aggregated-level analysis Research in Higher Education 54(7) 746-764
Zhao B (2018a) Disinvesting in the future A comprehensive examination of the effects of state appropriations for public higher education Federal Reserve Bank of Boston New England Public Policy Center
Zhao B (2018b) State disinvestment in higher education The impact on public research universities patent applications Federal Reserve Bank of Boston New England Public Policy Center
SHEEO INVESTIGATING THE IMPACTS OF STATE HIGHER EDUCATION APPROPRIATIONS AND FINANCIAL AID82
copy 2021 by the State Higher Education Executive Officers Association (SHEEO)
APPENDIX ATABLE A1 GENERAL OPERATING APPROPRIATIONS PER FTE (CONSTANT ADJUSTED $) BY STATE 2001-2019
GENERAL OPERATING PER FTE PERCENT CHANGE
STATE 2001 2008 2012 2018 2019 2001-2019 2008-2019 2012-2019 2018-2019
ALABAMA $8611 $10696 $6680 $6414 $6410 -256 -401 -40 -01
ALASKA $14065 $15304 $14660 $14607 $15435 97 09 53 57
ARIZONA $8678 $8835 $5546 $5275 $5210 -400 -410 -61 -12
ARKANSAS $9441 $9199 $7510 $7149 $7232 -234 -214 -37 12
CALIFORNIA $8867 $7662 $5267 $7649 $8107 -86 58 539 60
COLORADO $5796 $4130 $2718 $3547 $3849 -336 -68 416 85
CONNECTICUT $11356 $10320 $8074 $8153 $8185 -279 -207 14 04
DELAWARE $8117 $7240 $5412 $5246 $5096 -372 -296 -58 -29
FLORIDA $8886 $6627 $4653 $6232 $6293 -292 -50 353 10
GEORGIA $12358 $9128 $6181 $7497 $7653 -381 -162 238 21
HAWAII $10058 $12537 $9312 $13345 $14632 455 167 571 96
IDAHO $13176 $11911 $6976 $9649 $9706 -263 -185 391 06
ILLINOIS $11709 $10747 $11663 $13767 $14111 205 313 210 25
INDIANA $8431 $6241 $4951 $5026 $4990 -408 -200 08 -07
IOWA $10860 $8200 $5716 $6157 $6241 -425 -239 92 14
KANSAS $10665 $8154 $6551 $6608 $6815 -361 -164 40 31
KENTUCKY $11747 $9209 $6981 $6373 $6120 -479 -335 -123 -40
LOUISIANA $7029 $8501 $5210 $3880 $3786 -461 -555 -273 -24
MAINE $9641 $7639 $6705 $7443 $7403 -232 -31 104 -05
MARYLAND $8954 $7410 $6150 $7302 $7544 -157 18 227 33
MASSACHUSETTS $10917 $8454 $6026 $7342 $7494 -314 -114 244 21
MICHIGAN $11070 $7662 $5735 $6995 $7130 -356 -69 243 19
MINNESOTA $9651 $7962 $5371 $7141 $6885 -287 -135 282 -36
MISSISSIPPI $10334 $9637 $6923 $6390 $6279 -392 -348 -93 -17
MISSOURI $11972 $9182 $6682 $6499 $6572 -451 -284 -17 11
MONTANA $6309 $6425 $5460 $6261 $6381 11 -07 169 19
NEBRASKA $12642 $9396 $8344 $9851 $9922 -215 56 189 07
NEVADA $8439 $10014 $6409 $6596 $6736 -202 -327 51 21
NEW HAMPSHIRE $5349 $3899 $1905 $2826 $2871 -463 -264 507 16
NEW JERSEY $9375 $7846 $6049 $5253 $5339 -431 -320 -117 16
NEW MEXICO $9535 $11634 $8846 $10774 $11626 219 -01 314 79
NEW YORK $7326 $7578 $6454 $7750 $8044 98 62 246 38
NORTH CAROLINA $12803 $12369 $9511 $10261 $10528 -178 -149 107 26
NORTH DAKOTA $7384 $7290 $8316 $8059 $8200 110 125 -14 17
OHIO $9226 $6685 $5288 $6223 $6021 -347 -99 139 -32
OKLAHOMA $10168 $9328 $7300 $5636 $5597 -450 -400 -233 -07
OREGON $7688 $5964 $3981 $5935 $6129 -203 28 540 33
PENNSYLVANIA $8372 $6103 $3608 $3914 $3944 -529 -354 93 08
RHODE ISLAND $9087 $6640 $5623 $5798 $5866 -354 -117 43 12
SOUTH CAROLINA $7519 $6280 $3251 $4236 $4587 -390 -270 411 83
SOUTH DAKOTA $8546 $7226 $5369 $6103 $6097 -287 -156 136 -01
TENNESSEE $8841 $8741 $5235 $6880 $7020 -206 -197 341 20
TEXAS $9254 $9644 $7441 $7698 $7611 -178 -211 23 -11
UTAH $8314 $8722 $5848 $7305 $7470 -102 -144 277 23
VERMONT $3485 $2999 $2555 $2481 $2449 -297 -184 -42 -13
VIRGINIA $8472 $6413 $4221 $4944 $5089 -399 -206 205 29
WASHINGTON $7495 $7217 $4170 $5943 $6279 -162 -130 506 57
WEST VIRGINIA $6785 $6430 $4667 $3729 $4027 -407 -374 -137 80
WISCONSIN $9969 $7953 $6324 $6055 $6255 -373 -213 -11 33
WYOMING $12949 $16951 $14766 $16725 $17506 352 33 186 47
US $9547 $8377 $6187 $7224 $7388 -226 -118 194 23
NOTES 1 General operating is the portion of state and local support appropriated directly to public institutions for the purposes of general
operations2 Full-time equivalent (FTE) enrollment converts student credit hours to full-time academic year students but excludes medical students3 Constant dollars adjusted by the Higher Education Cost Adjustment (HECA) Adjustment factors to account for interstate differences
include the Cost of Living Index (COLI) and Enrollment Mix Index (EMI)SOURCE State Higher Education Executive Officers Association State Higher Education Finance Data (httpsshefsheeoorg)
SHEEO INVESTIGATING THE IMPACTS OF STATE HIGHER EDUCATION APPROPRIATIONS AND FINANCIAL AID83
copy 2021 by the State Higher Education Executive Officers Association (SHEEO)
TABLE A2 STATE GRANT AID (CONSTANT ADJUSTED $) BY STATE 2001-2019
STATE GRANT AID (IN MILLIONS) PERCENT CHANGE
STATE 2001 2008 2012 2018 2019 2001-2019 2008-2019 2012-2019 2018-2019
ALABAMA $1348 $3109 $2630 $12074 $9391 5966 2020 2571 -222
ALASKA $188 $070 $570 $1474 $1361 6220 18336 1386 -77
ARIZONA $446 $1458 $1765 $2854 $2726 5111 870 545 -45
ARKANSAS $7232 $5551 $21401 $14818 $13592 880 1448 -365 -83
CALIFORNIA $56406 $79418 $136074 $178418 $176169 2123 1218 295 -13
COLORADO $8090 $9187 $8001 $12723 $13831 710 506 728 87
CONNECTICUT $5616 $6467 $4913 $2906 $2746 -511 -575 -441 -55
DELAWARE $234 $1936 $2099 $2031 $2064 7804 66 -17 17
FLORIDA $46162 $65851 $55700 $71023 $85252 847 295 531 200
GEORGIA $51577 $65873 $69374 $86216 $91865 781 395 324 66
HAWAII $064 $039 $336 $375 $359 4608 8197 66 -43
IDAHO $199 $992 $821 $1371 $1623 7144 637 977 184
ILLINOIS $59042 $51180 $49280 $39938 $39010 -339 -238 -208 -23
INDIANA $18285 $29287 $31618 $38236 $35648 950 217 127 -68
IOWA $8653 $7761 $6999 $6532 $6393 -261 -176 -87 -21
KANSAS $2143 $2552 $2237 $1926 $1915 -107 -250 -144 -06
KENTUCKY $11516 $25720 $24990 $27080 $28593 1483 112 144 56
LOUISIANA $15212 $18507 $24722 $35357 $35803 1354 935 448 13
MAINE $1830 $2122 $1706 $1500 $1517 -171 -285 -110 12
MARYLAND $6628 $10625 $8997 $9363 $8900 343 -162 -11 -49
MASSACHUSETTS $15102 $8918 $8461 $8093 $8536 -435 -43 09 55
MICHIGAN $18278 $26617 $11343 $13678 $13556 -258 -491 195 -09
MINNESOTA $19399 $20155 $18153 $22062 $23097 191 146 272 47
MISSISSIPPI $3861 $3509 $3273 $4586 $5127 328 461 566 118
MISSOURI $8002 $16038 $13188 $14701 $15221 902 -51 154 35
MONTANA $535 $584 $806 $051 $050 -907 -915 -938 -22
NEBRASKA $979 $1642 $1889 $2134 $2017 1062 229 68 -55
NEVADA $2296 $5389 $6751 $5041 $5388 1347 00 -202 69
NEW HAMPSHIRE $208 $415 $- $001 $443 1123 65 479011
NEW JERSEY $27028 $32133 $35834 $42762 $43053 593 340 201 07
NEW MEXICO $6525 $9252 $11607 $8569 $8503 303 -81 -267 -08
NEW YORK $79176 $78830 $85712 $77520 $72667 -82 -78 -152 -63
NORTH CAROLINA $26584 $41664 $43542 $37576 $37124 396 -109 -147 -12
NORTH DAKOTA $187 $490 $1627 $2184 $2065 10030 3211 269 -54
OHIO $29912 $35024 $13930 $15964 $15063 -496 -570 81 -56
OKLAHOMA $5614 $10872 $12387 $11706 $10993 958 11 -112 -61
OREGON $2776 $3944 $4599 $7752 $8486 2057 1151 845 95
PENNSYLVANIA $48262 $55990 $50584 $40634 $37724 -218 -326 -254 -72
RHODE ISLAND $881 $1753 $1344 $950 $928 53 -470 -309 -22
SOUTH CAROLINA $15838 $38473 $39435 $43437 $43798 1765 138 111 08
SOUTH DAKOTA $- $328 $520 $663 $705 1147 355 63
TENNESSEE $5351 $40300 $48527 $51391 $48755 8112 210 05 -51
TEXAS $19356 $71584 $81799 $102709 $110091 4688 538 346 72
UTAH $548 $1457 $1114 $1649 $1944 2547 335 745 179
VERMONT $1997 $2284 $2181 $1856 $1846 -75 -192 -154 -05
VIRGINIA $18875 $23630 $25028 $52577 $56737 2006 1401 1267 79
WASHINGTON $14107 $23564 $31306 $34103 $35741 1534 517 142 48
WEST VIRGINIA $2898 $10502 $12354 $10707 $9183 2169 -126 -257 -142
WISCONSIN $12360 $13282 $13938 $13342 $13228 70 -04 -51 -09
WYOMING $- $023 $2017 $2041 $2048 89411 15 03
US $687807 $966354 $1037485 $1176652 $1192874 734 234 150 14
NOTES 1 State grant aid includes all scholarship and grant aid awarded to undergraduate and graduate students including the small portion
of aid allocated to non-public institutions2 Constant dollars adjusted by the Higher Education Cost Adjustment (HECA) Adjustment factors to account for interstate differences
include the Cost of Living Index (COLI) and Enrollment Mix Index (EMI)3 Asterisks () indicate a state not allocating any grant aid in one or both years of the percent change calculationSOURCE National Association of State Student Grant and Aid Programs 2001 through 2018 data pulled from NASSGAPrsquos Annual
Survey data query tool 2019 pulled from Table 3 History 2004-2019
SHEEO INVESTIGATING THE IMPACTS OF STATE HIGHER EDUCATION APPROPRIATIONS AND FINANCIAL AID84
copy 2021 by the State Higher Education Executive Officers Association (SHEEO)
APPENDIX B
HAS STATE HIGHER EDUCATION FUNDING REALLY DECLINED
Recent reports have used SHEEOrsquos data to question whether state funding for higher education has truly declined over time State higher education finance data can be looked at in many ways (per FTE per capita as a percentage of state budgets including or excluding certain funds using different inflation adjustments and in comparison to different points in history) Most reasonable analyses show a state funding decline but data can be cherry-picked to support a different narrative for those with an agenda Figure 1 below shows a sample of different higher education metrics that can be used for trend analysis While the metrics differ in their cumulative change over time the overall trends are largely stable with increases during economically prosperous times and sharp declines during economic recessions All metrics show a net decline in funding over time although the decline differs in size The largest declines across all metrics occurred during the Great Recession Note that due to data limitations all metrics dating back to 1980 include financial aid which has increased over time unlike general operating appropriations
TABLE B1COMPARING CUMULATIVE PERCENT CHANGE IN MULTIPLE MEASURES OF STATE SUPPORT FOR PUBLIC HIGHER EDUCATION OVER TIME
-8 B
-1 A
-40 F
-27 D
-20 C
-33 E
-50
-30
-10
10
30
198
0
198
1
198
2
198
3
198
4
198
5
198
6
198
7
198
8
198
9
199
0
199
1
199
2
199
3
199
4
199
5
199
6
199
7
199
8
199
9
20
00
20
01
20
02
20
03
20
04
20
05
20
06
20
07
20
08
20
09
20
10
20
11
20
12
20
13
20
14
20
15
20
16
20
17
20
18
20
19
CU
MU
LAT
IVE
PE
RC
EN
T C
HA
NG
E
LEGEND
A State Education Appropriations Per Capita (Inflation Adjusted)
B State Education Appropriations Per FTE (Inflation Adjusted)
C State General Operating Per Capita (Inflation Adjusted)
D State General Operating Per FTE (Inflation Adjusted)
E State General Operating Per $1000 Personal Income
F State Education Appropriations Per $1000 Personal Income
NOTES
1 The most recent data for funding per capita and per $1000 of personal income are fiscal 2018
2 All measures exclude local appropriations State education appropriations include financial aid while state general operating appropriations do not General operating appropriation data are not available until 2001
3 Funding per FTE and per capita are in constant dollars adjusted by the Higher Education Cost Adjustment (HECA)
SOURCE State Higher Education Executive Officers Association State Higher Education Finance Data (httpsshefsheeoorg)
SHEEO INVESTIGATING THE IMPACTS OF STATE HIGHER EDUCATION APPROPRIATIONS AND FINANCIAL AID85
copy 2021 by the State Higher Education Executive Officers Association (SHEEO)
While the type of metric used is important much of the difference in analystrsquos views of the current status of state funding for public higher education comes from the use of different time frames SHEEO regularly compares todayrsquos data to prior years in even increments (1 5 10 15 20 and 25 years) but also includes comparisons to pre-recession levels to demonstrate the magnitude of declines in higher education during economic recessions In general it is most appropriate to compare the current year to prior years at a similar point in the economic cycle The latest data from 2019 represents a high-point prior to a recessionary year (2020) and is most appropriately compared to past pre-recession high points like 2001 and 2008 Some analysts exclude all comparisons except to 1980 the first year in the SHEF dataset However 1980 is a poor starting point it was a recession year and per-student funding in 1980 had declined approximately 74 since 1978 Regardless todayrsquos per-student funding remains below pre-recession funding levels in all but one year since 1980
Inflation indices can also impact the interpretation of trends over time SHEEOrsquos analyses of higher education funding generally use the Higher Education Cost Adjustment (HECA) an inflation index specific to service-based industries However we also examine changes in higher education funding using the Consumer Price Index (CPI) and inflation index for consumer goods The indices are extremely similar over time but result in small differences when viewed over long periods of time It is important to understand when itrsquos appropriate to use each inflation index (ie for a consumer versus state perspective) Both HECA and CPI measure increases in the price of certain items over time CPI is focused on consumer goods like milk and gasoline and does not show the true impact of inflation in service areas that rely more heavily on personnel than consumer goods Higher education is a service about 75 of the cost of higher education goes to personnel so we weight our inflation index accordingly with 75 personnel costs and 25 non-service goods The personnel costs in HECA are not specific to higher education employees and it is not self-referential The inclusion of personnel is important because unlike manufactured goods personnel do not get more efficient and begin to cost less over time Inflation indices like CPI do not correct for this disparity between goods and services (also known as cost disease)
STATE HIGHER EDUCATION EXECUTIVE OFFICERS
3035 CENTER GREEN DRIVE SUITE 100 BOULDER COLORADO 80301 3035411600 bull SHEEOorg
- Table of Contents
- _Hlk62838259
- _Hlk62838580
- _Hlk62839938
- _Hlk57727464
- _Ref63073710
- _Hlk62837095
- _Hlk62840456
- _Hlk57719827
- _Hlk55569431
- _Hlk55567823
- _Hlk61949723
- _Hlk61950233
- _Hlk57778138
- _Hlk61950622
- _Hlk57728163
- _Hlk65158467
- _Hlk62837038
- OLE_LINK1
- OLE_LINK2
- _Hlk57782772
- _Hlk57782852
- _Hlk57778955
- State General Public Operating Appropriations per FTE and FTE Enrollment (Constant $) US 2001-2019
- Change in Education Appropriations per FTE Following Economic Recessions (Constant $) US 1980-2019
- Change in State General Operating Appropriations FY 2001-2019 by State
- State and Local Appropriations per FTE and FTE Enrollment at Two- and Four-Year Institutions (Constant $) US 2001-2017
- State Grant Aid for Need- and Non-Need Programs (Constant $) US 2001-2019
- Changes in Total State Grant Aid (Constant $) US 2001-2019
- State Grant Aid and FTE Enrollment at Two- and Four-Year Institutions (Constant $) US 2001-2017
- Change in State General Operating and Grant Aid per FTE Following Economic Recessions (Constant $) US 1980-2019
- Change in State General Operating and Grant Allocations FY 2001-2019 by State
- Comparison to US Average in State General Operating and Grant Aid Allocations FY 2019 by State
- Breakdown of Total Public Higher Education Revenues US FY 2001-2019
- Flowchart of Review Criteria for State Appropriations Literature Review
- State and Local Appropriations per FTE at Public Institutions by Carnegie Classification (Constant $) US 2001-2017
- Flowchart of Review Criteria for Financial Aid Literature Review
- Comparing Cumulative Percent Change in Multiple Measures of State Support for Public Higher Education Over Time
- Index of Figures
- Index of Tables
- Abstract
- Acknowledgments
- Executive Summary
- Introduction
- Current and Historical Context of State Support for Higher Education
- Prior Literature on the Effects of State Appropriations
- Prior Literature on the Effects of Grant Aid
- Simulated Impacts of State Appropriations and Financial Aid
- Conclusion
- References
- Appendix A
- Appendix B
-