Invesco Asset Management (India) Private Limited 2101-A, 21st Floor, A Wing, Marathon Futurex, N.M....
43
Equity Funds Invesco India Tax Plan Invesco India Multicap Fund Invesco India Contra Fund Invesco India Largecap Fund Invesco India Growth Opportunities Fund Invesco India Midcap Fund Invesco India Smallcap Fund Invesco India Financial Services Fund Invesco India Infrastructure Fund Invesco India PSU Equity Fund Hybrid Funds Invesco India Arbitrage Fund Invesco India Dynamic Equity Fund Invesco India Equity & Bond Fund Invesco India Equity Savings Fund Debt Funds Invesco India Liquid Fund Invesco India Treasury Advantage Fund Invesco India Short Term Fund Invesco India Money Market Fund Invesco India Ultra Short Term Fund Invesco India Credit Risk Fund Invesco India Gilt Fund Invesco India Corporate Bond Fund Invesco India Banking & PSU Debt Fund Fund of Funds Invesco India Feeder - Invesco Pan European Equity Fund Invesco India Feeder - Invesco Global Equity Income Fund Invesco India Gold Fund Exchange Traded Funds Invesco India Gold Exchange Traded Fund Invesco India Nifty Exchange Traded Fund Strengthen your portfolio with Invesco. Fact Sheet November 2019
Transcript of Invesco Asset Management (India) Private Limited 2101-A, 21st Floor, A Wing, Marathon Futurex, N.M....
Invesco Asset Management (India) Private Limited2101-A, 21st Floor, A Wing, Marathon Futurex, N.M. Joshi Marg, Lower Parel, Mumbai - 400 013.Telephone +91 22 6731 0000Fax +91 22 2301 9422
To invest:Call 1800 209 0007SMS ‘invest’ to 56677
www.invescomutualfund.com
Follow us on
Equity FundsInvesco India Tax PlanInvesco India Multicap FundInvesco India Contra FundInvesco India Largecap FundInvesco India Growth Opportunities FundInvesco India Midcap FundInvesco India Smallcap FundInvesco India Financial Services FundInvesco India Infrastructure FundInvesco India PSU Equity Fund
Hybrid FundsInvesco India Arbitrage FundInvesco India Dynamic Equity FundInvesco India Equity & Bond FundInvesco India Equity Savings Fund
Debt FundsInvesco India Liquid FundInvesco India Treasury Advantage FundInvesco India Short Term FundInvesco India Money Market FundInvesco India Ultra Short Term FundInvesco India Credit Risk FundInvesco India Gilt FundInvesco India Corporate Bond FundInvesco India Banking & PSU Debt Fund
Fund of FundsInvesco India Feeder - Invesco Pan European Equity FundInvesco India Feeder - Invesco Global Equity Income FundInvesco India Gold Fund
Exchange Traded FundsInvesco India Gold Exchange Traded FundInvesco India Nifty Exchange Traded Fund
Strengthen your portfoliowith Invesco.
Mutual fund investments are subject to market risks,read all scheme related documents carefully.
Fact SheetNovember 2019
2 of 42
Macro Economic Review The month of November 2019 witnessed Equity indices hitting life time highs. Nifty gained by 1.5% for the month on back of upbeat Q2 corporate earnings whereas 10-year government bond yields were flat with a surplus liquidity in system.The GDP growth continues to moderate down with Q2FY20, real GDP growth of 4.5% yoy. This was despite sharp pick-up in government expenditure (15.6 % YoY growth), without which the real GDP growth would have fallen to post Global Financial Crisis low of 3.1% YoY. Gross Fixed Capital Formation fell to 1.0% YoY while a small silver lining was Private consumption growth which rebounded slightly to 5.1% YoY in Q2FY20 (vs. 3.1%). The gross value added (GVA) growth decelerated to 4.3 per cent in Q2FY20, pulled down by a contraction in manufacturing.The contraction in output of eight core industries – which constitute 40 per cent of the index of industrial production (IIP) – extended into the second consecutive month in October and became more pronounced, dragged down by coal, electricity, cement, natural gas and crude oil.The headline CPI inflation clocked 4.6%YoY (+0.6pp) on the back of sharp spike in food inflation. However, core inflationary trends remained subdued at 3.5%YoY. The Food & Beverage inflation jumped to 6.9% YoY led by vegetable prices (~26% vs ~16%). The sharp pickup is primarily led by a supply side shock in the agriculture sector in an otherwise demand-constrained economy. The base effect will turn adverse for headline inflation going ahead and the headline numbers will continue to trend higher. The MPC (Monetary Policy Committee) will have to deal with an interesting challenge going ahead of dealing with slower growth and high CPI numbers.The trade deficit for 7MFY20 came in at USD 95 billion. Merchandise exports fell by 1.1% in the month of October (third consecutive month of contraction), while imports fell for the fifth month in a row by 16.3%, driven by a fall in petroleum, coal and precious stones leading to a trade deficit of $11 billion. Continuing trade tensions and a slowing global economy have prompted the World Trade Organization to sharply downgrade its trade growth forecast for 2019 and 2020.The Fiscal deficit as for 7MFY20 stands at 102.4% of budgeted (vs. ~100% last year) driven by a record shortfall in gross tax revenue and would have been ~110% of budgeted estimates if not for the excess dividend from RBI. The falling tax revenues have further compounded the woes for the government. The Gross tax revenue growth has fallen to a decadal low, growing at an anemic 1.2%YoY. The fall was broad-based with major constituents like Excise, import duties and Centre’s share of GST falling short of budgeted targets. The shortfall is more pronounced in excise and import duty which were down 4.0% YoY and 15% YoY respectively. CCEA (Cabinet Committee On Economic Affairs) gave in-principle approval for strategic disinvestment of government stake in 5 PSUs including BPCL and Container Corporation. These strategic sales become necessary for government to meet its disinvestment target of Rs1.05 trillion as well as maintain the fiscal deficit.The Overall macro data on domestic as well as global front continued to show slow-down. In face of benign inflation globally, Central Banks have continued to ease policy rates. As the impact of lower rates continues to diminish, talks of fiscal stimulus continues to gather momentum globally. We believe that incrementally the Government and RBI will have to pay heed to such a necessity. Government’s options are limited in face of slow growth and fiscal constraints. RBI has done its bit by reducing rates 135 bps ytd and has yet to see full transmission of rates in the economy. Going forward, it will have to take a calibrated approach rather than data driven approach. It seems recovery if any will be slow.
Equity MarketThe BSE-30 Index and Nifty-50 Index were up 1.7% and 1.5% respectively in November. Investor sentiments were broadly positive with the government taking some further pro-growth steps like approval of stake sale in certain PSUs, a Rs.250 bn booster package for the real estate sector and indicating their intent to carry out labor reforms through introduction of a new bill in the parliament. In terms of sectors, telecom was a clear outperformer with tariff hikes and some spectrum relief bringing back interest whereas financials - particularly public sector banks were at the second spot as both Essar Steel verdict and government’s move to bring financial institutions under the ambit of IBC (Insolvency and Bankruptcy Code) stoked optimism. Auto and Capital goods indices were the worst performing sectors. On the global front, situation in HK escalated and President Trump signed the HK Bill backing the protesters even as the discussions with China over trade deal were still ongoing. India’s real GDP growth moderated sharply to 4.5% in 2QFY20 from 5% in 1QFY20. In terms of India’s domestic economic activity indicators, barring consumer credit growth and electricity consumption, most other indicators like auto sales (wholesale), consumer durable production continues to remain weak. FPIs invested US$3.3 bn while DIIs (Domestic Institutional Investors) sold US$1.1 bn worth of equities.We continue to maintain that at a global level most central banks around the world would continue being in an easing mode and with US-China trade talks once again assuming the right direction, conditions for improved global economic activity and price inflation are developing. This should in turn augur well for risk assets such as equity.Ongoing local economic indicators continue to demonstrate pressure with the latest GDP growth coming at a 6-year low, but medium-term, our positive outlook on the economy is premised on improving macro factors - controlled inflation, stable commodity prices/currency and continuing moderation of interest rates. Even as the central bank has chosen to put rate cuts on hold in its latest policy meet in view of inflation spikes resulting out of short term aberration in price of a few food commodities, it has reiterated maintaining its accommodative stance. This coupled with recent govt. policy measures such as corporate tax cut, good monsoons and accelerating rural spends should aid India’s growth recovery. Moreover, it may be important to highlight that some quantum of food inflation is desirable from the perspective of aiding rural income growth and remains our base case expectation. Improvement in global conditions should likely benefit India through stabilisation of exports, rising WPI and improving liquidity. In the meanwhile, continuing on measures to ease system liquidity thereby enabling steady recovery in overall credit growth especially out of NBFCs will likely be critical.
Market Update

3 of 42
From a portfolio management standpoint, we restrict ourselves to a bottom-up approach to stock selection and portfolio construction until stronger evidence of more broad-based growth emerges. Given the extent of the slowdown across various sectors of the domestic economy, we would also like to keep our outlook on business growth recovery muted for the next couple of quarters even though the recent tax cut should aid overall earnings growth this fiscal. We prefer to evaluate investment propositions based on flat to weak growth assumptions for the ensuing future and resultant price to intrinsic value equation. We continue to be wary of balance-sheet related risks to businesses.
Fixed Income MarketThe bond yields have mostly stayed elevated over the last month. Post the print of 4.5% GDP growth for Q2FY20 there was some rise in long bond prices as expectations rose for additional repo rate reduction. However, the expectations were short lived as later in 1st week of Dec’19 the MPC (Monetary Policy Committee) members unanimously decided the keep the rates unchanged. The MPC members want to wait out. • To see the outcome of the rising headline inflation(which has been rising for the last 2 months on back
of rising food prices and expected to stay elevated for the next 4-6 months, before it moderates) • And giving more time to see the result of the 135bps cumulative repo rate reduction so far from
Feb’19, rather than ‘mechanically’ continue the rate reduction in every meeting• And await to see the other countercyclical measures to be announced by the government to arrest the
slowdown in economic growthWe feel that the MPC members have attached higher importance to the recent ‘temporary’ rise in headline inflation led by rise in food price inflation over economic growth. Bond yields have remained elevated for the last 3-4 months despite rate reductions so far due to fears of additional G-sec supply by the government in order to make up for the reduced tax revenues and need to spend more during periods of slower economic growth.The MPC members have kept the monetary policy stance unchanged at accommodative in order to retain the option for further rate reductions. However, the abrupt halt to the rate reduction glide path has been a jolt for the market and we expect the bonds yields to remain elevated as a result of this and also due to fears of additional G-sec supply in the last quarter of FY20. We do agree that by retaining the stance as accommodative the repo rates may be lowered further in future however the sudden ‘halt’ despite deeper drop in the economic growth data will create uncertainty in the minds of the investors.Last month the headline CPI has moved up from 3.99% to 4.62% mostly due to the rise in the food prices attributed to the unseasonal rains, while the core (inflation ex food and fuel) inflation dropped closer to 3.4%. We expect the future course of rate action will be dictated by• Growth inflation dynamics and • Progress of transmission of lower rates into the credit marketThe room for further rate reduction would depend on the growth and inflation trajectory. While the MPC members feel that there is space for rate reduction, the decision to press the ‘pause’ button when the growth is at a multi-year low give rise to uncertainties in the minds of the investors. However, the factors led by • Softening international oil prices as growth slows in several other global economies.• Improved sentiment amongst foreign investors leading to positive foreign inflows into debt• The drop in global yields particularly in US and Europe improves the relative attractiveness of the EM
(Emerging Market) bonds.• Possible inclusion of Indian bonds in international bond indices Remain intact and should attract foreign investor flows into Indian debt market.Moreover, based on RBI’s suasion, few banks have started to link their lending rates to an external benchmark which RBI feels will work towards transmission of rates. So far the transmission of lower rates into the system has been mostly in high quality credits due to risk aversion. The drop in interest rates should help in balancing the overall leverage and ideally help in attracting equity capital as earnings from savings and debt investments become unappealing. However, it remains to be seen whether this theoretical cycle follows through in India in this environment.Outlook –We reason that the slowing domestic growth is a function of both slowing global growth and slowing domestic consumption. The average headline CPI (presently at 4.62%) for FY20 is expected to be comfortably well within 4% due to benign oil prices, drop in core inflation and soft food prices (although there is some rise in vegetable prices in the recent period). The drop in core inflation in India to ~ 3.4% levels in the recent months after staying at over 5.5% for the last few years highlights the slowing domestic consumption. While, slowing growth and accommodative monetary policy stance gives room for further rate reduction, we think that further policy actions will be guided by evolving growth-inflation dynamics.Amid mix of positives (mainly accommodative monetary policy stance & surplus liquidity) and negatives (mainly due to rising inflation & fears of fiscal slippage), we feel that benchmark yields are expected to remain range bound.Since majority of the debt investors so far were expecting a rate reduction of a minimum 25 bps, a status quo rates decision may see some unwinding in the near term. Over the month, the market direction will be dictated by RBI’s actions to infuse durable liquidity and government’s decision on the steps to meet the potential fiscal slippage. Any upward revision in borrowing calendar of Government for FY20 may also pose upward pressure on yields.In this environment we urge investors to select funds in alignment with their investment horizon and depending on their individual risk appetite and of high credit quality. The transmission of lower rates into the credit markets may get delayed due to the pause in the rate reduction trajectory. While possibilities of an OMO (Open Market Operations) (to infuse durable liquidity) and TARP (Troubled Asset Relief Plan): to buy the non-performing assets from investor books have not been announced yet and not completely ruled out, any announcement of this nature will go a long way in bringing about financial stability, infuse liquidity, improve risk appetite and help in rates transmission.Source: Bloomberg, Internal
Market Update Contd...
4 of 42
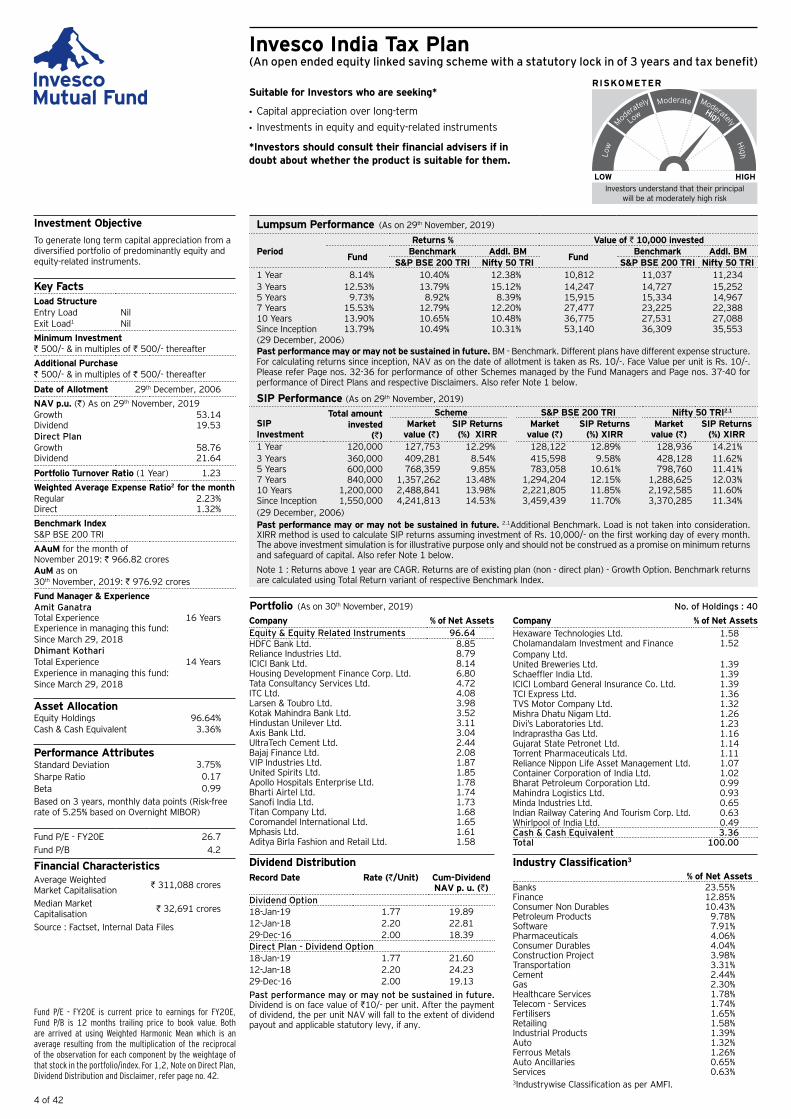
Invesco India Tax Plan(An open ended equity linked saving scheme with a statutory lock in of 3 years and tax benefit)
RISKOMETER
Investors understand that their principal will be at moderately high risk
Suitable for Investors who are seeking*
l Capital appreciation over long-terml Investments in equity and equity-related instruments
*Investors should consult their financial advisers if in doubt about whether the product is suitable for them.
Industry Classification3
% of Net AssetsBanks 23.55%Finance 12.85%Consumer Non Durables 10.43%Petroleum Products 9.78%Software 7.91%Pharmaceuticals 4.06%Consumer Durables 4.04%Construction Project 3.98%Transportation 3.31%Cement 2.44%Gas 2.30%Healthcare Services 1.78%Telecom - Services 1.74%Fertilisers 1.65%Retailing 1.58%Industrial Products 1.39%Auto 1.32%Ferrous Metals 1.26%Auto Ancillaries 0.65%Services 0.63%3Industrywise Classification as per AMFI.
Dividend DistributionRecord Date Rate (R/Unit) Cum-Dividend
NAV p. u. (R)Dividend Option18-Jan-19 1.77 19.8912-Jan-18 2.20 22.8129-Dec-16 2.00 18.39Direct Plan - Dividend Option18-Jan-19 1.77 21.6012-Jan-18 2.20 24.2329-Dec-16 2.00 19.13Past performance may or may not be sustained in future. Dividend is on face value of R10/- per unit. After the payment of dividend, the per unit NAV will fall to the extent of dividend payout and applicable statutory levy, if any.
Investment ObjectiveTo generate long term capital appreciation from a diversified portfolio of predominantly equity and equity-related instruments.
Key FactsLoad Structure Entry Load Nil Exit Load1 Nil
Minimum Investment R 500/- & in multiples of R 500/- thereafter
Additional PurchaseR 500/- & in multiples of R 500/- thereafter
Date of Allotment 29th December, 2006
NAV p.u. (R) As on 29th November, 2019Growth 53.14 Dividend 19.53 Direct PlanGrowth 58.76 Dividend 21.64
Portfolio Turnover Ratio (1 Year) 1.23
Weighted Average Expense Ratio2 for the monthRegular 2.23%Direct 1.32%
Benchmark IndexS&P BSE 200 TRI
AAuM for the month of November 2019: R 966.82 croresAuM as on30th November, 2019: R 976.92 crores
Fund Manager & ExperienceAmit GanatraTotal Experience 16 Years Experience in managing this fund: Since March 29, 2018Dhimant KothariTotal Experience 14 Years Experience in managing this fund: Since March 29, 2018
Asset AllocationEquity Holdings 96.64%Cash & Cash Equivalent 3.36%
Performance AttributesStandard Deviation 3.75%Sharpe Ratio 0.17Beta 0.99Based on 3 years, monthly data points (Risk-free rate of 5.25% based on Overnight MIBOR)
Fund P/E - FY20E 26.7Fund P/B 4.2
Financial CharacteristicsAverage Weighted Market Capitalisation r 311,088 crores
Median Market Capitalisation r 32,691 crores
Source : Factset, Internal Data Files
Portfolio (As on 30th November, 2019) No. of Holdings : 40Company % of Net AssetsEquity & Equity Related Instruments 96.64HDFC Bank Ltd. 8.85Reliance Industries Ltd. 8.79ICICI Bank Ltd. 8.14Housing Development Finance Corp. Ltd. 6.80Tata Consultancy Services Ltd. 4.72ITC Ltd. 4.08Larsen & Toubro Ltd. 3.98Kotak Mahindra Bank Ltd. 3.52Hindustan Unilever Ltd. 3.11Axis Bank Ltd. 3.04UltraTech Cement Ltd. 2.44Bajaj Finance Ltd. 2.08VIP Industries Ltd. 1.87United Spirits Ltd. 1.85Apollo Hospitals Enterprise Ltd. 1.78Bharti Airtel Ltd. 1.74Sanofi India Ltd. 1.73Titan Company Ltd. 1.68Coromandel International Ltd. 1.65Mphasis Ltd. 1.61Aditya Birla Fashion and Retail Ltd. 1.58
Company % of Net AssetsHexaware Technologies Ltd. 1.58Cholamandalam Investment and Finance Company Ltd.
1.52
United Breweries Ltd. 1.39Schaeffler India Ltd. 1.39ICICI Lombard General Insurance Co. Ltd. 1.39TCI Express Ltd. 1.36TVS Motor Company Ltd. 1.32Mishra Dhatu Nigam Ltd. 1.26Divi’s Laboratories Ltd. 1.23Indraprastha Gas Ltd. 1.16Gujarat State Petronet Ltd. 1.14Torrent Pharmaceuticals Ltd. 1.11Reliance Nippon Life Asset Management Ltd. 1.07Container Corporation of India Ltd. 1.02Bharat Petroleum Corporation Ltd. 0.99Mahindra Logistics Ltd. 0.93Minda Industries Ltd. 0.65Indian Railway Catering And Tourism Corp. Ltd. 0.63Whirlpool of India Ltd. 0.49Cash & Cash Equivalent 3.36Total 100.00
Lumpsum Performance (As on 29th November, 2019)
PeriodReturns % Value of r 10,000 invested
FundBenchmark Addl. BM
FundBenchmark Addl. BM
S&P BSE 200 TRI Nifty 50 TRI S&P BSE 200 TRI Nifty 50 TRI1 Year 8.14% 10.40% 12.38% 10,812 11,037 11,2343 Years 12.53% 13.79% 15.12% 14,247 14,727 15,2525 Years 9.73% 8.92% 8.39% 15,915 15,334 14,9677 Years 15.53% 12.79% 12.20% 27,477 23,225 22,38810 Years 13.90% 10.65% 10.48% 36,775 27,531 27,088Since Inception 13.79% 10.49% 10.31% 53,140 36,309 35,553(29 December, 2006)Past performance may or may not be sustained in future. BM - Benchmark. Different plans have different expense structure. For calculating returns since inception, NAV as on the date of allotment is taken as Rs. 10/-. Face Value per unit is Rs. 10/-. Please refer Page nos. 32-36 for performance of other Schemes managed by the Fund Managers and Page nos. 37-40 for performance of Direct Plans and respective Disclaimers. Also refer Note 1 below.
SIP Performance (As on 29th November, 2019)
SIPInvestment
Total amountinvested
(R)
Scheme S&P BSE 200 TRI Nifty 50 TRI2.1
Market value (R)
SIP Returns (%) XIRR
Market value (R)
SIP Returns (%) XIRR
Market value (R)
SIP Returns (%) XIRR
1 Year 120,000 127,753 12.29% 128,122 12.89% 128,936 14.21%3 Years 360,000 409,281 8.54% 415,598 9.58% 428,128 11.62%5 Years 600,000 768,359 9.85% 783,058 10.61% 798,760 11.41%7 Years 840,000 1,357,262 13.48% 1,294,204 12.15% 1,288,625 12.03%10 Years 1,200,000 2,488,841 13.98% 2,221,805 11.85% 2,192,585 11.60%Since Inception 1,550,000 4,241,813 14.53% 3,459,439 11.70% 3,370,285 11.34%(29 December, 2006)Past performance may or may not be sustained in future. 2.1Additional Benchmark. Load is not taken into consideration. XIRR method is used to calculate SIP returns assuming investment of Rs. 10,000/- on the first working day of every month. The above investment simulation is for illustrative purpose only and should not be construed as a promise on minimum returns and safeguard of capital. Also refer Note 1 below.
Note 1 : Returns above 1 year are CAGR. Returns are of existing plan (non - direct plan) - Growth Option. Benchmark returns are calculated using Total Return variant of respective Benchmark Index.
Fund P/E - FY20E is current price to earnings for FY20E, Fund P/B is 12 months trailing price to book value. Both are arrived at using Weighted Harmonic Mean which is an average resulting from the multiplication of the reciprocal of the observation for each component by the weightage of that stock in the portfolio/index. For 1,2, Note on Direct Plan, Dividend Distribution and Disclaimer, refer page no. 42.

5 of 42
Invesco India Multicap Fund(Multi Cap Fund - An open ended equity scheme investing across large cap, mid cap, small cap stocks)
RISKOMETER
Investors understand that their principal will be at moderately high risk
Suitable for Investors who are seeking*
l Capital appreciation over long-terml Investments in equity and equity related instruments
across market capitalization
*Investors should consult their financial advisers if in doubt about whether the product is suitable for them.
Industry Classification3
% of Net AssetsBanks 22.81%Consumer Durables 9.00%Finance 7.52%Pharmaceuticals 7.34%Software 6.45%Retailing 5.76%Consumer Non Durables 5.17%Auto Ancillaries 4.43%Transportation 3.47%Industrial Products 3.33%Auto 2.74%Chemicals 2.68%Gas 2.62%Healthcare Services 2.45%Pesticides 2.34%Telecom - Services 2.27%Construction 2.05%Construction Project 1.51%Petroleum Products 0.96%Services 0.50%3Industrywise Classification as per AMFI.
Dividend DistributionRecord Date Rate (R/Unit) Cum-Dividend
NAV p. u. (R)Dividend Option08-Aug-14 2.50 26.91Direct Plan - Dividend Option08-Aug-14 2.55 27.30Past performance may or may not be sustained in future. Dividend is on face value of R10/- per unit. After the payment of dividend, the per unit NAV will fall to the extent of dividend payout and applicable statutory levy, if any.
Investment ObjectiveTo generate capital appreciation by investing predominantly in Equity and Equity Related Instruments across market capitalization.
Key FactsLoad Structure Entry Load Nil Exit Load1 • Nil - if upto 10% of Units allotted
are redeemed / switched-out within 1 year from the date of allotment.
• 1% - for any redemption / switch-out in excess of 10% of units allotted within one year from the date of allotment.
• Nil - if units are redeemed or switched-out after 1 year from the date of allotment.
Switch between the Plans under the Scheme, please refer page no. 42.
Minimum Investment R 1,000/- & in multiples of R 1/- thereafter
Additional PurchaseR 1,000/- & in multiples of R 1/- thereafter
Date of Allotment 17th March, 2008
NAV p.u. (R) As on 29th November, 2019Growth 48.43 Dividend 43.92 Direct PlanGrowth 53.54 Dividend 48.48
Portfolio Turnover Ratio (1 Year) 0.62
Weighted Average Expense Ratio2 for the monthRegular 2.36%Direct 1.21%
Benchmark IndexS&P BSE AllCap TRI
AAuM for the month of November 2019: R 846.68 croresAuM as on30th November, 2019: R 842.50 crores
Fund Manager & ExperienceTaher BadshahTotal Experience 24 Years Experience in managing this fund: Since March 29, 2018Pranav GokhaleTotal Experience 15 Years Experience in managing this fund: Since March 29, 2018
Asset AllocationEquity Holdings 95.40%Cash & Cash Equivalent 4.60%
Performance AttributesStandard Deviation 4.50%Sharpe Ratio 0.08Beta 1.07Based on 3 years, monthly data points (Risk-free rate of 5.25% based on Overnight MIBOR)
Fund P/E - FY20E 26.9Fund P/B 4.4
Financial CharacteristicsAverage Weighted Market Capitalisation r 123,498 crores
Median Market Capitalisation r 16,371 crores
Source : Factset, Internal Data Files
Portfolio (As on 30th November, 2019) No. of Holdings : 41Company % of Net AssetsEquity & Equity Related Instruments 95.40HDFC Bank Ltd. 8.89ICICI Bank Ltd. 6.94Infosys Ltd. 4.22Axis Bank Ltd. 3.27TVS Motor Company Ltd. 2.74Sanofi India Ltd. 2.72Aditya Birla Fashion and Retail Ltd. 2.71Cholamandalam Investment and Finance Co. Ltd. 2.69Vinati Organics Ltd. 2.68Orient Electric Ltd. 2.64Indraprastha Gas Ltd. 2.62United Spirits Ltd. 2.56Whirlpool of India Ltd. 2.45Apollo Hospitals Enterprise Ltd. 2.45Torrent Pharmaceuticals Ltd. 2.45City Union Bank Ltd. 2.45VIP Industries Ltd. 2.42Rallis India Ltd. 2.34Bharti Airtel Ltd. 2.27Mphasis Ltd. 2.23Ajanta Pharma Ltd. 2.17
Company % of Net AssetsPNC Infratech Ltd. 2.05Schaeffler India Ltd. 2.05Indiamart Intermesh Ltd. 1.87ICICI Lombard General Insurance Co. Ltd. 1.83TCI Express Ltd. 1.73Mahindra Logistics Ltd. 1.73Motherson Sumi Systems Ltd. 1.57Equitas Holdings Ltd. 1.53United Breweries Ltd. 1.51Rail Vikas Nigam Ltd. 1.51Minda Industries Ltd. 1.49Titan Company Ltd. 1.49Multi Commodity Exchange of India Ltd. 1.46Exide Industries Ltd. 1.36Timken India Ltd. 1.29Bandhan Bank Ltd. 1.26V-Mart Retail Ltd. 1.19Heritage Foods Ltd. 1.09Gulf Oil Lubricants India Ltd. 0.96Indian Railway Catering And Tourism Corp. Ltd. 0.50Cash & Cash Equivalent 4.60Total 100.00
Lumpsum Performance (As on 29th November, 2019)
PeriodReturns % Value of r 10,000 invested
FundBenchmark Addl. BM
FundBenchmark Addl. BM
S&P BSE AllCap TRI Nifty 50 TRI S&P BSE AllCap TRI Nifty 50 TRI1 Year 4.84% 8.33% 12.38% 10,483 10,831 11,2343 Years 8.74% 12.40% 15.12% 12,856 14,196 15,2525 Years 7.95% 8.30% 8.39% 14,662 14,908 14,9677 Years 16.00% 12.40% 12.20% 28,256 22,664 22,38810 Years 16.61% 10.36% 10.48% 46,523 26,811 27,088Since Inception 14.42% 10.15% 10.10% 48,430 31,030 30,865(17 March, 2008)Past performance may or may not be sustained in future. BM - Benchmark. Different plans have different expense structure. For calculating returns since inception, NAV as on the date of allotment is taken as Rs. 10/-. Face Value per unit is Rs. 10/-. Please refer Page nos. 32-36 for performance of other Schemes managed by the Fund Managers and Page nos. 37-40 for performance of Direct Plans and respective Disclaimers. Also refer Note 1 below.
SIP Performance (As on 29th November, 2019)
SIPInvestment
Total amountinvested
(R)
Scheme S&P BSE AllCap TRI Nifty 50 TRI2.1
Market value (R)
SIP Returns (%) XIRR
Market value (R)
SIP Returns (%) XIRR
Market value (R)
SIP Returns (%) XIRR
1 Year 120,000 126,767 10.71% 126,721 10.63% 128,936 14.21%3 Years 360,000 379,976 3.55% 402,100 7.34% 428,128 11.62%5 Years 600,000 706,763 6.50% 758,446 9.32% 798,760 11.41%7 Years 840,000 1,305,363 12.39% 1,261,067 11.42% 1,288,625 12.03%Since Inception – – – – – – –(17 March, 2008)Past performance may or may not be sustained in future. 2.1Additional Benchmark. Returns for other periods not available as the Scheme was close-ended and re-opened for purchase on March 18, 2011, first SIP installment is taken as April 1, 2011. Load is not taken into consideration. XIRR method is used to calculate SIP returns assuming investment of Rs. 10,000/- on the first working day of every month. The above investment simulation is for illustrative purpose only and should not be construed as a promise on minimum returns and safeguard of capital. Also refer Note 1 below.
Note 1 : Returns above 1 year are CAGR. Returns are of existing plan (non - direct plan) - Growth Option. Benchmark returns are calculated using Total Return variant of respective Benchmark Index.
Fund P/E - FY20E is current price to earnings for FY20E, Fund P/B is 12 months trailing price to book value. Both are arrived at using Weighted Harmonic Mean which is an average resulting from the multiplication of the reciprocal of the observation for each component by the weightage of that stock in the portfolio/index. For 1,2, Note on Direct Plan, Dividend Distribution and Disclaimer, refer page no. 42.

6 of 42
Invesco India Contra Fund(An open ended equity scheme following contrarian investment strategy)
RISKOMETER
Investors understand that their principal will be at moderately high risk
Suitable for Investors who are seeking*
l Capital appreciation over long-terml Investments predominantly in equity and equity related
instruments through contrarian investing.
*Investors should consult their financial advisers if in doubt about whether the product is suitable for them.
Industry Classification3
% of Net AssetsBanks 25.12%Software 10.63%Auto 7.43%Petroleum Products 7.18%Consumer Non Durables 6.26%Pharmaceuticals 6.14%Finance 5.16%Construction Project 4.62%Auto Ancillaries 3.50%Power 3.25%Telecom - Services 2.99%Gas 2.94%Healthcare Services 2.27%Fertilisers 1.67%Retailing 1.63%Cement 1.42%Transportation 1.33%Consumer Durables 1.27%Industrial Capital Goods 1.11%Non - Ferrous Metals 1.06%Ferrous Metals 0.70%Construction 0.56%Media & Entertainment 0.13%3Industrywise Classification as per AMFI.
Dividend DistributionRecord Date Rate (R/Unit) Cum-Dividend
NAV p. u. (R)Dividend Option28-Mar-19 2.07 26.1923-Mar-18 3.25 27.1811-Apr-17 2.60 26.09Direct Plan - Dividend Option28-Mar-19 2.07 30.8823-Mar-18 3.25 31.1111-Apr-17 2.60 29.07Past performance may or may not be sustained in future. Dividend is on face value of R10/- per unit. After the payment of dividend, the per unit NAV will fall to the extent of dividend payout and applicable statutory levy, if any.
Investment ObjectiveTo generate capital appreciation by investing predominantly in Equity and Equity Related Instruments through contrarian investing.
Key FactsLoad Structure Entry Load Nil Exit Load1 • Nil - if upto 10% of Units allotted
are redeemed / switched-out within 1 year from the date of allotment.
• 1% - for any redemption / switch-out in excess of 10% of units allotted within one year from the date of allotment.
• Nil - if units are redeemed or switched-out after 1 year from the date of allotment.
Switch between the Plans under the Scheme, please refer page no. 42.
Minimum Investment R 1,000/- & in multiples of R 1/- thereafter
Additional PurchaseR 1,000/- & in multiples of R 1/- thereafter
Date of Allotment 11th April, 2007
NAV p.u. (R) As on 29th November, 2019Growth 48.90 Dividend 24.10 Direct PlanGrowth 53.60 Dividend 29.04
Portfolio Turnover Ratio (1 Year) 1.06
Weighted Average Expense Ratio2 for the monthRegular 1.92%Direct 0.97%
Benchmark IndexS&P BSE 500 TRI
AAuM for the month of November 2019: R 4,504.70 croresAuM as on30th November, 2019: R 4,557.63 crores
Fund Manager & ExperienceTaher BadshahTotal Experience 24 Years Experience in managing this fund: Since January 13, 2017Amit GanatraTotal Experience 16 Years Experience in managing this fund: Since August 14, 2012
Asset AllocationEquity Holdings 98.39%Cash & Cash Equivalent 1.61%
Performance AttributesStandard Deviation 4.00%Sharpe Ratio 0.18Beta 1.02Based on 3 years, monthly data points (Risk-free rate of 5.25% based on Overnight MIBOR)
Fund P/E - FY20E 20.2Fund P/B 2.9
Financial CharacteristicsAverage Weighted Market Capitalisation r 231,178 crores
Median Market Capitalisation r 24,406 crores
Source : Factset, Internal Data Files
Portfolio (As on 30th November, 2019) No. of Holdings : 51Company % of Net AssetsEquity & Equity Related Instruments 98.39ICICI Bank Ltd. 8.91HDFC Bank Ltd. 8.44Reliance Industries Ltd. 6.05Infosys Ltd. 4.96Larsen & Toubro Ltd. 4.15ITC Ltd. 4.08Axis Bank Ltd. 3.54Bharti Airtel Ltd. 2.99Sun Pharmaceutical Industries Ltd. 2.77State Bank of India 2.69Apollo Hospitals Enterprise Ltd. 2.27HCL Technologies Ltd. 2.25Cholamandalam Investment and Finance Company Ltd.
2.19
NTPC Ltd. 1.84Gujarat State Petronet Ltd. 1.79Maruti Suzuki India Ltd. 1.78United Spirits Ltd. 1.76Coromandel International Ltd. 1.67Aditya Birla Fashion and Retail Ltd. 1.63IndusInd Bank Ltd. 1.54Tech Mahindra Ltd. 1.53Escorts Ltd. 1.48Bajaj Auto Ltd. 1.46UltraTech Cement Ltd. 1.42Torrent Power Ltd. 1.41
Company % of Net AssetsTVS Motor Company Ltd. 1.38Hexaware Technologies Ltd. 1.36Exide Industries Ltd. 1.34Equitas Holdings Ltd. 1.31Orient Electric Ltd. 1.27Ajanta Pharma Ltd. 1.25Mahanagar Gas Ltd. 1.16Bharat Petroleum Corporation Ltd. 1.13Motherson Sumi Systems Ltd. 1.12Bharat Electronics Ltd. 1.11Torrent Pharmaceuticals Ltd. 1.09National Aluminium Company Ltd. 1.06Tube Investments of India Ltd. 1.04Cipla Ltd. 1.03Central Depository Services (India) Ltd. 0.86Ashok Leyland Ltd. 0.81Motilal Oswal Financial Services Ltd. 0.80Container Corporation of India Ltd. 0.76Mishra Dhatu Nigam Ltd. 0.70The Great Eastern Shipping Company Ltd. 0.56KNR Constructions Ltd. 0.56Mphasis Ltd. 0.52Tata Motors Ltd. 0.51Rail Vikas Nigam Ltd. 0.48Apex Frozen Foods Ltd. 0.42Music Broadcast Ltd. 0.13Cash & Cash Equivalent 1.61Total 100.00
Lumpsum Performance (As on 29th November, 2019)
PeriodReturns % Value of r 10,000 invested
FundBenchmark Addl. BM
Fund Benchmark Addl. BMS&P BSE 500 TRI Nifty 50 TRI S&P BSE 500 TRI Nifty 50 TRI
1 Year 6.37% 9.19% 12.38% 10,635 10,916 11,2343 Years 13.59% 13.00% 15.12% 14,649 14,423 15,2525 Years 10.59% 8.62% 8.39% 16,548 15,126 14,9677 Years 16.39% 12.54% 12.20% 28,935 22,865 22,38810 Years 13.22% 10.48% 10.48% 34,632 27,100 27,088Since Inception 13.38% 10.83% 10.74% 48,900 36,688 36,337(11 April, 2007)Past performance may or may not be sustained in future. BM - Benchmark. Different plans have different expense structure. For calculating returns since inception, NAV as on the date of allotment is taken as Rs. 10/-. Face Value per unit is Rs. 10/-. Please refer Page nos. 32-36 for performance of other Schemes managed by the Fund Managers and Page nos. 37-40 for performance of Direct Plans and respective Disclaimers. Also refer Note 1 below.
SIP Performance (As on 29th November, 2019)
SIPInvestment
Total amountinvested
(R)
Scheme S&P BSE 500 TRI Nifty 50 TRI2.1
Market value (R)
SIP Returns (%) XIRR
Market value (R)
SIP Returns (%) XIRR
Market value (R)
SIP Returns (%) XIRR
1 Year 120,000 125,915 9.34% 127,256 11.49% 128,936 14.21%3 Years 360,000 404,600 7.76% 407,087 8.17% 428,128 11.62%5 Years 600,000 780,553 10.48% 768,461 9.85% 798,760 11.41%7 Years 840,000 1,421,717 14.79% 1,275,960 11.75% 1,288,625 12.03%10 Years 1,200,000 2,562,175 14.52% 2,185,232 11.54% 2,192,585 11.60%Since Inception 1,520,000 4,129,774 14.74% 3,287,014 11.49% 3,262,439 11.39%(11 April, 2007)Past performance may or may not be sustained in future. 2.1Additional Benchmark. Load is not taken into consideration. XIRR method is used to calculate SIP returns assuming investment of Rs. 10,000/- on the first working day of every month. The above investment simulation is for illustrative purpose only and should not be construed as a promise on minimum returns and safeguard of capital. Also refer Note 1 below. Note 1 : Returns above 1 year are CAGR. Returns are of existing plan (non - direct plan) - Growth Option. Benchmark returns are calculated using Total Return variant of respective Benchmark Index.
Fund P/E - FY20E is current price to earnings for FY20E, Fund P/B is 12 months trailing price to book value. Both are arrived at using Weighted Harmonic Mean which is an average resulting from the multiplication of the reciprocal of the observation for each component by the weightage of that stock in the portfolio/index. For 1,2, Note on Direct Plan, Dividend Distribution and Disclaimer, refer page no. 42.

7 of 42
Invesco India Largecap Fund(Large Cap Fund - An open ended equity scheme predominantly investing in large cap stocks)
RISKOMETER
Investors understand that their principal will be at moderately high risk
Suitable for Investors who are seeking*
l Capital appreciation over long-terml Investments predominantly in equity and equity-related instruments
of largecap companies
*Investors should consult their financial advisers if in doubt about whether the product is suitable for them.
Industry Classification3
% of Net AssetsBanks 23.23%Finance 14.87%Software 11.47%Petroleum Products 11.29%Consumer Non Durables 9.43%Pharmaceuticals 7.55%Construction Project 5.59%Consumer Durables 3.69%Gas 1.81%Cement 1.79%Auto 1.65%Retailing 1.65%Ferrous Metals 1.52%Healthcare Services 1.45%Transportation 1.31%3Industrywise Classification as per AMFI.
Dividend DistributionRecord Date Rate (R/Unit) Cum-Dividend
NAV p. u. (R)Dividend Option29-May-17 1.70 17.7722-Mar-16 1.90 16.0828-Nov-14 2.00 18.30Direct Plan - Dividend Option29-May-17 1.70 18.7522-Mar-16 1.90 16.6228-Nov-14 2.20 18.63Past performance may or may not be sustained in future. Dividend is on face value of R10/- per unit. After the payment of dividend, the per unit NAV will fall to the extent of dividend payout and applicable statutory levy, if any.
Investment ObjectiveTo generate capital appreciation by investing predominantly in Largecap companies.
Key FactsLoad Structure Entry Load Nil Exit Load1 • Nil - if upto 10% of Units allotted
are redeemed / switched-out within 1 year from the date of allotment.
• 1% - for any redemption / switch-out in excess of 10% of units allotted within one year from the date of allotment.
• Nil - if units are redeemed or switched-out after 1 year from the date of allotment.
Switch between the Plans under the Scheme, please refer page no. 42.
Minimum Investment R 1,000/- & in multiples of R 1/- thereafter
Additional PurchaseR 1,000/- & in multiples of R 1/- thereafter
Date of Allotment 21st August, 2009
NAV p.u. (R) As on 29th November, 2019Growth 29.55 Dividend 19.08 Direct PlanGrowth 32.81 Dividend 21.11
Portfolio Turnover Ratio (1 Year) 0.62
Weighted Average Expense Ratio2 for the monthRegular 2.61%Direct 1.46%
Benchmark IndexNifty 50 TRI
AAuM for the month of November 2019: R 202.63 croresAuM as on30th November, 2019: R 203.32 crores
Fund Manager & ExperienceAmit GanatraTotal Experience 16 Years Experience in managing this fund: Since March 29, 2018Nitin GosarTotal Experience 14 Years Experience in managing this fund: Since March 29, 2018
Asset AllocationEquity Holdings 98.32%Cash & Cash Equivalent 1.68%
Performance AttributesStandard Deviation 3.31%Sharpe Ratio 0.16Beta 0.90Based on 3 years, monthly data points (Risk-free rate of 5.25% based on Overnight MIBOR)
Fund P/E - FY20E 26.3Fund P/B 4.0
Financial CharacteristicsAverage Weighted Market Capitalisation r 370,186 crores
Median Market Capitalisation r 93,956 crores
Source : Factset, Internal Data Files
Portfolio (As on 30th November, 2019) No. of Holdings : 28Company % of Net AssetsEquity & Equity Related Instruments 98.32Reliance Industries Ltd. 11.29HDFC Bank Ltd. 10.23Housing Development Finance Corp. Ltd. 9.73ICICI Bank Ltd. 7.08Infosys Ltd. 6.56ITC Ltd. 6.43Kotak Mahindra Bank Ltd. 5.92Larsen & Toubro Ltd. 5.59Tata Consultancy Services Ltd. 4.91Sun Pharmaceutical Industries Ltd. 2.51Bajaj Finance Ltd. 2.45Divi’s Laboratories Ltd. 2.04Torrent Pharmaceuticals Ltd. 1.95Indraprastha Gas Ltd. 1.81
Company % of Net AssetsUltraTech Cement Ltd. 1.79United Spirits Ltd. 1.76Bajaj Auto Ltd. 1.65Aditya Birla Fashion and Retail Ltd. 1.65Mishra Dhatu Nigam Ltd. 1.52Apollo Hospitals Enterprise Ltd. 1.45Titan Company Ltd. 1.45ICICI Lombard General Insurance Co. Ltd. 1.36SBI Life Insurance Company Ltd. 1.34Whirlpool of India Ltd. 1.33TCI Express Ltd. 1.31Heritage Foods Ltd. 1.24Sanofi India Ltd. 1.05VIP Industries Ltd. 0.92Cash & Cash Equivalent 1.68Total 100.00
Lumpsum Performance (As on 29th November, 2019)
PeriodReturns % Value of r 10,000 invested
FundBenchmark Addl. BM
FundBenchmark Addl. BM
Nifty 50 TRI S&P BSE Sensex TRI Nifty 50 TRI S&P BSE Sensex TRI 1 Year 8.78% 12.38% 14.05% 10,876 11,234 11,4013 Years 11.33% 15.12% 16.67% 13,796 15,252 15,8745 Years 7.99% 8.39% 8.70% 14,694 14,967 15,1837 Years 12.40% 12.20% 12.80% 22,661 22,388 23,23610 Years 10.41% 10.48% 10.76% 26,937 27,088 27,791Since Inception 11.12% 11.34% 11.62% 29,550 30,163 30,951(21 August, 2009)Past performance may or may not be sustained in future. BM - Benchmark. Different plans have different expense structure. For calculating returns since inception, NAV as on the date of allotment is taken as Rs. 10/-. Face Value per unit is Rs. 10/-. Please refer Page nos. 32-36 for performance of other Schemes managed by the Fund Managers and Page nos. 37-40 for performance of Direct Plans and respective Disclaimers. Also refer Note 1 below.
SIP Performance (As on 29th November, 2019)
SIPInvestment
Total amountinvested
(R)
Scheme Nifty 50 TRI S&P BSE Sensex TRI2.1
Market value (R)
SIP Returns (%) XIRR
Market value (R)
SIP Returns (%) XIRR
Market value (R)
SIP Returns (%) XIRR
1 Year 120,000 126,507 10.29% 128,936 14.21% 130,238 16.33%3 Years 360,000 403,571 7.59% 428,128 11.62% 440,670 13.62%5 Years 600,000 742,262 8.46% 798,760 11.41% 822,102 12.57%7 Years 840,000 1,238,964 10.93% 1,288,625 12.03% 1,321,515 12.74%10 Years 1,200,000 2,141,959 11.16% 2,192,585 11.60% 2,255,225 12.13%Since Inception 1,240,000 2,258,034 11.15% 2,308,997 11.55% 2,374,541 12.06%(21 August, 2009)
Past performance may or may not be sustained in future. 2.1Additional Benchmark. Load is not taken into consideration. XIRR method is used to calculate SIP returns assuming investment of Rs. 10,000/- on the first working day of every month. The above investment simulation is for illustrative purpose only and should not be construed as a promise on minimum returns and safeguard of capital. Also refer Note 1 below.
Note 1 : Returns above 1 year are CAGR. Returns are of existing plan (non - direct plan) - Growth Option. Benchmark returns are calculated using Total Return variant of respective Benchmark Index.
Fund P/E - FY20E is current price to earnings for FY20E, Fund P/B is 12 months trailing price to book value. Both are arrived at using Weighted Harmonic Mean which is an average resulting from the multiplication of the reciprocal of the observation for each component by the weightage of that stock in the portfolio/index. For 1,2, Note on Direct Plan, Dividend Distribution and Disclaimer, refer page no. 42.
8 of 42
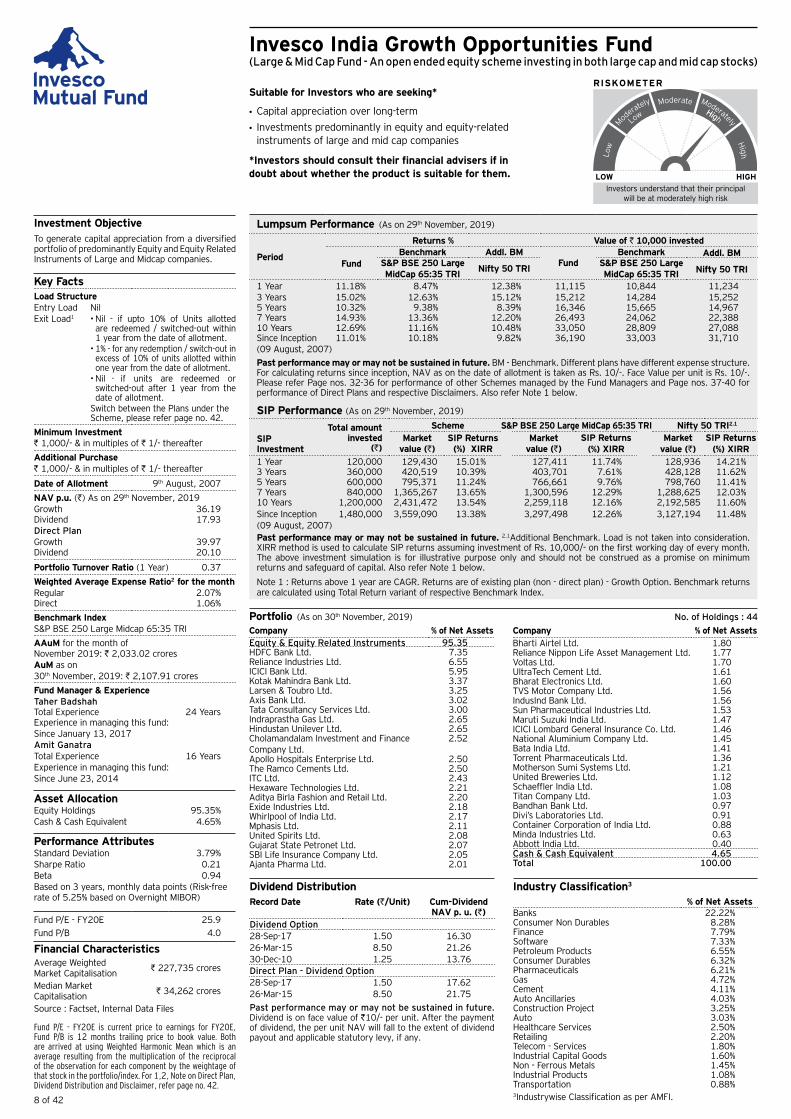
Invesco India Growth Opportunities Fund(Large & Mid Cap Fund - An open ended equity scheme investing in both large cap and mid cap stocks)
RISKOMETER
Investors understand that their principal will be at moderately high risk
Suitable for Investors who are seeking*
l Capital appreciation over long-terml Investments predominantly in equity and equity-related
instruments of large and mid cap companies
*Investors should consult their financial advisers if in doubt about whether the product is suitable for them.
Industry Classification3
% of Net AssetsBanks 22.22%Consumer Non Durables 8.28%Finance 7.79%Software 7.33%Petroleum Products 6.55%Consumer Durables 6.32%Pharmaceuticals 6.21%Gas 4.72%Cement 4.11%Auto Ancillaries 4.03%Construction Project 3.25%Auto 3.03%Healthcare Services 2.50%Retailing 2.20%Telecom - Services 1.80%Industrial Capital Goods 1.60%Non - Ferrous Metals 1.45%Industrial Products 1.08%Transportation 0.88%3Industrywise Classification as per AMFI.
Dividend DistributionRecord Date Rate (R/Unit) Cum-Dividend
NAV p. u. (R)Dividend Option28-Sep-17 1.50 16.3026-Mar-15 8.50 21.2630-Dec-10 1.25 13.76Direct Plan - Dividend Option28-Sep-17 1.50 17.6226-Mar-15 8.50 21.75Past performance may or may not be sustained in future. Dividend is on face value of R10/- per unit. After the payment of dividend, the per unit NAV will fall to the extent of dividend payout and applicable statutory levy, if any.
Investment ObjectiveTo generate capital appreciation from a diversified portfolio of predominantly Equity and Equity Related Instruments of Large and Midcap companies.
Key FactsLoad Structure Entry Load Nil Exit Load1 • Nil - if upto 10% of Units allotted
are redeemed / switched-out within 1 year from the date of allotment.
• 1% - for any redemption / switch-out in excess of 10% of units allotted within one year from the date of allotment.
• Nil - if units are redeemed or switched-out after 1 year from the date of allotment.
Switch between the Plans under the Scheme, please refer page no. 42.
Minimum Investment R 1,000/- & in multiples of R 1/- thereafter
Additional PurchaseR 1,000/- & in multiples of R 1/- thereafter
Date of Allotment 9th August, 2007
NAV p.u. (R) As on 29th November, 2019Growth 36.19 Dividend 17.93 Direct PlanGrowth 39.97 Dividend 20.10
Portfolio Turnover Ratio (1 Year) 0.37
Weighted Average Expense Ratio2 for the monthRegular 2.07%Direct 1.06%
Benchmark IndexS&P BSE 250 Large Midcap 65:35 TRI
AAuM for the month of November 2019: R 2,033.02 croresAuM as on30th November, 2019: R 2,107.91 crores
Fund Manager & ExperienceTaher BadshahTotal Experience 24 Years Experience in managing this fund: Since January 13, 2017Am it GanatraTotal Experience 16 Years Experience in managing this fund: Since June 23, 2014
Asset AllocationEquity Holdings 95.35%Cash & Cash Equivalent 4.65%
Performance AttributesStandard Deviation 3.79%Sharpe Ratio 0.21Beta 0.94Based on 3 years, monthly data points (Risk-free rate of 5.25% based on Overnight MIBOR)
Fund P/E - FY20E 25.9Fund P/B 4.0
Financial CharacteristicsAverage Weighted Market Capitalisation r 227,735 crores
Median Market Capitalisation r 34,262 crores
Source : Factset, Internal Data Files
Portfolio (As on 30th November, 2019) No. of Holdings : 44Company % of Net AssetsEquity & Equity Related Instruments 95.35HDFC Bank Ltd. 7.35Reliance Industries Ltd. 6.55ICICI Bank Ltd. 5.95Kotak Mahindra Bank Ltd. 3.37Larsen & Toubro Ltd. 3.25Axis Bank Ltd. 3.02Tata Consultancy Services Ltd. 3.00Indraprastha Gas Ltd. 2.65Hindustan Unilever Ltd. 2.65Cholamandalam Investment and Finance Company Ltd.
2.52
Apollo Hospitals Enterprise Ltd. 2.50The Ramco Cements Ltd. 2.50ITC Ltd. 2.43Hexaware Technologies Ltd. 2.21Aditya Birla Fashion and Retail Ltd. 2.20Exide Industries Ltd. 2.18Whirlpool of India Ltd. 2.17Mphasis Ltd. 2.11United Spirits Ltd. 2.08Gujarat State Petronet Ltd. 2.07SBI Life Insurance Company Ltd. 2.05Ajanta Pharma Ltd. 2.01
Company % of Net AssetsBharti Airtel Ltd. 1.80Reliance Nippon Life Asset Management Ltd. 1.77Voltas Ltd. 1.70UltraTech Cement Ltd. 1.61Bharat Electronics Ltd. 1.60TVS Motor Company Ltd. 1.56IndusInd Bank Ltd. 1.56Sun Pharmaceutical Industries Ltd. 1.53Maruti Suzuki India Ltd. 1.47ICICI Lombard General Insurance Co. Ltd. 1.46National Aluminium Company Ltd. 1.45Bata India Ltd. 1.41Torrent Pharmaceuticals Ltd. 1.36Motherson Sumi Systems Ltd. 1.21United Breweries Ltd. 1.12Schaeffler India Ltd. 1.08Titan Company Ltd. 1.03Bandhan Bank Ltd. 0.97Divi’s Laboratories Ltd. 0.91Container Corporation of India Ltd. 0.88Minda Industries Ltd. 0.63Abbott India Ltd. 0.40Cash & Cash Equivalent 4.65Total 100.00
Lumpsum Performance (As on 29th November, 2019)
Period
Returns % Value of r 10,000 invested
FundBenchmark Addl. BM
FundBenchmark Addl. BM
S&P BSE 250 Large MidCap 65:35 TRI
Nifty 50 TRI S&P BSE 250 Large MidCap 65:35 TRI Nifty 50 TRI
1 Year 11.18% 8.47% 12.38% 11,115 10,844 11,2343 Years 15.02% 12.63% 15.12% 15,212 14,284 15,2525 Years 10.32% 9.38% 8.39% 16,346 15,665 14,9677 Years 14.93% 13.36% 12.20% 26,493 24,062 22,38810 Years 12.69% 11.16% 10.48% 33,050 28,809 27,088Since Inception 11.01% 10.18% 9.82% 36,190 33,003 31,710(09 August, 2007)Past performance may or may not be sustained in future. BM - Benchmark. Different plans have different expense structure. For calculating returns since inception, NAV as on the date of allotment is taken as Rs. 10/-. Face Value per unit is Rs. 10/-. Please refer Page nos. 32-36 for performance of other Schemes managed by the Fund Managers and Page nos. 37-40 for performance of Direct Plans and respective Disclaimers. Also refer Note 1 below.
SIP Performance (As on 29th November, 2019)
SIPInvestment
Total amountinvested
(R)
Scheme S&P BSE 250 Large MidCap 65:35 TRI Nifty 50 TRI2.1
Market value (R)
SIP Returns (%) XIRR
Market value (R)
SIP Returns (%) XIRR
Market value (R)
SIP Returns (%) XIRR
1 Year 120,000 129,430 15.01% 127,411 11.74% 128,936 14.21%3 Years 360,000 420,519 10.39% 403,701 7.61% 428,128 11.62%5 Years 600,000 795,371 11.24% 766,661 9.76% 798,760 11.41%7 Years 840,000 1,365,267 13.65% 1,300,596 12.29% 1,288,625 12.03%10 Years 1,200,000 2,431,472 13.54% 2,259,118 12.16% 2,192,585 11.60%Since Inception 1,480,000 3,559,090 13.38% 3,297,498 12.26% 3,127,194 11.48%(09 August, 2007)Past performance may or may not be sustained in future. 2.1Additional Benchmark. Load is not taken into consideration. XIRR method is used to calculate SIP returns assuming investment of Rs. 10,000/- on the first working day of every month. The above investment simulation is for illustrative purpose only and should not be construed as a promise on minimum returns and safeguard of capital. Also refer Note 1 below.
Note 1 : Returns above 1 year are CAGR. Returns are of existing plan (non - direct plan) - Growth Option. Benchmark returns are calculated using Total Return variant of respective Benchmark Index.
Fund P/E - FY20E is current price to earnings for FY20E, Fund P/B is 12 months trailing price to book value. Both are arrived at using Weighted Harmonic Mean which is an average resulting from the multiplication of the reciprocal of the observation for each component by the weightage of that stock in the portfolio/index. For 1,2, Note on Direct Plan, Dividend Distribution and Disclaimer, refer page no. 42.

9 of 42
Invesco India Midcap Fund(Mid Cap Fund - An open ended equity scheme predominantly investing in mid cap stocks)
RISKOMETER
Investors understand that their principal will be at moderately high risk
Suitable for Investors who are seeking*
l Capital appreciation over long-terml Investments predominantly in equity and equity-related
instruments of Midcap companies
*Investors should consult their financial advisers if in doubt about whether the product is suitable for them.
Industry Classification3
% of Net AssetsBanks 11.82%Pharmaceuticals 9.19%Gas 8.88%Auto Ancillaries 8.15%Finance 7.92%Consumer Durables 6.99%Industrial Products 4.75%Retailing 4.60%Software 4.53%Fertilisers 3.38%Healthcare Services 3.38%Consumer Non Durables 3.14%Cement 2.58%Chemicals 2.25%Construction 2.01%Ferrous Metals 1.83%Industrial Capital Goods 1.75%Auto 1.62%Power 1.49%Construction Project 1.21%Transportation 1.11%Petroleum Products 1.09%Services 0.98%Media & Entertainment 0.49%3Industrywise Classification as per AMFI.
Dividend DistributionRecord Date Rate (R/Unit) Cum-Dividend
NAV p. u. (R)Dividend Option11-Jan-19 2.21 24.7228-Mar-18 3.25 27.3719-Apr-17 2.90 28.17Direct Plan - Dividend Option11-Jan-19 2.21 27.8028-Mar-18 3.25 30.0419-Apr-17 2.90 30.21Past performance may or may not be sustained in future. Dividend is on face value of R10/- per unit. After the payment of dividend, the per unit NAV will fall to the extent of dividend payout and applicable statutory levy, if any.
Investment ObjectiveTo generate capital appreciation by investing predominantly in Midcap companies.
Key FactsLoad Structure Entry Load Nil Exit Load1 • Nil - if upto 10% of Units allotted
are redeemed / switched-out within 1 year from the date of allotment.
• 1% - for any redemption / switch-out in excess of 10% of units allotted within one year from the date of allotment.
• Nil - if units are redeemed or switched-out after 1 year from the date of allotment.
Switch between the Plans under the Scheme, please refer page no. 42.
Minimum Investment R 1,000/- & in multiples of R 1/- thereafter
Additional PurchaseR 1,000/- & in multiples of R 1/- thereafter
Date of Allotment 19th April, 2007
NAV p.u. (R) As on 29th November, 2019Growth 49.39 Dividend 23.05 Direct PlanGrowth 55.02 Dividend 26.60
Portfolio Turnover Ratio (1 Year) 0.52
Weighted Average Expense Ratio2 for the monthRegular 2.51%Direct 1.06%
Benchmark IndexNifty Midcap 100 TRI
AAuM for the month of November 2019: R 627.91 croresAuM as on30th November, 2019: R 644.95 crores
Fund Manager & ExperiencePranav GokhaleTotal Experience 15 Years Experience in managing this fund: Since March 29, 2018Neelesh DhamnaskarTotal Experience 13 Years Experience in managing this fund: Since July 18, 2018
Asset AllocationEquity Holdings 95.14%Cash & Cash Equivalent 4.86%
Performance AttributesStandard Deviation 4.48%Sharpe Ratio 0.11Beta 0.81Based on 3 years, monthly data points (Risk-free rate of 5.25% based on Overnight MIBOR)
Fund P/E - FY20E 22.4Fund P/B 4.3
Financial CharacteristicsAverage Weighted Market Capitalisation r 30,905 crores
Median Market Capitalisation r 14,699 crores
Source : Factset, Internal Data Files
Portfolio (As on 30th November, 2019) No. of Holdings : 44Company % of Net AssetsEquity & Equity Related Instruments 95.14Whirlpool of India Ltd. 4.09ICICI Bank Ltd. 4.08Cholamandalam Investment and Finance Company Ltd.
3.95
City Union Bank Ltd. 3.84Gujarat State Petronet Ltd. 3.56Coromandel International Ltd. 3.38Apollo Hospitals Enterprise Ltd. 3.38Indraprastha Gas Ltd. 3.23Sanofi India Ltd. 3.05Aditya Birla Fashion and Retail Ltd. 2.98Bata India Ltd. 2.90Ajanta Pharma Ltd. 2.79AIA Engineering Ltd. 2.64The Ramco Cements Ltd. 2.58Exide Industries Ltd. 2.52United Spirits Ltd. 2.30Hexaware Technologies Ltd. 2.29Vinati Organics Ltd. 2.25Mphasis Ltd. 2.24Bandhan Bank Ltd. 2.19Schaeffler India Ltd. 2.11Mahanagar Gas Ltd. 2.08
Company % of Net AssetsPNC Infratech Ltd. 2.01Sundram Fasteners Ltd. 1.99Mishra Dhatu Nigam Ltd. 1.83Torrent Pharmaceuticals Ltd. 1.82Bharat Electronics Ltd. 1.75DCB Bank Ltd. 1.71Reliance Nippon Life Asset Management Ltd. 1.65Indiamart Intermesh Ltd. 1.62TVS Motor Company Ltd. 1.62ICICI Lombard General Insurance Co. Ltd. 1.54Abbott India Ltd. 1.53Torrent Power Ltd. 1.49Balkrishna Industries Ltd. 1.34Minda Industries Ltd. 1.27KEC International Ltd. 1.21Mahindra Logistics Ltd. 1.11Gulf Oil Lubricants India Ltd. 1.09Tube Investments of India Ltd. 1.03Indian Railway Catering And Tourism Corp. Ltd. 0.98Heritage Foods Ltd. 0.84Motilal Oswal Financial Services Ltd. 0.79Music Broadcast Ltd. 0.49Cash & Cash Equivalent 4.86Total 100.00
Lumpsum Performance (As on 29th November, 2019)
PeriodReturns % Value of r 10,000 invested
FundBenchmark Addl. BM
Fund Benchmark Addl. BMNifty Midcap 100 TRI Nifty 50 TRI Nifty Midcap 100 TRI Nifty 50 TRI
1 Year 5.01% -0.66% 12.38% 10,500 9,934 11,2343 Years 10.29% 6.09% 15.12% 13,410 11,939 15,2525 Years 9.01% 7.97% 8.39% 15,401 14,680 14,9677 Years 16.44% 12.61% 12.20% 29,019 22,957 22,38810 Years 16.04% 10.53% 10.48% 44,296 27,226 27,088Since Inception 13.49% 11.52% 10.46% 49,390 39,587 35,109(19 April, 2007)Past performance may or may not be sustained in future. BM - Benchmark. Different plans have different expense structure. For calculating returns since inception, NAV as on the date of allotment is taken as Rs. 10/-. Face Value per unit is Rs. 10/-. Please refer Page nos. 32-36 for performance of other Schemes managed by the Fund Managers and Page nos. 37-40 for performance of Direct Plans and respective Disclaimers. Also refer Note 1 below.
SIP Performance (As on 29th November, 2019)
SIPInvestment
Total amountinvested
(R)
Scheme Nifty Midcap 100 TRI Nifty 50 TRI2.1
Market value (R)
SIP Returns (%) XIRR
Market value (R)
SIP Returns (%) XIRR
Market value (R)
SIP Returns (%) XIRR
1 Year 120,000 125,527 8.72% 122,199 3.44% 128,936 14.21%3 Years 360,000 390,527 5.37% 355,901 -0.74% 428,128 11.62%5 Years 600,000 733,320 7.97% 678,572 4.87% 798,760 11.41%7 Years 840,000 1,366,778 13.68% 1,207,272 10.20% 1,288,625 12.03%Since Inception - - - - - - -(19 April, 2007)Past performance may or may not be sustained in future. 2.1Additional Benchmark. Returns for other periods not available as the Scheme was close-ended and re-opened for purchase on April 20, 2010, first SIP installment is taken as May 1, 2010. Load is not taken into consideration. XIRR method is used to calculate SIP returns assuming investment of Rs. 10,000/- on the first working day of every month. The above investment simulation is for illustrative purpose only and should not be construed as a promise on minimum returns and safeguard of capital. Also refer Note 1 below.
Note 1 : Returns above 1 year are CAGR. Returns are of existing plan (non - direct plan) - Growth Option. Benchmark returns are calculated using Total Return variant of respective Benchmark Index.
Fund P/E - FY20E is current price to earnings for FY20E, Fund P/B is 12 months trailing price to book value. Both are arrived at using Weighted Harmonic Mean which is an average resulting from the multiplication of the reciprocal of the observation for each component by the weightage of that stock in the portfolio/index. For 1,2, Note on Direct Plan, Dividend Distribution and Disclaimer, refer page no. 42.

10 of 42
Invesco India Smallcap Fund(Small Cap Fund - An open-ended equity scheme predominantly investing in small cap stocks)
RISKOMETER
Investors understand that their principal will be at moderately high risk
Suitable for Investors who are seeking*
l Capital appreciation over long-terml Investments predominantly in equity and equity-related instruments
of smallcap companies
*Investors should consult their financial advisers if in doubt about whether the product is suitable for them.
Industry Classification3
% of Net AssetsConsumer Durables 13.99%Finance 10.65%Construction 8.53%Retailing 6.87%Construction Project 6.73%Industrial Products 5.95%Transportation 4.93%Services 4.29%Auto Ancillaries 3.96%Banks 3.57%Ferrous Metals 3.46%Consumer Non Durables 3.13%Chemicals 2.83%Pesticides 2.54%Industrial Capital Goods 2.21%Petroleum Products 2.21%Gas 2.19%Software 2.10%Minerals/Mining 1.97%Pharmaceuticals 1.96%Media & Entertainment 1.02%3Industrywise Classification as per AMFI.
Investment ObjectiveTo generate capital appreciation by investing predominantly in stocks of smallcap companies.
Key FactsLoad Structure Entry Load Nil Exit Load1 • Nil - if upto 10% of Units allotted
are redeemed / switched-out within 1 year from the date of allotment.
• 1% - for any redemption / switch-out in excess of 10% of units allotted within one year from the date of allotment.
• Nil - if units are redeemed or switched-out after 1 year from the date of allotment.
Switch between the Plans under the Scheme, please refer page no. 42.
Minimum Investment R 1,000/- & in multiples of R 1/- thereafter
Additional PurchaseR 1,000/- & in multiples of R 1/- thereafter
Date of Allotment 30th October, 2018
NAV p.u. (R) As on 29th November, 2019Growth 10.64 Dividend 10.64 Direct PlanGrowth 10.83 Dividend 10.82
Weighted Average Expense Ratio2 for the monthRegular 2.59%Direct 0.99%
Benchmark IndexS&P BSE 250 Smallcap TRI
AAuM for the month of November 2019: R 398.72 croresAuM as on30th November, 2019: R 407.61 crores
Fund Manager & ExperienceTaher BadshahTotal Experience 24 Years Experience in managing this fund: Since October 30, 2018Pranav GokhaleTotal Experience 15 Years Experience in managing this fund: Since March 1, 2019
Asset AllocationEquity Holdings 95.09%Cash & Cash Equivalent 4.91%
Portfolio (As on 30th November, 2019) No. of Holdings : 41Company % of Net AssetsEquity & Equity Related Instruments 95.09Indian Railway Catering And Tourism Corporation Ltd.
4.29
Orient Electric Ltd. 4.04Whirlpool of India Ltd. 3.80Bata India Ltd. 3.50Mishra Dhatu Nigam Ltd. 3.46V-Mart Retail Ltd. 3.00Cera Sanitaryware Ltd. 2.95Vinati Organics Ltd. 2.83TCI Express Ltd. 2.76PNC Infratech Ltd. 2.73VIP Industries Ltd. 2.65KEC International Ltd. 2.59Rallis India Ltd. 2.54Minda Industries Ltd. 2.52H.G. Infra Engineering Ltd. 2.48Equitas Holdings Ltd. 2.47Multi Commodity Exchange of India Ltd. 2.21Bharat Electronics Ltd. 2.21Gulf Oil Lubricants India Ltd. 2.21Gujarat State Petronet Ltd. 2.19Mahindra Logistics Ltd. 2.17
Company % of Net AssetsCentral Depository Services (India) Ltd. 2.17Aditya Birla Fashion and Retail Ltd. 2.12Accelya Solutions India Ltd. 2.10Apex Frozen Foods Ltd. 2.04Timken India Ltd. 2.03Grindwell Norton Ltd. 2.01Motilal Oswal Financial Services Ltd. 1.98MOIL Ltd. 1.97Ajanta Pharma Ltd. 1.96Schaeffler India Ltd. 1.91City Union Bank Ltd. 1.88Reliance Nippon Life Asset Management Ltd.
1.81
KNR Constructions Ltd. 1.81Indiamart Intermesh Ltd. 1.76DCB Bank Ltd. 1.69Rail Vikas Nigam Ltd. 1.65Tube Investments of India Ltd. 1.44Heritage Foods Ltd. 1.09Ahluwalia Contracts (India) Ltd. 1.04Music Broadcast Ltd. 1.02Cash & Cash Equivalent 4.91Total 100.00
Lumpsum Performance (As on 29th November, 2019)
Period
Returns % Value of r 10,000 invested
FundBenchmark Addl. BM
FundBenchmark Addl. BM
S&P BSE 250 Smallcap TRI
Nifty 50 TRIS&P BSE 250 Smallcap TRI
Nifty 50 TRI
1 Year 4.94% -5.59% 12.38% 10,493 9,442 11,234Since Inception 5.90% -2.52% 18.21% 10,640 9,728 11,984(30 October, 2018)Past performance may or may not be sustained in future. BM - Benchmark. Different plans have different expense structure. For calculating returns since inception, NAV as on the date of allotment is taken as Rs. 10/-. Face Value per unit is Rs. 10/-. Please refer Page nos. 32-36 for performance of other Schemes managed by the Fund Managers and Page nos. 37-40 for performance of Direct Plans and respective Disclaimers.
SIP Performance (As on 29th November, 2019)
SIPInvestment
Total amountinvested
(R)
Scheme S&P BSE 250 Smallcap TRI Nifty 50 TRI2.1
Market value (R)
SIP Returns (%) XIRR
Market value (R)
SIP Returns (%) XIRR
Market value (R)
SIP Returns (%) XIRR
1 Year 120,000 125,652 8.92% 115,950 -6.24% 128,936 14.21%Since Inception 130,000 136,292 8.47% 125,678 -5.72% 140,921 14.81%(30 October, 2018)Past performance may or may not be sustained in future. 2.1Additional Benchmark. Load is not taken into consideration. XIRR method is used to calculate SIP returns assuming investment of Rs. 10,000/- every month. The above investment simulation is for illustrative purpose only and should not be construed as a promise on minimum returns and safeguard of capital. Also refer Note 1 below.
Note 1 : Returns above 1 year are CAGR. Returns are of existing plan (non - direct plan) - Growth Option. The scheme has been in existence for less than 3 years. Benchmark returns are calculated using Total Return variant of respective Benchmark Index.

11 of 42
Invesco India Dynamic Equity Fund(An open ended dynamic asset allocation fund)
RISKOMETER
Investors understand that their principal will be at moderately high risk
Suitable for Investors who are seeking*
l Capital appreciation over long-terml Investments in equity and debt securities which are managed
dynamically
*Investors should consult their financial advisers if in doubt about whether the product is suitable for them.
Industry Classification3
% of Net AssetsBanks 28.02%Consumer Non Durables 8.39%Petroleum Products 7.92%Software 7.05%Construction Project 5.57%Finance 3.93%Telecom - Services 3.15%Pharmaceuticals 2.05%Cement 2.02%Auto 1.96%Consumer Durables 1.85%3Industrywise Classification as per AMFI.
Dividend DistributionRecord Date Rate (R/Unit) Cum-Dividend
NAV p. u. (R)Dividend Option21-Nov-19 0.12395743 17.5622-Oct-19 0.12395743 17.3219-Sep-19 0.12395743 16.56Direct Plan - Dividend Option21-Nov-19 0.12395743 18.8322-Oct-19 0.12395743 18.5419-Sep-19 0.12395743 17.70Past performance may or may not be sustained in future. Dividend is on face value of R10/- per unit. After the payment of dividend, the per unit NAV will fall to the extent of dividend payout and applicable statutory levy, if any.
Investment ObjectiveTo generate capital appreciation by investing in equity and debt securities which are managed dynamically.
Key FactsLoad Structure Entry Load Nil Exit Load1 • Nil - if upto 10% of Units allotted
are redeemed / switched-out within 3 months from the date of allotment.
• 0.25% - for any redemption / switch-out in excess of 10% of units allotted within 3 months from the date of allotment.
• Nil - if units are redeemed or switched-out after 3 months from the date of allotment.
Switch between the Plans under the Scheme, please refer page no. 42.
Minimum Investment R 1,000/- & in multiples of R 1/- thereafter
Additional PurchaseR 1,000/- & in multiples of R 1/- thereafter
Date of Allotment 4th October, 2007
NAV p.u. (R) As on 29th November, 2019Growth 30.19 Dividend 17.44 Direct PlanGrowth 33.20 Dividend 18.71
Portfolio Turnover Ratio (1 Year) 3.31
Weighted Average Expense Ratio2 for the monthRegular 2.20%Direct 1.11%
Benchmark IndexCRISIL Hybrid 35+65 - Aggressive Index
AAuM for the month of November 2019: R 901.58 croresAuM as on30th November, 2019: R 912.42 crores
Fund Manager & ExperienceTaher BadshahTotal Experience 24 Years Experience in managing this fund: Since January 13, 2017Pranav GokhaleTotal Experience 15 Years Experience in managing this fund: Since June 1, 2018
Asset AllocationEquity Holdings 71.92%Corporate Debt 8.35%Fixed Deposits 4.87%Cash & Cash Equivalent 14.86%
Performance AttributesStandard Deviation 2.63%Sharpe Ratio 0.17Beta 0.98Based on 3 years, monthly data points (Risk-free rate of 5.25% based on Overnight MIBOR)
Fund P/E - FY20E 25.4Fund P/B 3.8
Financial CharacteristicsAverage Weighted Market Capitalisation r 405,116 crores
Median Market Capitalisation r 217,720 crores
Source : Factset, Internal Data Files. The above calculation is based on Equity component.
Portfolio (As on 30th November, 2019) No. of Holdings : 22Company Rating % of Net
AssetsEquity & Equity Related Instruments 71.92HDFC Bank Ltd. 10.35Reliance Industries Ltd. 7.92Larsen & Toubro Ltd. 5.57ICICI Bank Ltd. 4.78Hindustan Unilever Ltd. 4.25Tata Consultancy Services Ltd. 3.80Infosys Ltd. 3.25Kotak Mahindra Bank Ltd. 3.23Bharti Airtel Ltd. 3.15State Bank of India 2.92Axis Bank Ltd. 2.59Bandhan Bank Ltd. 2.58ITC Ltd. 2.40UltraTech Cement Ltd. 2.02
Company Rating % of Net Assets
ICICI Lombard General Insurance Company Ltd.
2.01
Bajaj Auto Ltd. 1.96Bajaj Finance Ltd. 1.93Titan Company Ltd. 1.85United Spirits Ltd. 1.74IndusInd Bank Ltd. 1.57Sun Pharmaceutical Industries Ltd. 1.04Divi’s Laboratories Ltd. 1.01Corporate Debt 8.35LIC Housing Finance Ltd. CARE AAA 2.80Sundaram Finance Ltd. CRISIL AAA 2.78Housing Development Finance Corp. Ltd. CRISIL AAA 2.77Fixed Deposits 4.87HDFC Bank Ltd. 4.87Derivatives, Cash & Cash Equivalent 14.86Total 100.00
Lumpsum Performance (As on 29th November, 2019)
Period
Returns % Value of r 10,000 invested
FundBenchmark Addl. BM
FundBenchmark Addl. BM
CRISIL Hybrid 35+65 - Aggressive Index
Nifty 50 TRI
CRISIL Hybrid 35+65 - Aggressive Index
Nifty 50 TRI
1 Year 9.01% 11.26% 12.38% 10,899 11,123 11,2343 Years 10.59% 11.41% 15.12% 13,520 13,825 15,2525 Years 7.53% 9.09% 8.39% 14,383 15,459 14,9677 Years 12.05% 11.61% 12.20% 22,182 21,569 22,38810 Years 10.42% 10.05% 10.48% 26,955 26,053 27,088Since Inception 9.51% 8.91% 8.43% 30,190 28,236 26,763(04 October, 2007)Past performance may or may not be sustained in future. BM - Benchmark. Different plans have different expense structure. For calculating returns since inception, NAV as on the date of allotment is taken as Rs. 10/-. Face Value per unit is Rs. 10/-. Please refer Page nos. 32-36 for performance of other Schemes managed by the Fund Managers and Page nos. 37-40 for performance of Direct Plans and respective Disclaimers. Also refer Note 1 below.
SIP Performance (As on 29th November, 2019)
SIPInvestment
Total amountinvested
(R)
Scheme CRISIL Hybrid 35+65 - Aggressive Index Nifty 50 TRI2.1
Market value (R)
SIP Returns (%) XIRR
Market value (R)
SIP Returns (%) XIRR
Market value (R)
SIP Returns (%) XIRR
1 Year 120,000 126,840 10.82% 128,098 12.85% 128,936 14.21%3 Years 360,000 397,006 6.48% 415,014 9.49% 428,128 11.62%5 Years 600,000 730,619 7.82% 773,030 10.09% 798,760 11.41%7 Years 840,000 1,198,216 9.99% 1,250,468 11.19% 1,288,625 12.03%10 Years 1,200,000 2,099,104 10.78% 2,119,718 10.97% 2,192,585 11.60%Since Inception 1,460,000 3,004,724 11.25% 2,945,082 10.95% 3,063,557 11.54%(04 October, 2007)Past performance may or may not be sustained in future. 2.1Additional Benchmark. Load is not taken into consideration. XIRR method is used to calculate SIP returns assuming investment of Rs. 10,000/- on the first working day of every month. The above investment simulation is for illustrative purpose only and should not be construed as a promise on minimum returns and safeguard of capital. Also refer Note 1 below.
Note 1 : Returns above 1 year are CAGR. Returns are of existing plan (non - direct plan) - Growth Option. Benchmark returns are calculated using Total Return variant of respective Benchmark Index.
The Gross Exposure Derivatives in the scheme is 16.36% of Net Assets.
Fund P/E - FY20E is current price to earnings for FY20E, Fund P/B is 12 months trailing price to book value. Both are arrived at using Weighted Harmonic Mean which is an average resulting from the multiplication of the reciprocal of the observation for each component by the weightage of that stock in the portfolio/index. For 1,2, Note on Direct Plan, Dividend Distribution and Disclaimer, refer page no. 42.

12 of 42
Invesco India Financial Services Fund(An open ended equity scheme investing in financial services sector)
RISKOMETER
Investors understand that their principal will be at high risk
Suitable for Investors who are seeking*
l Capital appreciation over long-terml Investment predominantly in equity and equity-related
instruments of companies engaged in the business of banking and financial services.
*Investors should consult their financial advisers if in doubt about whether the product is suitable for them.
Industry Classification3
% of Net AssetsBanks 62.81%Finance 32.49%3Industrywise Classification as per AMFI.
Dividend DistributionRecord Date Rate (R/Unit) Cum-Dividend
NAV p. u. (R)Dividend Option14-Feb-19 2.66 28.9930-Nov-15 3.20 21.8703-May-13 2.50 17.79Direct Plan - Dividend Option14-Feb-19 2.66 31.9030-Nov-15 3.20 22.7103-May-13 2.50 17.79Past performance may or may not be sustained in future. Dividend is on face value of R10/- per unit. After the payment of dividend, the per unit NAV will fall to the extent of dividend payout and applicable statutory levy, if any.
Investment ObjectiveTo generate capital appreciation from a portfolio of Equity and Equity Related Instruments of companies engaged in the business of banking and financial services.
Key FactsLoad Structure Entry Load Nil Exit Load1 • Nil - if upto 10% of Units allotted
are redeemed / switched-out within 1 year from the date of allotment.
• 1% - for any redemption / switch-out in excess of 10% of units allotted within one year from the date of allotment.
• Nil - if units are redeemed or switched-out after 1 year from the date of allotment.
Switch between the Plans under the Scheme, please refer page no. 42.
Minimum Investment R 1,000/- & in multiples of R 1/- thereafter
Additional PurchaseR 1,000/- & in multiples of R 1/- thereafter
Date of Allotment 14th July, 2008
NAV p.u. (R) As on 29th November, 2019Growth 62.52 Dividend 31.88 Direct PlanGrowth 69.45 Dividend 35.83
Portfolio Turnover Ratio (1 Year) 0.63
Weighted Average Expense Ratio2 for the monthRegular 2.83%Direct 1.71%
Benchmark IndexNifty Financial Services TRI
AAuM for the month of November 2019: R 181.32 croresAuM as on30th November, 2019: R 188.18 crores
Fund Manager & ExperienceAmit GanatraTotal Experience 16 Years Experience in managing this fund: Since November 9, 2010Dhimant KothariTotal Experience 14 Years Experience in managing this fund: Since June 1, 2018
Asset AllocationEquity Holdings 95.29%Cash & Cash Equivalent 4.71%
Performance AttributesStandard Deviation 4.64%Sharpe Ratio 0.24Beta 0.96Based on 3 years, monthly data points (Risk-free rate of 5.25% based on Overnight MIBOR)
Fund P/E - FY20E 28.9Fund P/B 3.5
Financial CharacteristicsAverage Weighted Market Capitalisation r 354,023 crores
Median Market Capitalisation r 102,378 crores
Source : Factset, Internal Data Files
Portfolio (As on 30th November, 2019) No. of Holdings : 16
Company % of Net AssetsEquity & Equity Related Instruments 95.29HDFC Bank Ltd. 24.68ICICI Bank Ltd. 14.69Housing Development Finance Corp. Ltd. 12.55Kotak Mahindra Bank Ltd. 9.68Axis Bank Ltd. 7.87Bajaj Finance Ltd. 6.92State Bank of India 4.63Cholamandalam Investment and Finance Company Ltd.
2.80
Company % of Net AssetsICICI Lombard General Insurance Co. Ltd. 2.56SBI Life Insurance Company Ltd. 1.75Reliance Nippon Life Asset Management Ltd. 1.52Equitas Holdings Ltd. 1.36IndusInd Bank Ltd. 1.26Central Depository Services (India) Ltd. 1.20Multi Commodity Exchange of India Ltd. 1.05Motilal Oswal Financial Services Ltd. 0.79Cash & Cash Equivalent 4.71Total 100.00
Lumpsum Performance (As on 29th November, 2019)
Period
Returns % Value of r 10,000 invested
FundBenchmark Addl. BM
FundBenchmark Addl. BM
Nifty Financial Services TRI Nifty 50 TRI
Nifty Financial Services TRI Nifty 50 TRI
1 Year 20.34% 25.02% 12.38% 12,028 12,494 11,2343 Years 18.97% 24.13% 15.12% 16,829 19,113 15,2525 Years 13.55% 14.73% 8.39% 18,888 19,893 14,9677 Years 15.24% 17.05% 12.20% 26,995 30,099 22,38810 Years 14.76% 15.70% 10.48% 39,645 43,016 27,088Since Inception 17.47% 18.70% 11.44% 62,520 70,416 34,304(14 July, 2008)Past performance may or may not be sustained in future. BM - Benchmark. Different plans have different expense structure. For calculating returns since inception, NAV as on the date of allotment is taken as Rs. 10/-. Face Value per unit is Rs. 10/-. Please refer Page nos. 32-36 for performance of other Schemes managed by the Fund Managers and Page nos. 37-40 for performance of Direct Plans and respective Disclaimers. Also refer Note 1 below.
SIP Performance (As on 29th November, 2019)
SIPInvestment
Total amountinvested
(R)
Scheme Nifty Financial Services TRI Nifty 50 TRI2.1
Market value (R)
SIP Returns (%) XIRR
Market value (R)
SIP Returns (%) XIRR
Market value (R)
SIP Returns (%) XIRR
1 Year 120,000 135,247 24.58% 137,964 29.13% 128,936 14.21%3 Years 360,000 446,937 14.61% 490,840 21.27% 428,128 11.62%5 Years 600,000 883,179 15.48% 973,324 19.46% 798,760 11.41%7 Years 840,000 1,538,398 17.00% 1,682,283 19.51% 1,288,625 12.03%10 Years 1,200,000 2,743,750 15.80% 3,033,216 17.66% 2,192,585 11.60%Since Inception 1,370,000 3,789,095 16.76% 4,208,342 18.42% 2,827,738 12.07%(14 July, 2008)Past performance may or may not be sustained in future. 2.1Additional Benchmark. Load is not taken into consideration. XIRR method is used to calculate SIP returns assuming investment of Rs. 10,000/- on the first working day of every month. The above investment simulation is for illustrative purpose only and should not be construed as a promise on minimum returns and safeguard of capital. Also refer Note 1 below.
Note 1 : Returns above 1 year are CAGR. Returns are of existing plan (non - direct plan) - Growth Option. Benchmark returns are calculated using Total Return variant of respective Benchmark Index.
Fund P/E - FY20E is current price to earnings for FY20E, Fund P/B is 12 months trailing price to book value. Both are arrived at using Weighted Harmonic Mean which is an average resulting from the multiplication of the reciprocal of the observation for each component by the weightage of that stock in the portfolio/index. For 1,2, Note on Direct Plan, Dividend Distribution and Disclaimer, refer page no. 42.

13 of 42
Invesco India Infrastructure Fund(An open ended equity scheme following Infrastructure theme)
RISKOMETER
Investors understand that their principal will be at high risk
Suitable for Investors who are seeking*
l Capital appreciation over long-terml Investments predominantly in equity and equity-related instruments
of infrastructure companies
*Investors should consult their financial advisers if in doubt about whether the product is suitable for them.
Industry Classification3
% of Net AssetsConstruction Project 15.71%Gas 12.01%Industrial Products 10.70%Power 10.67%Transportation 10.40%Construction 9.42%Cement 5.44%Services 4.33%Ferrous Metals 4.10%Telecom - Services 3.77%Petroleum Products 3.44%Consumer Durables 3.11%Industrial Capital Goods 3.09%Auto 2.06%3Industrywise Classification as per AMFI.
Dividend DistributionRecord Date Rate (R/Unit) Cum-Dividend
NAV p. u. (R)Dividend Option21-Nov-17 1.85 18.24Direct Plan - Dividend Option21-Nov-17 1.85 19.53Past performance may or may not be sustained in future. Dividend is on face value of R10/- per unit. After the payment of dividend, the per unit NAV will fall to the extent of dividend payout and applicable statutory levy, if any.
Investment ObjectiveTo generate capital appreciation by investing in a portfolio that is predominantly constituted of Equity and Equity Related Instruments of infrastructure companies.
Key FactsLoad Structure Entry Load Nil Exit Load1 • Nil - if upto 10% of Units allotted
are redeemed / switched-out within 1 year from the date of allotment.
• 1% - for any redemption / switch-out in excess of 10% of units allotted within one year from the date of allotment.
• Nil - if units are redeemed or switched-out after 1 year from the date of allotment.
Switch between the Plans under the Scheme, please refer page no. 42.
Minimum Investment R 1,000/- & in multiples of R 1/- thereafter
Additional PurchaseR 1,000/- & in multiples of R 1/- thereafter
Date of Allotment 21st November, 2007
NAV p.u. (R) As on 29th November, 2019Growth 17.38 Dividend 15.63 Direct PlanGrowth 19.34 Dividend 17.27
Portfolio Turnover Ratio (1 Year) 0.52
Weighted Average Expense Ratio2 for the monthRegular 2.49%Direct 0.95%
Benchmark IndexS&P BSE India Infrastructure TRI
AAuM for the month of November 2019: R 40.79 croresAuM as on30th November, 2019: R 40.59 crores
Fund Manager & ExperiencePranav GokhaleTotal Experience 15 Years Experience in managing this fund: Since August 14, 2012Neelesh DhamnaskarTotal Experience 13 Years Experience in managing this fund: Since June 1, 2018
Asset AllocationEquity Holdings 98.26%Cash & Cash Equivalent 1.74%
Performance AttributesStandard Deviation 4.78%Sharpe Ratio 0.08Beta 0.81Based on 3 years, monthly data points (Risk-free rate of 5.25% based on Overnight MIBOR)
Fund P/E - FY20E 16.0Fund P/B 3.1
Financial CharacteristicsAverage Weighted Market Capitalisation r 78,331 crores
Median Market Capitalisation r 12,138 crores
Source : Factset, Internal Data Files
Portfolio (As on 30th November, 2019) No. of Holdings : 27Company % of Net AssetsEquity & Equity Related Instruments 98.26Power Grid Corporation of India Ltd. 8.78Larsen & Toubro Ltd. 8.59Gujarat State Petronet Ltd. 5.30Indian Railway Catering And Tourism Corporation Ltd.
4.33
H.G. Infra Engineering Ltd. 4.33Mishra Dhatu Nigam Ltd. 4.10PNC Infratech Ltd. 4.09Bharti Airtel Ltd. 3.77TCI Express Ltd. 3.75Container Corporation of India Ltd. 3.60Indraprastha Gas Ltd. 3.54Reliance Industries Ltd. 3.44Mahanagar Gas Ltd. 3.17
Company % of Net AssetsJohnson Controls - Hitachi Air Conditioning India Ltd.
3.11
Bharat Electronics Ltd. 3.09AIA Engineering Ltd. 3.08Mahindra Logistics Ltd. 3.05Schaeffler India Ltd. 2.97UltraTech Cement Ltd. 2.88KNR Constructions Ltd. 2.85Grindwell Norton Ltd. 2.79KEC International Ltd. 2.79The Ramco Cements Ltd. 2.57Ahluwalia Contracts (India) Ltd. 2.48Ashok Leyland Ltd. 2.06Torrent Power Ltd. 1.89KEI Industries Ltd. 1.85Cash & Cash Equivalent 1.74Total 100.00
Lumpsum Performance (As on 29th November, 2019)
Period
Returns % Value of r 10,000 invested
FundBenchmark Addl. BM
FundBenchmark Addl. BM
S&P BSE India Infrastructure TRI Nifty 50 TRI S&P BSE India
Infrastructure TRI Nifty 50 TRI
1 Year 8.38% -2.50% 12.38% 10,835 9,751 11,2343 Years 8.71% 0.61% 15.12% 12,846 10,183 15,2525 Years 5.35% 1.37% 8.39% 12,980 10,702 14,9677 Years 12.76% 7.70% 12.20% 23,173 16,806 22,38810 Years 8.44% 4.17% 10.48% 22,484 15,049 27,088Since Inception 4.70% 0.55% 7.93% 17,380 10,685 25,055(21 November, 2007)Past performance may or may not be sustained in future. BM - Benchmark. Different plans have different expense structure. For calculating returns since inception, NAV as on the date of allotment is taken as Rs. 10/-. Face Value per unit is Rs. 10/-. Please refer Page nos. 32-36 for performance of other Schemes managed by the Fund Managers and Page nos. 37-40 for performance of Direct Plans and respective Disclaimers. Also refer Note 1 below.
SIP Performance (As on 29th November, 2019)
SIPInvestment
Total amountinvested
(R)
Scheme S&P BSE India Infrastructure TRI Nifty 50 TRI2.1
Market value (R)
SIP Returns (%) XIRR
Market value (R)
SIP Returns (%) XIRR
Market value (R)
SIP Returns (%) XIRR
1 Year 120,000 126,170 9.75% 113,798 -9.51% 128,936 14.21%3 Years 360,000 380,597 3.66% 321,869 -7.16% 428,128 11.62%5 Years 600,000 693,201 5.72% 595,899 -0.27% 798,760 11.41%7 Years 840,000 1,226,936 10.65% 957,191 3.68% 1,288,625 12.03%Since Inception - - - - - - -(21 November, 2007)Past performance may or may not be sustained in future. 2.1Additional Benchmark. Returns for other periods not available as the Scheme was close-ended and re-opened for purchase on November 23, 2010, first SIP installment is taken as December 1, 2010. Please refer relative performance table for non SIP returns. SIP doesn’t ensure profit or guarantee protection against loss in a declining market. Load is not taken into consideration. XIRR method is used to calculate SIP returns assuming investment of Rs. 10,000/- on the first working day of every month. The above investment simulation is for illustrative purpose only and should not be construed as a promise on minimum returns and safeguard of capital. Also refer Note 1 below.
Note 1 : Returns above 1 year are CAGR. Returns are of existing plan (non - direct plan) - Growth Option. Benchmark returns are calculated using Total Return variant of respective Benchmark Index.
Fund P/E - FY20E is current price to earnings for FY20E, Fund P/B is 12 months trailing price to book value. Both are arrived at using Weighted Harmonic Mean which is an average resulting from the multiplication of the reciprocal of the observation for each component by the weightage of that stock in the portfolio/index. For 1,2, Note on Direct Plan, Dividend Distribution and Disclaimer, refer page no. 42.

14 of 42
Invesco India PSU Equity Fund(An open ended equity scheme following PSU theme)
RISKOMETER
Investors understand that their principal will be at high risk
Suitable for Investors who are seeking*
l Capital appreciation over long-terml Investments predominantly in equity and equity-related
instruments of Government companies (PSU’s)
*Investors should consult their financial advisers if in doubt about whether the product is suitable for them.
Industry Classification3
% of Net AssetsGas 19.76%Power 18.03%Petroleum Products 16.02%Banks 9.12%Services 6.94%Transportation 6.14%Ferrous Metals 5.93%Finance 5.03%Non - Ferrous Metals 3.90%Industrial Capital Goods 2.99%Minerals/Mining 0.98%Construction Project 0.87%3Industrywise Classification as per AMFI.
Dividend DistributionRecord Date Rate (R/Unit) Cum-Dividend
NAV p. u. (R)Dividend Option18-Nov-19 1.35 15.1930-Mar-17 1.67 16.3426-Nov-10 1.10 11.22Direct Plan - Dividend Option18-Nov-19 1.35 16.6930-Mar-17 1.67 17.2Past performance may or may not be sustained in future. Dividend is on face value of R10/- per unit. After the payment of dividend, the per unit NAV will fall to the extent of dividend payout and applicable statutory levy, if any.
Investment ObjectiveTo generate capital appreciation by investing in Equity and Equity Related Instruments of companies where the Central / State Government(s) has majority shareholding or management control or has powers to appoint majority of directors.
Key FactsLoad Structure Entry Load Nil Exit Load1 • Nil - if upto 10% of Units allotted
are redeemed / switched-out within 1 year from the date of allotment.
• 1% - for any redemption / switch-out in excess of 10% of units allotted within one year from the date of allotment.
• Nil - if units are redeemed or switched-out after 1 year from the date of allotment.
Switch between the Plans under the Scheme, please refer page no. 42.
Minimum Investment R 1,000/- & in multiples of R 1/- thereafter
Additional PurchaseR 1,000/- & in multiples of R 1/- thereafter
Date of Allotment 18th November, 2009
NAV p.u. (R) As on 29th November, 2019Growth 18.62 Dividend 13.56 Direct PlanGrowth 20.53 Dividend 15.05
Portfolio Turnover Ratio (1 Year) 0.64
Weighted Average Expense Ratio2 for the monthRegular 2.53%Direct 1.68%
Benchmark IndexS&P BSE PSU TRI
AAuM for the month of November 2019: R 84.51 croresAuM as on30th November, 2019: R 99.37 crores
Fund Manager & ExperiencePranav GokhaleTotal Experience 15 Years Experience in managing this fund: Since September 28, 2015Nitin GosarTotal Experience 14 Years Experience in managing this fund: Since June 1, 2018
Asset AllocationEquity Holdings 95.71%Cash & Cash Equivalent 4.29%
Performance AttributesStandard Deviation 4.89%Sharpe Ratio -0.004Beta 0.77Based on 3 years, monthly data points (Risk-free rate of 5.25% based on Overnight MIBOR)
Fund P/E - FY20E 12.7Fund P/B 1.8
Financial CharacteristicsAverage Weighted Market Capitalisation r 79,171 crores
Median Market Capitalisation r 28,939 crores
Source : Factset, Internal Data Files
Portfolio (As on 30th November, 2019) No. of Holdings : 17Company % of Net AssetsEquity & Equity Related Instruments 95.71State Bank of India 9.12NTPC Ltd. 9.02Power Grid Corporation of India Ltd. 9.01Bharat Petroleum Corporation Ltd. 8.91Gujarat State Petronet Ltd. 8.91Indian Oil Corporation Ltd. 7.10Indian Railway Catering And Tourism Corporation Ltd.
6.94
Container Corporation of India Ltd. 6.14
Company % of Net AssetsMishra Dhatu Nigam Ltd. 5.93GAIL (India) Ltd. 5.31SBI Life Insurance Company Ltd. 5.03Mahanagar Gas Ltd. 4.58National Aluminium Company Ltd. 3.90Bharat Electronics Ltd. 2.99MOIL Ltd. 0.98Indraprastha Gas Ltd. 0.96Rail Vikas Nigam Ltd. 0.87Cash & Cash Equivalent 4.29Total 100.00
Lumpsum Performance (As on 29th November, 2019)
PeriodReturns % Value of r 10,000 invested
FundBenchmark Addl. BM
FundBenchmark Addl. BM
S&P BSE PSU TRI Nifty 50 TRI S&P BSE PSU TRI Nifty 50 TRI1 Year 16.13% 6.86% 12.38% 11,608 10,684 11,2343 Years 3.68% -0.70% 15.12% 11,143 9,790 15,2525 Years 6.32% -0.43% 8.39% 13,591 9,787 14,9677 Years 9.24% 2.50% 12.20% 18,564 11,890 22,38810 Years 6.36% -0.26% 10.48% 18,527 9,744 27,088Since Inception 6.39% -0.33% 10.39% 18,620 9,670 26,970(18 November, 2009)Past performance may or may not be sustained in future. BM - Benchmark. Different plans have different expense structure. For calculating returns since inception, NAV as on the date of allotment is taken as Rs. 10/-. Face Value per unit is Rs. 10/-. Please refer Page nos. 32-36 for performance of other Schemes managed by the Fund Managers and Page nos. 37-40 for performance of Direct Plans and respective Disclaimers. Also refer Note 1 below.
SIP Performance (As on 29th November, 2019)
SIPInvestment
Total amountinvested
(R)
Scheme S&P BSE PSU TRI Nifty 50 TRI2.1
Market value (R)
SIP Returns (%) XIRR
Market value (R)
SIP Returns (%) XIRR
Market value (R)
SIP Returns (%) XIRR
1 Year 120,000 130,454 16.68% 121,267 1.98% 128,936 14.21%3 Years 360,000 376,916 3.01% 340,045 -3.68% 428,128 11.62%5 Years 600,000 699,845 6.10% 608,142 0.53% 798,760 11.41%7 Years 840,000 1,160,459 9.09% 915,176 2.42% 1,288,625 12.03%10 Years 1,200,000 1,814,104 8.02% 1,293,851 1.49% 2,192,585 11.60%Since Inception 1,210,000 1,832,724 7.99% 1,303,521 1.46% 2,219,555 11.58%(18 November, 2009)Past performance may or may not be sustained in future. 2.1Additional Benchmark. Load is not taken into consideration. XIRR method is used to calculate SIP returns assuming investment of Rs. 10,000/- on the first working day of every month. The above investment simulation is for illustrative purpose only and should not be construed as a promise on minimum returns and safeguard of capital. Also refer Note 1 below.
Note 1 : Returns above 1 year are CAGR. Returns are of existing plan (non - direct plan) - Growth Option. Benchmark returns are calculated using Total Return variant of respective Benchmark Index.
Fund P/E - FY20E is current price to earnings for FY20E, Fund P/B is 12 months trailing price to book value. Both are arrived at using Weighted Harmonic Mean which is an average resulting from the multiplication of the reciprocal of the observation for each component by the weightage of that stock in the portfolio/index. For 1,2, Note on Direct Plan, Dividend Distribution and Disclaimer, refer page no. 42.

15 of 42
Invesco India Arbitrage Fund(An open ended scheme investing in arbitrage opportunities)
RISKOMETER
Investors understand that their principal will be at moderately low risk
Suitable for Investors who are seeking*
l Income over medium-terml Income through opportunities emerging out of difference in pricing
between cash and derivatives markets and through deployment of surplus cash in fixed income instruments.
*Investors should consult their financial advisers if in doubt about whether the product is suitable for them.
For 1,2, Note on Direct Plan, Dividend Distribution and Disclaimer, refer page no. 42.
Investment ObjectiveTo generate income through arbitrage opportunities emerging out of difference in pricing between the cash market and the derivatives market and through deployment of surplus cash in fixed income instruments.
Key FactsLoad Structure Entry Load Nil Exit Load1 If redeemed/switched-out on or
before 15 Days from the date of allotment : 0.5%If redeemed/switched-out after 15 Days from the date of allotment : NilSwitch between the Plans under the Scheme, please refer page no. 42.
Minimum Investment R 1,000/- & in multiples of R 1/- thereafter
Additional PurchaseR 1,000/- & in multiples of R 1/- thereafter
Date of Allotment 30th April, 2007
NAV p.u. (R) As on 29th November, 2019Growth 23.4881 Dividend 12.9939 Bonus 15.6590 Annual Bonus - Direct PlanGrowth 24.4655 Dividend 13.7434 Bonus - Annual Bonus 24.4646
Portfolio Turnover Ratio (1 Year) 10.37
Weighted Average Expense Ratio2 for the monthRegular 1.05%Direct 0.45%
Benchmark IndexNifty 50 Arbitrage
AAuM for the month of November 2019: R 245.08 croresAuM as on30th November, 2019: R 250.23 crores
Fund Manager & ExperiencePranav GokhaleTotal Experience 15 Years Experience in managing this fund: Since April 01, 2011
Asset AllocationEquity Holdings 66.94%Fixed Deposits 15.95%Cash & Cash Equivalent 17.11%The Scheme is having exposure to Stock Futures (Short) against the above Equity Stocks and the Gross Exposure Derivatives is 67.20% of Net Assets.
Portfolio (As on 30th November, 2019)
Company % of Net AssetsEquity & Equity Related Instruments 66.94Housing Development Finance Corp. Ltd. 7.85Tata Consultancy Services Ltd. 7.43Reliance Industries Ltd. 7.25Asian Paints Ltd. 5.56Bajaj Finance Ltd. 5.45ITC Ltd. 4.96Infosys Ltd. 4.88HCL Technologies Ltd. 2.71Mahindra & Mahindra Ltd. 2.69Sun Pharmaceutical Industries Ltd. 1.90Grasim Industries Ltd. 1.84Hero MotoCorp Ltd. 1.83Vedanta Ltd. 1.77GAIL (India) Ltd. 1.75Maruti Suzuki India Ltd. 1.24
Company % of Net AssetsUltraTech Cement Ltd. 1.19Bharat Petroleum Corporation Ltd. 1.10United Spirits Ltd. 1.06Indian Oil Corporation Ltd. 0.79IndusInd Bank Ltd. 0.75ACC Ltd. 0.68Bajaj Auto Ltd. 0.63Aurobindo Pharma Ltd. 0.54Britannia Industries Ltd. 0.51Adani Ports and Special Economic Zone Ltd. 0.34Cipla Ltd. 0.13Tata Motors Ltd. 0.10Fixed Deposits 15.95HDFC Bank Ltd. 15.95Derivatives, Cash & Cash Equivalent 17.11Total 100.00
Lumpsum Performance (As on 29th November, 2019)
PeriodReturns % Value of r 10,000 invested
FundBenchmark Addl. BM
FundBenchmark Addl. BM
Nifty 50 Arbitrage^ Nifty 50 TRI Nifty 50 Arbitrage^ Nifty 50 TRI1 Year 5.93% 6.53% 12.38% 10,591 10,651 11,2343 Years 5.90% 5.20% 15.12% 11,874 11,640 15,2525 Years 6.40% 6.05% 8.39% 13,639 13,416 14,9677 Years 6.85% 6.69% 12.20% 15,902 15,736 22,38810 Years 6.97% NA 10.48% 19,624 NA 27,088Since Inception 7.02% NA 10.28% 23,488 NA 34,285(30 April, 2007)Past performance may or may not be sustained in future. BM - Benchmark. Different plans have different expense structure. For calculating returns since inception, NAV as on the date of allotment is taken as Rs. 10/-. Face Value per unit is Rs. 10/-. Please refer Page nos. 32-36 for performance of other Schemes managed by the Fund Managers and Page nos. 37-40 for performance of Direct Plans and respective Disclaimers. Also refer Note 1 below.
SIP Performance (As on 29th November, 2019)
SIPInvestment
Total amountinvested
(R)
Scheme Nifty 50 Arbitrage^ Nifty 50 TRI2.1
Market value (R)
SIP Returns (%) XIRR
Market value (R)
SIP Returns (%) XIRR
Market value (R)
SIP Returns (%) XIRR
1 Year 120,000 123,978 6.25% 124,171 6.56% 128,936 14.21%3 Years 360,000 394,264 6.01% 392,549 5.72% 428,128 11.62%5 Years 600,000 699,288 6.07% 691,919 5.65% 798,760 11.41%7 Years 840,000 1,054,150 6.40% 1,042,224 6.08% 1,288,625 12.03%10 Years 1,200,000 1,702,521 6.81% NA NA 2,192,585 11.60%Since Inception 1,510,000 2,360,914 6.83% NA NA 3,226,622 11.40%(30 April, 2007)
Past performance may or may not be sustained in future. 2.1Additional Benchmark. Load is not taken into consideration. XIRR method is used to calculate SIP returns assuming investment of Rs. 10,000/- on the first working day of every month. The above investment simulation is for illustrative purpose only and should not be construed as a promise on minimum returns and safeguard of capital. Also refer Note 1 below.
Note 1 : Returns above 1 year are CAGR. Returns are of existing plan (non - direct plan) - Growth Option.
^The inception date of the Scheme is 30 April, 2007 which is prior to the date (i.e. 01 April, 2010) from which figures for Nifty 50 Arbitrage Index (Benchmark Index) are available. Hence returns since inception and for other required periods are not available for Nifty 50 Arbitrage Index. NA - Not Available
The Scheme is having exposure to Stock Futures (Short) against the above Equity Stocks and the Gross Exposure Derivatives is 67.20% of Net Assets.
Industry Classification3
% of Net AssetsSoftware 15.01%Finance 13.30%Consumer Non Durables 12.10%Petroleum Products 9.15%Auto 6.49%Cement 3.71%Pharmaceuticals 2.57%Non - Ferrous Metals 1.77%Gas 1.75%Banks 0.75%Transportation 0.34%3Industrywise Classification as per AMFI.
Dividend DistributionRecord Date Rate (R/Unit) Cum-Dividend
NAV p. u. (R)Dividend Option21-Nov-19 0.03541641 13.024122-Oct-19 0.07083282 13.036119-Sep-19 0.07083282 13.0476Direct Plan - Dividend Option21-Nov-19 0.03541641 13.771222-Oct-19 0.07083282 13.772519-Sep-19 0.07083282 13.7727Past performance may or may not be sustained in future. Dividend is on face value of R10/- per unit. After the payment of dividend, the per unit NAV will fall to the extent of dividend payout and applicable statutory levy, if any.

For 1,2,2a, Note on Direct Plan, Dividend Distribution and Disclaimer, refer page no. 4216 of 42
Invesco India Feeder - Invesco Pan European Equity Fund(An open ended fund of fund scheme investing in Invesco Pan European Equity Fund)
RISKOMETER
Investors understand that their principal will be at high risk
Suitable for Investors who are seeking*
l Capital appreciation over long-terml Investment in units of Invesco Pan European Equity Fund,
an overseas equity fund
*Investors should consult their financial advisers if in doubt about whether the product is suitable for them.
Investment ObjectiveTo generate capital appreciation by investing predominantly in units of Invesco Pan European Equity Fund, an overseas equity fund which invests primarily in equity securities of European companies with an emphasis on larger companies. The Scheme may, at the discretion of Fund Manager, also invest in units of other similar Overseas Mutual Funds with similar objectives, strategy and attributes which may constitute a significant portion of its net assets.
Key FactsLoad Structure Entry Load Nil Exit Load1 • Nil - if upto 10% of Units allotted
are redeemed / switched-out within 1 year from the date of allotment.
• 1% - for any redemption / switch-out in excess of 10% of units allotted within one year from the date of allotment.
• Nil - if units are redeemed or switched-out after 1 year from the date of allotment.
Switch between the Plans under the Scheme, please refer page no. 42.
Minimum Investment R 1,000/- & in multiples of R 1/- thereafter
Additional PurchaseR 1,000/- & in multiples of R 1/- thereafter
Date of Allotment 31st January, 2014
NAV p.u. (R) As on 29th November, 2019Growth 10.9485 Dividend 10.9473 Direct PlanGrowth 11.6445 Dividend 11.6289
Weighted Average Expense Ratio2, 2a
for the monthRegular 0.65%Direct 0.11%
Benchmark IndexMSCI Europe - Net Dividend
AAuM for the month of November 2019: R 27.96 croresAuM as on30th November, 2019: R 28.19 crores
Fund Manager & ExperienceNeelesh DhamnaskarTotal Experience 13 Years Experience in managing this fund: Since January 31, 2014
Asset AllocationUnits of Overseas Mutual Fund 97.94%Cash & Cash Equivalent 2.06%
Portfolio (As on 30th November, 2019)
Company % of Net AssetsOverseas Mutual Fund Units 97.94Invesco Pan European Equity Fund Accumulated C 97.94Cash & Cash Equivalent 2.06Total 100.00
The investor will bear the recurring expenses of the scheme, in addition to the expenses of underlying scheme.
Lumpsum Performance (As on 29th November, 2019)
PeriodReturns % Value of r 10,000 invested
FundBenchmark
FundBenchmark
MSCI Europe - Net Dividend MSCI Europe - Net Dividend1 Year 6.42% 16.37% 10,640 11,6333 Years 6.64% 11.75% 12,125 13,9525 Years 2.57% 6.36% 11,356 13,616Since Inception 1.57% 5.52% 10,948 13,681(31 January, 2014)Past performance may or may not be sustained in future. Returns above 1 year are CAGR. Returns are of existing plan (non - direct plan) - Growth Option. Different plans have different expense structure. For calculating returns since inception, NAV as on the date of allotment is taken as Rs. 10/-. Face Value per unit is Rs. 10/-. Please refer Page nos. 32-36 for performance of other Schemes managed by the Fund Managers and Page nos. 37-40 for performance of Direct Plans and respective Disclaimers.

For 1,2,2a, Note on Direct Plan, Dividend Distribution and Disclaimer, refer page no. 42 17 of 42
Invesco India Feeder - Invesco Global Equity Income Fund(An open ended fund of fund scheme investing in Invesco Global Equity Income Fund)
RISKOMETER
Investors understand that their principal will be at high risk
Suitable for Investors who are seeking*
l Capital appreciation and / or income over long-term l I nvestment in units of Invesco Global Equity Income Fund,
an overseas equity fund
*Investors should consult their financial advisers if in doubt about whether the product is suitable for them.
Investment ObjectiveTo provide capital appreciation and/or income by investing predominantly in units of Invesco Global Equity Income Fund, an overseas equity fund which invests primarily in equities of companies worldwide. The Scheme may, at the discretion of Fund Manager, also invest in units of other similar Overseas Mutual Funds with similar objectives, strategy and attributes which may constitute a significant portion of its net assets.
Key FactsLoad Structure Entry Load Nil Exit Load1 • Nil - if upto 10% of Units allotted
are redeemed / switched-out within 1 year from the date of allotment.
• 1% - for any redemption / switch-out in excess of 10% of units allotted within one year from the date of allotment.
• Nil - if units are redeemed or switched-out after 1 year from the date of allotment.
Switch between the Plans under the Scheme, please refer page no. 42.
Minimum Investment R 1,000/- & in multiples of R 1/- thereafter
Additional PurchaseR 1,000/- & in multiples of R 1/- thereafter
Date of Allotment 5th May, 2014
NAV p.u. (R) As on 29th November, 2019Growth 13.7535 Dividend 13.7329 Direct PlanGrowth 14.6887 Dividend 14.5802
Weighted Average Expense Ratio2, 2a
for the monthRegular 1.10%Direct 0.52%
Benchmark IndexMSCI World Index - Net Dividend
AAuM for the month of November 2019: R 7.35 croresAuM as on30th November, 2019: R 7.68 crores
Fund Manager & ExperienceNeelesh DhamnaskarTotal Experience 13 Years Experience in managing this fund: Since May 5, 2014
Asset AllocationUnits of Overseas Mutual Fund 97.37%Cash & Cash Equivalent 2.63%
Portfolio (As on 30th November, 2019)
Company % of Net AssetsOverseas Mutual Fund Units 97.37Invesco Global Equity Income Fund Accumulated C 97.37Cash & Cash Equivalent 2.63Total 100.00
The investor will bear the recurring expenses of the scheme, in addition to the expenses of underlying scheme.
Lumpsum Performance (As on 29th November, 2019)
PeriodReturns % Value of r 10,000 invested
FundBenchmark
FundBenchmark
MSCI World Index - Net Dividend MSCI World Index - Net Dividend1 Year 13.43% 18.14% 11,339 11,8083 Years 8.85% 14.17% 12,892 14,8785 Years 6.27% 10.92% 13,561 16,796Since Inception 5.89% 11.14% 13,754 18,010(05 May, 2014)Past performance may or may not be sustained in future. Returns above 1 year are CAGR. Returns are of existing plan (non - direct plan) - Growth Option. Different plans have different expense structure. For calculating returns since inception, NAV as on the date of allotment is taken as Rs. 10/-. Face Value per unit is Rs. 10/-. Please refer Page nos. 32-36 for performance of other Schemes managed by the Fund Managers and Page nos. 37-40 for performance of Direct Plans and respective Disclaimers.
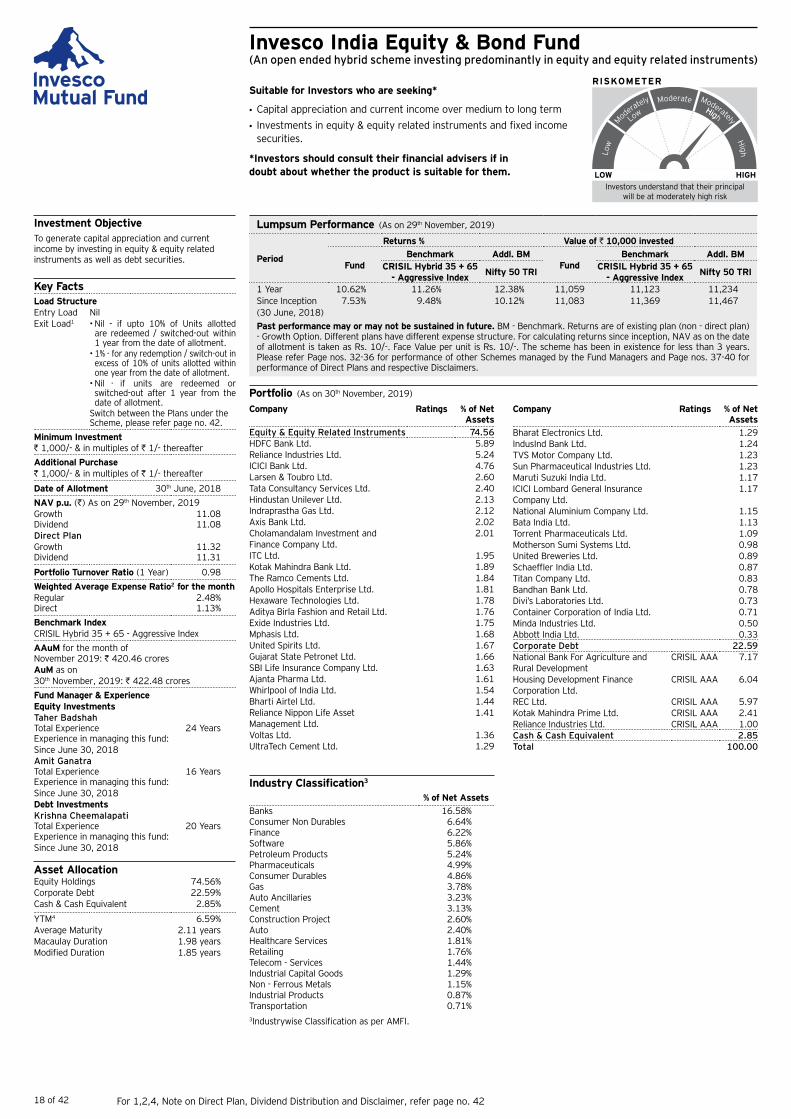
18 of 42 For 1,2,4, Note on Direct Plan, Dividend Distribution and Disclaimer, refer page no. 42
Invesco India Equity & Bond Fund(An open ended hybrid scheme investing predominantly in equity and equity related instruments)
RISKOMETER
Investors understand that their principal will be at moderately high risk
Suitable for Investors who are seeking*
l Capital appreciation and current income over medium to long terml Investments in equity & equity related instruments and fixed income
securities.
*Investors should consult their financial advisers if in doubt about whether the product is suitable for them.
Industry Classification3
% of Net AssetsBanks 16.58%Consumer Non Durables 6.64%Finance 6.22%Software 5.86%Petroleum Products 5.24%Pharmaceuticals 4.99%Consumer Durables 4.86%Gas 3.78%Auto Ancillaries 3.23%Cement 3.13%Construction Project 2.60%Auto 2.40%Healthcare Services 1.81%Retailing 1.76%Telecom - Services 1.44%Industrial Capital Goods 1.29%Non - Ferrous Metals 1.15%Industrial Products 0.87%Transportation 0.71%3Industrywise Classification as per AMFI.
Investment ObjectiveTo generate capital appreciation and current income by investing in equity & equity related instruments as well as debt securities.
Key FactsLoad Structure Entry Load Nil Exit Load1 • Nil - if upto 10% of Units allotted
are redeemed / switched-out within 1 year from the date of allotment.
• 1% - for any redemption / switch-out in excess of 10% of units allotted within one year from the date of allotment.
• Nil - if units are redeemed or switched-out after 1 year from the date of allotment.
Switch between the Plans under the Scheme, please refer page no. 42.
Minimum Investment R 1,000/- & in multiples of R 1/- thereafter
Additional PurchaseR 1,000/- & in multiples of R 1/- thereafter
Date of Allotment 30th June, 2018
NAV p.u. (R) As on 29th November, 2019Growth 11.08 Dividend 11.08 Direct PlanGrowth 11.32 Dividend 11.31
Portfolio Turnover Ratio (1 Year) 0.98
Weighted Average Expense Ratio2 for the monthRegular 2.48%Direct 1.13%
Benchmark IndexCRISIL Hybrid 35 + 65 - Aggressive Index
AAuM for the month of November 2019: R 420.46 croresAuM as on30th November, 2019: R 422.48 crores
Fund Manager & ExperienceEquity InvestmentsTaher BadshahTotal Experience 24 Years Experience in managing this fund: Since June 30, 2018Amit GanatraTotal Experience 16 Years Experience in managing this fund: Since June 30, 2018Debt InvestmentsKrishna CheemalapatiTotal Experience 20 Years Experience in managing this fund: Since June 30, 2018
Asset AllocationEquity Holdings 74.56%Corporate Debt 22.59%Cash & Cash Equivalent 2.85%
YTM4 6.59%Average Maturity 2.11 yearsMacaulay Duration 1.98 yearsModified Duration 1.85 years
Portfolio (As on 30th November, 2019)
Company Ratings % of Net Assets
Equity & Equity Related Instruments 74.56HDFC Bank Ltd. 5.89Reliance Industries Ltd. 5.24ICICI Bank Ltd. 4.76Larsen & Toubro Ltd. 2.60Tata Consultancy Services Ltd. 2.40Hindustan Unilever Ltd. 2.13Indraprastha Gas Ltd. 2.12Axis Bank Ltd. 2.02Cholamandalam Investment and Finance Company Ltd.
2.01
ITC Ltd. 1.95Kotak Mahindra Bank Ltd. 1.89The Ramco Cements Ltd. 1.84Apollo Hospitals Enterprise Ltd. 1.81Hexaware Technologies Ltd. 1.78Aditya Birla Fashion and Retail Ltd. 1.76Exide Industries Ltd. 1.75Mphasis Ltd. 1.68United Spirits Ltd. 1.67Gujarat State Petronet Ltd. 1.66SBI Life Insurance Company Ltd. 1.63Ajanta Pharma Ltd. 1.61Whirlpool of India Ltd. 1.54Bharti Airtel Ltd. 1.44Reliance Nippon Life Asset Management Ltd.
1.41
Voltas Ltd. 1.36UltraTech Cement Ltd. 1.29
Company Ratings % of Net Assets
Bharat Electronics Ltd. 1.29IndusInd Bank Ltd. 1.24TVS Motor Company Ltd. 1.23Sun Pharmaceutical Industries Ltd. 1.23Maruti Suzuki India Ltd. 1.17ICICI Lombard General Insurance Company Ltd.
1.17
National Aluminium Company Ltd. 1.15Bata India Ltd. 1.13Torrent Pharmaceuticals Ltd. 1.09Motherson Sumi Systems Ltd. 0.98United Breweries Ltd. 0.89Schaeffler India Ltd. 0.87Titan Company Ltd. 0.83Bandhan Bank Ltd. 0.78Divi’s Laboratories Ltd. 0.73Container Corporation of India Ltd. 0.71Minda Industries Ltd. 0.50Abbott India Ltd. 0.33Corporate Debt 22.59National Bank For Agriculture and Rural Development
CRISIL AAA 7.17
Housing Development Finance Corporation Ltd.
CRISIL AAA 6.04
REC Ltd. CRISIL AAA 5.97Kotak Mahindra Prime Ltd. CRISIL AAA 2.41Reliance Industries Ltd. CRISIL AAA 1.00Cash & Cash Equivalent 2.85Total 100.00
Lumpsum Performance (As on 29th November, 2019)
Period
Returns % Value of r 10,000 invested
FundBenchmark Addl. BM
FundBenchmark Addl. BM
CRISIL Hybrid 35 + 65 - Aggressive Index
Nifty 50 TRICRISIL Hybrid 35 + 65
- Aggressive IndexNifty 50 TRI
1 Year 10.62% 11.26% 12.38% 11,059 11,123 11,234Since Inception 7.53% 9.48% 10.12% 11,083 11,369 11,467(30 June, 2018)Past performance may or may not be sustained in future. BM - Benchmark. Returns are of existing plan (non - direct plan) - Growth Option. Different plans have different expense structure. For calculating returns since inception, NAV as on the date of allotment is taken as Rs. 10/-. Face Value per unit is Rs. 10/-. The scheme has been in existence for less than 3 years. Please refer Page nos. 32-36 for performance of other Schemes managed by the Fund Managers and Page nos. 37-40 for performance of Direct Plans and respective Disclaimers.

19 of 42
Invesco India Equity Savings Fund(An open ended scheme investing in equity, arbitrage and debt)
RISKOMETER
Investors understand that their principal will be at moderately high risk
Suitable for Investors who are seeking*
l Capital appreciation and current incomel Investments in equity and equity related instruments, arbitrage
opportunities and fixed income instruments (including debt, government securities and money market instruments)
*Investors should consult their financial advisers if in doubt about whether the product is suitable for them.
Industry Classification3
% of Net AssetsFinance 13.04%Consumer Non Durables 11.05%Banks 10.64%Software 9.07%Petroleum Products 5.02%Pharmaceuticals 4.65%Construction Project 2.35%Consumer Durables 1.52%Non - Ferrous Metals 1.45%Auto 1.32%Cement 1.28%Transportation 1.27%Gas 0.87%Healthcare Services 0.67%Telecom - Services 0.67%Fertilisers 0.63%Retailing 0.59%Industrial Products 0.54%Ferrous Metals 0.49%Auto Ancillaries 0.25%Services 0.24%3Industrywise Classification as per AMFI.
Investment ObjectiveTo generate capital appreciation and income by investing in equity & equity related instruments, arbitrage opportunities and fixed income instruments (including debt, government securities and money market instruments).
Key FactsLoad Structure Entry Load Nil Exit Load1 • If redeemed / switched-out on or
before 1 month from the date of allotment : 0.25%.
• If redeemed / switched-out after 1 month from the date of allotment : Nil
Switch between the Plans under the Scheme, please refer page no. 42.
Minimum Investment R 1,000/- & in multiples of R 1/- thereafter
Additional PurchaseR 1,000/- & in multiples of R 1/- thereafter
Date of Allotment 7th March, 2019
NAV p.u. (R) As on 29th November, 2019Growth 10.57 Dividend 10.57 Direct PlanGrowth 10.72 Dividend 10.70
Weighted Average Expense Ratio2 for the monthRegular 2.37%Direct 0.50%
Benchmark IndexNifty Equity Savings Index
AAuM for the month of November 2019: R 234.35 croresAuM as on30th November, 2019: R 222.43 crores
Fund Manager & ExperienceEquity InvestmentsTaher BadshahTotal Experience 24 Years Experience in managing this fund: Since March 7, 2019Amit GanatraTotal Experience 16 Years Experience in managing this fund: Since March 7, 2019Debt InvestmentsKrishna CheemalapatiTotal Experience 20 Years Experience in managing this fund: Since March 7, 2019
Asset AllocationEquity Holdings 67.62%Corporate Debt 18.32%Fixed Deposits 10.70%Cash & Cash Equivalent 3.36%
YTM4 7.00%Average Maturity 2.04 yearsMacaulay Duration 1.88 yearsModified Duration 1.76 years
Portfolio (As on 30th November, 2019)
Company Ratings % of Net Assets
Equity & Equity Related Instruments 67.62Housing Development Finance Corporation Ltd.
6.20
ITC Ltd. 5.53Bajaj Finance Ltd. 5.33Reliance Industries Ltd. 4.64Tata Consultancy Services Ltd. 3.95Infosys Ltd. 3.72HDFC Bank Ltd. 3.38ICICI Bank Ltd. 3.14Cipla Ltd. 3.11Axis Bank Ltd. 2.79United Spirits Ltd. 2.58Larsen & Toubro Ltd. 2.35Hindalco Industries Ltd. 1.45Kotak Mahindra Bank Ltd. 1.33Asian Paints Ltd. 1.24Hindustan Unilever Ltd. 1.18UltraTech Cement Ltd. 0.91Maruti Suzuki India Ltd. 0.83VIP Industries Ltd. 0.71Apollo Hospitals Enterprise Ltd. 0.67Bharti Airtel Ltd. 0.67Sanofi India Ltd. 0.66Titan Company Ltd. 0.64Coromandel International Ltd. 0.63Mphasis Ltd. 0.62Hexaware Technologies Ltd. 0.60Aditya Birla Fashion and Retail Ltd. 0.59
Company Ratings % of Net Assets
Cholamandalam Investment and Finance Company Ltd.
0.58
Schaeffler India Ltd. 0.54ICICI Lombard General Insurance Co. Ltd. 0.53TCI Express Ltd. 0.53United Breweries Ltd. 0.52TVS Motor Company Ltd. 0.49Mishra Dhatu Nigam Ltd. 0.49Divi’s Laboratories Ltd. 0.47Indraprastha Gas Ltd. 0.44Gujarat State Petronet Ltd. 0.43Torrent Pharmaceuticals Ltd. 0.41Reliance Nippon Life Asset Management Ltd.
0.40
Container Corporation of India Ltd. 0.39Bharat Petroleum Corporation Ltd. 0.38Grasim Industries Ltd. 0.37Mahindra Logistics Ltd. 0.36Minda Industries Ltd. 0.25Indian Railway Catering And Tourism Corporation Ltd.
0.24
HCL Technologies Ltd. 0.18Whirlpool of India Ltd. 0.18Corporate Debt 18.32Housing Development Finance Corp. Ltd. CRISIL AAA 11.46HDB Financial Services Ltd. CRISIL AAA 6.85Fixed Deposits 10.70HDFC Bank Ltd. 10.70Derivatives, Cash & Cash Equivalent 3.36Total 100.00
Out of 67.63% equity exposure, unhedged is 36.74% and balance is hedged.

20 of 42 For 1,2,4, Note on Direct Plan, Dividend Distribution and Disclaimer, refer page no. 42
Company Rating of Net Assets
Money Market Instruments 81.09Certificate of DepositBank of Baroda FITCH A1+ 4.24Small Industries Dev Bank of India CARE A1+ 1.77ICICI Bank Ltd. ICRA A1+ 1.42IDFC First Bank Ltd. ICRA A1+ 1.42Axis Bank Ltd. ICRA A1+ 0.71IndusInd Bank Ltd. CRISIL A1+ 0.35Commercial PaperNTPC Ltd. ICRA A1+ 4.26UltraTech Cement Ltd. CRISIL A1+ 4.24Reliance Jio Infocomm Ltd. CRISIL A1+ 4.23Hindustan Petroleum Corporation Ltd. CRISIL A1+ 3.56Indian Oil Corporation Ltd. ICRA A1+ 3.56Aditya Birla Housing Finance Ltd. ICRA A1+ 3.55National Housing Bank ICRA A1+ 2.85Grasim Industries Ltd. CRISIL A1+ 2.85Larsen & Toubro Ltd. ICRA A1+ 2.84Sun Pharmaceutical Industries Ltd. ICRA A1+ 2.82Reliance Jio Infocomm Ltd. CARE A1+ 2.14Bajaj Finance Ltd. ICRA A1+ 2.14Bajaj Housing Finance Ltd. CRISIL A1+ 2.12ICICI Sec Primary Dealership Ltd. CRISIL A1+ 1.78Muthoot Finance Ltd. CRISIL A1+ 1.63Reliance Retail Ltd. CARE A1+ 1.43Rashtriya Chemicals and Fertilizers Ltd. ICRA A1+ 1.43Sundaram Finance Ltd. CRISIL A1+ 1.42Bajaj Finance Ltd. CRISIL A1+ 1.42Tata Capital Housing Finance Ltd. ICRA A1+ 1.42Reliance Retail Ltd. CRISIL A1+ 1.42
Company Rating of Net Assets
Axis Finance Ltd. CRISIL A1+ 1.42Aditya Birla Finance Ltd. ICRA A1+ 1.41Bajaj Housing Finance Ltd. FITCH A1+ 1.41Godrej Consumer Products Ltd. CRISIL A1+ 1.41Berger Paints (I) Ltd. CRISIL A1+ 1.14Godrej Industries Ltd. ICRA A1+ 1.14REC Ltd. CARE A1+ 1.07SRF Ltd. CRISIL A1+ 1.06Larsen & Toubro Ltd. CRISIL A1+ 1.06Godrej Industries Ltd. CRISIL A1+ 0.92Alembic Pharmaceuticals Ltd. CRISIL A1+ 0.71Vedanta Ltd. CRISIL A1+ 0.71NTPC Ltd. CRISIL A1+ 0.71Hero Fincorp Ltd. CRISIL A1+ 0.71REC Ltd. CRISIL A1+ 0.71HDB Financial Services Ltd. CRISIL A1+ 0.57Blue Star Ltd. CRISIL A1+ 0.36Treasury Bill91 Days Tbill (MD 20/02/2020) Sovereign 1.4191 Days Tbill (MD 30/01/2020) Sovereign 0.14Corporate Debt 4.12Power Finance Corporation Ltd. CRISIL AAA 1.29LIC Housing Finance Ltd. CRISIL AAA 1.00Housing Development Finance Corporation Ltd.
CRISIL AAA 0.57
NHPC Ltd. CARE AAA 0.50HDB Financial Services Ltd. CRISIL AAA 0.40Sundaram Finance Ltd. ICRA AAA 0.36Cash & Cash Equivalent 14.79Total 100.00
Dividend DistributionRecord Date Rate (R/Unit) Cum-Dividend NAV p. u. (R)
Individuals/HUF OthersMonthly Dividend28-Nov-19 2.97925399 2.75880470 1,007.0860 30-Oct-19 3.71859304 3.44343650 1,008.1124 27-Sep-19 2.94813606 2.72998933 1,007.0428 Direct Plan - Monthly Dividend28-Nov-19 3.09342511 2.86452775 1,031.8035 30-Oct-19 3.84536980 3.56083244 1,032.8474 27-Sep-19 3.06151482 2.83497866 1,031.7592 Past performance may or may not be sustained in future. Dividend is on face value of R 1000/- per unit. After the payment of dividend, the per unit NAV will fall to the extent of dividend payout and applicable statutory levy, if any.
Invesco India Liquid Fund(An open ended liquid scheme)
RISKOMETER
Investors understand that their principal will be at low risk
Suitable for Investors who are seeking*
l Income over short terml Investments predominantly in money market and debt instruments
commensurate with low risk and high liquidity
*Investors should consult their financial advisers if in doubt about whether the product is suitable for them.
Investment ObjectiveTo generate income commensurate with low risk and high liquidity, through a portfolio of debt and Money Market Instruments.
Key FactsLoad Structure Entry Load Nil Exit Load1 (w.e.f. October 20, 2019)Redemption within “X” number of days from the Date of Allotment*
Exit Load
1 Day 0.0070%2 Days 0.0065%3 Days 0.0060%4 Days 0.0055%5 Days 0.0050%6 Days 0.0045%On or after 7 Days Nil*Date of Allotment is date of subscription NAV.For further details please refer Addendum dated October 18, 2019 uploaded on our website www.invescomutualfund.com
Minimum Investment R 1,000/- & in multiples of R 1/- thereafterAdditional PurchaseR 1,000/- & in multiples of R 1/- thereafterDate of Allotment 17th November, 2006
NAV p.u. (R) As on 30th November, 2019Growth 2,668.3975 Daily Dividend 1,001.7798 Weekly Dividend 1,003.5898 Monthly Dividend 1,003.2592 Bonus 2,668.7786 Direct PlanGrowth 2,680.9149 Daily Dividend 1,000.9596 Weekly Dividend 1,001.2825 Monthly Dividend 1,027.8297 Regular PlanGrowth 2,433.7950 Weekly Dividend 1,001.8161 Weighted Average Expense Ratio2 for the monthRegular 0.23%Direct 0.16%Benchmark IndexCRISIL Liquid Fund Index
AAuM for the month of November 2019: R 6,340.58 croresAuM as on30th November, 2019: R 7,002.61 croresFund Manager & ExperienceKrishna Cheemalapati Total Experience 20 Years Experience in managing this fund: Since April 25, 2011Abhishek BandiwdekarTotal Experience 12 Years Experience in managing this fund: Since July 24, 2018
Portfolio (As on 30th November, 2019)
Lumpsum Performance (As on 30th November, 2019)
Period
Returns % Value of r 10,000 invested
FundFund -
Regular
Benchmark Addl. BM
FundFund -
Regular
Benchmark Addl. BMCRISIL
Liquid Fund Index
CRISIL 91 Days T Bill
Index
CRISIL Liquid Fund
Index
CRISIL 91 Days T Bill
Index1 Year 6.69% 6.12% 7.04% 6.75% 10,669 10,612 10,704 10,6753 Years 6.90% 6.30% 7.04% 6.63% 12,215 12,011 12,264 12,1235 Years 7.38% 6.69% 7.41% 7.03% 14,279 13,826 14,297 14,0547 Years 7.89% 7.00% 7.89% 7.50% 17,019 16,059 17,017 16,59110 Years 7.90% 7.04% 7.65% 7.01% 21,397 19,752 20,911 19,690Since Inception 7.81% 7.06% 7.50% 6.54% 26,684 24,338 25,694 22,842(17 November, 2006)Past performance may or may not be sustained in future. BM - Benchmark. Returns above 1 year are CAGR. Returns are of existing plan (non - direct plan) - Growth Option. Different plans have different expense structure. For calculating returns since inception, NAV as on the date of allotment is taken as Rs. 1,000/-. Face Value per unit is Rs. 1,000/-. Please refer Page nos. 32-36 for performance of other Schemes managed by the Fund Managers and Page nos. 37-40 for performance of Direct Plans and respective Disclaimers.
Maturity Profile< 31 days 34.31%31 - 60 days 18.54%61 - 91 days 32.36%Cash & Cash Equivalent 14.79%YTM4 5.12%Average Maturity 40 daysMacaulay Duration 40 daysModified Duration 37 days
Aggregate Investments by other schemes i.e Inter - scheme investment in the portfolio is Nil as on November 30, 2019.Rating Profile
A1+ 79.54%
AAA 4.12%Sovereign 1.55%Cash & Cash Equivalent 14.79%

21 of 42For 1,2,4, Note on Direct Plan, Dividend Distribution and Disclaimer, refer page no. 42
Rating ProfileAAA 84.96%
A1+ 2.93%
Cash & Cash Equivalent 12.11%
Company Rating % of Net Assets
Corporate Debt 84.96Power Finance Corporation Ltd. CRISIL AAA 8.13National Bank For Agriculture and Rural Development
CRISIL AAA 8.12
Reliance Industries Ltd. CRISIL AAA 7.79National Housing Bank CARE AAA 7.69REC Ltd. CRISIL AAA 7.52Housing Development Finance Corporation Ltd.
CRISIL AAA 6.90
Small Industries Dev Bank of India CARE AAA 6.33Bajaj Finance Ltd. CRISIL AAA 4.67LIC Housing Finance Ltd. CARE AAA 3.79Housing & Urban Development Corporation Ltd.
ICRA AAA 3.42
Company Rating % of Net Assets
LIC Housing Finance Ltd. CRISIL AAA 3.15Indian Railway Finance Corp. Ltd. CRISIL AAA 3.12Larsen & Toubro Ltd. CRISIL AAA 3.11Kotak Mahindra Prime Ltd. CRISIL AAA 2.73Sundaram Finance Ltd. ICRA AAA 2.50Sundaram Finance Ltd. CRISIL AAA 2.20Power Grid Corporation of India Ltd. CRISIL AAA 1.60HDB Financial Services Ltd. CRISIL AAA 1.56NHPC Ltd. CARE AAA 0.63Money Market Instruments 2.93Certificate of DepositAxis Bank Ltd. CRISIL A1+ 2.93Cash & Cash Equivalent 12.11Total 100.00
Dividend DistributionRecord Date Rate (R/Unit) Cum-Dividend NAV p. u. (R)
Individuals/HUF OthersMonthly Dividend28-Nov-19 4.92651719 4.56198055 1,051.8808 30-Oct-19 4.78683258 4.43263187 1,051.9857 27-Sep-19 4.44468442 4.11580089 1,047.0522 Direct Plan - Monthly Dividend28-Nov-19 5.23121230 4.84412981 1,074.0255 30-Oct-19 5.08109083 4.70511655 1,074.1472 27-Sep-19 4.95676938 4.58999424 1,069.4032 Discretionary Dividend16-Jan-12 N.A. 23.73203670 1,031.4432 26-Sep-11 N.A. 2.5587222 1,006.0226 21-Jul-11 N.A. 6.70331059 1,008.8782 Regular Plan - Monthly Dividend28-Nov-19 4.86612165 4.50605397 1,117.2566 30-Oct-19 4.63499703 4.29203136 1,117.2485 27-Sep-19 4.34779958 4.02608503 1,112.0901 Past performance may or may not be sustained in future. Dividend is on face value of R 1000/- per unit. After the payment of dividend, the per unit NAV will fall to the extent of dividend payout and applicable statutory levy, if any.
^Please refer to the heading ‘C. Asset Allocation Pattern’ under Section ‘II. Information about the Scheme’ of Scheme Information Document where the concept of Macaulay duration has been explained.
Invesco India Treasury Advantage Fund(An open ended low duration debt scheme investing in instruments such that the Macaulay duration^ of the portfolio is between 6 months to 12 months)
RISKOMETER
Investors understand that their principal will be at moderately low risk
Suitable for Investors who are seeking*
l Income over short terml Investment in debt and money market instruments
*Investors should consult their financial advisers if in doubt about whether the product is suitable for them.
Investment ObjectiveTo generate income by investing in debt and Money Market Instruments.
Key FactsLoad Structure Entry Load Nil Exit Load1 Nil
Minimum Investment R 1,000/- & in multiples of R 1/- thereafter
Additional PurchaseR 1,000/- & in multiples of R 1/- thereafter
Date of Allotment 18th January, 2007
NAV p.u. (R) As on 29th November, 2019Growth 2,738.2534 Daily Dividend 1,011.5672 Weekly Dividend 1,061.2997 Monthly Dividend 1,045.1820 Discretionary Dividend 2,792.4275 Bonus 1,521.8003 Annual Bonus 2,738.2349 Direct PlanGrowth 2,806.1717 Daily Dividend 1,018.9655 Weekly Dividend 1,206.9347 Monthly Dividend 1,066.9155 Discretionary Dividend 2,807.3531 Bonus 1,558.9935 Regular PlanGrowth 2,523.0907 Daily Dividend 1,393.7263 Weekly Dividend 1,270.0263 Monthly Dividend 1,110.6332
Weighted Average Expense Ratio2 for the monthRegular 0.68%Direct 0.38%
Benchmark IndexCRISIL Low Duration Debt Index
AAuM for the month of November 2019: R 1,522.99 croresAuM as on30th November, 2019: R 1,616.10 crores
Fund Manager & ExperienceKrishna Cheemalapati Total Experience 20 Years Experience in managing this fund: Since January 1, 2013Nitish SikandTotal Experience 18 Years Experience in managing this fund: Since June 23, 2014
Portfolio (As on 30th November, 2019)
Lumpsum Performance (As on 29th November, 2019)
Period
Returns % Value of r 10,000 invested
FundFund -
Regular
Benchmark Addl. BM
FundFund -
Regular
Benchmark Addl. BMCRISIL Low
Duration Debt Index
CRISIL 1 Yr T-Bill Index
CRISIL Low Duration
Debt Index
CRISIL 1 Yr T-Bill Index
1 Year 9.49% 8.84% 9.00% 8.09% 10,946 10,881 10,898 10,8063 Years 7.37% 6.81% 7.65% 6.72% 12,377 12,182 12,472 12,1545 Years 7.90% 7.34% 8.25% 7.24% 14,628 14,257 14,870 14,1897 Years 8.20% 7.47% 8.61% 7.23% 17,366 16,562 17,824 16,29610 Years 8.18% 7.46% 8.02% 6.72% 21,957 20,531 21,631 19,158Since Inception 8.14% 7.46% 7.89% 6.52% 27,383 25,231 26,568 22,552(18 January, 2007)Past performance may or may not be sustained in future. BM - Benchmark. Returns above 1 year are CAGR. Returns are of existing plan (non - direct plan) - Growth Option. Different plans have different expense structure. For calculating returns since inception, NAV as on the date of allotment is taken as Rs. 1,000/-. Face Value per unit is Rs. 1,000/-. Please refer Page nos. 32-36 for performance of other Schemes managed by the Fund Managers and Page nos. 37-40 for performance of Direct Plans and respective Disclaimers.
Maturity Profile92 - 180 days 12.97%181 days - 1 year 26.89%1 - 2 years 48.03%Cash & Cash Equivalent 12.11%YTM4 6.13%Average Maturity 340 daysMacaulay Duration 327 daysModified Duration 307 days

22 of 42 For 1,2,4, Note on Direct Plan, Dividend Distribution and Disclaimer, refer page no. 42
Rating ProfileAAA 87.96%Sovereign 6.08%Cash & Cash Equivalent 5.96%
Dividend DistributionRecord Date Rate (R/Unit) Cum-Dividend NAV p. u. (R)
Individuals/HUF OthersMonthly Dividend28-Nov-19 5.33535696 4.94056830 1,054.8269 30-Oct-19 9.23619160 8.55276147 1,060.2423 27-Sep-19 1.76594272 1.63527215 1,049.8716 Direct Plan - Monthly Dividend28-Nov-19 10.28310836 9.52221185 1,856.2757 30-Oct-19 17.27232586 15.99426361 1,865.9786 27-Sep-19 4.00160776 3.70550961 1,847.5553 Plan B - Monthly Dividend29-Apr-13 14.15411326 12.05962963 1,086.388726-Mar-13 0.06962017 0.0596714 10.781327-Feb-13 0.01316549 0.01128417 10.7172Past performance may or may not be sustained in future. Dividend is on face value of R 1000/- per unit. Face value changed from v 10/- to v 1,000/- w.e.f. close of business hours on April 18, 2013. Dividend declared prior to face value change is on face value of R 10/- per unit. After the payment of dividend, the per unit NAV will fall to the extent of dividend payout and applicable statutory levy, if any.
^Please refer to the heading ‘C. Asset Allocation Pattern’ under Section ‘II. Information about the Scheme’ of Scheme Information Document where the concept of Macaulay duration has been explained.
Invesco India Short Term Fund(An open ended short term debt scheme investing in instruments such that the Macaulay duration^ of the portfolio is between 1 year to 3 years)
RISKOMETER
Investors understand that their principal will be at moderate risk
Suitable for Investors who are seeking*
l Income over short to medium terml Investments in short term debt and money market instruments
*Investors should consult their financial advisers if in doubt about whether the product is suitable for them.
Investment ObjectiveTo generate steady returns with a moderate risk for investors by investing in a portfolio of short term debt and Money Market Instruments.
Key FactsLoad Structure Entry Load Nil Exit Load1 Nil
Minimum Investment R 1,000/- & in multiples of R 1/- thereafter
Additional PurchaseR 1,000/- & in multiples of R 1/- thereafter
Date of Allotment 24th March, 2007
NAV p.u. (R) As on 29th November, 2019Growth 2,583.4849 Daily Dividend 1,033.7352 Weekly Dividend 1,020.1156 Monthly Dividend 1,047.8436 Direct PlanGrowth 2,738.9110 Daily Dividend 1,023.5517 Weekly Dividend 1,020.2102 Monthly Dividend 1,842.7876 Discretionary Dividend 1,932.2820 Plan BGrowth 2,574.3406 Daily Dividend - Weekly Dividend 1,016.6266 Monthly Dividend 1,712.7338
Weighted Average Expense Ratio2 for the monthRegular 1.29%Direct 0.44%
Benchmark IndexCRISIL Short Term Bond Fund Index
AAuM for the month of November 2019: R 587.68 croresAuM as on30th November, 2019: R 607.29 crores
Fund Manager & ExperienceSujoy DasTotal Experience 22 Years Experience in managing this fund: Since September 9, 2010
Maturity Profile61 - 91 days 1.63%181 days - 1 year 3.92%1 - 2 years 20.37%2 - 3 years 43.62%3 - 5 years 20.04%5 - 10 years 3.64%10 - 15 years 0.82%Cash & Cash Equivalent 5.96%
YTM4 6.78%Average Maturity 2.84 yearsMacaulay Duration 2.53 yearsModified Duration 2.37 years
Company Rating % of Net Assets
Corporate Debt 87.95Reliance Industries Ltd. CRISIL AAA 9.41Small Industries Dev Bank of India CARE AAA 8.42National Bank For Agriculture and Rural Development
CRISIL AAA 8.27
REC Ltd. CRISIL AAA 8.24Power Finance Corporation Ltd. CRISIL AAA 7.63Housing Development Finance Corp. Ltd. CRISIL AAA 7.06Housing & Urban Development Corp. Ltd. ICRA AAA 6.70LIC Housing Finance Ltd. CRISIL AAA 6.36HDB Financial Services Ltd. CRISIL AAA 5.89Reliance Jio Infocomm Ltd. CRISIL AAA 5.26Sundaram Finance Ltd. ICRA AAA 4.46Bajaj Finance Ltd. CRISIL AAA 4.22Kotak Mahindra Prime Ltd. CRISIL AAA 3.92
Company Rating % of Net Assets
Bajaj Housing Finance Ltd. CRISIL AAA 1.73Power Grid Corporation of India Ltd. CRISIL AAA 0.21Tata Sons Private Ltd CRISIL AAA 0.17Sikka Ports and Terminals Ltd. CRISIL AAA 0.02Government Security 4.466.45% GOI (MD 07/10/2029) Sovereign 2.476.79% GOI (MD 26/12/2029) Sovereign 0.826.79% GOI (MD 15/05/2027) Sovereign 0.627.59% GOI(MD 11/01/2026) Sovereign 0.527.26% GOI (MD 14/01/2029) Sovereign 0.03Money Market Instruments 1.63Treasury Bill182 Days Tbill (MD 27/02/2020) Sovereign 1.63Cash & Cash Equivalent 5.96Total 100.00
Portfolio (As on 30th November, 2019)
Lumpsum Performance (As on 29th November, 2019)
Period
Returns % Value of r 10,000 invested
FundFund - Plan B
Benchmark Addl. BM
FundFund - Plan B
Benchmark Addl. BMCRISIL
Short Term Bond Fund
Index
CRISIL 1 Yr T-Bill Index
CRISIL Short Term Bond Fund
Index
CRISIL 1 Yr T-Bill Index
1 Year 10.13% 10.14% 10.39% 8.09% 11,010 11,011 11,036 10,8063 Years 6.30% 6.30% 7.30% 6.72% 12,008 12,009 12,350 12,1545 Years 7.39% 7.40% 8.26% 7.24% 14,291 14,293 14,875 14,1897 Years 7.57% 7.51% 8.55% 7.23% 16,664 16,600 17,764 16,29610 Years 7.68% 7.57% 8.10% 6.72% 20,967 20,747 21,789 19,158Since Inception 7.76% 7.73% 8.21% 6.57% 25,835 25,743 27,210 22,428(24 March, 2007)Past performance may or may not be sustained in future. BM - Benchmark. Returns above 1 year are CAGR. Returns are of existing plan (non - direct plan) - Growth Option. Different plans have different expense structure. For calculating returns since inception, NAV as on the date of allotment is taken as Rs. 1,000/-. Face Value per unit is Rs. 1,000/-. Please refer Page nos. 32-36 for performance of other Schemes managed by the Fund Managers and Page nos. 37-40 for performance of Direct Plans and respective Disclaimers.
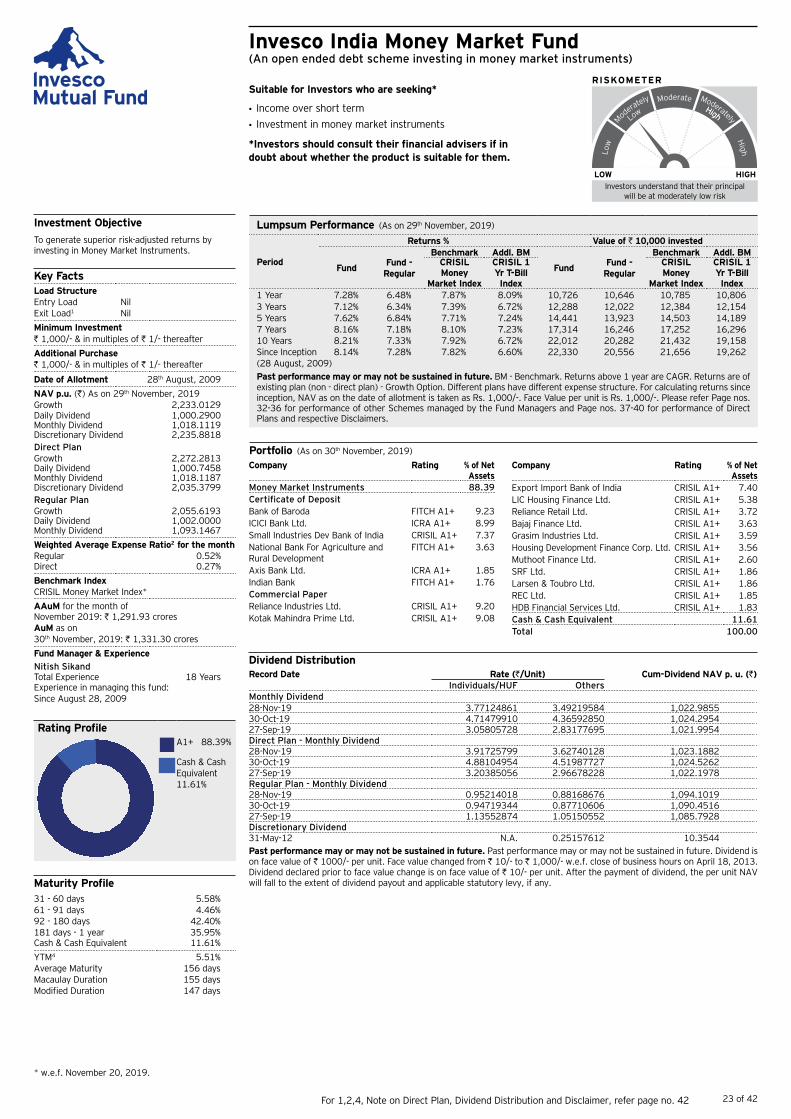
23 of 42For 1,2,4, Note on Direct Plan, Dividend Distribution and Disclaimer, refer page no. 42
Company Rating % of Net Assets
Money Market Instruments 88.39Certificate of DepositBank of Baroda FITCH A1+ 9.23ICICI Bank Ltd. ICRA A1+ 8.99Small Industries Dev Bank of India CRISIL A1+ 7.37National Bank For Agriculture and Rural Development
FITCH A1+ 3.63
Axis Bank Ltd. ICRA A1+ 1.85Indian Bank FITCH A1+ 1.76Commercial PaperReliance Industries Ltd. CRISIL A1+ 9.20Kotak Mahindra Prime Ltd. CRISIL A1+ 9.08
Company Rating % of Net Assets
Export Import Bank of India CRISIL A1+ 7.40LIC Housing Finance Ltd. CRISIL A1+ 5.38Reliance Retail Ltd. CRISIL A1+ 3.72Bajaj Finance Ltd. CRISIL A1+ 3.63Grasim Industries Ltd. CRISIL A1+ 3.59Housing Development Finance Corp. Ltd. CRISIL A1+ 3.56Muthoot Finance Ltd. CRISIL A1+ 2.60SRF Ltd. CRISIL A1+ 1.86Larsen & Toubro Ltd. CRISIL A1+ 1.86REC Ltd. CRISIL A1+ 1.85HDB Financial Services Ltd. CRISIL A1+ 1.83Cash & Cash Equivalent 11.61Total 100.00
Dividend DistributionRecord Date Rate (R/Unit) Cum-Dividend NAV p. u. (R)
Individuals/HUF OthersMonthly Dividend28-Nov-19 3.77124861 3.49219584 1,022.9855 30-Oct-19 4.71479910 4.36592850 1,024.2954 27-Sep-19 3.05805728 2.83177695 1,021.9954 Direct Plan - Monthly Dividend28-Nov-19 3.91725799 3.62740128 1,023.1882 30-Oct-19 4.88104954 4.51987727 1,024.5262 27-Sep-19 3.20385056 2.96678228 1,022.1978 Regular Plan - Monthly Dividend28-Nov-19 0.95214018 0.88168676 1,094.1019 30-Oct-19 0.94719344 0.87710606 1,090.4516 27-Sep-19 1.13552874 1.05150552 1,085.7928 Discretionary Dividend31-May-12 N.A. 0.25157612 10.3544 Past performance may or may not be sustained in future. Past performance may or may not be sustained in future. Dividend is on face value of R 1000/- per unit. Face value changed from R 10/- to R 1,000/- w.e.f. close of business hours on April 18, 2013. Dividend declared prior to face value change is on face value of R 10/- per unit. After the payment of dividend, the per unit NAV will fall to the extent of dividend payout and applicable statutory levy, if any.
Invesco India Money Market Fund(An open ended debt scheme investing in money market instruments)
RISKOMETER
Investors understand that their principal will be at moderately low risk
Suitable for Investors who are seeking*
l Income over short term l Investment in money market instruments
*Investors should consult their financial advisers if in doubt about whether the product is suitable for them.
Investment ObjectiveTo generate superior risk-adjusted returns by investing in Money Market Instruments.
Key FactsLoad Structure Entry Load Nil Exit Load1 Nil
Minimum Investment R 1,000/- & in multiples of R 1/- thereafter
Additional PurchaseR 1,000/- & in multiples of R 1/- thereafter
Date of Allotment 28th August, 2009
NAV p.u. (R) As on 29th November, 2019Growth 2,233.0129 Daily Dividend 1,000.2900 Monthly Dividend 1,018.1119 Discretionary Dividend 2,235.8818 Direct PlanGrowth 2,272.2813 Daily Dividend 1,000.7458 Monthly Dividend 1,018.1187 Discretionary Dividend 2,035.3799 Regular PlanGrowth 2,055.6193 Daily Dividend 1,002.0000 Monthly Dividend 1,093.1467
Weighted Average Expense Ratio2 for the monthRegular 0.52%Direct 0.27%
Benchmark IndexCRISIL Money Market Index*
AAuM for the month of November 2019: R 1,291.93 croresAuM as on30th November, 2019: R 1,331.30 crores
Fund Manager & ExperienceNitish SikandTotal Experience 18 Years Experience in managing this fund: Since August 28, 2009
Portfolio (As on 30th November, 2019)
Maturity Profile31 - 60 days 5.58%61 - 91 days 4.46%92 - 180 days 42.40%181 days - 1 year 35.95%Cash & Cash Equivalent 11.61%
YTM4 5.51%Average Maturity 156 daysMacaulay Duration 155 daysModified Duration 147 days
Lumpsum Performance (As on 29th November, 2019)
Period
Returns % Value of r 10,000 invested
FundFund -
Regular
Benchmark Addl. BM
FundFund -
Regular
Benchmark Addl. BMCRISIL Money
Market Index
CRISIL 1 Yr T-Bill Index
CRISIL Money
Market Index
CRISIL 1 Yr T-Bill Index
1 Year 7.28% 6.48% 7.87% 8.09% 10,726 10,646 10,785 10,8063 Years 7.12% 6.34% 7.39% 6.72% 12,288 12,022 12,384 12,1545 Years 7.62% 6.84% 7.71% 7.24% 14,441 13,923 14,503 14,1897 Years 8.16% 7.18% 8.10% 7.23% 17,314 16,246 17,252 16,29610 Years 8.21% 7.33% 7.92% 6.72% 22,012 20,282 21,432 19,158Since Inception 8.14% 7.28% 7.82% 6.60% 22,330 20,556 21,656 19,262(28 August, 2009)Past performance may or may not be sustained in future. BM - Benchmark. Returns above 1 year are CAGR. Returns are of existing plan (non - direct plan) - Growth Option. Different plans have different expense structure. For calculating returns since inception, NAV as on the date of allotment is taken as Rs. 1,000/-. Face Value per unit is Rs. 1,000/-. Please refer Page nos. 32-36 for performance of other Schemes managed by the Fund Managers and Page nos. 37-40 for performance of Direct Plans and respective Disclaimers.
Rating ProfileA1+ 88.39%
Cash & Cash Equivalent 11.61%
* w.e.f. November 20, 2019.
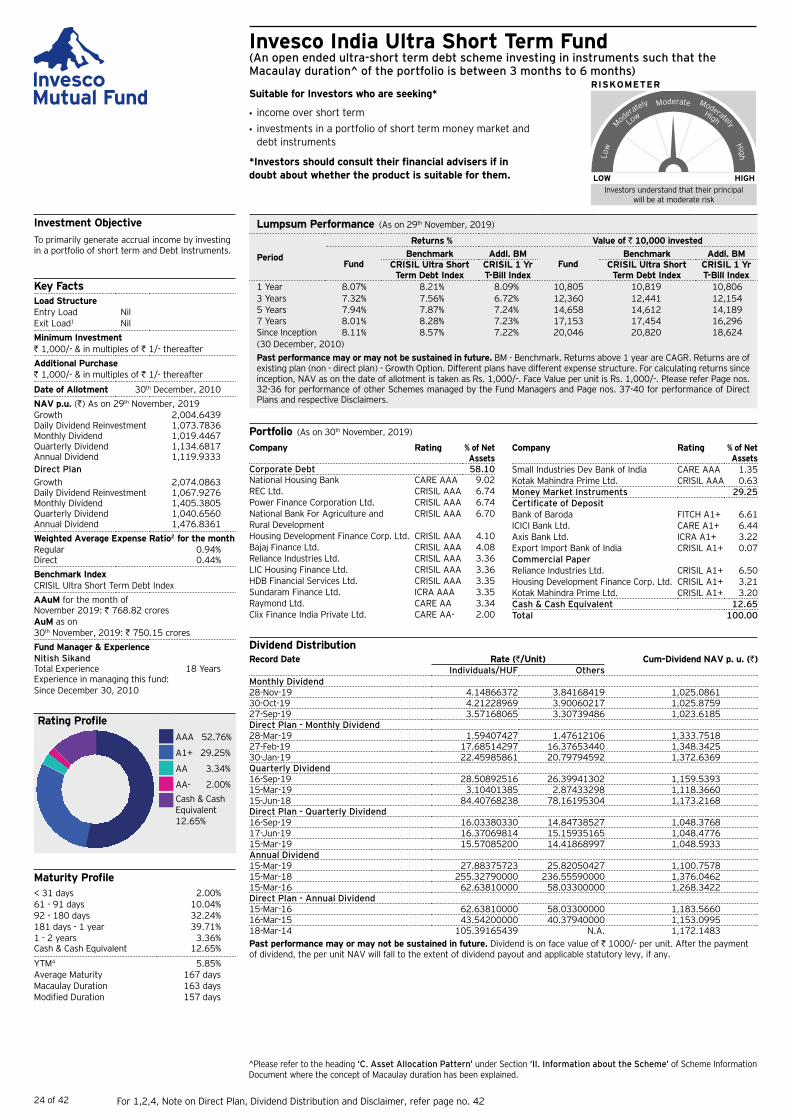
24 of 42 For 1,2,4, Note on Direct Plan, Dividend Distribution and Disclaimer, refer page no. 42
Company Rating % of Net Assets
Corporate Debt 58.10National Housing Bank CARE AAA 9.02REC Ltd. CRISIL AAA 6.74Power Finance Corporation Ltd. CRISIL AAA 6.74National Bank For Agriculture and Rural Development
CRISIL AAA 6.70
Housing Development Finance Corp. Ltd. CRISIL AAA 4.10Bajaj Finance Ltd. CRISIL AAA 4.08Reliance Industries Ltd. CRISIL AAA 3.36LIC Housing Finance Ltd. CRISIL AAA 3.36HDB Financial Services Ltd. CRISIL AAA 3.35Sundaram Finance Ltd. ICRA AAA 3.35Raymond Ltd. CARE AA 3.34Clix Finance India Private Ltd. CARE AA- 2.00
Company Rating % of Net Assets
Small Industries Dev Bank of India CARE AAA 1.35Kotak Mahindra Prime Ltd. CRISIL AAA 0.63Money Market Instruments 29.25Certificate of DepositBank of Baroda FITCH A1+ 6.61ICICI Bank Ltd. CARE A1+ 6.44Axis Bank Ltd. ICRA A1+ 3.22Export Import Bank of India CRISIL A1+ 0.07Commercial PaperReliance Industries Ltd. CRISIL A1+ 6.50Housing Development Finance Corp. Ltd. CRISIL A1+ 3.21Kotak Mahindra Prime Ltd. CRISIL A1+ 3.20Cash & Cash Equivalent 12.65Total 100.00
Dividend DistributionRecord Date Rate (R/Unit) Cum-Dividend NAV p. u. (R)
Individuals/HUF OthersMonthly Dividend28-Nov-19 4.14866372 3.84168419 1,025.0861 30-Oct-19 4.21228969 3.90060217 1,025.8759 27-Sep-19 3.57168065 3.30739486 1,023.6185 Direct Plan - Monthly Dividend28-Mar-19 1.59407427 1.47612106 1,333.7518 27-Feb-19 17.68514297 16.37653440 1,348.3425 30-Jan-19 22.45985861 20.79794592 1,372.6369 Quarterly Dividend16-Sep-19 28.50892516 26.39941302 1,159.5393 15-Mar-19 3.10401385 2.87433298 1,118.3660 15-Jun-18 84.40768238 78.16195304 1,173.2168 Direct Plan - Quarterly Dividend16-Sep-19 16.03380330 14.84738527 1,048.3768 17-Jun-19 16.37069814 15.15935165 1,048.4776 15-Mar-19 15.57085200 14.41868997 1,048.5933 Annual Dividend15-Mar-19 27.88375723 25.82050427 1,100.7578 15-Mar-18 255.32790000 236.55590000 1,376.0462 15-Mar-16 62.63810000 58.03300000 1,268.3422 Direct Plan - Annual Dividend15-Mar-16 62.63810000 58.03300000 1,183.566016-Mar-15 43.54200000 40.37940000 1,153.099518-Mar-14 105.39165439 N.A. 1,172.1483Past performance may or may not be sustained in future. Dividend is on face value of R 1000/- per unit. After the payment of dividend, the per unit NAV will fall to the extent of dividend payout and applicable statutory levy, if any.
^Please refer to the heading ‘C. Asset Allocation Pattern’ under Section ‘II. Information about the Scheme’ of Scheme Information Document where the concept of Macaulay duration has been explained.
Investment ObjectiveTo primarily generate accrual income by investing in a portfolio of short term and Debt Instruments.
Key FactsLoad Structure Entry Load Nil Exit Load1 Nil
Minimum Investment R 1,000/- & in multiples of R 1/- thereafter
Additional PurchaseR 1,000/- & in multiples of R 1/- thereafter
Date of Allotment 30th December, 2010
NAV p.u. (R) As on 29th November, 2019Growth 2,004.6439 Daily Dividend Reinvestment 1,073.7836 Monthly Dividend 1,019.4467 Quarterly Dividend 1,134.6817 Annual Dividend 1,119.9333 Direct PlanGrowth 2,074.0863 Daily Dividend Reinvestment 1,067.9276 Monthly Dividend 1,405.3805 Quarterly Dividend 1,040.6560 Annual Dividend 1,476.8361
Weighted Average Expense Ratio2 for the monthRegular 0.94%Direct 0.44%
Benchmark IndexCRISIL Ultra Short Term Debt Index
AAuM for the month of November 2019: R 768.82 croresAuM as on30th November, 2019: R 750.15 crores
Fund Manager & ExperienceNitish SikandTotal Experience 18 Years Experience in managing this fund: Since December 30, 2010
Portfolio (As on 30th November, 2019)
Invesco India Ultra Short Term Fund(An open ended ultra-short term debt scheme investing in instruments such that the Macaulay duration^ of the portfolio is between 3 months to 6 months)
RISKOMETER
Investors understand that their principal will be at moderate risk
Suitable for Investors who are seeking*
l income over short terml investments in a portfolio of short term money market and
debt instruments
*Investors should consult their financial advisers if in doubt about whether the product is suitable for them.
Maturity Profile< 31 days 2.00%61 - 91 days 10.04%92 - 180 days 32.24%181 days - 1 year 39.71%1 - 2 years 3.36%Cash & Cash Equivalent 12.65%
YTM4 5.85%Average Maturity 167 daysMacaulay Duration 163 daysModified Duration 157 days
Lumpsum Performance (As on 29th November, 2019)
Period
Returns % Value of r 10,000 invested
FundBenchmark Addl. BM
FundBenchmark Addl. BM
CRISIL Ultra Short Term Debt Index
CRISIL 1 Yr T-Bill Index
CRISIL Ultra Short Term Debt Index
CRISIL 1 Yr T-Bill Index
1 Year 8.07% 8.21% 8.09% 10,805 10,819 10,8063 Years 7.32% 7.56% 6.72% 12,360 12,441 12,1545 Years 7.94% 7.87% 7.24% 14,658 14,612 14,1897 Years 8.01% 8.28% 7.23% 17,153 17,454 16,296Since Inception 8.11% 8.57% 7.22% 20,046 20,820 18,624(30 December, 2010)Past performance may or may not be sustained in future. BM - Benchmark. Returns above 1 year are CAGR. Returns are of existing plan (non - direct plan) - Growth Option. Different plans have different expense structure. For calculating returns since inception, NAV as on the date of allotment is taken as Rs. 1,000/-. Face Value per unit is Rs. 1,000/-. Please refer Page nos. 32-36 for performance of other Schemes managed by the Fund Managers and Page nos. 37-40 for performance of Direct Plans and respective Disclaimers.
Rating ProfileAAA 52.76%
A1+ 29.25%
AA 3.34%
AA- 2.00%
Cash & Cash Equivalent 12.65%

25 of 42For 1,2,4, Note on Direct Plan, Dividend Distribution and Disclaimer, refer page no. 42
Company Rating % of Net Assets
Corporate Debt 71.18Raymond Ltd. CARE AA 12.78Housing Development Finance Corp. Ltd. CRISIL AAA 10.07Housing & Urban Development Corporation Ltd.
ICRA AAA 9.65
National Bank For Agriculture and Rural Development
CRISIL AAA 9.29
Export Import Bank of India CRISIL AAA 7.66Inox Air Products Pvt. Ltd. CRISIL AA 5.28
Company Rating % of Net Assets
Clix Finance India Private Ltd. CARE AA- 5.10ECL Finance Ltd. ICRA AA- 5.08India Infoline Finance Ltd. ICRA AA 2.74Sundaram Finance Ltd. ICRA AAA 2.58Indian Railway Finance Corp. Ltd. CRISIL AAA 0.54Reliance Industries Ltd. CRISIL AAA 0.26National Highways Auth Of Ind CRISIL AAA 0.15Cash & Cash Equivalent 28.82Total 100.00
Dividend DistributionRecord Date Rate (R/Unit) Cum-Dividend NAV p. u. (R)
Individuals/HUF OthersRegular Plan - Monthly Dividend30-Aug-18 3.77039911 3.49140919 1,030.4629 30-Jul-18 6.10435358 5.65266317 1,033.3682 28-Jun-18 3.42411373 3.17074713 1,029.7922 Direct Plan - Monthly Dividend30-Aug-18 4.24119874 3.92737210 1,029.3908 30-Jul-18 6.57434174 6.08787466 1,032.3024 28-Jun-18 3.84265078 3.55831461 1,028.6428 Past performance may or may not be sustained in future. Dividend is on face value of R 1000/- per unit. After the payment of dividend, the per unit NAV will fall to the extent of dividend payout and applicable statutory levy, if any.
Investment ObjectiveTo generate accrual income and capital appreciation by investing in debt securities of varying maturities across the credit spectrum.
Key FactsLoad Structure Entry Load Nil Exit Load1 • Nil - if upto 10% of Units allotted
are redeemed / switched-out within 1 year from the date of allotment.
• 1% - for any redemption / switch-out in excess of 10% of units allotted within one year from the date of allotment.
• Nil - if units are redeemed or switched-out after 1 year from the date of allotment.
Switch between the Plans under the Scheme, please refer page no. 42.
Minimum Investment R 1,000/- & in multiples of R 1/- thereafter
Additional PurchaseR 1,000/- & in multiples of R 1/- thereafter
Date of Allotment 4th September, 2014
NAV p.u. (R) As on 29th November, 2019Regular PlanGrowth 1,332.8726 Monthly Dividend 978.8941 Discretionary Dividend 1,332.4548 Direct PlanGrowth 1,388.9437 Monthly Dividend 988.3941 Discretionary Dividend 1,399.0986
Weighted Average Expense Ratio2 for the monthRegular 1.55%Direct 0.48%
Benchmark IndexCRISIL Composite AA Short Term Bond Index
AAuM for the month of November 2019: R 197.66 croresAuM as on30th November, 2019: R 195.94 crores
Fund Manager & ExperienceNitish SikandTotal Experience 18 Years Experience in managing this fund: Since September 4, 2014
Portfolio (As on 30th November, 2019)
Lumpsum Performance (As on 29th November, 2019)
Period
Returns % Value of r 10,000 invested
Fund - Regular
Benchmark Addl. BMFund -
Regular
Benchmark Addl. BMCRISIL Composite
AA Short Term Bond Index
CRISIL 1 Yr T-Bill Index
CRISIL Composite AA Short Term Bond
Index
CRISIL 1 Yr T-Bill Index
1 Year -3.97% 10.19% 8.09% 9,604 11,016 10,8063 Years 1.90% 8.16% 6.72% 10,579 12,651 12,1545 Years 5.28% 8.88% 7.24% 12,935 15,307 14,189Since Inception 5.64% 9.01% 7.32% 13,329 15,715 14,481(04 September, 2014)Past performance may or may not be sustained in future. BM - Benchmark. Returns above 1 year are CAGR. Returns are of existing plan (non - direct plan) - Growth Option. Different plans have different expense structure. For calculating returns since inception, NAV as on the date of allotment is taken as Rs. 1,000/-. Face Value per unit is Rs. 1,000/-. Please refer Page nos. 32-36 for performance of other Schemes managed by the Fund Managers and Page nos. 37-40 for performance of Direct Plans and respective Disclaimers.
Maturity Profile< 31 days 12.76%31 - 60 days 5.08%92 - 180 days 12.78%181 days - 1 year 12.81%1 - 2 years 2.58%2 - 3 years 24.48%3 - 5 years 0.54%5 - 10 years 0.15%Cash & Cash Equivalent 28.82%
YTM4 6.86%Average Maturity 300 daysMacaulay Duration 275 daysModified Duration 254 days
Invesco India Credit Risk Fund(An open ended debt scheme predominantly investing in AA and below rated corporate bonds (excluding AA+ rated corporate bonds))
RISKOMETER
Investors understand that their principal will be at moderate risk
Suitable for Investors who are seeking*
l Income and capital appreciation over medium to long terml Investments primarily in corporate debt securities of varying
maturities across the credit spectrum
*Investors should consult their financial advisers if in doubt about whether the product is suitable for them.
Rating ProfileAAA 40.19%
AA 20.80%
AA- 10.19%
Cash & Cash Equivalent 28.82%

26 of 42 For 1,2,4, Note on Direct Plan, Dividend Distribution and Disclaimer, refer page no. 42
Company Rating % of Net Assets
Government Security 90.926.45% GOI (MD 07/10/2029) Sovereign 38.877.26% GOI (MD 14/01/2029) Sovereign 19.466.79% GOI (MD 26/12/2029) Sovereign 19.417.59% GOI(MD 11/01/2026) Sovereign 8.176.79% GOI (MD 15/05/2027) Sovereign 5.01Cash & Cash Equivalent 9.08Total 100.00
Dividend DistributionRecord Date Rate (R/Unit) Cum-Dividend NAV p. u. (R)
Individuals/HUF OthersMonthly Dividend30-Aug-17 3.59838388 N.A. 1,050.6696 28-Jul-17 4.93672738 N.A. 1,058.1757 29-Jun-17 8.08344486 N.A. 1,061.9829 Direct Plan - Monthly Dividend27-Jun-13 15.51513735 14.85916859 1,040.909827-Feb-13 0.242765060 N.A. 10.4856Quarterly Dividend15-Sep-19 33.62977007 31.14134205 1,121.4412 15-Jun-19 23.07301117 21.36572839 1,117.1173 15-Mar-19 14.01070543 12.97398613 1,082.0998 Direct Plan - Quarterly Dividend15-Sep-19 75.36194406 69.78555229 1,123.4825 15-Jun-18 6.84119121 6.33497866 1,036.1090 15-Mar-18 49.51090000 45.87080000 1,091.2775 Annual Dividend15-Mar-19 112.55118792 104.22298559 1,216.4755 15-Mar-18 249.89060000 231.51840000 1,463.2884 15-Mar-15 84.65990000 78.51060000 1,355.2407 Direct Plan - Annual Dividend15-Mar-13 0.236960600 N.A. 11.5586Past performance may or may not be sustained in future. Dividend is on face value of R 1000/- per unit. Face value changed from R 10/- to R 1,000/- w.e.f. close of business hours on April 18, 2013. Dividend declared prior to face value change is on face value of R 10/- per unit. After the payment of dividend, the per unit NAV will fall to the extent of dividend payout and applicable statutory levy, if any.
Investment ObjectiveTo generate returns by investing predominantly in a portfolio of securities issued and guaranteed by Central and State Government across maturities.
Key FactsLoad Structure Entry Load Nil Exit Load1 Nil
Minimum Investment R 1,000/- & in multiples of R 1/- thereafter
Additional PurchaseR 1,000/- & in multiples of R 1/- thereafter
Date of Allotment 9th February, 2008
NAV p.u. (R) As on 29th November, 2019Growth 2,096.8933 Monthly Dividend 1,181.0330 Quarterly Dividend 1,080.4764 Annual Dividend 1,160.7774 Direct PlanGrowth 2,220.5791 Monthly Dividend 1,732.9487 Quarterly Dividend 1,026.2111 Annual Dividend 1,161.6372
Weighted Average Expense Ratio2 for the monthRegular 1.29%Direct 0.54%
Benchmark IndexCRISIL 10 Year Gilt Index
AAuM for the month of November 2019: R 25.53 croresAuM as on30th November, 2019: R 25.69 crores
Fund Manager & ExperienceSujoy DasTotal Experience 22 Years Experience in managing this fund: Since September 9, 2010
Portfolio (As on 30th November, 2019)
Lumpsum Performance (As on 29th November, 2019)
PeriodReturns % Value of r 10,000 invested
FundBenchmark
FundBenchmark
CRISIL 10 year Gilt Index CRISIL 10 year Gilt Index1 Year 11.80% 12.98% 11,177 11,2943 Years 4.72% 4.96% 11,483 11,5635 Years 8.05% 8.13% 14,733 14,7867 Years 8.02% 7.56% 17,159 16,65110 Years 7.87% 6.69% 21,339 19,106Since Inception 6.47% 6.73% 20,969 21,589(09 February, 2008)Past performance may or may not be sustained in future. BM - Benchmark. Returns above 1 year are CAGR. Returns are of existing plan (non - direct plan) - Growth Option. Different plans have different expense structure. For calculating returns since inception, NAV as on the date of allotment is taken as Rs. 1,000/-. Face Value per unit is Rs. 1,000/-. Please refer Page nos. 32-36 for performance of other Schemes managed by the Fund Managers and Page nos. 37-40 for performance of Direct Plans and respective Disclaimers.
Maturity Profile5 - 10 years 71.51%10 - 15 years 19.41%Cash & Cash Equivalent 9.08%
YTM4 6.49%Average Maturity 8.61 yearsMacaulay Duration 6.40 yearsModified Duration 6.19 years
Invesco India Gilt Fund(An open ended debt scheme investing in government securities across maturity)
RISKOMETER
Investors understand that their principal will be at moderate risk
Suitable for Investors who are seeking*
l Credit risk free returns over medium to long terml Investments primarily in securities issued and guaranteed
by the Central and the State Government across maturities
*Investors should consult their financial advisers if in doubt about whether the product is suitable for them.
Rating ProfileSovereign 90.92%Cash & Cash Equivalent 9.08%

27 of 42For 1,2,4, Note on Direct Plan, Dividend Distribution and Disclaimer, refer page no. 42
Company Rating % of Net Assets
Corporate Debt 94.04Reliance Industries Ltd. CRISIL AAA 9.31REC Ltd. CRISIL AAA 9.14Power Finance Corporation Ltd. CRISIL AAA 8.92Housing & Urban Development Corporation Ltd.
ICRA AAA 8.52
National Bank For Agriculture and Rural Development
CRISIL AAA 8.35
LIC Housing Finance Ltd. CRISIL AAA 7.18Bajaj Housing Finance Ltd. CRISIL AAA 7.07HDB Financial Services Ltd. CRISIL AAA 6.55
Company Rating % of Net Assets
Food Corporation Of India CRISIL AAA(CE) 5.33Housing Development Finance Corporation Ltd.
CRISIL AAA 5.11
Bajaj Finance Ltd. CRISIL AAA 5.09Larsen & Toubro Ltd. CRISIL AAA 4.37Small Industries Dev Bank of India CARE AAA 3.62Reliance Jio Infocomm Ltd. CRISIL AAA 2.05Small Industries Dev Bank of India ICRA AAA 1.46Sundaram Finance Ltd. CRISIL AAA 1.20Bharat Petroleum Corporation Ltd. CRISIL AAA 0.75Cash & Cash Equivalent 5.96Total 100.00
Dividend DistributionRecord Date Rate (R/Unit) Cum-Dividend NAV p. u. (R)
Individuals/HUF OthersMonthly Dividend28-Nov-19 9.71335123 8.99461377 1,411.8562 30-Oct-19 19.01789761 17.61067213 1,426.3658 27-Sep-19 76.33500662 70.68661328 1,513.0480 Direct Plan - Monthly Dividend 28-Nov-19 7.96892817 7.37926894 1,266.1683 30-Oct-19 12.73976836 11.79709178 1,272.7915 27-Sep-19 3.43968415 3.18516542 1,259.8805 Quarterly Dividend15-Sep-19 16.15863519 14.96298026 1,145.0354 15-Jun-19 15.33797173 14.20304162 1,129.5176 15-Mar-19 21.45732773 19.86959712 1,131.7182 Direct Plan - Quarterly Dividend15-Sep-19 17.08677077 15.82243863 1,147.5596 15-Jun-19 16.29189486 15.08637940 1,132.1670 15-Mar-19 22.42183960 20.76274013 1,134.5351 Annual Dividend15-Mar-12 0.81094060 N.A. 11.165115-Mar-11 0.39547700 N.A. 10.652715-Mar-10 0.01400000 0.01300000 10.0251Direct Plan - Annual Dividend15-Mar-19 680.56180836 630.20377535 2,173.7832 15-Mar-13 1.57136968 N.A. 13.9281Discretionary Dividend27-Jun-12 N.A. 0.45192015 10.6326Plan B - Monthly Dividend30-Jul-12 0.07448179 0.063792 10.922528-Feb-12 0.11589883 0.09920477 10.635828-Oct-11 0.03707525 0.03177745 10.4009Plan B - Quarterly Dividend15-Mar-13 0.2299179 N.A. 10.322615-Sep-12 0.163937603 N.A. 10.278215-Jun-12 0.05728105 N.A. 10.1165Plan A - Discretionary Dividend23-Jul-12 N.A. 0.05717367 10.1138Past performance may or may not be sustained in future. Dividend is on face value of R 1000/- per unit. Face value changed from R 10/- to R 1,000/- w.e.f. close of business hours on April 18, 2013. Dividend declared prior to face value change is on face value of R 10/- per unit. After the payment of dividend, the per unit NAV will fall to the extent of dividend payout and applicable statutory levy, if any.
Investment ObjectiveTo generate regular and stable income by investing predominantly in bonds issued by corporates. The scheme will invest in bonds which are rated AA+/ AAA by credit rating agencies.
Key FactsLoad Structure Entry Load Nil Exit Load1 Nil
Minimum Investment R 1,000/- & in multiples of R 1/- thereafter
Additional PurchaseR 1,000/- & in multiples of R 1/- thereafter
Date of Allotment 2nd August, 2007
NAV p.u. (R) As on 29th November, 2019Growth 2,247.4517 Monthly Dividend 1,398.9159 Quarterly Dividend 1,146.1813 Annual Dividend 1,976.4839 Discretionary Dividend 2,356.9807
Direct PlanGrowth 2,356.8608 Monthly Dividend 1,255.6077 Quarterly Dividend 1,148.5045 AnnualDividend 1,332.8466 Discretionary Dividend 2,356.9914
Weighted Average Expense Ratio2 for the monthRegular 0.60%Direct 0.20%
Benchmark IndexCRISIL AAA Short Term Bond Index
AAuM for the month of November 2019: R 653.60 croresAuM as on30th November, 2019: R 704.84 crores
Fund Manager & ExperienceSujoy DasTotal Experience 22 Years Experience in managing this fund: Since September 9, 2010
Portfolio (As on 30th November, 2019)
Lumpsum Performance (As on 29th November, 2019)
Period
Returns % Value of r 10,000 invested
FundBenchmark Addl. BM
FundBenchmark Addl. BM
CRISIL AAA Short Term Bond Index
CRISIL 1 Yr T-Bill Index
CRISIL AAA Short Term Bond Index
CRISIL 1 Yr T-Bill Index
1 Year 12.08% 11.04% 8.09% 11,205 11,101 10,8063 Years 4.50% 7.94% 6.72% 11,410 12,574 12,1545 Years 7.58% 8.45% 7.24% 14,413 15,009 14,1897 Years 7.46% 8.73% 7.23% 16,546 17,961 16,29610 Years 7.58% 8.40% 6.72% 20,777 22,405 19,158Since Inception 6.79% 8.86% 6.54% 22,475 28,480 21,837(02 August, 2007)Past performance may or may not be sustained in future. BM - Benchmark. Returns above 1 year are CAGR. Returns are of existing plan (non - direct plan) - Growth Option. Different plans have different expense structure. For calculating returns since inception, NAV as on the date of allotment is taken as Rs. 1,000/-. Face Value per unit is Rs. 1,000/-. Please refer Page nos. 32-36 for performance of other Schemes managed by the Fund Managers and Page nos. 37-40 for performance of Direct Plans and respective Disclaimers.
Maturity Profile1 - 2 years 2.77%2 - 3 years 85.28%3 - 5 years 5.99%Cash & Cash Equivalent 5.96%
YTM4 6.82%Average Maturity 2.50 yearsMacaulay Duration 2.29 yearsModified Duration 2.15 years
Invesco India Corporate Bond Fund(An open ended debt scheme predominantly investing in AA+ and above rated corporate bonds)
RISKOMETER
Investors understand that their principal will be at moderate risk
Suitable for Investors who are seeking*
l Income over medium to long terml Investments in AA+ and above rated corporate bonds
*Investors should consult their financial advisers if in doubt about whether the product is suitable for them.
Rating Profile
AAA 94.04%
Cash & Cash Equivalent 5.96%

28 of 42 For 1,2,4, Note on Direct Plan, Dividend Distribution and Disclaimer, refer page no. 42
Dividend DistributionRecord Date Rate (R/Unit) Cum-Dividend NAV p. u. (R)
Individuals/HUF OthersMonthly Dividend28-Nov-19 4.01462597 3.71756453 1,019.1236 30-Oct-19 8.20300655 7.59602675 1,022.1791 27-Sep-19 0.13743754 0.12726788 1,010.1908 Direct Plan - Monthly Dividend 28-Nov-19 6.23518387 5.77381270 1,018.6561 30-Oct-19 9.03774274 8.36899680 1,022.5468 27-Sep-19 0.36851701 0.34124867 1,010.5116 Past performance may or may not be sustained in future. Dividend is on face value of R 1000/- per unit. After the payment of dividend, the per unit NAV will fall to the extent of dividend payout and applicable statutory levy, if any.
Investment ObjectiveTo generate returns by investing primarily in debt & Money Market Instruments issued by banks, Public Financial Institutions (PFIs), Public Sector Undertakings (PSUs) and Municipal Bonds.
Key FactsLoad Structure Entry Load Nil Exit Load1 Nil
Minimum Investment R 1,000/- & in multiples of R 1/- thereafter
Additional PurchaseR 1,000/- & in multiples of R 1/- thereafter
Date of Allotment 29th December, 2012
NAV p.u. (R) As on 29th November, 2019Growth 1,648.5930 Daily Dividend 1,003.7200 Monthly Dividend 1,013.7961 Direct PlanGrowth 1,726.5252 Daily Dividend 1,087.8848 Monthly Dividend 1,010.2577
Weighted Average Expense Ratio2 for the monthRegular 0.66%Direct 0.25%
Benchmark IndexCRISIL Banking and PSU Debt Index*
AAuM for the month of November 2019: R 48.47 croresAuM as on30th November, 2019: R 49.47 crores
Fund Manager & ExperienceNitish SikandTotal Experience 18 Years Experience in managing this fund: Since December 29, 2012
Lumpsum Performance (As on 29th November, 2019)
Period
Returns % Value of r 10,000 invested
Fund
Benchmark Addl. BM
Fund
Benchmark Addl. BMCRISIL Banking and PSU Debt
Index
CRISIL 1 Yr T-Bill Index
CRISIL Banking and PSU Debt
Index
CRISIL 1 Yr T-Bill Index
1 Year 10.30% 11.45% 8.09% 11,027 11,142 10,8063 Years 7.14% 7.72% 6.72% 12,295 12,497 12,1545 Years 7.26% 8.76% 7.24% 14,205 15,222 14,189Since Inception 7.49% 9.04% 7.21% 16,486 18,206 16,191(29 December, 2012)Past performance may or may not be sustained in future. BM - Benchmark. Returns above 1 year are CAGR. Returns are of existing plan (non - direct plan) - Growth Option. Different plans have different expense structure. For calculating returns since inception, NAV as on the date of allotment is taken as Rs. 1,000/-. Face Value per unit is Rs. 1,000/-. Please refer Page nos. 32-36 for performance of other Schemes managed by the Fund Managers and Page nos. 37-40 for performance of Direct Plans and respective Disclaimers.
Maturity Profile92 - 180 days 17.92%181 days - 1 year 1.97%1 - 2 years 7.96%2 - 3 years 42.15%3 - 5 years 8.55%5 - 10 years 9.46%Cash & Cash Equivalent 11.99%
YTM4 6.25%Average Maturity 2.63 yearsMacaulay Duration 2.21 yearsModified Duration 2.07 years
Invesco India Banking & PSU Debt Fund(An open ended debt scheme predominantly investing in Debt instruments of banks, Public Sector Undertakings, Public Financial Institutions and Municipal Bonds)
RISKOMETER
Investors understand that their principal will be at moderate risk
Suitable for Investors who are seeking*
l Returns over short to medium terml Investments primarily in debt & money market instruments
issued by Banks, PFIs, PSUs and Municipal Bonds
*Investors should consult their financial advisers if in doubt about whether the product is suitable for them.
Company Rating % of Net Assets
Corporate Debt 68.13Indian Railway Finance Corporation Ltd.
CRISIL AAA 9.58
National Highways Auth Of Ind CRISIL AAA 9.46Power Grid Corporation of India Ltd. CRISIL AAA 6.93Power Finance Corporation Ltd. CRISIL AAA 6.92Housing & Urban Development Corporation Ltd.
ICRA AAA 6.73
National Bank For Agriculture and Rural Development
CRISIL AAA 6.24
REC Ltd. CRISIL AAA 6.13
Company Rating % of Net Assets
Reliance Industries Ltd. CRISIL AAA 6.10LIC Housing Finance Ltd. CRISIL AAA 5.64Bharat Petroleum Corporation Ltd. CRISIL AAA 3.09Food Corporation Of India CRISIL AAA(CE) 1.30Money Market Instruments 19.88Certificate of DepositBank of Baroda FITCH A1+ 8.96Export Import Bank of India CRISIL A1+ 8.95Indian Bank FITCH A1+ 1.97Cash & Cash Equivalent 11.99Total 100.00
Portfolio (As on 30th November, 2019)
Rating ProfileAAA 68.13%
A1+ 19.88%
Cash & Cash Equivalent 11.99%
* w.e.f. November 20, 2019.

29 of 42For 1,2, Note on Direct Plan, Dividend Distribution and Disclaimer, refer page no. 42
Investment ObjectiveTo provide returns that closely corresponds to returns provided by Invesco India Gold Exchange Traded Fund.
Key FactsLoad Structure Entry Load Nil Exit Load1 If redeemed/switched-out on or
before 6 months from the date of allotment : 2%If redeemed/switched-out after 6 months but on or before 1 year from the date of allotment : 1%If redeemed/switched-out after 1 year from the date of allotment : NilSwitch between the Plans under the Scheme, please refer page no. 42.
Minimum Investment R 1,000/- & in multiples of R 1/- thereafter
Additional PurchaseR 1,000/- & in multiples of R 1/- thereafter
Date of Allotment 5th December, 2011
NAV p.u. (R) As on 29th November, 2019Growth 11.6096 Dividend 11.6091 Direct PlanGrowth 11.8323 Dividend 11.8144
Weighted Average Expense Ratio2 for the monthRegular 0.50%Direct 0.09%
Benchmark IndexPrice of Gold
AAuM for the month of November 2019: R 14.93 croresAuM as on30th November, 2019: R 14.81 crores
Fund Manager & ExperienceNitish SikandTotal Experience 18 Years Experience in managing this fund: Since December 5, 2011
Lumpsum Performance (As on 29th November, 2019)
PeriodReturns % Value of r 10,000 invested
FundBenchmark
FundBenchmark
Price of Gold Price of Gold1 Year 23.05% 25.39% 12,298 12,5313 Years 8.52% 9.07% 12,777 12,9725 Years 5.91% 7.43% 13,327 14,3147 Years 1.00% 2.49% 10,722 11,880Since Inception 1.89% 3.23% 11,610 12,892(05 December, 2011)Past performance may or may not be sustained in future. BM - Benchmark. Returns above 1 year are CAGR. Returns are of existing plan (non - direct plan) - Growth Option. Different plans have different expense structure. For calculating returns since inception, NAV as on the date of allotment is taken as Rs. 1,000/-. Face Value per unit is Rs. 10/-. Please refer Page nos. 32-36 for performance of other Schemes managed by the Fund Managers and Page nos. 37-40 for performance of Direct Plans and respective Disclaimers.
Asset AllocationExchange Traded Funds 97.39%Cash & Cash Equivalent 2.61%
Invesco India Gold Fund(An open ended fund of fund scheme investing in Invesco India Gold Exchange Traded Fund)
RISKOMETER
Investors understand that their principal will be at moderately high risk
Suitable for Investors who are seeking*
l Regular income and capital appreciation over medium to long terml Investment in units of Invesco India Gold Exchange Traded Fund,
which in turn invests in physical gold
*Investors should consult their financial advisers if in doubt about whether the product is suitable for them.
Company % of Net Assets
Exchange Traded Funds 97.39Invesco India Gold Exchange Traded Fund 97.39Cash & Cash Equivalent 2.61Total 100.00
The investor will bear the recurring expenses of the scheme, in addition to the expenses of underlying scheme.
Portfolio (As on 30th November, 2019)

30 of 42 For 1,2, Note on Direct Plan, Dividend Distribution and Disclaimer, refer page no. 42
Investment ObjectiveTo generate returns that closely correspond to the returns provided by investment in physical gold in the domestic market, subject to tracking error.
Key FactsLoad Structure Entry Load Nil Exit Load1 Nil
(For redemption in Creation Unit size.)
Minimum Investment 1.1
On Exchange : 1 Unit Directly with Mutual Fund : 1,000 Units and in multiples thereof.
Listing ExchangeNSE / BSE
NSE /BSE SymbolIVZINGOLD
BSE Code533172
ISININF205K01361
Date of Allotment12th March, 2010
Pricing per Unit1 gram of gold (approx.)
NAV p.u. (R) As on 29th November, 2019Growth 3,453.5199
Weighted Average Expense Ratio2
for the month0.45%
Tracking Error0.08% (annualised) Based on 3 years, monthly data points
Benchmark IndexPrice of Gold
AAuM for the month of November 2019: R 35.56 crores
AuM as on30th November, 2019: R 35.28 crores
Fund Manager & ExperienceNitish SikandTotal Experience 18 Years Experience in managing this fund: Since March 12, 2010
Lumpsum Performance (As on 29th November, 2019)
PeriodReturns % Value of r 10,000 invested
FundBenchmark
FundBenchmark
Price of Gold Price of Gold1 Year 24.55% 25.39% 12,448 12,5313 Years 8.11% 9.07% 12,632 12,9725 Years 6.43% 7.43% 13,661 14,3147 Years 1.55% 2.49% 11,134 11,880Since Inception 7.69% 8.71% 20,557 22,526(12 March, 2010)Past performance may or may not be sustained in future. BM - Benchmark. Returns above 1 year are CAGR. Returns are of existing plan (non - direct plan) - Growth Option. Different plans have different expense structure. For calculating returns since inception, NAV as on the date of allotment is taken as Rs. 1,680.0014. Face Value per unit is Rs. 100/-. Please refer Page nos. 32-36 for performance of other Schemes managed by the Fund Managers and Page nos. 37-40 for performance of Direct Plans and respective Disclaimers.
Invesco India Gold Exchange Traded Fund(An open ended scheme tracking returns provided by investment in physical gold)
RISKOMETER
Investors understand that their principal will be at moderately high risk
Suitable for Investors who are seeking*
l Capital appreciation over long terml Generate returns that closely correspond to the returns provided
by investment in physical gold in the domestic market, subject to tracking error.
*Investors should consult their financial advisers if in doubt about whether the product is suitable for them.
Company % of Net Assets
Gold 99.75Gold 99.75Cash & Cash Equivalent 0.25Total 100.00
Portfolio (As on 30th November, 2019)
1.1Investor can purchase units from stock exchange at traded price or subscribe the units through Mutual Fund in Creation unit size for Cash or by submitting Portfolio deposit and Cash Component at applicable NAV.

31 of 42For 1,2, Note on Direct Plan, Dividend Distribution and Disclaimer, refer page no. 42
Invesco India Nifty Exchange Traded Fund(An open ended scheme replicating Nifty 50 Index)
RISKOMETER
Investors understand that their principal will be at moderately high risk
Suitable for Investors who are seeking*
l Capital appreciation over long-terml Generate returns that closely correspond to the returns generated
by securities represented by the Nifty 50, subject to tracking error, if any.
*Investors should consult their financial advisers if in doubt about whether the product is suitable for them.
Industry Classification3
% of Net AssetsBanks 30.17%Software 12.33%Petroleum Products 12.13%Finance 10.99%Consumer Non Durables 10.45%Auto 5.61%Construction Project 3.30%Pharmaceuticals 2.18%Power 1.93%Telecom - Services 1.69%Cement 1.59%Ferrous Metals 1.18%Non - Ferrous Metals 1.12%Consumer Durables 0.97%Oil 0.83%Minerals/Mining 0.74%Pesticides 0.63%Transportation 0.60%Telecom - Equipment & Accessories 0.47%Gas 0.47%Media & Entertainment 0.36%3Industrywise Classification as per AMFI.
Dividend DistributionRecord Date Rate (R/Unit) Cum-Dividend
NAV p. u. (R)Dividend Option26-Dec-12 5 596.3176Past performance may or may not be sustained in future. Dividend is on face value of R10/- per unit. After the payment of dividend, the per unit NAV will fall to the extent of dividend payout and applicable statutory levy, if any.
Lumpsum Performance (As on 29th November, 2019)
Period
Returns % Value of r 10,000 invested
FundBenchmark Addl. BM
FundBenchmark Addl. BM
Nifty 50 TRI S&P BSE Sensex TRI Nifty 50 TRI S&P BSE
Sensex TRI1 Year 12.33% 12.38% 14.05% 11,229 11,234 11,4013 Years 15.00% 15.12% 16.67% 15,202 15,252 15,8745 Years 8.24% 8.39% 8.70% 14,861 14,967 15,1837 Years 11.87% 12.20% 12.80% 21,933 22,388 23,236Since Inception 10.76% 11.14% 11.53% 23,759 24,457 25,193(13 June, 2011)Past performance may or may not be sustained in future. BM - Benchmark. Returns above 1 year are CAGR. Returns are of existing plan (non - direct plan) - Growth Option. Different plans have different expense structure. For calculating returns since inception, NAV as on the date of allotment is taken as Rs. 548.28. Face Value per unit is Rs. 10/-. Please refer Page nos. 32-36 for performance of other Schemes managed by the Fund Managers and Page nos. 37-40 for performance of Direct Plans and respective Disclaimers. Benchmark returns are calculated using Total Return variant of respective Benchmark Index.
Investment ObjectiveTo generate returns which closely correspond to the returns generated by securities as represented by Nifty 50, subject to tracking error, if any.
Key FactsLoad Structure Entry Load Nil Exit Load1, 1.1 Nil
(For redemption in Creation Unit size.)
Minimum Investment 1.2
On Exchange : 1 Unit Directly with Mutual Fund : 5,000 Units and in multiples thereof.
Listing ExchangeNSE
NSE SymbolIVZINNIFTY
ISININF205K01DA9
Date of Allotment 13th June, 2011
Pricing per Unit1/10th of the value of Nifty 50 (approx.)
NAV p.u. (R) As on 29th November, 2019Growth 1,291.7143
Weighted Average Expense Ratio2
for the month 0.10%
Tracking Error0.05% (annualised) Based on 3 years, monthly data points
Benchmark IndexNifty 50 TRI
AAuM for the month of November 2019: R 2.13 crores
AuM as on30th November, 2019: R 2.15 crores
Fund Manager & ExperiencePranav GokhaleTotal Experience 15 Years Experience in managing this fund: Since June 13, 2011
1.1Please refer to Key Information Memorandum / Scheme Information Document for exit load applicable for redemption of units in other than creation unit size directly with the Mutual Fund. Exit Load charged, if any, will be credited back to the scheme, net of goods & services tax. 1.2Investor can purchase units from stock exchange at traded price or subscribe the units through Mutual Fund in Creation unit size for Cash or by submitting Portfolio deposit and Cash Component at applicable NAV.
Company % of Net AssetsEquity & Equity Related Instruments 99.74HDFC Bank Ltd. 11.06Reliance Industries Ltd. 10.66Housing Development Finance Corp. Ltd. 7.95ICICI Bank Ltd. 6.64Infosys Ltd. 5.12Kotak Mahindra Bank Ltd. 4.33Tata Consultancy Services Ltd. 4.33ITC Ltd. 4.25 Axis Bank Ltd. 3.30Larsen & Toubro Ltd. 3.30Hindustan Unilever Ltd. 2.92State Bank of India 2.63Bajaj Finance Ltd. 1.95Maruti Suzuki India Ltd. 1.92IndusInd Bank Ltd. 1.90Bharti Airtel Ltd. 1.69Asian Paints Ltd. 1.54HCL Technologies Ltd. 1.23Bajaj Finserv Ltd. 1.10Mahindra & Mahindra Ltd. 1.02NTPC Ltd. 1.02Nestle India Ltd. 1.01Sun Pharmaceutical Industries Ltd. 1.00Titan Company Ltd. 0.97UltraTech Cement Ltd. 0.97
Company % of Net AssetsTech Mahindra Ltd. 0.94Power Grid Corporation of India Ltd. 0.91Oil & Natural Gas Corporation Ltd. 0.83Bajaj Auto Ltd. 0.83Bharat Petroleum Corporation Ltd. 0.82Coal India Ltd. 0.74Britannia Industries Ltd. 0.72Wipro Ltd. 0.71Dr. Reddy’s Laboratories Ltd. 0.70Tata Steel Ltd. 0.65Indian Oil Corporation Ltd. 0.65Eicher Motors Ltd. 0.64UPL Ltd. 0.63Hero MotoCorp Ltd. 0.63Grasim Industries Ltd. 0.62Adani Ports and Special Economic Zone Ltd. 0.60Hindalco Industries Ltd. 0.59Tata Motors Ltd. 0.58JSW Steel Ltd. 0.53Vedanta Ltd. 0.53Cipla Ltd. 0.48Bharti Infratel Ltd. 0.47GAIL (India) Ltd. 0.47Zee Entertainment Enterprises Ltd. 0.36Yes Bank Ltd. 0.29Cash & Cash Equivalent 0.26Total 100.00
Portfolio (As on 30th November, 2019)
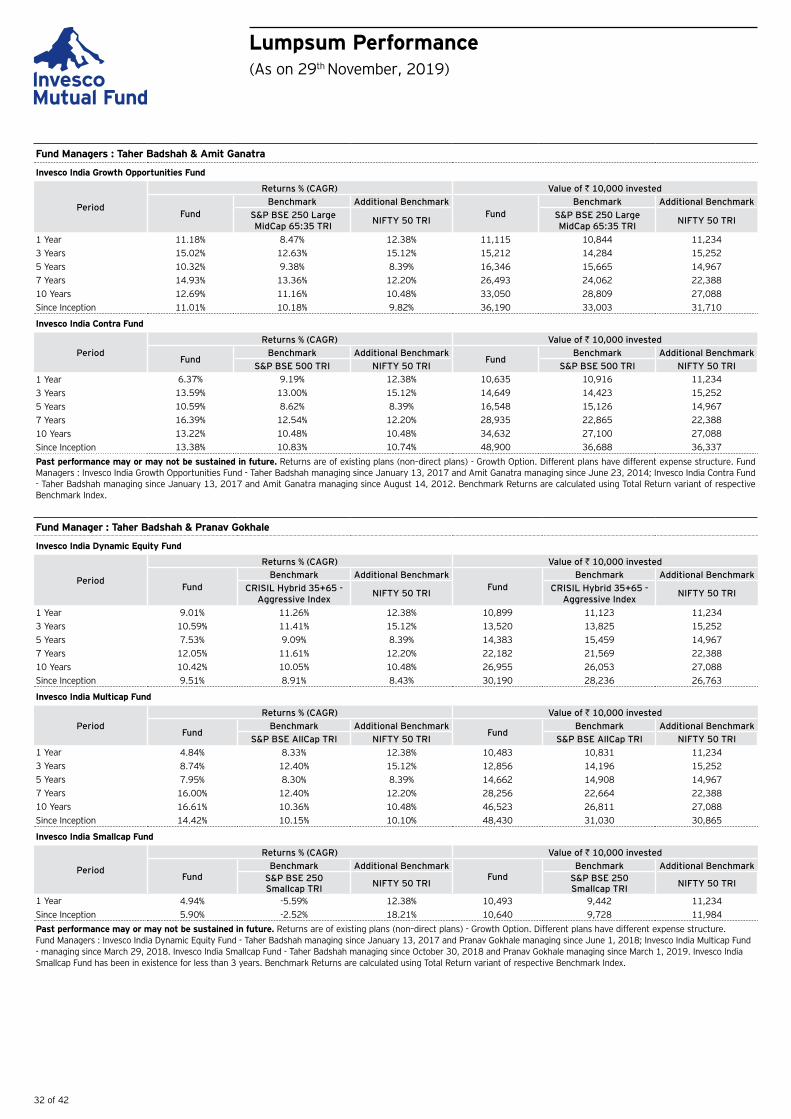
32 of 42
Lumpsum Performance(As on 29th November, 2019)
Fund Managers : Taher Badshah & Amit Ganatra
Invesco India Growth Opportunities Fund
Period
Returns % (CAGR) Value of r 10,000 invested
FundBenchmark Additional Benchmark
FundBenchmark Additional Benchmark
S&P BSE 250 Large MidCap 65:35 TRI NIFTY 50 TRI S&P BSE 250 Large
MidCap 65:35 TRI NIFTY 50 TRI
1 Year 11.18% 8.47% 12.38% 11,115 10,844 11,2343 Years 15.02% 12.63% 15.12% 15,212 14,284 15,2525 Years 10.32% 9.38% 8.39% 16,346 15,665 14,9677 Years 14.93% 13.36% 12.20% 26,493 24,062 22,38810 Years 12.69% 11.16% 10.48% 33,050 28,809 27,088Since Inception 11.01% 10.18% 9.82% 36,190 33,003 31,710
Invesco India Contra Fund
PeriodReturns % (CAGR) Value of r 10,000 invested
FundBenchmark Additional Benchmark
FundBenchmark Additional Benchmark
S&P BSE 500 TRI NIFTY 50 TRI S&P BSE 500 TRI NIFTY 50 TRI 1 Year 6.37% 9.19% 12.38% 10,635 10,916 11,2343 Years 13.59% 13.00% 15.12% 14,649 14,423 15,2525 Years 10.59% 8.62% 8.39% 16,548 15,126 14,9677 Years 16.39% 12.54% 12.20% 28,935 22,865 22,38810 Years 13.22% 10.48% 10.48% 34,632 27,100 27,088Since Inception 13.38% 10.83% 10.74% 48,900 36,688 36,337
Past performance may or may not be sustained in future. Returns are of existing plans (non–direct plans) - Growth Option. Different plans have different expense structure. Fund Managers : Invesco India Growth Opportunities Fund - Taher Badshah managing since January 13, 2017 and Amit Ganatra managing since June 23, 2014; Invesco India Contra Fund - Taher Badshah managing since January 13, 2017 and Amit Ganatra managing since August 14, 2012. Benchmark Returns are calculated using Total Return variant of respective Benchmark Index.
Fund Manager : Taher Badshah & Pranav Gokhale
Invesco India Dynamic Equity Fund
Period
Returns % (CAGR) Value of r 10,000 invested
FundBenchmark Additional Benchmark
FundBenchmark Additional Benchmark
CRISIL Hybrid 35+65 - Aggressive Index NIFTY 50 TRI CRISIL Hybrid 35+65 -
Aggressive Index NIFTY 50 TRI
1 Year 9.01% 11.26% 12.38% 10,899 11,123 11,2343 Years 10.59% 11.41% 15.12% 13,520 13,825 15,2525 Years 7.53% 9.09% 8.39% 14,383 15,459 14,9677 Years 12.05% 11.61% 12.20% 22,182 21,569 22,38810 Years 10.42% 10.05% 10.48% 26,955 26,053 27,088Since Inception 9.51% 8.91% 8.43% 30,190 28,236 26,763
Invesco India Multicap Fund
PeriodReturns % (CAGR) Value of r 10,000 invested
FundBenchmark Additional Benchmark
FundBenchmark Additional Benchmark
S&P BSE AllCap TRI NIFTY 50 TRI S&P BSE AllCap TRI NIFTY 50 TRI 1 Year 4.84% 8.33% 12.38% 10,483 10,831 11,2343 Years 8.74% 12.40% 15.12% 12,856 14,196 15,2525 Years 7.95% 8.30% 8.39% 14,662 14,908 14,9677 Years 16.00% 12.40% 12.20% 28,256 22,664 22,38810 Years 16.61% 10.36% 10.48% 46,523 26,811 27,088Since Inception 14.42% 10.15% 10.10% 48,430 31,030 30,865
Invesco India Smallcap Fund
Period
Returns % (CAGR) Value of r 10,000 invested
FundBenchmark Additional Benchmark
FundBenchmark Additional Benchmark
S&P BSE 250 Smallcap TRI NIFTY 50 TRI S&P BSE 250
Smallcap TRI NIFTY 50 TRI
1 Year 4.94% -5.59% 12.38% 10,493 9,442 11,234Since Inception 5.90% -2.52% 18.21% 10,640 9,728 11,984
Past performance may or may not be sustained in future. Returns are of existing plans (non–direct plans) - Growth Option. Different plans have different expense structure. Fund Managers : Invesco India Dynamic Equity Fund - Taher Badshah managing since January 13, 2017 and Pranav Gokhale managing since June 1, 2018; Invesco India Multicap Fund - managing since March 29, 2018. Invesco India Smallcap Fund - Taher Badshah managing since October 30, 2018 and Pranav Gokhale managing since March 1, 2019. Invesco India Smallcap Fund has been in existence for less than 3 years. Benchmark Returns are calculated using Total Return variant of respective Benchmark Index.
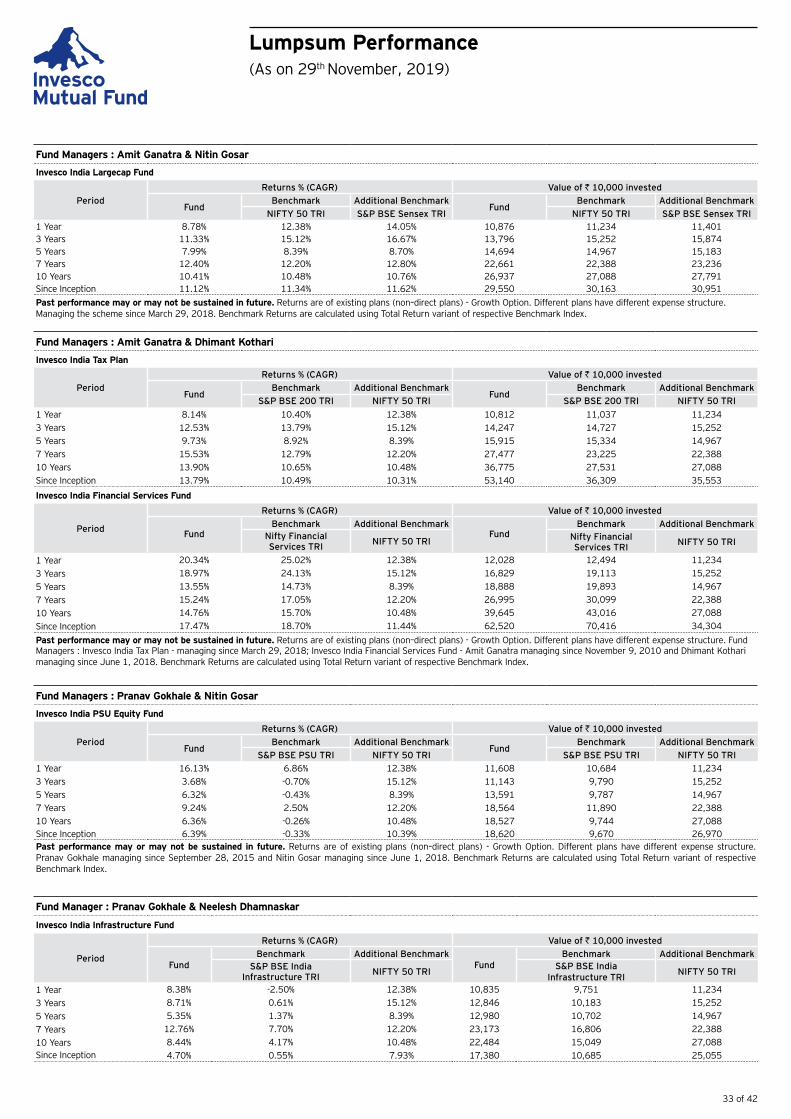
33 of 42
Lumpsum Performance(As on 29th November, 2019)
Fund Managers : Amit Ganatra & Nitin Gosar
Invesco India Largecap Fund
PeriodReturns % (CAGR) Value of r 10,000 invested
FundBenchmark Additional Benchmark
FundBenchmark Additional Benchmark
NIFTY 50 TRI S&P BSE Sensex TRI NIFTY 50 TRI S&P BSE Sensex TRI1 Year 8.78% 12.38% 14.05% 10,876 11,234 11,4013 Years 11.33% 15.12% 16.67% 13,796 15,252 15,8745 Years 7.99% 8.39% 8.70% 14,694 14,967 15,1837 Years 12.40% 12.20% 12.80% 22,661 22,388 23,23610 Years 10.41% 10.48% 10.76% 26,937 27,088 27,791Since Inception 11.12% 11.34% 11.62% 29,550 30,163 30,951Past performance may or may not be sustained in future. Returns are of existing plans (non–direct plans) - Growth Option. Different plans have different expense structure. Managing the scheme since March 29, 2018. Benchmark Returns are calculated using Total Return variant of respective Benchmark Index.
Fund Managers : Amit Ganatra & Dhimant Kothari
Invesco India Tax Plan
PeriodReturns % (CAGR) Value of r 10,000 invested
FundBenchmark Additional Benchmark
FundBenchmark Additional Benchmark
S&P BSE 200 TRI NIFTY 50 TRI S&P BSE 200 TRI NIFTY 50 TRI1 Year 8.14% 10.40% 12.38% 10,812 11,037 11,2343 Years 12.53% 13.79% 15.12% 14,247 14,727 15,2525 Years 9.73% 8.92% 8.39% 15,915 15,334 14,9677 Years 15.53% 12.79% 12.20% 27,477 23,225 22,38810 Years 13.90% 10.65% 10.48% 36,775 27,531 27,088Since Inception 13.79% 10.49% 10.31% 53,140 36,309 35,553
Invesco India Financial Services Fund
Period
Returns % (CAGR) Value of r 10,000 invested
FundBenchmark Additional Benchmark
FundBenchmark Additional Benchmark
Nifty Financial Services TRI NIFTY 50 TRI Nifty Financial
Services TRI NIFTY 50 TRI
1 Year 20.34% 25.02% 12.38% 12,028 12,494 11,2343 Years 18.97% 24.13% 15.12% 16,829 19,113 15,2525 Years 13.55% 14.73% 8.39% 18,888 19,893 14,9677 Years 15.24% 17.05% 12.20% 26,995 30,099 22,38810 Years 14.76% 15.70% 10.48% 39,645 43,016 27,088Since Inception 17.47% 18.70% 11.44% 62,520 70,416 34,304
Past performance may or may not be sustained in future. Returns are of existing plans (non–direct plans) - Growth Option. Different plans have different expense structure. Fund Managers : Invesco India Tax Plan - managing since March 29, 2018; Invesco India Financial Services Fund - Amit Ganatra managing since November 9, 2010 and Dhimant Kothari managing since June 1, 2018. Benchmark Returns are calculated using Total Return variant of respective Benchmark Index.
Fund Managers : Pranav Gokhale & Nitin Gosar
Invesco India PSU Equity Fund
PeriodReturns % (CAGR) Value of r 10,000 invested
FundBenchmark Additional Benchmark
FundBenchmark Additional Benchmark
S&P BSE PSU TRI NIFTY 50 TRI S&P BSE PSU TRI NIFTY 50 TRI 1 Year 16.13% 6.86% 12.38% 11,608 10,684 11,2343 Years 3.68% -0.70% 15.12% 11,143 9,790 15,2525 Years 6.32% -0.43% 8.39% 13,591 9,787 14,9677 Years 9.24% 2.50% 12.20% 18,564 11,890 22,38810 Years 6.36% -0.26% 10.48% 18,527 9,744 27,088Since Inception 6.39% -0.33% 10.39% 18,620 9,670 26,970Past performance may or may not be sustained in future. Returns are of existing plans (non–direct plans) - Growth Option. Different plans have different expense structure. Pranav Gokhale managing since September 28, 2015 and Nitin Gosar managing since June 1, 2018. Benchmark Returns are calculated using Total Return variant of respective Benchmark Index.
Fund Manager : Pranav Gokhale & Neelesh Dhamnaskar
Invesco India Infrastructure Fund
Period
Returns % (CAGR) Value of r 10,000 invested
FundBenchmark Additional Benchmark
FundBenchmark Additional Benchmark
S&P BSE India Infrastructure TRI NIFTY 50 TRI S&P BSE India
Infrastructure TRI NIFTY 50 TRI
1 Year 8.38% -2.50% 12.38% 10,835 9,751 11,2343 Years 8.71% 0.61% 15.12% 12,846 10,183 15,2525 Years 5.35% 1.37% 8.39% 12,980 10,702 14,9677 Years 12.76% 7.70% 12.20% 23,173 16,806 22,38810 Years 8.44% 4.17% 10.48% 22,484 15,049 27,088Since Inception 4.70% 0.55% 7.93% 17,380 10,685 25,055
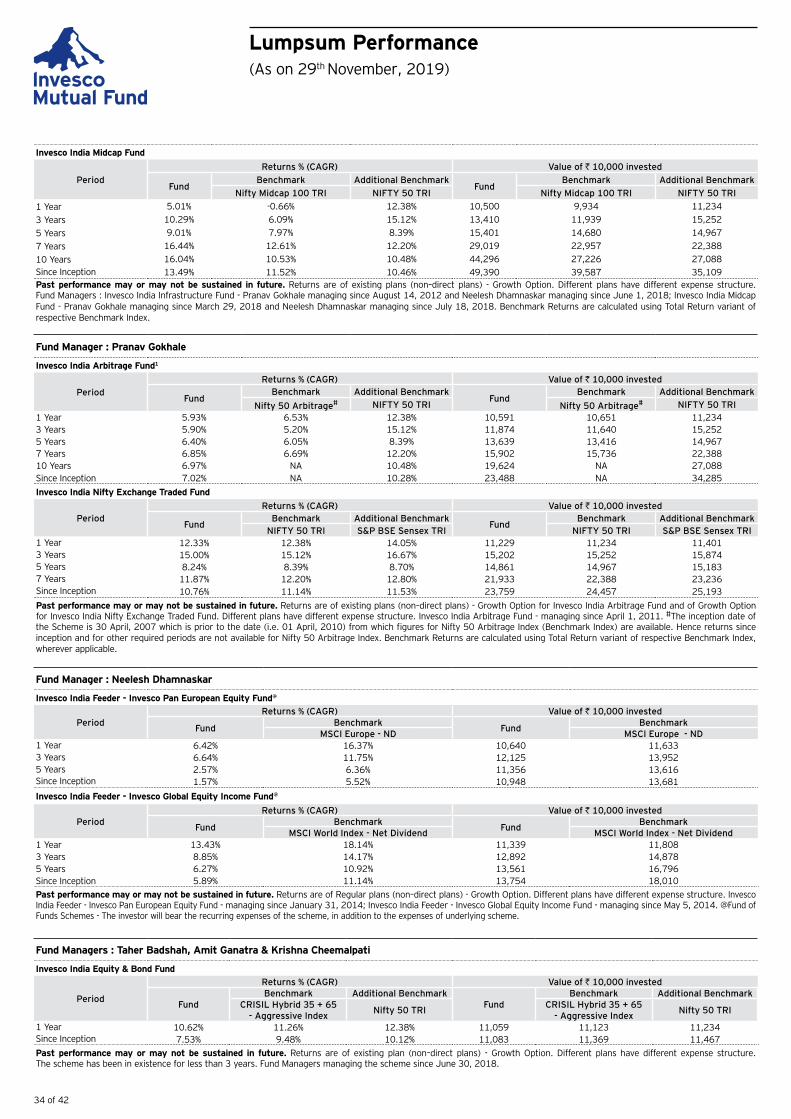
34 of 42
Lumpsum Performance(As on 29th November, 2019)
Invesco India Midcap Fund
PeriodReturns % (CAGR) Value of r 10,000 invested
FundBenchmark Additional Benchmark
FundBenchmark Additional Benchmark
Nifty Midcap 100 TRI NIFTY 50 TRI Nifty Midcap 100 TRI NIFTY 50 TRI 1 Year 5.01% -0.66% 12.38% 10,500 9,934 11,2343 Years 10.29% 6.09% 15.12% 13,410 11,939 15,2525 Years 9.01% 7.97% 8.39% 15,401 14,680 14,9677 Years 16.44% 12.61% 12.20% 29,019 22,957 22,38810 Years 16.04% 10.53% 10.48% 44,296 27,226 27,088Since Inception 13.49% 11.52% 10.46% 49,390 39,587 35,109Past performance may or may not be sustained in future. Returns are of existing plans (non–direct plans) - Growth Option. Different plans have different expense structure. Fund Managers : Invesco India Infrastructure Fund - Pranav Gokhale managing since August 14, 2012 and Neelesh Dhamnaskar managing since June 1, 2018; Invesco India Midcap Fund - Pranav Gokhale managing since March 29, 2018 and Neelesh Dhamnaskar managing since July 18, 2018. Benchmark Returns are calculated using Total Return variant of respective Benchmark Index.
Fund Manager : Pranav Gokhale
Invesco India Arbitrage Fund1
PeriodReturns % (CAGR) Value of r 10,000 invested
FundBenchmark Additional Benchmark
FundBenchmark Additional Benchmark
Nifty 50 Arbitrage# NIFTY 50 TRI Nifty 50 Arbitrage# NIFTY 50 TRI1 Year 5.93% 6.53% 12.38% 10,591 10,651 11,2343 Years 5.90% 5.20% 15.12% 11,874 11,640 15,2525 Years 6.40% 6.05% 8.39% 13,639 13,416 14,9677 Years 6.85% 6.69% 12.20% 15,902 15,736 22,38810 Years 6.97% NA 10.48% 19,624 NA 27,088Since Inception 7.02% NA 10.28% 23,488 NA 34,285Invesco India Nifty Exchange Traded Fund
PeriodReturns % (CAGR) Value of r 10,000 invested
FundBenchmark Additional Benchmark
FundBenchmark Additional Benchmark
NIFTY 50 TRI S&P BSE Sensex TRI NIFTY 50 TRI S&P BSE Sensex TRI1 Year 12.33% 12.38% 14.05% 11,229 11,234 11,4013 Years 15.00% 15.12% 16.67% 15,202 15,252 15,8745 Years 8.24% 8.39% 8.70% 14,861 14,967 15,1837 Years 11.87% 12.20% 12.80% 21,933 22,388 23,236Since Inception 10.76% 11.14% 11.53% 23,759 24,457 25,193Past performance may or may not be sustained in future. Returns are of existing plans (non–direct plans) - Growth Option for Invesco India Arbitrage Fund and of Growth Option for Invesco India Nifty Exchange Traded Fund. Different plans have different expense structure. Invesco India Arbitrage Fund - managing since April 1, 2011. #The inception date of the Scheme is 30 April, 2007 which is prior to the date (i.e. 01 April, 2010) from which figures for Nifty 50 Arbitrage Index (Benchmark Index) are available. Hence returns since inception and for other required periods are not available for Nifty 50 Arbitrage Index. Benchmark Returns are calculated using Total Return variant of respective Benchmark Index, wherever applicable.
Fund Manager : Neelesh Dhamnaskar
Invesco India Feeder - Invesco Pan European Equity Fund@
PeriodReturns % (CAGR) Value of r 10,000 invested
Fund Benchmark Fund BenchmarkMSCI Europe - ND MSCI Europe - ND
1 Year 6.42% 16.37% 10,640 11,6333 Years 6.64% 11.75% 12,125 13,9525 Years 2.57% 6.36% 11,356 13,616Since Inception 1.57% 5.52% 10,948 13,681
Invesco India Feeder - Invesco Global Equity Income Fund@
PeriodReturns % (CAGR) Value of r 10,000 invested
Fund Benchmark Fund BenchmarkMSCI World Index - Net Dividend MSCI World Index - Net Dividend
1 Year 13.43% 18.14% 11,339 11,8083 Years 8.85% 14.17% 12,892 14,8785 Years 6.27% 10.92% 13,561 16,796Since Inception 5.89% 11.14% 13,754 18,010Past performance may or may not be sustained in future. Returns are of Regular plans (non–direct plans) - Growth Option. Different plans have different expense structure. Invesco India Feeder - Invesco Pan European Equity Fund - managing since January 31, 2014; Invesco India Feeder - Invesco Global Equity Income Fund - managing since May 5, 2014. @Fund of Funds Schemes - The investor will bear the recurring expenses of the scheme, in addition to the expenses of underlying scheme.
Fund Managers : Taher Badshah, Amit Ganatra & Krishna Cheemalpati
Invesco India Equity & Bond Fund
Period
Returns % (CAGR) Value of r 10,000 invested
FundBenchmark Additional Benchmark
FundBenchmark Additional Benchmark
CRISIL Hybrid 35 + 65 - Aggressive Index Nifty 50 TRI CRISIL Hybrid 35 + 65
- Aggressive Index Nifty 50 TRI
1 Year 10.62% 11.26% 12.38% 11,059 11,123 11,234Since Inception 7.53% 9.48% 10.12% 11,083 11,369 11,467Past performance may or may not be sustained in future. Returns are of existing plan (non–direct plans) - Growth Option. Different plans have different expense structure. The scheme has been in existence for less than 3 years. Fund Managers managing the scheme since June 30, 2018.

35 of 42
Lumpsum Performance(As on 29th November, 2019)
Fund Manager : Sujoy Das
Invesco India Short Term Fund
Period
Returns % (CAGR) Value of r 10,000 invested
Fund Fund - Plan B
Benchmark Additional BenchmarkFund Fund -
Plan B
Benchmark Additional BenchmarkCRISIL Short Term Bond Fund Index
CRISIL 1 Year T-Bill Index
CRISIL Short Term Bond Fund Index
CRISIL 1 Year T-Bill Index
1 Year 10.13% 10.14% 10.39% 8.09% 11,010 11,011 11,036 10,8063 Years 6.30% 6.30% 7.30% 6.72% 12,008 12,009 12,350 12,1545 Years 7.39% 7.40% 8.26% 7.24% 14,291 14,293 14,875 14,1897 Years 7.57% 7.51% 8.55% 7.23% 16,664 16,600 17,764 16,29610 Years 7.68% 7.57% 8.10% 6.72% 20,967 20,747 21,789 19,158Since Inception 7.76% 7.73% 8.21% 6.57% 25,835 25,743 27,210 22,428
Invesco India Corporate Bond Fund
Period
Returns % (CAGR) Value of r 10,000 invested
FundBenchmark Additional Benchmark
FundBenchmark Additional Benchmark
CRISIL AAA Short Term Bond Index
CRISIL 1 Yr T-Bill Index
CRISIL AAA Short Term Bond Index
CRISIL 1 Yr T-Bill Index
1 Year 12.08% 11.04% 8.09% 11,205 11,101 10,8063 Years 4.50% 7.94% 6.72% 11,410 12,574 12,1545 Years 7.58% 8.45% 7.24% 14,413 15,009 14,1897 Years 7.46% 8.73% 7.23% 16,546 17,961 16,29610 Years 7.58% 8.40% 6.72% 20,777 22,405 19,158Since Inception 6.79% 8.86% 6.54% 22,475 28,480 21,837
Invesco India Gilt Fund
PeriodReturns % (CAGR) Value of r 10,000 invested
FundBenchmark
FundBenchmark
CRISIL 10 year Gilt Index CRISIL 10 year Gilt Index 1 Year 11.80% 12.98% 11,177 11,2943 Years 4.72% 4.96% 11,483 11,5635 Years 8.05% 8.13% 14,733 14,7867 Years 8.02% 7.56% 17,159 16,65110 Years 7.87% 6.69% 21,339 19,106Since Inception 6.47% 6.73% 20,969 21,589
Past performance may or may not be sustained in future. Returns are of existing plans (non–direct plans) - Growth Option. Different plans have different expense structure. Managing the schemes since September 9, 2010.
Fund Manager : Nitish Sikand
Invesco India Money Market Fund
Period
Returns % (CAGR) Value of r 10,000 invested
Fund Fund - RegularBenchmark Additional
BenchmarkFund Fund - Regular
Benchmark Additional Benchmark
CRISIL Money Market Index
CRISIL 1 Year T-Bill Index
CRISIL Money Market Index
CRISIL 1 Year T-Bill Index
1 Year 7.28% 6.48% 7.87% 8.09% 10,726 10,646 10,785 10,8063 Years 7.12% 6.34% 7.39% 6.72% 12,288 12,022 12,384 12,1545 Years 7.62% 6.84% 7.71% 7.24% 14,441 13,923 14,503 14,1897 Years 8.16% 7.18% 8.10% 7.23% 17,314 16,246 17,252 16,29610 Years 8.21% 7.33% 7.92% 6.72% 22,012 20,282 21,432 19,158Since Inception 8.14% 7.28% 7.82% 6.60% 22,330 20,556 21,656 19,262
Invesco India Ultra Short Term Fund
Period
Returns % (CAGR) Value of r 10,000 invested
FundBenchmark Additional Benchmark
FundBenchmark Additional Benchmark
CRISIL Ultra Short Term Debt Index
CRISIL 1 Yr T-Bill Index
CRISIL Ultra Short Term Debt Index
CRISIL 1 Yr T-Bill Index
1 Year 8.07% 8.21% 8.09% 10,805 10,819 10,8063 Years 7.32% 7.56% 6.72% 12,360 12,441 12,1545 Years 7.94% 7.87% 7.24% 14,658 14,612 14,1897 Years 8.01% 8.28% 7.23% 17,153 17,454 16,296Since Inception 8.11% 8.57% 7.22% 20,046 20,820 18,624
Invesco India Banking & PSU Debt Fund
Period
Returns % (CAGR) Value of r 10,000 invested
FundBenchmark Additional Benchmark
FundBenchmark Additional Benchmark
CRISIL Banking and PSU Debt Index
CRISIL 1 Yr T-Bill Index
CRISIL Banking and PSU Debt Index
CRISIL 1 Yr T-Bill Index
1 Year 10.30% 11.45% 8.09% 11,027 11,142 10,8063 Years 7.14% 7.72% 6.72% 12,295 12,497 12,1545 Years 7.26% 8.76% 7.24% 14,205 15,222 14,189Since Inception 7.49% 9.04% 7.21% 16,486 18,206 16,191

36 of 42
Lumpsum Performance(As on 29th November, 2019)
Invesco India Gold Exchange Traded Fund
PeriodReturns % (CAGR) Value of r 10,000 invested
FundBenchmark
FundBenchmark
Price of Gold Price of Gold1 Year 24.55% 25.39% 12,448 12,5313 Years 8.11% 9.07% 12,632 12,9725 Years 6.43% 7.43% 13,661 14,3147 Years 1.55% 2.49% 11,134 11,880Since Inception 7.69% 8.71% 20,557 22,526
Invesco India Gold Fund @
PeriodReturns % (CAGR) Value of r 10,000 invested
FundBenchmark
FundBenchmark
Price of Gold Price of Gold
1 Year 23.05% 25.39% 12,298 12,531
3 Years 8.52% 9.07% 12,777 12,972
5 Years 5.91% 7.43% 13,327 14,314
7 Years 1.00% 2.49% 10,722 11,880
Since Inception 1.89% 3.23% 11,610 12,892
Invesco India Credit Risk Fund
Period
Returns % (CAGR) Value of r 10,000 invested
Fund - RegularBenchmark Additional
Benchmark Fund - RegularBenchmark Additional
BenchmarkCRISIL Composite AA Short
Term Bond Index CRISIL 1 Yr T-Bill Index CRISIL Composite AA Short Term Bond Index CRISIL 1 Yr T-Bill Index
1 Year -3.97% 10.19% 8.09% 9,604 11,016 10,806
3 Years 1.90% 8.16% 6.72% 10,579 12,651 12,154
5 Years 5.28% 8.88% 7.24% 12,935 15,307 14,189
Since Inception 5.64% 9.01% 7.32% 13,329 15,715 14,481
Past performance may or may not be sustained in future. Returns are of existing plans (non–direct plans) - Growth Option. Different plans have different expense structure. Invesco India Money Market Fund – managing since August 28, 2009; Invesco India Ultra Short Term Fund – managing since December 30, 2010; Invesco India Banking & PSU Debt Fund – managing since December 29, 2012; Invesco India Gold Exchange Traded Fund – managing since March 12, 2010; Invesco India Gold Fund – managing since December 5, 2011; Invesco India Credit Risk Fund – Regular Plan – managing since September 4, 2014.
Fund Managers : Krishna Cheemalapati & Nitish Sikand
Invesco India Treasury Advantage Fund
Period
Returns % (CAGR) Value of r 10,000 invested
Fund Fund - Regular
Benchmark Additional Benchmark
Fund Fund - Regular
Benchmark Additional Benchmark
CRISIL Low Duration Debt
Index
CRISIL 1 Yr T-Bill Index
CRISIL Low Duration Debt
Index
CRISIL 1 Yr T-Bill Index
1 Year 9.49% 8.84% 9.00% 8.09% 10,946 10,881 10,898 10,806
3 Years 7.37% 6.81% 7.65% 6.72% 12,377 12,182 12,472 12,154
5 Years 7.90% 7.34% 8.25% 7.24% 14,628 14,257 14,870 14,189
7 Years 8.20% 7.47% 8.61% 7.23% 17,366 16,562 17,824 16,296
10 Years 8.18% 7.46% 8.02% 6.72% 21,957 20,531 21,631 19,158
Since Inception 8.14% 7.46% 7.89% 6.52% 27,383 25,231 26,568 22,552Past performance may or may not be sustained in future. Returns are of existing plans (non–direct plans) - Growth Option. Different plans have different expense structure. Fund Managers : Krishna Cheemalapati - managing since January 1, 2013 and Nitish Sikand - managing since June 23, 2014.
Fund Managers : Krishna Cheemalapati & Abhishek Bandiwdekar
Invesco India Liquid Fund (as on 30th November, 2019)
Period
Returns % (CAGR) Value of r 10,000 invested
Fund Fund - RegularBenchmark Additional
Benchmark Fund Fund - RegularBenchmark Additional
BenchmarkCRISIL Liquid Fund
Index CRISIL 91 Days
T Bill IndexCRISIL Liquid Fund
Index CRISIL 91 Days
T Bill Index1 Year 6.69% 6.12% 7.04% 6.75% 10,669 10,612 10,704 10,675
3 Years 6.90% 6.30% 7.04% 6.63% 12,215 12,011 12,264 12,123
5 Years 7.38% 6.69% 7.41% 7.03% 14,279 13,826 14,297 14,054
7 Years 7.89% 7.00% 7.89% 7.50% 17,019 16,059 17,017 16,591
10 Years 7.90% 7.04% 7.65% 7.01% 21,397 19,752 20,911 19,690Since Inception 7.81% 7.06% 7.50% 6.54% 26,684 24,338 25,694 22,842
Past performance may or may not be sustained in future. Returns are of existing plans (non–direct plans) - Growth Option. Different plans have different expense structure. Fund Managers : Krishna Cheemalapati - managing since April 25, 2011 and Abhishek Bandiwdekar - managing since July 24, 2018.

37 of 42
Fund Managers : Taher Badshah & Amit Ganatra
Invesco India Growth Opportunities Fund
Period
Returns % (CAGR) Value of r 10,000 invested
FundBenchmark Additional Benchmark
FundBenchmark Additional Benchmark
S&P BSE 250 Large MidCap 65:35 TRI NIFTY 50 TRI S&P BSE 250 Large
MidCap 65:35 TRI NIFTY 50 TRI
1 Year 12.47% 8.47% 12.38% 11,243 10,844 11,2343 Years 16.70% 12.63% 15.12% 15,886 14,284 15,2525 Years 12.09% 9.38% 8.39% 17,709 15,665 14,967Since Inception 16.68% 13.06% 12.17% 29,048 23,359 22,113
Invesco India Contra Fund
PeriodReturns % (CAGR) Value of r 10,000 invested
Fund
Benchmark Additional Benchmark Fund
Benchmark Additional BenchmarkS&P BSE 500 TRI NIFTY 50 TRI S&P BSE 500 TRI NIFTY 50 TRI
1 Year 7.57% 9.19% 12.38% 10,754 10,916 11,2343 Years 15.18% 13.00% 15.12% 15,275 14,423 15,2525 Years 12.21% 8.62% 8.39% 17,801 15,126 14,967Since Inception 17.60% 12.32% 12.17% 30,664 22,322 22,113
Past performance may or may not be sustained in future. Returns are of Direct plans - Growth Option. Different plans have different expense structure. Fund Managers : Invesco India Growth Opportunities Fund - Taher Badshah managing since January 13, 2017 and Amit Ganatra managing since June 23, 2014; Invesco India Contra Fund - Taher Badshah managing since January 13, 2017. Benchmark Returns are calculated using Total Return variant of respective Benchmark Index.
Fund Manager : Taher Badshah & Pranav Gokhale
Invesco India Dynamic Equity Fund
Period
Returns % (CAGR) Value of r 10,000 invested
FundBenchmark Additional Benchmark
FundBenchmark Additional Benchmark
CRISIL Hybrid 35+65 - Aggressive Index NIFTY 50 TRI CRISIL Hybrid 35+65 -
Aggressive Index NIFTY 50 TRI
1 Year 10.26% 11.26% 12.38% 11,023 11,123 11,2343 Years 12.04% 11.41% 15.12% 14,062 13,825 15,2525 Years 9.18% 9.09% 8.39% 15,521 15,459 14,967Since Inception 13.60% 11.45% 12.17% 24,145 21,158 22,113
Invesco India Multicap Fund
PeriodReturns % (CAGR) Value of r 10,000 invested
FundBenchmark Additional Benchmark
FundBenchmark Additional Benchmark
S&P BSE AllCap TRI NIFTY 50 TRI S&P BSE AllCap TRI NIFTY 50 TRI1 Year 6.37% 8.33% 12.38% 10,636 10,831 11,2343 Years 10.49% 12.40% 15.12% 13,486 14,196 15,2525 Years 9.72% 8.30% 8.39% 15,911 14,908 14,967Since Inception 17.27% 12.18% 12.17% 30,079 22,127 22,113
Invesco India Smallcap Fund
Period
Returns % (CAGR) Value of r 10,000 invested
FundBenchmark Additional Benchmark
FundBenchmark Additional Benchmark
S&P BSE 250 Smallcap TRI NIFTY 50 TRI S&P BSE 250
Smallcap TRI NIFTY 50 TRI
1 Year 6.72% -5.59% 12.38% 10,670 9,442 11,234Since Inception 7.65% -2.52% 18.21% 10,830 9,728 11,984
Past performance may or may not be sustained in future. Returns are of Direct plans - Growth Option. Different plans have different expense structure. Fund Managers : Invesco India Dynamic Equity Fund - Taher Badshah managing since January 13, 2017 and Pranav Gokhale managing since June 1, 2018; Invesco India Multicap Fund - managing since March 29, 2018, Invesco India Smallcap Fund - Taher Badshah managing since October 30, 2018 and Pranav Gokhale managing since March 1, 2019. Invesco India Smallcap Fund has been in existence for less than 3 years. Benchmark Returns are calculated using Total Return variant of respective Benchmark Index.
Fund Managers : Amit Ganatra & Nitin Gosar
Invesco India Largecap Fund
PeriodReturns % (CAGR) Value of r 10,000 invested
FundBenchmark Additional Benchmark
FundBenchmark Additional Benchmark
NIFTY 50 TRI S&P BSE Sensex TRI NIFTY 50 TRI S&P BSE Sensex TRI1 Year 10.46% 12.38% 14.05% 11,043 11,234 11,4013 Years 13.23% 15.12% 16.67% 14,511 15,252 15,8745 Years 9.87% 8.39% 8.70% 16,021 14,967 15,183Since Inception 14.31% 12.17% 12.76% 25,200 22,113 22,935
Past performance may or may not be sustained in future. Returns are of Direct plans - Growth Option. Different plans have different expense structure. Managing the scheme since March 29, 2018. Benchmark Returns are calculated using Total Return variant of respective Benchmark Index.
Lumpsum Performance - Direct Plan(As on 29th November, 2019)
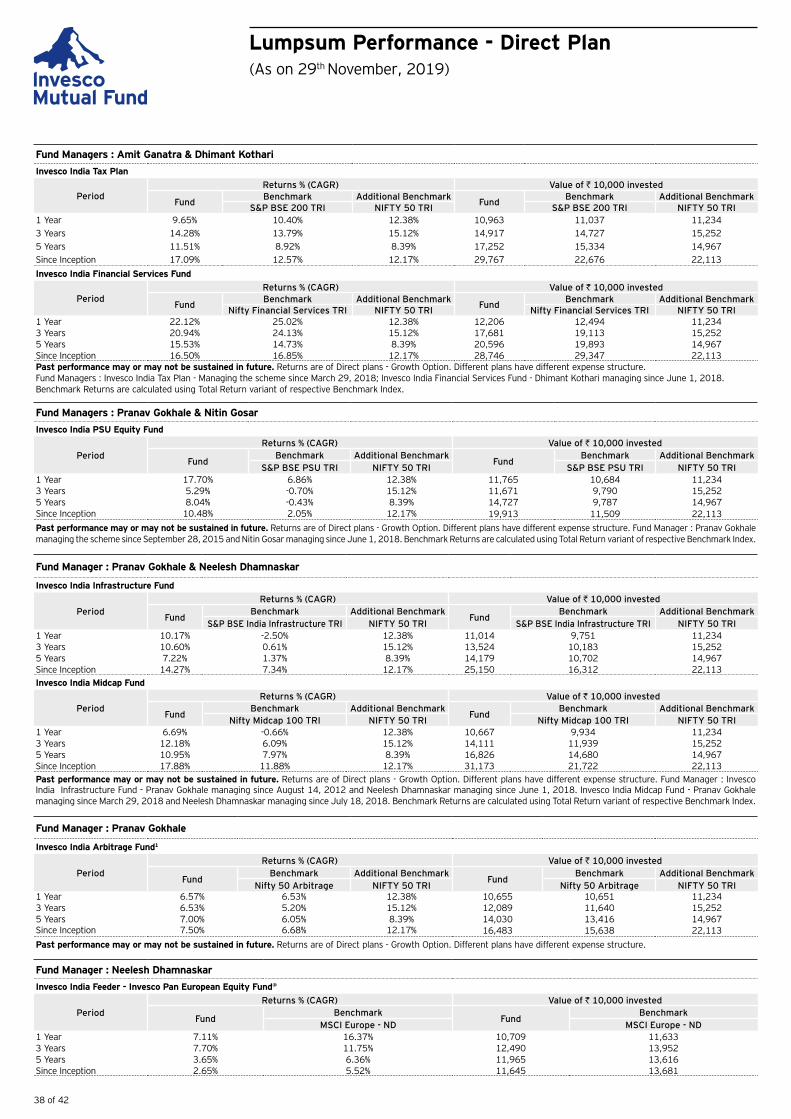
38 of 42
Fund Managers : Amit Ganatra & Dhimant Kothari
Invesco India Tax Plan
PeriodReturns % (CAGR) Value of r 10,000 invested
Fund Benchmark Additional Benchmark Fund Benchmark Additional BenchmarkS&P BSE 200 TRI NIFTY 50 TRI S&P BSE 200 TRI NIFTY 50 TRI
1 Year 9.65% 10.40% 12.38% 10,963 11,037 11,2343 Years 14.28% 13.79% 15.12% 14,917 14,727 15,2525 Years 11.51% 8.92% 8.39% 17,252 15,334 14,967Since Inception 17.09% 12.57% 12.17% 29,767 22,676 22,113
Invesco India Financial Services Fund
PeriodReturns % (CAGR) Value of r 10,000 invested
Fund Benchmark Additional Benchmark Fund Benchmark Additional BenchmarkNifty Financial Services TRI NIFTY 50 TRI Nifty Financial Services TRI NIFTY 50 TRI
1 Year 22.12% 25.02% 12.38% 12,206 12,494 11,2343 Years 20.94% 24.13% 15.12% 17,681 19,113 15,2525 Years 15.53% 14.73% 8.39% 20,596 19,893 14,967Since Inception 16.50% 16.85% 12.17% 28,746 29,347 22,113Past performance may or may not be sustained in future. Returns are of Direct plans - Growth Option. Different plans have different expense structure. Fund Managers : Invesco India Tax Plan - Managing the scheme since March 29, 2018; Invesco India Financial Services Fund - Dhimant Kothari managing since June 1, 2018. Benchmark Returns are calculated using Total Return variant of respective Benchmark Index.
Fund Managers : Pranav Gokhale & Nitin Gosar
Invesco India PSU Equity Fund
PeriodReturns % (CAGR) Value of r 10,000 invested
FundBenchmark Additional Benchmark
FundBenchmark Additional Benchmark
S&P BSE PSU TRI NIFTY 50 TRI S&P BSE PSU TRI NIFTY 50 TRI 1 Year 17.70% 6.86% 12.38% 11,765 10,684 11,2343 Years 5.29% -0.70% 15.12% 11,671 9,790 15,2525 Years 8.04% -0.43% 8.39% 14,727 9,787 14,967Since Inception 10.48% 2.05% 12.17% 19,913 11,509 22,113
Past performance may or may not be sustained in future. Returns are of Direct plans - Growth Option. Different plans have different expense structure. Fund Manager : Pranav Gokhale managing the scheme since September 28, 2015 and Nitin Gosar managing since June 1, 2018. Benchmark Returns are calculated using Total Return variant of respective Benchmark Index.
Fund Manager : Pranav Gokhale & Neelesh Dhamnaskar
Invesco India Infrastructure Fund
PeriodReturns % (CAGR) Value of r 10,000 invested
FundBenchmark Additional Benchmark
FundBenchmark Additional Benchmark
S&P BSE India Infrastructure TRI NIFTY 50 TRI S&P BSE India Infrastructure TRI NIFTY 50 TRI 1 Year 10.17% -2.50% 12.38% 11,014 9,751 11,2343 Years 10.60% 0.61% 15.12% 13,524 10,183 15,2525 Years 7.22% 1.37% 8.39% 14,179 10,702 14,967Since Inception 14.27% 7.34% 12.17% 25,150 16,312 22,113Invesco India Midcap Fund
PeriodReturns % (CAGR) Value of r 10,000 invested
Fund Benchmark Additional Benchmark Fund Benchmark Additional BenchmarkNifty Midcap 100 TRI NIFTY 50 TRI Nifty Midcap 100 TRI NIFTY 50 TRI
1 Year 6.69% -0.66% 12.38% 10,667 9,934 11,2343 Years 12.18% 6.09% 15.12% 14,111 11,939 15,2525 Years 10.95% 7.97% 8.39% 16,826 14,680 14,967Since Inception 17.88% 11.88% 12.17% 31,173 21,722 22,113Past performance may or may not be sustained in future. Returns are of Direct plans - Growth Option. Different plans have different expense structure. Fund Manager : Invesco India Infrastructure Fund - Pranav Gokhale managing since August 14, 2012 and Neelesh Dhamnaskar managing since June 1, 2018. Invesco India Midcap Fund - Pranav Gokhale managing since March 29, 2018 and Neelesh Dhamnaskar managing since July 18, 2018. Benchmark Returns are calculated using Total Return variant of respective Benchmark Index.
Fund Manager : Pranav Gokhale
Invesco India Arbitrage Fund1
PeriodReturns % (CAGR) Value of r 10,000 invested
FundBenchmark Additional Benchmark
FundBenchmark Additional Benchmark
Nifty 50 Arbitrage NIFTY 50 TRI Nifty 50 Arbitrage NIFTY 50 TRI1 Year 6.57% 6.53% 12.38% 10,655 10,651 11,2343 Years 6.53% 5.20% 15.12% 12,089 11,640 15,2525 Years 7.00% 6.05% 8.39% 14,030 13,416 14,967Since Inception 7.50% 6.68% 12.17% 16,483 15,638 22,113
Past performance may or may not be sustained in future. Returns are of Direct plans - Growth Option. Different plans have different expense structure.
Fund Manager : Neelesh Dhamnaskar
Invesco India Feeder - Invesco Pan European Equity Fund@
PeriodReturns % (CAGR) Value of r 10,000 invested
FundBenchmark
FundBenchmark
MSCI Europe - ND MSCI Europe - ND1 Year 7.11% 16.37% 10,709 11,6333 Years 7.70% 11.75% 12,490 13,9525 Years 3.65% 6.36% 11,965 13,616Since Inception 2.65% 5.52% 11,645 13,681
Lumpsum Performance - Direct Plan(As on 29th November, 2019)

39 of 42
Invesco India Feeder - Invesco Global Equity Income Fund@
PeriodReturns % (CAGR) Value of r 10,000 invested
Fund Benchmark Fund BenchmarkMSCI World Index - Net Dividend MSCI World Index - Net Dividend
1 Year 14.32% 18.14% 11,428 11,8083 Years 10.05% 14.17% 13,324 14,8785 Years 7.51% 10.92% 14,367 16,796Since Inception 7.14% 11.14% 14,689 18,010Past performance may or may not be sustained in future. Returns are of Direct plans - Growth Option. Different plans have different expense structure. @Fund of Funds Schemes - The investor will bear the recurring expenses of the scheme, in addition to the expenses of underlying scheme.
Fund Managers : Taher Badshah, Amit Ganatra & Krishna Cheemalpati
Invesco India Equity & Bond Fund
Period
Returns % (CAGR) Value of r 10,000 invested
FundBenchmark Additional Benchmark
FundBenchmark Additional Benchmark
CRISIL Hybrid 35 + 65 - Aggressive Index Nifty 50 TRI CRISIL Hybrid 35 + 65
- Aggressive Index Nifty 50 TRI
1 Year 12.21% 11.26% 12.38% 11,217 11,123 11,234
Since Inception 9.14% 9.48% 10.12% 11,318 11,369 11,467
Past performance may or may not be sustained in future. Returns are of direct plan - Growth Option. Different plans have different expense structure. The scheme has been in existence for less than 3 years.
Fund Manager : Sujoy Das
Invesco India Short Term Fund
Period
Returns % (CAGR) Value of r 10,000 invested
FundBenchmark Additional Benchmark
FundBenchmark Additional Benchmark
CRISIL Short Term Bond Fund Index
CRISIL 1 Year T-Bill Index
CRISIL Short Term Bond Fund Index
CRISIL 1 Year T-Bill Index
1 Year 11.07% 10.39% 8.09% 11,104 11,036 10,8063 Years 7.12% 7.30% 6.72% 12,290 12,350 12,1545 Years 8.25% 8.26% 7.24% 14,870 14,875 14,189Since Inception 8.46% 8.56% 7.21% 17,532 17,640 16,178
Invesco India Corporate Bond Fund
Period
Returns % (CAGR) Value of r 10,000 invested
FundBenchmark Additional Benchmark
FundBenchmark Additional Benchmark
CRISIL AAA Short Term Bond Index
CRISIL 1 Yr T-Bill Index
CRISIL AAA Short Term Bond Index
CRISIL 1 Yr T-Bill Index
1 Year 12.57% 11.04% 8.09% 11,254 11,101 10,8063 Years 5.14% 7.94% 6.72% 11,622 12,574 12,1545 Years 8.38% 8.45% 7.24% 14,962 15,009 14,189Since Inception 8.08% 8.71% 7.21% 17,109 17,816 16,178
Invesco India Gilt Fund
PeriodReturns % (CAGR) Value of r 10,000 invested
FundBenchmark
FundBenchmark
CRISIL 10 year Gilt Index CRISIL 10 year Gilt Index 1 Year 12.64% 12.98% 11,260 11,2943 Years 5.51% 4.96% 11,744 11,5635 Years 8.88% 8.13% 15,312 14,786Since Inception 8.73% 7.36% 17,835 16,340Past performance may or may not be sustained in future. Returns are of Direct plans - Growth Option. Different plans have different expense structure.
Fund Manager : Nitish Sikand
Invesco India Money Market Fund
Period
Returns % (CAGR) Value of r 10,000 invested
FundBenchmark Additional Benchmark
FundBenchmark Additional Benchmark
CRISIL Money Market Index CRISIL 1 Yr T-Bill Index CRISIL Money Market
Index CRISIL 1 Yr T-Bill Index
1 Year 7.55% 7.87% 8.09% 10,753 10,785 10,8063 Years 7.38% 7.39% 6.72% 12,380 12,384 12,1545 Years 7.89% 7.71% 7.24% 14,623 14,503 14,189Since Inception 8.42% 8.09% 7.21% 17,484 17,124 16,178
Invesco India Ultra Short Term Fund
Period
Returns % (CAGR) Value of r 10,000 invested
FundBenchmark Additional Benchmark
FundBenchmark Additional Benchmark
CRISIL Ultra Short Term Debt Index CRISIL 1 Yr T-Bill Index CRISIL Ultra Short Term
Debt Index CRISIL 1 Yr T-Bill Index
1 Year 8.61% 8.21% 8.09% 10,859 10,819 10,8063 Years 7.83% 7.56% 6.72% 12,535 12,441 12,1545 Years 8.40% 7.87% 7.24% 14,977 14,612 14,189Since Inception 8.51% 8.27% 7.21% 17,591 17,323 16,178
Lumpsum Performance - Direct Plan(As on 29th November, 2019)

40 of 42
Invesco India Banking & PSU Debt Fund
Period
Returns % (CAGR) Value of r 10,000 invested
FundBenchmark Additional Benchmark
FundBenchmark Additional Benchmark
CRISIL Banking and PSU Debt Index CRISIL 1 Yr T-Bill Index CRISIL Banking and PSU
Debt Index CRISIL 1 Yr T-Bill Index
1 Year 10.74% 11.45% 8.09% 11,071 11,142 10,8063 Years 7.57% 7.72% 6.72% 12,443 12,497 12,1545 Years 7.84% 8.76% 7.24% 14,593 15,222 14,189Since Inception 8.16% 9.00% 7.21% 17,201 18,147 16,178
Invesco India Gold Fund @
PeriodReturns % (CAGR) Value of r 10,000 invested
FundBenchmark
FundBenchmark
Price of Gold Price of Gold1 Year 23.49% 25.39% 12,341 12,5313 Years 8.85% 9.07% 12,893 12,9725 Years 6.21% 7.43% 13,518 14,314Since Inception 1.73% 3.01% 11,259 12,275
Invesco India Credit Risk Fund
Period
Returns % (CAGR) Value of r 10,000 invested
FundBenchmark Additional Benchmark
FundBenchmark Additional Benchmark
CRISIL Composite AA Short Term Bond Index CRISIL 1 Yr T-Bill Index CRISIL Composite AA Short
Term Bond Index CRISIL 1 Yr T-Bill Index
1 Year -3.06% 10.19% 8.09% 9,695 11,016 10,8063 Years 2.73% 8.16% 6.72% 10,840 12,651 12,1545 Years 6.11% 8.88% 7.24% 13,456 15,307 14,189Since Inception 6.47% 9.01% 7.32% 13,889 15,715 14,481
Past performance may or may not be sustained in future. Returns are of Direct plans - Growth Option. Different plans have different expense structure. @Fund of Funds Schemes - The investor will bear the recurring expenses of the scheme, in addition to the expenses of underlying scheme.
Fund Managers : Krishna Cheemalapati & Nitish Sikand
Invesco India Treasury Advantage Fund
Period
Returns % (CAGR) Value of r 10,000 invested
FundBenchmark Additional Benchmark
FundBenchmark Additional Benchmark
CRISIL Low Duration Debt Index
CRISIL 1 Yr T-Bill Index
CRISIL Low Duration Debt Index
CRISIL 1 Yr T-Bill Index
1 Year 9.82% 9.00% 8.09% 10,979 10,898 10,8063 Years 7.77% 7.65% 6.72% 12,515 12,472 12,1545 Years 8.27% 8.25% 7.24% 14,882 14,870 14,189Since Inception 8.57% 8.60% 7.21% 17,658 17,688 16,178
Past performance may or may not be sustained in future. Returns are of Direct plans - Growth Option. Different plans have different expense structure. Fund Manager : Nitish Sikand - managing since June 23, 2014.
Fund Managers : Krishna Cheemalapati & Abhishek Bandiwdekar
Invesco India Liquid Fund (as on 30th November, 2019)
Period
Returns % (CAGR) Value of r 10,000 invested
FundBenchmark Additional Benchmark
FundBenchmark Additional Benchmark
CRISIL Liquid Fund Index
CRISIL 91 Days T Bill Index
CRISIL Liquid Fund Index
CRISIL 91 Days T Bill Index
1 Year 6.76% 7.04% 6.75% 10,676 10,704 10,6753 Years 6.97% 7.04% 6.63% 12,241 12,264 12,1235 Years 7.46% 7.41% 7.03% 14,329 14,297 14,054Since Inception 7.95% 7.89% 7.49% 16,973 16,904 16,473
Past performance may or may not be sustained in future. Returns are of Direct plans - Growth Option. Different plans have different expense structure. Fund Manager : Abhishek Bandiwdekar - managing since July 24, 2018.
Lumpsum Performance - Direct Plan(As on 29th November, 2019)

41 of 42
Table IAsset Class-wise disclosure of AUM & AAUM - September 2019
R in LakhsCategory of the Scheme Average AUM
for the Quarter Liquid Fund/Money Market Fund/ Floater Fund 839,727.17
Gilt Fund/ Gilt Fund with 10 year constant duration 2,595.84
Remaining Income/ Debt Oriented Schemes 462,029.48
Growth/ Equity Oriented Schemes (Other than ELSS) 770,141.47
ELSS Funds 85,711.98
Hybrid Schemes 187,120.55
Solution Oriented Schemes 0.00
Index Funds 0.00
GOLD ETF 3,543.86
Other ETF 199.74
Fund of Fund investing overseas 3,213.03
Total 2,354,283.11
Table IIAuM REPORT FOR THE QUARTER ENDED (30/09/2019)
Disclosure of percentage of AUM by geography
Geographical Spread % of Total AUM as on the last day of the Quarter (Sep ‘19)
Top 5 Cities 67.37%
Next 10 Cities 16.67%
Next 20 Cities 8.28%
Next 75 Cities 5.88%
Others 1.81%
Total 100.00%
Assets Under Management
No. of Schemes managed by respective Fund ManagersTaher Badshah 7 Sujoy Das 3
Amit Ganatra 7 Nitish Sikand 7 & FMPs
Pranav Gokhale 8 Krishna Cheemalapati 4
Nitin Gosar 2 Neelesh Dhamnaskar 4
Dhimant Kothari 2 Abhishek Bandiwdekar 1
NotesReturns above 1 year are CAGR. Compounded Annualised Growth Rate (CAGR). Inception date is deemed to be date of allotment.
Invesco India Equity Savings Fund has not completed 1 year, hence performance data is not provided.
Note for Direct Plan : The date of allotment for Direct Plan is January 1, 2013 for all schemes except Invesco India Credit Risk Fund. (i) Applicable to all schemes except Invesco India Credit Risk Fund and Invesco India Liquid Fund : For calculating returns since inception for Direct Plan, NAV as on January 1, 2013 of corresponding Growth Option of Existing Plan is considered. (ii) Applicable only to Invesco India Liquid Fund : For calculating returns since inception for Direct Plan, NAV as on December 31, 2012 of corresponding Growth Option of Existing Plan is considered.
Returns for Invesco India Nifty Exchange Traded Fund are calculated after considering dividend reinvestment of v 5 per unit on record date - December 26, 2012 at ex-dividend NAV of v 591.3176 per unit. For calculating returns since inception of all schemes except open ended debt schemes, Invesco India Gold Exchange Traded Fund and Invesco India Nifty Exchange Traded Fund, NAV as on the date of allotment is taken as v 10/-. For calculating returns since inception for Invesco India Gold Exchange Traded Fund, NAV as on the date of allotment is taken as v 1,680.0014 and for Invesco India Nifty Exchange Traded Fund, NAV as on the date of allotment is taken as v 548.28. For calculating returns since inception for open ended debt schemes NAV as on the date of allotment is taken as v 1,000/-. Face Value per unit is v 10/- for all schemes except for open ended debt schemes and Invesco India Gold Exchange Traded Fund where Face Value per unit is v 1,000/- and v 100/- respectively.
The performance of Invesco India Fixed Maturity plans (FMPs) is not given above, as FMPs are close-ended schemes of varying maturities, performance of FMPs may or may not be strictly comparable with open-ended debt schemes.1 Invesco India Arbitrage Fund performance is not strictly comparable with that of its additional benchmark since the scheme does not take directional call in equity markets but is limited to availing arbitrage opportunities etc.
Scheme Name Date of Allotment
Invesco India Equity Savings Fund 7th March, 2019
Invesco India Smallcap Fund 30th October, 2018
Invesco India Equity & Bond Fund 30th June, 2018
Invesco India Credit Risk Fund 4th September, 2014
Invesco India Feeder - Invesco Global Equity Income Fund 5th May, 2014
Invesco India Feeder - Invesco Pan European Equity Fund 31st January, 2014
Invesco India Banking & PSU Debt Fund 29th December, 2012
Invesco India Gold Fund 5th December, 2011
Invesco India Nifty Exchange Traded Fund 13th June, 2011
Invesco India Ultra Short Term Fund 30th December, 2010
Invesco India Gold Exchange Traded Fund 12th March, 2010
Invesco India PSU Equity Fund 18th November, 2009
Invesco India Money Market Fund 28th August, 2009
Invesco India Largecap Fund 21st August, 2009
Scheme Name Date of Allotment
Invesco India Financial Services Fund 14th July, 2008
Invesco India Multicap Fund 17th March, 2008
Invesco India Gilt Fund 9th February, 2008
Invesco India Infrastructure Fund 21st November, 2007
Invesco India Dynamic Equity Fund 4th October, 2007
Invesco India Growth Opportunities Fund 9th August, 2007
Invesco India Corporate Bond Fund 2nd August, 2007
Invesco India Arbitrage Fund 30th April, 2007
Invesco India Midcap Fund 19th April, 2007
Invesco India Contra Fund 11th April, 2007
Invesco India Short Term Fund 24th March, 2007
Invesco India Treasury Advantage Fund 18th January, 2007
Invesco India Tax Plan 29th December, 2006
Invesco India Liquid Fund 17th November, 2006
Lumpsum Performance

42 of 42
The upfront commission, if any, on investment made by the investor shall be paid by the investor directly to the Distributor, based on his assessment of various factors including the service rendered by the Distributor.1Exit load charged, if any, will be credited back to the scheme, net of goods & services tax.2Includes goods & services tax on management fee accrued and additional TER charged on account of inflows from beyond top 30 cities, wherever applicable.2aExcluding total recurring expense charged by the Underlying Fund.4YTM : Yield to maturity should not be construed as minimum return offered by Scheme.Note on Direct Plan : Pursuant to provisions of SEBI Circular No. CIR/IMD/DF/21/2012 dated September 13, 2012, a separate plan for direct investments (i.e. investments not routed through Distributor) under all Schemes of Invesco Mutual Fund (except Exchange Traded Funds) was introduced with effect from January 1, 2013. Direct Plan under Invesco India Feeder - Invesco Pan European Equity Fund, Invesco India Feeder - Invesco Global Equity Income Fund and Invesco India Credit Risk Fund is available since inception. Direct Plan will have a lower expense ratio excluding distribution expenses, commission for distribution of Units etc.Note on Exit Load Structure for Switch to & from Direct Plan within the Scheme : (a) For Switch to Direct Plan: Transaction not routed through Distributor: Nil; Transaction routed through Distributor: Applicable exit load. (b) For Switch from Direct Plan : Nil: It should be noted that if the Unit holder redeems / switches-out such switched units from existing / regular plan before completing specified exit load period from the date of original purchase, applicable exit load will be charged.Note Applicable to Dividend Distribution : The dividend distribution table includes details of past 3 dividends declared and does not include details of all the dividends declared in the scheme(s) since inception, wherever applicable.Disclaimer of NSE Indices Limited : The “Product” offered by “the issuer” is not sponsored, endorsed, sold or promoted by NSE Indices Limited. NSE Indices Limited does not make any representation or warranty, express or implied (including warranties of merchantability or fitness for particular purpose or use) and disclaims all liability to the owners of “the Product” or any member of the public regarding the advisability of investing in securities generally or in the “the Product” linked to Nifty 50 / Nifty 50 Arbitrage / Nifty Financial Services / Nifty Midcap 100 / Nifty Equity Savings or particularly in the ability of the Nifty 50 / Nifty
50 Arbitrage / Nifty Financial Services / Nifty Midcap 100 / Nifty Equity Savings to track general stock market performance in India. Please read the full Disclaimers in relation to the mentioned indices in the Offer Document / Prospectus / Information Statement.Disclaimer of AIPL: The (S&P BSE 200 / S&P BSE 500 / S&P BSE Sensex / S&P BSE PSU / S&P BSE AllCap / S&P BSE India Infrastructure / S&P BSE 250 Large MidCap 65:35) is a product of AIPL, which is a joint venture of S&P Dow Jones Indices LLC or its affiliates (“SPDJI”) and BSE, and has been licensed for use by Invesco Asset Management (India) Pvt. Ltd. (IAMI), Standard & Poor’s® and S&P® are registered trademarks of Standard & Poor’s Financial Services LLC (“S&P”); BSE® is a registered trademark of BSE Limited (“BSE”); Dow Jones® is a registred trademark of Dow Jones Trademark Holdings LLC (“Dow Jones”); and these trademarks have been licensed for use by AIPL and sublicensed for certain purposes by IAMI. © Asia Index Private Limited 201[x]. All rights reserved. Redistribution, reproduction and/or photocopying in whole or in part are prohibited without written permission of AIPL. For more information on any of AIPL’s indices please visit http://www.asiandex.com/. None of AIPL, BSE, Dow Jones Trademark Holdings LLC, their affiliates nor their third party licensors make any representation or warranty, express or implied, as to the ability of any index to accurately represent the asset class or market sector that it purports to represent and none of AIPL, BSE, S&P Dow Jones Indices LLC, Dow Jones Trademark Holdings LLC or their affiliates nor their third party licensors shall have any liability for any errors, omissions, or interruptions of any index or the data included therein.The information contained herein should not be altered in any way, transmitted to, copied or distributed, in part or in whole, to any other person or to the media or reproduced in any form, without prior written consent of Invesco Asset Management (India) Pvt. Ltd. (IAMI). Any information contained in this publication does not constitute and shall be deemed not to constitute an advice, an offer to sell / purchase or as an invitation or solicitation to do so for any security of any entity, and further IAMI / affiliates / sponsor / trustee (IAMI Group) or their officers, employees, personnel, directors shall not be liable for any loss, damage, liability whatsoever for any direct or indirect loss arising from the use or access of any information that may be displayed in this publication from time to time. Recipients of the information contained herein should exercise due care and caution and read the scheme information documents/statement of additional information (including if necessary, obtaining the advice of tax / legal / accounting / financial / other professionals) prior to taking of any decision, acting or omitting to act, on the basis of the information contained herein.
How to read Fact SheetFund Manager : An employee of the asset management company such as a mutual fund or life insurer, who manages investments of the scheme. He is usually part of a larger team of fund managers and research analysts.Application Amount for Fresh Subscription : This is the minimum investment amount for a new investor in a mutual fund scheme.Minimum Additional Amount : This is the minimum investment amount for an existing investor in a mutual fund scheme.Yield to Maturity : The Yield to Maturity or the YTM is the rate of return anticipated on a bond if held until maturity. YTM is expressed as an annual rate. The YTM factors in the bond’s current market price, par value, coupon interest rate and time to maturity.SIP : SIP or systematic investment plan works on the principle of making periodic investments of a fixed sum. It works similar to a recurring bank deposit. For instance, an investor may opt for an SIP that invests v 500 every 15th of the month in an equity fund for a period of three years.NAV : The NAV or the net asset value is the total asset value per unit of the mutual fund after deducting all related and permissible expenses. The NAV is calculated at the end of every business day. It is the value at which the investor enters or exits the mutual fund.Benchmark : A group of securities, usually a market index, whose performance is used as a standard or benchmark to measure investment performance of mutual funds, among other investments. Some typical benchmarks include the Nifty, Sensex, BSE 200, BSE 500, 10-Year Gsec.Entry Load : A mutual fund may have a sales charge or load at the time of entry and/or exit to compensate the distributor/agent. Entry load is charged at the time an investor purchases the units of a mutual fund. The entry load is added to the prevailing NAV at the time of investment. For instance, if the NAV is v 100 and the entry load is 1%, the investor will enter the fund at v 101.Note : SEBI, vide circular dated June 30, 2009 has abolished entry load and mandated that the upfront commission to distributors will be paid by the investor directly to the distributor, based on his assessment of various factors including the service rendered by the distributor.
Exit Load : Exit load is charged at the time an investor redeems the units of a mutual fund. The exit load is deducted from the prevailing NAV at the time of redemption. The investor
will receive redemption proceeds at net value of NAV less exit load. For instance, if the NAV is v 100 and the exit load is 1%, the investor will receive v 99.
Macaulay Duration : Macaulay duration of a bond is the number of years taken to recover the initial investment of a bond. It is calculated as the weighted average number of years to receive the cash flow wherein the present value of respective cash flows is multiplied with the time to that respective cash flows. The total of such values is divided by the price of the security to arrive at the duration.
Modified Duration : Modified duration is the price sensitivity and the percentage change in price for a unit change in yield.
Standard Deviation : Standard deviation is a statistical measure of the range of an investment’s performance. When a mutual fund has a high standard deviation, it means its range of performance is wide, implying greater volatility.
Sharpe Ratio : The Sharpe Ratio, named after its founder, the Nobel Laureate William Sharpe, is a measure of risk-adjusted returns. It is calculated using standard deviation and excess return to determine reward per unit of risk.
Beta : Beta is a measure of an investment’s volatility vis-à-vis the market. Beta of less than 1 means that the security will be less volatile than the market. A beta of greater than 1 implies that the security’s price will be more volatile than the market.
AUM : AUM or assets under management refers to the recent / updated cumulative market value of investments managed by a mutual fund or any investment firm.
Holdings : The holdings or the portfolio is a mutual fund’s latest or updated reported statement of investments/securities. These are usually displayed in terms of percentage to net assets or the rupee value or both. The objective is to give investors an idea of where their money is being invested by the fund manager.
Nature of Scheme : The investment objective and underlying investments determine the nature of the mutual fund scheme. For instance, a mutual fund that aims at generating capital appreciation by investing in stock markets is an equity fund or growth fund. Likewise, a mutual fund that aims at capital preservation by investing in debt markets is a debt fund or income fund. Each of these categories may have sub-categories.Rating Profile : Mutual funds invest in securities after evaluating their creditworthiness as disclosed by the ratings. A depiction of the mutual fund in various investments based on their ratings becomes the rating profile of the fund. Typically, this is a feature of debt funds.
Agra : 0562 - 6459171 Ahmedabad : 079 - 66521550 Allahabad : 0532 - 6455816 Bengaluru : 080 - 42941000 Baroda : 07819064804 Bhopal : 0755 - 4253972 Bhubaneshwar : 09937082201 Chandigarh : 09041003653 Chennai : 09043000628 Coimbatore : 09843555682 Dehradun : 0135 - 6453212
Delhi : 011 - 43789000 Hyderabad : 09030015457 Indore : 07415000281 Jaipur : 0141 - 6451086 Jalandhar : 0181 - 4626870 Jamshedpur : 09709099913 Kanpur : 0512 - 6451658 Kochi : 09037001509 Kolkata : 033 - 40639115 Lucknow : 0522 - 4000841 Ludhiana : 0161 - 6543354
Madurai : 0452 - 6460114 Mumbai (H.O) : 022 - 67310000 Mumbai
(Nariman Point): 022 - 43416000
Nagpur : 0712 - 6463962 Panaji : 0832 - 6650402 Patna : 09264457840 Pune : 020 - 41291015 Raipur : 0771 - 4056046 Surat : 0261 - 6450848 Varanasi : 0542 - 6055444
AMC Branches

Invesco Asset Management (India) Private Limited2101-A, 21st Floor, A Wing, Marathon Futurex, N.M. Joshi Marg, Lower Parel, Mumbai - 400 013.Telephone +91 22 6731 0000Fax +91 22 2301 9422
To invest:Call 1800 209 0007SMS ‘invest’ to 56677
www.invescomutualfund.com
Follow us on
Equity FundsInvesco India Tax PlanInvesco India Multicap FundInvesco India Contra FundInvesco India Largecap FundInvesco India Growth Opportunities FundInvesco India Midcap FundInvesco India Smallcap FundInvesco India Financial Services FundInvesco India Infrastructure FundInvesco India PSU Equity Fund
Hybrid FundsInvesco India Arbitrage FundInvesco India Dynamic Equity FundInvesco India Equity & Bond FundInvesco India Equity Savings Fund
Debt FundsInvesco India Liquid FundInvesco India Treasury Advantage FundInvesco India Short Term FundInvesco India Money Market FundInvesco India Ultra Short Term FundInvesco India Credit Risk FundInvesco India Gilt FundInvesco India Corporate Bond FundInvesco India Banking & PSU Debt Fund
Fund of FundsInvesco India Feeder - Invesco Pan European Equity FundInvesco India Feeder - Invesco Global Equity Income FundInvesco India Gold Fund
Exchange Traded FundsInvesco India Gold Exchange Traded FundInvesco India Nifty Exchange Traded Fund
Strengthen your portfoliowith Invesco.
Mutual fund investments are subject to market risks,read all scheme related documents carefully.