Introduction - World Bank
14
National & Policy Climate and Disaster Risk Screening Tool Approach, Methodology, and Data for Climate and Disaster Risk Screening Tool for the National & Policy Tool Introduction The Climate and Disaster Risk Screening Tool has been designed to help World Bank staff and other development practitioners screen key national development goals and associated priority sectors for risks from climate variability and change, as well as from geophysical disasters. This document outlines the tool’s methodology, including the scientific and logical basis underlying the design of the tool and the data used within it. The tool is intended to help mainstream climate and disaster-risk reduction into the World Bank’s strategic planning for a country, including the development of Systematic Country Diagnostics (SCDs), and Country Partnership Frameworks (CPFs), as well as key Development Policy Operations and sector strategies. It is not a detailed risk assessment tool and it does not recommend specific adaptation measures for increasing a sector’s resilience. Rather, it has been developed to help facilitate dialogue about the effects of climate and geophysical hazards on the priority sectors. The tool can also be used in national planning for a specific sector. The tool is designed to help users assess the key ways in which the occurrence and intensity of hazards can affect sectors and policies at the national level. It does so by guiding users through a series of screening stages to connect information on these hazards with their understanding of the sectors and the readiness of national ministries, departments and other relevant institutions to address the impacts. Key Terminology Adaptive capacity: “The ability of systems, institutions, humans, and other organisms to adjust to potential damage, to take advantage of opportunities, or to respond to consequences” of hazards. 1 Climate hazard: Hydro-meteorological and oceanographic variables and phenomena with the potential to cause harm to human health, livelihoods, or systems, or natural resources. Geophysical hazard: Natural land processes and events with the potential to cause harm to human health, livelihoods, or systems, or natural resources. Exposure: “The presence of people, livelihoods, species or ecosystems, environmental services and resources, infrastructure, or economic, social, or cultural assets in places that could be adversely affected” by a hazard.* Sensitivity: “The degree to which a system or species is affected, either adversely or beneficially, by climate variability or change” or geophysical hazards.* Potential impact: The effects on human or natural assets and systems as a result of exposure and sensitivity, either beneficial or harmful. Risk: “The potential for consequences where something of human value (including humans themselves) is at stake and where the outcome is uncertain.” This tool defines risk as a combination of exposure, sensitivity, and adaptive capacity. It does not define risk as the product of probability of hazardous events and the consequences of those events, as is frequently used. 1 Definitions adapted from IPCC, 2014: Climate Change 2014: Impacts, Adaptation, and Vulnerability. Contribution of Working Group II to the Fifth Assessment Report of the Intergovernmental Panel on Climate Change. http://www.ipcc.ch/report/ar5/wg2/ 2 N. Brooks, 2003. “Vulnerability, Risk and Adaptation: A Conceptual Framework” Working Paper No. 38. Tyndall Centre. http://www.tyndall.ac.uk/sites/default/files/wp38.pdf Box 1. Key terminology and definitions as applied in this tool.
Transcript of Introduction - World Bank

National & Policy Climate and Disaster Risk Screening Tool
Approach, Methodology, and Data for Climate and Disaster Risk Screening Tool for the National & Policy Tool
Introduction The Climate and Disaster Risk Screening Tool has been designed to help World Bank staff and other
development practitioners screen key national development goals and associated priority sectors for
risks from climate variability and change, as well as from geophysical disasters. This document outlines
the tool’s methodology, including the scientific and logical basis underlying the design of the tool and
the data used within it.
The tool is intended to help mainstream climate and disaster-risk reduction into the World Bank’s
strategic planning for a country, including the development of Systematic Country Diagnostics (SCDs),
and Country Partnership Frameworks (CPFs), as well as key Development Policy Operations and sector
strategies. It is not a detailed risk assessment tool and it does not recommend specific adaptation
measures for increasing a sector’s resilience. Rather, it has been developed to help facilitate dialogue
about the effects of climate and geophysical hazards on the priority sectors. The tool can also be used in
national planning for a specific sector.
The tool is designed to help users assess the key ways in which the occurrence and intensity of hazards
can affect sectors and policies at the national level. It does so by guiding users through a series of
screening stages to connect information on these hazards with their understanding of the sectors and
the readiness of national ministries, departments and other relevant institutions to address the impacts.
Key Terminology
Adaptive capacity: “The ability of systems, institutions, humans, and other organisms to adjust to potential damage, to
take advantage of opportunities, or to respond to consequences” of hazards.1
Climate hazard: Hydro-meteorological and oceanographic variables and phenomena with the potential to cause harm to
human health, livelihoods, or systems, or natural resources.
Geophysical hazard: Natural land processes and events with the potential to cause harm to human health, livelihoods, or
systems, or natural resources.
Exposure: “The presence of people, livelihoods, species or ecosystems, environmental services and resources,
infrastructure, or economic, social, or cultural assets in places that could be adversely affected” by a hazard.*
Sensitivity: “The degree to which a system or species is affected, either adversely or beneficially, by climate variability or
change” or geophysical hazards.*
Potential impact: The effects on human or natural assets and systems as a result of exposure and sensitivity, either
beneficial or harmful.
Risk: “The potential for consequences where something of human value (including humans themselves) is at stake and
where the outcome is uncertain.” This tool defines risk as a combination of exposure, sensitivity, and adaptive capacity. It
does not define risk as the product of probability of hazardous events and the consequences of those events, as is
frequently used.
1 Definitions adapted from IPCC, 2014: Climate Change 2014: Impacts, Adaptation, and Vulnerability. Contribution of Working Group II to
the Fifth Assessment Report of the Intergovernmental Panel on Climate Change. http://www.ipcc.ch/report/ar5/wg2/ 2 N. Brooks, 2003. “Vulnerability, Risk and Adaptation: A Conceptual Framework” Working Paper No. 38. Tyndall Centre.
http://www.tyndall.ac.uk/sites/default/files/wp38.pdf
Box 1. Key terminology and definitions as applied in this tool.

National & Policy Climate and Disaster Risk Screening Tool
Because these hazard risks are highly context-specific, this tool enables users to apply their expertise
and understanding of their country and its sectors to assess risk nationally, rather than relying on
automated tool functions.
Tool Approach As illustrated in Figure 1, this tool applies an exposure – sensitivity – adaptive capacity framework to
assess climate and geophysical risks to the country’s priority sectors. This framework embodies the
elements of the IPCC risk analysis framework1 and USAID’s framework2 for vulnerability assessment,
with some modifications, to improve the usability of the tool and to tailor the tool to country planning
and investments.
Figure 1. Tool approach: outline of each step in the tool and its connection to the exposure-sensitivity-adaptive capacity framework.
In its 2014 climate change report, the IPCC defines risk as "the potential for consequences where
something of value is at stake and where the outcome is uncertain, recognizing the diversity of values."
It is sometimes equated to the product of probability and impact. In this tool, probability is generally not
explicitly considered. Therefore, the word "risk" in this tool follows a colloquial definition from
Webster’s: “Possibility of loss or injury.” The greater the exposure and sensitivity and the lower the
adaptive capacity is, the greater the possibility of loss or injury.
A further explanation of each step and the relationship between the steps follows.
1 IPCC, 2014. Summary for policymakers. In: Climate Change 2014: Impacts, Adaptation, and Vulnerability. Part A: Global and Sectoral Aspects.
Contribution of Working Group II to the Fifth Assessment Report of the Intergovernmental Panel on Climate Change [Field, C.B., V.R. Barros, D.J. Dokken, K.J. Mach, M.D. Mastrandrea, T.E. Bilir, M. Chatterjee, K.L. Ebi, Y.O. Estrada, R.C. Genova, B. Girma, E.S. Kissel, A.N. Levy, S. MacCracken, P.R. Mastrandrea, and L.L. White (eds.)]. Cambridge University Press, Cambridge, United Kingdom and NewYork, NY, USA, pp. 1-32.Note that the risk in this framework is a function of vulnerability (comprised of adaptive capacity and sensitivity), exposure, and hazard. All of these elements are addressed in the framework used in this tool, though the terms are defined somewhat differently. The IPCC Fourth Assessment defined vulnerability as a function of adaptive capacity, sensitivity, and exposure. 2 USAID, Climate - Resilient Development: A Framework for Understanding and Addressing Climate Change (Washington, DC: 2014)
(http://pdf.usaid.gov/pdf_docs/PBAAA245.pdf)
National & Policy Climate and Disaster Risk Screening Tool
Development-First In the Identifying Priority Sectors stage, users will identify, as relevant, key country development goals,
sectoral strategies, institutional and/or policy reforms; and associated sectors that are required to
achieve them. The rest of the screening will depend on this identification. This step supports the
"development-first" approach,3 which aims to mainstream climate considerations into existing
development priorities and associated planning and decision-making.
The approach is designed to help practitioners continue to work toward existing key country
development goals while understanding the risks and opportunities that climate change may pose.
Users will select priority sectors - those that are most critical for achieving the key development goals,
sectoral strategies, institutional and/or policy reforms; rather than pre-selecting sectors based only on
whether they are at high risk from climate change and geophysical disasters.
Hazard Exposure Exposure to climate and geophysical hazards at the national level is evaluated in the Characterizing
Hazards step.
Users characterize two sets of hazards: climate hazards and geophysical hazards. This tool addresses the
following climate hazards:
Precipitation & Flooding Strong Winds
Sea Level Rise Drought
Storm Surge Extreme Temperature
The tool addresses these geophysical hazards:
Earthquakes Landslides4
Tsunamis Volcanic Eruptions
The phrase “climate and geophysical hazards” captures all of the hydro-meteorological, oceanographic,
and geophysical concerns outlined above. The term “hazard” refers to any of the above. These hazards
were selected because they are highly relevant to most countries. The list is not exhaustive. In some
locations, there may be certain hazards that are not explicitly addressed here; examples include dust
storms, infestations, freeze-thaw cycles and permafrost melting. If a known hazard is missing from the
tool, the user has the option to add it to the screening. (Note that the screening tool does not address
man-made disasters, such as armed conflict or chemical spills.)
The tool relies largely on the World Bank Climate Change Knowledge Portal (CCKP) and the CCKP’s
Country Adaptation and Risk Profiles for data concerning climate-related hazards and occurrence of
major geophysical hazards in the country. The CCKP data draw on global, quality-controlled data sets
3 USAID, Climate - Resilient Development: A Framework for Understanding and Addressing Climate Change (Washington, DC: 2014)
(http://pdf.usaid.gov/pdf_docs/PBAAA245.pdf) 4 Numerous factors contribute to landslides, such as earthquakes, heavy rainfall, and erosion. However, because landslides are fundamentally ground movements, rather than climatic events, they are classified here as a geophysical hazard.

National & Policy Climate and Disaster Risk Screening Tool
and is continually updated as new data becomes available. In some cases, the CCKP is supplemented
with other sources of information. For more detail on the data used in this step, please refer to the Data
Annex.
Hazard exposure is evaluated across the country. Exposure may be the same across the identified
priority sectors, or it may be quite different. For example, in inland countries, both the agricultural and
the industrial sectors may be exposed to riverine flooding but have no exposure to sea level rise. Users
can also the option to adding their own notes to highlight regional differences in exposure, where
sectors are concentrated in the country, if known.
Exposure to climate hazards is evaluated in two time-frames: Historical/Current and Future. This is
because past records are not necessarily indicative of future conditions. The Historical/Current time-
frame captures past extreme events and recent climate trends, such as increases in average
temperature from the 1960-1990 period to the 1990-current period. The Future time-frame focuses on
the climate and climate-related conditions projected under different global climate models and
development scenarios.
The default time-frame selected in the Country Adaptation and Risk profiles is midcentury, 2040-2059.
This time-frame is selected because it is most relevant to the lifetime of World Bank investments.
Because geophysical hazards (earthquakes, tsunamis, landslides and volcanic eruptions) do not have
associated future projections, exposure to those hazards is assessed only in the Historical/Current time-
frame.
Potential Impact In this step, users combine their information on exposure with their understanding of the sensitivity of
the country’s priority sectors to rate the potential impact from climate and geophysical hazards.
Users rate potential impacts from hazards for each priority sector because the impacts vary by sector. A
small increase in temperature, for example, may exceed the tolerable range for certain crops in the
Climate Projections The future projections of climate in the CCKP are currently derived from General Circulation Models (GCMs).
These are the most advanced tools currently available for simulating the global climate system’s response to
increasing greenhouse gas concentrations6. Those making climate risk assessments must use caution when
applying these projections, because there is some uncertainty within the climate models. While this tool
employs projections to develop a general sense of future trends, the resulting information should not be
regarded as definitive. Further, the coarse geographic resolution of the projections (~200 km x 200 km) does
not capture climate variability within each modeled grid cell. For more information on climate projections,
please refer to the Data Annex.
*Intergovernmental Panel on Climate Change. What is a GCM? http://www.ipcc-data.org/guidelines/pages/gcm_guide.html
Box 2. Background on climate projections.

National & Policy Climate and Disaster Risk Screening Tool
country and result in a high potential impact for the agricultural sector but a low potential impact for
the finance sector.
Time-frames: Users rate impacts separately for the Historical/Current and Future time-frames, because
the level of potential impact on a sector’s physical assets, resources and systems may change as
exposure changes over time. It is important to first evaluate historical trends and current baselines to
understand the conditions and trends under which the priority sectors are currently operating. For
example, the country’s transport assets may not have been damaged by flooding in the recent past,
making potential impact in the Historical/Current time-frame low. But a significant increase in flooding
over time could raise the potential impact on this sector if the county’s roads, rails and airport runways
are not designed to withstand more frequent or more severe flooding.
Combining ratings across hazards: After rating potential impact on each priority sector by hazard, users
combine the ratings across all hazards to arrive at a potential impact rating for each priority sector and
time-frame. The ratings are aggregated based on the user’s knowledge of the country and other expert
judgment. This provides a more integrated picture of the combined potential impact on a sector. Users
may also be able to quickly identify the key hazards that drive potential impacts for each sector and
weight them in selecting an overall sector rating.
The rating scale for potential impact looks like this:
Sensitivity considerations: In selecting these ratings, users overlay sensitivity considerations with the
previous hazard exposure ratings to assess potential impact. For this reason, the potential impact ratings
may or may not align with the exposure ratings. For example, the potential impact of drought on the
agriculture sector might be low, even if crops grown throughout the country are highly exposed to
drought, because the dominant crops are drought-tolerant biomass crops. These ratings therefore
require subject matter expertise and contextual understanding. The Resource Annex provides a list of
resources on the potential impacts of climate hazards on sectors at the national level.
Adaptive Capacity In this screening stage, the user will score institutional readiness, that is, the institutional adaptive
capacity of the key institutions in the country to address the potential impacts identified. In this tool, the
ability to adjust to and cope with potential impacts is evaluated based on four key elements of an
institution’s adaptive capacity:
Awareness of the potential impacts. Does the institution possess the knowledge and information
on the hazards and their potential impacts that could affect the country’s development
progress?
Ability to conduct risk assessments. Does the institution have the ability to assess risks from
climate and geophysical hazards? Low skill levels in this area will undermine the institution’s
understanding of future climate hazards as new information becomes available.

National & Policy Climate and Disaster Risk Screening Tool
Ability to plan and implement adaptive measures. Without the ability to take action, risks may
remain unabated.
Capacity to adaptively manage. Does the institution have the level of readiness needed to use
its knowledge of potential impacts and risks to adjust in its planning, development and
management? It will need to be able to make adjustments in the face of uncertainty in
projections and long planning horizons.
The ratings for institutional readiness are done for the combined effect of all hazards, rather than hazard
by hazard. This is primarily because the effects of institutional readiness are not hazard-specific. For
example, when an institution enhances its procedures for infrastructure maintenance and risk
management procedures, it improves its formal capacity to counter all physical impacts – whether they
are temperature, precipitation or wind.
Time-frame: The ratings capture only current institutional readiness, because users could not possibly
accurately predict future readiness. Planning processes and budgets change over time in a variety of
ways. However, since institutional readiness can be improved over time through activities such as
capacity building, education and training, the tool is designed to record ratings as the user revisits this
stage.
National vs. Sectoral level: National adaptive capacity can both influence and reflect the capacity of
individual sectors, so the tool guides users to provide ratings at both the national level and the sectoral
level. For example, assessments of future climate impacts may be conducted by a national
meteorological service and provided to sectoral institutions, which would raise the sectoral institutions
ability to conduct vulnerability assessments.
The rating scale for institutional readiness looks like this:
This scale enables users to qualitatively score the level of institutional readiness. The ratings can be used
in national planning to identify specific areas where capacities to address climate and geophysical
hazards are weak and where specific capacities can be improved through targeted intervention. The
scoring is also designed to provide consistent comparison as the user revisits this screening stage over
time.
Overall Risk Overall Risk to Priority Sectors
0 = Absent. No evidence is available or capacity is nonexistent.
1 = Minimal. There is no formalized capacity. Hazard awareness and analytical abilities are very limited within the institution.
2 = Moderate. The institution has modest formal capacity. However, making hazard assessment is not a normal part of planning and implementation or a normal part of budget planning.
3 = Significant. The institution has strong formal capacity. Hazard awareness and the skills and resources needed to analyze hazard risks are a significant consideration in budgets as well as national planning and project development.
4 = Outstanding. Excellent formal capacity. Hazard awareness and analytical abilities related to hazards have been fully mainstreamed in national planning and project development in the institution.
National & Policy Climate and Disaster Risk Screening Tool
In this final screening stage, users integrate the potential impact and adaptive capacity ratings to arrive
at an overall risk rating for each priority sector. The risk rating represents the extent to which climate
and geophysical hazards may prevent a priority sector from successfully contributing to the country’s
development goals.
Combining impact and readiness ratings: Users first employ their sectoral knowledge and professional
judgment to arrive at a preliminary risk rating based on the potential impact and sector’s total
institutional readiness score. High levels of institutional readiness can lower the risk posed by climate
and geophysical hazards, while low levels of institutional readiness may raise it.
Adjusting for development context: Users then adjust the risk rating for the development context to
arrive at one overall assessment of risk. They consider how elements of the broader development
context can influence the risk of climate and geophysical hazards to each priority sector, institutional
capacity and/or policy operations. For example, low levels of enforcement of safety protocols may lead
to substandard construction of industrial facilities and therefore increase hazard risk to the industry
sector. Similar to the scoring in the Institutional Readiness stage, the sector ratings as adjusted for the
development context are determined for the combined effects of all hazards on a priority sector, and
they are not separated by time-frame.
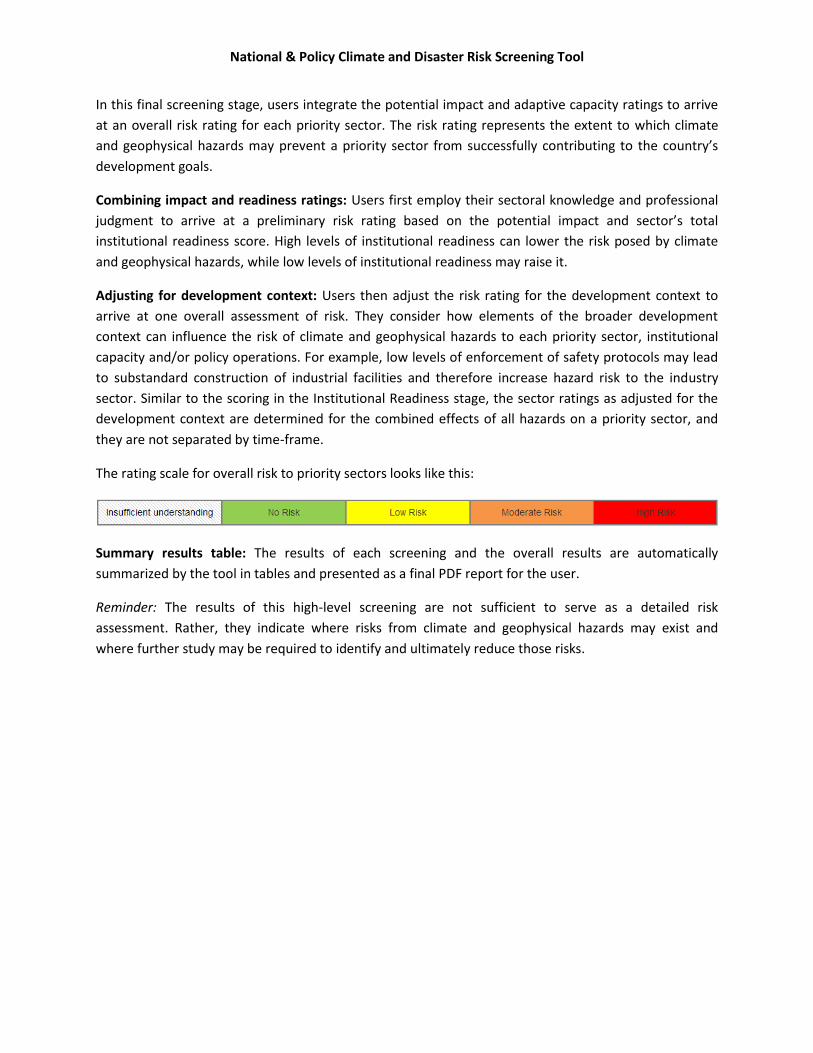
The rating scale for overall risk to priority sectors looks like this:
Summary results table: The results of each screening and the overall results are automatically
summarized by the tool in tables and presented as a final PDF report for the user.
Reminder: The results of this high-level screening are not sufficient to serve as a detailed risk
assessment. Rather, they indicate where risks from climate and geophysical hazards may exist and
where further study may be required to identify and ultimately reduce those risks.
National & Policy Climate and Disaster Risk Screening Tool
Data Annex
Climate Data This National & Policy screening tool is linked online to the World Bank’s Climate Change Knowledge
Portal (CCKP) and the CCKP’s Country Adaptation and Risk Profiles, allowing users to access most of the
data concerning hazards in the project location. Further information on the underlying information
sources can be found in the CCKP metadata description.
Main data sources: The CCKP’s current datasets are based on the Intergovernmental Panel on Climate
Change’s (IPCC’s) Fourth Assessment Report. Future climate information in the CCKP and profiles is
derived from 14 of the 23 available general circulation models (GCMs), which are physically based
models of projected climate change. To understand the potential range of climate model outcomes and
account for climate model uncertainties, the CCKP presents an envelope of all models depicting the
ensemble median, the ensemble high (10th percentile), and the ensemble low (90th percentile) of the
model distribution.
Emissions scenarios: Consistent with the Fourth Assessment Report, the CCKP currently uses projections
from the Special Report on Emissions Scenarios (SRES) projections, which contain these two emissions
scenarios (among others): SRES A2 and SRES B1. By default, the Country Adaptation Profiles display data
from the SRES A2 emissions scenario, which is the higher emissions scenario and more closely associated
with current estimated CO2 concentrations in the atmosphere.5 Climate data from the latest IPCC Fifth
Assessment Report (AR5) is forthcoming (see below).
Time-frames: The default future time-frame depicted in the Country Adaptation Profiles is 2040-59, but
data are available for 20-year averages through 2100. The mid-century time-frame is the default option
because it is most relevant to the lifetime of World Bank’s projects and investments. However, since
project lifetimes can vary, users are encouraged to adjust the time-frame of the climate information as
necessary to match the lifetime of project investments.
Updated data: Work is ongoing to update the CCKP with datasets from the IPCC’s Fifth Assessment
Report (AR5) to be available externally by early 2015. Once updated, the CCKP and the Adaptation
Profiles will include the CMIP5 climate models from the AR5 for all four Representative Concentration
Pathways (RCPs) (2.6; 4.5; 6.0; 8.5) and four time periods (2020, 2050, 2070, and 2090).6 The CCKP will
include all model output means as well as the anomaly of the models in comparison with historical data.
Model uncertainty is depicted through the 90th and 10th percentile distribution of ensemble models.
5 Additional information on these emissions scenarios can be found in an IPCC report, available online here:
http://www.ipcc.ch/ipccreports/sres/emission/index.php?idp=0 6 Representative Concentration Pathways (RCPs) are four greenhouse gas concentration (not emissions) trajectories adopted by
the IPCC for its Fifth Assessment Report (AR5). The pathways are used for climate modeling and research. They describe four possible climate futures, all of which are considered possible depending on how much greenhouse gases are emitted in the years to come. The four RCPs, RCP2.6, RCP4.5, RCP6, and RCP8.5, are named after a possible range of radiative forcing values in the year 2100 relative to pre-industrial values (+2.6, +4.5, +6.0, and +8.5 W/m
2, respectively).
National & Policy Climate and Disaster Risk Screening Tool
Spatial scales: The spatial resolution currently provided in the CCKP and the Country Adaptation and
Risk Profiles varies among datasets. The historical dataset in the CCKP is represented with a global
dataset available at a native scale of 50 km x 50 km (produced by the Climatic Research Unit (CRU),
University of East Anglia). Future projections are displayed in their native GCMs resolutions at a 2° scale
(~200 km x 200 km). The coarse resolution might not allow for a detailed assessment of climate
variability within each grid cell.
The Climate Analysis Tool of the CCKP provides a visualization of global downscaled climate models with
daily data at a 0.5° scale (~50 km x 50 km). Users can access this by clicking the Future
Climate>Downscaled Climate tab within the CCKP country pages. It is important to keep in mind that
uncertainty increases the further these global datasets are downscaled and its outcomes should be
interpreted with caution.
The Risk Screening Overview tab of the Country Adaptation and Risk profile to which the screening tools
are currently hyperlinked provide the following resolutions: 50km x 50km for historical information; and
~200 km x 200 km for future climate projections. The tool utilizes the A2 default scenario to help users
understand and plan for scenarios of greater climate change and the associated risk to World Bank
projects.
The sections below address those datasets that are not currently in the CCKP,7 highlighting exposure-
related thresholds used in Stage 1 (“Screen for exposure to climate and disaster risks”) for sea level rise,
storm surge, and strong winds used in the screening tool.
Sea Level Rise Sea level is a function of numerous climatic and non-climatic factors, including ocean thermal expansion,
melting from glaciers and ice sheets, land uplift, and groundwater depletion, among others. There is
significant uncertainty regarding the extent of future sea level rise in particular locations and for
particular decades.
Range of projections: The IPCC’s Fifth Assessment Report provides scenarios of global mean sea level
rise that are below 1 meter by 2100; however, there is significant evidence for greater increases in sea
level in the literature.8 The IPCC’s assessment relies on process-based projections and does not
incorporate semi-empirical projections because of low confidence levels in the results. However, these
semi-empirical models project greater rises in sea level, with an upper bound sometimes exceeding 1.5
meters by 2100.9 The U.S. National Climate Assessment projects rising of up to 2 meters in global mean
sea level over this period, and the IPCC cites reports with estimates of up to 2.4 meters.10
7 Please note the CCKP will be constantly updated to include more datasets as resources are made available.
8 See Figure 13.11a in in J.A. Church et al., eds., “Sea Level Change,” in Climate Change 2013: The Physical Science Basis. Contribution of
Working Group I to the Fifth Assessment Report of the Intergovernmental Panel on Climate Change, edited by T. F. Stocker et al. (Cambridge and New York: Cambridge University Press). 9 See Figure 13.12d in Church et al., “Sea Level Change.”
10 U.S. Global Change Research Program, 2014 National Climate Assessment (Washington: 2014) (http://nca2014.globalchange.gov/report)
National & Policy Climate and Disaster Risk Screening Tool
Given the range of these sea level rise projections, project teams using this tool should apply the upper
end of the estimates to provide a conservative screen for project managers.
Calculation of accelerating rise: A default Future time-frame in the screening tool is 2040-2059, since
many project lifetimes will not reach the end of the century. Sea level rise is not projected as a constant
increase over time; rather, the rate accelerates from the current ~3 mm/year to up to roughly 15
mm/year by the end of the century.11
Note: To estimate an upper end of global mean sea level rise in the middle of the century, a quadratic
relationship is used to calculate change from 1992 (the starting point) to 2050: 𝐸(𝑡) = 0.0017𝑡 + 𝑏𝑡2,
where E is global mean sea level rise in meters, t is the number of years since 1992, and b is a constant
that ranges from 0 (lowest scenario) to 1.56x10⁻⁴ (highest scenario).12 This equation yields an upper-end
estimate of a rise of 0.62 meters in sea level by 2050, which is rounded to 0.6 meters for the sake of the
tool.
Local vs. global rates: Caution should be used with such thresholds because local sea level change can
vary significantly from global averages. For example, local sea level can be strongly influenced by local
factors such as uplift or subsidence of the land surface, erosion (i.e., sediment removal), and accretion
(i.e., sediment addition) in the project area. Rates of current local sea level rise data can be viewed in a
“Tides and Currents” web page from the U.S. National Oceanic and Atmospheric Administration (NOAA).
It is likely that these rates will increase in the future. They therefore generally represent a minimum rate
of rise (or a maximum level of decrease in areas of rapid subsidence).
Upper bounds: An appropriate upper bound for a rate of sea level rise depends on the project lifetime.
For projects with short lifetimes of 10-20 years, the rate of sea level change will resemble the
Historical/Current rate. However, as mentioned above, the rate of global mean sea level rise is projected
to increase over time. For projects with lifetimes that stretch beyond mid-century, a maximum sea level
rise rate of 15 mm/year can be applied over the project’s service life.13 Again, this is a conservative
screen focused on the upper bound of projections.
As an example, if a project has an expected service life of 70 years, the maximum sea level rise that
could be expected is roughly 1.05 meters x (0.015m/yr * 70 yrs).
If the contributions of local drivers of sea level change are known (e.g., through consultation with local
experts), the following formula can be used to estimate future sea level rise:
𝐿𝑜𝑐𝑎𝑙 𝑟𝑎𝑡𝑒 𝑜𝑓 𝑠𝑒𝑎 𝑙𝑒𝑣𝑒𝑙 𝑐ℎ𝑎𝑛𝑔𝑒 = 𝐺𝑙𝑜𝑏𝑎𝑙 𝑚𝑒𝑎𝑛 𝑠𝑒𝑎 𝑙𝑒𝑣𝑒𝑙 𝑟𝑖𝑠𝑒 + 𝐿𝑜𝑐𝑎𝑙 𝑑𝑟𝑖𝑣𝑒𝑟𝑠 𝑜𝑓 𝑠𝑒𝑎 𝑙𝑒𝑣𝑒𝑙 𝑐ℎ𝑎𝑛𝑔𝑒
11
See Figure 13.11b in Church et al., “Sea Level Change.” 12
National Oceanic and Atmospheric Administration, Global Sea Level Rise Scenarios for the United States, National Climate Assessment, NOAA
Technical Report OAR CPO-1, (Washington: 2012) (http://cpo.noaa.gov/sites/cpo/Reports/2012/NOAA_SLR_r3.pdf) 13
See Table 13.5 in Church et al., “Sea Level Change.”
National & Policy Climate and Disaster Risk Screening Tool
Storm Surge Historical/Current: To assess the project location’s exposure to storm surge in the Historical/Current time-frame, a conservative screen of 10 meters is applied. That is, if the project elevation is 10 meters above the present maximum high tide level, then the project will not likely be exposed to storm surge. The 10 meter elevation threshold indicated above is roughly the elevation of the greatest historical
storm surge and wave run-up heights.
The highest storm surge in the past century occurred during the Great Bhola Cyclone of 1970 in the Bay
of Bengal, when a storm surge of 10.6 meters occurred during one of the highest high tides of the year.14
The highest storm surge on record in the United States was from Hurricane Katrina in 2005, measured at
8.4 meters above the normal astronomical tide level.15
There are far more sophisticated techniques for estimating maximum storm surge involving numerical
modeling. However, the threshold approach in this tool is adequate for the coarse, rapid screening
purposes of this tool. (However, it is important to note that increases in sea level are not equivalent to
increases in storm surge height.)
Future: To assess whether the project will be exposed to future storm surge, the tool helps the user to identify whether the project elevation is within 11 meters’ elevation of the present maximum high tide level. Storm surge height is likely to be increased by sea level rise. The 11 meter threshold is based on a combination of the maximum present day surge values (10 meters) and the upper end of sea level rise projections for 2050 (0.6 meters). (See “Storm Surge: Historical/Current” section above and “Sea Level Rise” section on preceding page.) Both thresholds suggested under this (storm surge) hazard are intended to be conservative screens to
determine whether the project location could experience storm surge. They do not reflect whether the
project location is likely to experience tropical cyclones or the distance inland that a storm surge may
travel. (For assessments of exposure to cyclones and other wind hazards, see “Strong Winds” section,
next page.)
More precise estimates of changes in the magnitude of future storm surge are difficult to make and are
relatively uncertain. There is high confidence that storm surge extremes will increase with sea level rise,
yet there is low confidence in region-specific projections in storminess and storm surges.16 As noted
above, numerical modeling techniques can be used to simulate storm surge if more precise information
on storm surge is needed to refine the estimates of risk to the project.
Strong Winds Historical/Current: Strong winds are related to tropical cyclone, thunderstorms, tornadoes, frontal winds, downslope winds, and dust storms and other desert winds. Through the Country Adaptation and
14
M.K. Karim, and N. Mimura, “Impacts of Climate Change and Sea-level Rise on Cyclonic Storm Surge Floods in Bangladesh,” Global
Environmental Change, vol. 18, no. 3: 490-500 (2008) (doi:10.1016/j.gloenvcha.2008.05.002); and M.L. Shrestha, ed., The Impact of Tropical
Cyclones on the Coastal Regions of SAARC Countries and Their Influence in the Region (Bangladesh: SMRC N. SAARC Meteorological Research
Centre, DHA, October 1998). 15
R.D. Knabb, J.R. Rhome, and D.P. Brown, “Tropical Cyclone Report, Hurricane Katrina, 23-30 August 2005” (Washington: National Oceanic
and Atmospheric Administration, 2005). (http://www.nhc.noaa.gov/pdf/TCR-AL122005_Katrina.pdf) 16
Church et al., “Sea Level Change.”
National & Policy Climate and Disaster Risk Screening Tool
Risk Profiles in the CCKP, the cyclone hazard mapping tool can be used to identify project locations that are exposed to strong winds from tropical cyclones. However, high quality local information about damaging winds that are not due to tropical cyclones is difficult to obtain. This information may be available from other sources, such as the project country’s National Meteorological Service (see www.wmo.int/pages/members/members_en.html for a country listing). Future: Average tropical cyclone maximum wind speed is likely to increase over the 21st century, although increases may not occur in all ocean basins.17 The details of these changes are highly uncertain. The frequency of future tropical cyclones is even more uncertain. It is likely that the global frequency of tropical cyclones will either decrease or remain essentially unchanged.18 The most authoritative source of information on future regional and global changes in extreme events currently is the IPCC Special Report on Managing the Risks of Extreme Events and Disasters to Advance Climate Change Adaptation (SREX)19.
Geophysical Hazards
The CCKP also provides a general view of global hydro-meteorological and geophysical natural hazard datasets and historical disaster loss information that are available from a range of open data sources, including the Natural Disaster Hotspots from CIESIN, the Global Risk Data Platform from UNEP/UNISDR, the OFDA/CRED International Disaster Database (EM-DAT), and the National Geophysical Data Center/World Data Center (NGDC/WDC)20.
17
J.H. Christensen et al., “Climate Phenomena and their Relevance for Future Regional Climate Change,” in Climate Change 2013: The Physical
Science Basis. Contribution of Working Group I to the Fifth Assessment Report of the Intergovernmental Panel on Climate Change, edited by T.F. Stocker (Cambridge and New York: Cambridge University Press, 2013). 18
Christensen et al., “Climate Phenomena and their Relevance for Future Regional Climate Change.” 19
C.B. Field et al., eds., Managing the Risks of Extreme Events and Disasters to Advance Climate Change Adaptation. A Special Report of
Working Groups I and II of the Intergovernmental Panel on Climate Change, (Cambridge and New York: Cambridge University Press, 2012). 20
Background information on the data in the Climate Change Knowledge Portal may be found at this CCKP web page:
http://sdwebx.worldbank.org/climateportal/documents/Metadata-Portal.pdf

National & Policy Climate and Disaster Risk Screening Tool
Annex B.
Useful Additional Resources
For information on climate data:
The World Bank’s Climate Change Knowledge Portal provides historical and future climate and
climate-related datasets.
The CCKP’s Country Adaptation and Risk Profiles synthesize and distill data sets for the purposes
of the screening tool.
Working Group I’s contribution to the IPCC’s Fifth Assessment Report presents the latest in
observed climate changes and future climate projections.
For resources to help identify the country’s main development goals and priority sectors:
National Communications are country-specific reports to the United Nations Framework
Convention on Climate Change that often contain information and research on a country’s key
sectors that may face risks from climate.
National indicators from World Bank Open Data may also be useful for this tool.
Past World Bank Country Assistance Strategies will provide information about a country’s
development goals and the World Bank’s program of support for that country.
World Bank Poverty Reduction Strategy Papers can provide a country’s long-term vision and sets
out macroeconomic, structural, and social policy goals.
The World Bank Country Pages provide access to a number of helpful resources, including
country briefs, country statistics, feature stories, and country portfolio information.
Multilateral Development Bank’s Country Pages (including the African Development Bank, Asian
Development Bank, and Inter-American Development Bank) host information on development
strategies, portfolios, sectors, human development, etc.
Additionally, some countries may develop their own individual poverty reduction, economic
growth, or development strategies, plans, or programs.
For more information on climate change impacts to sectors at the national level:
The World Bank Climate Change Knowledge Portal has country Adaptation and Risk Profiles that
provide an indication of national sector risk.
National Communications are country-specific reports to the United Nations Framework
Convention on Climate Change that often contain information and research on a country’s key
sectors that may face risks from climate.
Turn Down the Heat: Why a 4°C Warmer World Must be Avoided is a World Bank report focused
on the impacts of climate change on developing countries.
Turn Down the Heat: Climate Extremes, Regional Impacts, and the Case for Resilience builds on
the previous report and focuses on impacts in Sub-Saharan Africa, South East Asia, and South
Asia.

National & Policy Climate and Disaster Risk Screening Tool
Turn Down the Heat: Confronting the New Climate Normal is a World Bank Report that builds on
previous reports and focuses on impacts to development in Latin America and the Caribbean,
the Middle East and North Africa, and parts of Europe and Central Asia.
The Global Facility for Disaster Reduction and Recovery (GFDRR) features country profiles which
include information on key socioeconomic sectors that can be used to understand sector risk.
The Adaptation Learning Mechanism has country profiles that include information on sector and
regional risks, as well as links to other useful resources.
The Climate Vulnerability Monitor uses indicators to showcase levels of risks for a number of
sectors within a given country.