bauschinger effect - eTheses Repository - University of Birmingham

Growth and Development in the Genus Pan:
a Life-History Approach
Thesis Submitted for the Degree of
Doctor of Philosophy
Conrad Brimacombe BSc MSc
Department of Archaeology
The University Of Sheffield
November 2013

Acknowledgements
I would like to express my gratitude to my supervisors, Dr. Pia Nystrom and Dr. Kevin Kuykendall for
their support and encouragement throughout this entire process. I am also indebted to the Charles B.
Lockwood Memorial Grant from the Primate Society of Great Britain. The receipt of this funding
provided much-needed financial assistance for the data collection process. I am also incredibly
grateful for the assistance provided by all individuals by the University of Zurich, the Powell-Cotton
Museum and the Museum of Central Africa. Without their efforts this project would never have
possible. I greatly appreciate the help and support of colleagues, notably Isabelle Heyerdahl King, who
so kindly spent hours looking at my X-rays of teeth for error analysis. My parents have also been a
significant source of support as well as my girlfriend, Dr. Yi Jin, whose encouragement and help in the
final months of this project could not have been more inspiring.

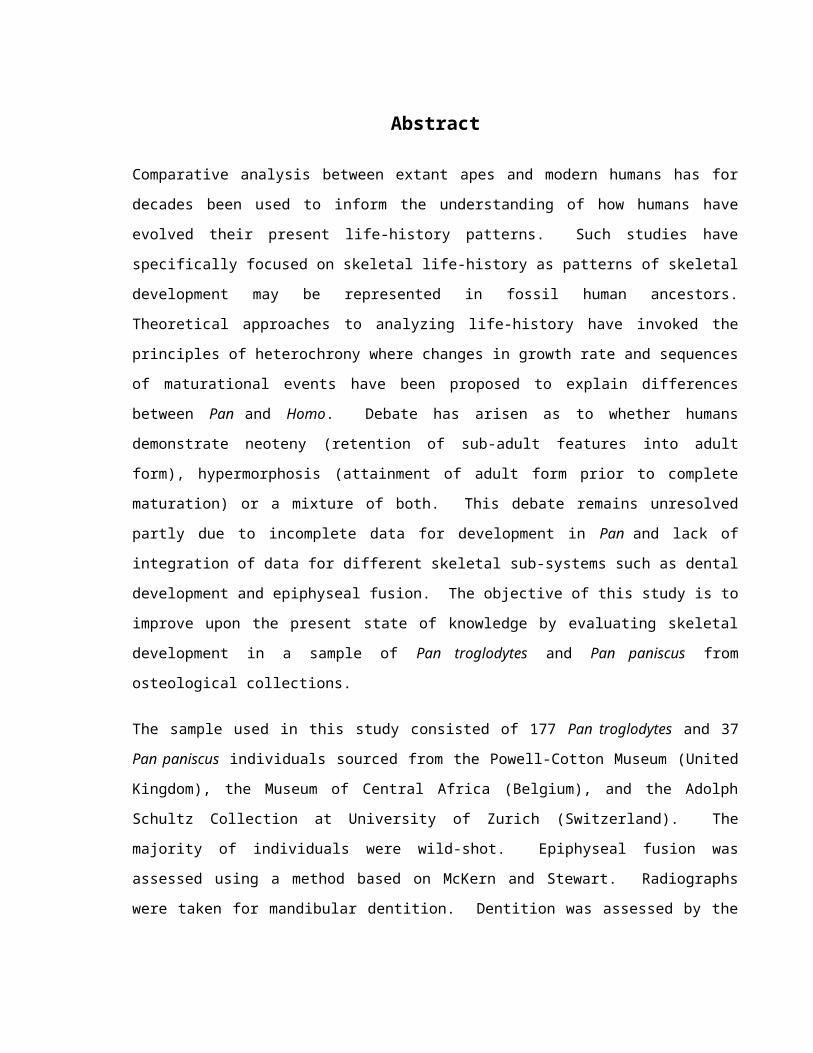
Abstract
Comparative analysis between extant apes and modern humans has for decades been used to inform the
understanding of how humans have evolved their present life-history patterns. Such studies have
specifically focused on skeletal life-history as patterns of skeletal development may be represented in
fossil human ancestors. Theoretical approaches to analyzing life-history have invoked the principles of
heterochrony where changes in growth rate and sequences of maturational events have been proposed
to explain differences between Pan and Homo. Debate has arisen as to whether humans demonstrate
neoteny (retention of sub-adult features into adult form), hypermorphosis (attainment of adult form
prior to complete maturation) or a mixture of both. This debate remains unresolved partly due to
incomplete data for development in Pan and lack of integration of data for different skeletal sub-
systems such as dental development and epiphyseal fusion. The objective of this study is to improve
upon the present state of knowledge by evaluating skeletal development in a sample of Pan troglodytes
and Pan paniscus from osteological collections.
The sample used in this study consisted of 177 Pan troglodytes and 37 Pan paniscus individuals
sourced from the Powell-Cotton Museum (United Kingdom), the Museum of Central Africa (Belgium),
and the Adolph Schultz Collection at University of Zurich (Switzerland). The majority of individuals
were wild-shot. Epiphyseal fusion was assessed using a method based on McKern and Stewart.
Radiographs were taken for mandibular dentition. Dentition was assessed by the Demirjian method for
8 teeth. Length was measured for all long-bones.
Data were analysed for three major parameters of skeletal growth, these being growth rate, sequence of
maturational events, and allometric change. Comparisons between chimpanzees and bonobos found
these two species to be essentially the same in terms of measured skeletal maturation parameters.
Analysis of Pan paniscus was more limited due to smaller sample size. Comparison between Pan and
Homo focused primarily on comparison between chimpanzees and humans due to sample size
limitations for Pan paniscus. Comparisons of sequences found broad similarities between these two
species in terms of epiphyseal fusion events. Comparisons of fusion sequences and dental maturation
showed some differences, especially in the later stages of maturation for these two systems.
Epiphyseal fusion event timing was also considered in the context of proportional change in length of
long-bones. It was found that the relative timing of fusion events as proportion of growth in length
was the same for both chimpanzees and humans. Estimates of chronological age of fusion were
produced for epiphyses analysed in prior studies as well as additional centres not previously evaluated.
This was done using Kuykendall’s regression equation for 8 teeth. Estimates for age of fusion
determined in this study closely matched the data for sites observed in prior studies using known-age
samples. This indicates that the estimates for age for previously undocumented sites in the present
study are likely accurate.
The implications of these results for theoretical approaches to studying growth as well as the study of
fossil hominids are discussed. Humans appear more divergent from apes when maturational events are
considered in the context of chronological years. Comparisons based strictly on maturational events
suggest that the differences in growth rate may distort the perception of how large differences in life-
history pattern actually are.

i
Table of Contents
Chapter 1 Introduction1.1 The problem with sub-adult skeletal and dental development in paleoanthropology1.2 The main objectives of this study1.3 The contribution this study will make to modelling of growth and development in hominins1.4 Study approach1.5 Chapter overview
Chapter 2 Background2.1 Theoretical approaches to growth
2.1.1 Fundamental concepts: measuring skeletal growth2.1.2 Developmental Theory2.1.3 How this study can contribute to the theory of growth
2.2 Organisation of sections for each species2.3 Epiphyseal fusion
2.3.1 The physiology of growth and fusion2.3.2 Epiphyseal fusion studies from the mammalian world2.3.3 Epiphyseal fusion in primates2.3.4 Epiphyseal fusion in humans2.3.5 Epiphyseal fusion in chimpanzees2.3.6 Epiphyseal fusion in bonobos2.3.7 Comparisons between chimpanzees and bonobos2.3.8 Comparisons between chimpanzees, bonobos and humans
2.4 Dental development2.4.1 Primate dentition and dental development2.4.2 Dental development in humans2.4.3 Dental development in chimpanzees2.4.4 Dental development in bonobos2.4.5 Comparisons between chimpanzees and bonobos2.4.6 Comparisons between chimpanzees, bonobos and humans2.4.7 Assessment of environmental factors affecting dental development: Pathology and
systemic stress2.5 Long bone growth in length: Introduction
2.5.1 Long bone growth rates in humans2.5.2 Long bone growth rates in chimpanzees2.5.3 Long bone growth rates in bonobos2.5.4 Comparisons between chimpanzees, bonobos, and humans
2.6 Summary of current knowledge of Homo and Pan life history variables2.6.1 Summary of developmental theory2.6.2 Summary of epiphyseal fusion2.6.3 Summary of dental development2.6.4 Summary of long-bone growth in length2.6.5 Summary conclusion

ii
Chapter 3 Materials and Methods3.1 Materials: The Collections
3.1.1 Definition of species used3.1.2 Species and sub-species3.1.3 Provenance3.1.4 Sex3.1.5 Completeness of the collections and condition: statement by collection3.1.6 Observation of pathological conditions3.1.7 Inclusion of species and sub-species for analysis
3.2 Methodology: Data collection3.2.1 Overview of data categories3.2.2 Demographic data3.2.3 Developmental age range3.2.4 Dental recording3.2.5 Epiphyseal Fusion Recording3.2.6 Long-bone measurements
3.3 Methodology: Dental development3.3.1 Overview of data processing in dental development3.3.2 Assignment of dental scores3.3.3 Incomplete quadrants and imputed data3.3.4 Distribution of dental scores3.3.5 Intra- and inter-observer error
3.4 Epiphyseal fusion3.4.1 Determining combined sample values for analysis of epiphyseal fusion3.4.2 Ordering the sample and generated scores3.4.3 Application of mean epiphyseal fusion values for seriating epiphyses3.4.4 Estimation of age for fusion timing using dental score3.4.5 Evaluating number of individuals at each stage and recoding results into three
stages3.4.6 Error analysis for epiphyseal fusion
3.5 Methodology: Long-bone length analysis3.5.1 Presence or absence of epiphyses and distribution of data by bone type3.5.2 Investigating the possibility of lateralization3.5.3 Combined sample variable and dental score 64 individuals
3.6 The problem of presenting data in a comparable framework3.7 Organisation of results
3.7.1 Standards of growth for chimpanzees and bonobos: Chapter 43.7.2 Comparisons of growth standards of Pan and Homo: Chapter 5
Chapter 4 Results – Standards of growth for chimpanzees and bonobos4.1 Growth rate of long-bones as a function of dental score
4.1.1 Analysis of growth rate as a function of dental score using regression analysis4.2 Analysis of epiphyseal fusion sequences

iii
4.2.1 Comparing epiphyseal fusion sequences to dental score4.2.2 Producing a seriation of epiphyseal fusion sequences
4.3 Analysis of allometric relationships within Pan4.3.1 Confirming allometric relationships established in the past and adding new sub-
species of Pan4.3.2 Regression of serially homologous limb elements
4.4 Calendar year estimation of epiphyseal fusion events for comparability to other studies.4.5 Summary of standards of growth for chimpanzees and bonobos
4.5.1 Growth Rate4.5.2 Sequence of fusion events4.5.3 Analysis of allometry4.5.4 Estimation of age for fusion in chronological years for comparability to prior
studies
Chapter 5 Results – Comparisons of growth standards between Pan and Homo5.1 Comparison of human and chimpanzee epiphyseal fusion sequences
5.1.1 Comparison of modular sequence patterns to Schaefer and Black (2007)5.1.2 Comparison of mean epiphyseal fusion sequence patterns to Schaefer and Black
(2007)5.2 Comparisons between epiphyseal fusion sequences and dental sequences5.3 Epiphyseal fusion as a proportion of long-bone length5.4 Summary of comparisons of growth standards between Pan and Homo
Chapter 6 Discussion6.1 Introduction to discussion6.2 Application of the results of this study to developmental theory
6.2.1 Growth rate6.2.2 Patterns of growth: analysis of sequences6.2.3 Skeletal development relative to sexual maturity6.2.4 General conclusions with respect to growth theory
6.3 Application to fossil hominids6.4 Suggestions for future research/limitations of present study 208
Chapter 7 Concluding Remarks

iv
Table of Contents for the Appendix
8.1. Demographic data 2298.2. Outputs from imputation analysis 231
8.2.1 Pan paniscus combined-sex analysis of patterns 2318.2.2 Pan troglodytes females analysis of patterns 2328.2.3 Pan troglodytes males analysis of patterns 234
8.3. Linear regression for long-bone length as plotted against dental score 2368.4. Descriptive statistics for mid-fusion and complete fusion relative to dental score 2398.5. Seriating epiphyseal fusion by mean epiphyseal fusion 2488.6. Linear regression comparisons with Shea (1981) 2528.7. Regression for comparison of serially homologous individual bone elements in Pan
troglodytes. 2538.8. Normality tests for fusion as a percentage of long-bone length in Pan troglodytes 257

v
List of Figures
Figure 2.1 Maturational events in two hypothetical species of differing growth rates where species 1 (red line) reaches specific maturational events more rapidly than species 2 (green line).
Figure 2.2 Maturational events in two hypothetical species of differing growth rates and differing relative timing of sequence events.
Figure 2.3 Demonstration of growth rate pattern of chimpanzee size relative to chronological time.
Figure 3.1 Map showing the distribution of all major sub-species and the locations of individuals from the University of Zurich. (Image created using Open Street Map)
Figure 3.2 Demonstration of tooth orientation as shown from distal and occlusal views.
Figure 3.3 Occlusal view of typical positions for mandibular X-ray imaging.
Figure 3.4 Cross-sectional view of the mounting system for X-ray exposure of mandibular teeth.
Figure 3.5 Demonstration of the foam mounting system with a mandible in place (photo is author’s own)
Figure 3.6 Demirjian dental scoring stages redrawn from Demirjian (1973).
Figure 3.7 Visual demonstration of epiphyseal fusion stages.
Figure 3.8 Demonstration of glued epiphysis.
Figure 3.9 Demonstration of the axis of measure through the radius and femur.
Figure 3.10 Left and right humeri plotted again each other for Pan paniscus individuals.
Figure 3.11 Left and right humeri plotted again each other for Pan troglodytes individuals.
Figure 3.12 Chimpanzee and human Demirjian dental score relative to chronological age as determined by prior studies.
Figure 3.13 Chimpanzee and human Demirjian dental score relative to percentiles of age as determined by prior studies.
Figure 4.1 Humeral length relative to dental score showing Pan troglodytes females.
Figure 4.2 Multiple linear regressions for long-bone length in Pan troglodytes females.
Figure 4.3 Multiple linear regressions for long-bone length in Pan troglodytes males.
Figure 4.4 Male and female Pan paniscus humeral length plotted against dental score.
Figure 4.5 Mid-fusion and complete fusion for the epiphyses of the upper limb in Pan troglodytes females.
Figure 4.6 Female Pan troglodytes mid-fusion with generated dental score.

vi
Figure 4.7 Female Pan troglodytes complete-fusion with generated dental score.
Figure 4.8 Male Pan troglodytes mid-fusion with generated dental score.
Figure 4.9 Male Pan troglodytes complete fusion with generated dental score.
Figure 4.10 Female Pan paniscus mid-fusion and complete fusion median values plotted against dental score and generated dental score.
Figure 4.11 Male Pan paniscus mid-fusion and complete fusion median values plotted against dental score and generated dental score.
Figure 4.12 Hypothetical perfect seriation of epiphyseal fusion events.
Figure 4.13 Typical types of order deviations.
Figure 4.14 Mean values for all epiphyses at mid-fusion states for Pan troglodytes females.
Figure 4.15 Mean values for all epiphyses at mid-fusion states for Pan troglodytes females.
Figure 4.16 Demonstration of range of no statistical significance for Pan troglodytes females.
Figure 4.17 Mean values for all epiphyses at complete fusion states for Pan troglodytes females.
Figure 4.18 Mean values for all epiphyses at complete fusion states for Pan troglodytes males.
Figure 4.19 Mean values for all epiphyses at mid-fusion states for combined sex Pan troglodytes.
Figure 4.20 Mean values for all epiphyses at complete-fusion states for combined sex Pan troglodytes.
Figure 4.21 Log10 regression for male Pan troglodytes upper vs. lower limb.
Figure 4.22 Regression plot of log10 transformed intermembral indicies for Pan troglodytes and Pan paniscus males.
Figure 4.23 Regression plot of log10 transformed intermembral indicies for Pan troglodytes and Pan paniscus females.
Figure 5.1 Matrix showing fusion events for Pan troglodytes males using Schaefer and Black (2007) criteria.
Figure 5.2 Modular sequence for combined-sex Pan troglodytes.
Figure 5.3 Demonstration of mean adult humeral length after fusion of the proximal epiphysis.
Figure 6.1 Representation of a chimpanzee growth curve relative to time based on prior studies by Kimura and Hamada (1996), Leigh and Shea (1996),and Shea (1981)
Figure 6.2 Reproduction of Kuykendall’s (1996) regression for dental score relative to chronological age.
Figure 6.3 Demonstration of the limitation of DS64 individuals on observing chimpanzee growth curves.

vii
Figure 6.4 Grouping of epiphyseal fusion events by region for Pan troglodytes females ordered by mean epiphyseal fusion values.
Figure 6.5 Grouping of epiphyseal fusion events by region for Pan troglodytes males ordered by mean epiphyseal fusion values.
Figure 6.6 Grouping of epiphyseal fusion events by region for Pan troglodytes females using modular sequence.
Figure 6.7 Grouping of epiphyseal fusion events by region for Pan troglodytes males using modular sequence.
Figure 6.8 Regional pattern for humans derived from the modular pattern found in Schaefer and Black (2007).
Figure 6.9 Visualization of chimpanzees and humans using hypothetical chimpanzee maturational time units.
Figure 6.10 Visualization of chimpanzees and humans development as compared to chronological years using chimpanzee maturational time units.
List of Figures for the Appendix
Figure 8.1 Summary of missing values for Pan paniscus combined sex multiple imputation
Figure 8.2 Missing value patterns for Pan paniscus combined sex multiple imputation
Figure 8.3 Summary of missing values for Pan troglodytes females multiple imputation
Figure 8.4 Missing value patterns for Pan troglodytes females multiple imputation
Figure 8.5 Summary of missing values for Pan troglodytes males multiple imputation
Figure 8.6 Missing value patterns for Pan troglodytes males multiple imputation

viii
List of Tables
Table 2.1 Species and sample sizes used by King (2004).
Table 2.2 Studies of epiphyseal fusion sequences across different human populations.
Table 2.3 Previous studies of Pan troglodytes epiphyseal fusion.
Table 2.4 Fusion centres observed by Kerley (1966).
Table 2.5 Fusion sites recorded by Zihlman et al. (2007).
Table 2.6 Zihlman et al.’s (2007) skeletal maturity in wild chimpanzees
Table 2.7 Reproduced comparison of estimates ages for fusion events in Bolter and Zihlman (2012), Kerley (1966), and Zihlman et al. (2007) as presented by Bolter and Zihlman (2012).
Table 2.8 Data comparing chimpanzee and bonobo epiphyseal fusion reproduced from Bolter and Zihlman (2012).
Table 2.9 Data from Zihlman et al.’s (2007) dental delays of wild chimpanzees.
Table 2.10 Sequence variations in completion order reported for mandibular Pan paniscus and comparison to Pan troglodytes.
Table 2.11 Chimpanzee, bonobo, and human emergence and mineralzation sequences.
Table 3.1 Number of individuals for each species/sub-species listed by collection.
Table 3.2 Captive vs. wild by species
Table 3.3 Number of individuals listed for each sex by species and sub-species.
Table 3.4 Number of individuals for each sex by captivity status.
Table 3.5 Wild specimen numbers by sex sorted by species and sub-species.
Table 3.6 The three major categories of pathological conditions that were observed in the study populations.
Table 3.7 Definition of Demirjian scoring stages (Reproduced from Kuykendall 1996, Kuykendall et al. 1992, Kuykendall and Conroy 1996).
Table 3.8 Upper body epiphyseal fusion sites recorded.
Table 3.9 Lower body epiphyseal fusion sites recorded.
Table 3.10 Description of epiphyseal fusion stages observed.
Table 3.11 Description of bone orientation for length measurements
Table 3.12 Number, direction and percentage of deviations between sides of the mandible
Table 3.13 Number of complete scores for both left and right quadrants by species.
Table 3.14 Missing tooth frequency analysis for individuals with incomplete quadrants.
ix
Table 3.15 Number of individuals brought forward for analysis.
Table 3.16 Distribution of dental scores by intervals of 10 for both species and sex.
Table 3.17 Individuals used for intra- and inter-observer error analysis.
Table 3.18 Number of deviations by tooth stage for intra-observer error.
Table 3.19 Number of deviations by tooth stage for inter-observer error.
Table 3.20 Sample size and frequency of differences between sides.
Table 3.21 Frequences of missing values for epiphyseal fusion sites in Pan paniscus and Pan troglodytes.
Table 3.22 Missing data by epiphysis showing number of individuals for the entire sample and for dental score 64 individuals
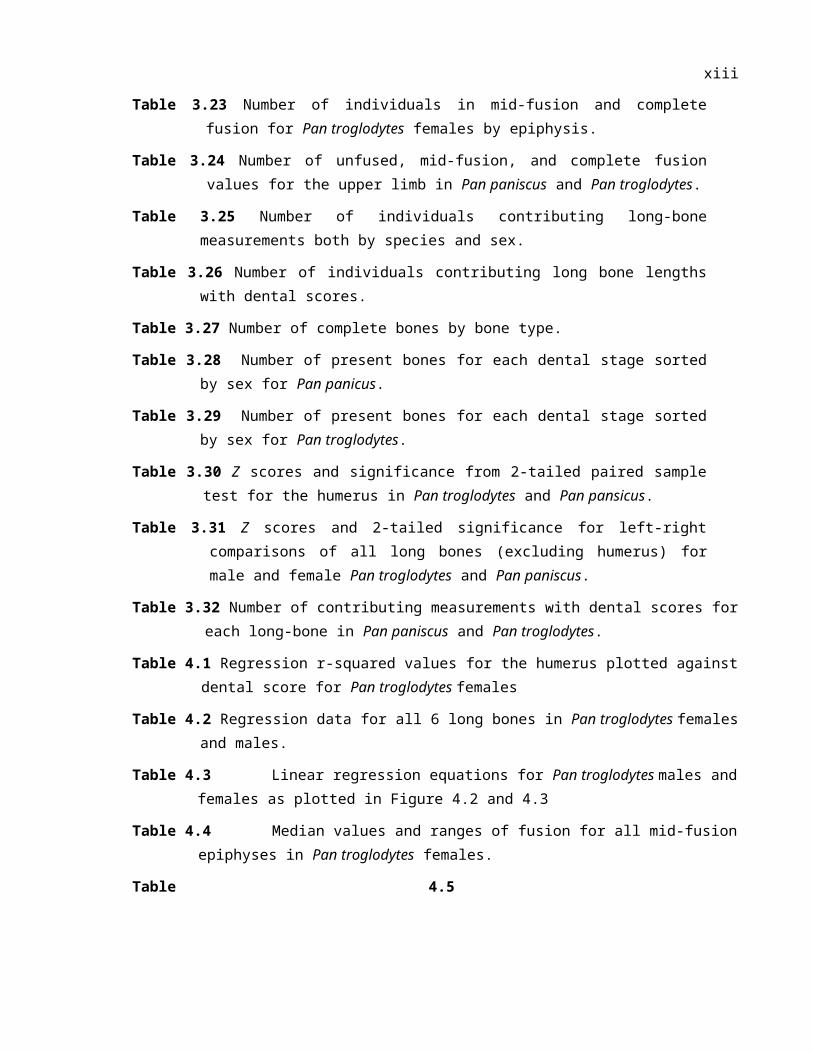
Table 3.23 Number of individuals in mid-fusion and complete fusion for Pan troglodytes females by epiphysis.
Table 3.24 Number of unfused, mid-fusion, and complete fusion values for the upper limb in Pan paniscus and Pan troglodytes.
Table 3.25 Number of individuals contributing long-bone measurements both by species and sex.
Table 3.26 Number of individuals contributing long bone lengths with dental scores.
Table 3.27 Number of complete bones by bone type.
Table 3.28 Number of present bones for each dental stage sorted by sex for Pan panicus.
Table 3.29 Number of present bones for each dental stage sorted by sex for Pan troglodytes.
Table 3.30 Z scores and significance from 2-tailed paired sample test for the humerus in Pan troglodytes and Pan pansicus.
Table 3.31 Z scores and 2-tailed significance for left-right comparisons of all long bones (excluding humerus) for male and female Pan troglodytes and Pan paniscus.
Table 3.32 Number of contributing measurements with dental scores for each long-bone in Pan paniscus and Pan troglodytes.
Table 4.1 Regression r-squared values for the humerus plotted against dental score for Pan troglodytes females
Table 4.2 Regression data for all 6 long bones in Pan troglodytes females and males.
Table 4.3 Linear regression equations for Pan troglodytes males and females as plotted in Figure 4.2 and 4.3
Table 4.4 Median values and ranges of fusion for all mid-fusion epiphyses in Pan troglodytes females.
Table 4.5 Median values and ranges of fusion for all complete fusion epiphyses in Pan troglodytes females.

x
Table 4.6 Mid-fusion and complete fusion median, 25th and 75th percentiles values for generated dental score in Pan troglodytes females.
Table 4.7 Shapiro-Wilk normality test for Pan troglodytes male and female epiphyses with dental scores below DS64.
Table 4.8 t-test comparison for male and female Pan troglodytes epiphyses that satisfy criteria for being below dental score 64.
Table 4.9 Mean epiphyseal fusion value compared to dental score for Pan troglodytes females by individual.
Table 4.10 Mean epiphyseal fusion value compared to dental score for Pan troglodytes males and Pan paniscus males and females.
Table 4.11 Example of contingency table comparing the coracoid with the distal ulna in Pan troglodytes males.
Table 4.12 Modular sequence of fusion for Pan troglodytes females.
Table 4.13 Modular sequence of fusion for Pan troglodytes males.
Table 4.14 Summary of non-normal ranges of mean epiphyseal fusion score for mid-fusion and complete fusion in Pan troglodytes males and females.
Table 4.15 Bonferroni post-hoc test of difference for the proximal humerus in Pan troglodytes females.
Table 4.16 Earlier and later epiphyses for mid-fusion Pan troglodytes females.
Table 4.17 Independent sample t-test for comparing male and female mid-fusion mean epiphyseal fusion score ranges for all epiphyses.
Table 4.18 Independent sample t-test for comparing male and female complete fusion mean epiphyseal fusion score ranges for all epiphyses.
Table 4.19 Post-hoc Bonferroni tests of the proximal humerus for mid-fusion combined-sex fusion events in Pan troglodytes.
Table 4.20 Sequence order of mean values from lowest to highest for mid-fusion Pan troglodytes males and females.
Table 4.21 Sequence order of mean from lowest to highest for complete fusion Pan troglodytes males and females.
Table 4.22 Regression summary for male Pan troglodytes upper vs. lower limb.
Table 4.23 Regression r-squared values for limb comparisons of Pan troglodytes females and Pan paniscus males and females
Table 4.24 Linear regression equations of log10 transformed limb data for Pan troglodytes and Pan paniscus males and females.

xi
Table 4.25 Regression values for analysis of serially homologous limb elements in Pan troglodytes.
Table 4.26 Regression values for analysis of serially homologous limb elements in Pan paniscus.
Table 4.27 Estimated chronological ages for fusion events based on median values of mid-fusion and complete fusion in Pan troglodytes females.
Table 4.28 Estimated chronological ages for fusion events based on median values of mid-fusion and complete fusion in Pan troglodytes males.
Table 4.29 Estimated chronological ages for fusion events based on median values of mid-fusion and complete fusion in Pan paniscus females.
Table 4.30 Estimated chronological ages for fusion events based on median values of mid-fusion and complete fusion in Pan paniscus males.
Table 4.31 Comparison of estimated mid-fusion and complete fusion ages in Pan troglodytes from the present study to data from Bolter and Zihlman (2012).
Table 4.32 Comparison of estimated mid-fusion and complete fusion ages in Pan paniscus from the present study to data from Bolter and Zihlman (2012).
Table 5.1 Sample size for mid-fusion events in Pan troglodytes males using Schaefer and Black’s (2007) criteria.
Table 5.2 Legend of epiphyses for Figure 5.1.
Table 5.3 Sample size for combined-sex Pan troglodytes mid-fusion epiphysis using Schaefer and Black’s (2007) criteria.
Table 5.4 Comparison of sequence differences between chimpanzees and humans using Schaefer and Black’s (2007) criteria.
Table 5.5 Comparison of mid-fusion sequences between combined-sex chimpanzees using mean epiphyseal fusion value and humans from Schaefer and Black (2007).
Table 5.6 Human and chimpanzee dental apical closure ages and chimpanzee
Table 5.7 Epiphyseal fusion ranges in humans for both males and females derived from several different studies.
Table 5.8 Chimpanzee fusion events after apical closures estimated from Kuykendall (1996)
Table 5.9 Epiphysis groups for dental apical age ranges in chimpanzees.
Table 5.10 Groupings of mid-fusion epiphyses by dental apical closure for human females.
Table 5.11 Comparison of mid-fusion timing relative to growth in long-bone length for female chimpanzees and humans.
Table 5.12 Comparison of mid-fusion timing relative to growth in long-bone length for male chimpanzees and humans.
Table 6.1 Epiphysis classification for regional comparison of epiphyses.

xii
List of Tables for the Appendix
Table 8.1 Reported locations for wild specimens at the Museum of Central Africa.
Table 8.2 Locations from which Pan troglodytes troglodytes specimens were collected at the Powell-Cotton Museum.
Table 8.3 Provenience for specimens from the University of Zurich and re-classification.
Table 8.4 Variable summary for missing tooth data in Pan paniscus combined sex multiple imputation.1
Table 8.5 Variable summary for missing tooth data in Pan troglodytes females multiple imputation.3
Table 8.6 Variable summary for missing tooth data in Pan troglodytes males multiple imputation.4
Table 8.7 Regression outputs for linear regression analysis comparing long-bone plotted against dental score.36
Table 8.8 Pan troglodytes females linear regression ANOVA outputs for all long-bones as plotted against dental score.
Table 8.9 Pan troglodytes males linear regression ANOVA outputs for all long-bones as plotted against dental score.37
Table 8.10 Coefficients of linear regression analysis of long-bones as plotted against dental score for Pan troglodytes females.37
Table 8.11 Coefficients of linear regression analysis of long-bones as plotted against dental score for Pan troglodytes males.38
Table 8.12 Median values and ranges of dental score for all mid-fusion epiphyses in Pan troglodytes males.39
Table 8.13 Median values and ranges of dental score for all complete fusion epiphyses in Pan troglodytes males.40
Table 8.14 Median values and ranges of dental score for all mid-fusion epiphyses in Pan paniscus females.1
Table 8.15 Median values and ranges of dental score for all complete fusion epiphyses in Pan paniscus females.2
Table 8.16 Median values and ranges of dental score for all mid-fusion epiphyses in Pan paniscus males.3
Table 8.17 Median values and ranges of dental score for all complete fusion epiphyses in Pan paniscus males.4

xiii
Table 8.18 Mid-fusion and complete fusion median, 25th and 75th percentiles dental score values for Pan troglodytes males.5
Table 8.19 Mid-fusion and complete fusion median, 25th and 75th percentiles dental score values for Pan paniscus females.46
Table 8.20 Mid-fusion and complete fusion median, 25th and 75th percentiles dental score values for Pan paniscus males.47
Table 8.21 Mean epiphyseal fusion normality tests for mid-fusion Pan troglodytes females.48
Table 8.22 Mean epiphyseal fusion normality tests for mid-fusion Pan troglodytes males49
Table 8.23 Mean epiphyseal fusion normality tests for complete fusion Pan troglodytes females50
Table 8.24 Mean epiphyseal fusion normality tests for complete fusion Pan troglodytes males.51
Table 8.25 Regression summary for comparison of upper vs. lower limb with Shea (1981) in Pan paniscus and Pan troglodytes.2
Table 8.26 Linear regression ANOVA outputs for Pan troglodytes and Pan paniscus males and females.2
Table 8.27 Coefficients for linear regression analysis comparison with Shea (1981) for Pan troglodytes and Pan paniscus males and females.2
Table 8.28 Multiple limb element linear regression outputs for Pan troglodyes and Pan paniscus males and females.3
Table 8.29 Multiple limb-element linear regression ANOVA outputs for Pan troglodytes males and females.4
Table 8.30 Multiple limb-element linear regression ANOVA outputs for Pan paniscus males and females.5
Table 8.31 Coefficients for linear regression in Pan troglodytes males and females.56
Table 8.32 Coefficients for linear regression in Pan paniscus males and females.56
Table 8.33 Normality plots for fusion as a percentage of long-bone length in Pan troglodytes57
1
Chapter 1 Introduction
1.1 The problem with sub-adult skeletal and dental development in paleoanthropology
Our knowledge of the origins of the human species has greatly expanded in recent decades. With new
fossil evidence being found on a continual basis, what is known about our predecessors since the split
between the human lineage and other extant apes continues to change and evolve. A great amount of
this research has focused on morphological differences between species and adaptive changes such as
the shift towards bipedalism, brain expansion and an extended period of maturation. Much interest has
focused on the environmental and behavioural reasons for these adaptations with many well-supported
theories having been proffered. However, it has been less clear how these changes are manifest in
skeletal evidence for growth and development and there is a good reason for a lack of lucidity in the
understanding of this topic. This derives from the fact that understanding changes in skeletal
development necessarily requires large samples of sub-adult individuals of different ages from a single
species, preferably at a single point in geological time. Even with the size of the fossil record growing
on a continual basis, the satisfaction of such requirements is still extremely unlikely if not impossible.
Researchers must instead rely on evidence from a scattering of sub-adult specimens spanning different
species over large periods of time and space. Such specimens include well-known examples such as
the Nariokotome Boy and the Sediba and Dikika specimens (Alemseged et al. 2006, Berger et al.
2010).
The above mentioned specimens only provide a snapshot of development. They are single individuals
frozen at one specific stage of an ongoing process. Developmental parameters from long-deceased
human ancestors will never be uncovered by compiling statistics from a small scattering of bones. As
such research in the field has been forced to rely on comparing these individuals to developmental
patterns of extant humans. The understanding of modern human development is quite advanced but
using these data for comparison with fossil remains has been deemed questionable because of the
inherent nature of this type of information. Variation is a critical component that must be accounted
for in any such comparison. Patterns of growth found for extant humans have been ascertained by the
use of large data sets which rely on patterns determined by statistics of central tendency. However, it
is well understood from such studies that individuals can exhibit variation in pattern and timing of
developmental events caused either by genetic or environmental factors. The case of the Nariokotome
Homo ergaster specimen (KNM-WT 15000) is both a well-known and pertinent example of the
ambiguity that such variation may present. In this individual it was found that the pattern of skeletal
2
fusion shown differed from an expected normal human pattern but was not outside of the range of
modern human outliers (Smith 2004). In other words, the Nariokotome specimen’s parent population
may or may not have been developmentally analogous to modern humans. Without further
information the problem cannot be solved.
This type of difficulty has drawn some researchers to comparisons of modern humans with closely
related extant primate species to ascertain where consistencies lie and deviations from shared patterns
occur. These patterns may help to identify where changes have developed and where shared primate
traits are expected. The underlying logic is that if a trait is shared between two closely related extant
species then it is likely that their ancestor also exhibited this same trait. Even though this strategy is
very good, from a cladistic perspective it is not foolproof. Traits may develop by convergence
whereby the same phenotype has been arrived at twice in two independently evolving species. It is
even possible that a trait has disappeared and then re-appeared such as has been observed for the
maxillary sinus in some old world monkeys (Rae et al. 2002). However, the most important fact to
keep in mind is that this method of comparison provides the most tenable pattern of shared and derived
traits.
For humans, it has been established that our closest living relatives are chimpanzees and bonobos
(Kumar et al. 2005, Raaum et al. 2005, Stumpf 2007). It is these two species to which research has
focused for furthering the understanding of development in human fossil ancestors. This brings us to
the key objective of this study. A large body of research on chimpanzees and bonobos has in the past
been produced but there remains much still to be understood with many gaps in integration of skeletal
developmental parameters. This study seeks to close some of these gaps in knowledge and provide
further insights into developmental pattern comparisons between humans and our closest living
relatives. This will allow for the refinement of models for what is observed in the fossil record.
1.2 The main objectives of this study
This study will evaluate the level of concordance in pattern and timing of skeletal development
between Pan troglodytes and Pan paniscus and will compare these aspects to humans (Homo sapiens).
The applicability of theoretical models of growth will be assessed. This will be achieved by
documenting the pattern and relative timing of specific skeletal growth parameters. Three aspects of
skeletal growth will be considered; epiphyseal fusion (the union of growth plates to the ends of the
bone), dental mineralization, and long-bone growth in length in a comparatively large sample of these
two Pan species. Prior studies have focused more narrowly on regional developmental patterns such as
hand/wrist and foot bone epiphyseal fusion (e.g., Hamada and Chatani 2003, Watts 1971, 1985,

3
Winkler 1996), dental development (e.g., Anemone et al. 1991, Kuykendall 1996, Kuykendall et al.
1992, Smith et al. 2010, Zihlman 2004), and immature morphology (e.g., Gavan 1971, Hamada et al.
1996, Watts 1982). Holistic studies incorporating both dental development and a broad spectrum of
epiphyses are rare with only a few researchers attempting this approach using small sample sizes
(Bolter and Zihlman 2012, King 2004, Zihlman et al. 2007). King (2004) reinforced through
discriminant function analysis that there are broadly related trends among apes and Bolter and Zihlman
(2012) have provided approximate ranges fusion for both species using a sample of only 10 Pan
troglodytes and 8 Pan paniscus individuals. Even though these studies have been useful for providing
a general range of fusion events and an expectation of some broad similarities between all three
species, there is still not a clear understanding of fusion sequence and concise timing for fusion events.
This is due to the mitigating effect of the small sample sizes used in these studies. There is also a lack
of information relating growth rates to fusion sequences and timing.
The present study attempts to improve this situation by the analysis of a cross-sectional sample of 177
Pan troglodytes and 37 Pan paniscus individuals found in skeletal collections at the Museum of
Central Africa, The Powell Cotton Museum, and the University of Zurich. Three main categories of
data were evaluated: epiphyseal fusion, dental development, and length of long-bones. Dental
mineralization was assessed using the Demirjian (1973) method and used as a scale for maturational
development relative to epiphyseal fusion and long-bone growth. Epiphyseal fusion was assessed
using a system similar to that employed by Zihlman et al. (2007). Fusion events were seriated and
sequences within dental and skeletal development compared. Long-bone length data were used in
conjunction with dental score which permitted the generation of growth curves by linear regression
analysis. Having both length and epiphyseal fusion sequence data from the same sample facilitated the
simultaneous integration of dimensional change and maturational pattern. Not only could a sequence
of fusion events be produced, but the relative timing of these events could be scaled to changes in long-
bone length. These data were compared and contrasted between the two species of Pan and the
extensive data already in existence for Homo.
1.3 The contribution this study will make to modelling of growth and development in hominins
Humans demonstrate an extended period of maturation relative to chimpanzees, bonobos, and other
apes (Hill 1993) and have developed a longer lifespan (de Magalhães and Church 2007). Humans
experience an extension of sub-adult stages including the addition of childhood and adolescent stages
(Bogin and Smith 1996). This has meant that there are differences in growth curves both in terms of
duration and rates between the two species. These differences have made direct comparisons of

4
maturational sequences using chronological time as a reference problematic. It is known that in
chimpanzees the third molar is complete and in occlusion only shortly after the second molar
(Kuykendall and Conroy 1996). Given what is known about chimpanzee growth, this event is likely
contemporaneous with or precedes complete skeletal maturation. Research on bonobo dentition and
maturation has suggested similar results (Bolter and Zihlman 2012). In humans the third molar
emerges either later than or near the end of complete skeletal maturation (Scheuer and Black 2000,
Schaefer et al. 2009, Sciulli 2007). The paucity of chimpanzee data has meant that it cannot be
conclusively determined that these species are different. It remains to be determined if such
differences of development are also shared between chimpanzees and bonobos. It is such questions
that this study aims to address.
Pattern and rate of growth: Heterochrony
Explaining developmental patterns has been approached using different models. These models all fall
under the area of developmental theory referred to as heterochrony, which is the study of changes in
rates and patterns (sequences) of growth (Rice 1997). This topic will be discussed in detail in Chapter
2. Here two key variables shall be briefly introduced: the pattern of development and the rate of
development. The pattern of development relates to developmental sequences such as dental eruption
and epiphyseal fusion. The rate of development refers to the functional relationship between time and
growth. These concepts are not independent but past research has tended to analyse them
independently. Skeletal elements grow at different rates and their completion is determined by fusion
of the epiphysis to the diaphysis. An organism can be looked upon as a system in which the entire
process of growth functions as a unit. To illustrate this point, it is known that chimpanzees and
bonobos attain adult proportions earlier than humans with respect to chronological time (Hamada et al.
1996). However, it is unclear if the means of having achieved this maturity represents an accelerated
version of the same pattern or if the pattern is markedly different within this shorter timeframe.
Delineating between these concepts is difficult, especially with the amount of inherent individual
variation that exists. Having the foundation of long-bone lengths, fusion sequences, and dental
development will allow for the pursuit of greater clarity within this topic.
The following are some specific topics of interest that this study will address having both dimensional
change and sequence data concomitantly:

5
1. Morphological change
Here the concern is with the dimensional changes, particularly the relative lengths of bones. The aim
is to know how the pattern of different relative lengths of bones is arrived at and how these patterns are
represented in skeletal fusion and growth rate.
2. Behavioural and locomotory adaptations
This topic is not independent of morphological change. It involves the additional effects that behavior
has on skeletal maturation. It remains to be seen if particular epiphyses that are more precocious than
others fuse earlier in order to stabilise joints due to positional behavioural demands. Differences in
pattern and timing of ossification centre appearance have been implicated as support for this suggestion
(Blomquist 2009, Dainton and Macho 1999, Hunt 1991, 1992). It is not entirely clear if the growth
rates of bones are related to such adaptations. In humans, for example, more growth in length occurs at
the distal end of a radius than the proximal with the same pattern occuring for the ulna but the reverse
being observed for the humerus (Schaefer et al. 2009, Scheuer and Black 2000). This pattern is
generally observed for mammals as a group. However, some studies have found small differences in
pattern for individual elements in primates and this has been associated with behavioural patterns
(Bolter 2011). It may be speculated that the precocious fusion of epiphyses at the elbow might relate
to the need for structural stability in that joint as a consequence of behavioural patterning as early in
development as possible. If this is the case then more suspensory primates may place higher priority
for earlier fusion of this joint. The provision of sequence and relative timing data from this study will
permit inferences to be made in relation to locomotory patterns and dimensional change.
Determining the shared and derived nature of developmental patterns has consequences for what may
be inferred about locomotion in fossil ancestors. In recent time this has become a topic of greater
interest with current research suggesting that the human and chimpanzee last common ancestor may
have been less of a direct analogue of modern extant apes than was once though (Lovejoy et al. 2009).
When large changes occur in relative timing and rate of maturation, and when these deviations are
correlated with differences in behavioural patterning, models may be generated that describe how this
ancestor might have appeared.
3. Comparisons of developmental sequences and rates of growth.
As mentioned above, heterochrony may be broken down into two major areas of study: rates of growth
and sequences of developmental events. Linking developmental sequences to chronological time
informs these theories about the state of development relative to the growth in size or shape. Many of

6
the terms of this subject rely on development relative to the age at which sexual maturity is reached. It
has been established for some time that humans differ from chimpanzees in both rate and duration of
overall somatic growth (Bogin 1997). Some sequences of developmental events have been determined
such as dental development (Kuykendall 1996) but this linkage between rates and sequences is
incomplete. This study seeks to bridge many of these gaps by clarifying epiphyseal fusion sequences
in the context of dental sequences and dimensional growth.
1.4 Study approach
As noted in section 1.2, this study will evaluate epiphyseal fusion, dental development, and long-bone
growth in 177 Pan troglodytes and 37 Pan paniscus individuals from osteological collections. This
study both builds and expands upon past research, which will be defined in Chapter 2: Background. In
the context of this past research, it was decided to evaluate dental development using the Demirjian
method (Demirjian et al. 1973) applied to radiographs of mandibular dentition. This produced
summary dental scores comparable with known age samples used by Kuykendall and Conroy (1996).
Epiphyseal fusion was recorded using a multi-stage scoring system similar to those that has been used
for human studies. Long-bone length was evaluated using an osteometric board, with orientation
normalized to set criteria. These data were collected for both sides of the skeleton in order to
maximize data entries when skeletal elements were missing from one side or the other, as is common
with many osteological collections.
1.5 Chapter overview
Chapter 2 (Background) provides the context in which this research is situated. This chapter is broken
into two major sections. The first section is an overview of developmental theory and how it has been
applied to chimpanzee, bonobo, and human growth. There is a lack of consensus as to which
developmental parameters define differences between the two genera and how these differences have
affected adult form. This is discussed. The second half of this chapter describes what is known for
humans, chimpanzees, and bonobos for each developmental variable evaluated in this study, these
being dentition, epiphyseal fusion and long-bone growth. For each of these variables the effects of sex,
population affinities, and nutritional stress are evaluated. Comparisons between these species are then
considered, highlighting gaps in knowledge.
Chapter 3 (Materials and Methods) is divided into three section. First, a descriptive analysis of the
materials used is pursued (Section 3.1). The geographic origins, state of preservation, completeness,
and general demographic data are detailed. Second, the methodology used to collect the data is
outlined with justification provided for each procedure (Section 3.2). Third, due to the complex nature

7
of these data, a series of procedures are carried out in order to begin the analysis and to ensure
robusticity of the data. These procedures are described in sections 3.3. Sections 3.4 to 3.6 demonstrate
how these procedures were carried out in greater detail.
Chapter 4 (General Results) presents the the general results for epiphyseal fusion sequences and long-
bone growth in Pan troglodytes and Pan paniscus. The two major sections of this chapter are
concerned with growth rates and sequences within Pan. Epiphyseal fusion as plotted against dental
score is explored and the limitations of this approach highlighted. Fusion sequences are also seriated
without dental score for Pan troglodytes. Allometric relationships are explored for long-bone growth
and growth curves for each long-bone plotted.
Chapter 5 (Comparisons of growth standards between Pan and Homo) investigates comparisons
between chimpanzee, bonobos, and humans, including comparisons with prior studies of all three
species. Such past studies often collected data in different ways and the effects of these differing
methodologies must be analysed. This chapter begins by producing estimated chronological ages of
fusion from dental scores and compares the results of this analysis to the data provided by to Bolter and
Zihlman (2012). An expanded list of estimated chronological ages for the epiphyses in this study are
presented. Seriated sequences of fusion are compared to Schaefer and Black’s (2007) modular
sequence for human epiphyseal fusion. Following this, an analysis of the relative position of dental
and epiphyseal fusion sequences is considered. For the last part of this chapter, a comparison of long-
bone lengths relative to epiphyseal fusion events is pursued by considering the timing of fusion events
as a proportion of growth in length.
Chapter 6 (Discussion) considers the implications of new information provided in the previous two
chapters. This chapter is broken into two section. The first section considers how the results of this
study may be situated within the context of developmental theory. How well these data inform debates
relating to growth rate and pattern is assessed. The second section considers what the implication these
results have for the study of fossil hominids. The Nariokotome Homo ergaster specimens is a
pertinent example and an analysis of this individual is discussed.
Chapter 7 (Concluding Remarks) provides an assessment of the general findings of this study. The
implications that this new information has for the study of developmental theory is discussed. The
consequences for the study of fossil hominids are also reviewed. Suggestions for further research are
made.

8
Chapter 2 Background
2.1 Theoretical approaches to growth
This study observes growth for three separate systems of development; epiphyseal fusion, dentition,
and long-bone length. These three systems have factored largely in developmental modelling
alongside other variables not directly measured in this research. To begin this discussion fundamental
concepts are defined followed by an introduction of the applications of heterochrony and
developmental theory.
2.1.1 Fundamental concepts: measuring skeletal growth
All living organisms, including mammals, grow and develop according to a set of instructions given by
their genotype. In recent years molecular biology has undergone a veritable revolution in decoding
these instructions and finding out how these systems works. Many regulators of growth such as IGF-I
(e.g., Chia et al. 2006) have been identified and research within the field will continue to improve the
understanding of development at a molecular level. However, the study of genetics is still far from
being able to describe growth in terms of morphology and the triggers for ossification and fusion
events. Present understanding is able to identify the function of individual proteins and hormones, as
well as the consequences of mutation in the genes that code for them, but the complete picture required
to establish exactly how these systems work at a molecular level is still missing. Thus, the
understanding of growth is still dependent on looking for patterns in what is physically observable,
which in this study is bones. The mammalian world is replete with variation in skeletal morphology
and diversity but there remain the same intrinsic structures. All of the bones found in a human can be
found in for example a baboon, despite differences in shape and proportion. The study of growth relies
on assessing modifications of these structures and explaining such changes by proposed adaptative
mechanisms.
For skeletal growth there are two basic variables to consider: growth rate and event sequence patterns.
Growth rate will be considered first. This may refer to overall somatic growth of an organism as a
proportion of final adult size or the relative growth of specific elements. Overall somatic growth is
often measured as a function of mass vs. time or another general measure such as anterior trunk length.
Examples of such studies for chimpanzees include Hamada et al. 1996, Hamada et al. 2003, Hamada
and Udono 2002, and Schultz 1960. These types of measures are informative in the sense that they
take into account the effect of many different systems at once. It is known that chimpanzees and
humans gain mass at different rates and for different durations of time. Humans have specific sub-

9
adult stages, specifically childhood and adolescence, which are believed to have been specifically
selected for in the human lineage and are not shared with Pan (Bogin 1997). Thus, the study of this
key variable suggests that all of the more specific systems of skeletal development must likewise be
developing at different rates.
The next step of an analysis of growth rates is to consider how different growth rate is manifest in
comparisons of specific elements. This may be expressed as a functional relationship between two or
more elements. For example, human cranial growth is much in advance of post-cranial growth (Leigh
2004). Growth rates may also differ even within single skeletal elements. For example, in humans and
mammals generally, bone growth at the proximal humerus contributes to the majority of growth in
length and matures years after cessation in growth of the distal portion (Scheuer and Black 2004).
Both ends of this bone contribute to growth in length but at different rates and for different periods of
time. Changes in the relative length of bones during growth, if they are present, may also relate to such
differences in growth rates between differing elements.
Sequences in development are marked by distinct maturational events such as the formation of
ossification centres, tooth emergence, and epiphyseal fusion. Examples of such sequences are
provided for humans in many reference texts (e.g., Schaefer et al. 2009, Scheuer and Black 2004).
These events do not occur simultaneously during growth and are found to follow a predictable order.
Particular sub-systems appear to have sequences that are independent from each other such as dental
development and skeletal fusion. This has notably been observed in stressed human populations where
dental and skeletal development deviate from one another (Demirjian et al. 1985, Lewis and Garn
1960, Smith 1991).
The differences between developmental sequences and rates of growth require some further discussion.
Consider a hypothetical example where two species have exactly the same pattern of epiphyseal fusion
but one species matures in half the time that the other does. Figure 2.1 illustrates how this may be
represented in these species. Each species has a different rate of growth but exactly the same sequence
of maturational events.
10
Figure 2.1 Maturational events in two hypothetical species of differing growth rates where species 1 (red line) reaches specific maturational events more rapidly than species 2 (green line).
Both events occurred in the same order and at the same relative time in growth (Figure 2.1). Event 1
occurred at 50% and event 2 at 80% of growth. Thus, in this case the only difference is the relative
time it took for these events to occur. Growth rate relative to time differs, as does duration of growth
but maturational sequences are identical. In addition to this, it can be stated that these maturational
events occur at the same time as a proportion of length. Figure 2.2 illustrates inconsistent relative
growth.
In Figure 2.2 the event sequence is again identical but the relative timing and rates of growth rates are
different between the two species. A third potential scenario would be when the two growth curves
superimposed, indicating that growth rate and duration were identical for both species but the
sequences differed. These figures illustrate that studying pattern independent of growth rate and time
can be misleading when comparing species, although this approach is frequently employed. Both the
rate of growth rate and sequence of events need to be considered in conjunction in order to gain a more
complete understanding of development.

11
*Species 1 (red line) reaches specific maturational events more rapidly than species 2 (green line) and experiences event 1 (E1S1) relatively earlier than species 2.
Figure 2.2 Maturational events in two hypothetical species of differing growth rates and differing
relative timing of sequence events.
2.1.2 Developmental Theory
In this section the theoretical terminology used to study growth will be presented. How these terms
have been applied to comparisons between chimpanzees, bonobos, and humans will be discussed. As
noted in Chapter 1, the subject within developmental biology that studies the effects of changes in
event timing and rate of growth is known as heterochrony. Heterochrony focuses changes in size and
shape through developmental processes. Rice (1997) defined different types of processes that are
included within this subject:
1. Progenesis: The achievement of sexual maturity before attaining the adult form.
2. Hypermorphosis: The achievement of adult form prior to sexual maturity.
3. Neoteny: Retention of juvenile traits.
4. Acceleration: Increased rates of development.

12
5. Sequence heterochrony: Changes in time of onset of events
Some further clarification of these terms is warranted. Progenesis implies that early sexual maturation
is positively selected and can lead to precocious reproduction at an earlier phase of growth. Neoteny
suggests that traits from sub-adults are maintained through to adult individuals. Therefore the time of
attainment of adulthood relative to sexual maturity may or may not change, but it is simply that certain
traits remain sub-adult in appearance. Hypermorphosis, conversely implies that an adult state is
attained prior to sexual maturity. It may be applied to either the entire organism or individual
anatomical features with the latter being a more common usage. Bogin (1997) defines hypermorphosis
as the extention of earlier growth stages while neoteny is the retention of lower, or earlier stages into
adulthood. Neither progenesis nor acceleration tend to be discussed independently when describing
humans. The focus is instead on neoteny and hypermorphosis. Humans are progenetic in the sense
that they reach physical sexual maturity prior to complete skeletal maturity. However, this is not
unique to this species and is common in many mammalian taxa including primates (Kilborn et al.
2002).
The analysis of sequence heterochrony relies on the study of pre- and post-displacement, or in other
words the changing of order of events (Bininda-Emonds et al. 2002, Jeffery et al. 2002, King 2004,
Nunn and Smith 1998, Richardson et al. 2001, Smith 2001 2002, Velhagen 1997). Many examples of
sequence heterochrony studies may be found in the literature including Goswami (2007), King (2004),
and Smirthwaite (2007). In the context of skeletal development, this area of study makes particular use
of epiphyseal fusion and dental sequences of development. As shall be discussed in section 2.4.6,
King’s (2004) study incorporating both of these sequence variables is of particular relevance for the
study of sequence heterochrony in primates.
Allometric scaling
Allometric scaling refers to changes in the proportionate size of elements relative to the size of the
whole organism. Differences between adults are generally much better studied than differences
between sub-adult individuals. Changes in allometry are related to imposed biomechanical and
behavioural constraints (Schmidt-Nielsen 1984, Small 1996). When two species with differing adult
proportions are compared, it is necessary to consider whether the difference between them develops
during growth from a sub-adult of the same dimensions or if these species are born with already
differing proportions. This is a phenomenon known as ontogenetic scaling. There has been much
discussion considering issues of scaling with respect to both size and shape (e.g., Gould 1977, Persson
et al. 1998, Ravosa and Daniel 2010).
13

14
Combining allometric scaling and maturational sequences
Determining the relationship between maturational events and growth parameters is complex. Various
models have been used to try and calibrate maturational events relative to body proportions, and to
compare these variables between ancestors and descendents (Klingenberg 1998). It has been suggested
that there is not a strong relationship between skeletal maturational pattern and significant changes in
size for closely related species (Godfrey and Sutherland 1995), as shown by Roth (1984) who studied
skeletal development in elephant species. Roth showed that these species varied dramatically in size
but the size changes did not necessarily correlate to any specific changes in pattern of skeletal and
dental development. Dwarfed species especially did not exhibit paedomorphic patterns (retention of
juvenile traits in adult forms, i.e. neoteny) but simply appeared to be scaled-down versions of larger
species. This study may seem like a convincing case in point, although it is only drawn from one
dwarfed taxon from which there was sufficient data. It is not evidence that other dwarfed taxa
necessarily behave in this manner. However, a bigger challenge for this type of research is that it
requires a diverse set of samples from multiple species for robust conclusions to be made. This type of
information across appropriately related taxa is still limited.
The application of ontogenetic theory to the study of human evolution
Ontogenetic theory as applied to humans has centred primarily on comparisons between chimpanzees
and humans. This is because chimpanzees are a closely related species to humans but also remains
morphologically and behaviourally distinct. While bonobos are equally closely related to humans,
comparisons with this species are relatively rare but fall into a similar category of study due to bonobos
branching away from chimpanzees after the divergence of Homo-Pan. Adding to the differences
between chimpanzees and humans, it has been observed that these species achieve adult form at
different times and at different rates. This particular point has been discussed at length with some level
of disagreement persisting to the current state of research.
Attempts at unified theories based on neoteny and hypermorphosis
In the 1990s there was a thrust towards producing a unified theory of growth. The subject was
extensively debated but disagreement and a lack of consensus remained and persists to the present day.
The concept that humans exhibit neoteny has been proposed multiple times and is the oldest proposed
explanations for how the species differs from other apes. As discussed by Bogin (1997), the most
substantial proponent of this concept was Gould (1981) who provided a case based more on
15
behavioural observations than anatomical ones. Essentially the curiosity and learning behaviours of
young primates is brought forward to adulthood in humans.
The popular impression that young chimpanzees appear more ‘human-like’ has led the expectation of
sub-adult feature retention. However, the investigation of neoteny in terms of general anatomy has had
limited application. There have been some studies of facial morphology that have pointed towards
humans retaining sub-adult cranial features into adult form (e.g., Bastir and Rosas 2004, Penin et al.
2002). Bufill et al. (2011) have suggested that humans maintain neurologically immature state of
synaptic connection formation. Apart from the study of cranio-facial growth, the application of
neoteny to humans relies on little other anatomical evidence. The simplicity of the concept may have
limitations when applied to post-cranial growth. The convention that defines complete maturation of a
bone is fusion of its epiphyses. In this sense, neoteny clearly doesn’t apply to humans or apes as they
both always mature. However, whether individual elements demonstrate ‘temporary neoteny’ in that
an element may grow longer or stay in an immature state for a greater period of time is entirely
possible. A pertinent example of this would be the temporally very late fusion of the medial clavicle in
humans. Additionally, the argument that dimensional differences during growth indicate neoteny is
difficult to prove. Evidence may be presented as a slowing of growth in an element, resulting in a
difference for the adult. Whether this is simply a difference between species or a specific retention of
sub-adult features is debatable.
The application of neoteny to humans has been challenged in the past for growth rate and for
dimensional change. McKinney and McNamara (1991), Parker (1996), and Vrba (1996) argued that
humans are instead hypermorphic; they are not persistent subadults but are actually developmentally
delayed adults. That is, there is not retention of subadult features into later stages but rather that the
adult stages are delayed. These studies again considered overall somatic growth rates as well as
cognitive and social rationale for their conclusions. Vrba (1996) went further and posited that this
longer period of growth permitted the distortions in body shape between ancestor and descendant we
see today. However, the theory that humans are hypermorphic has also been challenged. Shea (1989),
Godfrey and Sutherland (1996) and Mitteroecker et al. (2004) have reasoned that neither theory
sufficiently explains the patterns of growth and allometry in humans. Shea (1989) allowed for neoteny
to be potentially present for cranio-facial dimensions. Mitteroecker et al. (2004) have taken the
opposing view after comparing chimpanzee and human cranial dimensions and concluded that this is
not the case. These studies refuting neoteny and hypermorphosis have cited allometric contradictions
as evidence against both theories.

16
In the last decade there has been a decline in attempts to describe human development by a unified
theory with perhaps the exception of neoteny in cranio-facial growth, although this too is not without
dispute. It seems a reasonable conclusion to draw that differences in growth are inherently more
complex than the definitions these terms permit. Thus far neither allometry nor overall somatic growth
rate appear to conform to generalised theories of heterochrony either analysed separately or combined.
It appears that the size and shape of humans are not strictly the consequence of augmented growth rate
but undoubtedly the result of independent selection acting on different anatomical regions and
processes. This result points towards the requirement for a more detailed understanding of each
developmental process.
Allometric scaling in chimpanzees, bonobos, and humans
Theories of heterochrony may not work well when attempting to integrate data from allometric scaling
but the results of such studies are in themselves very useful for understanding developmental change.
Shea’s (1989) argument against heterochrony was based on the list of papers that he produced over the
previous decade (e.g., Shea 1981, 1983, 1984, 1985, 1989). The details of Shea’s research are
discussed in sections 2.6.2 to 2.6.4 when studies of long-bone length are considered. To summarise,
Shea (1981) found that Pan troglodytes, Pan paniscus, and Gorilla gorilla showed broad similarities in
overall growth rates but differences in development of individuals bones were both interspecific and
intraspecific. These differences had effects on the eventual adult dimensions, which have been more
commonly compared. For example, both chimpanzee and gorilla adults have longer upper as opposed
to lower limbs. However, during development chimpanzees achieve this difference by greater growth
of the distal radius whereas gorillas attain this difference by growth of both the radius and humerus,
resulting in a difference of adult inter-membral index (ratio between limb segments). With respect to
humans, Shea (1983) noted that differences related to bipedalism certainly do not align with concepts
of neoteny and there are allometric reasons in support of this. When examining Shea’s (1981) data, it
is clear that Pan and Gorilla have different limb proportions when compared to humans from birth.
Even though Shea’s work was published over 30 years ago and our understanding has improved since
then, these studies remain effectively the only source of information available for allometry and growth
of these species. Critically, they provide evidence that growth in specific bones for chimpanzees,
bonobos, and humans does not necessarily follow a universal pattern, an observation that has
implications for reconstructing phylogenetic relationships from growth data. This idea is quite
important for the analysis of data from the current study and no studies since have provided further
information in this regard.

17
Sequence heterochrony: the incomplete picture for chimpanzees, bonobos and humans
There has been limited discussion of sequence heterochrony for chimpanzees in a focused theoretical
manner. The only two studies which directly address the topic are King (2004) and Blomquist (2009).
Blomquist (2009) used radiographic data from Pyle and Sontag (1943), Nissen and Riesen (1949), and
Gavan (1953) to evaluate the appearance of ossification centres in hand and wrist bones relative to time
using event-pair cracking methods. He suggested that shifts in timing of ossification centre appearance
may be related to locomotory differences between chimpanzees and humans. King (2004) used
discriminant function analysis to cluster dental and epiphyseal fusion data for 16 different primate
species (species and sample size listed in Table 2.1). King’s (2004) methodology did not provide a
seriation of fusion events relative to dental development. However, the results of his discriminant
function analysis provided useful insights. Distances were determined between groups, with the
Hominidae, Hylobatidae, and Cercopithecidae families being distinguishable. Apes tended to cluster
together and chimpanzees were distinguished from gorillas.
Table 2.1 Species and sample sizes used by King (2004).
species sample sizeEuoticus elegantulus 47Lepilemur edwardsi 19Perodicticus potto 44
Propithecus verreauxi 20Aotus trivirgatus 47
Saguinus nigricollis 30Saimiri sciureus 55
Cercopithecus ascanius 66Chlorocebus aethiops 36Lophocebus albigena 80Macaca fascicularis 80
Nasalis larvatus 42Trachypithecus cristatus 101
Gorilla gorilla 78Hylobates lar 98
Pan troglodytes 86
The lack of theoretical application of sequence heterochrony aside from these studies is undoubtedly
due to the scarcity of data. As shall be explored in detail in section 2.4.6 for epiphyseal fusion in

18
chimpanzees, the present data are too limited to be able to assess epiphyseal fusion relative to dental
developmental sequences and bonobos have been even less studied. Not only is epiphyseal fusion data
lacking, but also further sequence data such as ossification and other embryological patterns. As noted
previously, dental developmental schedules for both for emergence and mineralization are known for
chimpanzees and bonobos (e.g., Boughner and Dean 2012, Conroy 1991, Kuykendall et al. 1992).
Keene (1991) provided some theoretical discussion based on tooth emergence but this did not
necessarily contribute to a changed perspective when comparing dental scheduling for the studies that
followed. Dental sequences are very useful in their own right but differences observed are limited.
How dental and skeletal systems relate to each other is necessary for a complete analysis and the data
presently available for skeletal sequences is too unrefined to provide exact sequences.
2.1.3 How this study can contribute to the theory of growth
The objective of this study, as outlined in Chapter 1, is to acquire new data such that developmental
patterns in chimpanzees and bonobos can be better understood for the purposes of assessing fossil
hominids. The intention is not to explicitly define these species within the concepts of heterochrony
but the analysis of these data implicitly ties in these theories of growth. As discussed above, models of
human and chimpanzees growth have been proffered within the context of developmental theory but
there remains some level of disagreement. In this study data on dentition, epiphyseal fusion, and long-
bone growth are collected. Dental and skeletal fusion data when combined will provide further
evidence for comparing sequences of growth in chimpanzees, bonobos and humans. The addition of
long-bone length will help define these by providing dimensional data that can be associated with
fusion events. Such data are unique to this study and may inform questions that consider fusion
sequences relative to dimensional change. Specifically, sequences may be considered with respect to
proportionate growth in length. Being able to dissociate these variables (fusion sequence and length)
from time allows for observation of these elements as a function purely of maturational development.
2.2 Organisation of sections for each species
For each of the main aspects of growth addressed in this study (epiphyseal fusion, dental development,
and long bone growth) the following topics will be addressed:
1. The underlying physiology of epiphyseal fusion, dental development, and long-bone growth;
2. A review of all prior studies for each of chimpanzees, bonobos, and humans, outlining what is known versus unknown;
3. Comparison of captive versus wild populations;
4. A review of the known effects of pathological conditions on skeletal systems.

19
It should be noted that for humans, captive and wild are not an applicable set of categories. Here, the
same types of physiological effects are discussed under the topics of stressed vs. healthy populations.
2.3 Epiphyseal fusion
In this section what is known about epiphyseal fusion plates and their function in growth will be
introduced. This will start with a brief overview of the evolved functional aspects of epiphyses
(section 2.3.1) followed by a consideration of epiphyseal fusion plate physiology (section 2.3.2).
Developing from this basis, epiphyseal fusion sequences in mammals (section 2.4.3), primates in
general (2.3.4) and lastly epiphyseal fusion sequences in Homo and Pan (sections 2.3.5-2.3.9) will be
presented.
2.3.1 The physiology of growth and fusion
Calcified bone forms on one of two types of pre-osseous templates: fibrous membranes, from which
we derive the term intramembranous ossification and hyaline cartilage, from which we achieve
endochondral ossification. The reason for two distinct types of pre-osseous template is not entirely
clear. It has been speculated that fibrous membranes may be present for more rapid ossification in long
bones (Holden 1882, Last 1973), although more recently it has been suggested that intramembranous
ossification may be a more ancestral type of ossification derived from dermal bone, and as such
endochondral ossification may have been derived from this original method of bone formation
(Morriss-Kay 2001).
Intramembranous ossification is mainly described in embryonic development, although it does actually
continue throughout life (Scheuer and Black 2000). For the purposes of studying epiphyseal fusion
sequence and timing, it is endochondral ossification at the end of the diaphysis (the shaft or mid-
section of the bone) that is observed. There is distinction between these two types of bone formation.
This is especially because long bone formation is in fact intramembranous in origin at early stages of
primary centre formation both before and after birth (Scheuer and Black 2000) and it is only later,
when it comes to describing the epiphyseal regions of joint formation when strictly endochondral
ossification is observed.
There are three distinct functional types of epiphysis: pressure, traction, and atavistic. Only the first
two of these are of significant interest in paleoanthropological and archaeological contexts. Pressure
epiphyses are necessary to allay stresses through the joint such that longitudinal growth can continue
without damage to the diaphysis (Parsons 1905, Smith 1962). The forces in joints follow geometric
increases with the size of the animal. These changes are apparent in the morphology of the epiphyseal
region as the relative area of the joint surface covered by the plate increases rapidly with age.

20
Examples of such joints include the wrist, knee, and ankle. Traction epiphyses occur at some major
muscle insertion sites such as the femoral lesser trochanter and the humeral medial epicondyle of the
humerus (Salter and Harris 1963). Atavistic epiphyses are any epiphyses that do not fall into the
previous two categories such as costal notch flakes and may have been part of structures that existed at
earlier evolutionary stages (Haines 1940, Scheuer and Black 2000).
Fusion at epiphyses is likely be triggered at least in part by hormonal influences. There is a long list of
growth factors that have been discovered linked to somatic growth in humans. Endocrine examples
include growth hormone (GH), insulin like growth factor I (IGF I), high-affinity growth hormone-
binding protein (high-affinity GH-BP) (Shea 1992, Wang et al. 1999). Determining the direct link
between these substances and epiphyseal closure is not as clear as their effect on overall body growth.
Oestrogen is known to correlate with bone maturation while testosterone correlates with cartilagenous
growth (Feuillan et al. 1999, Ogden 1979). The difference in timing of maturation in human males and
females whereby males are consistently delayed compared with females may be related to these two
hormonal influences. However, the factors that govern fusion at any particular site are likely not
controlled solely by hormonal influences (Weise 2001). Most bones cease growth at different times
with many centres, such as the clavicle in humans, fusing long after sexual maturation has occurred. A
more recent theory of local control suggests that there is no hormonal control (Nilsson and Baron
2004). Rather, fusion is mediated by entirely intrinsic factors within the growth plate whereby stem-
like cells have finite limits on growth potential. Stevens et al. (1999) provided some evidence that
supports such a theory. They transplanted epiphyseal fusion plates using allografts between
individuals of New Zealand white female rabbits, and found that fusion was mediated by the plate as
the timing of fusion was dependent on the age of the donor plate and not the recipient. This raises the
prospect of several different models. It could be that there is a standard number of cell reproductions
and oestrogen shuts this process down early while testosterone extends it. It could be that females have
fewer cells to add and oestrogen levels are purely coincidental. It may also be that females have fewer
cells and oestrogen accelerates their rate of deposition. The reality is that the true nature of this is
simply not known. However, it is likely that growth hormones play some role as evidence from
domestic animals demonstrates large effects of introduced hormones and modifications of the pituitary
gland (Scanes 1999). Irrespective of the exact nature of hormonal control, it seems that their effects
are systemic and that relative fusion timing is controlled locally with pre-programmed senecence for
each plate. In other words, growth hormones are mediators of the overall rate and duration of growth
but the plates themselves retain their particular schedule of growth cessation relative to other plates.

21
2.3.2 Epiphyseal fusion studies from the mammalian world
Mammalian skeletal elements are highly conserved and the same bony elements are present in most
species. The differences in morphology observed are the consequence of changes in length and shape
of the same elements rather than the generation of new ones. Sometimes bones are lost such as the
digits of ungulates. Long bones are generally conserved. Similar to the presence of these bones,
fusion centres are also typically conserved. Long bones always have proximal and distal epiphyses.
Metacarpals and phalanges have fusion plates at only one end for all terrestrial and marine mammals
with only notable exception being cetaceans (Ogden et al. 1981).
There have been studies of epiphyseal fusion in several different species of mammal. Sources of
current data are often derived from species of economic relevance and ease of access such as livestock
(e.g., Noddle 1974), pets (e.g., Sumner-Smith 1966, Smith 1969, Zuck 1938), and animals prevalent in
laboratories (e.g., Kaufman 1992, Weise 2001, Witschi 1962). These can problematic due to the high
level of human-related selection which has created significant genetic bottlenecks. Some species, such
as dogs, have experienced substantial modification to size and allometry and it would seem unlikely
that patterns of growth and development would remain completely unaffected. Studies of epiphyseal
fusion sequencing in wild species are less common and are also selective with respect to which
mammalian taxa are of interest. Comprehensive studies looking at the entire range of epiphyses
include North American bighorn sheep, (Walker 1987), bison (Koch 1935), grizzly bears (Weinstock
2009), and whales (Ogden et al. 1979). Primate species have also been considered (e.g., Cheverud
1981, King 2004, Wintheiser et al. 1977). Studies of specific epiphyses only include the radius and
ulna in elk (Knight 1966), fox (Sullivan and Haugen 1976) and deer (Lewall and Cowan 1963).
Studies of specific locations have considered some primate species (e.g., Michejda 1987; Newell-
Morris and Tarrant 1978; Newell-Morris et. al. 1980, Schultz 1941, Watts 1971), with King (2004)
presenting a more comprehensive study including a larger number of ossification centres in 16 primate
species.
Sample size remains the largest fundamental limitation of such studies. The analyses of these data are
also made problematic by large amounts of individual variation and sequence polymorphisms, whereby
the sequence of two events is commonly interchanged within a single species (Colbert and Rowe
2008). Larger sample sizes are required to resolve these difficulties and it is only for humans that there
is sufficiently extensive data.
King’s (2004) study using discriminant function analysis resolved differences between species within
the same taxon and also between taxa in primates. This approach considered sequences of both dental

22
and skeletal fusion which makes distinctions unclear in the sense that some of the differences may be
dental-skeletal shifts. Whether shifts are in pattern or relative timing compared to other maturational
sequences, the results are still very important. They are of particular note because the same data
collection and statistical methodology was applied to a single sample. This level of systematic
comparison does not exist for comparing other mammalian taxa to each other. Even though there is
some information available for different species, the data are too sparsely reported for overall trends to
be observed.
2.3.3 Epiphyseal fusion in primates
Primate epiphyseal fusion has been studied for a patchy array of different species and with varying
breadth of fusion centres considered. Typically the species studied have been those which are most
easily accessed or are of particular interest. For example, both radiographic and dry bone studies have
been used for Macaca mulatta and M. fuscata epiphyseal fusion centres (Hayama 1965, Michejda
1987, Van Wagenen and Asling 1958, Watts 1971). Both of these species have had their skeletal
fusion patterns studied sufficiently in depth for skeletal maturation to be compared. Hayama (1965)
and van Wagenen and Asling (1958) have suggested that there are no differences in fusion pattern and
timing between these two macaque species. Other primate genera that have been studied include
squirrel monkeys (Galliari 1988), tamarins (Glassman 1983), and baboons (Bramblett 1969). Studies
of apes include orang-utans (Schultz 1941, Winkler 1996). All of the aforementioned studies have
looked at a comprehensive survey of epiphyseal closure with the exception of Schultz (1941) and
Winkler (1996) who only considered fusions occurring in the hand/wrist. There is a lack of studies
examining fusion in gorillas and gibbons, although growth in dental and other tissues of the former
have been examined quite closely.
Patterns and trends
Research that summarises general trends in primate epiphyseal closure relies on incomplete data.
Despite this, some general modelling has been presented. With respect to the pattern of fusion, Kerley
(1966), Schultz (1940, 1944), Shigehara (1980) and Todd (1930) all remarked that there is a general
sequence for limb fusion in primates, including humans. The pattern, from earliest to latest was as
follows: elbow, hip, ankle, knee, wrist, shoulder. This included all of the epiphyses in each region.
For example, the elbow included the distal humerus and the humeral medial epicondyle. It has been
observed in humans and other primates that this sequence of commonly observed epiphyseal closure
does not vary. These commonly observed epiphyses tend to be on long-bones and with a special focus
on the wrist. Comprehensive studies are not numerous enough to find inconsistencies between regions

23
such as hand, foot, ankle, and torso fusion events. As previously mentioned, King (2004) surveyed a
larger collection of fusion sites by means of discriminant function analysis. He did not produce a
seriation of fusion events for each species, and his samples were possibly not large enough for each
species to do so with any measurable statistical confidence. However, the discriminant function
distinctions found between species suggested that enough consistent variation is present for differences
to be predicted if larger samples of epiphyses are compared between different primate taxa.
Epiphyseal fusion sequences always show consistent patterns at a species level. Deviations from the
standard pattern are known as sequence polymorphisms. These have been particularly well-
documented in humans with the most common of these highlighted in reference texts such as Scheuer
and Black (2004). In reality, sequence polymorphisms can be found for almost every epiphysis in
humans. The rates of occurrence vary depending on how temporally close together two given
epiphysis are. Schaefer and Black (2007) provided a modular sequence of fusion events for human
males that included pre- and post- event shifts. For example, the fusion of the humeral medial
epicondyle usually precedes the lesser trochanter and is preceded by the femoral head and proximal
radius. In a minority of cases this epiphysis is proceeded by the lesser trochanter or precedes the
femoral head or proximal radius (Schaefer and Black 2007). Any combination of these variations is
potentially observed in an individual. These variations in order are likely consequent of only small
differences in timing of fusion onset for closely overlapping events. Schaefer and Black’s (2007)
modular sequence for humans was observed only after after collecting data from hundreds of
individuals. Consequently, knowledge of sequence polymorphisms for other primates remains
unstudied. Observation is limited due to the impracticality of collecting data from hundreds of
skeletonized individuals. Simply determining basic sequences for limb and torso fusion is difficult
enough without sufficiently large samples.
2.3.4 Epiphyseal fusion in humans
This section will discuss the types of studies that have been conducted (radiographic and dry bone) and
will consider the methodological robusticity of these techniques. Humans of European ancestry are the
most extensively studied group and are the source of most data on epiphyseal fusion. Some research of
non-European populations has been considered and comparisons with these studies will be discussed.
Radiography and dry-bone studies
Studies of human epiphyseal fusion patterning have been carried out extensively over the past century
using both radiographic and dry-bone techniques. The use of radiographic methods has declined in
recent decades due to health concerns. Liberal use of radiographic methods in the mid-twentieth

24
century allowed for a number of longitudinal studies to be undertaken. The earliest of these examined
a series of Australian children for a larger number of fusion sites (Flecker 1932). Large scale
radiographic longitudinal studies have also been conducted including research at the University of
Colorado (e.g., Hansman and Maresh 1961), The Brush Foundation at Case Western Reserve
University (e.g., Greulich and Pyle 1959, Hewitt and Acheson 1961, Pyle and Hoerr 1955), The Fels
Institute at Yellow Springs Ohio (e.g., Garn et al. 1967), and the Oxford Child Health Survey (Tanner
et al. 1983, 2001). From these studies several roentgenographic atlases were produced, including an
atlas for the development of the hand and wrist (Greulich and Pyle 1959), the foot and ankle (Hoerr et
al. 1962), the distal humerus, proximal radius, and ulna (Brodeur et al. 1981), and the patella, distal
femur, proximal tibia and fibula (Pyle and Hoerr 1955). Tanner et al. (1983, 2001) and Greulich and
Pyle (1959) produced methodologies for assessment of skeletal age.
Cross-sectional radiographic studies have been less numerous than longitudinal studies. More cross-
sectional studies have used dry-bone, as opposed to radiography. Studies of dry bone using of skeletal
collections from archaeological sources are naturally cross-sectional. Most of the cross-sectional
studies have supplemented or evaluated the atlas methods previously mentioned (e.g., Cockshott and
Park 1983, Cundy et al. 1988). Subsequent literature produced using radiographic methods has been
conducted with the purpose of improving clinical and forensic data on radiographic assessment (e.g.,
Flores-Mir et al. 2004, Schmeling et al. 2004). These studies tend to be limited to specific regions that
are easily observed such as hand/wrist fusion.
There are some notable limitations to radiography. The method provides images with only a two-
dimensional perspective and fusion state can only be evaluated by what can be seen in this image.
There has been variation reported with respect to initiation and completion of fusion (Scheuer and
Black 2000) and it is very likely that these differences are partly due to uncertainties as a result of
methodology. McKern and Stewart (1957) consistently reported older ages for completion of fusion
for many sites on dry bone than had been reported in the radiographic literature. This effect may be the
result of final-stage fusion scars simply not being visible in radiographs. Problems with radiography
were considered in depth during the collection of early radiographic data by Mainland (1953, 1954,
1957), who looked at systematic error, variable error, and comparisons of methods of assessment of
roentgenograms. Error in radiographic studies has also been analyzed by Cockshott and Park (1983)
who looked at literature data and studies carried out at McMaster University on hand bones and the
sacro-iliac joint. Their advice was the use of a more refined statistical approach using kappa statistics
in future studies. Cundy et al. (1988) use the Greulich and Pyle method in a study looking at children

25
with leg length discrepancies, which were analysed by several radiologists using the Greulich and Pyle
atlas, finding significant variation in terms of age assessment.
The assessment techniques used in the early radiographic studies of the 1950’s and 1960’s have been
significantly criticised. Acheson (1954, 1957) pointed out that radiographic assessment techniques
required the assumption that there was a rigidly fixed order of sequence events, which biased against
variation in sequence order. Acheson also criticised the emphasis on chronological as opposed to
maturational age. Garn and Rohmann (1963) and Garn et al. (1965) showed that wrist ossification
centres in early postnatal life were not normally distributed, but were in fact quite skewed towards late
infancy. Epiphyseal union likewise showed skewedness, with much longer tails to the older side of the
distribution. Such criticisms led to the Tanner method for assessing skeletal maturity from radiographs
(Tanner et al.1983, 2001) which, instead of comparing to standardized photographs, used the addition
of bone elements to produce a maturity score. The Tanner-Whitehouse method has undergone several
revisions that are conventionally referred to as TW2 (Tanner-Whitehouse 2) (Tanner et al. 1983) and
the most recent version TW3 (Tanner-Whitehouse 3) (Tanner et al. 2001). The Tanner-Whitehouse
method for assessing skeletal maturity is presently the most commonly used for assessing skeletal
maturation from radiographs. No application of the aforementioned method has precipitated any large
change in accepted timings of fusion events in studies since the 1980s. This may be partly to do with
the decline of radiographic work but also when the data that already exists are combined with dry-bone
information, there is enough refinement for sequence timings to be estimated with an acceptable level
of precision.
A number of dry bone studies have been conducted in addition to radiographic studies, resulting in a
large body of data. Epiphyseal fusion had been observed on bones for centuries but the earliest studies
which systematically attempted to produce sequences of union were done by Stevenson (1924) and
Todd (1930). These studies used samples of European ancestry, which were not always of known-age
from the Western Reserve University (Stevenson 1924, Todd 1930). Stevenson (1924) and Todd
(1930) looked at a wide range of sites including all the proximal and distal epiphyses of long bones as
well as epiphyses on the pelvis. These were followed by a landmark study by McKern and Stewart
(1957) of older sub-adults (ages 17-23 years) from American-Korean War dead. They examined
virtually everything in the cranial and post-cranial skeleton. In the half century that followed, more
studies were conducted for all skeletal elements (e.g., Cardoso 2008, Coqueugniot and Weaver 2007,
Schaefer 2008, Webb and Suchey 1985). Modular sequence patterns whereby a seriation of fusion
events irrespective of time have been done by Schaefer and Black (2007). Summary data are available
in compiled volumes for both forensic and osteological applications such as Scheuer and Black (2004)
and Schaefer et al. (2009).

26
Comparisons of different human populations
Even though many studies have focused on humans of European ancestry, there have been number of
studies examining non-western populations. Stewart (1934) looked at Native Americans and Inuit
using dry bone observations. No substantial differences were noted at that time. The majority of non-
western population studies have been from the late twentieth century. A selection of these are listed in
Table 2.2. Most of these projects have been cross-sectional radiographic studies using the TW2 and
TW3 methodologies (Tanner et al. 1983, 2001). Studies of skeletal maturity over the last several
decades include examples from northwest India, Japan, and China (see Table 2.2). In Indian children,
multiple radiographic studies have reported union times for a variety of fusion centres. Fusion has
been evaluated using the TW2 method for the hand/wrist in large samples (Prakash and Cameron
1981) as well as in various other sites such as the proximal humerus, iliac crest, ischial tuberosity,
femoral head (Jit and Singh 1971), elbow, and wrist (Sahni et al. 1995) (Table 2.2). With respect to
differences observed, Prakash and Cameron (1981) noted that carpal maturity differed between their
Indian sample and the British standard, with girls reaching carpal maturity at the same times as British
girls, but boys showed retardation in comparison to standards for British boys. The amount of
deviation varied with age. Jit and Kaur (1989) also determined some differences between northwest
Indian and western populations in terms of timing of fusion in sternebrae, finding slightly earlier times
for different stages in the Indian populations. Differences in other populations have also been observed
using the TW2 methodology. Ashizawa et al. (1996) using a large sample of nearly 1500 Japanese
children, noted that their sample population attained adult stages one to two years earlier than Belgian
(Beunen et al. 1990), British (Tanner et al. 1983), southern Chinese (Ye et al. 1992) and north Indian
standards (Prakash and Cameron 1981, Prakash and Pathmanathan 1991).

27
Table 2.2 Studies of epiphyseal fusion sequences across different human populations.
country study sample size skeletal elements observed
India
Jit and Singh 1971 ?1.proximal humerus, iliac crest, ischial tuberosity, and femoral head
Sahni et al. 1995 149 elbow and wrist joints in girls
Prakash and Cameron 1981 298 hand/wrist
Jit and Kaur 1989 1018 fusion in sternebraeJapan Ashizawa et al. 1996 1457 hand/wrist
Belgium Beunen et al. 1990 9698 hand/wristChina Ye et al. 1992 2122 hand/wrist
1. Not defined in publication.
The differences that have been observed only relate to age of epiphyseal maturity, as opposed to
pattern of fusion. Fusion sequences between these populations did not differ. Schmeling et al. (2000)
analyzed the results from over 80 radiographic studies conducted on multiple populations, both
theoretically healthy and deprived, finding that the order of events does not correlate with specific
ethnic groups. Chronological delays of maturation observed in some studies of supposedly healthy
populations were most likely due to unforseen environmental stresses not accounted for in such
studies. Evidence from individuals of the same ethnic group maturing in different geographic regions
supports this argument (Schmeling et al. 2000).
It is notable that the majority of these studies consider only hand and wrist fusion. This anatomical
area is easy to radiograph and is routinely observed. Large-scale studies comparable to those of
western populations encompassing the complete range of fusion sites are lacking, and there is a paucity
of dry-bone studies. There are small differences in human skeletal proportions that are related to
climatic effects (Ruff 2002) such as the shorter limbs of people living in colder climates. There are not
enough complete data sets from these populations to assess whether these variations in allometry have
consequences for the sequence order of fusion, although the work of Stewart (1934) suggests no
notable deviations exist.
In most aspects of anatomy humans follow consistent patterns between populations. Given that
individual variation can lead to ambiguity in small samples, it would seem necessary that large sample
sizes would be required for any tendency towards sequence and age abnormalities to become apparent,
if they exist at all. The current data suggest that humans as a species encompassing all populations

28
demonstate a consistent pattern of epiphyseal closure. Minor variations in age of maturity have been
observed which are likely the result of adverse or beneficial environmental conditions.
Past studies on stressed populations
Even though there exist sufficient data to model healthy human populations, a discussion of the effects
of stress and nutritional deficiencies observed in humans is warranted. As shall be shown in section
2.4.6, the effects stress and nutritional deficiency are less well known for chimpanzees and bonobos.
Since humans are very closely related, the patterns observed in this species may be informative for the
study of deficiencies in Pan. This is especially relevant for osteological collections where the history
of individuals prior to death is often less clear.
There have been a number of epiphyseal fusion studies assessing living populations undergoing
nutritional stress that have considered variables such as weight, stature, cognitive abilities, dental
eruption stage and degree of skeletal maturation. The effects on growth due of different forms of
nutritional stress such as deficiencies in energy, fat, protein, and minerals are outlined by Roche and
Sun (2003). The majority of studies examining skeletal maturation have done so using only
radiographic imaging of hand/wrist fusion (e.g., Bogin and MacVean 1983, Bogin et al. 1989, Lampl
et al. 1978, Stini 1969). Studies of archaeological populations have typically looked at the effects of
nutritional stress on the pattern of dental eruption, skeletal maturity and predicted stature (e.g., Albert
and Greene 1999, Prendergast Moore et al. 1986, Stout and Lueck 1995).
Early studies found readily apparent differences. Greulich (1957) compared growth and skeletal
maturation of children of Japanese ancestry born in the United States with those born in Japan. These
data were collected not long after the Second World War when Japan was in the process of rebuilding
and nutritional standards were known to be poor. It was found that the skeletal maturity of Japanese-
born children was delayed between 6 and 24 months when compared to the American-born children
(Greulich 1957). Sex differences in maturational delay were found by Stini (1969) who examined
maturity in Columbian children experiencing nutritional stress. Males were found to be more delayed
than females. Later studies include Bogin and MacVean (1983) and Bogin et al. (1989) who looked at
Guatemalan children, finding a similar pattern of delays in skeletal maturation of the hand/wrist.
Again, males showed greater retardation when compared to females. It has become generally accepted
that nutritional stress incurs delays in skeletal maturation and that there are sex differences in the
severity of these delays. Males appear to be more susceptible to stress delays than females (Stinson
1985, Wells 2000). Studies in other animals also suggest that this pattern is true for many different
species (Katz 1980, Lucas 1998, Smart 1977, 1986). Why this disparity exists has been the subject of

29
debate. It has been suggested that the ability to buffer environmental stress is more critical for females
due to reproductive demands. Attempts have been made to fit this into the Trivers-Willard hypothesis
(Trivers and Willard 1973), where there is genetic selection to favour male health in good
environments and male morbidity in bad environments. Evidence from studies looking at sex ratios in
various socio-economic groups appears to support this theory (e.g., Almond and Edlund 2007).
Another very important observation of stressed populations is that post-cranial skeletal maturation is
affected more severely than dental maturation (Cardoso 2007, Garn and Rohmann 1966, Lasker 1969,
Roberts 1981). Dry-bone archaeological studies where multiple maturational indicators have been
analyzed often show this pattern (e.g., Prendergast Moore et al. 1986). The effect of nutritional
deficiencies on the development of the dentition is discussed in section 2.5.2. In osteological research
the use of dental age in sub-adults is often preferred to skeletal age when a population is assumed to be
under stress (Ubelaker 1987, 1989). In the absence of other evidence, when an individual shows much
more advanced dental development when compared to skeletal age, it may be reasonable to consider
that there may be something problematic occurring.
Summary of human epiphyseal fusion
For humans there is a large body of data charting the timing and pattern of epiphyseal fusion. These
data are derived from both radiographic and dry-bone studies which when combined have provided a
reasonable degree of precision in estimation as well as demonstrating the types and level of variation
between individuals. Populations have been found to vary slightly with regards to chronological
timing of fusion but not sequence. Most of this variation has been considered to be more likely a result
of unforseen environmental factors than genetic ones. Nutritional stress has an effect on the timing of
fusion but not the overall pattern, with delays appearing to slow down the entire system. Skeletal
growth is more susceptible to nutritional stress than dental development.
2.3.5 Epiphyseal fusion in chimpanzees
There have been both radiographic and dry-bone studies examining epiphyseal fusion in wild and
captive chimpanzees, in addition to one histological study (Kerley 1966). These studies have varied in
the breadth of epiphyses considered and sample sizes used. The earliest work was done by Schultz
(1940) who noted that long bone epiphyses fused between the ages of 7 and 11 years. Kerley’s (1966)
histological work used a sample of known-age chimpanzees to observe epiphyseal maturation in 12
femora and 8 humerii. Kerley’s (1966) sample also provided radiographic observations of epiphyseal
fusion for other epiphyses which will be discussed below in the context of Bolter and Zihlman’s (2012)
study. Subsequent radiographic and dry-bone work has been completed for specific sites. For

30
example, radiographic studies of hand/wrist and foot epiphyseal fusion centres include Hamada et al.
(1998), Hamada and Chatani (2003), Nissen and Riesen (1949a,b), and Watts (1971, 1985) using
captive populations. Table 2.3 provides a list of studies that include epiphyseal fusion and the regions
that were assessed.
Table 2.3 Previous studies of Pan troglodytes epiphyseal fusion.
skeletal region study type of study sample sizehand/wrist Gavan 1953 radiographic 16hand/wrist and foot Hamada et al. 1998 radiographic 65
Hamada and Chatani 2003 radiographic 12Nissen and Riesen 1949a,b radiographic 16Watts 1971, 1985 radiographic ?1.
olecranon, proximal and distal humerus Schultz 1940 dry-bone 63
distal epiphyses of limb bones Winkler 1996 dry-bone 10histology of distal humerus, acetabulum and acromial process Kerley 1966 histological 30
multiple post-cranial fusion sites Bolter and Zihlman 2012 dry-bone 10(more than one region of the skeleton) Kerley 1966 radiographic 10
King 2004 dry-bone 86Zihlman et al. 2007 dry-bone 22
1. These values have not been obtained.
It is evident from Table 2.3 that the majority of past studies of specific skeletal elements have focused
on hand/wrist and easily observable limb epiphyses. The lack of diversity in different skeletal
elements among different studies has meant that a cohesive picture of fusion cannot be ascertained by
combining results. There is also a mixture of radiographic and dry-bone research, with radiographic
observation exclusive to hand/wrist fusion. The differing sources for the samples of each of these
specific element studies also leaves open the possibility of inconsistency between samples due to
unanticipated environmental variables such as nutritional stress.
There have been only four mutiple post-cranial fusion site studies, these being Bolter and Zihlman
(2012), Kerley (1966), King (2004) and Zihlman et al. (2007). As noted previously, King (2004) was
not concerned with producing a seriation of fusion events or estimating ages, but rather with placing
chimpanzees in the context other primates using discriminant function analysis. As such he made no
contribution to describing the pattern of fusion in chimpanzees other than providing insights as to what
should be expected given known patterns in other primates. Chimpanzees clustered apart from African
monkeys and were distinct from gorillas. The limitation of including both dentition and epiphyseal

31
fusion in the analysis is that it was not possible to determine if these distinctions stemmed from dental
or epiphyseal fusion sequence differences. With fusion patterns not explicitly defined in other species
it is not possible to deduce fusion patterns in chimpanzees by these observations alone.
Of multiple skeletal region studies, the study that provided information for the most comprehensive list
of epiphyses was Kerley (1966) who listed state of fusion for 31 different epiphyses (Table 2.4).
However, the determination of fusion sequences in this study was fundamentally limited by sample
size for younger age ranges and the number of individuals used for assessing these epiphyses was only
10, as opposed to the entire sample used for histology which was 30. For most epiphyses only one or
two individuals was observed to be fusing and for 7 epiphyses no individuals were observed as fusing
at all. As such, Kerley’s (1966) data only provides very approximate ages for fusion of elements other
than those of later stage. For those of later stages, typically only 5 or 6 individuals contributed data,
although with a high degree of overlap sequences were not discernable.
Table 2.4 Fusion centres observed by Kerley (1966).
fusion centres observed by Kerley (1966)proximal humerus lumbar vertebraedistal humerus iliac cresthumeral medial epicondyle triradiate
proximal radius ischiumdistal radius femoral headproximal ulna greater trochanterdistal ulna lesser trochantermetacarpal heads 2-5 distal femurphalanges (hand) proximal tibiamedial border of scapula distal tibiaacromium proximal fibulacoracoid distal fibulamedial clavicle calcaneusribs metatarsal heads 2-5cervical vertebrae phalanges (foot)thoracic vertebrae
Kerley’s (1966) data were very useful for suggesting which epiphyses fall later within the sequence of
fusion. These epiphyses were clearly the proximal humerus, the medial border of the scapula, the
ischium, the iliac crest, and the medial clavicle. However, Kerley’s sample was derived purely from
captive individuals while Zihlman et al.’s (2007) more recent work has added comparison with wild
individuals for a more limited number of epiphyses. The epiphyses recorded by Zihlman et al. (2007)
are shown in Table 2.5.

32
Table 2.5 Fusion sites recorded by Zihlman et al. (2007).
bone epiphysis
pelvis
ischio-pubic ramusilium to pubisilium to ischiumpubis to ischium
humerusproximalmedial1.
distal
radius, ulna, tibia, fibulaproximaldistal
femurgreater trochanterlesser trochanterdistal
1. It is assumed here that medial implies the humeral medial epicondyle.
Zihlman et al.’s (2007) sample consisted of 22 individuals, although those that had observable fusion
and dental features reduced the measured sample to 9. The estimated age of these individuals relied on
tooth emergence which only provided ranges of estimated age. These data did provide some basic
dental landmarks by which point fusion had occurred for certain epiphyses based on single individuals.
For example, for one individual that had emergence of the permanent canine (approximate age 10.5 to
12.5 years) the triradiate, proximal femur, and distal humerus had all fused. The basic trends that these
data could produce were limited to the obervations in Table 2.6.
Table 2.6 Zihlman et al.’s (2007) skeletal maturity in wild chimpanzees.
skeletal element wild (years)
distal humerus fully fusedfemale1.: before 12.5male: before 13.5
acetabulum fully fusedfemale2.: before 12.5male: before 14.5
distal femur fully fusedfemale: before 16.5male: before 14.5
humeral head fully fusedfemale: before 16.5
male: before 14.5
1. Missing data for one of the three individuals sampled (aged 10.5)2. Missing data for one of the three individuals sampled (aged 10.5)

33
Bolter and Zihlman (2012) provided further data from 5 captive individuals, used for a comparison
with Pan paniscus. They also provided a comparative table for the epiphyses observed including
Kerley (1966). This comparison is reproduced in below in Table 2.7.
Table 2.7 Reproduced comparison of estimated ages for fusion events in Bolter and Zihlman (2012), Kerley (1966), and Zihlman et al. (2007) as presented by Bolter and Zihlman (2012).
skeletal elementBolter and Zihlman 2012, captive, age in
years, N = 5
Kerley 1966, captives from Yerkes, age in
year, N = 101.
Zihlman et al. 2007, wild from Tai National Park,
age in years, N = 9ischio-pubic ramus <0.83 years n/a 0.74< x <3.76
distal humerus <6.74 partial 6–7 7.96b< x <10acetabulum <6.74 partial 7 5.19< xc <11.38
proximal radius 7.3d partial 9 11.38< x <12coracoid 7.3< x <8.54 partial 9 10< x <11.38
proximal femur 7.3< x <8.54 partial 9 11.38< x <12distal tibia <8.54 partial 9 11.38< x <12
proximal tibia partial 8.54 partial 9-14 >12humeral head 8.54< x <11.68 partial 9-14 >12
acromial process 8.54< x <11.68 <10 >12iliac crest partial 11.68 partial 9-14 >12
1. Bolter and Zihlman’s (2012) comparison was with the same size present for these epiphyses only. Kerley (1966) had small amounts of data for epiphyses that Bolter and Zihlman (2012) did not analyse, although these were very limited to only a few individuals.
Zihlman et al. (2007) suggested that older ages of fusion were being observed in their sample. It could
be argued given the ranges presented by Kerley (1966) and Bolter and Zihlman (2012) that the ‘real
world’ population ranges for captive and wild could easily overlap. With such small sample sizes there
were no statistical means to test these assertions. It is worth noting that Bolter and Zihlman’s (2012)
captive sample produced ranges younger than Kerley’s (1966) captive sample, potentially indicating
the level of variability between small-sample studies.
It is worth noting the level of agreement between specific element studies and the mutiple skeletal
region studies considered above. The timings observed in these radiographic studies are generally
consistent with the captive range presented in Bolter and Zihlman (2012) and Kerley (1966).
Radiographic studies have always only considered captive individuals.

34
Sex differences
Prior studies have not considered sex differences either for the specific elements observed in
radiographic studies, or in the multiple skeletal region studies with the exception of Zihlman et al.
(2007). They noted differences in chronological age of fusion for the epiphyses observed. It is likely
that sample size limitations have prevented meaningful comparisons by sex. The ranges of fusion in
terms of years likely overlap and sufficiently large samples are required. There is no comprehensive
analysis suggesting differences in sequence between sexes.
Summary
To summarize chimpanzee epiphyseal fusion data, there exist data providing probable ranges of time
for fusion of specific elements. Hand/wrist fusion timing has been studied relatively extensively and
estimations of timing may be obtained from the aforementioned radiographic studies in Table 2.3.
More comprehensive studies of epiphyseal fusion provide wider ranges of fusion timing and are reliant
on small sample sizes. Landmark ages by which certain fusion events are likely to have occurred have
been proposed but no more precise sequence of events has been observed due to the limitations of the
data.
2.3.6 Epiphyseal fusion in bonobos
The data for skeletal maturation in Pan paniscus are much more limited than what exists for its
congeneric Pan troglodytes. The only study that has focused on bonobo epiphyseal fusion is Bolter
and Zihlman (2012) which was based on only 8 individuals. Five of these were from captivity and of
known age at death (0.83, 6.74, 7.30, 8.54 and 11.68 years respectively). The remaining three were
wild caught and of unknown age. They were aged using dental eruption (Bolter and Zilhman 2012).
The spread of ages of these individuals could be considered conducive to a ‘snapshot’ approach of
different developmental stages. However, with several year gaps between individuals, especially
between later years, this approach was only able to provide very broad estimates. The exact sequence
of fusion remained unspecified.

35
2.3.7 Comparisons between chimpanzees and bonobos
The aforementioned study by Bolter and Zihlman (2012) is the only comparison of skeletal fusion
between the two species that has been completed. As mentioned in section 2.3.6, the timing of fusion
for bonobos was derived from a small sample (N = 8). The only information these data could provide
were some generalized timings of fusion over a period of several years. These data are reproduced in
Table 2.8. It should be noted that only 5 of the 8 bonobos observed by Bolter and Zihlman (2012)
were used for the comparison and were the ones of known age from captivity.
Table 2.8 Data comparing chimpanzee and bonobo epiphyseal fusion reproduced from Bolter and Zihlman (2012).
skeletal element
Pan paniscus Pan troglodytes Pan troglodytes
captive, age in years (N = 5)
captive from Yerkes, Kerley 1966, age in years
(N = 10)
Wild from Tai National Park, age in years (N = 9)
ischio-pubic ramus before 0.83 n/a 0.74 to 3.76distal humerus before 6.74 partial 6–7 7.96 to 10acetabulum before 6.74 partial 7 5.19 to 11.38proximal radius 7.3 partial 9 11.38 to 12coracoid process 7.3 to 8.54 partial 9 10 to 11.38proximal femur 7.3 to 8.54 partial 9 11.38 to 12distal tibia before 8.54 partial 9 11.38 to 12proximal tibia ≈ 8.54 partial 9-14 after 12humeral head 8.54 to 11.68 partial 9-14 after 12acromial process 8.54 to 11.68 <10 after 12iliac crest ≈ 11.68 partial 9-14 after 12
Bolter and Zihlman (2012) concluded that fusion timings for chimpanzees and bonobos appear to
overlap and that the pattern is very similar. They suggested that there may be some slight differences
in timing of fusion of the knee joint and the hip between the two species, although there were only two
Pan paniscus individuals used to make this assessment. What may be drawn from this study is that
any substantive deviations in patterning between these species should not be expected. All other
evidence of ape and other primate skeletal maturation discussed to this point would support this.
Bolter and Zihlman’s (2012) study is a good starting point although limited by sample size. There still
remain no studies that compare the two species using more precisely estimated times for fusion.

36
2.3.8 Comparisons between chimpanzees, bonobos and humans
Comparisons between chimpanzees and bonobos have been noted in the previous section (section
2.3.7) and it has been assessed that based on the data from Bolter and Zihlman (2012) that the two
species are likely similar in pattern given the limited evidence. As far as the state of current research,
bonobos fit within a Pan pattern of maturation as set by Pan troglodytes. As such, comparisons of
either Pan species to humans are expected to demonstrate the same results. It may be noted that there
have been no direct comparisons of bonobo epiphyseal maturation to humans. Given this assumption
of equivalence for skeletal maturational patterns in Pan, there remains only one comparison in which
analysis within the literature may be explored and that is between chimpanzees and humans.
Comparing chimpanzee and human epiphyseal fusion patterns using prior studies is complicated by the
differing rates of growth relative to chronological years. Chimpanzees have a shorter overall growth
period and a more linear rate of growth (e.g., Hamada et al. 1996, Hamada and Chatani 2003, Shea
1981). These differences have effects on the relative timing of epiphyseal fusion events in terms of
calendar years. Differences in growth rate and duration introduce inherent problems for studies only
looking at single or a few epiphyses. In theory, attempting a proper comparison would require time to
be scaled to see if fusion events occur at the same point of growth. The human growth curve has for
some time been known to require a minimum of several polynomials to model (Bock and Thissen
1976, Karlberg 1985) and there exists no quantified functional relationship comparing the two species
aside from illustrations of growth curve shape. When it is known that the functions are not exactly the
same, which indeed they are not, there is no way of knowing if these events are scaled or if they are
distorted without the use of a higher-resolution growth parameter that may be scaled to chronological
years. The relationship between dental mineralization and chronological years is well-known for
chimpanzees but this approach has not been taken for the aforementioned studies of chimpanzee
epiphyseal fusion. This may potentially be a consequence of logistical constraints for radiography.
Irrespective of whatever reasons may be behind this, only dental emergence reference points are
available which provide a much more coarse approximation to age due to this method only producing
groupings of epiphyses by periods of years between emergence events. Potentially as a result of the
limitation of growth rate differences between the species, single-region studies simply report the ages
at which these events occurred without considering comparison to humans. Multiple skeletal-region
studies (Bolter and Zihlman 2012, King 2004, and Zihlman et al. 2007) have had more potential to
make comparison to humans at the levels of sequences but none have had sufficient data to complete
such an analysis. King’s (2004) methodology did not include human data and focused on sequence
relationships within other primate lineages. Bolter and Zihlman (2012) focused exclusively on

37
chimpanzees and bonobos. Zihlman et al. (2007) provided ranges of fusion for the individuals in the
sample but their study was more concerned with discussing the differences between males and females
and comparisons between wild and captive animals. Kerley (1966) was the only study that made direct
comment on comparing chimpanzee to human epiphyseal fusion using original data. Kerley (1966)
suggested that fusion times for the acetabulum, the distal humerus, and the acromial process may be
earlier in sequence for chimpanzees than that reported for humans. Kerley’s (1966) data set was too
small to test this assertion.
2.4 Dental development
The study of dental development is both a complex and diverse topic. The use of such information for
this study is limited to understanding mineralization and estimated chronological ages of attainment for
particular mineralization stages. However, functional morphology and other such parameters such as
emergence do play a role in determining selective pressure on growth patterns and as such this section
will situate chimpanzee, bonobo, and human dental development within general primate dental
patterns. There are known differences between chimpanzee, bonobo and human dentition with respect
to emergence chronology and mineralization (Boughner and Dean 2012, Kuykendall and Conroy 1996)
and these must be clarified for comparisons to be made. Further study including dental emergence
may also shed light on sequence differences.
2.4.1 Primate dentition and dental development
The depth of information avaliable about primate dentition is variable, depending greatly on species
and genera. The largest body of data pertain to great apes. However, general dental patterning and
emergence has been assessed in a variety of species.
2.4.1.a Dental formula
Compared to other mammalian groups, the dental formula of primates has shown reduction in tooth
number over time (Martin 1990). Extant primate dentition follows a pattern with a maximum number
of teeth in each category for incisors, canines, premolars and molars of 2.1.3.3. Platyrrhine species
show either 2.1.3.2 or 2.1.3.3 while catarrhines follow 2.1.2.3 (Fleagle 1998, Kinsey 1997). Being
catarrhine primates, chimpanzees, bonobos, and humans all share the same dental formula.
38
2.4.1.b Morphology
Primate dentition can be morphologically distinct depending on dietary adaptations (e.g., Fleagle and
McGraw 1999, Kinzey 1984, 1992). Primate diets vary from folivory to frugivory and various types of
omnivory (Fleagle 1999, Nystrom and Ashmore 2008). An analysis of these differences is not directly
relevant in the context of this study but it is important to describe morphological differences related to
the species used in this study. Chimpanzees and bonobos have more substantial canines when
compared to humans. Aside from this one marked difference, the morphology of the dentition is
largely similar apart from some minor variation in cusp patterns and some differences in enamel
thickness. This likely relates both to recent ancestry and all three species retaining an relatively
omnivorous dietary pattern. Chimpanzee and bonobo dentition is also much larger than that of humans
as a proportion of body size and facial dimensions, resulting in significant prognathism. Human dental
morphology is atypical of a primate species with regards to dimensions and level of non-metric and
morphological variation. Size differences may be due to the effects of craniofacial reduction
(Bermúdez De Castro and Nicolas 1995, Calcagno and Gibson 1988).
2.4.1.c Emergence
A general sequence of emergence for primates was reported by Schultz (1935) and was determined
using a number of primate genera including Cebus, Ateles, Papio, Cercopithecus, Pongo, Hylobates,
Pan and Gorilla, using dry-bone observation. This sequence, from earliest to latest, followed the
pattern of second decidous molar, first molar, central incisor, lateral incisor, second molar, premolars,
canine, and lastly, third molar. This pattern became and has generally remained accepted as a general
sequence of primate dental development with further studies refining this using larger sample sizes.
General sequences are to be expected among groups of related species but differences appear when
observing individuals species in further detail with regards to such variables as crown and root
completion times and scheduling relative to other ontogentic events. There are few species where this
level of detail is available. It should be noted that humans diverge from this pattern in unusual ways, a
fact that is reviewed in section 2.4.2.
2.4.1.d Radiographic and other studies
More detailed study of particular primate species has been done for organgutans (e.g., Beynon et al.
1991, Dean and Wood 1981), gorillas (e.g., Beynon et al. 1991, Kelley and Schwartz 2010, Simpson
et al. 1992), chimpanzees (e.g., Kuykendall et al. 1992, Kuykendall and Conroy 1996, Nissen and
39
Riesen 1964, Zihlman et al. 2004), macaques (e.g., Nass 1977), and baboons (e.g., Dirks et al. 2002,
Phillips-Conroy and Jolly 1988). These include radiographic and histological studies with some
studies looking at known-age samples. Humans have been intensively studied with regards to
emergence and mineralization patterning as well as chronological scheduling.
2.4.2 Dental development in humans
In the following sections (2.4.2, 2.4.3 and 2.4.4) chimpanzee, bonobo, and human dental development
is considered in greater detail. Provided is an overview of what is known regarding emergence,
mineralization and chronological scheduling. Several variables known to affect dental development in
these species are also introduced. Sex differences and population differences have been examined, as
well as wild versus captive, or in the case of humans, nutritionally stressed versus healthy populations
have been considered and these variables are known to have effects.
2.4.2.a Human dental development
Dental development in humans has been extensively analysed in both the clinical and anthropological
literature. Patterns for mineralization, emergence, and chronological scheduling of permanent teeth are
well known. Histological analysis considering perikymata has also been pursued (FitzGerald 1998,
Huda and Bowman 1995). Large sample statistics were compiled in the mid-twentieth century by
researchers such as Moorrees et al. (1963) and Simson and Kunos (1998) among others. This wealth
of information is compiled in reference texts such as Scheuer and Black (2000) and Schaefer et al.
(2009) as well as countless anthropological textbooks such as White (2000). Methods evaluating the
morphology and dimensions of teeth either by radiographic of dry-bone observation include Demirjian
(1973), Liversidge et al. (1998), and Smith et al. (1994).
2.4.2.b Differences by sex in humans
In humans there are well-documented differences in developmental timing between males and females
(Demirjian and Leveseque 1980, Lewis and Garn 1960, Liversidge 2003, Scheuer and Black 2000).
Males are consistently delayed relative to females. These delays correspond to equivalent deviations in
skeletal development and attainment of maturity (Scheuer and Black 2000). Differences between the
sexes relate only to timing of development as opposed to pattern. Such differences are consistent for
emergence and root completion, for which there is ample data from both categories.

40
2.4.2.c Human intra-species differences
Variation of both emergence and root completion in both sexes has been explored in multiple
populations (e.g., Simpson and Kunos 1998, Liversidge and Speechly 2001, Monge et al. 2007).
Significant differences in terms of timing have been found between different populations and slight
variations in relative timing of sequences have been shown. These differences are often not without
dispute as there are clearly sources of error from both unforseen variables in the sample populations
such as nutitional and environmental stresses and problems with variable application of methodology.
Comparisons of the application of certain methods such as the Demirjian method have been made
using different populations (e.g., Koshy and Tandon 1998, Liversidge et al. 2006, Nykänen et al 1998,
Teivens and Mörnstad 2001b) as well as refinement and comparison to other methods (Chaillet and
Demirjian 2004, Teivens and Mörnstad H. 2001a). The true nature of population differences may be
difficult to confidently articulate. Liversidge and Speechly (2001) evaluated ethnically British children
in comparison to ethnically non-British children in the UK and found no significant differences. Reid
and Dean (2006) considered enamel striae of retzius in African and European populations finding that
these populations largely overlapped. They concluded that histological analysis of enamel
mineralization showed less variation than radiographic methods.
For the purposes of this study it is assumed that the differences between populations is not significant
for the application of the Demirjian method and that there exists a standard human pattern. Differences
for each sex will be taken from those formulas used by Demirjian for comparison to chimpanzees and
bonobos.
2.4.3 Dental development in chimpanzees
Data exist for both wild and captive chimpanzees. Radiographic, dry-bone, and histological studies
have been pursued. Dry-bone studies on emergence include Conroy and Mahoney (1991), Kuykendall
et al. (1992) and Nissen and Riesen (1964) among others. Emergence sequence patterns are
established for both wild and captive populations (Smith et al. 2013) with considerations of differences
between wild and captive emergence timings (Smith and Boesch 2011, Smith et al. 2010).
Histological work on chimpanzee dentition has been done by Smith et al. (2007). Radiographic studies
have improved the overall picture of dental development (Anemone et al. 1991, Dean and Wood 1981,
Smith et al. 2010). Studies using known-age individuals include Kuykendall (1996) and Kuykendall
and Conroy (1996). These studies used the Demirjian method on captive populations and provide a
chronological age estimation for individuals based on root development for both summary scores and
individual tooth scores. Comparisons between histology and radiographic studies have suggested that

41
radiographic estimations are largely correct, although they tend to underestimate age slightly (Reid et
al. 1998). The sequence of complete root mineralization in chimpanzees has been found to be M1 I1
I2 P3 P4 M2 C M3 (Kuykendall 1996) and the sequence of emergence M1 I1 I2 M2 P3 P4 C M3
(Conroy and Mahoney 1991).
2.4.3.a Captive vs. wild
It has been suggested that there exists a difference between wild and captive individuals with regards to
mineralization as well as emergence. Zihlman (2004) compared Kuykendall’s (1996) assessment of
captive ages and suggested that there are differences in development in terms of chronological age of
maturation between wild and captive specimens. Smith et al. (2010) have challenged this finding
whereby some of the ages of the wild specimens were questioned and it was suggested the
Kuykendall’s (1996) ages were still very applicable for wild samples. Based on evidence from
humans, it would be expected that differences in diet and stress would have an impact on the
chronological timing of development. The precise nature of the delays debated by Smith et al. (2010)
are interesting. It is important to recognise that the delays between captive and wild specimens are not
extreme and there is no evidence to suggest changes in sequence pattern. Both captive and wild data
are equally as applicable in this regard.
Table 2.9 Data from Zihlman et al.’s (2007) dental delays of wild chimpanzees.
tooth emergence wild chimpanzees (Taï) (years) captive chimpanzees (years)M1 ~ 4 2.7 – 4.1(1)
M2 ~8 5.3 – 7.3(1)
M3 ~12.5 no data available (10.5(2))
1. Conroy and Mahoney 19912. Estimated from Schwartz et al. 2000
2.4.3.b Sex differences in chimpanzees
Differences in dental development between males and females are documented for developmental
timing (Kuykendall 1996, Kuykendall et al. 1992). It is evident that the overall pattern of dental
development is effectively the same for males and females but that the chronological timing of
development is consistently delayed in males (Kuykendall 1996). The only exception to consistency in
pattern may be the canine where there appear to be larger relative delays in development in males. It
has been suggested that emergence timing differences are consistent with this male pattern of delayed
chronological development (Zihlman 2004).

42
2.4.3.c Population differences in chimpanzees
Variation in dental developmental patterning for chimpanzees sub-species has not been extensively
studied apart from some very simple observations such as molar morphology (Swindler et al. 1998).
Many of the studies determining Pan troglodytes dental emergence and mineralization patterns have
used samples with a mix of individuals from different sub-species. When considering that the
aforementioned studies of chimpanzee dental development largely agree with each other and use
individuals from all different sub-species, it would be expected by inference that any direct comparison
of population sub-groups would most likely show no large deviations. For the purposes of this study,
we will assume that there are no differences.
2.4.4 Dental development in bonobos
There is sufficient information available on bonobo dentition to provide a confident assessment of
dental development. Research that has been conducted includes histology (Ramirez and Lacruz 2007),
radiographic studies (e.g., Boughner et al. 2012, Dean and Wood 1981), and emergence (Bolter and
Zihlman 2011, Kinzey 1984). Bougher et al. (2012) and Dean and Wood (1981) did not use samples
of known age for detemining mineralization sequence. However, there is sufficient data in terms of
chronological landmarks such as molar emergence timing to harmonize mineralization pattern and
chronological age with some degree of certainty.
2.4.4.a Sex differences in bonobo dentition
Direct comparisons between males and females with respect to chronological timing have not been
made. Boughner et al.’s (2012) study had sufficient sample size to test for overt differences in
sequence between males and females but this study did not pursue this approach. In this context
‘overt’ is given to mean highly consistent differences as opposed to small variations in frequencies of
certain polymorphisms which may often be difficult to discern, even in much larger studies. Given the
combined nature of Boughner et al.’s (2012) sample it appears that it was assumed that this species did
not show differences between the sexes. There is no further evidence that there are differences in
either timing or sequence of dental development between males and females in bonobos.
43
2.4.4.b Sequence differences between studies of bonobo dentition:
Ramirez et al. (2007) found slightly different results to Boughner et al. (2012) but these may have been
consequent of the sampling methods using mandibular vs. maxillary teeth, with the maxilla tending to
show more advanced development. There were also some slight contradictions in the results between
Bolter and Zihlman (2011) and Boughner et al. (2012). Bolter and Zihlman (2012) found the sequence
[M1 I1 P4 M2 I2] P3 C M3 for the mandibular dentition while Boughner and Dean (2012) determined
the sequence to be M1 I1 I2 [P3 P4] M2 C M3. In this context [] enclose teeth that may show
sequence polymorphisms, or in other words, changes in sequence order. Those teeth outside the
brackets do not vary in order. Again, these differences may be the result of sample size issues with
that of Boughner and Dean (2012) being substantially larger.
2.4.4.c Population differences in bonobo dentition
There are no studies that exist that compare different populations of Pan paniscus. It is inferred and
may be expected that no substantial population variability is likely to be observed due to the much
more restricted range of this species.
2.4.5 Comparisons between chimpanzees and bonobos
It has been suggested that the pattern of dental development in bonobos does not differ significantly
from chimpanzees (Boughner and Dean 2004 and Boughner et al. 2012). Minor variations in
emergence and mineralization sequence have been reported between chimpanzees and bonobos.
Boughner et al. (2012) found that in bonobos the P3 began to mineralize before the canine whereas in
chimpanzees the canine and the P3 mineralized at the same time. They found that these differences
were only characterised for the initiation of mineralization but not the completion sequence of teeth. A
possible exception was that the P3 and P4 completed mineralization at the same time in Pan paniscus,
while there was an offset in Pan troglodytes with P3 completing before P4. Table 2.10 illustrates
differences in completion timing found in emergence and mineralization. It should be noted that this
table does not indicate reported polymorphisms for the sake of simplicity, and the level of
polymorphisms do vary between studies.

44
Table 2.10 Sequence variations in completion order reported for mandibular Pan paniscus and comparison to Pan troglodytes.
species (study) order1st 2nd 3rd 4th 5th 6th 7th 8th
P. paniscus emergence (Bolter and Zihlman 2011) [M1 I1 P4 M2 I2] P3 C M3
P. paniscus emergence (Kinzey 1984) M1 I1 M2 [I2 P3 P
4] C M3
P. paniscus mineralization (Boughner et al. 2012) M1 I1 [I2 P3 P4] M2 C M3
P. troglodytes mineralization (Kuykendall 1996) M1 I1 I2 P3 P4 M2 C M3
P. troglodytes emergence (Conroy and Mahoney 1991) M1 I1 I2 M2 P3 P4 C M3
Boughner et al. (2012) compared bonobos to chimpanzees and determined that there were no
statistically significant differences between the two species with regards to root mineralization pattern.
This finding allows for the application of the same scale of dental score to both Pan paniscus and Pan
troglodytes. It should be noted that individual variation, although not statistically significant, does
show some patterning with the delay of the second incisor in bonobos relative to chimpanzees. This
was also noted by Kinzey (1984). In addition it appears that there is some consistency in the deviation
between the emergence of M2 and the mineralization of M2 in both species.
The data for bonobos explored by Boughner et al. (2012) did not use individuals of known age.
Present knowledge of the chronological timing of dental development relies solely on Bolter and
Zihlman (2011, 2012). Similarly to other overall observations of growth and development,
chimpanzee and bonobos dental development appears to follow effectively the same chronologic
scheduling of dental development.
2.4.6 Comparisons between chimpanzees, bonobos and humans
Given the previous comparison of chimpanzees and bonobos, these species will be considered to be
effectively the same with regards to emergence timing and mineralization sequences. Comparisons
between chimpanzees and humans considering both timing and sequence of mineralization have been
made in the past. Comparisons for these two species also exist for for timing and sequence of dental
emergence.

45
2.4.6.a Emergence and mineralization
For mineralization, Kuykendall and Conroy (1996) noted some significant shifts in sequence between
chimpanzees and human dental mineralization. Notable was the delayed crown formation of the
canine and the earlier maturation of the first molar in chimpanzees. For the canine, this was potentially
a result of the difference in size of these teeth between the two species. The difference was quite
extreme, with chimpanzees having substantially larger canines. There were also some other very
important differences. Table 2.11 demonstrates human, chimpanzee, and bonobo emergence and
mineralzation sequences. It is evident that there is also a polymorphism for M1 and I1 in humans from
one study (Garn 1987). The second molar also deviates later in sequence in humans compared to
chimpanzees and bonobos.
Table 2.11 Chimpanzee, bonobo, and human emergence and mineralization sequences.
species/studyorder
1st 2nd 3rd 4th 5th 6th 7th 8th
P. paniscus emergence (Bolter and Zihlman 2011) [1.M1 I1 P4 M2 I21.] P3 C M3
P. paniscus emergence (Kinzey 1984) M1 I1 M2 [I2 P3 P4] C M3
P. paniscus mineralization (Boughner and Dean 2012) M1 I1 [I2 P3 P4] M2 C M3
P. troglodytes mineralization (Kuykendall 1996) M1 I1 I2 P3 P4 M2 C M3
P. troglodytes mineralization (Kuykendall and Conroy 1996) M1 I1 I2 [P3 P4 M2
] C M3
P. troglodytes emergence (Conroy and Mahoney 1991) M1 I1 I2 M2 P3 P4 C M3
H. sapiens emergence (Haavikko 1970) I1 M1 I2 C P3 P4 M2 M3
H. sapiens mineralization (Demirjian and Levesque 1980) I1 M1 I2 C P3 P4 M2 M3
H. sapiens mandibular eruption (Smith and Garn 1987) [M1 I1] I2 [C P1] [P2 M2] -
1. Teeth for which polymorphisms occur are bracketed by [,].
2.4.6.b Polymorphisms
Changes in sequence order of specific teeth found in an individual relative to the expected pattern for
their species are referred to as polymorphisms. Humans have been the most extensively studied
species for this phenomena and some regularities have been observed. Sequence polymorphisms have
been reported by Diamonti and Townsend (2003), Garn et al. (1973), Liversidge and Speechley (2001),

46
Nonaka et al. (1990), and Smith and Garn (1987). These studies have often used quite larges samples.
For example, Smith and Garn (1987) looked at human sequence polymorphisms in a large sample of
6,000 black and white Americans. They found polymorphisms for the mandible at [M1 I1] I2 [C P1]
[P2 M2] with [M1 I1] shifts the most common. Diamonti and Townsend (2003) found similar results
using a sample of 8,676 children from Australia whom were said to be typically of European ancestry.
Studies of children from other populations include South Asians (Kaul et al. 1975), Japanese (Nonaka
et al 1990), Malays (Hussin et al. 2007) among others. The prevalence rate for the [M1 I1]
polymorphism appear to vary from 30% to 50%. The [C P1] [P2 M2] polymorphisms appeared in all
groups but less frequently and consistently. The aforementioned studies of other populations have
tended to find similar results. Many of the differences observed in these studies have been criticized
for inconsistencies in definitions and methodological considerations such radiographic observation
techniques (Braga and Heuze 2007).
It is clear that human teeth are suceptible to sequence changes of emergence with relatively high
frequencies. The frequency of sequence changes in chimpanzees and bonobos is less clear when
considering the studies in Table 2.11. Neither mineralization sequences or polymorphisms agree
between studies. There is not enough data to evaluate if the species of Pan share the same level of
variability as humans. Given that smaller human studies of only several hundred individuals often
retain a level of uncertainty as a consequence of sample size, it may be inferred that exceptionally
larger samples are critical for finding trends. Another important perspective to consider is sequences
of mineralization irrespective of time. Braga and Heuze (2007) considered human teeth by looking at
modularity using X-rays of 2089 human children, finding that the incisors and post-incisors may
behave as variably independent subsets of teeth. They suggested that a full understanding of sequence
variability should not necessarily assume independence of teeth. Emergence and mineralization may
also not correlate. Kuykendall and Conroy (1996) found that this may be true for chimpanzees.
The observed variability in polymorphisms for chimpanzees and bonobos appears more likely a
consequence of uncertainty caused by small sample rather than an actual species-level difference. It
will be assumed for the purposes of this study that these species do not consistently differ in their
polymorphic centres and that their dental development schedules are the same. It may also be
suggested that the observation of polymorphisms with the sample sized used in this study may or may
not have any statistical relevance. Although it has not been directly tested by any of the
aforementioned studies, there is no indication that changes in sequence necessarily affect dental score
relative to chronological time.

47
2.4.6.c Chronological scheduling
Due to the requirement of known-age samples, tying dental development to calendar years has been
studied much less extensively for chimpanzees and bonobos than sequences of mineralization and
emergence. The best data for providing estimated ages of completion for chimpanzees come from
Kuykendall (1996), Kuykendall et al. (1992), and Kuykendall and Conroy (1996). As an anatomical
reference, it has been found that the third molar is in occlusion prior to the fusion of the proximal
humerus (Bolter and Zihlman 2012, Zihlman et al. 2007). Other studies that link chronological time to
mineralization have been completed as well (e.g., Anemone et al. 1996, Smith et al. 2007). For
bonobos, there is reliance on the compartively small sample sizes of Bolter and Zihlman (2011, 2012).
The data provided by these studies do suggest that there is no remarkable deviation between
chimpanzees and bonobos with regards to overall period of dental maturation.
2.4.7 Assessment of environmental factors affecting dental development: Pathology and systemic stress
It has been found in humans that that the dentition is less affected by systemic insult than is skeletal
growth (Demirjian et al. 1985, Lewis and Garn 1960, Smith 1991). Archaeological studies comparing
skeletal maturation and dental development have found the same result (Cardoso 2007). For
chimpanzees there is less data and for bonobos there is none at all. It has been suggest that in primates
captive individuals demonstrate advanced dental emergence (Phillips-Conroy and Jolly 1988).
Zihlman et al. (2004, 2007) compared wild and captive chimpanzee dental developmental, finding that
captive individuals were much more advanced when compared to the wild sample. These studies made
the assumption that wild individuals were more stressed than captive. These findings were refuted by
Smith et al. (2010) who re-assessed the same material with some additional individuals. They found
that wild and captive emergence timings greatly overlap. Smith et al. (2010) also used radiographic
methods to further clarify their results. It is important to keep in mind that ‘captive’ and ‘wild’ are not
direct analogues of ‘healthy’ and ‘stressed’ and with other environmental variables likely, these studies
are inherently ambiguous. Aside from these comparisons, there exist no studies with well-defined
stressed and unstressed individuals. Smith et al.’s (2010) results may be important for the
interpretation of results of studies such as this one where mixed captive and wild individuals are
included. Although it cannot be demonstrated that the nutritional status of their sample mirrors that of
other skeletal collections, their conclusions suggest that large deviations between captive and wild
groups should not be expected.

48
2.5 Long bone growth in length: Introduction
There are two main factors to consider with respect to long-bone growth and these stem from two
separate questions. First, changes in allometry between species and the achievement of these
difference during growth must be considered. Mere observation suggests that adult humans limb
proportions deviate from the patterns seen in adult chimpanzees and bonobos. It has also been
demonstrated that adult bonobos and chimpanzees differ slightly from each other with bonobos having
slightly longer femora and feet as well as scapular dimensions (Coolidge and Shea 1982, Shea 1984).
However, these differences are slight in comparison with the difference between Pan and Homo.
These differences in allometry have been linked to locomotor behaviour. Humans are strictly bipedal
while chimpanzees and bonobos exhibit suspensory and knuckle-walking behaviour. Bonobos may
also be somewhat more arboreal with regards to suspensory behaviour than chimpanzees (Doran 1993).
It has been observed that differences in proportions of long-bones remain constant from birth to
adulthood (Shea 1981).
The second factor to be considered is growth rate. Growth rate comparisons and associated modelling
has been the subject of considerable discussion as noted in section 2.1. Humans show notable
deviations when compared to chimpanzees and bonobos, particularly an extended adolescence (Bogin
1999b). This will be explored in section 2.5.4.
2.5.1 Long bone growth rates in humans
Similarly to all other aspects of human growth, changes in bone length have been well-documented.
Studies using large samples conducted in the late twentieth century established general patterns of
long-bone length. Both pre- and post-natal values were determined using cross sectional and
longitudinal data. Such studies for pre-natal growth include Fazekas and Kósa (1978) and Jeanty
(1983). Post-natal length values were determined for all long bones by Maresh (1970). Other studies
looking at individuals bones or groups of bones include Ghantus (1951) and Gindhart (1973). More
recent longitudinal study results are provided by Smith and Buschang (2005). Data of this nature are
compiled in edited volumes such as Scheuer and Black (2004) and Schaefer et al. (2009).

49
2.5.1.a Sex differences
Humans are sexually dimorphic with adult females smaller than males on average, although there is
considerable overlap between the two sexes. Similarly to other primates, females mature in advance of
males. Compiled data from sources such as Scheuer and Black (2004) and Schaefer et al. (2009)
demonstrate earlier female maturation and subsequent male catch-up growth. These patterns result in
differences in size and timing of maturation between the sexes.
2.5.1.b Population variation
Humans have been known to exhibit differing long-bone allometry and a number of comparisons have
been made between different adult populations (e.g., Holliday and Ruff 2001). The majority of
differences appear to relate to tibial length and correlate with different climate conditions. Sub-adult
variation in different population groups have been considered by archaeological studies (e.g.,
Mensforth 1985, Miles and Bulman 1994). Minor deviations have been found with regards to changes
in length relative to skeletal maturity. However, within such studies it can often be difficult to
differentiate between the effects of nutritional stress on long-bone growth and actual differences
related to healthy population affinities. Archaeological populations can also provide less-than-optimal
sample sizes and no records about the individual during life. The causal factors underlying the minor
variations observed are unlikely to be related to activity. It has been argued that climate affects post-
cranial limb-length (Holliday 1997, Newman 1953, Pearson 2000, Ruff 1994, Weaver and Steudel-
Numbers 2005). Genetic drift may also be a possibility, although this has not been investigated. For
the purposes of this study the standards provided by reference texts such as Scheuer and Black (2004)
and Schaefer et al (2009) will be used.
2.5.1.c Stressed populations
Some studies have attempted to explore the effects of nutritional stress (e.g., Jantz and Owsley 1984,
Hoppa 1992). Retardation of skeletal growth and reduced adult stature as a result of nutritional stress
has been documented (Bogin 1999a). Within the context of this study, reliable data from healthy
populations are available but it is worth noting in the context of such evidence that relative delays are
statistically significant for human populations. Similarly to dental development, this does not prove
that such effects are also true for chimpanzees and bonobos, but given the physiological similarity
between the two species, it is certainly a worthy point to note.

50
2.5.2 Long bone growth rates in chimpanzees
General patterns of growth in chimpanzee long-bones have been studied in both longitudinal and cross
sectional samples for both wild and captive animals. The majority of this work has tended to be cross-
sectional with longitudinal studies only looking at captive individuals using small sample sizes. Early
cross-sectional work was completed by Shea (1981) and early longitudinal work with captive
specimens by Gavan (1953) and Smith et al. (1975). General discussion of growth rate can be found in
Watts and Gavan (1982). Leigh and Shea (1996) performed non-parametric regression analysis on a
large sample of chimpanzees and have produced body weight functions. It should be noted that long-
bone growth as a function of Demirjian dental score has not been examined in prior studies.
Chimpanzee growth relative to calendar years follows a curve with a slight slowing of rate in juvenile
or mid-growth stages and a slight increase of rate at adolecsence, or near the completion of growth,
after which there is a dramatic slowing. This observation is both in terms of long-bone length and
overall body weight. Figure 2.3 demonstrates what a typical growth rate progression for chimpanzees
looks like.
Figure 2.3 Demonstration of growth rate pattern of chimpanzee size relative to chronological time.

51
2.5.2.a Sex differences
Shea (1981) compared chimpanzees to gorillas and bonobos using dental emergence. He also provided
detailed analyses of growth rates of different indicies and assessment by sex. Females were typically
advanced in growth relative to males with subsequent catch-up growth exhibited by males. Cross-
sectional work by Zihlman et al. (1990) and Zihlman et al. (2007) has confirmed the patterns found by
Shea (1981). Size differences between adult males and females is only slight in chimpanzees
(Richmond and Jungers 1995) and is unlikely to be distinguishable in sub-adult dimensional growth.
2.5.2.b Populations differences
Analysis of the allometric differences between adults of different sub-species has been made (Morbeck
and Zihlman 1989). However, no studies have compared long-bone growth in different sub-species of
chimpanzees.
2.5.2.c Comparisons of captive and wild:
It has been argued that there are differences between wild and captive chimpanzees with respect to
growth rate and final adult dimensions. In humans it has been well-documented that nutritional
differences have a significant impact on both rate of growth and final adult height, which is a
consequence of reduced limb length (Bogin 1988, 1991). Evidence in humans has relied on
comparisons between extant populations and known low socio-economic status archaeological
populations. Similarly to dental development, for chimpanzees it has been proposed that wild
populations are more stressed than captive ones and that the same principles of delay and reduced
growth found in humans applies. Kimura and Hamada (1996) have confirmed this assertion when they
found advanced development of long bones in captive chimpanzees relative to wild samples. They
also found that captive individuals were larger than wild individuals at cessation of growth, a particular
feature that has been noted by others (Coe et al. 1979, Hamada et al. 1996, Kraemer et al. 1982,
Matsuzawa et al. 1990, Zihlman et al. 1990). It appears that unlike dental development there are clear
distinctions between captive and wild for this species with respect to long-bone growth.
2.5.3 Long bone growth rates in bonobos
Similar to other aspects of development, research on long bone growth in bonobos is more limited.
Data are available for adult dimensions (Coolidge 1933, Coolidge and Shea 1982, Shea 1983). Studies
of adult dimensions have usually been conducted with the objective of comparison with chimpanzees.
Studies providing dimensional information on growth in sub-adult bonobos are limited to Shea (1981,

52
1983, 1984). Shea analysed limb dimensions and overall somatic growth. The sample used was quite
small (N = 7). Based on these data, it became evident that bonobo growth rates were similar to that of
chimpanzees. With such limited data, it is evident that captive and wild comparisons have not been
made. There are again no different populations available for comparison.
2.5.4 Comparisons between chimpanzees, bonobos, and humans
As mentioned in section 2.6.3, Shea (1981, 1983, 1984) compared sub-adult bonobos and
chimpanzees. These studies are the only direct comparisons between the two species with respect to
growth rates. At present, however, it can only be concluded that bonobo and chimpanzee long-bone
growth rates are effectively the same.
In section 2.1 growth rates and allometry were discussed. There are evidently many comparisons of
overall somatic growth such as Hamada et al. (1996), Hamada and Udono (2002), Schultz (1960),
among others. Adult dimensions are well-documented and adult allometry has been considered in the
context of differing locomotor behaviour between humans and chimpanzees (e.g., Jungers 1982, Myatt
et al. 2011). As noted in section 2.5.2, dimensions and rates for growth of individual long-bones have
been determined by Shea (1981, 1983, 1984). Despite differences in growth rates making comparisons
problematic, Shea (1983) suggested that humans do not develop their bipedally adapted long-bone
dimensions during growth, rather, these exist from birth.
Due to the relatively large samples of sub-adult individuals that are required, no further studies have
pursued sub-adult allometric change comparisons beyond Shea’s work. Much more research has been
done comparing cranial allometry, as mentioned in section 2.1. This lack of study depth may relate to
craniometric variables being less tied to locomotion than post-cranial ones. Shea’s evidence also
suggests that static allometry consistency between chimpanzee sub-adults and adults indicates that
further research into sub-adult allometry would not likely provide any additional insights.
2.6 Summary of current knowledge of Homo and Pan life history variables
In this chapter a wide range of topics have been covered discussing growth and development in Homo
and Pan. Key variables from each section will now be summarised.

53
2.6.1 Summary of developmental theory
The concept of heterochrony has been introduced and changes in growth rate and pattern have been
considered. Within this subject the concepts of neoteny and hypermorphosis have been explored.
These have been used to explain the difference between human and ape development. The debate over
the validity of each was considered and it was demonstrated that there is no widespread agreement with
respect to these issue. It is clear that for some areas such as sequence heterochrony and the comparison
of different systems that more data are required. This study will assist in making up some of these
deficiencies.
2.6.2 Summary of epiphyseal fusion
It is clear that comprehensive data exist for humans with sequence timing well-established. Sex
difference in terms of fusion timing have been observed. Current research suggests that population
affinities are unlikely to affect pattern of fusion. Populations in which minor differences have been
observed have tended to also be stressed populations and as such make results less reliable. Nutritional
stress has also been shown to delay fusion timing.
For chimpanzees most epiphyseal fusion sites have been observed at some point but sample sizes and
levels of precision for age ranges vary dramatically. Methodology is also inconsistent between studies.
As such, a well-defined sequences using a large sample size have yet to be achieved. Population
comparisons have not been considered for epiphyseal fusion in chimpanzees. Comparisons of captive
vs. wild have shown some differences, although sample size limitations have rendered the level of
deviation unclear.
For bonobos the only work on epiphyseal fusion sites has been Bolter and Zihlman (2012). Data for
the effect of stress on growth has not been acquired. There are no population sub-groups to compare
for this species.

54
Differences between species/sub-species:
Epiphyseal fusion comparisons between chimpanzees and bonobos are limited to Bolter and Zihlman
(2012). This study found that there were generally no differences between the species. However, the
sample size was small and only very generalized ranges were obtained for fusion timing. Comparisons
of chimpanzees to humans are restricted to the basic observations of Kerley (1966) for three fusion
sites. Such comparisons are made problematic by the lack of precision for age ranges of fusion events
and growth rate distortions between Pan and Homo. It is evident that large sample sizes are necessary
for refinement of understanding in skeletal fusion for Pan.
2.6.3 Summary of dental development
Human dental emergence and mineralization have been well-established with many large-sample
studies spanning multiple populations and covering healthy and stressed individuals. Sex differences
in timing have been determined. Different populations have shown minor differences for
mineralization pattern in some studies but not others. It is not entirely clear what the effect of
population is but it is likely that any real differences are minor. Nutritional stress has also been shown
to affect dental development. It has been documented that this system is less susceptible to systemic
stress than skeletal development.
Emergence and mineralization timings are documented for chimpanzees. Sex differences are known to
exist. Comparisons of different populations are lacking for mineralization and emergence. It should
be noted that many of the studies of dental development agree with each other and these studies have
often employed data from different populations. By inference it should be expected that deviations are
not great, if present at all. Data comparing captive and wild as a proxy for stressed and unstressed
populations have potentially shown some differences (Zihlman 2004), although the evidence for this
effect has been challenged (Smith et al. 2010).
Bonobo dentition has been less extensively studied but emergence and mineralization timing is
available. Nutritional stress effects have not been investigated. There are no sub-species to compare.
There are well-documented differences in both mineralization and emergence timing between
chimpanzees and humans. Chimpanzees and bonobos have been compared by Boughner et al. (2012)
with the conclusion that patterns of mineralization are not distinguishable between the species. Both
species of Pan may be considered dentally analogous for the purposes of this study.

55
2.6.4 Summary of long-bone growth in length
Metric changes in length of long-bones are well known for humans. Sex differences are known to exist
both for timing and overall dimensions, with females smaller than males. Minor population differences
have been documented. Some studies looking at these differences may suffer from acquiring data from
using populations that are environmentally stressed. It should be noted that inconsistencies found
between populations do not appear to relate to behavioural differences in terms of locomotion but
rather, refer to differences of climate adaptation or potential genetic drift. Nutritionally stressed
populations show notable delays in growth. Nutritionally stressed populations also show reduced
stature. Data from large studies of healthy populations are available in reference texts such as Scheuer
and Black (2004) and Schaefer et al. (2009).
Growth of chimpanzee long-bones has been observed in multiple studies. Sex differences are known,
with females in advance of males. Wild samples have been found to be retarded in growth compared
to captive samples, lending support to the presumption that wild samples are more stressed.
Information on bonobo long-bone growth is limited to the work of Shea in the 1980s. Long-bone
growth rates were determined using a small sample across differing ages.
Shea’s (1981) work suggests that bonobos do not dramatically differ from chimpanzees, although his
sample size was small. Comparisons of chimpanzees, bonobos, and humans have suggested that these
species maintain static allometry for growth in length of long-bones (Shea 1981, 1983).
2.6.5 Summary conclusion
Much data exist on chimpanzee growth and development but there are notable areas where information
is lacking or is derived from small samples. No studies have integrated all three variables of
epiphyseal fusion, dental mineralization, and long-bone length in a single study for either species of
Pan.

56
Chapter 3 Materials and Methods
3.1 Materials: The Collections3.1.1 Definition of species usedThe skeletal collections used contained several sub-species of Pan. The species and sub-species of
Pan troglodytes require some definition. The classifications of chimpanzee sub-species here are as
defined by Groves (2001), and the differences have been described based largely on geographic
separation (Ely et al. 2005). The sub-species of chimpanzees are Pan troglodytes schweinfurthii, Pan
troglodytes troglodytes, Pan troglodytes verus, and Pan troglodytes vellerosus. Morphological
differences including both soft tissue and the skeleton are not as clearly defined with only small
amounts of comparative data available. It has been suggested that differences heavily overlap
(Morbeck and Zihlman 1989). Based on mitochondrial DNA, the divergence between all of the
different sub-species occurred around 900 000 years to 400 000 years before present (Hey 2010).
These groups are not genetically isolated and have been observed to interbreed at the margins of their
ranges (Yu et al. 2003). With regards to growth and development, no studies have focused on
developmental differences between sub-species. Most studies of ontogeny have treated the individuals
involved simply as members of Pan troglodytes without sub-species affiliations. Some studies have
included mixed samples which have been treated without consideration for sub-species (e.g.,
Kuykendall et al. 1996). There has been effectively no research comparing different sub-species of
chimpanzees using rigorous methodology.
Groves (2001) also defines Pan paniscus for the area south of the Congo River. There are no defined
sub-species of bonobos.
3.1.2 Species and sub-speciesIn total there were 219 specimens assessed in this study from which 214 were derived from three main
collections: the Powell-Cotton Collection (Birchington, United Kingdom), the Adolph Schultz
Collection at the University of Zurich (Zurich, Switzerland), and the Museum of Central Africa
Collection (Tervuren, Belgium). Five additional specimens were obtained from the Weston Park
Museum (Sheffield, United Kingdom). Table 3.1 indicates the number of specimens used at each
location and the species/sub-species evaluated. The numbers for each individual sub-species of Pan
troglodytes are partly derived from classification based on museum records and partly derived from re-
assignment based on information provided by curatorial records at these collections. These re-
assignments are justified in the discussion of provenance in section 3.1.2. It should be noted that the

57
majority of Pan troglodytes sub-species were classified as either Pan troglodytes schweinfurthii or Pan
troglodytes troglodytes.
Table 3.12 Number of individuals for each species/sub-species listed by collection.
species/sub-speciesPowell-Cotton
Museum
Adolph Schultz
Collection
The Museum of Central
Africa
Weston Park
Museumtotal
Pan paniscus 0 1 36 0 37Pan troglodytes troglodytes 69 2 3 0 74Pan troglodytes schweinfurthii 0 0 47 0 47Pan troglodytes 0 46 5 5 53Unspecified Pan 0 0 5 0 5total number of individuals 69 49 96 5 219
The information provided for each specimen was variable both between and within collections. As
indicated by Table 3.1, sub-species designation was reported for virtually all specimens at the Museum
of Central Africa and the Powell-Cotton Museum. This was not true of the specimens from the
University of Zurich where nearly all individuals were reported as being simply Pan troglodytes. How
the determination of sub-species was made was never specified in any collection. It is likely that such
information was deduced from records of geographic origin. Sub-species reports were accepted in this
study for those specimens from the Museum of Central Africa due to collection location information
agreeing with currently understood regions in which these sub-species reside. This was not the case
for the Powell-Cotton Collection samples where there was a significant contradiction between the
geographic area reported and the known range for the sub-species reported. All samples were reported
there as being Pan troglodytes schweinfurthii (Pan satryus schweinfurthii on record cards) while the
locations noted in museum records indicated that these samples all were derived from a region that can
be confidently assigned to Pan troglodytes troglodytes (see section 3.1.2 regarding provenance of these
collections for further analysis of geographic constraints). Geographic records at the Powell-Cotton
Museum were both specific and consistently reported, providing the name of the location as well as
longitude and latitude. The records that assigned these samples to Pan troglodytes schweinfurthii may
have been using out-dated classification information. The use of the term ‘satyrus’ would suggest this.
The dates in which these records were made were not provided. Given this information, it was decided
to re-classify the Pan troglodytes schweinfurthii samples from the Powell-Cotton Museum as Pan
troglodytes troglodytes for the purposes of this study.

58
3.1.3 Provenance
The information provided regarding provenance for each specimen was variably reported. Table 3.2
provides the captivity status for each species. For most specimens it was possible to establish if the
individual was captive or wild, although for a few specimens this information was not available. These
were samples in which the collector’s name was given but no additional information was provided.
Table 3.13 Captive vs. wild by species
species/sub-species wild1 captive2 ambiguous3 not reported4 totalPan paniscus 31 1 1 4 37Unspecified Pan 2 0 0 3 5Pan troglodytes 8 2 42 6 58Pan troglodytes schweinfurthii 37 2 0 8 47Pan troglodytes troglodytes 72 0 0 0 72entire sample 150 21 5 43 219
1. Wild indicates that some descriptive term indication geographic origin was presented.2. Captive indicates that there is a reference to a zoo or other captive circumstance.3. Ambiguous indicates that in the description the origin simply refers to the individual collector such as
‘collected by Pilette.’4. Not reported means that no information was given.
3.1.2.a Provenance at the Museum of Central Africa
At the Museum of Central Africa [MCA] the exact location or region where the individual was found
was reported for many of the specimens. It should be noted that many of the MCA specimens which
had been listed as being obtained from the Antwerp Zoo may have originally been wild animals. Their
capture age and duration of time spent within the zoo was not specified. Due to the lack of records and
the paucity of information regarding their origins, it shall be assumed for the purposes of this study that
these had always remained captive animals. Table 8.1 in the appendix lists the reported locations for
the wild specimens from the MCA.
3.1.2.b Provenance at the Powell-Cotton Museum
Virtually all of the specimens at the Powell-Cotton Museum had curation cards that provided species
name, sex, locality, latitude and longitude, head and body measurements, span, height, girth,
anatomical parts present and additional notes. A date was also provided, although it is not clear what
this date represents. These dates were mostly from the 1930s. Virtually all individuals were listed as
‘Pan satyrus (schweinfurthii).’ As discussed below, it is unlikely that these specimens are members of
this sub-species and they will be referred to here as members of Pan troglodytes troglodytes. Of these
individuals, 45% were recorded as being collected from a single region of Cameroon, the Obala,

59
Batouri District. The remainder of the specimens were also from various parts of Cameroon with the
exception of one individual which had come from the Congo. Numbers of individuals from each
location are available in Table 8.2 in the appendix.
Current classification indicates that Pan troglodytes schweinfurthii and Pan troglodytes troglodytes
inhabit non-overlapping regions in central Africa. Pan troglodytes schweinfurthii resides north and
east of the Congo river while Pan troglodytes troglodytes is located in the western margins of central
Africa covering territories in Gabon, Congo and Cameroon (Stumpf 2007). These geographic
subdivisions suggest that the entire sample from the Powell-Cotton Museum can be confidently re-
assigned to the sub-species Pan troglodytes troglodytes.
3.1.2.c Provenance at the Adolph Schultz Collection, University of Zurich
As indicated by Table 3.1, all of the specimens from the University of Zurich were ascribed Pan
troglodytes without sub-species classification. A handful of individuals had geographic origins
provided in curation records. These individuals were only specified to the country or region. The
specimens from Liberia and Sierra Leone can be confidently ascribed to the sub-species Pan
troglodytes verus as those two countries an entirely encapsulated by the range of this sub-species
(Sugiyama 1989, 2004). The specimen from Equatorial Guinea may be assigned to Pan troglodytes
troglodytes for the same reason. This country is entirely within the range of this sub-species (Stumpf
2007). This is also true for the Nigerian specimen, which can be classified as Pan troglodytes
vellerosus (Sommer et al. 2004). Provenance for specimens at the Adolph Schultz Collection are listed
in Table 8.3 in the appendix.
3.1.2.d Provenance at Weston Park Museum
There were five individuals from Weston Park Museum in Sheffield. Four of these had no provided
information on provenance. One individual was reported to have come from Bostock’s Jungle, a local
equivalent of a Zoo, and thus has been considered a captive animal for the purposes of this study. All
of these individuals were reported as belonging to Pan troglodytes.
3.1.2.e Summary of geographic origins
Figure 3.1 provides a summary of the known geographic origins for the individuals in this sample. The
samples of Pan troglodytes from the University of Zurich are identified by dots indicating the locations
from which individuals were derived. The ranges for Pan paniscus, Pan troglodytes schweinfurthii,
and Pan troglodytes troglodytes represent geographic regions where those species are found.

60
Figure 3.4 Map showing the distribution of all major sub-species and the locations of individuals from the University of Zurich. (Image created using Open Street Map)
3.1.4 Sex
Sex was not determined in this study by any means other than curation records. No osteological
determinations were made for individuals that did not have reported sex. Sexually dimorphic features
such as larger canines, more prominent brow ridges, differing facial morphology and overall greater
robusticity in males (Cobb and O’Higgins 2007, Leutenegger and Kelly 1977) can be assessed in adults
with relative ease but this is not necessarily the case for sub-adult individuals. Chimpanzees and
bonobos show some similarity to humans with respect to the fact that these features are not as overtly
visible if present at all during at earlier stages of development and thus make confident sex
determinations difficult. The number of individuals present by sex for each species/sub-species is
shown in Table 3.3. It is of particular note that females out-numbered males for both Pan paniscus and
all the Pan troglodytes sub-species. This was a pattern that appeared at all institutions with the
exception of Weston Park Museum where there was only one individual of confirmed sex.

61
Table 3.14 Number of individuals listed for each sex by species and sub-species.
species total no.
male#
male%
female#
female%
unknown #
unknown%
P. paniscus 37 17 46.0 13 35 7 19P. troglodytes 54 19 35 27 50 7 13P. troglodytes schweinfurthii 47 15 31 17 36 15 32
P. troglodytes troglodytes 74 29 39 45 61 0 0P. troglodytes verus 2 0 0 2 100 0 0P. troglodytes vellerosus 1 1 100 0 0 0 0Pan species (unspecified) 5 0 0 0 0 5 100total 219 81 36.99 104 47.49 34 15.53
Table 3.3 includes all individuals (wild, captive, ambiguous and unreported). To ensure that there was
no significant sex bias by captivity status, analysis of the data Table 3.4 will be considered. These data
indicate the number of individuals reported by sex for each provenance category. This includes all
species and sub-species. The pattern whereby there are more females than males is also repeated in
each sub-category of Table 3.4. When the wild specimens are sorted by sex and by species, the results
can be seen in Table 3.5.
Table 3.15 Number of individuals for each sex by captivity status.
captivity status male female unknown all specimenscaptive 7 9 14 30
wild 55 70 14 139ambiguous 2 4 1 7not reported 16 23 4 43
total 80 106 33 219
Table 3.16 Wild specimen numbers by sex sorted by species and sub-species.
species/sub-species male female unknown totalPan paniscus 14 9 7 30Pan troglodytes schweinfurthii 12 13 7 32Pan troglodytes troglodytes 27 44 0 71Pan troglodytes 2 4 0 6

62
There can be several observations made regarding these distribution patterns. With the exception of
the Pan paniscus sample, the relative proportions of males, females, and unsexed individuals was
consistent between species, sub-species, and within captive and wild categories. Overall the
percentage of individuals with unknown sex was low at 15.5% for the entire sample. Males out-
numbered females for all groupings of Pan troglodytes with 41% of sexed individuals of this species
(excluding unknowns) being male and 59% female. Equivalent values for Pan paniscus were 57%
male and 43% female. Despite these values not representing a perfectly even sex distribution, the do
provide values that are quite acceptable for use in analysis of both sexes for both species.
3.1.5 Completeness of the collections and condition: statement by collection
To further clarify which elements were required, bilateral assessments (both left and right sides) were
taken for each individual and as such a complete skeleton was desirable. A statement simply
quantifying presence or absence of skeletal elements at this juncture is not especially meaningful for
understanding the feasibility of analysis. For example, the presence or absence of epiphyses has an
impact on long-bone length and as such a list of numbers of each long bone would need to be qualified
by the presence or absence of one of both of its epiphyses. Likewise with dentition, the presence or
absence of teeth may or may not have an influence on the assessment of dental score (see section 3.4)
and thus simply listing presence/absence values will not assist in understanding the effectiveness of
data presence/absence for the analysis of results. Due to the complex nature of this, the completeness
of elements used is described within each methodology section. The following provides the location of
all completeness analyses within this chapter. Each of these analyses is completed for both species and
both sexes independently.
Dentition:
1. Bilateral assessment of dentition by species including tooth presence and completion of quadrants: section 3.4.1 and 3.4.2.
Epiphyseal fusion:
1. Number of bilateral epiphyseal fusion site records: section 3.5.1
2. Number of complete epiphyseal fusion centre data points: section 3.5.1
Long-bone length:
1. Number of bilateral measurements for long bone length: section 3.6.1 and 3.6.2

63
2. Number of complete long bones: section 3.6.3
Cortical condition and state of preservation are important factors to consider as poor preservation may
lead to difficulty in making assessments regarding epiphyseal fusion and ultimately with regards to
error in measurement. For all of these collections the state of preservation was very good. Provided
here is a brief statement for each collection regarding collection condition.
The condition of cortical bone for the Powell-Cotton Museum skeletal collection was extremely good.
Some cut-marks were visible but this had no impact on the sites used for data collection in this study.
Post-mortem fractures of long bones were not notably present and as such long-bone lengths could be
obtained for virtually all long bones available. Epiphyses were often found glued to the ends of the
bones.
In the Museum of Central Africa skeletal collection the cortical condition was generally good with
most bones having no visible surface damage. Some specimens showed mild surface erosion. Some
cut-marks remained due to disarticulation but these did not impede data collection. None of these
specimens had decay severe enough to be considered a problem for evaluation of epiphyseal state or
length measurements. Similarly to the Powell-Cotton Museum, epiphyses were often found glued. A
few skeletons were articulated using wires, which created some difficulties for measurement and this
was noted during data collection. Residual cartilage and liagmentous material made assessment
difficult for hand and foot bones in some samples.
The skeletal collection at the University of Zurich demonstrated good cortical preservation with most
bones having no visible surface damage. Some cut-marks remained due to disarticulation but these in
no way impeded data collection. Many of the skulls had the top portion of the cranium removed,
presumably for extraction of the brain for post-mortem examination or preparation. The piece of bone
that was removed, which included parts of the frontal, parietal, and occipital, was not often present.
The individuals from Weston Park Museum were articulated on stands and intended for display. These
skeletons retained a considerable amount of cartilage and ligamentous material making assessment
difficult.
3.1.6 Observation of pathological conditions
A variety of pathological conditions are known to affect skeletal development (Bogin 1999a, Scheuer
and Black 2000). Many such conditions are not visible osteologically, but some may be symptomatic
in the skeleton such as linear enamel hypoplastic defects in dentition which can be an indication of
periods of nutritional stress among other things. The inclusion of only healthy individuals is desireable

64
for the study of ontogeny. However, when using skeletonised collections with often limited
information about the individual during life and cause of death, there is no means to conclusively
demonstrate that all individuals were free of pathological conditions. In addition, many observed
disturbances in skeletonised individuals may not represent an insult to normal development or the
pattern of development. In humans there is evidence that nutritional stress may cause chronological
delays in skeletal maturity (Bogin 1999a) but there is no evidence that the pattern of fusion events
changes. It has been noted that dental development is less susceptible to systemic stress than is skeletal
development and as a consequence, discrepancies may develop between expected skeletal and dental
maturation (Cardoso 2007). Here the assumption is that chimpanzees and bonobos fundamentally
operate on the same principles. Some evidence does suggest that this is true from comparisons of wild
and captive chimpanzees (Zihlman et al. 2007).
As a matter of establishing criteria in which to accept a sample for data collection, only very overtly
pathologically affected individuals were discounted. In other words, individuals excluded were those
that appeared to have very obvious and severe systemic changes in bone structure such as substantial
cortical remodelling and deformation of bones and teeth (Table 3.6). Only two individuals from the
Museum of Central Africa fell into this category. Other potentially pathological conditions were
subsequently observed during data collection and instead of immediately rejecting that individual, the
condition was simply noted by verbal description. Analysis of variation potentially caused by
pathological conditions can be found in sections 3.5.1 (Determining combined sample values for
analysis of epiphyseal fusion). Evidence of fractures was also recorded. In the entire sample there
were 9 individuals with clear evidence for fractures that were either healed or in a state of non-union
and 3 which were suspected of having had a healed fracture with extensive remodelling.
Table 3.17 The three major categories of pathological conditions that were observed in the study populations.
condition Nsuspected infection 18linear enamel hypoplasia 9other unidentified disturbance 24total observed pathological individuals 51
65
3.1.7 Inclusion of species and sub-species for analysis
The numbers of each sub-species (Table 3.3; see section 3.1.3) show that the frequency of each sub-
species divided by sex were typically in the range of 15 to 30 individuals. When considering that the
number of individuals exhibiting unfused, mid-fusion, and complete fusion categories would be an
even smaller sub-set of these groups, the available data would provide insufficient sample size. For
Pan paniscus there were only 37 individuals in the entire sample. In the Pan troglodytes sample it was
possible to group both at the species and sub-species level. In humans as well as other animals,
variation in timing and pattern of growth is commonly observed and as such large sample sizes are
desired to encompass as much of this variation as possible. This, coupled with the fact that sub-species
comparisons would make the analysis impractically large for a single study, meant that it was decided
from this point forward to only look at species-level comparisons. Information on sub-species and
provenience will be retained for future analysis.
3.2 Methodology: Data collection3.2.1 Overview of data categories
The study of skeletal growth and development is a significant area of research that encompasses many
different types of information ranging from morphometrics to specific cellular processes. This
particular study is concerned with tying together certain key variables of skeletal development in Pan
and Homo. Selecting an appropriate and practical number of variables of study is necessary. There are
three main types of information that are considered here: epiphyseal fusion, dental development, and
long-bone length. The analysis of these variables in conjunction with each other will provide an
important contribution to present literature.
These data were collected and compiled into a single database. Demographic data collection and
developmental age range parameters are described in sections 3.2.2 and 3.2.3. The manner in which
the data were collected for each major data type is outlined for dental recording (section 3.2.4),
epiphyseal fusion (section 3.2.5), and long-bone length measurements (section 3.2.6).
3.2.2 Demographic data
As indicated in section 3.1, as much data as possible were recorded for each specimen regarding
provenance, sex, and species/sub-species affiliation. The original museum specimen numbers have
been retained and any and all additional information was collected including such things as known
mass (weight) and height of the individual at the time of death.

66
3.2.3 Developmental age range
The specimens used for analysis included all age groups from the youngest individual available
(neonates) to the point where there is full epiphyseal fusion of all bones with no residual fusion
scarring for all but the last remaining epiphysis or epiphyses if there was more than one. This last
remaining epiphysis had to be fused with only a residual scar line. This allowed for the collection of
data purely from sub-adults and not requiring redundant data collection from fully mature adults. The
last remaining epiphyses to fuse were found to be either the iliac crest or the medial clavicle for all
species and sub-species used in this study. This was determined by surveying all older sub-adults and
adults in each collection prior to commencing full-scale data collection.
3.2.4 Dental recording
Radiographs were taken for mandibular and maxillary teeth using a low-dosage, portable dental X-ray
(Aribex NOMAD Pro®) provided by the Glover Laboratory at the University of Sheffield. The sensor
used by this device obtained images 36.0 x 25.6 mm. This allowed for imaging of typically not more
than three teeth per exposure. A system whereby the mandible was placed on foam mountings was
devised and the sensor was put on the lingual side parallel with the plane of the tooth. Demirjian
scores were used to assess dental maturity. This will be described below in section 3.2.4a. A
fundamental requirement for the production of images used in assessment of Demirjian scores was to
have a view of each tooth with the axis from the apex of the crown to the tip of the root positioned
parallel with the sensor. It was also necessary to have each tooth oriented such that the mesio-distal
plane was also parallel with the sensor. A demonstration of this is shown in Figure 3.2. It should be
noted that the illustration in Figure 3.2 is only for showing the orientation of the teeth relative to the
sensor and does not indicate distance from the sensor. In all cases the teeth were placed as close as
possible to the sensor.
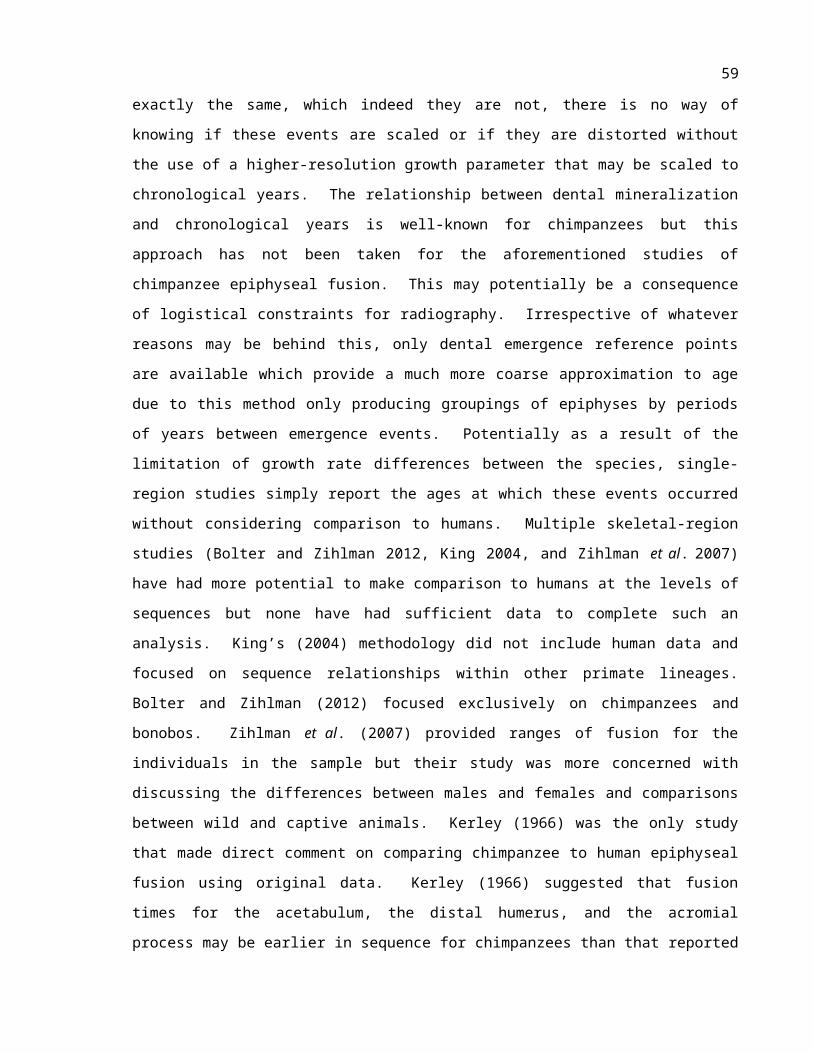
67
Figure 3.5 Demonstration of tooth orientation as shown from distal and occlusal views.
The standard mandibular imaging positions used are shown in Figures 3.3 and 3.4. These images
demonstrate the positions of the sensor with all permanent dentition present under ideal conditions. In
practice, there existed some variation between adults with respect to the morphology of the mandible
with the lingual dimensions of the mandible sometimes making these standard positions impractical.
In progressively younger individuals where interior dimensions of the mandible were smaller and more
constricted, the sensor positions shown in Figure 3.3 had to be modified. In such cases, the sensor was
placed in a position such that the plane of the sensor was parallel with the mesiodistal plane (Figures
3.4 and 3.5). This often involved taking additional X-rays in order to properly record all teeth. The
distance between the teeth and the sensor was kept as close as possible in order to minimise distortion
of the xray image. The assessment of dental maturity by Demirjian scores does not require direct
measurements of teeth but it does require teeth to be parellel with the sensor or film as shown above in
Figure 3.2. Increased distances raise the likelihood of distortions due to changes in angle of the tooth
relative to the plane of the sensor being less obvious to the naked eye.

68
Figure 3.6 Occlusal view of typical positions for mandibular X-ray imaging.
Figure 3.7 Cross-sectional view of the mounting system for X-ray exposure of mandibular teeth.

69
Figure 3.8 Demonstration of the foam mounting system with a mandible in place (photo is author’s own)
3.2.4a: Description and justification of the use of the Demirjian system
To score the X-ray images the Demirjian method was used (Demirjian et al. 1973) which is a standard
method for assessment of dental maturity in humans. The method was applied to 8 teeth. Prior studies
of chimpanzee dental development such as Kuykendall (1996), Kuykendall et al. (1992), and
Kuykendall and Conroy (1996) also used this method of dental scoring to assess maturity using
known-age individuals. Kuykendall (1996) provided regression equations estimating chronological
age of attainment from Demirjian score for both 7 and 8 teeth (third molar included or excluded). This
is the most refined means for estimating age in skeletal collections of chimpanzees available without
known ages being provided. The application of the method to bonobos requires some caution in the
sense that Kuykendall’s work did not apply the method to this species. It could be argued that the
application of the method is permissible provided that it is understood that this application is made on
the basis of information derived from other studies. This information is as follows: Boughner et al.
(2012) have indicated that patterning of bonobo mineralization likely does not differ from
chimpanzees. Bonobo emergence timings also do not notably differ from chimpanzees as far as
current research indicates (Bolter and Zihlman 2011). Assuming that Bolter and Zihlman’s (2011)
comparatively small sample size predicted reliable ranges for emergence, it would seem likely that
bonobos mineralization timings converge upon very similar values. Figure 3.6 demonstrates the
Dermirjian developmental stages and Table 3.7 explains the criteria for each stage.

70
Figure 3.9 Demirjian dental scoring stages redrawn from Demirjian (1973).

71
Table 3.18 Definition of Demirjian scoring stages (Reproduced from Kuykendall 1996, Kuykendall et al. 1992, Kuykendall and Conroy 1996).
Stage 1In both uniradicular and multiradicular teeth, the initial calcification is visible in the superior region of the tooth crypt as one or a series of inverted cones. There is no fusion of these calcified points.
Stage 2 Fusion of the calcified points form one or several cusps which unite to give a regularly outlined occlusal surface.
Stage 3
a) Enamel formation is complete at the occlusal surface. Its extension and convergence towards the cervical region is visible.b) Beginning of a dentinal deposit is present below the enamel crownc)The outline of the pulp chamber has a curved shape at the occlusal border.
Stage 4
a) Crown formation is complete to the cementoenamel junction.b) The superior border of the pulp chamber in uniradicular teeth has a definite curved form, being concave toward the cervical region. If the pulp horns are present, they give an outline like an umbrella top. In molars, the pulp chamber has a trapezoidal form.c) Beginning of root formation is observable in the form of a spicule
Stage 5
Uniradicular teeth:a) The walls of the pulp chamber form straight lines, but may be interrupted but the presence of pulp hornsb) Root length is less than crown height.Premolars and Molars:a) Initial formation of the radicular bifurcation is visible as either a calcified point, or a semilunar mass.b) Root length is still less than crown height
Stage 6
Uniradicular teeth:a) The walls of the pulp chamber approximate an isosceles triangle. The apex ends in a funnel shapeb) Root length is equal to or greater than the crown height.Molars:a) The calcified region of the bifurcation has developed further down from its semilunar stage to give more definition to the roots, which have funnel-shaped endings.b) The root length is equal to or greater than the crown height.
Stage 7
a) The walls of the root canals are parallel (distal root in molars).b) The apical ends of the root canal are open, but NOT funnel-shaped. The periodontal membrane bulges around the root apices.c ) Proximal and distal roots of multiradicular teeth are parallel--root elongation is complete
Stage 8a) The apical end of the root canal is completely closed (distal root in molars).b) The periodontal membrane has a uniform width around the roots and apices

72
3.2.5 Epiphyseal Fusion Recording
Epiphyseal fusion centres observed in this study were chosen with the specific objective of including
sites that have been recorded in prior study as well as adding further elements that have yet to be
observed in the literature. Tables 3.8 and 3.9 outline the fusion centres observed in this study.
Table 3.19 Upper body epiphyseal fusion sites recorded.
bone epiphysis
humerusproximal epiphysis fusion
distal capiptulum/trochlea/lateral epicondyle fusiondistal medial epipcondyle fusion
radiusproximal epiphysis fusion
distal epiphyses fusion
ulnaproximal epiphysis fusion
distal epiphyses fusion
hand
distal phalangeal epiphyses fusionbase of metacarpal 1 fusion
proximal and middle phalangeal epiphysis fusionheads of metacarpals 2-5 fusion
claviclemedial epiphysis fusionlateral epiphysis fusion
scapula
coracoid process fusionsub-coracoid centre and glenoid epiphysis fusion
acromial epiphysis fusionmedial border
Table 3.20 Lower body epiphyseal fusion sites recorded.
bone epiphysis
femur
femoral head fusiongreater trochanter fusionlesser trochanter fusiondistal epiphysis fusion
tibiaproximal epiphysis fusion
distal epiphysis fusion
fibulaproximal epiphysis fusion
distal epiphysis fusion
foot
calcaneal epiphysis fusiontalar epiphysis fusion
distal phalanges, middle phalanges, metatarsal heads 2-5 fusionproximal phalanges and base of metatarsal 1 fusion
pelvis
tri-radiate epiphysis fusionanterior inferior iliac spine fusion
iliac crest fusionischial epiphysis fusion

73
The selected sample is not an exhaustive list of all epiphyses present in the developing individual.
There are other epiphyses present in the spinal column and on the ribs which were not evaluated
because they are considerably more difficult to observe in osteological collections. Ribs are often
broken or lost, and the epiphyses for these bones are very thin and easily broken. These sites were also
not considered to be necesary for satisfying the core objectives of this study. The included epiphyses
are exhaustive for all long bones, hand and feet. This study also observes all epiphyses of the pelvic
and shoulder girdle with the exception of the pelvic ramus. The ramus was often encased in cartilage
and difficult to observe. These regions are of particular interest for the study of changes in locomotory
behaviour between bonobos, chimpanzees, and humans.
3.2.5.a Epiphyseal Fusion Stages: scoring system
As noted in Chapter 2 (section 2.2.1 and 2.2.2), there have been many studies of human epiphyseal
closure and multiple scoring systems employed using both dry-bone and radiographic methods. Prior
studies of chimpanzees have also employed both radiographic and dry-bones methodologies describing
differing states of fusion with varying levels of detail. Some studies have simply reported ‘fused’ and
‘unfused,’ while others have recorded degrees of mid-fusion, such as ‘partially fused.’ This variation
is the result of difficulties of observation encountered with two-dimensional images. The system used
in this study was designed to permit comparison with prior and future studies, and describes ‘fused,’
‘unfused,’ and three mid fusion stages. This information could always be reduced by assigning
partially fused scores to a simpler ‘fused’ category for comparisons with studies where fewer stages
have been recorded. It shall be shown in this study a similar reduction was required as a consequence
of limited sample size of individuals fusing at each individual epiphysis (see sections 3.5.1 and 3.5.2).
A description of the stages is presented in Table 3.10 and a graphic representation is provided in Figure
3.7.
Table 3.21 Description of epiphyseal fusion stages observed.
stage basic description detailed description
1 unfused The epiphysis is detached and may or may not yet be ossified.
2 beginning fusion Bone bridging is visible at the earliest stage. Fusion does not appear to exceed more than 1/3 of the surface area of the hypertrophic zone.
3 partial fusionFusion of the epiphysis has completed between 1/3 of the surface area of the hypertrophic zone and a near completion state with a cartilage zone not less than 2 mm in depth.
4 complete fusion with scar
There is a scar or fusion line of no greater than 2mm in depth. Any visible remaining scar classifies the epiphysis at this stage even if there are areas of obliteration.
5 complete fusion There is complete obliteration of the fusion scar line. No fusion scar is

74
with obliteration visible at any point.
Figure 3.10 Visual demonstration of epiphyseal fusion stages.
It should be noted that that the fused area was not directly measured for stages 2 and 3, where a
fractional ratio of hypertrophic area is referred to. It would have been neither possible nor practical to
find a means to exactly quantify this relationship for a large sample. Visual estimation was deemed
sufficient. The error analysis in section 3.4.5 suggests that this type of assessment is consistent
irrespective of the knowledge of exact areas. This is due to the fact that these ratios were chosen based
on very visually distinct phases. Epiphyseal fusion is a continuous process, and these stages are meant
to provide basic parameters used for the estimation of beginning fusion, partial fusion, and fusion with
remaining scar.
There are two main problems encountered in the observation of epiphyseal closure. The first is a
consequence of the curation process and this is the practice of gluing epiphyses to the diaphysis.
Although this is not acceptable for modern collections, it was quite common in the early to mid-
twentieth century when these collections were developed. This practice appeared frequently in the
Adolph Schultz and the Museum of Central Africa collections. Confident detection of early fusion was
assigned when a bone bridge was visible between the epiphysis and the diaphysis, but if an epiphysis
was attached and no bone bridge was visible, a number of steps were taken to try and rule out the
presence of glue. When glue was clearly extruded from the edge of the hypertrophic zone, a confident
assessment of unfused could be made. This was the most common case observed. Occasionally glue
was not obviously extruded and could only be detected by inspection of the hypertrophic zone.

75
In some instances glue was ‘suspected’ but could not be seen and no bone bridges were visible. This
scenario happened typically with large long-bone epiphyses such as the proximal humerus and the
distal femur. The reason the term ‘suspected’ is used in this case is due to the unusual nature of fusion,
if fusion had actually occurred. When epiphyses are unfused there is a carilagenous complex that
makes up the gap between the ends of the diaphysis and the epiphysis when bones are de-fleshed. This
gap decreases in height with age and is typically 2-3mm in thickness for long-bones in humans just
prior to fusion (see analysis by Byers et al. 2000). When fusion initiates, the closing of the gap begins
in the centre and progresses outwards towards the sides (Scheuer and Black 2004), thus leaving a well-
defined space at the sides. These gaps are present in all mammals. It was observed in data collection
for this study that epiphyses in mid-fusion states for chimpanzees and bonobos appear to have gaps
consistent with humans in terms of height. When bone bridges are beginning to appear between the
epiphysis and the diaphysis at the point that the animal has died, the epiphysis is locked in place by the
bone bridges and that gap of 2-3mm remains at the edges despite the dissapearance of the cartilage.
When an unfused epiphysis is glued the gap is closed and the epiphysis forms an unusually ‘tight fit’ to
the diaphysis. In the event that there was reasonable grounds to suggest that this was the case a
designation of ‘unfused’ was assigned. This problem was also mitigated somewhat by the practice of
taking bilateral measurements, although often if one side was fused then the other was also fused.
Figure 3.11 Demonstration of glued epiphysis.

76
For some individuals, the bones had not been properly cleaned and a dried cartilage remained. This
cartilage could have the effect of ‘glueing’ an epiphysis to the diaphysis, as it had in life. Dried
cartilage is semi-transparent and an attempt was made to ‘see into’ the cartilage on these individuals to
observe if bone briding was occuring. If an assessment could not be made, a score was not recorded
and the site was reported as being obscured by cartilage. This issue was not as problematic for
projecting fusion timing as might be expected due to the tendency for the individuals with remaining
cartilage to be very young and not of an age when epiphyses begin fusing. It is quite possible that the
cartilage was left as a means of keeping the epiphyses in place while in older individuals this was less
of a concern. The issue affected not more than 10% of individuals, most of which were found at the
Museum of Central Africa.
3.2.6 Long-bone measurements
Similarly to the study of long-bone length in humans, the orientation of the bone had to be
standardised. The description of the orientations used in this study are presented in Table 3.11.
Measurements were taken for all long bones (humerus, radius, ulna, femur, tibia and fibula) using an
osteometric board. The axis of all long bones was taken be a straight line directly through the main
shaft of each bone. The radius and ulna in chimpanzees and bonobos are more curved than in humans
due to more substantive forearm musculature and this had to be accounted for in measurements. An
example of the axis of measure being projected through the radius is presented in Figure 3.9.
Table 3.22 Description of bone orientation for length measurements
bone orientationhumerus bone is positioned with the posterior surface on the board.radius bone is positioned with the posterior surface on the board. The bone naturally tilts laterallyulna bone is positioned with the posterior surface on the board. The bone naturally tilts medially
femur bone is positioned with the posterior surface on the board. The distal end lies flat causing lateral rotation of proximal end.
tibia bone is positioned with the posterior surface on the board. The bone naturally tilts mediallyfibula the distal articular surface is placed facing the surface of the osteometric board

77
Figure 3.12 Demonstration of the axis of measure through the radius and femur.
Epiphyses present a problem for measurement of long-bone length in sub-adults. All long bones were
measured regardless of whether epiphyses were present or not. An analysis of epiphysis presence and
number of contributing long bones to complete long-bone length is provided in section 3.6. A coding
variable was added for each bone that determined which epiphyses were present. This coding was as
follows:
Code 1: no epiphyses present
Code 2: only the proximal epiphysis is present, the distal is missing
Code 3: only the distal epiphysis is present, the proximal is missing
Code 4: both epiphyses are present.
It should be noted that for some individuals falling within codes 2-4, one or both epiphyses were
present but were not fused. As discussed previously with respect to glueing, epiphyses that are not
fused actually form a tighter ‘fit’ to the diaphysis than fusing ones due to the gap present for the
hypertrophic zone. This presented a slight challenge for measurement as there is a small difference
between what the length would be with or without the hypertrophic cartilage. There was no means to
correct for this at the measurement stage. It was determined that it was better to hold the epiphyses in

78
place rather than simply taking the length of the bone without the epiphysis. The hypertrophic zone for
a fusing epiphysis is is typically 2-3mm in thickness (Byers et al. 2000). This thickness constitutes
little more than 1% of length for all long bones at stages measured and was likely of little statistical
relevance.
3.3 Methodology: Dental development3.3.1 Overview of data processing in dental development
It was desired in this project to produce comparable results with other studies using established
techniques. Prior research of Pan troglodytes such as Kuykendall (1996), Kuykendall et al. (1992),
and Kuykendall and Conroy (1996) used the Demirjian (1973) method to analyse a single quadrant of
the mandibular dentition. In the present study this method was applied to produce a single summary
dental score for each individual. In order to achieve this, several steps of analysis had to be first
completed. As with most museum collections, missing teeth leading to missing data was a constant
problem. Maximizing the number of individuals with dental scores was desireable as sample size was
a limiting factor. The additional information provided by having two separate mandibular quadrants
was useful for side substitution to make complete sets. For some individuals, mandibular scores were
incomplete. In order to achieve the most complete set of scores the technique of multiple imputation
was applied (Schafer 2000). This method was able to generate scores for 9 individuals that had
incomplete dentition, bringing to the total number of individuals used in the epiphyseal fusion analysis
to 177. Complete analysis is found in section 3.3.3.
3.3.2 Assignment of dental scores
Dental scores were assigned with values from 1 to 8 using the Demirjian (1973) method for all adult
mandibular dentition including both left and right quadrants. Additional codes (9 and 10) were added.
The score of 9 represented missing tooth information whereby either the section of the mandible was
missing or the socket was clearly present but the tooth was absent. The score of 10 represented no
evidence for tooth presence. This was confirmed initially by visual observation of no socket presence
or perforation of alveolar bone and subsequently by radiographic analysis.
The score of 10 requires some further clarification with respect to the analysis here. This score did not
provide a reason for the absence of the tooth. There were a few potential causes of a tooth being
absent and thus assigned a score of 10. The first was if an individual was too young to have a
mineralized third molar. The second when a tooth was missing due to either agenesis or decay/trauma,
either of which counts as missing data with respect to dental score. There are two ways of processing
this type of missing data. Either the score represents a very young individual and counts as a ‘0’ when

79
generating the summary score, or it represents a missing tooth category and is treated as missing data.
Based on the analysis of Kuykendall (1996) and Kuykendall and Conroy (1996), if an individual had a
first molar of at least stage 3 a third molar crown was very likely to have been present. Any individual
with a first molar of this stage or higher was considered to be missing the tooth and thus was re-
classified as having missing data. All individuals in the data set were recoded as either ‘0’ or ‘-’ with
‘0’ representing lack of development and ‘-’ representing missing data.
3.3.2.a Recoding and completion of sets
A composite score was calculated since only a single dental score for each individuals was required.
All individuals had the potential to provide left and right quadrant scores. Not all individuals had
complete dentition and many individuals were missing teeth. There were three conditions in which
individuals in this study could be classified:
Condition 1: when both sets were complete for both quadrants of the mandible. In this case a
summary score for both left and right was available for all 8 teeth.
Condition 2: when only one quadrant (left or right) mandibular score was complete.
Condition 3: when neither side was complete.
3.3.2.b Comparison between sides for individuals in Condition 1
Past research suggests that a statistically significant difference between sides for Pan troglodytes is not
to be expected (Kuykendall et al. 1992) but a small amounts of individual variation and sample error
would be entirely likely. To what extent this would hold true for Pan paniscus is not known but it is
assumed this species would show a similar pattern. A trend towards directionality in deviations would
also suggest the possiblity of inconsistency in the application of the Demirjian method. Table 3.12
summarises the variation found.
Table 3.23 Number, direction and percentage of deviations between sides of the mandible
species left minus right total number present1. % of deviations2.
Pan paniscusminus3. 5
98 6.1%plus4. 1
Pan troglodytesminus 13
593 4.4%plus 13
1. The total number of pairs of teeth present for bilateral assessment. The total number of teeth is double this value.
2. The percentage of cases out of the total number of tooth pairs where there was an asymmetry between sides.3. The deviations in which a negative number appeared as the difference.4. The deviations in which a positive number appeared as the difference.

80
In chimpanzees it was found that the vast majority of individuals had no difference between sides
(96.6%). Of the deviations between sides, there was a perfectly even split between positive and
negative deviations, suggesting the variation was random. The percentage of cases which had identical
scores for both sides in bonobos was also high with 94.9% showing the same value for both sides. The
deviation appears biased towards the right side. By using a binomial probability equation it is possible
to show that the two sides do not differ and the deviations are erroneous or random.
Binomial probability equation:
P(k out of N) =N!
k!(N-k)!(pk)(qN-k)
In this instance, k refers to the number successes (minuses), N refers to the total number of trials (both
pluses and minuses), and p/q refer to the probability of success and failure (in this case both are equally
probable). If it is assumed that the probability of positive or negative values would be p/q = 0.5, N = 6
and k = 5, then using the binomial probability equation our P(k out of N) = 0.09375. If the cut-off at P(k out of
N) = 0.05 is set then we fail to reject the null hypothesis.
3.3.2.c Conditions 2 and 3
For Condition 2, where only one side (left or right) had a complete score, the only complete score
present was simply placed in the final score variable. For some individuals with mandibles in
Condition 3 where neither left nor right had complete dentition, there was the possibility of producing
a ‘complete’quadrant by combining missing values from either left or right scores. Dental scores were
thus possible for individuals with a number of missing teeth. Table 3.13 shows the number of
complete scores for both left and right quadrants by species. Note that composites included all
individuals with a complete quadrant plus those with assembled quadrants derived from individuals
with Condition 3 where left and right teeth were combined to make a full quadrant.
Table 3.24 Number of complete scores for both left and right quadrants by species.
species/sub-species total sample
complete right mandibles
complete left mandibles
complete composite mandibles
P. paniscus 37 14 13 22P. troglodytes1 177 116 130 145unidentified Pan 5 4 4 4total 219 134 147 171
1. combined Pan troglodytes includes all sub-species

81
Complete composite mandibles make up a large proportion of the total sample size with 78% (171 of
219) present but there still remained missing individuals. There were 15 individuals that had no skull
present, these being a single bonobo and fourteen chimpanzees.
3.3.3 Incomplete quadrants and imputed data
In the sample there were 47 individuals with mandibles that did not have complete composite dental
scores. For 19 of these individuals there was no skull present and a score was not possible to calculate.
However, for 28 of the individuals there were at least some teeth present. Of those 28 individuals, the
mean number of teeth present was 11.63 ± 2.6 out of total possible sample of 16 (two quadrants of 8).
This figure does not indicate the distribution of missing teeth but it is inferred that each of these
individuals would be missing at least one tooth category. This amounts to at least 2 out of 16 missing
with the highest completeness value for any individual of 87.5%. Provided that not all individuals
were only missing one tooth and a small number of individuals were missing many, this would suggest
that for most individuals the majority of teeth were present. Table 3.14 demonstrates number of teeth
present by tooth category. The pattern of missing teeth is typical of tooth loss in osteological
collections with incisors frequently missing and molars most often present.
Table 3.25 Missing tooth frequency analysis for individuals with incomplete quadrants.
quadrant tooth number present percentage present1.
right mandible
incisor 1 10 33.3%incisor 2 18 60.0%canine 23 76.7%
premolar 3 27 90.0%premolar 4 26 86.7%
molar 1 23 76.7%molar 2 25 83.3%molar 3 21 70.0%
left mandible
incisor 1 11 36.7%incisor 2 23 76.7%canine 23 76.7%
premolar 3 21 70.0%premolar 4 23 76.7%
molar 1 25 83.3%molar 2 27 90.0%molar 3 23 76.7%
1. This is the percentage present out of the total number of individuals with present skulls that have dentition (n=30).

82
With the majority of teeth present for most individuals, it is possible to confidently predict what the
missing values should be based on patterns of the data available. The statistical methodology to be
used here is multiple imputation (Schafer 2000). Multiple imputation is an algorithm-based method
that determines patterning in the data set and then produces a most-likely value for a missing data entry
based on the teeth that were present. With many incomplete quadrants missing only a small number of
teeth and with the sample being relatively large (204 skulls with teeth present), it would be expected
that the application of this method would be robust.
3.3.3.a Preparation of tooth data for multiple imputation
There existed the potential for developmental inter-specific differences as well as intra-specific
differences between males and females. Males and females were analysed separately for Pan
troglodytes while a mixed-sex sample was used for Pan paniscus due to sample sizes being too small
for independent analysis of Pan paniscus males and females. For this species males, females, and
unsexed individuals were pooled and imputation carried out using all 33 individuals (4 individuals did
not have teeth). There is a risk of this method being unreliable if there existed significant differences
in patterning (as opposed to timing) of dental maturation between sexes. Given the results of
Boughner et al. (2012) showing high degrees of similarity, this seems unlikely. In chimpanzees and
humans it is known that the overall pattern of maturation does not show major deviations between
males and females. The assumption is made that this should be true for this sample as well.
Included in this analysis were also individuals with complete quadrants, those with teeth missing from
one side or the other but having a complete composite score, and those individuals with incomplete
composite scores. These data were loaded into SPSS Statistics 21. Variables were first analysed to
look at the distribution and patterns of completeness. Both left and right quadrants were analysed in
parallel within the same analysis. Based on the premise that there is no statistically significant
difference between sides (Kuykendall et al. 1992), this approach made more sense than running each
quadrant separately due to more complete data being present. Five iterations were run on each
quadrant and these results were then compiled into an imputed data set. Imputed values were produced
for all missing teeth from both left and right sides. Summary dental scores were taken for all
individuals. Full imputation results are available in section 8.1 of the digital appendix. The resulting
analysis of missing values are available in section 8.2 of the appendix for all three species. The total
number of individuals with mandibular scores evaluated in the analysis is shown in Table 3.15. It is
evident that all of the incomplete individuals that could be added for Pan paniscus and Pan troglodytes
were added. It should be noted that the one bonobo that could not be added by imputation had only
two teeth present, the left and the right I2, both of which were fully mature.

83
Table 3.26 Number of individuals brought forward for analysis by the use of multiple imputation.
data typeP. paniscus
NP. troglodytes
N
total individuals1. 37 171missing skulls 4 15individuals with at least one permanent tooth 33 156composite or complete mandible scores 19 131incomplete individuals (sexed and unsexed) 12 25incomplete individuals for male and female Pan troglodytes 2. - 16individuals added by imputation2. 11 16final no. individuals for analysis 32 147
1. This is the total number of individuals in the study sample. 2. This excludes unsexed individuals.
3.3.4 Distribution of dental scores
With the final dental scores now produced it is necessary to consider the distribution of scores as these
will provide the range of development to be considered. It would be desirable to have an even spread
of scores across a wide range of ages, although this may not be achievable. This study measured both
long bone length and epiphyseal fusion and the distributions of data required for each are not
analagous. Epiphyseal fusion requires a large group of individuals between the ages in which fusion
begins to occur and completes. These events occur relatively later in development, often completing at
the end of the growth. Conversely, long-bone length is continuous throughout the entire process of
growth from birth to maturity. Prior studies of human epiphyseal closure have shown that this growth
parameter can be quite variable. Whether it is more variable than long-bone growth rates is not a
question that can be easily answered at this juncture. However, it is desired to have a large sample size
for epiphyseal fusion ages as this variable is quite critical for this study. Table 3.16 provides numbers
of individuals presented in dental score intervals of 10.

84
Table 3.27 Distribution of dental scores sorted by intervals of 10 for both species and sexes.
Pan paniscusdental score male female no sex all individuals
0 to 10 0 0 0 010 to 20 2 0 0 221 to 30 2 0 3 531 to 40 2 2 0 441 to 50 3 0 0 351 to 60 4 4 1 9
61 + 4 5 0 9sum 17 11 4 32
Pan troglodytesdental score male female no sex all individuals
0 to 10 0 0 2 211 to 20 4 6 3 1321 to 30 9 9 2 2031 to 40 9 6 0 1541 to 50 11 13 5 2951 to 60 14 15 2 31
61 + 12 37 3 52sum 59 86 17 162
The majority of individuals in the sample were at later stages of dental development for both species.
The proportions of individuals at each stage was approximately equivalent for both bonobos and
chimpanzees but the sample size was much larger for Pan troglodytes. Dental scores 0 to 10
corresponds to either newborn or fetal individuals (Kuykendall 1996). The lack of samples in this
range was to be expected and was not of great concern. The sample size increased dramatically from
dental score range 21 to 30 towards maturity. Kuykendall (1996) placed individuals in the range 21 to
30 at between 2 to 4 years of age. It seems unlikely that epiphyseal fusion for any epiphysis would be
initiated by this young of an age due to the fact that a large amount of growth has yet to be achieved
after this age. As a point of reference, Bolter and Zihlman (2012) estimated the intiation of fusion for
the distal humerus at between 6-7 years for captive and 7-10 years for wild individuals of both species.
In humans this is quite an early fusion event and although it presupposes that chimpanzees and humans
do not differ by such an extreme amount as to overlap these ranges, it would seem unlikely that this is
true purely from a developmental standpoint. It could be safely assumed that the higher dental score
values encompass the majority if not all epiphyseal fusion events. The lack of individuals at lower
stage ranges may result in more variation for analysis of Pan paniscus but would be sufficient for
analysis of Pan troglodytes from stage 11 to 20 and higher as shall be shown in the analysis of
epiphyseal fusion and long-bone length.
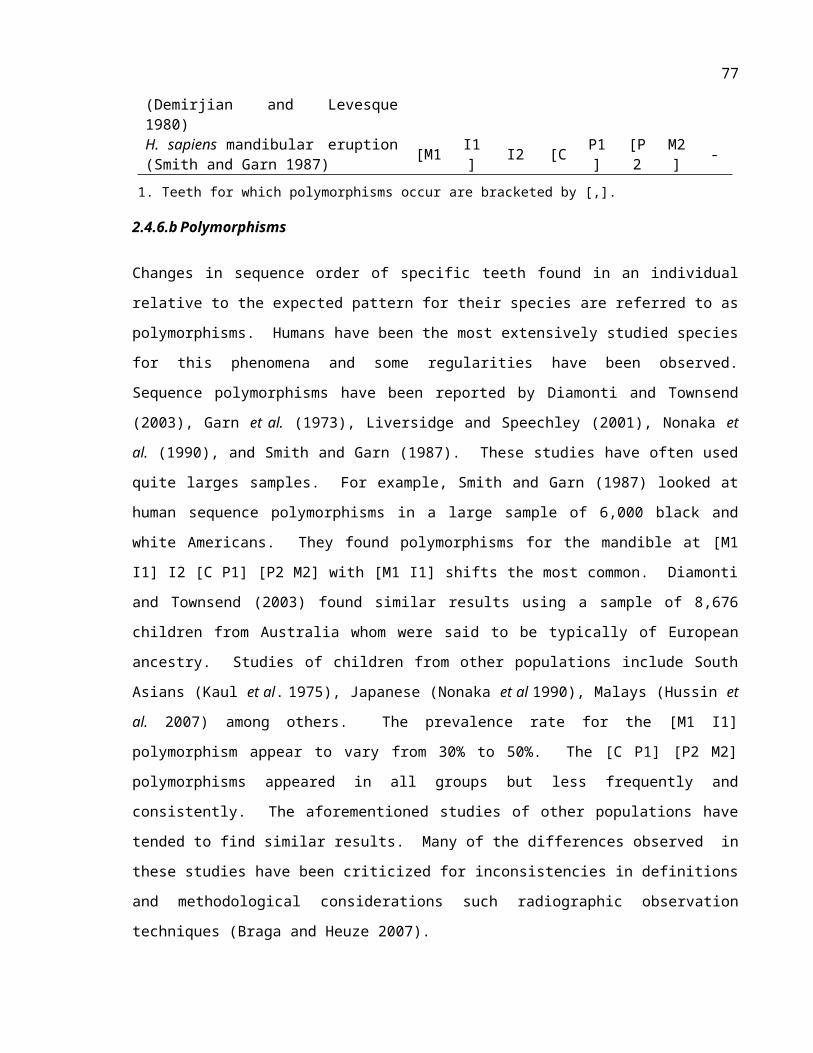
85
3.3.5 Intra- and inter-observer error
Testing the consistency of measurement involved the re-evaluation of dental score for a randomised
selection of 20 individuals. For intra-observer error, 15 individuals were re-evaluated by the primary
researcher (Conrad Brimacombe, CB) and 12 different individuals were evaluated by a colleague
(Isabelle Heyerdahl-King, IHK). Table 3.17 provides a list of the individuals used. It should be noted
that prior to full-scale data collection, 10 individuals were completed by CB. These were discussed
and compared with the results of Dr. Kuykendall such that variation could be reduced by having the
observer being already accustomed to the system prior to data collection. In order to apply the same
effect to the inter-observer error candidate (IHK), 5 preliminary trials were done before the 12
observed here and were not included in this analysis.
Table 3.28 Individuals used for intra- and inter-observer error analysis.
inter-observer error intra-observer errorsample species sample species
MCA 84036M03 Pan paniscus MCA 29057 Pan paniscusMCA 29060 Pan paniscus MCA 29040 Pan paniscusMCA 80046M02 Pan paniscus MCA 29043 Pan paniscusMCA 29055 Pan paniscus MCA 29047 Pan paniscusMCA 11293 Pan paniscus MCA 16380 Pan troglodytesMCA 29021 Pan paniscus UZ 7056 (K81 V-B) Pan troglodytesMCA 29056 Pan paniscus UZ PAL-190 (K81 VI-A) Pan troglodytesMCA 9931 Pan troglodytes UZ 7421 (K81 V-B) Pan troglodytesPCM M805 Pan troglodytes MCA 9584 Pan troglodytesPCM M967 Pan troglodytes PCM M274 Pan troglodytesPCM M299 Pan troglodytes MCA 30660 Pan troglodytesPCM M655 Pan troglodytes UZ AS-310 (K81 / 5-D) Pan troglodytes
MCA 23511 Pan troglodytesUZ AS 778 (K81 VI-D) Pan troglodytesUZ 10742 (K81 V-D) Pan troglodytes
3.3.4.a Intra-observer error
The results for the 15 individuals that were re-evaluated by CB were compared to the original data set.
This set of 15 individuals was re-evaluated some months after the original scoring of the teeth. Any
anomalous individuals such as those with a particular pattern of tooth loss/damage or super-numery
teeth were avoided. The total number of deviations were counted. With the exception of one outlier
that differed by three stages, no teeth deviated by more than one stage. It is suspected that this outlier
may have been due to mistaken tooth identity in the X-ray. There were 18 deviations reported from a
total of 212 observations producing a deviation rate of 8.5%. If deviations were random it would be

86
expected that the number of positive deviations would approximate equal numbers and this was indeed
the case with 9 deviations higher and 9 lower. The deviations were evenly spread across all tooth
types. Kuykendall (1992) found that greatest number of deviations were for stages 1,3 and 8. The
pattern of deviations in this analysis were similar to these results with proportionately higher levels of
variations found between stages 2 to 4 (few stage 1 teeth were present in this sample). Table 3.18
provides these values.
Table 3.29 Number of deviations by tooth stage for intra-observer error.
stage change1. N5 to 32. 12 to 3 53 to 4 54 to 5 25 to 6 16 to 7 27 to 8 2total 18
1. Stage change refers to the deviation from one stage to the next. This includes all deviations from higher to lower comparing either second observation to original or vice versa.
2. This is the outlier mentioned in the above text.
The distribution in Table 3.18 is not even and the reason for this pattern is likely a consequence of
varition in the difficulty of applying the classification criteria. The difference between stages 5 and 6,
for example, requires the root to either be shorter than crown height (stage 5) or longer than crown
height (stage 6), which is a feature that can be easily distinguished in an X-ray of even marginal
quality. However, the difference between stage 3 and stage 4 is defined by the completion of the
crown (stage 3) and initiation of cementum deposition (stage 4), which is a distinction that is much
more difficult to observe. Similarly, it can be difficult to discern between the later stages of an
incomplete crown (stage 2) and a recently complete one (stage 3). Variation in individual crown
morphology could have an effect on the judgement of the observer as to whether the crown was
complete or not. The difficulty in determining the distinction between these stages was more
pronounced for canines where chimpanzee and bonobo teeth do not morphologically match the human
teeth in the scoring system very well. A further complication for assessment of these criteria was the
rotation of tooth crowns within the crypt. This tended to occur for stages below a Demirjian dental
score of 5.

87
In order to test consistency over time, it was also important to rule out any trend towards higher or
lower scores in the small number of deviations found. In other words, it was hoped that the observer
did not have any positive or negative shift over time. There were 11 deviations that went down one
stage and 7 deviations that went up one stage. The binomial probability equation was used and
positive and negative values were considered. It was postulated that they were randomly distributed
above and below 0 with equal probability. Here, k = 7, N = 19, and p/q = 0.5. It was found that P(k out of
N) = 0.12 and the possibility that there was a trend of deviation towards lower or higher scores was
rejected.
As a summary statement, intra-observer error comparisons suggest that the data are consistent with a
small rate of insignificant error. This error was concentrated between certain stages and was
demonstrably random.
3.3.4.b Inter-observer error
The results for the 12 individuals completed by IHK were compared to the assignments done by CB.
There were 21 deviations from a total of 131 teeth, producing a deviation rate of 16.8%. This was a
higher deviation rate than reported for intra-observer error. The distribution of deviations was again
quite evenly spread through the dentition and deviations were never more than 1 stage apart. Of those
21 deviation, 11 were negative and 10 were positive. This also suggested that there was no tendency
towards positive or negative values. Here, k = 10, N = 21, and p/q = 0.5. It was found that P(k out of N) =
0.17. Table 3.19 lists the number of deviations by stage type.
Table 3.30 Number of deviations by tooth stage for inter-observer error.
stage change number3 to 2 24 to 5 85 to 6 57 to 8 6total 21
More deviations were apparent between stages 4 to 5 when compared to intra-observer error. There
were also a higher number of deviations between 5 to 6. These deviations were less consistent with the
deviations found by CB, and also Kuykendall (1992), but they nonetheless represent an acceptable
level of overall error.

88
To summarise inter-observer error, the values of deviation determined here were similar in nature to
intra-observer error but with a slightly higher prevalence rate. There was no notable directionality of
deviations towards positive or negative values. The patterning of these results was similar to that
found by Kuykendall (1992), suggesting that there is sufficient consistency in application of the
Demirjian (1973) method in this research.
3.4.4.c Error analysis of the method from other studies
With regards to further academic study of the reliability of the Demirjian method, analysis has been
completed that has considered both accuracy and precision. There has been some variation with
respect to the prediction of exact chronological age (Koshy and Tandon 1998, Nykänen et al. 1998) and a comparison using a more refined polynomial function (Chaillet and Demirjian 2004). There have been some modifications to refine the applicability of the method for different populations and to refine growth curves (Teivens and Mörnstad 2001a, 2001b). Since the chronological ages are unknown in this sample the level of accuracy of age estimation cannot be compared. However, the most important point to draw from these studies is that the overall precision of the method has not been challenged. For further discussion see Liversidge et al. (2006). The results found the current study stand comparatively well with other studies.
3.4 Epiphyseal fusion3.4.1 Determining combined sample values for analysis of epiphyseal
fusion
Bilateral assessment was taken for all epiphyses when possible. With the primary objective being to
provide information on general state of fusion, a combined sample variable was created for each
epiphysis. This variable provide a single value from each epiphysis for each individual. Humans have
shown sight lateralisation with respect to upper limb length but there is no evidence for lateralisation of
epiphyseal union. Based on this fact it is assumed that epiphyseal fusion is not lateralised and that
there is no population-level difference between left and right side.
For all individuals where there was only one side present, this value was simply transferred to the
combined sample variable. For those individuals that had both scores; if those scores were exactly the
same then this value was again transferred directly to the combined sample variable. However, on
some rare occasions there existed a difference between sides. Based on the principle of fluctuating

89
asymmetry and developmental stability (Klingenberg and McIntyre 1998, Palmer and Strobeck 1986,
1992), small amounts of variation between sides would be expected. Small amounts of sampling error
may also be expected, although with both bones being observed at the same time, deviations caused by
wrongly classifying or inputting data for an epiphysis was considered highly unlikely. This was due to
the fact that any observed difference between sides was immediately apparent to the observer.
Whenever this situation arose during the data collection process the bones would be re-evaluated such
that this difference could be confidently recorded. Developmental asymmetry has been correlated with
environmental stress and in order to detect more extreme cases some analysis is warranted with respect
to the distribution of asymmetry within this data set.
3.4.1.a Analysis of frequency difference
Table 3.20 provides the number of bilateral asymmetries for each epiphysis and the the total sample
size of bilateral measurements. When values in the column ‘number of individuals with a difference
between sides’ are considered, the variation is evidently small, typically between 2 and 4 percent. This
variation is also quite evenly spread across all epiphyses. These values are sufficiently consistent that
it may be asserted that there was no evidence for concentration of bilateral asymmetry towards any
specific epiphysis.
In total, 67 individuals (30.8%) of the sample had at least one asymmetry. Pathological conditions
observed in the sample were recorded and these included broken bones, unexplained lesions, and linear
enamel hypoplastic defects (see analysis of pathology in section 3.1.6). The prevalence rate of
reported pathological conditions excluding recently broken bones was determined both for individuals
with asymmetries and for those without. Evidence for recent trauma such as recently broken bones
was not considered potential evidence for insult to systemic health. The proximity to age at death
likely had no longer-term implications for health status and thus would not impact on the individual as
far as this study would be concerned. It was found that for the 67 individuals with asymmetries, 13
showed some possible sign of abnomormality (19%) while 27 of the remaining 152 individuals without
asymmetries (18%) show signs of abnormalities. Application of a chi-squared statistic using these
values provides an non-significant result (χ2 = 0.082953, p = 0.9593), suggesting that the population of
suspected pathological individuals were not more likely to be asymmetric than the overall population.

90
Table 3.31 Sample size and frequency of differences between sides for epiphyseal fusion.
bone epiphysis
number of individuals
contributing bilateral
measurements
number of individuals
with a difference between
sides1.
humerus
proximal epiphysis fusion 198 4 (2.0%)distal capiptulum/trochlea/lateral epicondyle fusion 198 4 (2.0%)distal medial epipcondyle fusion 198 5 (2.5%)
radiusproximal epiphysis fusion 195 7 (3.6%)distal epiphyses fusion 194 4 (2.1%)
ulnaproximal epiphysis fusion 193 5 (2.6%)distal epiphyses fusion 195 8 (4.1%)
hand
distal phalangeal epiphyses fusion 64 1 (1.6%)base of metacarpal 1 fusion 139 2 (1.4%)proximal and middle phalangeal epiphysis fusion 163 1 (0.6%)heads of metacarpals 2-5 fusion 181 0 (0.0%)
femur
femoral head fusion 191 4 (2.1%)greater trochanter fusion 191 3 (1.6%)lesser trochanter fusion 190 3 (1.6%)distal epiphysis fusion 189 4 (2.1%)
tibiaproximal epiphysis fusion 190 2 (1.1%)distal epiphysis fusion 190 4 (2.1%)
fibulaproximal epiphysis fusion 190 6 (3.2%)distal epiphysis fusion 189 3 (1.6%)
foot
calcaneal epiphysis fusion 171 0 (0.0%)talar epiphysis fusion 170 1 (0.6%)distal phalanges, middle phalanges,metatarsal heads 2-5 fusion
170 7 (4.1%)proximal phalanges and base of metatarsal 1 fusion 166 4 (2.4%)
pelvis
triradiate epiphysis fusion 210 5 (2.4%)anterior inferior iliac spine fusion 206 0 (0.0%)iliac crest fusion 202 4 (2.0%)ischial epiphysis fusion 206 5 (2.4%)
claviclemedial epiphysis fusion 180 3 (1.7%)lateral epiphysis fusion 170 0 (0.0%)
scapula
coracoid process fusion 195 8 (4.1%)sub-coracoid centre and glenoid epiphysis fusion 193 4 (2.1%)acromial epiphysis fusion 190 4 (2.1%)medial border 190 4 (2.1%)
mean values 183.5 3.6 (1.9%)
1. The number with a difference between sides refers to the number of individuals with bilateral asymmetry of epiphyseal union, regardless of the magnitude of difference. The percentage in brackets is this value as a percentage of the total number of bilateral measurements in the adjacent column.

91
When considering the net number of deviations by individual for the entire data set, the highest number
came from a single individual with 6 asymmetries. It was noted that there were difficulties in
measuring this individual due to gluing of epiphyses and this may have been a source of ambiguity for
measurement. This individuals was not an extreme outlier and data from this individual was analysed.
The remainder of individuals with asymmetric epiphyses ranged from having 1 to 4 deviations with a
mean value of 1.68. Even if these values were considered as a percentage of data entries present for
each individual, the numbers were not large enough for any difference from randomness to be found.
It is therefore possible to conclude that asymmetry of epiphyseal fusion in this data set is the result of
very small amounts of variation caused either by measurement error or minor biological variation.
Differences between sides did not concentrate within specific individuals which were either identified
as potentially being pathological or otherwise.
The question remains as to how to deal with these asymmetries. It was decided to take the higher of
the two scores for the epiphysis (more advanced stage). This arbitrary decision is equally as acceptable
as staging down but has one advantage. For those epiphyses where one side had stage 2 fusion
(beginning fusion) while the other was completely unfused (stage 1), selecting the lower score would
mean that no fusion was recorded as having occured at all for the epiphysis, which is incorrect. It
should also be noted that any obscuring effect of choosing the higher or lower value would likely be of
little or no statistical relevance due the very lower prevalence rate of these asymmetries.
For all individuals where only one side was present, the value for that side was simply added to the
final variable. For those individuals where both sides had exactly the same value, again that value was
simply transferred to the final value. For the majority of epiphyses, 85-90% of individuals with dental
scores were able to contribute values to the final fusion scores. There were some sites that deviated
from this assertion and these were mostly hand and foot bones with the distal phalanges of the hand
being the most prominent outlier. These deviations were expected as these bones are small and easily
lost in the curation process.
3.4.2 Ordering the sample and generated scores
Pan paniscus and Pan troglodytes individuals were sorted into individual data sets by sex and then
ordered by dental score from lowest to highest. There were some instances where individuals had the
same dental score, especially those with higher scores. This was of particular importance for the case
of individuals with a dental score of 64 because this constituted fully mature dentition. For individuals
with fully mature dentition (dental score 64), there there were 23 female and 5 male Pan troglodytes

92
and 3 female and 2 male Pan paniscus. The presence of a large number of dental score 64 (DS64)
individuals for both species and both sexes indicates that skeletal maturity proceeds dental maturity.
As opposed to the human pattern where the third molar erupts quite late in the developmental
sequence, it is known from tooth emergence data that in catarrhine primates including studies of apes
that full dentition is in place prior to full skeletal maturity (Bolter and Zihlman 2003, Schultz 1942,
Zihlman et al. 2007). The timing of root completion, as opposed to emergence with respect to skeletal
maturity has not been explored, although it would not be an unreasonable supposition to expect that the
difference between the two would not be substantial. The relative timing of these events is what this
study seeks to clarify. Chronological timing of third molar completion is available from Anemone et
al. (1991, 1996), Kuykendall (1996) and Kuykendall and Conroy (1996) but there is no certainty as to
how these age ranges relate to skeletal maturation. Past reported ranges for later epiphyses by Bolter
and Zihlman (2012) and Kerley (1966) overlap third molar maturity. This was evidently a problem for
analysis of this data set due to the maximal age indicator being reached for many individuals prior to
the fusion of multiple epiphyses.
For DS64 individuals in female Pan troglodytes it was observed that unfused epiphyses for the distal
radius, distal ulna, iliac crest, the acromium, the medial border of the scapula, and the medial clavicles
were common. The number of individuals with unfused epiphyses for these bones ranged from 5 to 16
depending on the epiphysis. There were also 12 other epiphyses for which there were up to four
individuals with unfused scores. This pattern was repeated for the male Pan troglodytes sample. For
Pan paniscus individuals of both sexes these epiphyses were also unfused, although the numbers for
each were inevitably smaller due to the difference in sample size. The criteria used to select
individuals to be included in this sample was the presence of any remaining unfused epiphyses
including individuals with only a remaining epiphyseal fusion scar line. When preliminary analysis of
collections was completed prior to full-scale data collection for estimating the number of sub-adults
available, it was observed that it was either the iliac crest or the medial clavicle were the last remaining
unfused epiphyses. All other fusion centres were completely mature before these epiphyses. With the
iliac crest and medial clavicle serving as an end-point and with unfused epiphyses present for the distal
radius, distal ulna, the acromium and the medial border of the scapula, it would thus stand to reason
that within this sample of DS64 individuals that there should be a range of fusion states observable.

93
3.4.2.a Generated Scores: Theory
A core objective of this study is to chart the sequence of epiphyseal fusion. With dental score being a
limiting factor for later stage fusion events, a different approach was attempted. To solve this problem,
a strategy was used based on the simple premise that all epiphyseal fusion plates will eventually fuse
and that there is a general underlying pattern in which they fuse. Fundamentally this must be true
given all past research. Dermirjian scores for dentition were a sum of a series of ordinal variables that
increased in value with time. Epiphyseal fusion scores, which are also a series of increasing ordinal
variables, behave likewise. If a summary or mean value of these epiphyseal fusion scores was taken
for each individual, then it would be expected that as age increased that summary epiphyseal fusion
score would increase in tandem. It shall be shown in section 3.4.2b that mean value is more
appropriate in this study. These mean value scores could then be used to order individuals based on
increasing levels of skeletal maturity. This would not provide any means to anchor epiphyseal fusion
events with respect to the dental maturity but it would provide information regarding the order in
which epiphyses fuse beyond dental maturity. The only potential challenge of doing this would be if
fusion events substantially overlapped ranges of variation between epiphyses. This would mean that
epiphyseal fusion scores would tend to cluster around similar values. In section 4.2.4 this will be
shown to not be the case and distinct differences in position of fusion events will become apparent.
3.4.2.b Producing mean epiphyseal fusion values for generated scores: Limitations and approach
DS64 individuals from this point forward in the analysis of epiphyseal fusion will be considered a
special subset of dental score. Ideally, producing a summary score for epiphyseal fusion centres would
be the best method for assessing maturity and is a direct analogue of dental score. A sum of all scores
could be taken and individuals ordered based on increasing score. However, in reality determining a
generated score by simply adding all values for each fusion event and comparing scores in a similar
fashion to dental scores would have been inadequate due to the problem of incomplete data. Missing
data occurred no more frequently than it did with dental scores but the variables involved were more
numerous. As opposed to 8 teeth, there were 33 epiphyses, and thus the likelihood that an individual
would be missing at least one data entry was much higher.
Tables 3.21 and 3.22 show the distribution of missing data for epiphyseal fusion. The cumulative
percentages show that that majority of individuals were missing data entries for small number of
epiphyseal fusion sites. Individuals missing greater than 10 entries made up only 5.65% of individuals.

94
These individuals were ones where only a small number of bones were present but their inclusion was
still considered useful due to the provision of a complete dental score.
Table 3.32 Frequencies of missing values for epiphyseal fusion sites in Pan paniscus and Pan troglodytes.
no. missing entries individuals percentage of total cumulative percentage
0 53 29.94 29.941 74 41.81 71.752 13 7.34 79.103 10 5.65 84.754 7 3.95 88.705 1 0.56 89.277 2 1.13 90.408 5 2.82 93.229 2 1.13 94.35
10+ 10 5.65 100.00total 177 100.00% 100.00%
1. The cumulative percentage is calculated as the sum of all individuals in the current stage and all stages with lower numbers of data points missing presented as a percentage of the total sample.
Apart from the distal phalanges of the hand, the number of missing entries was quite small per
epiphysis. The number of missing entries for individuals showed an even spread of missing data
throughout the sample set except for distal phalanges (Table 3.21). With the pattern of missing values
evenly spread, simply removing variables with missing data points such that all sets would be complete
would not be practical. For example, this would require the loss of the medial border of the scapula
and all pelvic fusion sites except the tri-radiate. The removal of the affected individuals is also
problematic due to the fact that individuals missing one of these entries for one bone were not
necessarily the same individuals that were missing entries for another. This would cause the sample
size to shrink to an unacceptably small size. However, what has been shown here is that the overall
level of missing data for most individuals was quite small with typically only a few percent of entries
missing. An approach was taken whereby a mean value for all epiphyseal fusion sites for each
individual was produced as opposed to a summed score. This method would smooth out occasional
missing data and approach the robusticity of summed scores due to the comparatively small level of
incompleteness. A mean value is more appropriate than a median value in this circumstance because
all epiphyses present contribute to a mean. If, for example, a very young individual begins fusion at
two epiphyses, the median value for all epiphyses would remain 1, while the mean would encompass
these fusion events and be slightly greater than 1. Mean epiphyseal fusion scores were calculated for
all individuals with DS64 for both the Pan paniscus and Pan troglodytes sample. Mean values for

95
epiphyseal fusion of DS64 individuals score ranged from 2.47 to 4.91 with the majority of the values
falling between 4 and 4.91. It can be fairly confidently asserted that there was a considerable amount
of fusion occuring after dental maturity.
Table 3.33 Missing data by epiphysis showing number of individuals for the entire sample and for DS64 individuals
bone epiphysisdata
entries (whole
sample)
number missing (whole
sample)
data entries (dental score 64
individuals)
number missing (dental score 64
individuals)
humerus
proximal epiphysis fusion 173 4 30 0distal capiptulum/trochlea/lateral
epicondyle fusion 173 4 30 0
distal medial epipcondyle fusion 173 4 30 0
radiusproximal epiphysis fusion 171 6 30 0
distal epiphyses fusion 170 7 30 0
ulnaproximal epiphysis fusion 172 5 30 0
distal epiphyses fusion 171 6 30 0
hand
distal phalangeal epiphyses fusion 66 111 6 24base of metacarpal 1 fusion 134 43 27 3
proximal and middle phalangeal epiphysis fusion 150 27 29 1
heads of metacarpals 2-5 fusion 162 15 29 1
femur
femoral head fusion 173 4 30 0greater trochanter fusion 173 4 30 0lesser trochanter fusion 173 4 30 0distal epiphysis fusion 173 4 30 0
tibiaproximal epiphysis fusion 172 5 30 0
distal epiphysis fusion 171 6 30 0
fibulaproximal epiphysis fusion 170 7 29 1
distal epiphysis fusion 171 6 30 0
foot
calcaneal epiphysis fusion 163 14 29 1talar epiphysis fusion 160 17 29 1
distal phalanges, middle phalanges, metatarsal heads 2-5 fusion 156 21 28 2
proximal phalanges and base of metatarsal 1 fusion 160 17 29 1
pelvis
triradiate epiphysis fusion 173 4 30 0anterior inferior iliac spine fusion 170 7 29 1
iliac crest fusion 167 10 28 2ischial epiphysis fusion 169 8 28 2
claviclemedial epiphysis fusion 171 6 30 0lateral epiphysis fusion 159 18 28 2
scapula coracoid process fusion 173 4 30 0sub-coracoid centre and glenoid
epiphysis fusion172 5 30 0

96
acromial epiphysis fusion 172 5 30 0medial border 170 7 29 1
mean values 164.42 12.58 28.70 1.30
3.4.2.c Using mean values to produce generated extended dental scores
These special subsets of DS64 individuals were analysed separately as four sub-sets, these being Pan
paniscus females, Pan paniscus males, Pan troglodytes females and Pan troglodytes males. For un-
sexed individuals, none of the Pan paniscus specimens had DS64 while there was a single Pan
troglodytes individual in this category. As such, un-sexed individuals are not included here. Mean
epiphyseal fusion values were used to order each of these sub-sets by their skeletal maturity, which
resulted in two separate systems, dental score and skeletal score. Dental score allows for analysis of
development up to the point of dental maturity while skeletal score allows for observation of fusion
events after dental maturity.
A means by which to visualise fusion events after dental maturity but still using dental score would be
to add increments to DS64 individuals such that the relative state of fusion past dental maturity may be
observed. As an example, if there are n individuals with DS64, an incremental additional value would
be added to 64 of x for the ith individual, generating a new score Si. In other words, Si = 64+i(x). If x =
0.3, then this will mean that for individuals S0, S1, S2 … Sn the values 64.0, 64.3, 64.6 … 64.0 + (n ×
0.3) are achieved. The value of x is arbitrary. However, the choice of value does have an impact on
scaling and should be proportionate to the number of individuals present. For Pan troglodytes females,
for example, there were 23 individuals with DS64. If the incremental score of 0.3 is used, then there is
a range from the youngest individuals of 64 to 70.6 for the oldest individuals. As will be shown in
section 4.2.4, this scaling factor allows for the relative timing of fusion events to become clearly
visible beyond the dental score of 64. With individuals sorted by dental score and additionally by
mean epiphyseal fusion score it is possible to proceed to analyse epiphyseal fusion sequences.
3.4.2d Consideration of other methods
It is of note that dental wear has been used in prior studies of both humans and other animals to
determine age at death (e.g., Lovejoy 1985). The use of this methodology has shown some reliability
in humans for estimating age in larger samples. However, there are some critical limitations for the
application of such an approach in this study. There are some studies of chimpanzee dental wear (e.g.,
Ungar and M’Kirera 2003) but equivalent studies predicting age by dental wear in chimpanzees do not
exist as they do for humans. Additionally such methods rely on consistent dietary patterns within the
population of study. With a mixed-sample of captive and wild, this cannot be assured and dental wear
may prove much more variable. Futher complicating this approach is the fact that the ages of interest

97
are all very young at which point there is little dental wear to observe. It is considered that generated
dental score is a more reliable means for projecting extended maturational age in this study than
attempting the use of dental wear.
3.4.3 Application of mean epiphyseal fusion values for seriating epiphyses
The aforementioned addition of generated dental score values allows for observation of fusion events
beyond dental maturity but due the system being an artificial combination of two systems, this makes
any quantitative analysis of these differences invalid. It will be observed that there are several fusion
events that occur after dental maturity. Any estimates of ages may not be calculated for these
epiphyses but with their mean epiphyseal fusion scores they may be ordered. Mean epiphyseal fusion
scores were determined for all individuals in the data set. Individuals could then be seriated based on
increasing maturity irrespective of dental score.
3.4.4 Estimation of age for fusion timing using dental score
As estimation of age is a critical component of this study, estimated ages for fusion events based on
dental maturity will still be estimated for those epiphyses that had ranges below DS64. It will be
shown in Chapter 4 that many mid-fusion ranges do fall below the cut-off of dental maturity and
estimated ages of attainment may be determined.
3.4.5 Evaluating number of individuals at each stage and recoding results into three stages
Table 3.23 provides sample sizes of mid-fusion (recorded stages 2-4) and complete fusion (recorded
stage 5) for all epiphyses in Pan troglodytes females. Table 3.24 compares mid-fusion and complete
fusion values in the upper limb for both species and sexes. It is important to note that the sample size
for female Pan paniscus individuals was quite small once all dentally incomplete individuals were
removed. There were two cases of fusion centres where no mid-fusion values were present and
likewise two cases where no complete fusion was found. For Pan troglodytes the number of
individuals for each epiphysis were much larger.
Mid-fusion values are of the greatest concern with respect to analysis as this state indicates when the
process of fusion is occuring. Table 3.23 indicates that there were typically around 9 values for mid-
fusion for each epiphysis in Pan troglodytes females. Proportionate values relative to sample size were
found for Pan troglodytes males and Pan paniscus males and females. Table 3.24 indicates that the
number of data entries for each epiphysis in the upper limb are greatest for females Pan troglodytes.
This should be expected as Pan troglodytes females provided the largest sample for any of males or

98
females of both species. With only 9 individuals being typical of mid-fusion events in Pan troglodytes
females, most individual recorded stages (stages 2 - 4) would provide not more than 3 or 4 individuals
for Pan troglodytes and single data points common for Pan paniscus. It was decided to consider mid-
fusion as a single category from this point in the analysis. A case-by-case review may be possible in
the future for some epiphyses, but certainly not for all.
Table 3.34 Number of individuals in mid-fusion and complete fusion for Pan troglodytes females by epiphysis.
skeletal region epiphyseal fusion site N mid-fusion1. N complete fusion2.
upper limb
proximal humerus 19 12distal humerus 8 48
humeral medial epicondyle 8 42proximal radius 11 30
distal radius 16 9proximal ulna 4 40
distal ulna 14 10
hand
distal phalanges (hand) 2 10base of metacarpal 1 7 29
proximal and middle phalanges (hand) 10 29metacarpal heads 2-5 7 25
lower limb
femoral head 10 29greater trochanter 10 32lesser trochanter 5 37
distal femur 19 12proximal tibia 20 13
distal tibia 12 21proximal fibula 14 16
distal fibula 9 24
foot
calcaneus 7 35talus 2 46
distal phalanges (foot) 11 31middle phalanges (foot) 10 29metatarsal heads (2-5) 13 25base of metatarsal 1 8 32
proximal phalanges (foot) 8 27
pelvis
triradiate 8 39anterior inferior iliac spine 1 40
iliac crest 18 0ischial epiphysis 16 11
claviclemedial clavicle 7 5lateral clavicle 4 28
scapula coracoid 9 39sub-coracoid and glenoid 6 42

99
acromium 16 4medial border 8 2
mean 9.92 25.1median 9 28.5
1. Mid-fusion indicates the number of individuals with fusion score 2-42. Complete fusion indicates the number of individuals with fusion score 5
Table 3.35 Number of unfused, mid-fusion, and complete fusion values for the upper limb in Pan paniscus and Pan troglodytes.
male Pan paniscus mid-fusion1. complete fusion2.
proximal humerus 3 0distal humerus 0 7humeral medial epicondyle 5 2proximal radius 5 2distal radius 0 2proximal ulna 1 7distal ulna 0 2
female Pan paniscus mid-fusion complete fusionproximal humerus 0 3distal humerus 1 7humeral medial epicondyle 3 4proximal radius 1 3distal radius 4 0proximal ulna 2 5distal ulna 3 1
female Pan troglodytes mid-fusion complete fusionproximal humerus 19 12distal humerus 8 48humeral medial epicondyle 8 42proximal radius 11 30distal radius 16 9proximal ulna 4 40distal ulna 14 10
male Pan troglodytes mid-fusion complete fusionproximal humerus 7 3distal humerus 5 18humeral medial epicondyle 7 13proximal radius 3 10distal radius 8 3proximal ulna 6 12distal ulna 6 4

100
1. Mid-fusion indicates the number of individuals with recorded score 2-42. Complete fusion indicates the number of individuals with recorded score 5

101
3.4.6 Error analysis for epiphyseal fusion
Intra-observer error analysis was carried out using 13 individuals which were re-assessed at the
University of Zurich. These data were acquired after a 6 month interval between the two sampling
periods. Despite this period of time, familiarity with particular individuals remained possible. In order
to reduce the likelihood of this all of the verbal descriptions made for each individual were evaluated.
These 13 individuals were selected from those which had no notable features such as suspected
pathological conditions or fractures. Data for inter-observer error was unfortunately not possible to
collect due to time constraints on the data collection period.
For the 13 individuals there were 22 differences between the two data collection events out of a total of
775 data entries, producing a net deviation rate of 2.8%. There were nine deviations that were more
than one stage apart. From these eight deviations, three were different by 2 stages, three were different
by 4, and two were different by 3. Three deviations appeared in the talus, two in the sub-coracoid, and
two in the lesser trochanter. Both the talar epiphysis and the lesser trochanter are often difficult to
observe due to their small physeal area and this may have been a source of error. For the combined
sample variable (combining left and right) no variable exceeded two deviations with the exception of
the talus, which had four. This meant that the spread of deviations across all the variables was even
and that apart from the talus, no particular epiphyses were more prone to error than others. The
deviation rate for the talus is still quite low.
It was noted that with respect to difficulty of observation, the lesser trochanter, the talus, the medial
and the lateral epiphysis of the clavicle were considered challenging. The clavicles were found to be
difficult due to variation in morphology and lack of clear epiphyseal surfaces even when the epiphysis
was not fused. The level of indentation of the medial end of the bone was used as an indicator but this
trait sometimes appeared even in fused epiphyses. As opposed to the first two noted epiphyses where
difficulties arose (the talus and lesser trochanter), the clavicles have no noted deviations, indicating that
the observation system was at least internally consistent. Another area of potential concern was the
iliac crest, which can be quite brittle and is subject to being broken when an individual in the early
stages of fusion is skeletonised. This concern was met with a higher level of scrutiny when
observations took place. There were no reported deviations for this epiphysis in the intra-observer
error sample.

102
3.5 Methodology: Long-bone length analysisThe purpose of collecting data for long-bone length was to provide a measure of dimensional growth
that could be compared with dental score. Epiphyseal fusion events could also be considered as a
function of changes in length. Length was recorded for all bones where a length measurement was
possible, with or without epiphyses. It was preferrable to have long-bone length determined by bones
with complete epiphyses but prior to data collection it was not known whether sufficient numbers of
individuals with complete epiphyses could be obtained. There is a need to resolve a combined sample
variable, similarly to epiphyseal fusion as measurements has been taken from both sides of the
skeleton. This will involve assessing if lateralisation is present (section 3.5.2) as this is known to exist
in humans and is a potential source of error. It shall be shown that this is not the case and a pooled
sample will be produced.
3.5.1 Presence or absence of epiphyses and distribution of data by bone type
Long-bone measures with both epiphyses present were desired as this represents the complete length of
the bone. Due to uncertainty with respect to the completeness of the sample, the experimental design
for this study provided for all bones to be measured irrespective of their epiphyseal plate
presence/absence. The state of epiphyseal fusion plate presence was recorded (both present, proximal
present only, distal present only, neither present). If a substantial proportion of bones were missing
epiphyses, then a method of compensating for this problem could be devised. However, during data
collection it became rapidly apparent that a large proportion of individuals had both epiphyses present
for most long bones. This information is quantified here. A preliminary combined sample variable for
filtering epiphysis presence/absence state was created. This variable allowed for the counting of the
numbers of bones that had both epiphyses present, one from either left, right, or both sides. Table 3.25
provides the number of individuals contributing a complete measurement (both epiphyses present) for
each long bone by species and sex.
Table 3.36 Number of individuals contributing long-bone measurements both by species and sex.
species humerus radius ulna femur tibia fibula max N 2.
P. paniscus total1. 28 27 19 32 29 17 37P. troglodytes total 157 147 96 160 158 125 177P. paniscus females 11 11 9 12 12 8 12P. paniscus males 13 12 8 14 13 7 18P. troglodytes females 85 80 58 86 86 69 91P. troglodytes males 57 53 28 59 58 44 64
1. ‘total’ includes males, females, and unsexed individuals
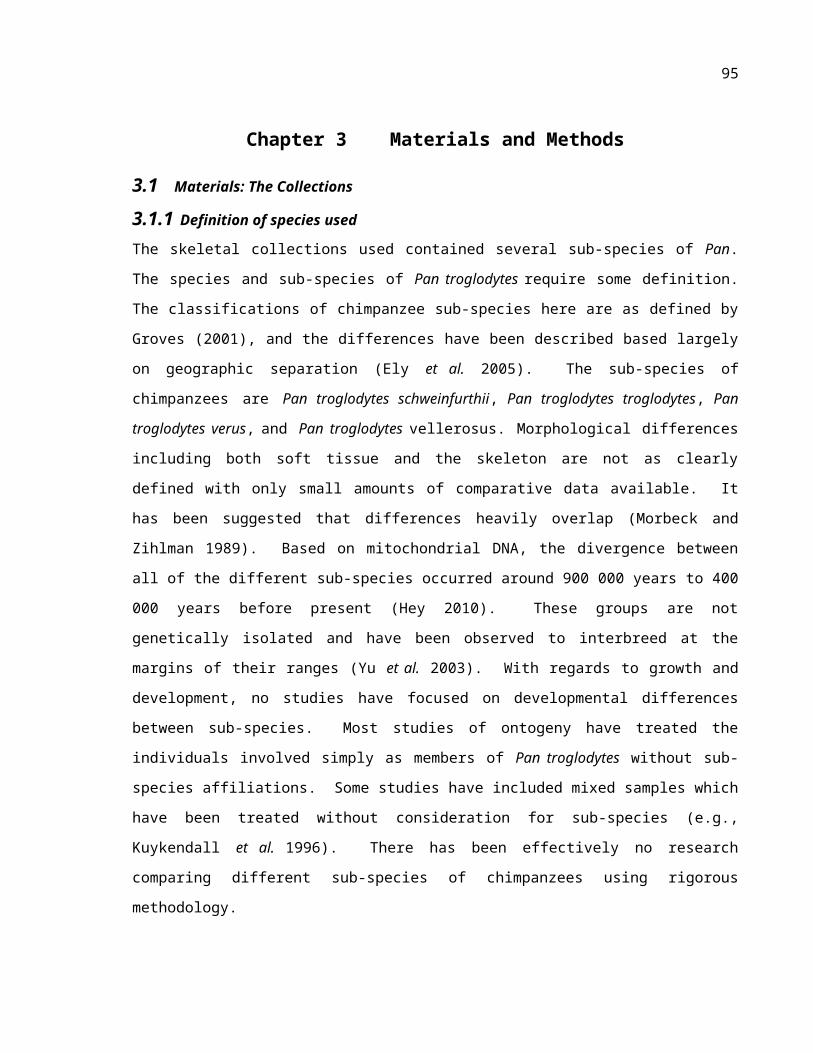
103
2. ‘max n’ refers to the total number individuals present in each category from the original dataset. This would be the number of measurements present if all data were 100% complete.
For all long-bones the proportion of individuals with missing epiphyses decreased as length increased.
This was an expected trend as older individuals are more likely to have fused epiphyses. There
remained also the question of how many individuals had both long-bone measures with complete
epiphyses as well as dental scores. Table 3.26 presents the number of individuals contributing at least
one long bone length for each dental score interval of 10.
Table 3.37 Number of individuals contributing long bone lengths with dental scores.
Pan troglodytesdental score male female no sex all individuals
0 to 10 0 2 2 411 to 20 4 4 3 821 to 30 9 9 2 1831 to 40 9 6 0 1541 to 50 11 13 5 2451 to 60 13 15 2 29
61 + 13 37 2 49sum 59 86 14 159
Pan paniscusdental score male female no sex all individuals
0 to 10 0 0 0 010 to 20 2 0 1 321 to 30 2 0 2 431 to 40 2 2 0 441 to 50 3 0 0 351 to 60 4 4 1 9
61 + 4 5 0 9sum 17 11 4 32
There was a paucity of individuals with lower dental scores in Pan paniscus. However, this problem
would not be alleviated by the inclusion of individuals with incomplete epiphyses, as 32 individuals
from the entire sample of 37 were accounted for (Table 3.24). The remaining 4 individuals lacked
skulls and there was the single individual that had only two teeth as noted during imputation analysis
(see section 3.3.3a). Even if a method for including incomplete bones was devised, it would be of no
use here. The scores for Pan troglodytes follow a similar pattern to Pan paniscus but due to the much
larger sample size, the lower dental scores are much better represented in this species. These values
also follow a consistent pattern with the distribution of dental scores for the entire population (see

104
section 3.3.4). The numbers of individuals do not substantially deviate from the numbers of
individuals present for the entire sample. There were 159 chimpanzee specimens with complete long
bones while the entire sample of dental scores for this species consisted of 162 individuals. Table 3.27
provides an assessment of the number of complete bones by bone type.
Table 3.38 Number of complete bones by bone type.
Pan troglodytesbone entire sample males females no sex
humerus 145 51 81 13
radius 135 49 74 12ulna 88 25 54 9
femur 150 55 82 13tibia 147 54 81 12
fibula 115 40 65 10Pan paniscus
bone entire sample males females no sexhumeru
s 25 14 8 3
radius 24 12 9 3ulna 17 8 7 2
femur 27 14 10 3tibia 25 12 10 3
fibula 14 7 5 2
There is a distinct pattern in the frequencies of bone presence and this pattern directly correlates to the
size of the epiphyseal plates. The ulna and the fibula, for example, have relatively smaller epiphyseal
plates when compared to the femur and the tibia. For the humerus, the medial epicondyle is small but
does not contribute to length, while the distal humerus fuses earlier than other long-bone epiphyses
(see section 4.2). Small epiphyses are more frequently broken or lost and this was noted during data
collection. As a consequence, bones such as the ulna were less frequently represented from younger
individuals. Tables 3.28 and 3.29 provide the number of bones present by dental score for Pan
paniscus and Pan troglodytes.
The values for Pan paniscus (Table 3.28) show the effects of single individuals within each dental
score range and do not provide enough information to make a statement regarding the distribution of
presence of bones. It does show that it was only males that had potentially sufficient numbers at each
dental score range to produce a measure of growth over time/dental maturity. ‘Sufficient’numbers in
this instance are the values acceptable for use in linear regression (see section 4.3.2).

105

106
Table 3.39 Number of present bones for each dental stage sorted by sex for Pan panicus.
species/sex dental score humerus radius ulna femur tibia fibula
Pan paniscusno sex
0 to 10 0 0 0 0 0 011 to 20 0 0 0 0 0 021 to 30 2 2 2 2 2 231 to 40 0 0 0 0 0 041 to 50 0 0 0 0 0 051 to 60 1 1 0 1 1 0
61+ 0 0 0 0 0 0
Pan paniscusfemales
0 to 10 0 0 0 0 0 011 to 20 0 0 0 0 0 021 to 30 0 0 0 0 0 031 to 40 2 2 0 2 2 041 to 50 0 0 0 0 0 051 to 60 2 2 2 3 3 2
61+ 4 5 5 5 5 3
Pan paniscus
males
0 to 10 0 0 0 0 0 011 to 20 2 1 0 1 0 021 to 30 1 1 1 1 1 131 to 40 2 2 0 1 2 041 to 50 2 1 1 3 1 051 to 60 4 4 3 4 4 3
61+ 3 3 3 4 4 3
The presence of bones in the sample for Pan troglodytes over the full range of dental scores is more
complete than that foud in the Pan paniscus sample. The data in Table 3.29 indicate that the numbers
of bones for each bone type very closely follow each other as a proportion of the sample population
and are consistent with the summary scores for all bones shown in Table 3.27. Female Pan troglodytes
individuals in the category ‘61+’ are proportionately more numerous when compared to males in this
category for all bones. Aside from this anomalous category where there clearly exists an excess of
older females, males and females closely resemble each other in terms of bone presence by dental
category for all bones. Even though they are substantially skewed towards older individuals, the
numbers for all long bones cover a wide enough range of dental scores that it is likely that growth
curves may be produced using regression techniques for males and females. The unsexed individuals
are more problematic in terms of number. However, the only use for regression of unsexed individuals
would be in the context of a pooled sample of males, females, and unsexed, representing both sexes.
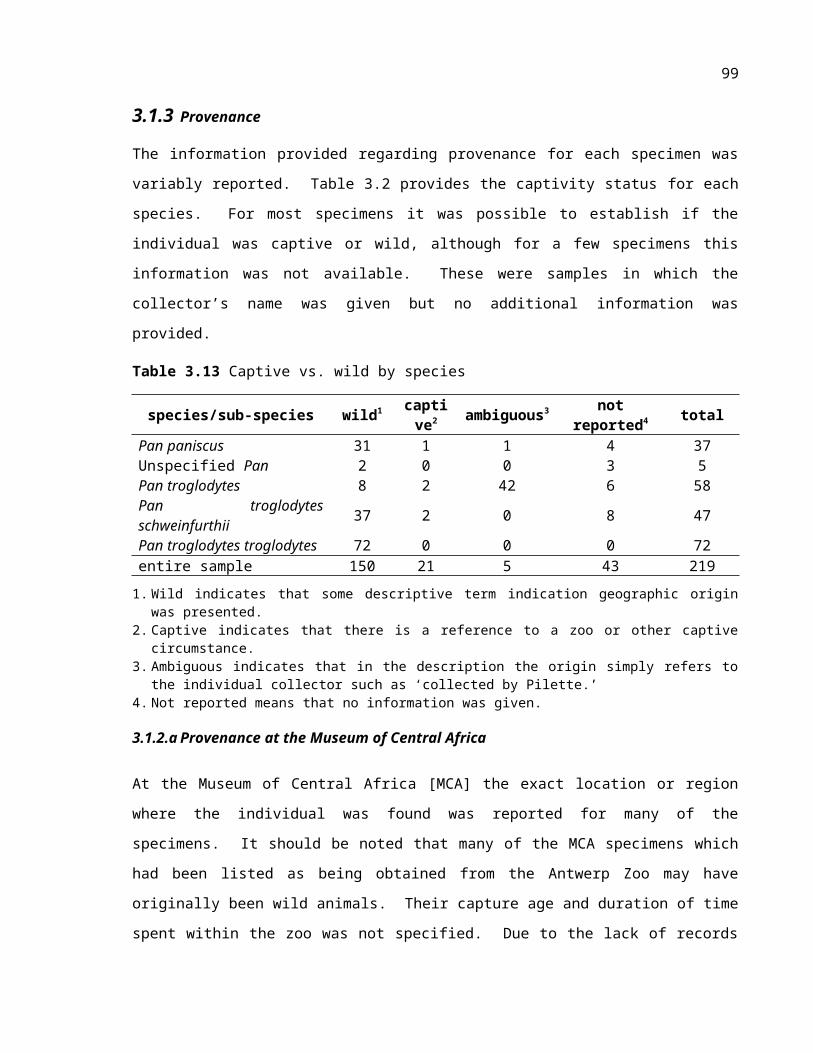
107
Table 3.40 Number of present bones for each dental stage sorted by sex for Pan troglodytes.
species/sex dental score humerus radius ulna femur tibia fibula
Pan troglodytesno sex
0 to 10 2 1 1 2 2 111 to 20 3 2 1 1 2 221 to 30 1 1 1 2 2 131 to 40 0 0 0 0 0 041 to 50 4 4 4 4 3 351 to 60 1 2 1 2 1 1
64+ 1 1 1 1 1 1
Pan troglodytesfemales
0 to 10 2 1 1 1 1 111 to 20 2 0 0 2 2 021 to 30 7 6 1 9 9 331 to 40 6 6 1 6 6 241 to 50 13 12 7 13 13 1051 to 60 14 12 9 14 13 13
61+ 37 37 35 37 37 360 to 10 0 0 0 0 0 0
Pan troglodytesmales
11 to 20 2 2 2 3 2 121 to 30 7 6 2 8 8 431 to 40 8 8 2 9 9 441 to 50 10 11 2 11 11 951 to 60 12 10 6 12 12 10
61+ 12 12 11 12 12 12
3.5.2 Investigating the possibility of lateralization
Humans show bone length asymmetry which is associated with handedness and there are consistent
differences between sides (Auerbach and Ruff 2006). In chimpanzees and bonobos laterality is
substantially less clear. Some reports suggest a slight tendency towards right-handedness in
chimpanzees (Hopkins 2006, Hopkins and Pearson 2000) but with populations not necessarily tending
towards one specific limb (Corp and Byrne 2003). In bonobos it has been suggested that there is no
clear preference for hand use (Harrison and Nystrom 2008). With regards to osteological studies, some
slight asymmetries have been reported with respect to sub-periosteal area of the humerus (Sarringhaus
et al. 2005) but data specifically comparing left and right limb bone lengths appears to be lacking.
Recent evidence based on humeral length in 40 chimpanzees suggested that there is no lateralisation
(Barros and Soligo 2013). No data comparing humeral length in bonobos are available.

108
It would seem reasonable to postulate that if there does exist handedness in chimpanzees and bonobos,
that this feature would be much less pronounced than it is for humans. This is because if distinct
lateralisation were present then there would be much greater consensus regarding its presence given the
amount of study already conducted considering the issue. As a consequence, the types of asymmetries
seen in human limb dimensions are less likely to be present in the two Pan species.
In this study a combined sample variable would include some data from individuals that only have one
side of the skeleton present. This could vary between left and right and also was found at a number of
different dental score stages. In order to clarify if lateralization is a factor that may potentially reduce
precision, differences between left and right are considered.
This procedure is commenced by first considering the humerus, which is the most lateralized bone in
the human body. There were 19 left and 26 right humerii for Pan paniscus and 153 left and 149 right
humerii for Pan troglodytes present. Of these, 16 Pan paniscus and 138 Pan troglodytes individuals
had values for both sides. All values were inspected for extreme outliers (differences of more than 15
mm) as these were likely to be consequent of measurement error or a pathological condition. In
humans, the deviation between sides is rarely greater than this value (Steele and Mays 1995). Two
Pan paniscus and four Pan troglodytes individuals were removed due to greater than 30 mm difference
between sides. The vast majority of individuals showed differences of less than 5 mm and these outlier
individuals were likely the result of sampling error or some other unexplained effect. Figures 3.10 and
3.11 show individual points from humerii for Pan paniscus and Pan troglodytes respectively. A linear
regression line is also plotted as well as a line of perfect isometry where left equals right.

109
120 140 160 180 200 220 240 260 280 300120
140
160
180
200
220
240
260
280
300
Trendline comparing left and right humeral length for all Pan paniscus individuals to a line of perfect isometry
left and right humerii Linear (left and right humerii)line of perfect isometry Linear (line of perfect isometry)
right humerus (mm)
left
hum
erus
(mm
)
Figure 3.13 Left and right humerii plotted again each other for Pan paniscus individuals.
Figure 3.14 Left and right humerii plotted again each other for Pan troglodytes individuals.
110 130 150 170 190 210 230 250 270 290 310 330110
130
150
170
190
210
230
250
270
290
310
330
Trendline comparing left and right humeral length for all Pan troglodytes individuals to a line of perfect isometry
left and right humeri Linear (left and right humeri)
right humerus (mm)
left
hum
erus
(mm
)

110
The regression lines in Figures 3.14 and 3.15 almost perfectly overlap for both species, suggesting that
there was no notable difference between right and left humerii with respect to length. Upon
observation of the data points for individuals of Pan troglodytes, there appears not to be any significant
trend of deviation above or below isometry for any point in development. If lateralization is a
developed trait later in growth, then one might expect differences to appear more frequently at longer
lengths, but this is clearly not the case. To compare these samples statistically, a non-parametric paired
sample test was performed for the humerus in SPSS Statistics 21. Table 3.30 indicates Z scores and 2-
tailed significance values for Pan troglodytes and Pan paniscus males and females.
Table 3.41 Z scores and significance from 2-tailed paired sample test for the humerus in Pan troglodytes and Pan pansicus.
test statisticPan troglodytes Pan paniscus
females males females malesZ score -0.938 -0.65 -1.063 -1.378
significance (2-tailed) 0.348 0.516 0.288 0.168
Table 3.42 Z scores and 2-tailed significance for left-right comparisons of all long bones (excluding humerus) for male and female Pan troglodytes and Pan paniscus.
species/sex/bone Z score significance (2-tailed)P. paniscus females radius -1. -P.paniscus males radius - -P. troglodytes female radius -0.612 0.541P. troglodytes male radius -1.131 0.258P. paniscus females ulna -0.816 0.414P.paniscus males ulna - -P. troglodytes female ulna -0.163 0.870P. troglodytes male ulna -0.634 0.526P. paniscus females femur - -P.paniscus males femur -0.141 0.888P. troglodytes female femur -0.340 0.734P. troglodytes male femur -0.524 0.600P. paniscus females tibia -0.378 0.705P.paniscus males tibia - -P. troglodytes female tibia -0.641 0.521P. troglodytes male tibia -1.342 0.180P. paniscus females fibula -1.342 0.180P.paniscus males fibula -0.447 0.655P. troglodytes female fibula -0.519 0.604P. troglodytes male fibula -0.169 0.866
1. ‘-’ means that all individuals had exactly the same score. This only occurred for Pan paniscus where small sample size contributed to this occurence. As such, no tests were performed.

111
It is clear that there is no statistically significant difference between left and right humeral
measurements for either species. In humans this is the most asymmetric bone and it has been
confirmed here that there is no significant difference for chimpanzees or bonobos. It may be inferred
that it is very unlikely that the remaining bones of the body are asymmetric but to provide certainty this
same statistical test was carried out for the remaining long bones and this was shown to be true. The
results of these tests are shown in Table 3.31.
3.5.3 Combined sample variable and dental score 64 individuals
Given that there was no significant difference between sides with respect to length, a combined sample
variable was created. A mean value for left and right was taken for individuals where there was a
difference between sides. Long-bone lengths from the combined sample variable were sorted by
species and by sex. The overall sample size present for individuals that also had corresponding dental
scores is shown in Table 3.32.
Table 3.43 Number of contributing measurements with dental scores for each long-bone in Pan paniscus and Pan troglodytes.
Pan troglodytes males females unknown sex totalhumerus 51 81 0 132radius 49 74 0 123ulna 25 54 0 79
femur 55 82 0 137tibia 54 81 0 135
fibula 40 65 0 105Pan paniscus males females unknown sex total
humerus 14 8 3 25radius 12 9 3 24ulna 8 7 2 17
femur 14 10 3 27tibia 12 10 3 25
fibula 7 5 2 14

112
3.6 The problem of presenting data in a comparable framework
The presentation of long-bone growth data in past studies has mostly relied upon known-age samples.
Those which have not (e.g., Shea 1981) have used emergence estimates for time and grouped
individuals into age categories. Growth rate relative to time has been used to compare chimpanzees to
humans. However, in the present study there are Demirjian scores from which lengths have been
assigned as well as epiphyseal fusion data based on the same maturational indicator. The question
remains as to which format is best for presenting growth patterns between chimpanzees and humans.
Figure 3.12 presents regression curves for chimpanzee and human dental score plotted against
chronological years as determined by prior studies. Figure 3.13 presents the same data but plotted as a
percentage of growth in years.
1. Human data is based on Demirjian (1973), Demirjian and Levesque (1986) and Meinl et al. (2007)
2. Chimpanzee data is derived from regression by Kuykendall (1996)
Figure 3.15 Chimpanzee and human Demirjian dental score relative to chronological age as determined by prior studies.

113
1. Human data is based on Demirjian (1973), Demirjian and Levesque (1986) and Meinl et al. (2007)2. Chimpanzee data is derived from regression by Kuykendall (1996)
Figure 3.16 Chimpanzee and human Demirjian dental score relative to percentiles of age as determined by prior studies.
While these data are well-known, it is important to observe in Figures 3.12 and 3.13 that the change in
dental score as a function of age is not consistent between the two species. The increase in dental score
with age reflects growth rate. Even when the duration of growth is scaled as a percentage of total
growth period (birth to complete skeletal and dental maturation), the two species retain their distinctive
patterns. One of the key factors behind this large difference is the human third molar. This tooth
completes mineralization much later as a proportion of total growth period in humans than it does for
chimpanzees. If the data for seven teeth (I1 to M2) were compared for both species as a percentage of
the entire growth period the patterns become much more convergent. This may be hinted at by looking
only at the earlier parts of the curve in Figure 3.13. However, in the present study there are data for 8
teeth and it is necessary to use third molar data in order to demonstrate the period of dental
development relative to epiphyseal fusion. There are also other differences in terms of mineralization
sequence from Kuykendall (1996) and others. These differences make the use of dental score as a
direct means of comparison with humans technically inappropriate.

114
Two points can be drawn from this: 1) Dental score relative to years has no reliable direct translation
between chimpanzees and humans, and 2) dental score relative to percentage of total growth period
also mirrors growth rate. Comparing growth in these species must therefore rely on maturational
indicators in both dental and skeletal systems. References to chronological time may only be made by
aligning maturational events.
3.7 Organisation of results
The main objective of this study was to measure the level of concordance in pattern and timing of
skeletal systems in chimpanzees, bonobos and humans using dental mineralization, epiphyseal fusion,
and growth in long-bone length. It is desireable to compare integrated data from Pan to Homo in order
to better understand similarities and differences in skeletal developmental parameters between the two
genera. As outlined in Chapter 2, some data already exist for chimpanzees and bonobos from each of
these sub-systems, but integration is lacking from single-sample studies. Data collection methodology
has now been presented for each of these sub-systems. The next step in this process is to consider how
to integrate these systems using the data collected and compare them.
Within the context of growth theory, two major lines of inquiry have been highlighted that have
theoretical significance, these being growth rate and sequences of developmental events. There is also
theoretical discussion regarding allometric relationships and how sequences of events may relate to
differences in morphology between species. The types of analyses performed on the data from this
study seek to expand upon what is already known related to these topics and further integrate systems.
Section 3.7.1 will describe how these topics will be addressed within the context of growth standard for
chimpanzees (results presented in Chapter 4). Section 3.7.2 will address comparability of these results
to studies of humans (results presented in Chapter 5). Not all types of analysis will be possible for both
species due to the more limited sample size for Pan paniscus. Inclusion and exclusion of species in
each analysis will be dealt with in each analysis.
3.7.1 Standards of growth for chimpanzees and bonobos: Chapter 4
3.7.1a: Growth rate
Long-bone length is the only variable present in this study for evaluating growth rate. Age at death
was not available for the individuals in these collections so growth in length may only be evaluated
against other developmental parameters, which in this study shall be Demirjian summary dental score.
Despite summary dental score being a sum of 8 categories of an ordinal variable for 8 teeth, this
system provides the nearest approximation to a continuous variable of development. It has been shown
that Demirjian summary dental score does not linearly relate to chronological age (section 3.6) and the

115
increase in dental score with age approximates the curve determined in other studies for overall
somatic growth with time. Long-bone length relative to dental score will be analysed using linear
regression.
3.7.1b Sequences of developmental events
Epiphyseal fusion is the primary variable in which sequence shall be analysed. Analysis of dental
developmental sequences could also be considered in this study. However, dental emergence and
mineralization sequences are already well-known (e.g. Kuykendall 1996, Smith et al. 2007). Dental
development will be limited to the production of summary Demirjian scores. Epiphyseal fusion events
may be charted as a function of summary dental score. This provides information about the
relationship between state of dental mineralization and skeletal fusion. Epiphyseal fusion may also be
seriated independently as a sequence of events. This will be evaluated by considering mean epiphyseal
fusion score and modular sequence derived from analysis of contingency tables.
3.7.1c: Allometry
The relationships of growth in length between different limb elements has in the past been analysed for
Pan troglodytes troglodytes and Pan paniscus by Shea (1981) who found that the relative lengths of
limb bones remain unchanged during growth. Shea (1981) also found that this consistency of limb-
length is also found in humans. It is possible to confirm these patterns in the data set of the present
study and extend these trends to further sub-species of Pan troglodytes. This will be done by
employing linear regression analysis on Log10 transformed limb lengths.
3.7.1d: Estimating chronological age for epiphyseal fusion events
The estimation of chronological age for fusion events is possible using the regression equation for 8
teeth from Kuykendall (1996). The utility of pursuing a chronological reference is that it confirms the
relationship between known-age studies and the present one. This allows for confident assessments of
the relationship between maturation and chronological time.

116
3.7.2 Comparisons of growth standards of Pan and Homo: Chapter 5
3.7.2a: Comparison of epiphyseal fusion seriations of chimpanzees and humans
With fusion sequence for chimpanzees and bonobos analysed by the use of modular sequence and
mean epiphyseal fusion, comparisons with available human data is possible. Schaefer and Black
(2007) provide a modular sequence for humans and comparison with this study will be made.
3.7.2b: Comparison of dental sequences and epiphyseal fusion sequences between chimpanzees and
humans
Comparison of the sequence of epiphyseal fusion events and dental developmental events is limited by
the fact that the dentition was analysed only using summary Demirjian dental score. As such discrete
events such as molar emergence cannot be directly used as markers for grouping sequences of events.
However, using standards from Kuykendall (1996) it is possible to estimate the timing of complete
mineralization in certain teeth. This provides a means to group epiphyseal fusion events and count the
number of events that occur in each grouping. This provides a basic measure as to how sequences of
fusion and dental events compare in both humans and chimpanzees. This analysis will not be possible
for bonobos given sample size limitations.
3.7.2c: Relating sequences of fusion events to changes in allometry
The relationship between fusion events are a proportion of growth in length is informative with respect
to understanding how differences in dimensions are achieved between species. As such, this is a
comparative analysis that will include humans and is found in Chapter 5. As outlined in Chapter 2, it
is not known if changes in allometry between species affects the timing of epiphyseal fusion events as
a proportion growth of length. Fusion events considered as a proportion of length will be compared
between chimpanzees and humans.
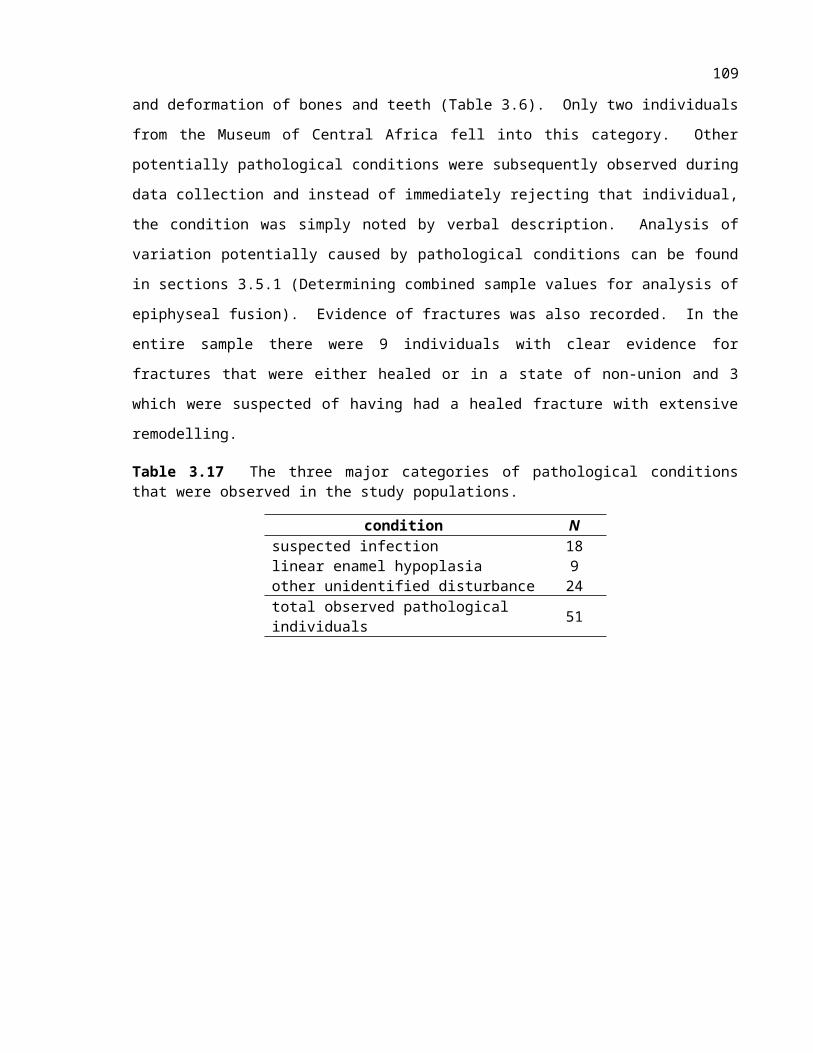
117
Chapter 4 Results – Standards of growth for chimpanzees and bonobos
4.1 Growth rate of long-bones as a function of dental score4.1.1 Analysis of growth rate as a function of dental score using
regression analysis
This section will consider long-bone growth as a function of dental score. As outlined in Chapter 2,
growth in length as a function of chronological years has been found to a be non-linear relationship for
chimpanzees and bonobos (Leigh and Shea 1996). However, the nature of the relationship between
growth in length for long-bones and dental score is not clear. This analysis begins by evaluating
chimpanzee humeral length as a function of dental score and then expanding analysis to encompass all
other long-bones. Figure 4.1 presents a scatterpot of humeral lengths for Pan troglodytes females
plotted against dental score. There appear to be more individuals clustered around the higher dental
score values of 62-64. This was a consequence of more individuals in this range having all epiphyses
present for this bone. Fusion for the proximal epiphysis begins at these dental stages. The relationship
appears linear. These data were analysed using linear regression analysis in SPSS Statistics 21.
Regression results are presented in Table 4.1. Detailed results are available in section 8.3 of the
appendix.
Figure 4.17 Humeral length relative to dental score showing Pan troglodytes females.
8 13 18 23 28 33 38 43 48 53 58 6395
135
175
215
255
295
335Pan troglodytes female humeral length by individual
dental score
hum
eral
leng
th (m
m)

118
Table 4.44 Regression r-squared values for the humerus plotted against dental score for Pan
troglodytes females.
Change Statistics
R R2 adjusted R2
std. error of the estimate
R2
change
F change df1 df2 sign. F
change
Durbin-
Watson
.9301. 0.866 0.864 5.5815 0.866 509.324 1 79 0 1.576
1. Predictors: (Constant), Pan troglodytes females humerus
With an R2 value of 0.866 and with residual analysis showing only very slight deviations, it may be
accepted that chimpanzee humeral growth is linear as a function of dental score. DS64 individuals
appear not to cause notable deviations, although the effect of the wider ranges at this score are visible
in scatterplots for residuals. Results for R2 values for all long-bones in male and female Pan
troglodytes are presented in Table 4.2. Growth in length as a function of dental score for these bones
also behaves linearly with R2 values between 0.753 and 0.915. It is thus assumed that chimpanzee
long-bone growth as a function of dental score may be plotted as a linear relationship for all long-
bones. Full results for each bone are found in the appendix section 8.3. Figures 4.2 and 4.3 provide
combined regression plots for all long-bones in male and female Pan troglodytes. Table 4.3 presents
linear regression equations for the lines plotted in Figures 4.2 and 4.3.
Table 4.45 Regression data for all 6 long bones in Pan troglodytes females and males.
species/sex bone R R2 adjusted R2
std. error of the estimate
Pan troglodytes females
humerus
0.930
0.866 0.864 19.2704radius 0.91
70.840 0.838 16.7815
ulna 0.898
0.807 0.803 16.3876femur 0.92
60.857 0.855 19.2221
tibia 0.926
0.857 0.855 16.7748fibula 0.86
80.753 0.749 15.0836
Pan troglodytes males
humerus
0.875
0.766 0.761 22.8207radius 0.93
30.870 0.867 16.0328
ulna 0.956
0.915 0.911 15.6222femur 0.95
10.904 0.903 15.4383
tibia 0.941
0.886 0.884 14.3676fibula 0.95
20.906 0.904 11.1698

119
8 18 28 38 48 5875
125
175
225
275
Multiple linear regressions for bone length in Pan troglodytes females
dental score
diap
lhys
eal l
engt
h (m
m)
Figure 4.18 Multiple linear regressions for long-bone length in Pan troglodytes females.
8 18 28 38 48 5875
125
175
225
275
Multiple linear regressions for bone length in Pan troglodytes males
dental score
leng
th (m
m)
Figure 4.19 Multiple linear regressions for long-bone length in Pan troglodytes males.

120
Table 4.46 Linear regression equations for Pan troglodytes males and females as plotted in Figure 4.2
and 4.3
regression equation for Pan troglodyteslong-bone females maleshumerus y = 3.212 x + 87.869 y = 3.1357x + 89.085radius y = 2.8816x + 82.935 y = 2.9265x + 79.682ulna y = 3.1409x + 88.547 y = 3.1135x + 84.563
femur y = 2.7238x + 70.272 y = 3.2006x + 84.269tibia y = 2.2443x + 77.612 y = 2.7811x + 65.882
fibula y = 3.1357x + 89.085 y = 2.443x + 64.541
Long bone length in Pan paniscus
Analysis of long-bone growth in Pan paniscus was more limited due to sample size being much
smaller. Figure 4.4 shows humeral lengths for both male and female Pan paniscus plotted against
dental score. Even though there appears to be a generally linear pattern observed for this bone, there
were too few individuals present for regression analysis to reliably assess growth in length relative to
dental score. Sex differences have been determined for Pan paniscus in the past (see Shea 1981) and
as such combining sex for regression may not be valid. Shea (1981) also noted this limitation for his
data set. This paucity of values is repeated for all other long bones.
Figure 4.20 Male and female Pan paniscus humeral length plotted against dental score.
10 15 20 25 30 35 40 45 50 55 60100
150
200
250
300
350Pan paniscus male and female humeral lengths
dental score
leng
th (m
m)

121
4.2 Analysis of epiphyseal fusion sequences
Sequences will be evaluated by the following analyses:
1. Epiphyseal fusion sequence will be compared to dental score (sections 4.2.1a-4.2.1c). This analysis
will consider how these systems are related with dental score behaving as a continuous variable
(justified in section). Descriptive statistics and analysis of limitations will be presented. A comparison
between dental score and mean epiphyseal fusion score will be made (section 4.2.1d). This will assess
the level of agreement between estimated maturity by dentition and epiphyseal fusion independently.
2. A seriation of fusion sequence will be produced by the use of two different methods. Epiphyseal
fusion events will first be sorted by modular patterns as determined by contingency tables (section
4.2.2a). In the second approach, fusion events will be sorted by mean epiphyseal fusion score (sections
4.2.2b-4.2.2f).
4.2.1 Comparing epiphyseal fusion sequences to dental score
4.2.1a Evaluating limitations for analysis as a consequence of dental score 64 individuals
As noted in Chapter 3, a limitation for this type of analysis is there are clearly individuals with multiple
unfused epiphyses beyond DS64 in this data set. Another potential problem is that the range of dental
scores for epiphyses that typically fuse below DS64 are derived from a sample that still often includes
several individuals with DS64. Figure 4.5 illustrates this problem for the upper limb in Pan
troglodytes females. This figure shows box plots for unfused, mid-fusion and complete fusion.
1: unfused2: mid-fusion3: complete fusion
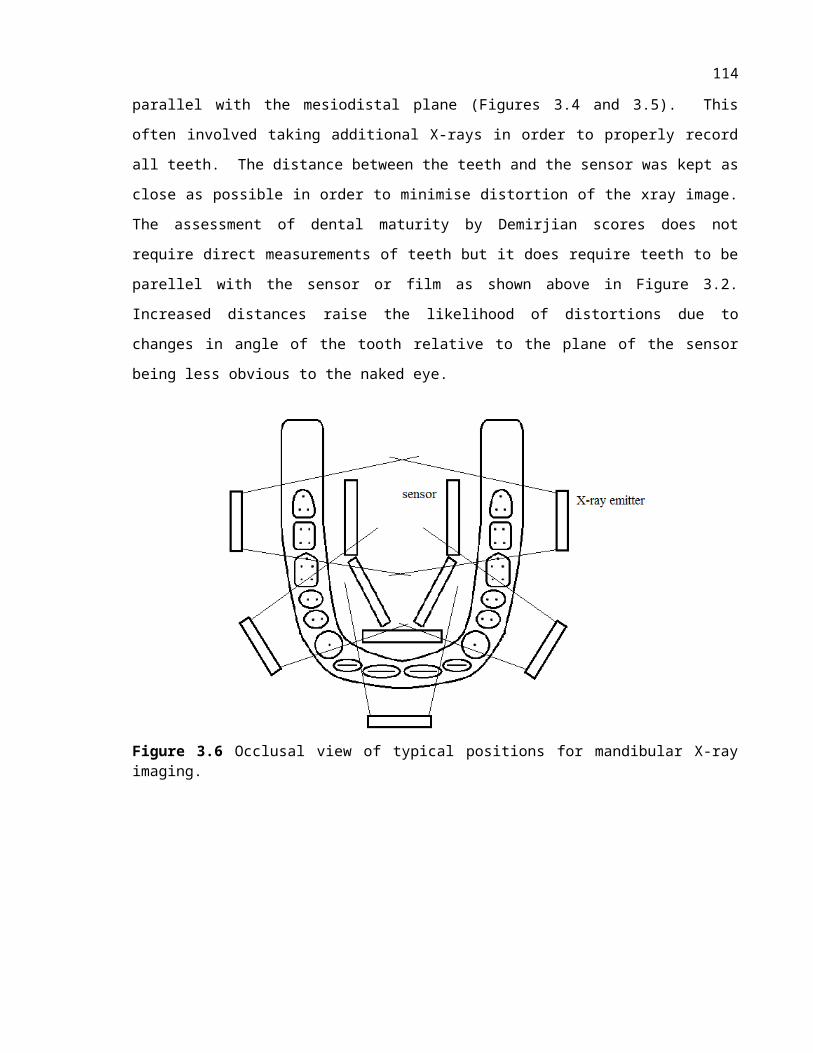
122
Figure 4.21 Mid-fusion and complete fusion for the epiphyses of the upper limb in Pan troglodytes females.
The effect of truncated ranges is evident for all mid-fusion and complete fusion events with the
exception of the distal humerus and the humeral medial epicondyle. The proximal radius and proximal
ulna have distributions with the majority of individuals below DS64 and this is true for many of the
ranges of mid-fusion in other epiphyseal fusion sites. Determining mean values will not produce
meaningful results for many later epiphyses as a result of the DS64 limitation. Median values are a
more appropriate alternative. Table 4.4 provides median values and ranges of mid-fusion in each
epiphysis for Pan troglodytes females. Median values above DS64 are highlighted in boldface. There
were 8 epiphyses that had median value over DS64. This is in accordance with expectations set out in
Chapter 3. Table 4.5 provides the same values for complete fusion from Pan troglodytes females.
Analysis of complete fusion ranges demonstrates that the majority of contributing fusion values have
DS64. The remaining tables for Pan troglodytes males and Pan paniscus males and females are
available in section 8.4 of the appendix (Tables 8.12-8.20). Full descriptive statistics are available for
both Pan troglodytes and Pan paniscus males and females in the digital appendix section 8.2.1 (Tables
8.2.1.1-8.2.1.4).

123
Table 4.47 Median values and ranges of fusion for all mid-fusion epiphyses in Pan troglodytes females.
skeletal region epiphyseal fusion site N median
dental scoreminimum
dental scoremaximum
dental score
upper limb
proximal humerus 19 62 47 64distal humerus 8 48 41 62
humeral medial epicondyle 8 55 48 62proximal radius 11 63 43 64
distal radius 16 64 57 64proximal ulna 4 56 48 60
distal ulna 14 64 57 64
hand
distal phalanges (hand) 2 50 48 52base of metacarpal 1 7 61 43 64proximal and middle
phalanges (hand) 10 60.5 43 64
metacarpal heads 2-5 7 62 60 64
lower limb
femoral head 10 62 56 64greater trochanter 10 61.5 43 64lesser trochanter 5 61 60 64
distal femur 19 64 60 64proximal tibia 20 63.5 60 64
distal tibia 12 62.5 60 64proximal fibula 14 63 60 64
distal fibula 9 63 60 64
foot
calcaneus 7 60 56 64talus 2 57 52 62
distal phalanges (foot) 11 60 43 64middle phalanges (foot) 10 62 43 64metatarsal heads (2-5) 13 62 43 64base of metatarsal 1 8 62.5 56 64
proximal phalanges (foot) 8 61.5 43 64
pelvis
triradiate 8 56.5 10 62anterior inferior iliac spine 1 55 55 55
iliac crest 18 64 62 64ischial epiphysis 16 64 60 64
claviclemedial clavicle 7 64 56 64lateral clavicle 4 59 55 64
scapula
coracoid 9 58 45 64sub-coracoid and glenoid 6 50 19 60
acromium 16 64 57 64medial border 8 64 62 64

124
Table 4.48 Median values and ranges of fusion for all complete fusion epiphyses in Pan troglodytes females.
skeletal region epiphyseal fusion site N median
dental scoreminimum
dental scoremaximum
dental score
upper limb
proximal humerus 12 64 62 64distal humerus 48 63 43 64
humeral medial epicondyle 42 64 43 64proximal radius 30 64 57 64
distal radius 9 64 62 64proximal ulna 40 64 43 64
distal ulna 10 64 62 64
hand
distal phalanges (hand) 10 62 56 64base of metacarpal 1 29 64 60 64proximal and middle
phalanges (hand) 29 64 60 64
metacarpal heads 2-5 25 64 60 64
lower limb
femoral head 29 64 60 64greater trochanter 32 64 60 64lesser trochanter 37 64 43 64
distal femur 12 64 62 64proximal tibia 13 64 62 64
distal tibia 21 64 62 64proximal fibula 16 64 62 64
distal fibula 24 64 60 64
foot
calcaneus 35 64 43 64talus 46 63 33 64
distal phalanges (foot) 31 64 56 64middle phalanges (foot) 29 64 60 64metatarsal heads (2-5) 25 64 60 64base of metatarsal 1 32 64 46 64
proximal phalanges (foot) 27 64 60 64
pelvis
triradiate 39 64 43 64anterior inferior iliac spine 40 64 43 64
iliac crest 0 - - -ischial epiphysis 11 64 62 64
claviclemedial clavicle 5 64 64 64lateral clavicle 28 64 43 64
scapula
coracoid 39 64 43 64sub-coracoid and glenoid 42 64 43 64
acromium 4 64 64 64medial border 2 64 64 64

125
4.2.1b Projection of fusion using generated dental score
As outlined in Chapter 3, generated dental scores were produced for individuals with DS64 with
additional increments added based on their mean epiphyseal fusion values (additional increment x =
0.3). To visualise these, median values were plotted. Plotted also were 25 th and 75th percentiles. These
values are listed for mid-fusion and complete fusion in Table 4.6 for Pan troglodytes females.
Comparable data for Pan troglodytes males and Pan paniscus males and females are available in
Tables 8.57 - 8.59 in the appendix.
Plots of mid-fusion and complete fusion data for Pan troglodytes males and females are shown below
in Figures 4.6 - 4.9. Epiphyses with no range for percentiles lacked sufficient data. The majority of
epiphyses had sufficient data. The grey regions between the 25 th percentile, median, and 75th percentile
are a visual aid and do not represent additional information. For Pan paniscus too few data entries
were available for percentiles to be informative. It was common for many epiphyses to have only 2 - 5
data entries. For this species only median values for mid-fusion and complete fusion were plotted.
Mid-fusion and complete fusion values were plotted on the same figure for females (Figure 4.10) and
males (Figure 4.11).
For Pan troglodytes individuals plotted against dental score in Figures 4.6 - 4.9 fusion events beyond
DS64 are visible and are clearly patterned. It appears that Pan paniscus follow similar patterns,
although the large amount of variation as a consequence of small sample size limits any further
analysis.

126
Table 4.49 Mid-fusion and complete fusion median, 25th and 75th percentiles values for generated dental score in Pan troglodytes females.
mid-fusion complete fusion
epiphysis median 25th percentile
75th percentile median 25th
percentile75th
percentileproximal humerus 62 60 65.8 68.95 67.975 69.925distal humerus 48 43.5 53 63 60.25 67.225humeral medial epicondyle 55 52.25 60 64.45 62 67.675proximal radius 63 60 64.6 65.95 62 68.575distal radius 65.5 62 67.15 69.4 68.35 70.15proximal ulna 56 49 60 64.45 62 67.825distal ulna 65.95 62 67.375 69.25 66.9 70.075distal phalanges (hand) 50 48 - 62 60 62.8base of metacarpal 1 61 60 62 66.4 63 68.65proximal and middle phalanges (hand) 60.5 47.25 64.075 66.4 63 68.65
metacarpals heads 2-5 62 61 64.6 67 63 68.95femoral head 62 60.75 64.075 66.4 63 68.65greater trochanter 61.5 59 64.075 65.95 62.25 68.425lesser trochanter 61 60 64.45 65.2 62 68.05distal femur 64.9 62 66.4 68.95 67.3 69.925proximal tibia 63.8 62 66.025 68.8 67.45 69.85distal tibia 63 61.5 65.35 67.75 63.7 69.325proximal fibula 63 62 65.8 68.5 67.3 69.7distal fibula 63 62 64.75 67.15 63.625 69.025calcaneus 60 58 64.3 65.5 62 68.2talus 52 45 - 63 60 67.45distal phalanges (foot) 60 48 62 66.1 62 68.5middle phalanges (foot) 62 60 64.075 66.4 63 68.65metatarsal heads 2-5 62 60.75 63.25 67.15 63.625 69.025base of metatarsal 1 61.5 48.75 63.5 66.55 63 68.725proximal phalanges (foot) 62.5 60.25 63.75 66.7 63 68.8triradiate 56.5 33.75 60 64.9 62 67.9anterior inferior iliac spine 55 55 55 66.7 62 68.8iliac crest 68.05 65.55 69.475 - - -ischial epiphysis 65.95 62.25 67.825 68.2 63 70medial clavicle 68.5 60 70 68.8 66.85 69.85lateral clavicle 59 55.25 66.425 65.5 63 68.725coracoid 58 50 62 64.9 62 67.9sub-coracoid and glenoid 52 22 60 64.6 62 67.75acromium 67 62 68.2 69.7 67.45 70.3medial border of scapula 69.1 64.5 69.85 70.6 70.6 70.6

127
Figure 4.22 Female Pan troglodytes mid-fusion with generated dental score.

128
Figure 4.23 Female Pan troglodytes complete-fusion with generated dental score.

129
Figure 4.24 Male Pan troglodytes mid-fusion with generated dental score.

130
Figure 4.25 Male Pan troglodytes complete fusion with generated dental score.

131
Figure 4.26 Female Pan paniscus mid-fusion and complete fusion median values plotted against dental score and generated dental score.

132
Figure 4.27 Male Pan paniscus mid-fusion and complete fusion median values plotted against dental score and generated dental score.

133
4.2.1c Analysis of sex differences when fusion events are compared to dental score for Pan
troglodytes
As noted in Chapter 2, sex differences between males and females may be observed relative to
chronological time with males delayed relative to females (Zihlman et al. 2007). It remains to be seen
if this is the case for both dental and skeletal development, or if the delay only relates to skeletal
development. This question may be considered for comparisons of fusion event timing with respect to
dental score. Comparison are limited to epiphyses contributing values all below DS64 with acceptable
sample sizes. An acceptable sample size may be defined as a minimum of 5 individuals. This limits
the number of comparisons but there are a few epiphyses that meet this criteria, namely the distal
humerus, humeral medial epicondyle, proximal ulna, femoral head, lesser trochanter, and middle
phalanges of the foot. An independent t-test may be used to determine if there are differences between
mid-fusion events. Using the central limit theorem the large number of ordinal categories presented by
dental score approximates a normal distribution and the application of parametric tests to this
distribution may be assumed to be robust (Norman 2010). The t-test test assumes normality of
distributions. A Shapiro-Wilk test for normality was carried out for each epiphysis and the results are
presented in Table 4.7. The lesser trochanter for female Pan troglodytes and the distal humerus for
Pan troglodytes males violate this assumption but all others fail to reject the null hypothesis and
normality is assumed. Independent sample t-tests were carried out for the humeral medial epicondyle,
proximal ulna, femoral head, and middle phalanges of the foot. The results are shown in Table 4.8.
Table 4.50 Shapiro-Wilk normality test for Pan troglodytes male and female epiphyses with dental scores below DS64.
Shapiro-Wilksex epiphysis statistic df sig.
Pan troglodytes females
distal humerus 1.000 3 1.000humeral medial epicondyle 0.893 3 0.363
proximal ulna 0.964 3 0.637femoral head 0.893 3 0.363
lesser trochanter 0.750 3 0.000middle phalanges (foot) 0.821 3 0.165
Pan troglodytes males
distal humerus 0.750 3 0.000humeral medial epicondyle 0.987 3 0.780
proximal ulna 0.964 3 0.637femoral head 0.964 3 0.637
lesser trochanter 1.000 3 1.000middle phalanges (foot) 0.964 3 0.637

134

135
Table 4.51 t-test comparison for male and female Pan troglodytes epiphyses that satisfy criteria for being below dental score 64.
Levene's Test for Equality of Variances
t-test for equality of means95% confidence Interval of the
Difference
epiphysis F sig. t dfSig. (2-
tailed)
mean differences
std. error differences lower upper
humeral medial epicondyle
a1. 4.072 0.07 -1.7 13 0.108 -3.38 1.957 -8 0.85
b2. -1.8 10 0.101 -3.38 1.8671 -8 0.78
proximal ulna
a 5.878 0.04 -1.7 8 0.127 -4.83 2.8398 -11 1.72b -1.5 4.1 0.21 -4.83 3.2498 -14 4.14
femoral head
a 1.036 0.33 1.22 12 0.245 2.05 1.6764 -2 5.7b 1.01 4.1 0.371 2.05 2.0391 -4 7.69
middle phalanges (foot)
a 0.268 0.62 0.61 11 0.558 2.5 4.1274 -7 11.6
b 0.9 8.3 0.394 2.5 2.7764 -4 8.86
1. Equal variances assumed2. Equal variances are not assumed
None of the four epiphyses analysed showed differences between each other. This analysis is very
limited in the sense that only four epiphyses satisfied the criteria necessary for this type of comparison.
As such it cannot be unequivocally stated that fusion follows the same pattern in males and females
with respect to dental score. However, the results from these epiphyses do lend support to the case that
the relationship between skeletal and dental development is the same for both male and females
irrespective of differences potentially observed in fusion timing relative to chronological years. It
should be noted that a sex differences has been observed for chimpanzee dentition. This difference is
in the completion of the canine (Kuykendall 1996). Regrettably this point of difference is near the end
of completion of the dentition and would not affect the epiphyses listed here. It may be suggested that
for earlier-fusing epiphyses that there are unlikely to be difference between the sexes. No epiphyses
for complete fusion were available for this analysis. Producing a mixed-sex comparison of epiphyseal
fusion events relative to chronological age is not necessarily justified with the limited amount of
information at present.
4.2.1d Assessing the difference between mean epiphyseal fusion value and dental score
Having both a measure of skeletal maturation (mean epiphyseal fusion score) and dental maturation
(dental score) for each individual permits comparison between the state of maturity for both systems.
As noted in Chapter 3, it has been well-established that dental development is less susceptible to
nutritional or environmental stress than skeletal development, resulting in an offset of the two systems

136
(Chaillet and Demirjian 2004). Table 4.9 presents a comparison of dental score and mean epiphyseal
fusion score for Pan troglodytes females. Dental scores for mean epiphyseal fusion value of 1 are not
included here due to all epiphyses being unfused at this stage.
Table 4.52 Mean epiphyseal fusion value compared to dental score for Pan troglodytes females by individual.
mean epiphyseal
fusion value
dental score
mean epiphyseal
fusion value
dental score
mean epiphyseal
fusion value
dental score
1.13 33 2.77 62 4.27 641.16 45 2.77 64 4.3 641.2 55 3.12 64 4.31 641.23 53 3.24 62 4.35 621.23 53 3.38 63 4.38 641.41 55 3.45 62 4.41 641.47 55 3.48 63 4.53 631.5 58 3.57 60 4.55 621.56 52 3.58 62 4.59 641.77 48 3.82 64 4.59 642.38 60 3.86 60 4.59 642.41 62 3.93 57 4.73 642.47 60 3.96 64 4.81 642.47 64 4.03 62 4.84 642.47 64 4.05 64 4.89 642.56 43 4.13 64 4.89 642.64 56 4.17 63 4.91 642.77 61 4.27 64
Mean epiphyseal fusion scores generally follow the same order as dental score score with a degree of
fluctation depending on the individual. There were occasional outliers of higher dental score with
lower mean epiphyseal fusion values. These outliers constitute large offsets between dental
development and skeletal development. It should be noted that when the epiphyseal fusion values for
these individuals are considered there is no consistent pattern of deviation of fusion events. None of
the individuals presented in Table 4.9 had recorded pathological conditions. Table 4.10 demonstrates
the same data for Pan troglodytes males and Pan paniscus males and females. Individuals with mean
epiphyseal fusion value 1 were again not reported.

137
Table 4.53 Mean epiphyseal fusion value compared to dental score for Pan troglodytes males and Pan paniscus males and females.
P. troglodytes male P. paniscus female P. paniscus malemean
epiphyseal fusion vale
dental
score
mean epiphyseal fusion vale
dental
score
mean epiphyseal fusion vale
dental
score
mean epiphyseal fusion vale
dental
score13 1.03 60 1.80 1.30 53 1.10 4520 1.03 61 1.81 1.76 53 1.82 4750 1.03 55 1.91 1.83 62 1.88 6131 1.05 59 2.66 2.15 51 2.10 5943 1.06 61 2.73 3.50 60 2.25 6046 1.06 60 3.48 4.14 64 2.88 5455 1.10 64 3.88 4.45 64 2.95 6043 1.12 63 3.92 4.48 64 3.28 6144 1.17 62 3.98 4.92 62 4.34 6453 1.24 60 4.05 4.79 6459 1.25 63 4.1460 1.31 63 4.7060 1.38 64 4.7258 1.44 64 4.8858 1.60 64 4.8961 1.71 64 4.94
4.2.1e Summary of fusion event comparisons to dental score
A pattern of fusion was visible when fusion events were compared to both dental score and generated
dental score. Differences between the sexes were not found, although the data suitable for this
comparison were limited. This comparison demonstrates clearly that at least several fusion events
begin union beyond DS64.
4.2.2 Producing a seriation of epiphyseal fusion sequences
4.2.2a Seriation using contingency tables to produce a modular sequence for fusion
Given the limitations for Pan paniscus epiphyseal fusion data observed in the previous section it was
decided to begin this analysis by considering Pan troglodytes only. Contigency tables for mid-fusion
values comparing each epiphysis were produced using SPSS 21 for both male and females. An
example of such a table is provided in Table 4.11. Tables 4.12 and 4.13 below demonstrate the
modular sequence order produced for male and female Pan troglodytes. Some sequence could not be
established. These are highlighted by boldface lettering. The lateral clavicle and anterior inferior iliac
spine were not included in this analysis due to suspected problems with reliability in measurement.
The range of variation in fusion timing of these sites was too unpredictable.

138
Table 4.54 Example of contingency table comparing the coracoid with the distal ulna in Pan troglodytes males.
distal ulna stage total1 2 3
coracoid stage1 37 0 0 372 8 0 0 83 17 16 11 44
total 62 16 11 89
Stage 1: unfusedStage 2: mid-fusionStage 3: complete fusion
Table 4.55 Modular sequence of fusion for Pan troglodytes females.
sequence number epiphysis1 distal humerus2 humeral medial epicondyle3 sub-coracoid and glenoid4 coracoid5 triradiate6 distal phalanges hand7 proximal ulna8 talus8 distal phalanges, middle phalanges, metatarsal heads 2-59 calcaneus
10 proximal and middle phalanges of hand11 proximal radius11 greater trochanter11 proximal phalanges (foot) and base of metatarsal 112 lesser trochanter13 base of metacarpal 114 femoral head15 heads of metacarpals 2-516 distal fibula17 proximal tibia17 distal tibia18 distal femur18 proximal fibula19 proximal humerus20 ischial epiphysis21 distal radius22 distal ulna23 acromium24 iliac crest25 medial border of scapula26 medial clavicle

139
Table 4.56 Modular sequence of fusion for Pan troglodytes males.
sequence number epiphysis1 distal humerus2 sub-coracoid and glenoid3 distal phalanges hand3 triradiate4 talus5 coracoid6 base of metacarpal 17 proximal ulna8 distal phalanges, middle phalanges, metatarsal heads 2-59 calcaneus10 proximal and middle phalanges of hand11 lesser trochanter12 femoral head13 proximal radius13 greater trochanter13 proximal phalanges (foot) and base of metatarsal 114 heads of metacarpals 2-514 distal fibula15 distal tibia16 distal femur17 proximal tibia18 distal radius19 proximal fibula19 ischial epiphysis20 humeral medial epicondyle21 distal ulna22 proximal humerus23 acromium24 iliac crest24 medial clavicle24 medial border of scapula
These sequences are similar but not identical. Differences found are the likely result of the smaller
sample size for males. Contingency tables inherently require measurements from both epiphyses to be
present for each individual. For many epiphyses in males this requirement meant that only a single
fusion event was present. Order changes of closely fusing fusion events were frequent. For epiphyses
where difficulty in observation due to cartilage was a frequent problem during data collection, such
order changes were more common. Occasionally more large sequence changes occurred. For
example, the proximal humerus is a later-fusing epiphyses but for a small number of individuals,
fusion at this site deviates much earlier in sequence. It is likely these values were erroneus. This
observation may also be made for the talus, the base of metacarpal 1 and the distal phalanges of both

140
hands and feet. In theory, testing for significant difference in sequence between sexes would requires
chi-squared tests for each shift in sequence order. Sample size for males was deemed too small for this
analysis to reliably be conducted. Given the level of variability observed for modular sequence
analysis in Pan troglodytes, it was decided not to conducted this analysis for Pan paniscus.
4.2.2b: Seriating sequence order by assessing mean epiphyseal fusion score in males and females independently
The use of mean epiphyseal fusion score for ordering fusion events is an alternative to the the
application of contingency tables. The utility of this method will be assessed in this section. In theory,
if all individuals underwent fusion in exactly the same order then simply ordering these individuals
based on their mean epiphyseal fusion score would produce a clear pattern. Figure 4.12 demonstrates
how an epiphyseal seriation would appear under ideal conditions. Figure 4.13 shows deviations more
typically observed in the present study. ‘0’ is defined as unfused and ‘1’ as fused. Epiphyseal fusion
events in Figure 4.7 follow a progression of E1, E2, E3 … Ex. In Figure 4.13 the order of these events
is far less clear. Variations in sequence are to be expected. As outlined in Chapter 2, for humans
sequences of fusion have been determined and reported by studies such as Schaefer and Black (2007).
Specific polymorphic sites are highlighted in texts such as Scheuer and Black (2004). A more
complete picture (e.g., Schaefer and Black 2007, Schaefer 2008) suggests that many different patterns
occur for epiphyses that fuse closely in time and that there is simply a pattern that the majority of
studies agree with. Larger samples have tended towards the most common patterns. There is no
reason to believe that chimpanzees and bonobos show any differing levels of variation in sequence
than humans.
Figure 4.28 Hypothetical perfect seriation of epiphyseal fusion events.

141
Figure 4.29 Typical types of order deviations.
Due to the contraints previous mentioned only Pan troglodytes will be considered here. Mid-fusion
and complete fusion were analysed separately. All data were analyzed using SPSS 21. Similar to
dental score, mean epiphyseal fusion values are based on a series of many ordinal variables and by the
central limit theorem behave as a continuous variable (Norman 2010). A one-way ANOVA was able
to distinguish if any of the ranges of fusion for these epiphyses were significantly different. This test
assumed that all variables were normally distributed. Shapiro-Wilk and Kolmogorov-Smirnov tests
were applied to both males and female Pan troglodytes for both mid-fusion and complete fusion.
Results are available in section 8.5 of the appendix (Tables 8.21-8.24). Complete fusion represents a
permanent stable state after fusion has occurred. As such, ranges for complete fusion might be
assumed that to be less likely to demonstrate normality due to the fact that these ranges will have no
central tendency. This was not the case and the vast majority of epiphyses were normally distributed.
Table 4.14 summarises epiphyses that were non-normal and those that were excluded from analysis
due to limited sample size (3 or fewer individuals present).
Table 4.57 Summary of non-normal ranges of mean epiphyseal fusion score for mid-fusion and complete fusion in Pan troglodytes males and females.
sex fusion state non-normal epiphyses excluded epiphysesfemale mid-fusion distal humerus (p=0.03) none
female complete fusion
proximal humerus (p=0.002) iliac crestproximal fibula (p=0.034) medial border of scapula
proximal phalanges (foot) (p=0.04)sub-coracoid and glenoid (p=0.028)
male mid-fusiondistal humerus (p=0.000) anterior inferior iliac
spinesub-coracoid and glenoid (p=0.000) lateral clavicletalus
male complete fusion noneiliac crest
medial claviclemedial border of scapula

142
For epiphysis in mid-fusion for females, only the distal humerus was not normally distributed. For
mid-fusion, in males the trochea and sub-coracoid and glenoid were not normally distributed. Tests of
normality for complete fusion in females indicated that the proximal humerus, proximal fibula,
proximal phalanges (foot) and the sub-coracoid and glenoid were not normally distributed. For
complete fusion in males, all epiphyseal fusion ranges were normal. Of greater concern in this analysis
is mid-fusion as this represents the process of fusion. For mid-fusion, there were 3 epiphyses out of a
total of 69 that were not normally distributed. A one-way ANOVA was performed with, and without
these epiphyses. Both returned p-values of 0.000, indicating that the presence of these epiphyses does
not affect the difference in overlap of ranges and there is a significant difference for at least one range
of fusion values. Subsequent post-hoc Bonferroni tests were used to distinguish which epiphyses
differed from each other. Rather than excluding these from analysis, it was decided to continue
analysis with these epiphyses present. Post-hoc Bonferroni comparisons with these epiphyses may
simply be accepted as less robust. Non-parametric tests may subsequently be performed if necessary.
Figures 4.14 and 4.15 show mean values for all mid-fusion epiphyses in male and female Pan
troglodytes.
It may be observed in Figures 4.14 and 4.15 that the pattern of fusion events in males and females were
generally the same with some exceptions. Differences between sex will be considered in section
4.2.2c. Post-hoc Bonferroni tests for determining which epiphyses significantly differed from each
other produced a large number of comparisons. There were 36 epiphyses for each sex. All
comparisons were too numerous to provide here but these are available in Table 8.2.2.1 of the digital
appendix (section 8.2.2). A numbering legend for this table is presented in Table 8.2.2.2 in the digital
appendix. Significant overlaps and differences were found for all epiphysis. To make sense of what
these comparisons imply, an example will be considered. Table 4.15 provides post-hoc Bonferroni
comparisons for the proximal humerus in Pan troglodytes females.
143
Figure 4.30 Mean values for all epiphyses at mid-fusion states for Pan troglodytes females.
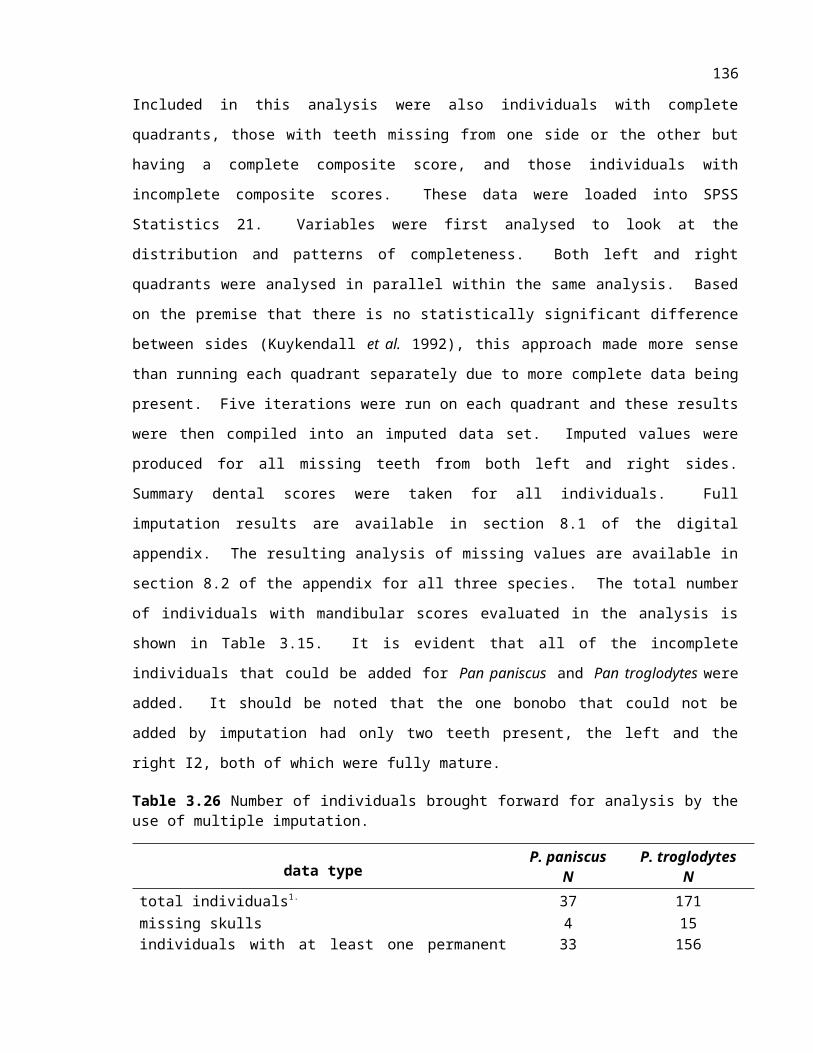
144
Figure 4.31 Mean values for all epiphyses at mid-fusion states for Pan troglodytes females.

145
Table 4.58 Post-hoc Bonferroni test of difference for the proximal humerus in Pan troglodytes females.
(J) proximal humerus mean difference (I-J) std. error sig.
95% confidence Intervallower
Boundupper Bounddistal humerus 2.66333* 0.22262 0.000 1.7747 3.552
humeral medial epicondyle 2.12667* 0.21347 0.000 1.2745 2.9788proximal radius .97083* 0.1939 0.001 0.1968 1.7448distal radius -0.38137 0.17481 1.000 -1.0792 0.3164proximal ulna 1.47667* 0.24803 0.000 0.4866 2.4668distal ulna -0.37604 0.17781 1.000 -1.0858 0.3337distal phalanges (hand) 1.97667* 0.33071 0.000 0.6565 3.2968base of metacarpal 1 (hand) .94833* 0.22262 0.016 0.0597 1.837proximal and middle phalanges (hand)
1.42697* 0.19943 0.000 0.6309 2.223heads of metacarpals 2-5 0.71111 0.21347 0.601 -0.141 1.5633femoral head .87606* 0.19943 0.009 0.08 1.6721greater trochanter 1.09970* 0.19943 0.000 0.3036 1.8958lesser trochanter 1.18133* 0.26663 0.008 0.117 2.2457distal femur -0.12143 0.16536 1.000 -0.7815 0.5386proximal tibia -0.04048 0.16536 1.000 -0.7005 0.6196distal tibia 0.17405 0.18487 1.000 -0.5639 0.912proximal fibula -0.05979 0.17781 1.000 -0.7696 0.65distal fibula 0.36433 0.20587 1.000 -0.4574 1.1861triradiate 1.97111* 0.21347 0.000 1.119 2.8233anterior inferior iliac spine 0.99833 0.39651 1.000 -0.5845 2.5811iliac crest -.76567* 0.16741 0.004 -1.4339 -0.0974ischial epiphysis -0.35333 0.17211 1.000 -1.0404 0.3337calcaneus 1.37833* 0.22262 0.000 0.4897 2.267talus 1.86333* 0.33071 0.000 0.5432 3.1835distal phalanges (foot) 1.47000* 0.1939 0.000 0.696 2.244middle phalanges (foot 1.17970* 0.19943 0.000 0.3836 1.9758metatarsal heads 2-5 .81067* 0.18114 0.006 0.0876 1.5337proximal phalanges (foot) 1.25083* 0.22262 0.000 0.3622 2.1395base of metatarsal 1 0.86208 0.22262 0.08 -0.0266 1.7507medial clavicle -0.10667 0.23385 1.000 -1.0401 0.8268lateral clavicle 0.55333 0.29231 1.000 -0.6135 1.7202coracoid 1.83433* 0.20587 0.000 1.0126 2.6561sub-coracoid and glenoid 2.03583* 0.22262 0.000 1.1472 2.9245acromium -0.48078 0.17481 1.000 -1.1786 0.217medial border -.87267* 0.20587 0.018 -1.6944 -0.0509

146
As observed in Figures 4.14 and 4.15, the proximal humerus is a relatively late-fusing epiphysis in
terms of mean epiphyseal fusion score but does not appear to be the last. When compared to this
epiphysis, 14 of 35 other epiphyses (40%) were not significantly different while 21 did show
differences (p-values shown above in Table 4.15). The most distant epiphysis that did not significantly
differ was the anterior inferior iliac spine (mean difference of 0.99833). and the most proximate in
terms of significant differences was the medial border of the scapula (mean difference of -0.87267,
p=0.018). Essentially, epiphyses that had a mean epiphyseal fusion value distance greater than 1
would show significant differences and those nearer would not. This pattern is observed for all
epiphyses. Figure 4.16 demonstrates how this ranges of no statistical differences may be visualised.
Figure 4.32 Demonstration of range of no statistical significance for Pan troglodytes females.

147
This means that range of overlap for these epiphyses is too great for this type of statistical test to find
differences for fusion events that occur close together. For epiphysis that are distant from each other in
terms of mean epiphyseal fusion value such as the distal humerus and proximal humerus, there may be
confidence in asserting that one is later than the other (p=0.000 in this case). A loose grouping of
fusion events that statistically differ from each other are shown in Table 4.16 below. These same
epiphyses are also significantly different for mid-fusion events in male Pan troglodytes.
Table 4.59 Earlier and later epiphyses for mid-fusion Pan troglodytes females.
earlier epiphysis later epiphysesdistal humerus proximal humerus
humeral medial epicondyle distal radiusproximal radius distal ulnaproximal ulna iliac crest
epiphyses of hands and feet ischial epiphysiscoracoid medial clavicle
subcoracoid and glenoid acromiummedial border of scapula
The analysis completed above was done for complete fusion epiphyses. Figures 4.17 and 4.18 provide
plots for mean values. Post-hoc Bonferroni tests are found in Table 8.2.3.1 of the digital appendix
(section 8.2.3). Far fewer epiphyses showed significant differences. For example, the proximal
humerus for females only showed a significant difference for the distal humerus (p=0.003) and the
talus (p=0.000) with all other epiphyses showing non-significant differences. This was likely due to
the much wider ranges of complete fusion.

148
Note: The iliac crest had no data.
Figure 4.33 mean values for all epiphyses at complete fusion states for Pan troglodytes females.
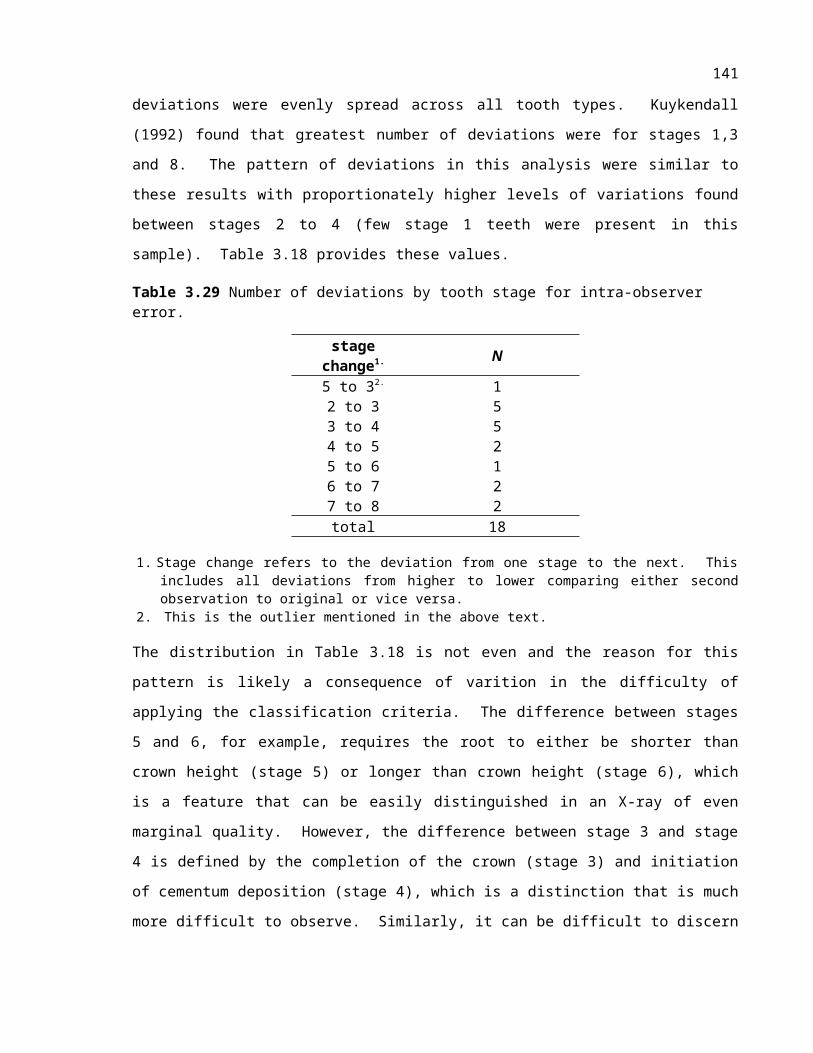
149
Figure 4.34 Mean values for all epiphyses at complete fusion states for Pan troglodytes males.
4.2.2c Sex differences in modular sequence pattern for Pan troglodytes
The general patterns of mean epiphyseal fusion values presented in Figures 4.14, 4.15, 4.17, 4.18
appear very similar, suggesting that there may be no differences between males and females. Given
that the distributions of these fusion events are virtually all normally distributed except for a few
named epiphyses (see Table 4.14) an independent sample t-test could be applied. This was first
performed for mid-fusion epiphyses. For both sexes was the distal humerus had a non-normal
distribution (p = 0.002 females, p = 0.000 males). The the sub-coracoid and glenoid was non-normal
for males (p = 0.000). Table 4.17 below provides results comparing male and female mid-fusion
values using independent sample t-tests for each epiphysis. The anterior inferior iliac spine, the talus
and the lateral clavicle were excluded from this analysis due to either the male or female sample
having only one individual present. Instances where the test of equal variances indicate a statistically

150
significant departure are highlighted in bold. Also highlighted are cases where there is a significant
differences between the sexes by means of the 2-tailed t-test.
Table 4.60 Independent sample t-test for comparing male and female mid-fusion mean epiphyseal fusion score ranges for all epiphyses in Pan troglodytes.
epiphysis
levene's test for equality of variances
t-test for equality of means
F Sig. t dfSig. (2-
tailed)
Mean Difference
Std. Error Difference
proximal humerus a1. .888 .355 -1.237 26 .227 -.41095 .33232b2. -1.608 18.427 .125 -.41095 .25564
distal humerus a 8.105 .016 -2.177 11 .052 -.16000 .07349b -1.859 5.221 .120 -.16000 .08605
humeral medial epicondyle
a 6.342 .024 .027 15 .979 .00542 .20370b .028 10.907 .978 .00542 .19486
proximal radius a .004 .953 -.151 13 .882 -.06136 .40652b -.136 4.547 .897 -.06136 .45025
distal radius a 7.158 .013 1.682 24 .106 .40248 .23927b 1.309 9.182 .222 .40248 .30740
proximal ulna a .397 .542 .229 11 .823 .12238 .53373b .238 9.994 .816 .12238 .51319
distal ulna a 2.551 .127 1.684 19 .108 .30357 .18022b 1.330 7.286 .224 .30357 .22825
distal phalanges (hand)
a 1.877 .220 -.131 6 .900 -.04933 .37710b -.163 5.404 .876 -.04933 .30214
base of metacarpal 1 a 4.753 .052 2.485 11 .030 .79500 .31986b 2.118 5.184 .086 .79500 .37544
proximal and middle phalanges (hand)
a 2.528 0.134 -0.592 14 0.563 -0.213 0.35974b -0.514 6.937 0.623 -0.213 0.4144
heads of metacarpals 2-5
(hand)
a .418 .532 -.484 10 .639 -.20111 .41593
b -.411 2.779 .711 -.20111 .48949
femoral head a .136 .718 .241 14 .813 .06927 .28713b .202 5.510 .847 .06927 .34253
greater trochanter a 1.186 .297 -.515 12 .616 -.09636 .18694b -.871 10.973 .402 -.09636 .11060
lesser trochanter a 19.369 .003 1.082 7 .315 .33700 .31150b .968 3.358 .398 .33700 .34820
distal femur a .356 .555 1.178 27 .249 .25351 .21517b 1.109 11.372 .290 .25351 .22856
1. Equal variances assumed2. Equal variances not assumed
(continued)

151
epiphysis
levene's test for equality of variances
t-test for equality of means
F Sig. t dfSig. (2-
tailed)
Mean Difference
Std. Error Difference
proximal tibia a1. 2.395 .133 1.151 27 .260 .26631 .23130b2. .914 8.925 .385 .26631 .29129
distal tibia a 3.421 .079 .208 20 .837 .05179 .24904b .176 9.225 .864 .05179 .29421
proximal fibula a .006 .937 .300 21 .767 .05455 .18179b .281 9.988 .785 .05455 .19431
distal fibula a 9.564 .007 -.159 17 .875 -.04211 .26412b -.153 9.968 .882 -.04211 .27555
triradiate a .003 .956 .133 17 .896 .03622 .27276b .133 16.989 .895 .03622 .27145
iliac crest a .026 .872 -1.390 23 .178 -.19100 .13741b -1.199 5.314 .281 -.19100 .15930
ischial epiphysis a .059 .811 2.273 21 .034 .48267 .21235b 2.088 5.783 .084 .48267 .23116
calcaneus a .180 .681 .999 10 .341 .28000 .28024b .939 5.229 .389 .28000 .29828
distal phalanges (foot)
a .326 .576 .596 15 .560 .19933 .33419b .569 6.856 .588 .19933 .35040
middle phalanges (foot)
a .508 .489 .168 13 .869 .03364 .20065b .144 4.239 .892 .03364 .23404
metatarsal heads 2-5 (foot)
a .009 .924 -.581 16 .569 -.22733 .39133b -.556 2.757 .620 -.22733 .40883
proximal phalanges (foot)
a 1.315 .281 -.646 9 .534 -.24750 .38293b -1.060 7.849 .321 -.24750 .23341
base of metatarsal 1 a 6.974 .027 .558 9 .591 .14125 .25322b .884 8.615 .401 .14125 .15984
medial clavicle a 24.103 .001 -1.147 9 .281 -.72750 .63419b -1.425 8.515 .190 -.72750 .51036
coracoid a 1.947 .182 .871 16 .396 .19400 .22261b .890 15.956 .386 .19400 .21787
sub-coracoid and glenoid
a .418 .527 .354 16 .728 .08550 .24167b .348 14.039 .733 .08550 .24566
acromium a .192 .666 2.770 18 .013 .77078 .27829b 2.150 2.368 .144 .77078 .35853
medial border of scapula
a .576 .462 -.283 12 .782 -.04650 .16416b -.234 4.075 .826 -.04650 .19873
1. Equal variances assumed2. Equal variances not assumed

152
Two epiphyses with insufficient sample sizes were not analysed. These were the lateral clavicle and
the anterior inferior iliac spine. The majority of epiphyses showed no significant difference between
sexes with p values greater than 0.05. There were some exceptions. For mid-fusion, the distal
humerus (p = 0.052), the base of metacarpal 1 (p = 0.03), the ischial epiphysis (p = 0.034), and the
acromium (p = 0.013) differed significantly. Both sexes were found to have non-normal fusion
distributions for the distal humerus. Variances were also unequal. When equal variances were not
assumed, the p-value was not statistically significant (p = 0.120). For the base of metacarpal 1, the
variances were only very slightly insignificant (p = 0.052) and with unequal variances there is no
significant difference. For the acromium and the ischium, equal variances may be assumed. For the
acromium there may be some limitation in terms of sample size for males (N = 3). For the ischium N =
5 for males and N = 19 for females. The sample size for males was small but was still deemed
acceptable. As a general statement males and females do not differ with respect to mean mid-fusion
epiphyseal fusion timing with some possible exceptions, most notable being the ischium. Ranges for
complete fusion were also analysed. Table 4.18 shows independent sample t-tests for complete fusion
comparing male and female Pan troglodytes. Significant values are highlighted in bold. The distal
tibia and proximal fibula significantly differed with equal variances assumed (p = 0.014 for tibia, p =
0.045 for proximal fibula). The distal fibula differed with equal variances not assumed at p = 0.000.
These were not the same epiphyses as differed for mid-fusion.

153
Table 4.61 Independent sample t-test for comparing male and female complete fusion mean epiphyseal fusion score ranges for all epiphyses in Pan troglodytes.
epiphysis
levene's test for equality of variances
t-test for equality of means
F sig. t dfsig. (2-
tailed)
mean difference
std. error difference
proximal humerusa1. 0.8486 0.3726 -0.981 14 0.3432 -0.3285 0.33477b2. -1.936 13.986 0.0733 -0.3285 0.16964
distal humerusa 4.0439 0.048 1.2167 71 0.2277 0.3521 0.28938b 1.109 30.988 0.2759 0.3521 0.31748
humeral medial epicondyle
a 0.16 0.69 -0.586 57 0.56 -0.1465 0.25003b -0.591 22.003 0.561 -0.1465 0.24803
proximal radiusa 0.1398 0.7104 -0.835 40 0.4086 -0.1588 0.19008b -0.846 15.381 0.4107 -0.1588 0.18771
distal radiusa 8.7742 0.012 -1.888 12 0.0834 -0.2279 0.12068b -3.572 11.445 0.004 -0.2279 0.0638
proximal ulnaa 0.0484 0.8267 -0.173 53 0.8632 -0.0432 0.24948b -0.169 19.351 0.8673 -0.0432 0.2551
distal ulnaa 4.4059 0.0559 -1.589 13 0.136 -0.1443 0.09081b -1.98 8.8621 0.0796 -0.1443 0.0729
distal phalanges (hand)a 2.9503 0.1064 -0.521 15 0.6101 -0.2353 0.45188b -0.433 5.4586 0.6814 -0.2353 0.54309
base of metacarpal 1a 3.4915 0.0694 0.0528 38 0.9582 0.01 0.18942b 0.0418 11.403 0.9674 0.01 0.23913
proximal and middlephalanges (hand)
a 0.4025 0.5296 -1.261 38 0.215 -0.2272 0.18018b -1.225 10.428 0.2475 -0.2272 0.18545
heads of metacarpals 2-5 (hand)
a 1.8729 0.1807 -0.724 32 0.4744 -0.1191 0.16458b -0.648 10.047 0.5313 -0.1191 0.18373
femoral heada 1.2199 0.2761 -0.532 39 0.5974 -0.091 0.17085b -0.499 13.842 0.6256 -0.091 0.18229
greater trochantera 0.2403 0.6265 -0.711 43 0.4809 -0.1249 0.17561b -0.707 16.82 0.4893 -0.1249 0.17664
lesser trochantera 0.2129 0.6465 -0.885 50 0.3805 -0.2079 0.23501b -0.911 18.983 0.3736 -0.2079 0.22815
distal femura 3.0085 0.1021 -1.723 16 0.1042 -0.1583 0.09188b -2.199 13.076 0.046 -0.1583 0.07198
1. Equal variances assumed2. Equal variances not assumed
(continued)

154
epiphysis
levene's test for equality of
variancest-test for equality of means
F sig. t dfsig. (2-
tailed)
mean difference
std. error difference
proximal tibiaa1. 0.09865b2. -2.749 13.902 0.016 -0.1993 0.07252
distal tibiaa 3.9417 0.0582 -2.653 25 0.014 -0.3278 0.12359b -4.372 16.671 4E-04 -0.3278 0.07497
proximal fibulaa 2.6979 0.1169 -2.151 19 0.045 -0.2191 0.10185b -3.013 14.262 0.009 -0.2191 0.07272
distal fibulaa 4.2837 0.047 -2.868 29 0.008 -0.396 0.1381b -5.177 18.248 6E-05 -0.396 0.0765
triradiatea 0.1423 0.7075 -0.222 53 0.8253 -0.0565 0.25474b -0.193 16.618 0.8494 -0.0565 0.29301
anterior inferior iliac spine
a 1.1445 0.2925 -0.578 33 0.5674 -0.1511 0.26149b -0.484 7.7595 0.642 -0.1511 0.31237
ischial epiphysisa 0.001 0.979 -.741 15 0.47 -0.1175 0.15854b -.693 6.6111 0.5117 -0.1175 0.16945
calcaneusa 0.3482 0.558 -0.387 46 0.7005 -0.096 0.24814b -0.353 14.522 0.7292 -0.096 0.27216
distal phalanges (foot)a 0.885 0.3514 -1.138 49 0.2608 -0.4206 0.36971b -1.43 15.923 0.1721 -0.4206 0.29417
middle phalanges (foot) a 5.003 .037 .571 19 .574 .10221 .17889b .527 11.494 .608 .10221 .19380
metatarsal heads 2-5 (foot)
a 1.585 .217 -.684 31 0.499 -0.1175 0.17182b -.611 8.339 0.5576 -0.1175 0.19239
proximal phalanges (foot)a .373 .545 -1.036 37 .307 -.18033 .17413b -1.036 13.203 .319 -.18033 .17404
base of metatarsal 1a 0.597 0.445 -1.165 35 0.2519 -0.1967 0.16881b -1.109 10.5 0.2921 -0.1967 0.17734
medial claviclea 2.9042 0.097 0.3362 36 0.7387 0.1456 0.43297b 0.2752 10.424 0.7886 0.1456 0.52898
coracoida 0.5122 0.4773 0.0913 54 0.9276 0.0217 0.23741b 0.0804 18.531 0.9368 0.0217 0.26939
sub-coracoid and glenoida 0.3009 0.5855 -0.074 56 0.9411 -0.0187 0.25226b -0.065 18.247 0.9488 -0.0187 0.28792
acromiuma 0.363 0.56 -.355 10 0.7296 -0.065 0.18285b -.355 9.848 0.7297 -0.065 0.18285
1. Equal variances assumed2. Equal variances not assumed

155
4.2.2.d Mixed sex samples for modular sequence pattern
Given that males and females do not show significant differences for almost all epiphyses, it is worth
exploring if a combined-sex sample produces a more distinct pattern due to increased sample size.
Figures 4.19 and 4.20 demonstrate mid-fusion and complete fusion mean value plots. Post-hoc
Bonferroni test results are available in Table 8.2.2.1 in the digital appendix (section 8.2.2).
Figure 4.35 Mean values for all epiphyses at mid-fusion states for combined sex Pan troglodytes.

156
Figure 4.36 Mean values for all epiphyses at complete-fusion states for combined sex Pan troglodytes.
It was found that increasing sample size did not greatly affect the range of variation and the number of
closely fusing epiphyses for a given epiphyses that did not show statistically significant differences did
not necessarily change. In section 4.2.2b the proximal humerus that was analysed to demonstrate the
range of significance. This analysis is repeated here for the combined-sex sample. Table 4.19
provides post-hoc Bonferroni test results for the proximal humerus in Pan troglodytes when looking at
combined-sex mid-fusion values. Epiphyses where sex differences were unclear or not analysed due to
sample size are not included in this analysis.
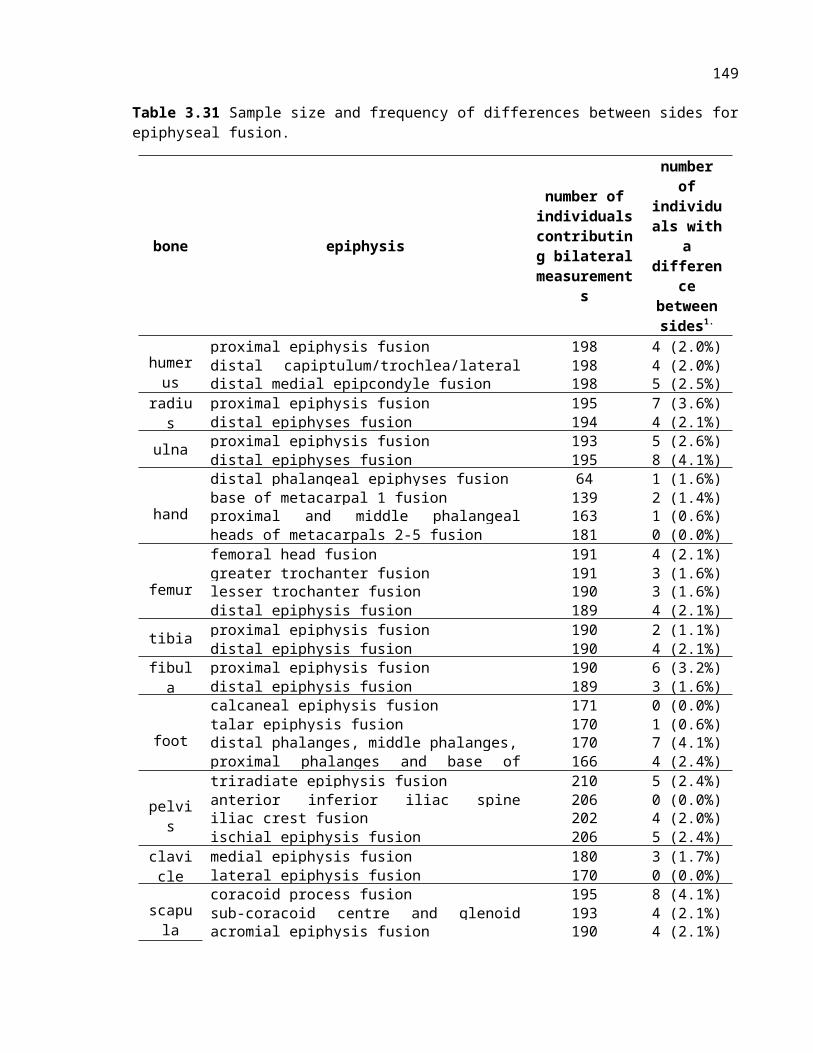
157
Table 4.62 Post-hoc Bonferroni tests of the proximal humerus for mid-fusion combined-sex fusion events in Pan troglodytes.
(J) proximal humerus mean difference (I-J) std. error sig.
95% confidence interval
lower bound
upper bound
humeral medial epicondyle 2.23195 0.180259 0.000 1.525182 2.938725proximal radius 1.05795 0.183731 0.000 0.337563 1.77833distal radius -0.139313187 0.159671 1.000 -0.76536 0.486735proximal ulna 1.64530 0.19676 0.000 0.873835 2.41677distal ulna -0.189580745 0.164982 1.000 -0.83645 0.457291distal phalanges (hand) 2.04857 0.235029 0.000 1.127054 2.970089proximal and middle phalanges (hand) 1.45960 0.180259 0.000 0.752829 2.166373
heads of metacarpals 2-5 0.763571429 0.202281 0.089 -0.02954 1.556687femoral head 1.00045 0.183731 0.000 0.280063 1.72083greater trochanter 1.18179 0.191901 0.000 0.42937 1.934202lesser trochanter 1.43385 0.224644 0.000 0.55305 2.314648distal femur 0.051243842 0.15533 1.000 -0.55778 0.66027proximal tibia 0.135726601 0.15533 1.000 -0.4733 0.744753distal tibia 0.295616883 0.167028 1.000 -0.35928 0.950511proximal fibula 0.059549689 0.164982 1.000 -0.58732 0.706422distal fibula 0.44712406 0.174256 1.000 -0.23611 1.130358triradiate 2.09291 0.174256 0.000 1.40968 2.776148anterior inferior iliac spine 1.65274 0.356152 0.002 0.256313 3.049163iliac crest -.70113 0.161318 0.008 -1.33364 -0.06862calcaneus 1.57440 0.202281 0.000 0.781289 2.367521talus 2.05607 0.313372 0.000 0.827381 3.284761distal phalanges (foot) 1.63137 0.180259 0.000 0.924594 2.338137middle phalanges (foot 1.29140 0.187588 0.000 0.555899 2.02691metatarsal heads 2-5 .87552 0.177116 0.001 0.181067 1.569964proximal phalanges (foot) 1.28607 0.208618 0.000 0.468109 2.104034base of metatarsal 1 1.00334 0.208618 0.001 0.185382 1.821306medial clavicle -0.268474026 0.208618 1.000 -1.08644 0.549488lateral clavicle 1.090071429 0.284635 0.072 -0.02594 2.206085coracoid 2.02329 0.177116 0.000 1.328845 2.717742sub-coracoid and glenoid 2.18607 0.177116 0.000 1.491623 2.88052medial border -.78321 0.191901 0.026 -1.53563 -0.0308
When this is repeated for the proximal humerus in the combined sex-sample for mid-fusion events it
was found that 11 of 21 events showed no statistically significant differences (52%). However, the
distal humerus and ischial epiphysis were removed due to significant differences between sexes having
been found. The furthest non-significant epiphyses in terms of mean value was the lateral clavicle (p =

158
0.068) which had a mean difference of 1.09077 from the proximal humerus. This epiphysis had an
insufficient sample size for comparison by sex in the previous analysis so it may be discounted. The
next closest significant difference was the heads of metacarpals 2 - 5 (p = 0.089) with a mean
difference of 0.76357. The nearest epiphysis with a significant difference was the medial border of the
scapula at a mean differences of 0.78321 (p = 0.026). These values are very similar to the values
demonstrated for the proximal epiphysis when only females were considered. This pattern is repeated
for all other epiphyses as may be observed in Table 8.2.2.1 in the digital appendix (section 8.2.2).
Combining sex does not appear to make fusion event order clearer.
4.2.2e Sequence of mean epiphyseal fusion values
Despite seriation analysis demonstrating significant amounts of overlap in ranges, it is possible to order
epiphyses based on their mean epiphyseal fusion value ranges. Table 4.20 presents mid-fusion
sequence order for Pan troglodytes males and females. Table 4.21 provides values for complete
fusion.
4.2.2f Seriation fusion event for Pan paniscus
With substantially fewer data for Pan paniscus it would be unlikely that analysis of mean epiphyseal
fusion value for ordering fusion events would be either useful or applicable. There were too few
individuals present to provide sufficient data for ranges to be analysed.

159
Table 4.63 Sequence order of mean values from lowest to highest for mid-fusion Pan troglodytes males and females.
order numbe
r
mean epiphyseal
fusion score
epiphysis (females)
mean epiphyseal
fusion score
epiphysis (males)
1 1.09 distal humerus 1.25 distal humerus2 1.63 humeral medial epicondyle 1.53 talus3 1.72 sub-coracoid and glenoid 1.62 humeral medial epicondyle4 1.78 distal phalanges (hand) 1.63 sub-coracoid and glenoid5 1.78 triradiate 1.73 coracoid6 1.89 talus 1.75 triradiate7 1.92 coracoid 1.83 distal phalanges (hand)8 2.28 proximal ulna 2.01 base of metacarpal 19 2.28 distal phalanges foot 2.08 distal phalanges foot
10 2.33 proximal and middle phalanges
2.10 calcaneal epiphysis fusion11 2.38 calcaneal epiphysis fusion 2.15 proximal ulna12 2.50 proximal phalanges foot 2.24 lesser trochanter13 2.57 lesser trochanter 2.53 proximal and middle
phalanges14 2.57 middle phalanges foot 2.54 middle phalanges foot15 2.65 greater trochanter 2.75 greater trochanter16 2.78 proximal radius 2.75 proximal phalanges foot17 2.81 base of metacarpal 1 2.75 base of metatarsal 118 2.88 femoral head 2.81 femoral head19 2.89 base of metatarsal 1 2.85 proximal radius20 2.94 metatarsal heads 2-5 3.17 metatarsal heads 2-521 3.04 heads of metacarpals 2.5 3.24 heads of metacarpals 2.522 3.39 distal fibula 3.43 distal fibula23 3.58 distal tibia 3.46 acromium24 3.75 proximal humerus 3.53 proximal tibia25 3.79 proximal tibia 3.53 distal tibia26 3.81 proximal fibula 3.62 distal femur27 3.86 medial clavicle 3.62 ischial epiphysis fusion28 3.87 distal femur 3.73 distal radius29 4.11 ischial epiphysis fusion 3.76 proximal fibula30 4.13 distal ulna 3.85 distal ulna31 4.13 distal radius 4.16 proximal humerus32 4.23 acromium 4.59 medial clavicle33 4.52 iliac crest fusion 4.67 medial border of scapula34 4.63 medial border of scapula 4.71 iliac crest fusion
Note: the lateral clavicle and the anterior inferior iliac spine have been omitted from this list.

160
Table 4.64 Sequence order of mean from lowest to highest for complete fusion Pan troglodytes males and females.
order numbe
r
mean epiphyseal
fusion score
epiphysis (females)mean
epiphyseal fusion score
epiphysis (males)
1 4.52 proximal humerus 4.85 proximal humerus2 3.57 distal humerus 3.22 distal humerus3 3.84 humeral medial epicondyle 3.99 humeral medial epicondyle4 4.21 proximal radius 4.37 proximal radius5 4.68 distal radius 4.90 distal radius6 3.89 proximal ulna 3.93 proximal ulna7 4.71 distal ulna 4.85 distal ulna8 3.64 distal phalanges hand 3.87 distal phalanges hand9 4.28 base of metacarpal 1 hand 4.27 base of metacarpal 1 hand
10 4.26 proximal and middle phalanges hand
4.49 proximal and middle phalanges hand11 4.37 heads of metacarpals 2-5
hand4.49 heads of metacarpals 2-5 hand
12 4.28 femoral head 4.37 femoral head13 4.20 greater trochanter 4.33 greater trochanter14 3.98 lesser trochanter 4.19 lesser trochanter15 4.67 distal femur 4.83 distal femur16 4.63 proximal tibia 4.83 proximal tibia17 4.50 distal tibial 4.83 distal tibial18 4.59 proximal fibula 4.83 proximal fibula19 4.43 distal fibula 4.83 distal fibula20 3.93 triradiate 3.99 triradiate21 4.26 anterior inferior iliac spine 4.41 anterior inferior iliac spine22 4.59 ischial epiphysis 4.72 iliac crest23 4.03 calcaneus 4.71 ischial epiphysis24 3.44 talus 4.13 calcaneus25 4.16 distal phalanges foot 2.76 talus26 4.26 middle phalanges foot 4.22 distal phalanges foot27 4.37 metatarsal heads 2-5 foot 4.42 middle phalanges foot28 4.27 proximal phalanges foot 4.49 metatarsal heads 2-5 foot29 4.31 base of metatarsal 1 fusion
foot4.45 proximal phalanges foot
30 4.57 medial clavicle 4.51 base of metatarsal 1 fusion foot31 3.77 lateral clavicle 4.94 medial clavicle32 3.96 coracoid 3.62 lateral clavicle33 3.89 sub-coracoid center and
glenoid3.93 coracoid
34 4.65 acromium 3.91 sub-coracoid center and glenoid35 4.91 medial border 4.71 acromium
36 4.88 medial border
Note: ischial epiphysis not included for females as there wer no individuals contributing complete fusion values.

161
4.3 Analysis of allometric relationships within Pan4.3.1 Confirming allometric relationships established in the past and
adding new sub-species of Pan
This section will assess allometric relationships between long-bones in a similar manner to Shea
(1981). This analysis will expand upon Shea’s (1981) work by including the sub-species Pan
troglodytes schweinfurthii¸ which was not present in Shea’s original sample. It should be noted that
Shea’s (1981) bonobo data was produced using the same individuals at the Museum of Central Africa
as the bonobos in this study. As outlined in Chapter 2, Shea (1981) applied regression analysis to
log10-scaled inter-membral indexes. He also evaluated variables not considered in the present study
including trunk length, body weight and postural changes. Shea made two particularly important
observations:
1. Growth in Pan troglodytes and Pan paniscus limbs is effectively isometric (the ratios of limb
lengths are static throughout growth)
2. The average leg length is a little bit longer in Pan paniscus and this may be observable in
growth trajectories.
All data were analysed using SPSS Statistics 21. Regression analysis is presented for a pooled sample
using all Pan troglodytes individuals in the dataset including all sub-species. The results of regression
applied at the species level demonstrated a high degree of linearity with an R2 value of 0.97. The high
level of agreement for long-bone lengths in this analysis suggested that separate analysis determining
linear regression results for individual sub-species of Pan troglodytes would not return meaningfully
different results. Figure 4.21 presents a scatterplot for log10-scaled arm (humerus + radius) vs. leg
(femur + tibia) data as well as a regression line for Pan troglodytes males. This includes individuals
from all sub-species. Table 4.22 shows R2 values for linear regression analysis.

162
Figure 4.37 log10 regression for male Pan troglodytes upper vs. lower limb.
Table 4.65 Regression summary for male Pan troglodytes upper vs. lower limb.
model R R2 adjusted R2 std. error of the estimate1 0.985a 0.97 0.969 0.01557
a. Predictors: (Constant), Pan troglodytes male lower limb
Regression analysis was carried out for Pan troglodytes females and both male and female Pan
paniscus. Detailed results are available in appendix section 8.6. Table 4.23 below presents R2 values
from these analyses. All R2 results demonstrated a linear relationship for both species and sexes.
Figure 4.22 shows Pan troglodytes and Pan paniscus male regression lines plotted together. Figure
4.23 presents the same information for Pan troglodytes and Pan paniscus females. Table 4.24 presents
the regression equations for Figures 4.22 and 4.23.

163
Table 4.66 Regression r-squared values for limb comparisons of Pan troglodytes females and Pan paniscus males and females
species/sex R R2 adjusted R2 std. error of the estimate
Pan troglodytes males 0.9851. 0.97 0.969 0.01557Pan troglodytes females 0.9912. 0.983 0.983 0.0113Pan paniscus males 0.9953. 0.991 0.99 0.01071Pan paniscus females 0.9954. 0.99 0.988 0.00977
1. Predictors: (Constant), Pan troglodytes males lower limb2. Predictors: (Constant), Pan troglodytes females lower limb3. Predictors: (Constant), Pan paniscus males lower limb4. Predictors: (Constant), Pan paniscus females lower limb
Figure 4.38 Regression plot of log10 transformed intermembral indicies for Pan troglodytes and Pan paniscus males.

164
Figure 4.39 Regression plot of log10 transformed intermembral indicies for Pan troglodytes and Pan
paniscus females.
Table 4.67 Linear regression equations of log10 transformed limb data for Pan troglodytes and Pan paniscus males and females.
sex P. troglodytes linear regression equation
P. paniscus linear regression equation
males y = 1.0504x - 0.153 y = 0.9819x + 0.0352females y = 0.9856x + 0.0179 y = 1.1348x - 0.3663
An isometric relationship between limb bones for males and females of both species found by Shea
(1981) is reproduced here. Pan troglodytes results do not change despite the addition of Pan
troglodytes schweinfurthii individuals from the Museum of Central Africa and the general Pan
troglodytes individuals from the University of Zurich. Given the very high R2 values for all of these
analyses, it would seem unlikely that when analysed separately that sub-species would produce
differing results. This may be pursued in future analysis but is not considered here.

165
4.3.2 Regression of serially homologous limb elements
In addition to regression for upper and lower limbs, correlations between individual long-bones were
considered. Regression was again performed using log10 transformed length data. Results are
presented in Table 4.25 for Pan troglodytes and Table 4.26 for Pan paniscus. Comparisons were made
between serially homologous upper and lower limb units (e.g., humerus-femur) and within limbs (e.g.,
humerus-radius). Full regression results are available in appendix section 8.7. The individual limb
elements analysis presented here provides further evidence that all long-bones scale isometrically.
These results are in agreement with Shea’s (1981) data.
Table 4.68 Regression values for analysis of serially homologous limb elements in Pan troglodytes.
sex bone-comparison R R2 adjusted R2
std. error of the estimate
Durbin-Watson
females
humerus-femur 0.992a 0.983 0.983 0.0123 1.565
radius tibia 0.986a 0.971 0.971 0.01467 1.637
humerus-radius 0.987a 0.975 0.975 0.0135 1.672tibia-femur 0.990a 0.981 0.981 0.0139 1.694
males
humerus-femur 0.856a 0.734 0.728 0.0460 1.217
radius tibia 0.992a 0.985 0.985 0.0113 1.631
humerus-radius 0.950a 0.903 0.901 0.0280 1.477
tibia-femur 0.995a 0.989 0.989 0.0103 1.623
Table 4.69 Regression values for analysis of serially homologous limb elements in Pan paniscus.
sex bone-comparison R R2 adjusted R2
std. error of the estimate
Durbin-Watson
females
humerus-femur 0.994 0.989 0.987 0.009 2.283
radius tibia 0.988 0.976 0.973 0.013 3.126
humerus-radius 0.999 0.998 0.998 0.004 2.287tibia-femur 0.993 0.986 0.985 0.010 2.611
males
humerus-femur 0.981 0.962 0.958 0.022 2.708
radius tibia 0.996 0.992 0.991 0.010 1.507
humerus-radius 0.987 0.974 0.972 0.019 3.014
tibia-femur 0.996 0.992 0.991 0.009 2.318
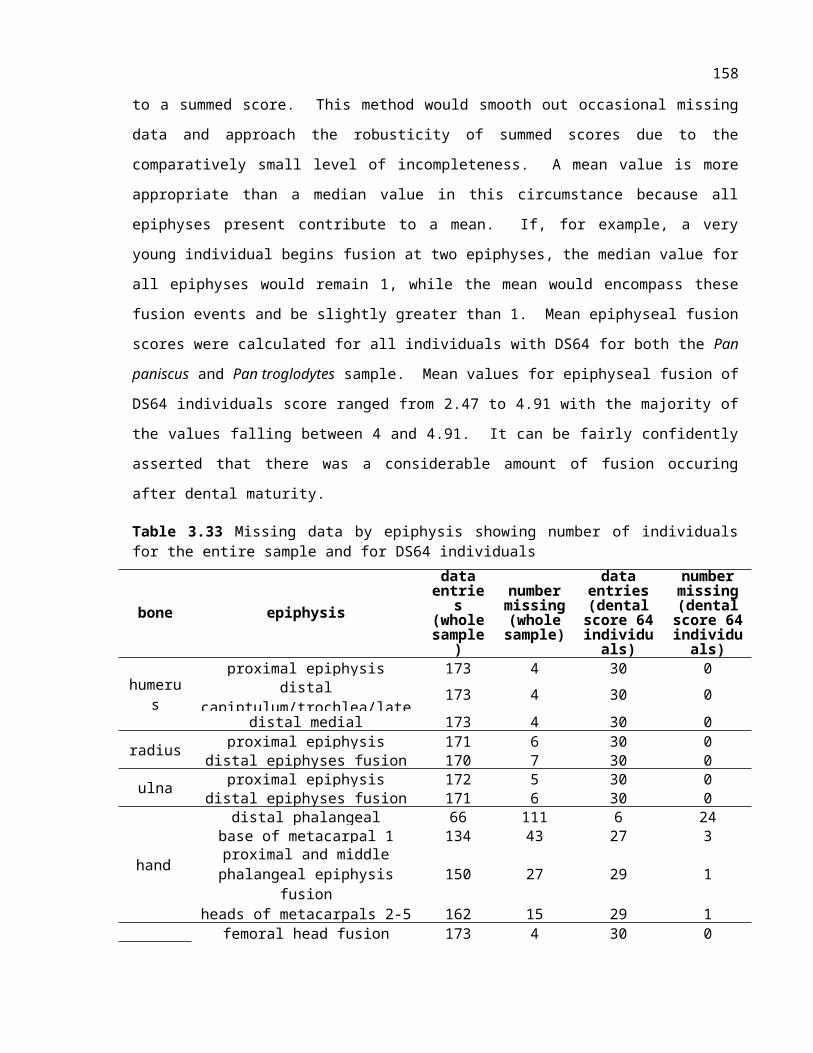
166
4.4 Calendar year estimation of epiphyseal fusion events for comparability to other studies.
Estimated chronological ages were produced using Kuykendall’s (1996) regression for summary dental
score using 8 teeth. It should be noted that Kuykendall’s (1996) estimation of third molar completion
was only technically a projection beyond stage 6, as there were no teeth present with stages 7 or 8 in
his analysis. Anemone et al. (1996) used a version of the Demirjian (1973) system in which complete
third molar maturation was observed and their results agree with the projections of Kuykendall (1996)
with maturation complete between 10-12 years. Kuykendall’s regression equation for 8 teeth will be
used in this analysis as it is the only means available to predict age using summary dental score.
Anemone’s (1996) study provided information for individual teeth but did not provide a regression
equation. The concordance between Kuykendall’s (1996) regression estimate for third molar
maturation timing and Anemone’s (1996) observation of real-world individuals provides support for
the approach used here.
Estimated chronological ages using 8 teeth for both mid-fusion and complete fusion are shown in
Table 4.27. Scores with median values of 64 are simply noted as greater than or equal to (≥) 9.453
years of age (>9.453). This is the value that is produce when DS64 is put into the regression equation.
It should be noted that Kuykendall’s (1996) regression does not differentiate between males and
females. Tables 4.28, 4.29 and 4.30 provide estimated age values for Pan troglodytes males and Pan
panicus males and females.
Variation in chronological age estimates inevitably mirror the variation found when fusion timing
relative to dental score was plotted (section 4.2.1). The limitations of sample size for Pan paniscus
was problematic in that analysis. This problem is directly translated into this analysis for age
estimations in terms of chronological years as the same data are used. It is worth noting the effect that
these variations have for chronological age estimation. Given prior statements about the difficulty of
collecting data for the lateral clavicle and the anterior inferior iliac spine, it is unsurprising that the
values for these epiphyses vary much more than other epiphyses. Insufficient sample size for a given
epiphysis was a recurrent problem for Pan paniscus and this is reflected in the inconsistency between
male and female values as well as between Pan paniscus and Pan troglodytes. As brought forward
from the results found for dental score, it is not possible to test differences between the two species.

167
Table 4.70 Estimated chronological ages for fusion events based on median values of mid-fusion and complete fusion in Pan troglodytes females.
skeletal region epiphyseal fusion site
N mid-fusio
n
N complete fusion
mid-fusion
median
complete fusion
median
mid-fusion
complete fusion
dental score
dental score years years
upper limb
proximal humerus 19 12 62 64 9.033 ≥9.453distal humerus 8 48 48 63 6.317 9.242
humeral medial epicondyle 8 42 55 64 7.626 ≥9.453proximal radius 11 30 63 64 9.242 ≥9.453
distal radius 16 9 64 64 ≥9.453 ≥9.453proximal ulna 4 40 56 64 7.821 ≥9.453
distal ulna 14 10 64 64 ≥9.453 ≥9.453
hand
distal phalanges (hand) 2 10 50 62 6.681 9.033base of metacarpal 1 7 29 61 64 8.826 ≥9.453proximal and middle
phalanges (hand)10 29 60.5 64 8.723 ≥9.453
metacarpal heads 2-5 7 25 62 64 9.033 ≥9.453
lower limb
femoral head 10 29 62 64 9.033 ≥9.453greater trochanter 10 32 61.5 64 8.929 ≥9.453lesser trochanter 5 37 61 64 8.826 ≥9.453
distal femur 19 12 64 64 ≥9.453 ≥9.453proximal tibia 20 13 63.5 64 9.347 ≥9.453
distal tibia 12 21 62.5 64 9.137 ≥9.453proximal fibula 14 16 63 64 9.242 ≥9.453
distal fibula 9 24 63 64 9.242 ≥9.453
foot
calcaneus 7 35 60 64 8.621 ≥9.453talus 2 46 57 63 8.018 9.242
distal phalanges (foot) 11 31 60 64 8.621 ≥9.453middle phalanges (foot) 10 29 62 64 9.033 ≥9.453metatarsal heads (2-5) 13 25 62 64 9.033 ≥9.453base of metatarsal 1 8 32 62.5 64 9.137 ≥9.453
proximal phalanges (foot) 8 27 61.5 64 8.929 ≥9.453
pelvis
triradiate 8 39 56.5 64 7.919 ≥9.453
anterior inferior iliac spine 1 40 55 64 7.626 ≥9.453
iliac crest 18 0 64 - ≥9.453 -ischial epiphysis 16 11 64 64 ≥9.453 ≥9.453
claviclemedial clavicle 7 5 64 64 ≥9.453 ≥9.453lateral clavicle 4 28 59 64 8.418 ≥9.453
scapula coracoid 9 39 58 64 8.217 ≥9.453
sub-coracoid and glenoid 6 42 50 64 6.681 ≥9.453
acromium 16 4 64 64 ≥9.453 ≥9.453

168
medial border 8 2 64 64 ≥9.453 ≥9.453
Table 4.71 Estimated chronological ages for fusion events based on median values of mid-fusion and complete fusion in Pan troglodytes males.
skeletal region epiphyseal fusion site N mid-
fusion
N complete
fusion
mid-fusion
median
complete fusion
median
mid-fusion
complete fusion
dental score
dental score years years
upper limb
proximal humerus 7 3 62 64 9.242 ≥9.453distal humerus 5 18 48 63 8.217 8.929
humeral medial epicondyle 7 13 55 64 8.621 9.242proximal radius 3 10 63 64 8.826 9.242
distal radius 8 3 64 64 9.242 9.453proximal ulna 6 12 56 64 8.723 9.242
distal ulna 6 4 64 64 9.242 ≥9.453
hand
distal phalanges (hand) 2 5 50 62 7.919 9.242base of metacarpal 1 2 10 61 64 8.217 9.347proximal and middle
phalanges (hand) 5 8 60.5 64 8.826 ≥9.453
metacarpal heads 2-5 2 8 62 64 9.033 ≥9.453
lower limb
femoral head 4 10 62 64 8.621 9.242greater trochanter 1 12 61.5 64 8.826 9.242lesser trochanter 3 12 61 64 8.217 9.242
distal femur 7 5 64 64 9.033 ≥9.453proximal tibia 7 5 63.5 64 9.033 ≥9.453
distal tibia 6 6 62.5 64 8.826 ≥9.453proximal fibula 5 6 63 64 9.242 ≥9.453
distal fibula 7 6 63 64 8.621 ≥9.453
foot
calcaneus 3 11 60 64 8.621 9.242talus 0 21 57 63 - 8.826
distal phalanges (foot) 2 9 60 64 8.217 9.242middle phalanges (foot) 3 8 62 64 8.418 9.347metatarsal heads (2-5) 2 7 62 64 9.033 ≥9.453base of metatarsal 1 2 9 62.5 64 8.621 ≥9.453
proximal phalanges (foot) 2 8 61.5 64 8.621 ≥9.453
pelvis
triradiate 8 13 56.5 64 8.621 9.242anterior inferior iliac spine 1 6 55 64 7.626 ≥9.453
iliac crest 5 1 64 - ≥9.453 ≥9.453ischial epiphysis 4 5 64 64 9.137 ≥9.453
claviclemedial clavicle 4 1 64 64 ≥9.453 ≥9.453lateral clavicle 1 9 59 64 6.681 9.242
scapula
coracoid 6 14 58 64 8.621 9.242sub-coracoid and glenoid 7 14 50 64 8.217 9.242
acromium 2 6 64 64 8.621 ≥9.453medial border 4 1 64 64 ≥9.453 ≥9.453

169

170
Table 4.72 Estimated chronological ages for fusion events based on median values of mid-fusion and complete fusion in Pan paniscus females.
skeletal region epiphyseal fusion site
N mid-
fusion
N complete
fusion
mid-fusion
median
complete fusion
median
mid-fusion
complete fusion
dental score
dental score years years
upper limb
proximal humerus 0 3 62 64 - ≥9.453distal humerus 1 7 48 63 7.242 9.033
humeral medial epicondyle 3 4 55 64 7.242 ≥9.453proximal radius 1 3 63 64 ≥9.453 ≥9.453
distal radius 4 0 64 64 ≥9.453 -proximal ulna 2 5 56 64 8.1172
5≥9.453
distal ulna 3 1 64 64 ≥9.453 9.033
hand
distal phalanges (hand) 2 4 50 62 7.242 ≥9.453base of metacarpal 1 1 3 61 64 7.242 ≥9.453proximal and middle
phalanges (hand) 2 4 60.5 64 7.242 ≥9.453
metacarpal heads 2-5 0 4 62 64 - ≥9.453
lower limb
femoral head 1 3 62 64 8.621 ≥9.453greater trochanter 1 3 61.5 64 8.621 ≥9.453lesser trochanter 0 4 61 64 - ≥9.453
distal femur 1 2 64 64 ≥9.453 ≥9.453proximal tibia 1 2 63.5 64 ≥9.453 ≥9.453
distal tibia 0 3 62.5 64 - ≥9.453proximal fibula 2 0 63 64 ≥9.453 -
distal fibula 0 2 63 64 - ≥9.453
foot
calcaneus 1 3 60 64 9.033 ≥9.453talus 0 5 57 63 - ≥9.453
distal phalanges (foot) 2 3 60 64 7.053 ≥9.453
middle phalanges (foot) 2 3 62 64 7.053 ≥9.453
metatarsal heads (2-5) 2 3 62 64 7.053 ≥9.453base of metatarsal 1 0 3 62.5 64 - ≥9.453
proximal phalanges (foot) 0 3 61.5 64 - ≥9.453
pelvis
triradiate 2 5 56.5 64 8.11725
8.826
anterior inferior iliac spine 0 3 55 64 - ≥9.453
iliac crest 3 0 64 - ≥9.453 -ischial epiphysis 1 0 64 64 ≥9.453 -
claviclemedial clavicle 0 1 64 64 - 9.033lateral clavicle 0 3 59 64 - ≥9.453
scapula coracoid 3 4 58 64 7.242 ≥9.453sub-coracoid and glenoid 3 4 50 64 7.242 ≥9.453
acromium 2 2 64 64 ≥9.453 9.242

171
medial border 1 1 64 64 ≥9.453 9.033
Table 4.73 Estimated chronological ages for fusion events based on median values of mid-fusion and complete fusion in Pan paniscus males.
skeletal region epiphyseal fusion site
N mid-
fusion
N complete
fusion
mid-fusion
median
complete fusion
median
mid-fusion
complete fusion
dental score
dental score years years
upper limb
proximal humerus 3 0 62 64 ≥9.453 8.621distal humerus 5 7 48 63 8.418 8.72325
humeral medial epicondyle 5 2 55 64 8.621 ≥9.453proximal radius 5 2 63 64 8.621 ≥9.453
distal radius 0 2 64 64 - 8.621proximal ulna 1 7 56 64 6.138 ≥9.453
distal ulna 0 2 64 64 - 9.13725
hand
distal phalanges (hand) 2 4 50 62 5.961 >9.453base of metacarpal 1 2 1 61 64 6.7732
5>9.453
proximal and middle phalanges (hand) 3 3 60.5 64 7.433 >9.453
metacarpal heads 2-5 5 2 62 64 8.621 8.826
lower limb
femoral head 6 1 62 64 8.7232 ≥9.453greater trochanter 3 3 61.5 64 8.621 8.826lesser trochanter 2 5 61 64 8.5192
5≥9.453
distal femur 1 1 64 64 ≥9.453 ≥9.453proximal tibia 1 2 63.5 64 8.621 ≥9.453
distal tibia 0 2 62.5 64 - ≥9.453proximal fibula 0 2 63 64 - ≥9.453
distal fibula 2 2 63 64 8.11725
8.826
foot
calcaneus 2 5 60 64 7.33725
8.621talus 0 9 57 63 - ≥9.453
distal phalanges (foot) 2 3 60 64 8.018 ≥9.453
middle phalanges (foot) 2 3 62 64 8.018 ≥9.453
metatarsal heads (2-5) 2 3 62 64 8.018 ≥9.453base of metatarsal 1 4 2 62.5 64 8.018 ≥9.453
proximal phalanges (foot) 4 2 61.5 64 8.018 8.826
pelvis
triradiate 4 5 56.5 64 7.91925
8.826
anterior inferior iliac spine 0 6 55 64 - -
iliac crest 1 0 64 - ≥9.453 -ischial epiphysis 4 0 64 64 8.826 ≥9.453
claviclemedial clavicle 1 2 64 64 7.433 8.418lateral clavicle 0 2 59 64 - 8.72325
scapula coracoid 1 6 58 64 7.433 9.13725sub-coracoid and glenoid 3 4 50 64 8.418 ≥9.453

172
acromium 0 2 64 64 - ≥9.453medial border 1 1 64 64 ≥9.453 9.033

173
Prior studies of epiphyseal fusion timing in chimpanzees and bonobos were outlined in Chapter 2.
Bolter and Zihlman (2012) provided the most comprehensive data set for epiphyseal fusion in
chimpanzees and bonobos and included data from Kerley (1966) and Zihlman et al. (2007). These data
will be used form comparison here. Table 4.31 compares estimated chronological ages based on
median dental score values from chimpanzees in the present study to data from Bolter and Zihlman
(2012). Table 4.32 provides comparative data from Bolter and Zihlman (2012) for bonobos to data
from the present study. All estimated ages based on dental score have an error range of +/- 0.92
(Kuykendall 1996).
Table 4.74 Comparison of estimated mid-fusion and complete fusion ages in Pan troglodytes from the present study to data from Bolter and Zihlman (2012).
prior studies data from the present study
skeletal element
Captives from Yerkes, age in years, N=101.
Wild from Tai National Park, age in years,
N=92.
female estimated age by median (years)
male estimated age by median
(years)mid-
fusioncomplete
fusionmid-
fusioncomplete
fusiondistal humerus partial 6–7 7.96b< x <10 6.32 9.24 8.22 8.93
acetabulum partial 7 5.19< x<11.38 7.92 ≥ 9.45 8.62 9.24proximal radius partial 9 11.38< x <12 9.24 ≥ 9.45 8.83 9.24
coracoid partial 9 10< x <11.38 8.22 ≥ 9.45 8.62 9.24proximal femur partial 9 11.38< x <12 9.03 ≥ 9.45 8.62 9.24
distal tibia partial 9 11.38< x <12 9.14 ≥ 9.45 8.83 ≥ 9.45proximal tibia partial 9-14 >12 9.35 ≥ 9.45 9.03 ≥ 9.45humeral head partial 9-14 >12 9.03 ≥ 9.45 9.24 ≥ 9.45
acromial process <10 >12 ≥ 9.45 ≥ 9.45 8.623. ≥ 9.45iliac crest partial 9-14 >12 ≥ 9.45 - ≥ 9.45 ≥ 9.45
1. There were only two individuals present and both had the same dental score.2. From Kerley (1966).3. From Zihlman et al.(2007) and unpublished data.

174
Table 4.75 Comparison of estimated mid-fusion and complete fusion ages in Pan paniscus from the present study to data from Bolter and Zihlman (2012).
epiphysisBolter and
Zihlman (2012) N=51.
data from the present studyfemales estimated age by
median (years)males estimated age by
median (years)
mid-fusion complete fusion mid-fusion
complete fusion
distal humerus <6.74 7.241. 9.03 8.42 8.72acetabulum <6.74 8.12 8.83 7.92 8.83
proximal radius 7.3 ≥ 9.451. ≥ 9.45 8.62 ≥ 9.45coracoid 7.3< x <8.54 7.24 ≥ 9.45 7.43 9.12
proximal femur 7.3< x <8.54 8.621. ≥ 9.45 8.72 ≥ 9.451.
distal tibia <8.54 - ≥ 9.45 - ≥ 9.45proximal tibia partial 8.54 ≥ 9.452. ≥ 9.45 8.621. ≥ 9.45humeral head 8.54< x <11.68 - ≥ 9.45 ≥ 9.45 8.62
acromial process 8.54< x <11.68 ≥ 9.45 9.24 - ≥ 9.45iliac crest partial 11.68 ≥ 9.45 - ≥ 9.451. -
1. Sample of only 1 individuals
A few remarks should be made regarding chimpanzee comparisons. There exists a mixture of terms
from the data provided by Bolter and Zihlman (2012) with a‘fused by’ classification for complete
union and ‘partial fusion’ representing mid-fusion. ‘Fused by’ or ‘fused prior to’ (denoted as <)
indicates that an individual observed had that epiphysis fused prior to observation. The large
difference between ages reported for wild chimpanzees and captive specimens is also present.
Comparison of captive past study results are more applicable to the data from the present study as
Kuykendall’s (1996) sample for regression analysis was drawn only from captive individuals. There is
general concordance between past studies and the present study within deviations of typically not more
than a year for mid-fusion/partial fusion comparisons.

175
4.5 Summary of standards of growth for chimpanzees and bonobos4.5.1 Growth Rate
Growth rate for long-bone length was plotted against dental score and linear regression analyses were
peformed. It was found that the relationship between growth in long-bone length and dental score is
significantly linear. Regression equations were presented for growth relative to dental score for each
long-bone.
4.5.2 Sequence of fusion events
Comparison of epiphyseal fusion events relative to dental score determined that some epiphyses fuse
beyond complete dental maturity. DS64 was a limiting factor and this method was not suitable for
ordering fusion events. Comparisons between sexes showed no significant differences, but the
limitation of dental maturity prevented a rigorous analysis of this topic.
Fusion events sequences were determined using two different methods. The first was the application
of contingency tables for producing a modular sequence of events and the second was the ordering of
events using mean epiphyseal fusion score. A notable amount of variation was found and sequences
varied somewhat between the application of the two methods. Sex differences were not apparent.
Post-hoc Bonferroni tests were used to observe differences in mean epiphyseal fusion value and it was
shown that there is a range of overlap for all sequences in which no statistically significant differences
may be found. Consequently, precise order remains ambiguous but general patterns appear to be
consistent both between sexes and between methodologies.
4.5.3 Analysis of allometry
Shea’s (1981) results were confirmed for an expanded list of Pan troglodytes sub-species.
4.5.4 Estimation of age for fusion in chronological years for comparability to prior studies
Estimations of fusion event timing in chronological years was produced using Kuykendall’s (1996)
regression equation for 8 teeth. The data in this study were consistent with results from prior studies.
An expanded list of estimated ages of fusion for given epiphyses was produced.

176
Chapter 5 Results – Comparisons of growth standards between Pan and
Homo
5.1 Comparison of human and chimpanzee epiphyseal fusion sequences5.1.1 Comparison of modular sequence patterns to Schaefer and Black
(2007)
Schaefer and Black (2007) provided a modular sequence pattern using the stages of ‘beginning fusion’
and ‘complete fusion’ in human males for 21 epiphyses. They used contingency tables to establish an
order of fusion events. The flow chart they produced provided a sequence for epiphyses with the
fractional minority cases (those which changed sequence order) listed for each stage. Chimpanzee data
presented in Chapter 4 showed a considerable amount of overlap and it appears that this was also true
for the data in Schaefer and Black’s (2007) study.
A comparison of mid-fusion data as presented in Chapter 4 with the results provided by Schaefer and
Black (2007) is problematic. The scoring method used in the Schaefer and Black’s (2007) study used
three stages: unfused, partial fusion, and complete fusion. These appear superficially to be the same as
the categories used in this study but they are not. Beginning fusion for Schaefer and Black (2007)
included individuals with epiphyses up to but not including a fused epiphysis with a residual scar line.
In the context of the system in which the data for this study was recorded, this meant that they used
mid-fusion stages 2 and 3 for their mid-fusion category while placing 4 and 5 into complete fusion. In
the present study fusion states 2, 3, and 4 were placed into mid-fusion (labelled as 2) and 5 into
complete fusion (labelled as 3). This meant that mid-fusion stages from the present study would be
potentially skewed due to the inclusion of epiphysis with a fusion scar line. Given that the duration of
time that an epiphysis retains this scar line cannot be assumed to be constant between epiphyses, these
data are not directly comparable. It is possible to re-calculate the order using Schaefer and Black’s
(2007) system as this type of data are available in the original data set. As noted in Chapter 4, sample
size for male Pan troglodytes mid-fusion events was a limiting factor. Removing individuals with
residual scar lines reduced sample numbers even further. Table 5.1 provides sample size for mid-
fusion events of Pan troglodytes males using Schaefer and Black’s (2007) criteria. Figure 5.1
demonstrates how these events are distributed for each epiphysis using a grid pattern. Epiphyses are
represented by letters which are defined in Table 5.2.

177
Table 5.76 Sample size for mid-fusion events in Pan troglodytes males using Schaefer and Black’s (2007) criteria.
epiphysis sample sizedistal humerus 2
triradiate 6medial 5
coracoid 4proximal ulna 4
proximal radius 1lesser trochanter 3proximal femur 3
distal fibula 4distal tibia 3
greater trochanter 1proximal tibia 5
acromium 2distal femur 4
proximal fibula 3distal radius 8distal ulna 4
ischial epiphysis 5proximal humerus 3
iliac crest 2medial clavicle 2

178
1. These letters are defined in the table below
Figure 5.40 Matrix showing fusion events for Pan troglodytes males using Schaefer and Black (2007)
criteria.

179
Table 5.77 Legend of epiphyses for Figure 5.1.
a distal humerus l proximal tibiab triradiate m acromiumc humeral medial epicondyle n distal femurd coracoid o proximal fibulae proximal ulna p distal radiusf proximal radius q distal ulnag lesser trochanter r ischial epiphysish femoral head s proximal humerusi distal fibula t iliac crestj distal tibia u medial claviclek greater trochanter
Sample size was too small for application of Schaefer and Black’s (2007) criteria to male Pan
troglodytes. Another approach was to consider combined sex data using Schaefer and Black’s (2007)
criteria for epiphyses where differences were not found between sexes in Chapter 4. This also allowed
for the inclusion of unsexed Pan troglodytes individuals. Table 5.3 presents sample sizes for each
epiphysis when combined-sex data is considered. Contingency tables were produced comparing each
epiphysis. A modular sequence chart is shown in Figure 5.2. Sequence order was determined by the
net number of epiphyses that proceeded (fused prior to) or preceded (fused after) a given epiphysis.
Table 5.78 Sample size for combined-sex Pan troglodytes mid-fusion epiphysis using Schaefer and Black’s (2007) criteria.
epiphysis N epiphysis Nproximal humerus 18 proximal tibia 19
distal humerus 11 distal tibia 7humeral medial epicondyle 12 proximal fibula 13
proximal radius 8 distal fibula 9distal radius 16 triradiate 11
proximal ulna 9 iliac crest 17distal ulna 14 ischial epiphysis 14
proximal femur 10 medial clavicle 9greater trochanter 5 coracoid 12lesser trochanter 7 acromium 18
distal femur 16

180
Figure 5.41 Modular sequence for combined-sex Pan troglodytes.
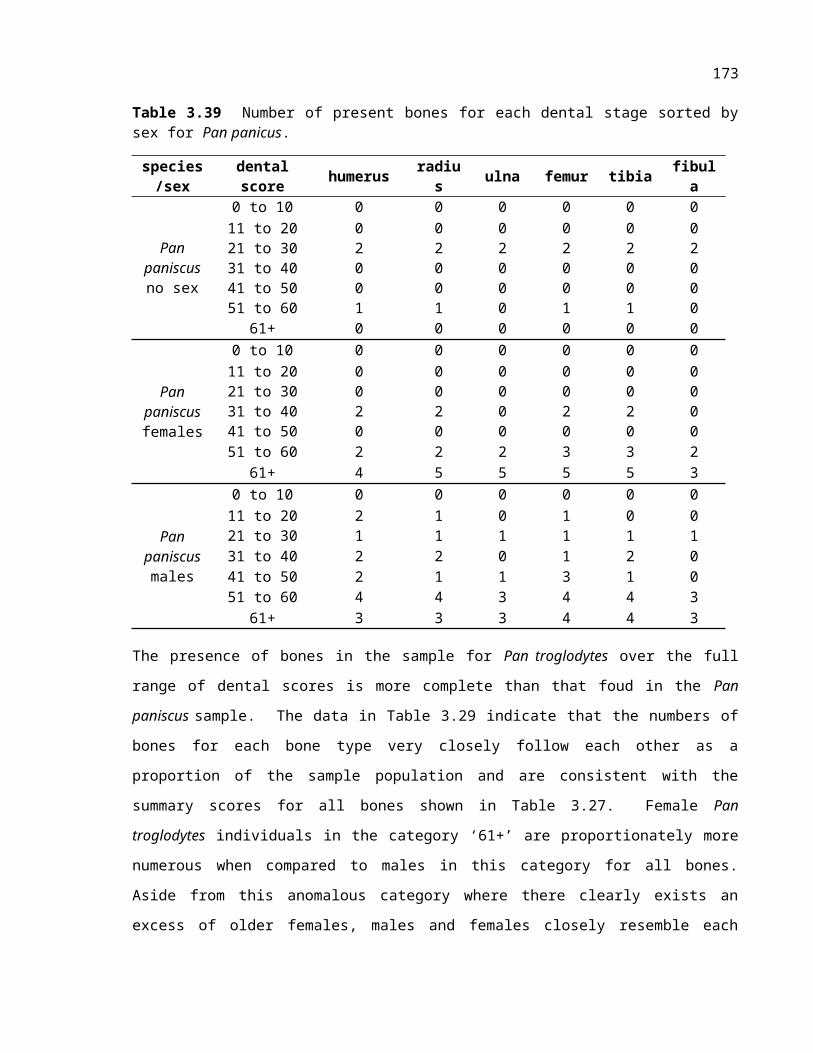
181
There was a similar amount of overlap of fusion events as was observed in Chapter 4 for fusion
sequences using the present study criteria. However, a general sequence remained discernable. Table
5.4 provides both the human sequence from Schaefer and Black (2007) and the chimpanzee sequence
as shown above in Figure 5.2. Pairs or groups of epiphyses for which order could not be determined
are highlighted in boldface. It should be noted that these particular epiphyses are separated in Figure
5.2 due to different epiphyses preceding and proceeding each. The order in this figure is arbitrary and
this does not indicate a determination of sequence order.
Table 5.79 Comparison of sequence differences between chimpanzees and humans using Schaefer and Black’s (2007) criteria.
combined-sex chimpanzees Schaefer and Black (2007) humansdistal humerus triradiate
triradiate proximal ulna/ distal humerushumeral medial epicondyle proximal ulna/ distal humerus
coracoid coracoidproximal ulna proximal radius
proximal radius/lesser trochanter femoral headproximal radius/lesser trochanter humeral medial epicondyle
greater trochanter distal tibiafemoral head lesser trochanter
proximal tibia/distal fibula greater trochanterproximal tibia/distal fibula ischial epiphysis
distal femur/distal tibia distal fibuladistal femur/distal tibia proximal tibia
proximal fibula distal femurproximal humerus acromiumischial epiphysis proximal fibula
distal radius iliac creastdistal ulna proximal humerusacromium distal radiusiliac crest distal ulna
medial clavicle medial clavicle
The sequence order appears to be different between the two species. The level of overlap indicates that
many of these sequence differences were based on very small differences in frequency and the removal
of one or two individuals for a given epiphysis would shift sequence position several places. The
appropriate test for this type of data would be a chi-squared or fisher exact test. However, for virtually
all cases there would be insufficient sample size for statistical validity. Schaefer and Black (2007) had
the luxury of a much larger sample size making the analysis of closely fusing epiphyses more distinctly
resolved for their study. Even with this being the case the amount of overlap observed in their data
also would have made this type of statistical analysis for frequency difference inconclusive for many
epiphyses.

182
5.1.2 Comparison of mean epiphyseal fusion sequence patterns to Schaefer and Black (2007)
In Chapter 4 mean epiphyseal fusion score was used as a maturational indicator for sequencing
epiphyseal fusion events. It is worth investigating if this method produced different patterns than those
found for modular sequence in the previous section when compared to Schaefer and Black (2007).
Schaefer and Black’s (2007) criteria for epiphyseal fusion was applied to the combined-sex mid-fusion
Pan troglodytes sample from this study. Results for post-hoc Bonferroni tests are available in Table
8.2.2.3 in the digital appendix (section 8.2.2). The sequence of fusion events was similar to that found
using the present study criteria (including stages 2, 3 and 4). The level of overlap was also consistent
with that observed for present-study criteria used in Chapter 4. The sequence of fusion events is shown
in comparison with that of Schaefer and Black (2007) in Table 5.5.
Table 5.80 Comparison of mid-fusion sequences between combined-sex chimpanzees using mean epiphyseal fusion value and humans from Schaefer and Black (2007).
order number chimpanzee epiphyses Schaefer and Black (2007) human male epiphyses
1 distal humerus triradiate2 humeral medial epicondyle proximal ulna/ distal humerus3 triradiate proximal ulna/ distal humerus4 coracoid coracoid5 proximal ulna proximal radius6 lesser trochanter femoral head7 proximal radius humeral medial epicondyle8 femoral head distal tibia9 greater trochanter lesser trochanter
10 distal fibula greater trochanter11 distal tibia ischial epiphysis12 proximal humerus distal fibula13 distal femur proximal tibia14 proximal tibia distal femur15 proximal fibula acromium16 distal radius proximal fibula17 ischial epiphysis iliac creast18 distal ulna proximal humerus19 acromium distal radius20 medial clavicle distal ulna21 iliac crest medial clavicle

183
5.2 Comparisons between epiphyseal fusion sequences and dental sequences
This section will consider comparisons of skeletal and dental sequences in chimpanzees and humans.
This is contrasted with the comparison of dental score measured as a continuous variable to epiphyseal
fusion events (section 4.2.1). In Chapter 4 it was found that sample size for Pan paniscus prohibited
sequencing epiphyseal fusion based on mean epiphyseal fusion or contingency tables. Without these
sequences, this species will not be analysed here and analysis will again only apply to Pan troglodytes.
Dental sequences may be evaluated using mineralization stages of individual teeth or tooth emergence.
Molar emergence is often used as a reference as the timing between the emergence of each tooth can be
a number of years. Comparing dental and epiphyseal fusion sequences would ideally use such
landmarks to group epiphysis and then consider which epiphyses came before and after these events.
However, this study is limited by the use of summary Demirjian dental score data. There are no
distinct landmark points provided in summary dental score when using this system for assessing dental
development. Emergence events may be associated with specific dental mineralization stages and it is
possible to use the original Demirjian score for each tooth to re-classify the entire data set. However,
due to the scale of this task, this would not be a practical approach and the process of doing so would
also introduce further estimation error.
In this section the potential of Kuykendall’s (1996) age estimations for dental development will be
investigated for use in observing the occurence of epiphyseal fusion events between the completion of
individual teeth. The completion of dental maturity (apical closure of the third molar) is a critical
landmark to consider in this application as well. Analysis of the number of epiphyses that fuse past
DS64 may reveal that this event is occuring relatively earlier in chimpanzees. Comparisons of dental
score to epiphyseal fusion in Chapter 4 have shown that several epiphyses fuse after this reference
point. This does not occur in humans where only the medial clavicle typically fuses after third molar
apical closure (Schaefer et al. 2009). Apical root closure of teeth was chosen as a reference for
chimpanzees and humans and ages of attainment are shown in Table 5.6. For reference points other
than complete third molar mineralization, the choice of completion of tooth mineralization is arbitrary.
However, it is a feature that is measureable given the data available in this study. Age ranges for
human epiphyseal fusion closure are provided in Table 5.7. This table provides ranges of fusion from
a number of different studies. No single study of human epiphyseal fusion considers all of the
epiphyses observed in the present study for chimpanzees and bonobos.

184
Table 5.81 Human and chimpanzee dental apical closure ages and chimpanzee
toothapical closure in humans (years)1. apical closure in chimpanzees (years)2.
males females males females total sampleM3 20.0 20.75 -3. - -M2 15.4 15.6 10.73 - 10.73M1 19.3 16.2 8.57 7.99 8.14P2 14.4 14.6 10.74 8.35 9.69P1 13.5 14.1 10.73 8.66 9.69C1 11.9 12.4 10.12 no data no dataI2 13.7 14.2 10.73 9.02 9.69I1 11.8 12.9 10.12 8.66 9.55
1. Data from Schaefer et al. (2009) except third molar which is from Moorrees et al. 1963.2. Data from Kuykendall (1996)3. Kuykendall’s data had no third molar sub-adults with apical closure.
Age estimates of epiphyseal fusion timing for chimpanzees in this study were calculated using
Kuykendall’s (1996) regression equation, which did not differentiate by sex. The estimated ages based
on regression do not exactly match the estimated ages for apical closure as estimated for each
individual tooth. Kuykendall’s (1996) estimated age for completion of the third molar (10.73 years) is
older than the regression estimate based on 8 teeth (9.453 years). The ranges of error for these
estimates overlap for both means of measurement and there is no immediate solution for this
ambiguity. Using estimates for apical closures of individual teeth may shift categorization of
epiphyses. To reduce the effect of this problem, only two reference points were used in this analysis.
These were apical closure of the first and third molar. Apical closure of the first molar provides an
early-stage reference point and third molar completion may be more confidently assessed as this
represents dental maturity. The value for the first molar was derived from the median value of
Kuykendall’s (1996) estimate for combined-sex Demirjian stage-8 teeth (8.14 years). Kuykendall’s
(1996) regression equation estimate for age of completion of the third molar was 9.453 years.
Epiphyses were grouped by these two apical closures. Table 5.8 provides a list of groups for epiphyses
that correspond to each range of time between the complete mineralization of tooth apicies. These
refer only to mid-fusion epiphyses that were observed in this study. The epiphyses in these groups are
listed below in Table 5.9.

185
Table 5.82 Epiphyseal fusion ranges in humans for both males and females derived from several different studies.
region epiphysis humans females (years) humans males (years)
feet
calcaneus 10-16 (1) 11-14 (1)talus not measured not measured
distal phalanges 11-13 (1) 14-16 (1)middle phalanges 11-13 (1) 14-16 (1)
metatarsal heads 2-5 fusion 11-13 (1) 14-16 (1)
hands
proximal phalanges 13-15 (1) 16-18 (1)base of metatarsal 1 13-15 (1) 16-18 (1)
distal phalanges 13.5 (1) 16 (1)base of metacarpal 1 14-14.5 (1) 16.5 (1)proximal and middle
phalanges 14-14.5 (1) 16.5 (1)
heads of metacarpals 2-5 14.5-15 (1) 16.5 (1)clavicle medial clavicle 17-33, closed after 21 (4) 17-29, closed after 21(4)
scapula
coracoid 11 to 17 (3) 15-22 (3)sub-coracoid and glenoid 11-17 (3) 15-18 (4)
acromium 17-20 (4) 17-21 (3)medial border - 18-22 (4)
upper limb
proximal humerus 17-23 (3) 19-23 (3)distal humerus 15-18 (3) approx 12 (3)
humeral medial epicondyle 12-14 (5) 16-18 (4)proximal radius 12-17 (3) 15-18 (4)
distal radius 17-22 (C&W) 16-20 (4)proximal ulna 14-18 (5) 15-18 (4)
distal ulna 17-21 (3) 17-20 (4)
lower limb
femoral head 14-16 (2) 16-20 (4)greater trochanter 13-16 (2) 16-20 (4)lesser trochanter 13-16 (2) 16-20 (4)
distal femur 14-19 (2) 16-20 (4)proximal tibia 14-19 (2) 16-20 (4)
distal tibia 14-16 (2) 16-18 (4)proximal fibula 14-17 (2), 17-19 (3) 16-20 (4)
distal fibula 14-16 (2) 17-21 (3) 16-20 (4)
pelvis
triradiate 11-16 (2) 11-18 (2)anterior inferior iliac spine 14-19 (3) 16-18 (4)
iliac crest 14-21 (2) 17-21 (4)ischium 14-19 (2) 16-20 (4)
1. Schaefer et al. 20092. Cardoso 20083. Coqueugniot and Weaver 20074. Schaefer 20085. Sahni and Jit 1995

186
Table 5.83 Chimpanzee fusion events after apical closures estimated from Kuykendall (1996)
tooth mid-fusion mean after age (years)1. female groups male groups
before M1 < 8.14 A Dbetween M1 and M3 8.14 < x < 9.453 B E
After M3 > 9.453 C F
Table 5.84 Epiphysis groups for dental apical age ranges in chimpanzees.
group A
distal humerus talus sub-coracoid and glenoidproximal ulna triradiate humeral medial epicondyle
distal phalanges (hand) anterior inferior iliac spine
group B
proximal radius lesser trochanter middle phalanges (foot)
base of metacarpal 1 proximal tibia metatarsal heads (2-5)proximal and middle
phalanges (hand) distal tibia base of metatarsal 1
metacarpal heads 2-5 proximal fibula proximal phalanges (foot)femoral head distal fibula lateral clavicle
greater trochanter calcaneus coracoid
distal phalanges (foot)
group C
acromium ischia epiphysis distal ulna
medial border medial clavicle distal radius
iliac crest distal femurgroup
D distal phalanges (hand) anterior inferior iliac spine lateral clavicle
group E
proximal humerus greater trochanter middle phalanges (foot)
distal humerus lesser trochanter metatarsal heads (2-5)
humeral medial epicondyle distal femur base of metatarsal 1
proximal radius proximal tibia proximal phalanges (foot)distal radius distal tibia triradiate
proximal ulna proximal fibula ischia epiphysisbase of metacarpal 1 distal fibula coracoidproximal and middle
phalanges (hand) calcaneus sub-coracoid and glenoid
metacarpal heads 2-5 distal phalanges (foot) acromiumfemoral head
group F iliac crest medial clavicle medial border

187
Male and female chimpanzees differed somewhat in terms of which epiphyses were included into
which groups. The majority of epiphyses fell into groups B and E. The smaller number of males in
groups D and F when compared to female groups A and C implies that males undergo fusion more
closely within the range of the developing dentition. However, certainty about exact number of
epiphyses in each group is not assured for at least two reasons. First, male sample sizes were smaller
leading to greater variability in estimated ages, although there is no reason to expect this would
necessarily produce a trend towards moving fusion events closer together. In any case such variation
could easily move epiphyses across boundaries. Second, the error range for Kuykendall’s regression
equation (+/- 0.92 years) meant there was less certainty for epiphyses very near the cut-off points for
groupings. There were 5 epiphyses for males that had a median dental score of 58, which represents
8.217 years. This is very close to the cutoff of 8.14 years and well within the error range of
Kuykendall’s (1996) regression analysis. Several of the female estimated ages which were below this
threshold were also equally close. As a general observation, the majority of epiphyses fused between
apical root closure of the first and last adult tooth. There was a consistent pattern of a small number of
epiphyses fusing before and after these teeth.
Humans epiphyseal fusion grouping are now considered. The definition of human mid-fusion varies
from study to study. The ranges of fusion also vary markedly. It is possible to provide approximately
equivalent data to that considered above for chimpanzees. Table 5.10 provides groupings of epiphyses
for human females. It is notable that the first tooth to complete apical closure in humans is the first
incisor as opposed to the first molar. For humans, there are also a small number of epiphyses that fuse
before the apical root closure of the first tooth. The epiphyses that fuse before the apical closure of the
first tooth are not necessarily the same set when comparing chimpanzees to humans. When
considering the comparison of fusion sequences in the previous section, it would seem likely that these
differences are consequent of small changes in order for heavily overlapping fusion centres. The
earliest epiphyses in this grouping (e.g., the distal humerus and the humeral medial epicondyle) are
always present, suggesting that at least at earlier stages the pattern is always the same. With respect to
third molar maturation, unlike chimpanzees there is only one epiphysis that fuses after the completion
of the third molar root in humans.

188
Table 5.85 Groupings of mid-fusion epiphyses by dental apical closure for human females.
teeth completing apical closure epiphyses
Near completion of I1 and C (up to ~13 years)
calcaneus distal phalangesdistal phalanges coracoid
middle phalanges distal humerusmetatarsal heads 2-5 fusion humeral medial epicondyle
Near completion of P1,I2, P2(~14-15 years)
proximal phalanges femoral headbase of metatarsal 1 greater trochanterbase of metacarpal 1 lesser trochanterproximal and middle
phalanges distal tibia
heads of metacarpals 2-5 triradiate
Near completion of M2 and M1(~16-19 years)
sub-coracoid and glenoid distal ulnaacromium distal femur
medial border proximal tibiaproximal humerus proximal fibulaproximal radius distal fibula
distal radius anterior inferior iliac spineproximal ulna iliac crest
ischiumafter completion of third molar
(~21-22 years)medial clavicle
For humans, the third molar is a potential outlier even if the pattern is scaled to a longer period of
maturity. The human second molar is complete at approximately age 16 according to Chaillet and
Demirjian (2004). Kuykendall’s (1996) regression suggests that the third molar and second molar in
chimpanzees likely mature within at most a year of each other. Anemone et al.’s (1991, 1996) data
also confirm this. As a proportion of time spent during growth (the time prior to full skeletal maturity)
the chimpanzee ratio of M2:M3 completion of approximately 10:11 years is a higher ratio than the
human values for these teeth which are 16:20 years if the middle of the 18-22 range from Scheuer and
Black (2004) is taken. A delay is observed in human dental maturation for the third molar. This delay
is more pronounced relative to skeletal maturation in terms of the epiphyses that fuse after third molar
completion.
The observations found for comparisons of dental and epiphyseal fusion sequences add to the general
conclusions regarding comparisons of skeletal and dental development. It has been established by
comparing dental score to epiphyseal fusion in Chapter 4 that many epiphyses may begin fusion after
the completion of the third molar root. The analysis here suggests that the earlier stages of skeletal and

189
dental maturity do not markedly differ between humans and chimpanzees. Kuykendall’s (1996)
regression suggests that the third molar completes apical closure very close in time after the second
molar. As stated previously, Anemone et al.’s (1991, 1996) data using complete mineralization data
agrees with this observation. In humans third molar mineralization completes much later. This implies
that there is a shift in dental developmental relative to skeletal development towards the end of
maturation.
5.3 Epiphyseal fusion as a proportion of long-bone length
It has been established that dental developmental sequence differs relative to skeletal fusion sequence
between chimpanzees and humans. This means that this system is an inappropriate maturational
reference from which to base comparisons of fusion timing as a function of long-bone growth in length
between the two species. Another way in which growth and epiphyseal fusion can be considered is as
percentage of growth in length. By doing this, neither rate of growth nor other maturational indicators
influence comparisons. This permits the observation of the point of growth in length of a bone at
which an epiphysis is no longer able to contribute to growth. This type of data is easily found for
humans by using data on long-bone length and epiphyseal fusion from multiple studies. Long-bone
length data from Maresh (1970) was used and epiphyseal fusion data derived from Cardoso (2007),
Coqeuegnoit and Weaver (2007) and Shaefer (2008).
In order to use chimpanzee and bonobo data from the present study, final adult length needed to be
determined. Complete fusion lengths provided this type of data and values were available for all long-
bones. Mid-fusion values for bones in which the last epiphysis (terminal epiphysis) began to fuse were
also acceptable for inclusion in calculating these values. This is because when the last epiphysis to
fuse for a bone begins fusion that bone is no longer able to grow in length. Figure 5.3 demonstrates
this principle for growth in humeral length relative to dental score.
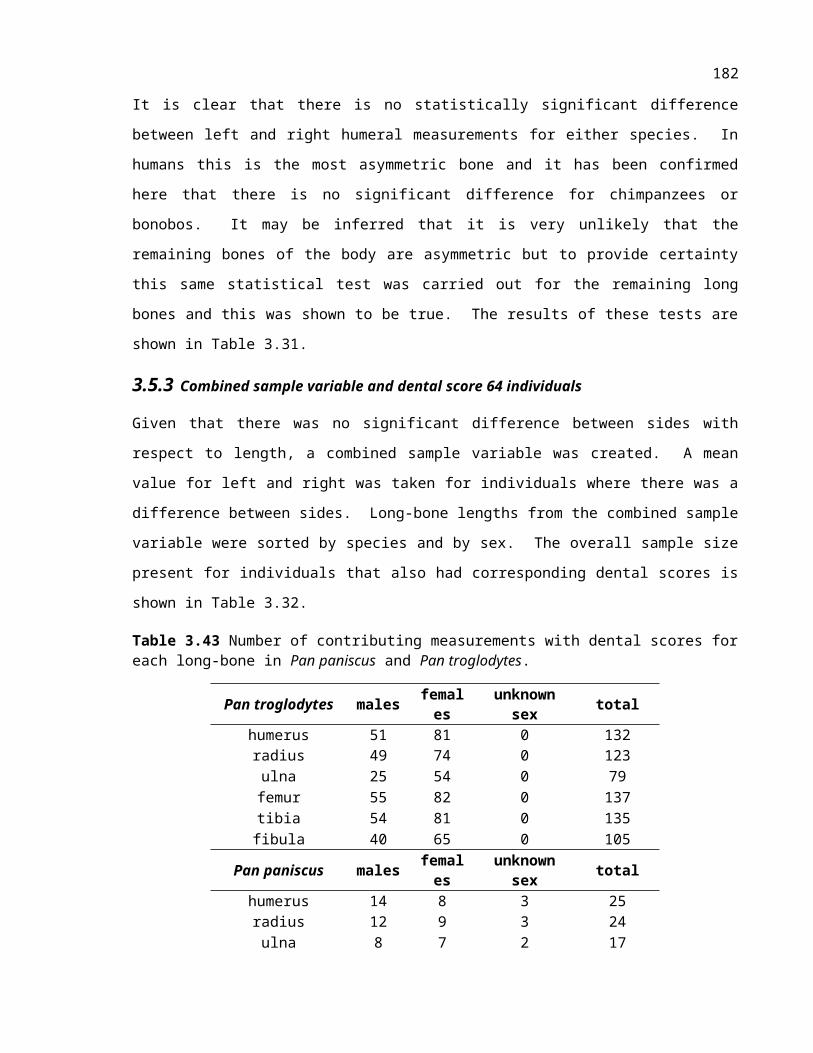
190
Figure 5.42 Demonstration of mean adult humeral length after fusion of the proximal epiphysis.
A mean value for all individuals with terminal epiphyses in either mid-fusion or complete fusion was
taken. All bone lengths for each individual were then converted into a percentage of length.
Individuals with mid-fusion epiphyses were identified then assessed with respect to percentage of
growth in length. Tables 5.11 and 5.12 provide percentiles of epiphyseal mid-fusion events for growth
in length for all 6 long-bones, comparing chimpanzee and humans. The ranges for epiphyseal fusion in
chimpanzees often go over 100%. This is because the mean value for terminal length does not
necessarily mean that fusing individuals were necessarily that close to the average. With cross-
sectional data, there was no means to correct for this. In reality these values for terminal epiphyses
will by definition be exactly 100% for each individual. The variation seen here is not substantial. It is
important to observe the mid-fusion values for epiphyses that precede terminal epiphyses in these
tables. These are the only epiphyses that may change between species relative to growth in length.

191
Table 5.86 Comparison of mid-fusion timing relative to growth in long-bone length for female chimpanzees and humans.
epiphysis2.,3.
human females1. chimpanzee females
(% length)
range of values (%
length)
N (mid-fusion)
mean % mid-
fusion
standard deviation
mid-fusion (%)
mid-fusion range (%)
proximal humerus 100.0 - 21 99.9 7.0 92-110distal humerus 91.0 914. 10 85.6 7.5 76-97humeral medial epicondyle 95.0 91-98 8 88.8 6.2 77-97proximal radius 97.8 91-100 12 95.1 4.3 89-101distal radius 100.0 - 17 102.2 4.7 93-108proximal ulna 95.6 92-99 6 88.7 4.3 89-94distal ulna 100.0 - 22 100.7 5.8 88-109femoral head 100.0 92-100 11 98.8 4.3 93-107greater trochanter 100.0 - 11 99.2 5.5 91-107lesser trochanter 99.8 99-100 5 95.9 3.9 91-101distal femur 100.0 - 21 101.1 5.0 93-110proximal tibia 100.0 - 21 100.9 5.3 92-110distal tibia 98.4 96-100 14 99.3 4.4 92-108proximal fibula 100.0 - 16 101.6 5.3 92-112distal fibula 100.0 - 10 99.3 4.2 92-107
1. Data for human length is from Maresh (1970)2. Data for human female epiphyseal fusion is from Coqeuegnoit and Weaver (2007)3. Data for female femur from Cardoso (2008)4. For human distal humerus fusion one single age was given.
The normality of epiphyseal fusion distributions as a percentage of growth in length was considered
using Shapiro-Wilk normality tests. These data are available in appendix section 8.8 . No epiphyses
significantly deviated from normality. It should also be observed that Schaefer’s (2008) data used for
males provided numbers of individuals for each year of age. Mean values were achieved by
mutiplying each age category by the percentage of individuals in each stage. The human female data
from Coqeuegnoit and Weaver (2007) only provided ranges and the mean values were a midpoint of
these ranges.

192
Table 5.87 Comparison of mid-fusion timing relative to growth in long-bone length for male chimpanzees and humans.
epiphysis1.,2.
human males chimpanzee males
males(% length)
range of values (%
length)
N (mid-
fusion)
mean % mid-fusion
standard deviation
mid-fusion (%)
mid-fusion range (%)
proximal humerus 99.8 97-100 6 103.7 4.6 97-111distal humerus 95.9 94-100 5 84.4 12.7 70-98humeral medial epicondyle 98.5 97-100 8 93.56 5.8 83-98proximal radius 97.1 94-100 8 97.7 7.6 88-103distal radius 99.6 98-100 4 97.6 9.7 88-107proximal ulna 95.7 94-100 6 94.6 4.1 89-97distal ulna 99.9 99-100 6 98.1 7.7 89-108femoral head 99 98-100 5 98.1 6.1 89-103greater trochanter 99.2 98-100 3 102.1 2 100-103lesser trochanter 99.2 98-100 4 96.1 6.5 89-103distal femur 99.8 98-100 7 99.4 3.6 99-103proximal tibia 100 100 7 98.8 7.3 88-108distal tibia 100 100 7 98.8 7.3 88-108proximal fibula 99.6 99-100 6 99.7 6.6 92-108distal fibula 99.3 98-100 8 98.7 7.1 92-108
1. Data for human length is from Maresh (1970)2. Data for human males from Schaefer (2008)
Ranges of fusion as a proportion of length in both chimpanzees and humans largely overlap. The range
of variation in fusion as a percentage of length for chimpanzees was greater than it was for humans.
This was likely due to the nature of smaller-sample cross-sectional data. Despite this, the patterns were
essentially the same. The only exceptions may have been the distal humerus and humeral medial
epicondyle, although these ranges still largely overlapped. It would be desireable to see if the values
for these ranges could be put to a test for significance. However, there was no equivalent data for
humans as exists for chimpanzees. Coqeuegnoit and Weaver (2007) only provided ranges of fusion
times as opposed to raw data. Schaefer (2008) provided numbers for each age category, which were
sufficient for establishment of central tendency but these data provided very skewed distributions.
Other studies of humans provide the same type of data as the aforementioned studies. Future study
including comparable human data may resolve these limitations in the future. At present it is assumed
that the pattern of fusion relative to growth in length is effectively the same between the two species.

193
Bonobos
The number of available bone lengths from Pan paniscus were too few to be able to calculate terminal
adult length with any confidence. Epiphyseal fusion values were likewise too few to provide reliable
data. Given these limitations it would not be appropriate to attempt the same procedure here for this
species.
5.4 Summary of comparisons of growth standards between Pan and Homo
The modular sequence of epiphyseal fusion events determined for chimpanzees was compared to the
human sequence determined by Schaefer and Black (2007). Sequence determined by mean epiphyseal
fusion value was also compared to this study. Post-hoc Bonferroni tests were used to compare
chimpanzee mean epiphyseal fusion value sequence to humans. It was found that sequences derived
from this method varied for each epiphysis but no statistically significant differences in sequence order
were discernable.
Furthering sequence comparisons a comparison of dental maturity to epiphyseal fusion was attempted
using estimated chronological age for complete mineralization of the third molar and first adult tooth
as a reference. It was shown that chimpanzees and humans both intiate fusion of a small number of
epiphyses prior to the complete mineralization of the first adult tooth. Chimpanzees continue skeletal
maturation for a greater number of epiphyses beyond dental maturity than do humans. Stated another
way, human third molar maturity extends further into skeletal development than it does for
chimpanzees.
Fusion events have never been considered in the context of long-bone growth as no studies previously
have both types of data simultaneously. With dental score a problematic frame of reference for
comparison between species, fusion events as a proportion of growth in length were analysed. This
was done only for Pan troglodytes due to sample limitations for Pan paniscus. It was found that there
were no differences between chimpanzees and humans.

194
Chapter 6 Discussion
6.1 Introduction to discussion
This chapter will consider the implications that the data produced in this study will have for
developmental theory and the study of fossil hominids. The chapter will be broken into two main
sections. The applications within constructs of developmental theory will first be discussed (section
6.2). The applications of intergrated data for understanding growth rate, sequence, and allometry will
be evaluated. This section will be followed by an analysis of the practical applications for the study of
fossil hominids (section 6.3).
6.2 Application of the results of this study to developmental theory
As presented in Chapter 2, there remains theoretical debate regarding the differences in developmental
patterns between humans and other apes. This was framed within the context of the study of
heterochrony. Debate has focused on the fundamental questions of whether humans demonstrate
neoteny, hypermorphosis, or a mixture of both patterns when compared to other apes. There remains a
lack consensus and a primary reason for differing perspectives relates to incomplete data required for
an integrated analysis of skeletal sub-systems. Often one feature or aspect of development was
analysed and used as evidence to support one theory while different evidence was used to support
another. For example, Penin et al. (2002) and Bastir and Rosas (2004) analysed facial morphology and
concluded that humans demonstrate neoteny. McKinney and McNamara (1991), Parker (1996), and
Vrba (1996) measured overall somatic growth and came to the conclusion that humans were
hypermorphic. Opposing arguments looking at the same region were essentially absent, either because
only a single group of researchers considered that region or the data only supported that theory for lack
of better evidence. For example, Vrba (1996) suggested that the longer period of human growth
allowed for distortions in body shape between ancestor and descendant to occur. Given the
information Vrba (1996) had at that time, this conclusion could be reached simply because it could not
be refuted by skeletal evidence that did not yet exist.
This section will attempt to bridge some of these contradictions by use of the integrated data from the
present study by means of the addition of new data that had not existed during the formation of past
models. This will be approached in the same manner in which these data have been analyses where
growth rate and sequences of developmental events will be considered separately.

195
6.2.1 Growth rate 6.2.1a Growth rate with respect to time
This study did not use individuals with known age and as such growth rate with respect to years was
not measureable. As previously stated, estimated chronological ages from dental development would
be possible using Kuykendall’s (1996) regression equation for dental age. However, with this
information already well-established in the literature such data would add no new insights into such
considerations and as estimates, such ‘ages’ would not represent real data points. The lack of
chronological age data required that the assessment focus on aspects of relative growth between
different skeletal sub-systems.
6.2.1b Growth rate with respect to dental development in Pan troglodytes
The data produced in this study included both Demirjian dental score and long-bone length. This
provided a unique opportunity for comparison of two types of data that have never been collected
before in a single dataset. Summary Demirjian dental score behaved effectively as a continuous
variable and as such provided an equivalent measure to a ‘maturational clock.’ Linear regression of
long-bone length as a function of dental maturity score for Pan troglodytes found the relationship to be
significantly linear for all long-bones. The question remains as to how this relationship compares to
that observed for growth rate relative to chronological time. It has been observed that chimpanzee
growth relative to time does not demonstrate the delayed period of growth associated in humans with
childhood (Bogin 1997). However, this does not necessarily imply that chimpanzee growth relative to
time is necessarily linear. Chimpanzee growth appears slightly geometric until near the end of growth
when there is a slowing down just prior to adulthood (Kimura and Hamada 1996, Leigh and Shea
1996, Shea 1981). A representation of this growth curve is presented in Figure 6.1.
Figure 6.43 Representation of a chimpanzee growth curve relative to time based on analysis in prior studies by Kimura and Hamada (1996), Leigh and Shea (1996).

196
There are two question raised in relation to this topic. First, the relationship between dental score and
chronological time should be considered as this may go some way to explaining the linear relationships
found when comparing long-bone length to dental score. Second, a consideration of what portion of
the entire growth period was actually being measured by dental score must also be assessed as it has
been found that growth relative to time in chimpanzees is non-linear for the entirety of the
development. In this study it was found that growth continues after complete dental maturity (DS64)
and this may include the tapering-off of growth observed in both chimpanzees and humans. In order to
address this first question, the relationship between Kuykendall’s (1996) regression equation for 8 teeth
and chronological time is considered. This relationship is demonstrated in Figure 6.2. The regression
curve for Demirjian scores relative and chronological years has a slightly geometric slope.
Figure 6.44 Reproduction of Kuykendall’s (1996) regression for dental score relative to chronological age.
Comparison of Figures 6.1 and 6.2 demonstrates that the shape of the curve for dental score relative to
chronological time behaves with a slightly inverted curve compared to to that found for growth relative
to chronological time. Leight and Shea (1996) provided parametric growth curves for chimpanzees but
they did not provided a numeric regression equation for chimpanzee growth. No other studies have
provided this information and it is likely that with the increasing segment early in growth and
decreasing segment near the end of growth that a regression function for this curve would be a
relatively complex polynomial. This makes direct comparison, certainly of the entire growth curve,
0 1 2 3 4 5 6 7 8 9 1005
101520253035404550556065
Comparison of Kuykendall's (1996) regression for 8 teeth to calendar years
age in years
sum
mar
y de
ntal
scor
e

197
unquantifiable. However, when considering the increasing segment early in growth, it may be
suggested that the opposing effects of growth vs. time as opposed to dental score vs. time may
counteract each other. This partially explains the much more linear relationship for comparisons of
growth in long-bone length to dental score.
The second question that must be addressed is the effect of not having a dental reference for length
data beyond DS64. It is possible that full dental maturity meant that observation ceased prior to the
slow down in growth near complete maturation. The potential effect of this is demonstrated in Figure
6.3.
Figure 6.45 Demonstration of the limitation of DS64 individuals for observing chimpanzee growth curves.
A number of long-bone epiphyses were observed to fuse beyond dental score and with this as evidence,
it is likely that growth continued beyond the period observed by dental score in this study. There have
been no studies of growth in long-bone length relative to chronological time that have also presented
dental maturity data. Without age at death being known for the sample in the present study there are
no means to determine how much of an effect the limitation of dental score has on the analysis of the
data. However, it should be kept in mind that this later-stage slowing of growth only accounts for a
small portion of the growth curve. Additionally, even if dental maturation did extend to or beyond the
end of skeletal development there would be no means to assess if it would or would not slow in tandem
with skeletal development, thereby maintaining a linear skeletal-dental relationship. Such an

198
observation remains speculative and the present pattern of maturation must be accepted as it is. The
result that dental score relative to growth in length of long-bones shows a high degree of linearity for
the period of maturation observed is still very important. It implies that as a maturational ‘clock’ that
dental mineralization provides a well-regulated reference. It may be questioned how well humans
adhere to the principle that long-bone length is linearly related to dental score. It was noted in Chapter
3 that human and chimpanzee dental score regression curves relative to time demonstrated differences
consistent with differences in growth pattern between the two species. This may imply that the same
relationship between dental mineralization and skeletal development would be observed in humans.
However, it has also been shown that there is an offset between skeletal and dental sequences in
humans for the third molar, meaning that the period of total growth for human dental developmental is
not directly analagous to chimpanzees. This makes direct comparison not technically valid as the same
period of skeletal growth would not be observed.
6.2.1c Growth rate with respect to dental development in Pan paniscus
As noted in Chapter 4, growth rate relative to dental development was not evaluated for Pan paniscus
due to sample size limitations. However, with assumed consistency for dental development, as
indicated by Boughner et al. (2012) and long-bone growth as indicated by Shea (1981), expectations
should not have been different from the pattern observed in chimpanzees. To the extent possible given
the limitations of the available data, the data for Pan paniscus appeared to confirm this trend. Thus,
for comparisons of dental score to growth in length, this study has not expanded or brought forth any
particularly new information relevant to developmental theory for this species. It has confirmed the
results of past studies, notably Shea (1981) and found expected trends.
6.2.1d Allometry and growth
In Chapter 4, comparisons of log10-transformed intermembral indexes were made to results from Shea
(1981). Some of the individuals were the same as those used by Shea including all of the Pan paniscus
and Pan troglodytes troglodytes individuals, although his study did not include Pan troglodytes
schweinfurthii. The analysis performed in the present study reproduced the log10-transform regression
performed by Shea and determined that exactly the same trend was observed with the inclusion of a
new sub-species (Pan troglodytes schweinfurthii). Limb length appears to remain isometrically scaled
for all limbs during growth for both Pan troglodytes and Pan paniscus. Given that Pan paniscus has
an older separation time from all sub-species of Pan troglodytes and Shea’s (1981) evidence suggested
that Pan paniscus and Pan troglodytes shared the same pattern, it is not surprising that the sub-species

199
of Pan troglodytes do not differ. All of Shea’s (1981) observations of limb segment growth have also
held true for both species including the addition of Pan troglodytes schweinfurthii.

200
6.2.2 Patterns of growth: analysis of sequences
The analysis of developmental sequence in this study focuses on epiphyseal fusion and the relationship
between fusion events and dental development. This section will focus on Pan troglodytes as this is
the Pan species from which the greater breadth of analysis was performed. Epiphyseal fusion
sequence seriations will first be considered and the relevance of general trends discussed.
Comparisons to humans as well as to general primate patterns will be made. For the second part of this
analysis the relationship between skeletal and dental development in humans and chimpanzees will be
compared and the implications of differences found discussed.
6.2.2a Seriation of epiphyseal fusion events
Analysis of chimpanzees
It Chapter 4 an attempt was made to distinguish sequence order in chimpanzees using both mean
epiphyseal fusion score and contingency tables. The results of these procedures produced general
patterns but there remained a high degree of overlap between epiphyses that fused closely in sequence.
This pattern held true for both methods. Comparisons between males and females followed generally
similar trends and comparison between the sexes did not determine any statistically significant
differences overall.
With the present study being the first to attempt to seriate epiphyseal fusion events by any method,
comparisons with past studies are not possible. It might be suggested that some general level of pattern
comparison could be made with studies of epiphyseal fusion events done using known-age samples
such as Bolter and Zihlman (2012), Kerley (1966) and Zihlman et al. (2007). Based on the estimated
ages for fusion events produced in Chapter 4, it could be asserted that the results of this study agree
with patterns found in these previous studies. However, with respect to confirming sequence of
epiphyseal fusion, very little more can be said and this is because the ranges of estimated fusion timing
from the known-age samples overlap with even less precision than do fusion events found in the
present study. These studies also do not have as comprehensive of a list of epiphyses as those
measured in the present study.
With this being said, a general consideration of pattern of epiphyseal fusion events may be considered
with respect to fusion event groupings. Zihlman et al. (2007) noted that the pattern of fusion they
observed in their Taï forest chimpanzees sample conforms to a previously observed pattern by Todd
(1930), Schultz (1940, 1944), and Kerley (1966). The general sequence, from earliest to latest, was
elbow, hip, ankle, knee, wrist, and shoulder. It was also noted that the upper limb has a common
pattern of fusion for all primates: first, elbow then wrist followed by shoulder (Shigehara 1980). It was
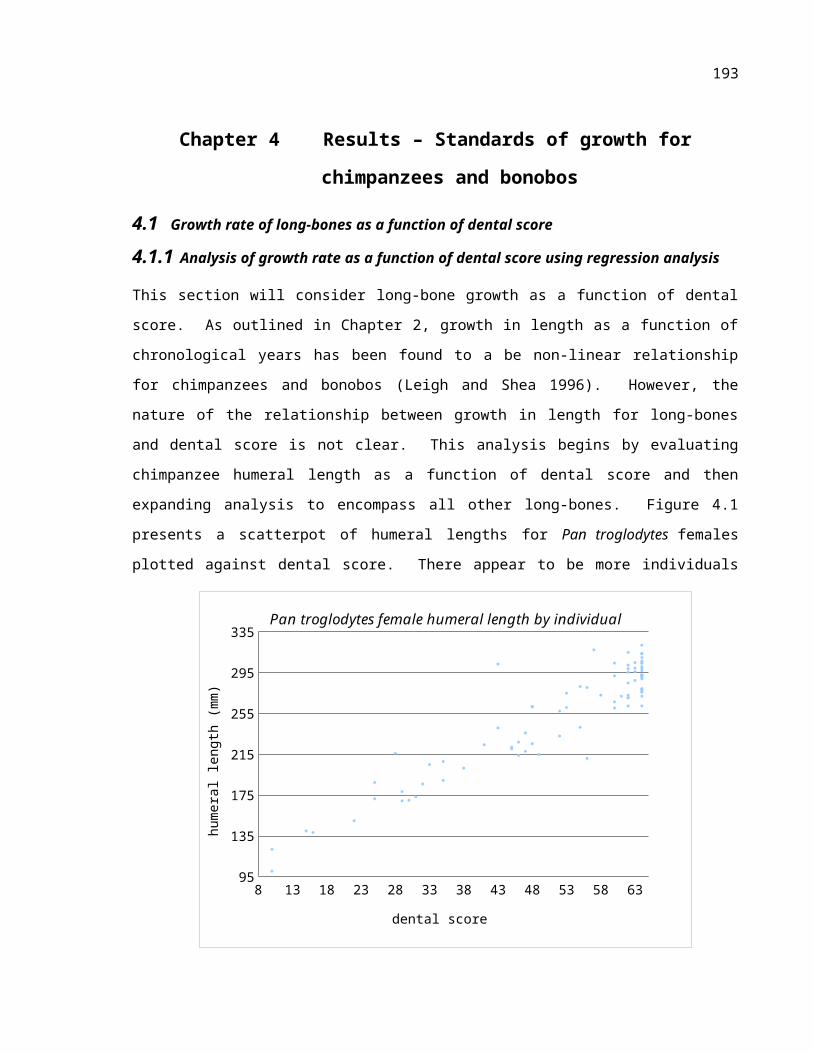
201
expected that the chimpanzees in the current study would demonstrate the same pattern. Not only were
these regions evaluated in the present study but other fusion centres in the hands, feet, and the pelvis
were considered. From either the sequence of mid-fusion mean epiphyseal fusion values or modular
sequences observed in Chapter 5, it is possible to group these epiphyseal fusion events as shown in
Figures 6.4 and 6.5 for males and females. The region between talar epiphyseal fusion and calcaneal
epiphyseal fusion is distinguished in these figures due to inconsistencies in values that will be
discussed. Modular sequence may also be used and are shown in Figures 6.6 and 6.7. Table 6.1
provides a classification of epiphysis groupings.
Table 6.88 Epiphysis classification for regional comparison of epiphyses.
shoulder: elbow:proximal humerus distal humerus
coracoid humeral medial epicondylesub-coracoid and glenoid proximal radiusmedial border of scapula proximal ulna
pelvis: hip:iliac crest geater/lesser trochanter
ischial epiphysis femoral headacetabulum
hand: ankle:base of metacarpal 1 distal talus
heads of metacarpals 2-5 distal fibuladistal phalanges calcaneus
proximal and middle phalanges talusfoot: knee:
base of metatarsal 1 proximal tibiaheads of metatarsals 2-5 proximal fibula
distal phalanges distal femurproximal phalanges wrist:middle phalanges distal radius
distal ulna

202
1. Mean epiphyseal fusion value*The earliest mean mid-fusion event for a region forms the earliest mid-fusion point on each bar. The latest mid-fusion point indicates the end of each bar. Mean epiphyseal fusion values run down the left-hand column.*It should be noted that the acetabulum is included in hip epiphyseal fusion as opposed to the pelvis.*Colour blocks indicate at which mean epiphyseal fusion values epiphyses in these groups appear to be fusing.
A: range between talar epiphyseal fusion and calcaneal fusion valueB: the entire range of of ankle fusion including the talusC: the range of ankle fusion excluding the talus

203
Figure 6.46 Grouping of epiphyseal fusion events by region for Pan troglodytes females ordered by mean epiphyseal fusion values.
1. Mean epiphyseal fusion value
A: range between talar epiphyseal fusion and calcaneal fusion valueB: the entire range of of ankle fusion including the talusC: the range of ankle fusion excluding the talus
Figure 6.47 Grouping of epiphyseal fusion events by region for Pan troglodytes males ordered by mean epiphyseal fusion values.

204
Figure 6.48 Grouping of epiphyseal fusion events by region for Pan troglodytes females using modular sequence.
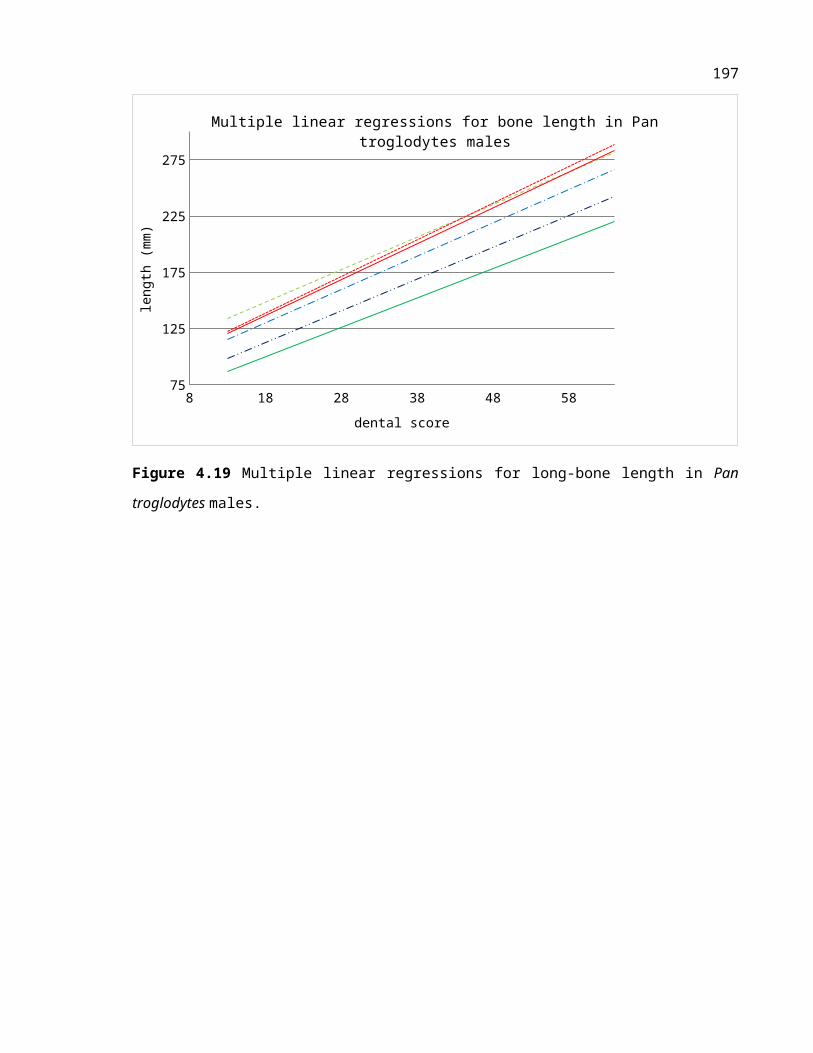
205
Figure 6.49 Grouping of epiphyseal fusion events by region for Pan troglodytes males using modular sequence.

206
The ranges of fusion events based on mean epiphyseal fusion value (defined in section 4.2.2) followed
the progression of elbow, hip, ankle, knee, and wrist for Pan troglodytes females, but not males. If the
talus is excluded, males agree with the pattern only for the first fusion centres observed for the ankle.
Previous studies (Bolter and Zihlman 2012, Kerley 1966, Zihlman et al. 2007) did not evaluate the
talar epiphysis and based on present study there may be a difference between males and females.
However, observations of mid-fusion events in this study were rare (there were only three observations
for females and one for males) and this difference cannot therefore be shown to be statistically
applicable for any testing. In addition, the difference between the last epiphysis of the elbow and the
last epiphysis of the hip to fuse in males is not large (2.81 vs. 2.85 in mean epiphyseal fusion score). It
could be suggested that the general patterns for both male and female Pan troglodytes agree with the
general trend for primates discussed by Zihlman et al. (2007) with some minor exceptions. Shoulder
epiphyses appear to fuse over a wide range of time but when considered by individual epiphyses, most
fuse quite late in development and it is only the much earlier fusion of the coracoid that drives the
initiation of the shoulder range quite early. Results from Zihlman et al. (2007) also placed the coracoid
quite early in the fusion sequence and in doing so made their statement slightly confused without
clarifying if the agreement was with the last elements to fuse or the overall range If the coracoid was
removed, both their statement and results would agree with the present study. Kerley (1966) only
recorded the coracoid as partially fused by age 9 due to limited data. Schutz’s (1940, 1944) and
Todd’s (1930) data were equally limited. As such, these are likely general patterns of observation. In
this context this study agrees with these patterns and is able to provide data for more epiphyses.
Modular fusion sequences confirm the patterning found using mean epiphyseal fusion value in this
context. The only possibly exception was the elbow in males. This was caused by a deviated humeral
medial epicondyle. It is entirely likely that this was the result of smaller sample size and does not
represent a deviation in actual pattern. Both the patterns observed using mean epiphyseal fusion value
and dental score would confirm this.
Comparing chimpanzees and humans
The general conclusion that may be brought forward from Chapter 5 where chimpanzee and human
fusion sequences (as determined by Schaefer and Black 2007) were compared was that these species
follow effectively the same pattern of maturation. This comes with the caveat that the level of overlap
between closely fusing epiphyses may have obscured small differences. The approach taken in this
comparison was that if the ranges could be distinguished statistically then it could be asserted without
question that the sequences were different. The approach taken in this study was only able to
determine broad trends of difference and was not able to distinguish closely-fusing epiphyses.
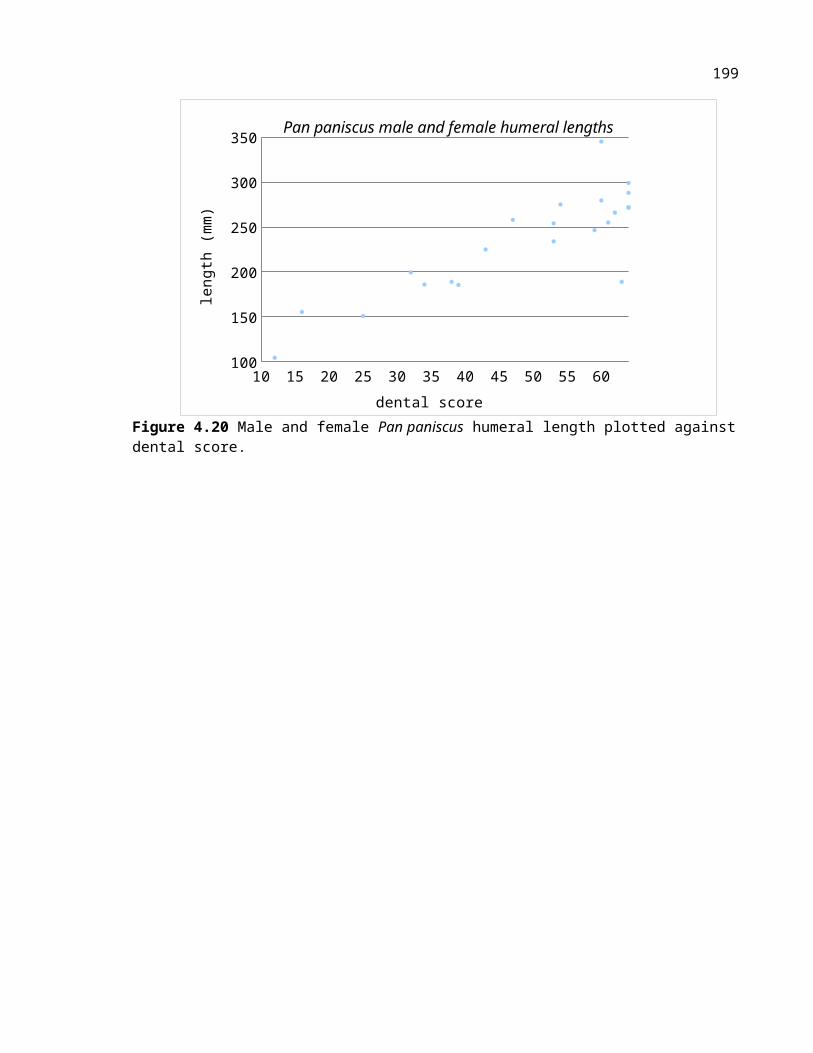
207
Epiphyses listed in Schaefer and Black’s (2007) modular sequence may be grouped using the same
system (elbow, hip, ankle, knee, wrist, shoulder) referred to by Zihlman et al. (2007). This is
demonstrated in Figure 6.8. It should be noted that Schaefer and Black (2007) did not include hand
and foot fusion centres. Notably, the calcaneus and the talus were not included in their sequence. It is
observed that the pattern of grouped epiphyses is essentially analgous to the pattern found for
chimpanzees. Pelvis epiphyses appear to fuse somewhat earlier in chimpanzees than humans. This
differences is caused mainly by a shift in position of the iliac crest. As was demonstrated in Chapter 5,
this epiphysis showed a range of variation that heavily overlapped other late-fusing epiphyses. As
such, it is not possible to prove that there exists an actual difference for this region. As a general
statement, the regional pattern of fusion events is largely consistent between chimpanzees and humans.
Figure 6.50 Regional pattern for humans derived from the modular pattern found in Schaefer and Black (2007).

208
6.2.2b Sequence of dental development relative to skeletal development
In Chapter 5 the relationship between epiphyseal fusion sequences and dental mineralization sequence
was explored. There were two main conclusions from this analysis that are relevant for disussion.
First, despite differences in mineralization sequence between humans and chimpanzees, the timing of
first apical closure of any tooth happens after the mean epiphyseal fusion values of 8 mid-fusion
events. Due to variation in sequence order as discussed in section 6.2.2a, these were not necessarily
the same fusion events, although the very earliest ones such as the distal humerus and humeral medial
epicondyle were always present. The second conclusion was that human third molar mineralization is
delayed relative to late-fusing epiphyseal fusion events in humans. In chimpanzees complete third
molar mineralization occurs close in time with the second molar and as a consequence many more
epiphyseal fusion events happen after complete dental maturity. Prior studies have not addressed this
type of comparison. This is likely consequent of the larger ranges of estimate times for fusion in
chimpanzee skeletal maturity found in Bolter and Zihlman (2012), Kerley (1966) and Zihlman et al.
(2007).
The next step in this analysis is to consider what the delay in third molar maturation in humans
represents for developmental theory. It has been found that epiphyseal fusion patterning is effectively
indistinguishable between humans and chimpanzees. Despite the rate at which these events mature
relative to chronological time differing, the pattern in which they mature is consistent. On the other
hand, dental development does not scale proportionately for the entire period of growth when
comparing chimpanzees to humans with the third molar being the key contributor to this difference. A
consideration of other primates is useful in this context. Smith et al. (1994) provided a list of first and
last tooth emergence data for many different primate species. Tooth emergence is not a direct
analogue for mineralization, but the two patterns are closely linked. Primates vary in the duration of
growth in terms of chronological years, but the timing from first to last emergence stays
proportionately constant. Humans dental development has long been known to be an exception to this
rule. Shultz (1960) compared lemurs, macaques, gibbons, and chimpanzees to humans, finding
humans to have and extended period of third molar maturation compared to all of these other species.
It may be concluded that human dental development is more deviant from a typical primate pattern
than is skeletal development with the third molar shift appearing exclusively in humans. This
differences does not fit neatly within the concepts of the neoteny-hypermorphosis debate. The relative
delay of third molar maturity in humans is a temporary retention of a sub-adult feature but with full
maturity eventually occuring, it may be better described as a more arbitrary difference in pattern.

209

210
6.2.2c Separating growth rates and patterns
At this point in discussion is it necessary to summarize what has presently been determined regarding
growth rate and pattern. The following observations have been made for the chimpanzees in this
study:
1. Growth rates are constant for all long bones relative to dental score for the period of growth
observed in this study.
2. Growth rates relative to chronological time for humans and chimpanzees are not the same and
as such sequences of events cannot be scaled by this measure.
3. Dental mineralization patterns are not the same between chimpanzees and humans and thus are
not a valid means to directly compare other developmental parameters. In addition, the fact
that dental maturity is reached before skeletal maturity is also limiting.
4. As a result of points 1.2. and 3. above, neither dental mineralization nor chronological time
provide a compatible reference for integrating both growth and fusion events between
chimpanzees and humans.
5. The sequence of epiphyseal fusion is not discernably different between humans and
chimpanzees.
6. Fusion events occur at the same proportion of total growth in length of bone for both
chimpanzees and humans.
In Chapter 5 epiphyseal fusion as a proportion of growth in length for long-bones was considered. It
was found that there were no differences between humans and chimpanzees with respect to the timing
of epiphyseal fusion events as a proportion of growth in length for each bone. This was a novel
approach because it did not depend on time or dental score. The analysis suggests that when growth
rates are removed from comparison by looking at the systems as percentages of growth that
chimpanzees and humans demonstrate exactly the same general pattern. Fusion event scheduling as a
proportion of final adult size is consistent between species. The implication of this is that skeletal
development in humans and chimpanzees varies only in terms of the rate of growth relative to time.
Chimpanzees and humans clearly differ in terms of allometry, but the proportionate amounts of time

211
during which each bone grows is the same. The femur in humans, for example, is proportionately
longer when compared to other bones than it is for chimpanzees. This bone does not achieve its
greater length in humans by growing for a longer period of developmental time. That proportion of
time remains constant. The bone simply gets longer at a faster rate by adding more material per unit of
maturational time. This concept, coupled with the knowledge that sequence patterns are not
distinguishable between Pan and Homo and that intermembral growth rates are consistent (Shea 1981)
implies again that the morphological differences between these species cannot be defined by the simple
concepts of neoteny-hypermorphosis debate.
A more abstract way of looking at this is to consider human and chimpanzee skeletal development as a
standard ‘ape’ pattern for development. There is a maturational time clock that has maturational time
units. Developmental events such as epiphyseal fusion are fixed relative to maturational time units.
Maturational time units may or may not linearly relate to chronological time. Humans and chimpanzee
had different ratios of long-bone lengths and these ratios are present from birth and simply scaled up to
adult form. The only way that it is possible to achieve a difference in a length between two species is
for more length to be added per unit time of the maturational clock. The rate of addition of length is
contant. If a chimpanzee adds 5 units of length to the length of a femur a human may add 7, but the
maturational time unit for the addition of those length units is the same. Initiation and fusion of
epiphyseal events must remain on schedule in terms of maturational time units.
Bonobos
Without sufficient data from bonobos to complete the analysis of proportionate growth in length,
conclusions with respect to bonobos are less certain. None of the data presented with respect to
bonobos up to this point suggests that they differ markedly from chimpanzees but beyond this general
assertion no firm conclusions can be made.

212
6.2.3 Skeletal development relative to sexual maturityIn the analysis of developmental theory one remaining point must be considered. Two of the terms of
heterochrony outlined in Chapter 2 pertained to sexual maturity. Specifically, progensis was the
achievement of sexual maturity prior to attaining adult form and hypermorphsis was the achievement
of adult form prior to sexual maturity (Rice 1997). Sexual maturity is defined as the age at which an
individuals become able to reproduce (Harvey and Clutton-Brock 1985). This study did not directly
measure sexual maturity in chimpanzees and bonobos. However, the age at which sexual maturity is
attained is known relative to chronological age. With new information for the estimated timing of
skeletal maturation relative to chronological years available in this study, the terms of progensis and
hypermorphosis should be re-considered.
Female age at first birth is a limiting factor for reproduction and it is females which this section will
focus on. When an individuals is able to reproduce and when they actually begin to bear offspring are
not necessarily concurrent events. In humans the difference between the time of first birth and the age
of sexual maturity varies between different societies and there are often non-biological cultural reasons
for these shifts. Menarche in humans is well-document and it begins to occur somewhere between 12-
14 years of age (Surbey 1990). It has been suggested that stress conditions may actually drive
menarche earlier rather than later in humans (Chisholm 2005). However, the point at which human
begin reproduction is much later in humans. Humans only reach completion of secondary sexual
characteristics by the age of 17 (Cameron 2006). In hunter-gatherer societies it has been found that
humans do not typically begin reproduction before 18-20 (Hill and Kaplan 1999). These societies
appear to represent some of the earliest reproduction ages, with many human societies further delaying
the event as a consequence of social and cultural pressures.
It has been reported that wild chimpanzees undergo menarche by 10 to 11 years (Boesche and Boesch-
Achermann 2000, Nishida et al. 2003) while captives have been recorded as undergoing menarche as
early as 8.5 years (Sugiyama 2004). These differences again invoke the debate as to whether wild
animals are stressed relative to their captive counterparts. It is not clear if this is true with respect to
attainment of sexual maturity. The captive data is much better controlled for observation of individuals
and sample size. Menarche by 10 years of age will be used in this discussion as it is a value
approximated by the majority of studies. Chimpanzees typically experience their first birth by 13-15
years (Hill and Kaplan 1999).
Given the estimates ages in this study, by the age of 10 in chimpanzees and by the ages of 12-14 in
humans, the number of fusion events that have occurred and the state of dental maturity is effectively
the same. This suggests that menarche is occuring at essentially the same point of a maturational

213
sequence irrespective of time. When it comes to first birth, which in chimpanzees is between 13-15
and humans between 18-20, it appear that humans and chimpanzees both begin reproduction very near
the end of skeletal maturation. The interval between these two events is particularly larger in humans,
and is consistent with the observed extended period of growth known as adolecence (Bogin 1997).
What is inferred from these data is that humans are following the same maturational pattern but are
simply modifying the time at which these events occur. This means that humans are neither progenetic
or hypermorphic as the timing of sexual maturation remains analagous between the two species in
terms of skeletal maturation.
6.2.4 General conclusions with respect to growth theory
Chimpanzees and humans appear to share the same sequence of fusion events. They do not share the
same dental mineralization sequences. Comparing dental sequences with skeletal sequences suggests
two things. Humans experience their first fully mature adult tooth at the same maturational time as
chimpanzees relative to epiphyseal fusion events. However, the human third molar matures much later
relative to epiphyseal fusion sequences. With respect to growth, humans and chimpanzees both appear
to scale allometrically and experience fusion events at the same proportions of growth in length.
Growth rates for chimpanzees relative to dental mineralization are effectively linear. This may not
necessarily be true for humans given the complexity introduced by the extended period of dental
mineralization. No human studies have directly compared long-bone length to dental score. A
comparison between chimpanzees and humans would not use the same frame of reference due to the
difference in duration of dental development relative to the entire period of growth.
For bonobos, far less may be directly concluded due to the limitation of sample size preventing many
of the analyses that were used to develop these conclusions for chimpanzees. What has been
demonstrated for Pan paniscus is that epiphyseal fusion sequences are generally analagous relative to
dental development between Pan paniscus and Pan troglodytes. Growth rates are also in agreement
between the two species. It is likely that bonobos share as very similar pattern of skeletal growth and
development with chimpanzees.
Figures 6.9 and 6.10 provide a visualisation of developmental pattern differences between chimpanzees
and humans using chimpanzees as a reference. Figure 6.9 illustrates how development in both of these
species appear relative to the ‘maturational clock’ with chimpanzees setting the hypothetical units of
this clock. Figure 6.10 shows how these species looks using chimpanzee maturational time units
compared to chronological time. It is worth noting that the visible differences between the two species
become more marked when looked at in terms of chronological years.

214
Figure 6.51 Visualization of chimpanzees and humans using hypothetical chimpanzee maturational time units.
Figure 6.52 Visualization of chimpanzees and humans development as compared to chronological years using chimpanzee maturational time units.
One final note regarding sequences should be considered within the context of figure 6.9. It should be
recalled that King’s (2004) used discriminant function analysis to group different primates based on
skeletal fusion and dental development. He noted that there was a distinct ape grouping for pattern of
maturation but that chimpanzees appeared distinct from gorillas. It remains to be seen how the
inclusion of human sequences into the same discriminant function analysis might also demonstrate
grouping with offsets of sequences now known to exist.
6.3 Application to fossil hominids
The study of sub-adult fossil hominids has been limited to few individuals. Those that have been
found have ranged over large periods of geologic time and are often classified as different species.

215
Examples include specimens such as Australopithecus sediba (Berger et al. 2010), the Dikika
Australopithecus afarensis (Alemseged et al. 2006), the Nariokotome Homo ergaster (Clegg and
Aiello 1999, Dean and Smith 2009, Smith 2004 among others), and more recent sub-adults
neanderthals (Dean et al. 1986). Many of these specimens have been moderately to substantially
incomplete with only a small number of epiphyses and/or teeth present. The Nariokotome Homo
ergaster is an exception to this and has been intensively studied (Smith 2004, Walker and Leakey
1993). Even though the specimen is not fully complete it provides the most comprehensive sample of
epiphyseal fusion sites from one individual compared with any other fossil specimen. A brief analysis
of this individual is warranted and the information brought forth by this study placed in context of such
analysis.
By virtue of the fact that epiphyseal fusion sequence is not discernably different between chimpanzees
and humans, it would be reasonable to infer that this feature was likely the same for fossil human
ancestors as well. Ruling out deviation and subsequent recoverging of developmental patterns at some
point in evolutionary history will never be possible but given the level of concordance between
chimpanzees, bonobos, and humans, such fluctuations would seem improbable. The consistency of
basic sequences known for apes such as the elbow-hip-ankle sequence mentioned in section 6.2 also
provides grounds to argue against deviation and reconverging of patterns. It suggests that fusion
patterns may be generally shared among many primate genera.
The implication of this is that any prior study assessing epiphyseal fusion using human models was not
misinformed about fusion sequence. Past studies such as Smith (2004) finding that this individual falls
within the range of normal human variation in sequence were likely correct. It is when an assessment
of chronological age has been attempted that problems have arisen (Graves et al. 2010). The two
problematic variables are dental development and growth rate. Growth rate cannot be practically be
measured in fossils and any assumption that epiphyseal fusion state relates directly to chronological
years cannot be assumed to be correct. Dental development also does not produce the same
chronological age estimation, as has been noted in the past (Dean and Smith 2009, Smith 2004).
Additionally, there are sequence differences known for chimpanzee teeth when compared to humans
(Kuykendall 1996). Therefore if chronological ages are sought, they must be found by other means
such as from dental histology. For example, Dean and Lucas (2009) determined age for the
Nariokotome specimen using incremental markings in dental enamel finding that the individual was
younger than expected when human criteria were used. They suggested that the Nariokotome
specimen fit closer with the expected ages for mineralization predicted by an ape model rather than
human one.

216
The Nariokotome Homo ergaster specimen was described in detail by Walker and Leakey (1993) and
Smith (1993). Unfused epiphyses included the triradiate and the proximal and distal ends of most
long-bones. The distal humerus had commenced fusion. Dental emergence and radiographic data
were available for the dentition. From these radiographs a Demirjian score could be assigned for I1 to
M2 reading, in that order, 8,7,6,6,6,7,5. This means that the first and only tooth to have completed
mineralization was the first incisor. The dental mineralization sequence for this individual was clearly
more consistent with the human sequence and has been analysed in prior studies. As such this analysis
simply considers epiphyseal fusion sequences in relation to mineralization of the first adult tooth, as
described in Chapter 5. This study has shown that fusion sequences in humans and chimpanzees do
not differ at this point of maturation. Only a couple phalanges from the hand were present and no foot
or ankle bones were present at all, making counting the number of epiphyses prior to the completion of
first complete tooth mineralization impossible. This limits any further direct application of the results
of this study beyond any conclusions reached in prior studies.
The finding that humans and chimpanzees share the same epiphyseal fusion pattern allows for a re-
evaluation of the conclusions of some previous studies. Clegg and Aiello (1999) suggested that the
Nariokotome specimen did not deviate from a human pattern of development. This study supports this
assertion by suggesting that the shared pattern between Pan and Homo has deeper ancestry than the
split between the two genera and thus occurred prior to the appearance of Homo ergaster. Smith’s
(2004) comparison of the Nariokotome specimen to a modern human sample concluded that it could be
human but deviated from normal human development. This assertion of deviation was based more on
estimation of body size for predicted age and enamel formation. Within the context of the skeletal
data, the two studies actually agree and with the knowledge that ape sequences at this stage of growth
converge with humans, this result would have been expected.
6.4 Suggestions for future study/limitations of present research
The present study provides a great deal of new information about growth and development in Pan,
However, there are clearly several limitations that future research may help to resolve. The most
obvious limitation is DS64 and the problem this presented for estimation of chronological age for
fusion of later epiphyses. Use of a known-age sample may be the only solution for this. Analysis of
Pan paniscus was limited by sample size and a larger sample would permit many of the analyses
performed in this study on Pan troglodytes to be done in tandem for Pan paniscus. Conducting similar
research using more distantly-related species may also serve to compliment the assessment of
developmental theory presented in this work.

217
Chapter 7 Concluding Remarks
Growth and development in Pan has been analysed by the study of epiphyseal fusion, dental
development, and long-bone growth in a sample of 177 Pan troglodytes and 37 Pan paniscus
specimens found in museum collections. The types of analyses performed in this study were done with
the objectives of informing both a theoretical understanding of human growth and for refinement of
growth standards applicable to the study of fossil hominids. The relationship between maturational
events and growth rates was considered as was the relationship between dental and skeletal sequences.
It was found that chimpanzees and humans share effectively the same pattern of skeletal fusion
sequences. When groupings of epiphyses were considered, humans were found to follow a similar
pattern to other primates of elbow-hip-ankle-knee, as outlined by Zihlman et al. (2007). Comparison
of dental sequences to epiphyseal fusion sequences determined that humans are unusual among
primates with third molar mineralization completing much closer to the terminal point of skeletal
maturation. Comparisons of fusion events relative to long-bone growth have indicated that the
differences in allometry between Pan and Homo are the result of different linear rates of individual
long-bone growth and do not represent the effects of sequence changes. There are marked differences
in both growth rate and duration of growth when Pan and Homo are compared. These differing growth
curves may obscure comparisons of maturational event patterns and lead to determination of
differences between species that may not actually exist. In terms of application to fossil hominids, the
results of this study suggest that the sequence of epiphyseal fusion events should be expected to be the
same. Differences in patterning between dental mineralization and skeletal fusion were identified
between Pan and Homo. This has implications for the assessment of either fossil or extant species.
Determining state of maturity through either dental or skeletal systems must take into account how
species differ.
It was not possible to complete as many analyses for bonobo skeletal development as were done for
chimpanzees due to the more limited sample size for this species. For the analyses that could be
completed, it was found that bonobos did not differ from chimpanzees, suggesting a general Pan
pattern of growth. Further study with larger sample sizes will help provide further clarity with respect
to developmental parameters in this species.
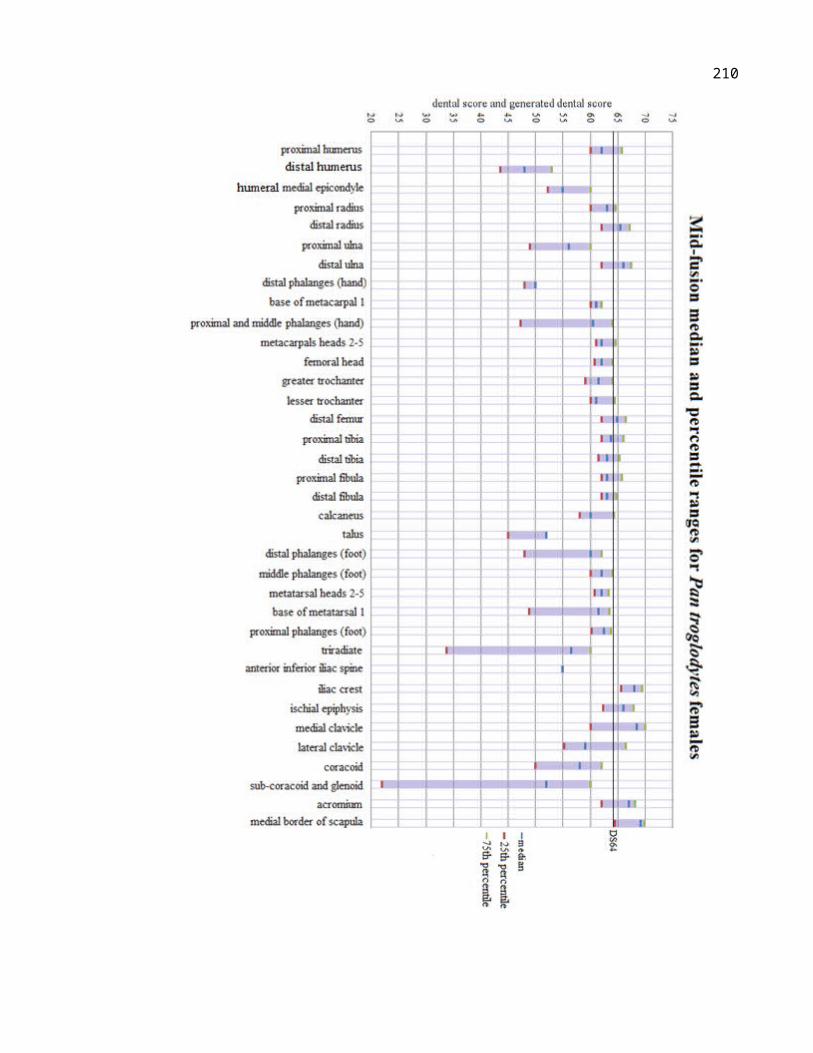
218
References
Acheson, R.M. 1954. A method for assessing skeletal maturity from radiographs: A report from the Oxford Child Health Survey. Journal of Anatomy 88(4): 498-508.Acheson, R.M. 1957. The Oxford method of assessing skeletal maturity. Clinical Orthopaedics and Related Research 10: 19-39.Albert, A.M. Greene, D.L. 1999. Bilateral asymmetry in skeletal growth and maturation as an indicator of environmental stress. American Journal of Physical Anthropology 110(3): 341-349.Alemseged, Z. Spoor, F. Kimbel, W.H. Bobe, R. Geraads, D. Reed, D. Wynn, J.G. 2006. A juvenile early hominin skeleton from Dikika, Ethiopia. Nature 443: 296-301.
Almond, D. Edlund, L. 2007. Triver-Willard at birth and one year: evidence from US natality data 1983-2001. Proceedings of the Royal Society B 274(1624): 2491-2496.Anemone, R.L. Mooney, M.P. Siegel, M.I. 1996. Longitudinal study of dental development in chimpanzees of known chronological age: implications for understanding the age at death for Plio-Pleistocene hominids. American Journal of Physical Anthropology 99(1): 119-133.Anemone, R.L. Watts, E.S. Swindler, D.R. 1991. Dental development of known-age chimpanzees, Pan troglodytes (primates, pongidae). American Journal of Physical Anthropology 86(2): 229-241.Ashizawa, K. Asami, T. Anzo, M. Matsuo, N. Matsuoka, H. Murata, M. Ohtsuki, F. Satoh, M. Tanaka, H. Tsukagoshi, K. Tsukagoshi, T. 1996. Standard RUS skeletal maturation of Tokyo children. Annals of Human Biology 23(6): 457-469.Auerbach, B.M. Ruff, C.B. 2006. Limb bone bilateral asymmetry: variability and commonality among modern humans. Journal of Human Evolution 50(2): 203–218.
Barros, A. Soligo, C. 2013. Bilateral Asymmetry of Humeral Torsion andLength in African Apes and Humans. Folia Primatologica 84(3-5): 220-238.
Bastir, M. Rosas, A. 2004. Comparative ontogeny in humans and chimpanzees: Similarities, differences and paradoxes in postnatal growth and development of the skull. Annals of Anatomy - Anatomischer Anzeiger 186(5–6): 503–509.
Berger, L.R. de Ruiter, D.J. Churchill, S.E. Schmid, P. Carlson, K.J. Dirks, P.H.G.M. Kibii, J. 2010. Australopithecus sediba: A New Species of Homo-Like Australopith from South Africa. Science 5975(328): 195-204.
Bermúdez De Castro, J.M. Nicolas, M.E. 1995. Posterior dental size reduction in hominids: The Atapuerca evidence. American Journal of Physical Anthropology 96(4): 335–356.
Beunen. G, Lefevre. J, Ostyn. M, Renson. R, Simons. J, Van Gerven. D. 1990. Skeletal maturity in Belgian youths assessed by the Tanner-Whitehouse method (TW2). Annals of Human Biology 17(5): 355–376.Beynon, A.D. Dean, M.C. Reid D.J. 1991. Histological study on the chronology of the developing dentition in gorilla and orangutan. American Journal of Physical Anthropology 86(2): 189-203.

219
Bininda-Emonds, O. R. P. Jeffery, J. E. Coates, M. I. Richardson, M. K. 2002. From Haeckel to event-pairing: the evolution of developmental sequences. Theory Biosciences 121: 297–320.Bininda-Emonds, O.R.P. Jeffrey, J.E. Richardson, M.K. 2004. Is Sequence Heterochrony an Important Evolutionary Mechanism in Mammals? Journal of Mammalian Evolution 10(4): 335-361.Bisgard, J.D. Bisgard, M.E. 1935. Longitudinal growth of long bones. Archives of Surgery 31(4): 568-578.Blomquist, G.E. 2009. Brief Communication: Methods of Sequence Heterochrony for Describing Modular Developmental Changes in Human Evolution. American Journal of Physical Anthropology 138(2): 231-238.Bock, R.D. Thissen, D. 1980. Statistical problems of fitting individual growth curves. In Johnston, F.E. Roche, A.F. Susanne, C. (eds.) Human Physical Growth and Maturation, Methodologies and Factors. Plenum: New York. pp. 265–290.
Boesch C, Boesch-Achermann H. 2000. The chimpanzees of the Tai Forest: behavioural ecology and evolution. New York: Oxford University Press. p.316.
Bogin, B.A. 1988. Patterns of Human Growth. Cambridge University Press: Cambridge.
Bogin, B.A. 1990. The evolution of human childhood. BioScience 40(1): 16–25.Bogin, B.A. 1991. Measurement of growth variability and environmental quality in Guatemalan children. Annals of Human Biology 18(4): 285-294.
Bogin, B.A. 1997. Evolutionary hypotheses for human childhood. American Journal of Physical Anthropology 104(S25): 63-89.
Bogin, B.A. 1999a. Patterns of Human Growth 2nd Ed. Cambridge University Press, Cambridge.Bogin, B.A. 1999b. Evolutionary Perspective on Human Growth. Annual Review of Anthropology 28: 109-153.
Bogin, B.A. MacVean, R.B. 1983. The relationship of socioeconomic status and sex to body size, skeletal maturation, and cognitive status of Guatemala City schoolchildren. Child Development 54(1): 115–128.Bogin, B.A. Sullivan, T. Hauspie, R. MacVean, R.B. 1989. Longitudinal growth in height, weight, and bone age of Guatemala Latino and Indian schoolchildren. American Journal of Human Biology 1(1): 103–113.Bogin, B.A. Smith, B.H. 1996. Evolution of the Human Life Cycle. American Journal of Human Biology 8(6): 703-716.Bolter, D.R. 2011. A Comparative Study of Growth Patterns in Crested Langurs and Ververt Monkeys. Anatomy Research International Article ID 948671, 12 pages doi:10.1155/2011/948671.Bolter, D.R. Zihlman, A.L. 2003. Morphometric analysis in wild-collected ververt monkeys (Cercopithecus aethiops) with implications for growth patterns in Old World monkeys, apes, and humans. Journal of Zoology 260(1): 99-110.Bolter, D.R. Zihlman, A.L. 2011. Brief communication: Dental development timing in captive Pan paniscus with comparisons to Pan troglodytes. American Journal of Physical Anthropology 145(4) 647–652.

220
Bolter, D.R. Zihlman, A.L. 2012. Skeletal development in Pan paniscus with comparisons to Pan troglodytes. American Journal of Physical Anthropology 147(4): 629–636.Boughner, J.C. Dean, M.C. 2004. Does space in the jaw influence the timing of molar crown initiation? A model using baboons (Papio anubis) and great apes (Pan troglodytes, Pan paniscus). Journal of Human Evolution 46(3): 253-277.
Boughner, J.C. & Dean, M.C. 2008. Mandibular Shape, Ontogeny and Dental Development in Bonobos (Pan paniscus) and Chimpanzees (Pan troglodytes). Evolutionary Biology 35(4): 296 -308.
Boughner, J.C. Dean, M.C. Wilgenbusch, C.S. 2012. Permanent tooth mineralization in bonobos (Pan paniscus) and chimpanzees (P. troglodytes). American Journal of Physical Anthropology 149(4): 560–571.
Braga, J. Heuze, Y. 2007. Quantifying variation in human dental development sequences: An EVO-DEVO perspective. Bailey, S.E. and Hublin J.J. (eds.) Dental Perspectives on Human Evolution. Springer, The Netherlands. pp.247-261.
Bramblett, C.A. 1969. Non-metric skeletal age changes in the Darajani baboon. American Journal of Physical Anthropology 30(2): 161-171.
Brodeur, A.E. Silberstein, M.J. and Graviss, E.R. 1981. Radiology of the Pediatric Elbow. G.K. Hall: Boston.Bufill, E. Agustí, J. Blesa, R. 2011. Human neoteny revisited: The case of synaptic plasticity. American Journal of Human Biology 23(6): 729–739.
Byers, S. Moore, A.J. Byard, R.W. Fazzalari, N.L. 2000. Quantitative Histomorphometric Analysis of the Human Growth Plate From Birth to Adolescence. Bone 27(4): 495-501.
Calcagno, J.M. Gibson, K.R. 1988. Human dental reduction: Natural selection or the probable mutation effect. American Journal of Physical Anthropology 77(4): 505–517.
Cameron, N. 2006. Assessment of Maturation. In: Human Growth and Development. Cameron, N. ed. Academic Press, New York. pp. 363-382.Cardoso, H.F.V. 2007. Environmental effects on skeletal versus dental development: Using a documented subadult skeletal sample to test a basic assumption in human osteological research. American Journal of Physical Anthropology 132(2): 223-233.Cardoso, H.F.V. 2008. Epiphyseal union at the innominate and lower limb in a modern Portuguese skeletal sample, and age estimation in adolescent and young adult male and female skeletons. American Journal of Physical Anthropology 135(2): 161-170.Chaillet, N. Demirjian A. 2004. Dental maturity in South France: A comparison between Demirjian's method and polynomial functions. Journal of Forensic Sciences 49(5): 1059-1066.Chia, D.J. Ono, M. Woelfle, J. Schlesinger-Massart, M. Jiang, H. Rotwein, P. 2006. Characterization of Distinct Stat5b Binding Sites That Mediate Growth Hormone-stimulated IGF-I Gene Transcription. The Journal of Biological Chemistry 281: 3190-3197.
Chisholm, J.S. Quinlivan, J.A. Petersen, R.W. Coall, D.A. 2005. Early stress predicts age at menarche and first birth, adult attachment, and expected lifespan. Human Nature 16(3): 233-265.

221
Cheverud, J.M. 1981. Epiphyseal union and dental eruption in Macaca mullata. The American Journal of Physical Anthropology 56(2): 157-167.Clegg, M. Aiello, L.C. 1999. A comparison of the Nariokotome Homo erectus with juveniles from a modern human population. American Journal of Physical Anthropology 110(1): 81–93.Cobb, S. O’Higgins, P. 2007. The ontogeny of sexual dimorphism in the facial skeleton of the African apes. Journal of Human Evolution 53(2): 176-190.
Cockshott, W.P. Park, W,M, 1983. Observer variation in skeletal radiology. Skeletal Radiology 10: 86-90.Coe, C.L. Connolly, A.C. Kraemer, H.C. Levine, S. 1979. Reproductive development of behavior of captive female chimpanzee. Primates 23(4): 393-405.Colbert, M.W. Rowe, T. 2008. Ontogenetic Sequence Analysis: Using Parsimony to Characterize Developmental Sequences and Sequence Polymorphism. Journal of Experimental Zoology 310B(5): 398-416.Conroy, G.C. Kuykendall, K. 1995. Paleopediatrics: Or when did human infants really become human? American Journal of Physical Anthropology 98(2): 121-131.Conroy, G.C. Mahoney, C.J. 1991. Mixed longitudinal study of dental emergence in the chimpanzee, Pan troglodytes (primates, pongidae). American Journal of Physical Anthropology 86(2): 243–254.
Conroy, G.C. Vannier, M.W. 1987. Dental Development of the Taung skull from computerized tomography. Nature 329(6140): 625-627.Coolidge, H.J. 1933. Pan paniscus: Pygmy chimpanzee from south of the Congo River. American Journals of Physical Anthropology 18(1): 1-59.Coolidge, H.J. Shea, B.T. 1982. External Body Dimensions of Pan paniscus and Pan troglodytes Chimpanzees. Primates 23(2): 245-251.
Corp, N. Byrne, R.W. 2003. Sex difference in chimpanzee handedness. American Journal of Physical Anthropology 123(1): 62-68.
Coqueugniot, H. Weaver, T. 2007. Infracranial maturation in the skeletal collection from Coimbra, Portugal: New aging standards for epiphyseal union. American Journal of Physical Anthropology 134(3): 424-437.Cundy, P, Patterson, D. Morris, L. And Foster, B. 1988. Skeletal age estimation in leg length discrepancy. Journal of Pediatric Orthopaedics 8: 513-515.Dainton, M. & Macho, G. (1999). Heterochrony: somatic, skeletal, and dental development in Gorilla, Homo and Pan. In R.D. Hoppa & C.M. Fitzgerald (Eds.) Human growth in the past: Studies from bones and teeth (pp.32-64). Cambridge: Cambridge University Press, Cambridge.Dean, C. Leakey, M.G. Reid, D. Friedemann, S. Schwartz, G.T. Stringer, C. Walker, A. 2001. Growth processes in teeth distinguish modern humans from Homo erectus and earlier hominins. Nature 414: 628-631.Dean, M.C. Lucas, V.S. 2009. Dental and skeletal growth in early fossil hominins. Annals of Human Biology 36(5): 545-561.

222
Dean, M.C. Smith, B.H. 2009. The First Humans – Origin and Early Evolution of the Genus Homo. Vertebrate Paleobiology and Paleoanthropology. In Growth and Development of the Nariokotome Youth, KNM-WT 15000. Springer, The Netherlands. pp 101-120.
Dean, M.C. Stringer, C.B. Bromage, T.G. 1986. Age at death of the Neanderthal child from Devil's Tower, Gibraltar and the implications for studies of general growth and development in Neanderthals. American Journal of Physical Anthropology 70(3): 301–309.
Demirjian, A. Buschang, P.H. Tanguay, R. Kingnorth Patterson, D. 1985. Interrelationships among measures of somatic, skeletal, dental, and sexual maturity. American Journal of Orthodontics 88(5): 433-488.
Demirjian, A. 1986. Dentition. Human Growth: A Multidisciplinary Review. Taylor and Francis Ltd, London. pp. 269-295.
Demrijian, A. Goldstein, H. Tanner, J.M. 1973. A new system of dental age assessment. Human Biology 45(2): 211-227.Demirjian, A. Levesque, G.Y. 1980. Sexual Differences in Dental Development and Prediction of Emergence. Journal of Dental Research 59(7): 1110-1122.
Diamanti, J. Townsend, G.C. 2003. New standards for permanent tooth emergence inAustralian children. Australian Dental Journal 48(1): 39-42.
Digby, K.H. 1916. The mesurement of diaphysial growth in proximal and distal directions. Journal of Anatomy 50 (Pt. 2): 187-188.Dirks, W. Reid, D.J. Jolly, C.J. Phillips-Conroy, J.E. Brett, F.L. 2002. Out of the Mouths of Baboons: Stress, Life History, and Dental Development in the Awash National Park Hybrid Zone, Ethiopia. American Journal of Physical Anthropology 118(3): 239-252.
Dean, M.C. Wood, B.A. 1981. Developing pongid dentition and its use for aging individual crania in comparative cross-sectional growth studies. Folia Primatologica 36(1-2): 111-127.
Doran, D.M. 1993. Comparative locomotor behavior of chimpanzees and bonobos: The influence of morphology on locomotion. American Journal of Physical Anthropology 91(1): 83–98.Ely, J.J. Dye, B. Frels, W.I. Fritz, J. Gagneux, P. Khun, H.H. Switzer, W.M. Lee, D.R. 2005. Subspecies composition and founder contribution of the captive U.S. chimpanzee (Pan troglodytes) population. American Journal of Primatology 67(2): 223–241.
Fairbairn, D.J. 1997. Allometry for Sexual Size Dimorphism: Pattern and Process in the Coevolution of Body Size in Males and Females. Annual Review of Ecology and Systematics 28: 659-687.Fazekas, I.Gy. Kósa, F. 1978. Forensic Fetal Osteology Akadémiai Kiado, Budapest.
Feuillan, P. Merke, D. Leschek, E.W. Cutler, G.B Jr. 1999. Use of aromatase inhibitors in precocious puberty. Endocrine-Related Cancer 6(2): 303 -306.FitzGerald, C.M. 1998. Do enamel microstructures have regular time dependency? Conclusions from the literature and a large-scale study. Journal of Human Evolution 35(4–5): 371–386.
Fleagle, J.G. 1998. Primate Adaptation and Evolution. 2nd Edition. Elsevier Academic Press. San Diego.
Fleagle, J.G. McGraw, W.S. 1999. Skeletal and dental morphology supports diphyletic origin of baboons and mandrills. Proceedings of the National Academy of Science of the United States of America 96(3): 1157-1161.

223
Flecker, H. 1932. Roentgenographic observations of the times of appearance of epiphyses and their fusion with the diaphyses. Journal of Anatomy 67(Pt. 1): 118-164.Flores-Mir, C. Nebbe, B. Major, P.W. 2004. Use of Skeletal Maturation Based on Hand-Wrist Radiographic Analysis as a Predictor of Facial Growth: A Systematic Review. Angle Orthodontist 74(1):118-124.Frechkop, S. (1935). Notes sure les mammiferes. XVII; A propus du chimpanze de la rive gauche du Congo. Musee Royale Histoire Naionale Belgique Bull. 11: 1-41.Galliari, C.A. 1988. A study of postnatal appendicular skeletal maturation in captive-born squirrel monkeys (Saimiri boliuiensis). American Journal of Primatology 16(1): 5-61Garn, S.M. Blumethall, T. And Rohmann, C.G. 1965. On skewness in the ossification centers of the elbow. American Journal of Physical Anthropology 23(3): 303-304.Garn, S.M. Rohmann, C.G. 1963. On the prevalence of skewness in incremental data. American Journal of Physical Anthropology 21(2): 235-236.Garn, S.M. Rohmann, C.G. 1966. Interaction of nutrition and genetics in the timing of growth anddevelopment. Pediatric Clinics of North America 13: 353-379.Garn, S.M. Rohmann, C.G. Silverman, F.N. 1967. Radiographic standards for postnatal ossification and tooth calcification. Medical Radiography and Photography 43: 45-66.Garn, S.M. Sandusky, S.T. Nagy, J.M. Trowbridge, F.L. 1973. Negro-Caucasoid differences in permanent tooth emergence at a constant income level. Archives of Oral Biology 18(5): 609-615.
Gavan, J.A. 1953. Growth and Development of the Chimpanzee; A Longitudinal and Comparative Study. Human Biology 25(2): 93-143.Gavan, J.A. 1971. Longitudinal, postnatal growth in chimpanzee. In G.H. Bourne (Ed.) The Chimpanzee. Volume 4, behaviour, growth, and pathology of chimpanzees (pp.46-102). S. Karger: Basel.Ghantus, M. 1951. Growth of the shaft of the human radius and ulna during the first two years of life. American Journal of Roentgenology 65: 784-786.Gindhart, P. 1973. Growth standards for the tibia and the radius in children aged one month through eighteen years. American Journal of Physical Anthropology 39(1): 41-48.
Glassman, D.M. 1983. Growth and development in the saddle-back tamarin: the sequence and timing of dental eruption and epiphyseal union. American Journal of Primatology 5(1): 51-59.Godfrey, L.R. Sutherland, M.R. 1995. Flawed inference: why size-based tests of heterochronic processes do not work. Journal of Theoretical Biology 172(1): 43-61.Godfrey, L. Sutherland, M.R. 1996. Paradox of peramorphic paedomorphosis: Heterochrony and human evolution. American Journal of Physical Anthropology 99(1): 17-42.

224
Goswami, A. 2007. Cranial modularity and sequence heterochrony in mammals. Evolution & Development 9(3): 290–298.
Gould, S.J. 1977. Ontogeny and Phylogeny. Harvard University Press: Cambridge p.235.Gould, S.J. 1981. The Mismeasure of Man. Norton: New York.
Graur, D. Higgins, D. G. 1994. Molecular Evidence for the Inclusion of Cetaceanswithin the Order Artiodactyla. Molecular Biology and Evolution 11(3): 357-364.Greulich, W.W. 1957. A comparison of the physical growth and development of American-born and native Japanese children. American Joural of Physical Anthropology 15(4):489-515.Greulich, W.W. and Pyle, S.I. 1959. Radiographic atlas of skeletal development of the hand and wrist. 2nd edn. Stanford University Press, New York.Graves, R.R. Lupo, A.C. McCarthy, R.C. Wescott, D.J. Cunningham, D.L. 2010. Just how strapping was KNM-WT 15000? Journal of Human Evolution 59(5): 542-554.Groves, C. 2001. Primate Taxonomy. Smithsonian Institution Press: Washington.
Gunst, K. Mesotten, K. Carbonez, A. Willems, G. 2003. Third molar root development in relation to chronological age: a large sample sized retrospective study. Forensic Science International 136(1-3): 52–57.
Haavikko, K. 1970. The formation and the alveolar and clinical eruption of the permanent teeth. An orthopantographic study. Proceedings of the Finnish Dental Society 66(3): 101-170.
Hales, S. 1727 Statistical essays. Volume 1. Vegetable statiks. W. Innys.: London.Hamada, Y. Udono, T. Teramoto, M. Sugawara, T. 1996. The Growth Pattern of Chimpanzees: Somatic Growth and Reproductive Maturation in Pan troglodytes. Primates 37(3): 279-295.Hamada, Y. Udono, T. Teramoto, M. Hayasaka, I. 1998. Development of the Hand and Wrist Bones in Chimpanzees. Primates 39(2): 157-169.Hamada,Y. Udono, T. 2002. Longitudinal analysis of length growth in the chimpanzee (Pan troglodytes). American Journal of Physical Anthropology 118 (3): 268–284.Hamada, Y. and Chatani, K. 2003. A longitudinal study on hand and wrist skeletal maturation in chimpanzees (Pan troglodytes), with emphasis on growth in linear dimensions. Primates 44(3): 259-271.Hansman, C.F. Maresh, M.M. 1961. A Longitudinal Study of Skeletal Maturation. American Journal of Diseases of Children 101(3):305-321.Harvey, P.H. Clutton-Brock, T.H. 1985. Life-history variation in primates. Evolution 39(3): 559-581.
Hayama, S. 1965. Morphological studies of Macaca fuscata II. The sequence of epiphyseal union by roentgenographic estimation. Primates 6(2):249-269.Hewitt, D. Acheson, R.M. 1961. Some aspects of skeletal development through adolescence. II The inter-relationship between skeletal maturation and growth at puberty. American Journal of Physical Anthropology 19(4): 333.344.

225
Hey, J. 2010. The Divergence of Chimpanzee Species and Subspecies as Revealed in Multipopulation Isolation-with-Migration Analyses. Molecular Biology and Evolution 27(4): 921-933.
Hill, K. 1993. Life history theory and evolutionary anthropology. Evolutionary Anthropology: Issues, News, and Reviews 2(3): 78-88.Hill, K. Kaplan, H. 1999. Life History Traits in Humans: Theory and Empirical Studies. Annual Review of Anthropology 28(1): 397-430.Hoerr, N.L. Pyle, S.I. and Francis, C.C. 1962. Radiographic Atlas of Skeletal Development of the Foot and Ankles: A Standard Reference. Springfield IL: C.C. Thomas.Holden, L. 1882. Human Osteology. 6th edition. Churchill: London.Holliday, T.W. 1997. Body proportions in Late Pleistocene Europe and modern human origins. Journal of Human Evolution 32(5): 423–447.Holliday, T.W. Ruff, C.B. 2001. Relative variation in human proximal and distal limb segment lengths. American Journal of Physical Anthropology 116(1): 26–33.
Holman, D.J. Jones, R.E. 1991. Longitudinal analysis of deciduous tooth emergence in Indonesian children. I. Life table methodology. American Journal of Human Biology 3(4): 389–403.
Hopkins, W.D. 2006. Comparative and familial analysis of handedness in great apes. Psychological Bulletin 132(4): 538-559.
Hopkins, W.D. Pearson, K. 2000. Chimpanzee (Pan troglodytes) handedness: Variability across multiple measures of hand use. Journal of Comparative Psychology 114(2): 126-135.
Hoppa, R.D. 1992. Evaluating human skeletal growth: An Anglo-Saxon example. International Journal of Osteoarchaeology 2(4): 275-288.
Huda, T.F.J. Bowman, J.E. 1995. Age determination from dental microstructure in juveniles. American Journal of Physical Anthropology 97(2): 135–150
Hussin, A.S. Mokhtar, N. Naing, L. Taylor, J.A. Mahmood, Z. 2007. The timing and sequence of emergence of permanent teeth in Malay schoolchildren in Kota Bharu, Malaysia. Archives of Orofacial Sciences 2: 36-40.
Jantz, R.L. Owsley, D.W. 1984. Long bone growth variation among Arikara skeletal populations. American Journal of Physical Anthropology 63(1): 3-20.
Jeanty, P. 1983. Fetal limb biometry. Radiology 147(2): 601-602.
Jeffery, J. E., Richardson, M. K., Coates, M. I. & Bininda-Emonds, O. R. P. 2002. Analyzing developmental sequences within a phylogenetic framework. Systematic Biology. 51(3): 478–491.Jit, I. Kaur, H. 1989. Time of fusion of the human sternebrae with one another in Northwest India. American Journal of Physical Anthropology 80(2): 195-202.Jit, I. Singh, B. 1971. A radiological study of the time of fusion of certain epiphyses in Punjabees. Journal of Anatomical Society India 20(1): 457-466.Jungers, W.L. 1982. Lucy's limbs: skeletal allometry and locomotion in Australopithecus afarensis. Nature 297: 676 – 678.
Karlberg, J. 1985. The human growth curve decomposed into three additive and partly superimposed components: The FBP model. In Abstracts. Fourth International Congress of Auxology. Taylor and Francis: London p. 46.

226
Kaufman, M.J. 1992. The atlas of mouse development. Academic Press: London.Kaul, S. Saini, S. Saxena, B. 1975. Emergence of permanent teeth in school-children in Chandigarh, India. Archives of Oral Biology 20(9): 587–593.
Katz, H.B. 1980. The influence of undernutrition on learning performance in rodents. Nutrional Abstracts and. Reviews 50(11): 767-784.Keene, H.J. 1991. On heterochrony in heterodonty: A review of some problems in tooth morphogenesis and evolution. American Journal of Physical Anthropology Supplement: Yearbook of Physical Anthropology 34 (S13): 251–282.
Kelley, J. Schwartz, G.T. 2010. Dental development and life history in living African and Asian apes. Proceedings of the National Academy of Sciences of the United States of America 3: 1035-1040.
Kelley, J. Smith, T. 2003. Age at first molar emergence in early Miocene Afropithecus turkanensis and life-history evolution in the Hominoidea. Journal of Human Evolution 44(3): 307-329.Kerley, E.R. 1966. Skeletal age changes in the chimpanzee. Tulane Studies in Zoology 13: 71-80.Kilborn,S.H. Trudel,G. Uhthoff,H. 2002. Review of Growth Plate Closure Compared with Age at Sexual Maturity and Lifespan in Laboratory Animals. Journal of the American Association for Laboratory Animal Science 41(5): 21-26.
Kimura, T. Hamada, Y. 1996. Growth of wild and laboratory born chimpanzees. Primates 37(3): 237-251.
King, S.J. 2004. Relative timing of ontogenetic events in primates. Journal of Zoology 264:3: 267-280.Kinzey, W.G. 1984. The dentition of the pygmy chimpanzee, Pan paniscus. In The Pygmy Chimpanzee Susman, R.L. ed. Plenum Press, New York pp. 65–88.
Kinzey, W.G. 1992. Dietary and dental adaptations in the Pitheciinae. American Journal of Physical Anthropology 88(4): 499–514.
Kinsey, W.G. 1997. New World Primates: Ecology, Evolution, and Behaviour. Kinsey, W.G. ed. Walter de Gruyter: New York.
Kirk, E.C. Simons, E.L. 2001. Diets of fossil primates from the Fayum Depression of Egypt: a quantitative analysis of molar shearing. Journal of Human Evolution 40(3): 203-229.
Klingenberg, C.P. 1998. Heterochrony and allometry: the analysis of evolutionary change in ontogeny. Biological Reviews of the Cambridge Philosophical Society 73(1): 79-123.Klingenberg, C.P. McIntyre, G.S. 1998. Geometric morphometrics of developmental instability: analyzing patterns of fluctuating asymmetry with Procrustes methods. Evolution 52(5): 1363-1375.Knight, R.R. 1966. Bone characteristics associated with aging in elk. Journal of Wildlife Management 30(2): 369-374.Koch, W. 1935. The age order of epiphyseal union in the skeleton of the European bison (bos bonasus L.) The Anatomical Record 61(3): 371-376.

227
Koshy, S. Tandon, S. 1998. Dental age assessment: the applicability of Demirjian's method in south Indian children. Forensic Science International 94(1-2): 73-85.Kraemer, H.C. Horvat, J.R. Doering, C. McGinnis, P.R. 1982. Male chimpanzee development focusing on adolescence: integration of behavioral with physiological changes. Primates 23(3): 393-405.Kumar, S. Filipski, A. Swarna, V. Walker, A. Hedges, S.B. 2005. Placing confidence limits on the molecular age of the human-chimpanzee divergence. Proceedings of the National Academy of Sciences 102(52): 18842-18847.Kuykendall, K.L. Mahoney, C.J. Conroy, G.C. 1992. Probit and Survival Analysis of Tooth Emergence Ages in a Mixed-Longitudinal Sample of Chimpanzees (Pan troglodytes). American Journal of Physical Anthropology 89(3): 379-399.Kuykendall, K. 1996. Dental Development in Chimpanzees (Pan troglodytes): The Timing of Tooth Calcification Stages. American Journal of Physical Anthropology 99(1):135-157.Kuykendall, K. Conroy, G.C. 1996. Permanent Tooth Calcification in Chimpanzees (Pan troglodytes) Patterns and Polymorphisms. American Journal of Physical Anthropology 99(1): 159-174.Laird, A.K. 1967. Evolution of the human growth curve. Growth 31: 345–355.Lampl, M. Johnston, F.E. Malcolm, L.A. 1978. The effects of protein supplementation on the growth and skeletal maturation of New Guinean school children. Annals of Human Biology 5(3): 219-227.Lasker, G.W. 1969. Human biological adaptability. Science 166(3912): 1480-1486.Last, R.J. 1973. Anatomy, Regional and Applied. 5th edition. Churchill Livingstone: Edinburgh.Leavens, D.A. Hopkins, W.D. Bard, K.A. 2005. Understanding the Point of Chimpanzee Pointing: Epigenesis and Ecological Validity. Current Directions in Psychological Science 14(4): 185-189.Leigh, S.R. 2004. Brain growth, life history, and cognition in primate and human evolution. American Journal of Primatology Special Issue: Topic issue on Primate Cognitive Ecology 62(3): 139–164.
Leigh, S.R. Shea, B.T. 1996. Ontogeny of Body Size Variation in African Apes. American Journal of Physical Anthropology 99(1): 43-45.
Leutenegger, W. Kelly, J.T. 1977. Relationship of Sexual Dimorphism in Canine Size and Body Size to Social, Behavioral, and Ecological Correlates in Anthropoid Primates. Primates 18(1): 117-136.
Sommer, V. Adanu, J. Faucher, I. Fowlera, A. 2004. Nigerian Chimpanzees (Pan troglodytes vellerosus) at Gashaka: two years of habituation efforts. Folia Primatologica 75: 295-316.
Lewall, E.G. Cowan, I.M. I963. Age determination in blacktail deer by degree of ossification of the epiphyseal plate in the long bones. Canadian Journal of Zoology 41(1): 629.Lewis, A.B. Garn, S.M. 1960. The Relationship Between Tooth Formation and Other Maturational Factors. The Angle Orthodontist 30: 70-77.

228
Lieberman, D. E. Carlo, J. Ponce de Leon, M. & Zollikofer,C.P.E. (2007). A geometric morphometric analysis of heterochrony in the cranium of chimpanzees and bonobos. Journal of Human Evolution 52(6): 647-662.Liversidge, H. 2003. Variation in modern human dental development. Patterns of Growth and Development in the Genus Homo. Thompson, J.L. Krovitz, G.E. (eds.). Cambridge University Press. Cambridge. pp. 73-113.
Liversidge, H.M. Chaillet, N. Mörnstad, H. Nyström, M. Rowlings, K. Taylor, J. Willems, G. 2006. Timing of Demirjian's tooth formation stages. Annals of Human Biology 33(4): 454-470.
Liversidge, H.M. Herdeg, B. Rosing, F.W. 1998. Dental age estimation of non-adults. A review of methods and principles. In: Dental Anthropology, Fundamentals, Limits and Prospects. Rosing, K.W. and Teschler-Nicola, M. eds.. Springer: Vienna. pp. 419-442.
Liversidge, H.M. Speechly, T. 2001. Growth of permanent mandibular teeth of British children aged 4 to 9 years. Annals of Human Biology 28(3): 256-262.
Lovejoy, C.O. 1985. Dental wear in the Libben population: Its functional pattern and role in the determination of adult skeletal age at death. American Journal of Physical Anthropology 68(1): 47–56.
Lovejoy, C.O. Suwa, G. Simpson, S.W. Matternes, J.H. White, T.D. 2009. The Great Divides: Ardipithecus ramidus Reveals the Postcrania of Our Last Common Ancestors with African Apes. Science 326(5949): 73, 100-106.
Lucas, A. Morley, R. Cole, T. J. 1998. Randomised trial of early diet in preterm babies and later intelligence quotient. British Medical Journal 317: 1481-1487.de Magalhães, J.P. Church, G.M. 2007. Analyses of human–chimpanzee orthologous gene pairs to explore evolutionary hypotheses of aging. Mechanisms of Ageing and Development 128(506): 355-364.Mainland, D. 1953. Evaluation of the skeletal age method of estimation children’s development. I. Systematic errors in the assessment of roentgenograms. Pediatrics 12(2): 114-129.Mainland, D. 1954. Evaluation of the skeletal age method of estimating children’s development. II. Variables errors in the assessment of roentgenograms. Pediatrics 13(2): 165-173.Mainland, D. 1957. Evaluation of the skeletal age method of estimating children’s development. III. Comparison of methods and inspection in the assessment of roentgenograms. Pediatrics 20(6): 979-992.Maresh, M.M. 1970. Measurement from roentgenograms. In: McCammon, R.W. ed. Human Growth and Development. Thomas: Springfield. pp. 157-200.
Martin, R.D. 1990. Primate Origins and Evolution Princeton University Press: Princeton.
Martin-de las Heras, S. García-Fortea, P. Ortega, A. Zodocovich, S. Valenzuela, A. 2008. Third molar development according to chronological age in populations from Spanish and Magrebian origin. Forensic Science International 174(1): 47-53.
Matsuzawa, T. Sakura, O. Kimura, Z. Hamada, Y. Sugiyama, Y. 1990. Case report on the death
of a wild chimpanzee (Pan troglodytes verus). Primates 31(4): 635-641.
McHenry, H.M. Coffing, K. 2000. Australopithecus to Homo: Transformations in Body and Mind. Annual Review of Anthropology: 125-146.

229
McKern, T.W. Stewart, T.D. 1957. Skeletal age changes in young American males, analysis from the standpoint of age identification. Headquarters Quartermaster Research and Development Command, Technical Report EP-45: Natick MA.
McNamara, K.J. 2002. What is Hetereochrony? Minugh-Purvis, N. McNamara, K.J. (eds.). Human Evolution through Developmental Change. John Hopkins University Press, Baltimore. pp.1-4.
Meindl, R.S. Lovejoy, C.O. 1985. Ectocranial suture closure: A revised method for the determination of skeletal age at death based on the lateral-anterior sutures. American Journal of Physical Anthropology 68(1): 57-66.Meinl, A. Tangl, S. Huber, C. Maurer, B. Watzek, G. 2007. The chronology of third molar mineralization in the Austrian population—a contribution to forensic age estimation. Forensic Science International 169(2-3): 161–167.
Mensforth, R.P. 1985. Relative tibia long bone growth in the Libben and Bt-5 prehistoric skeletal populations. American Journal of Physical Anthropology 68(2): 247-262.
Michejda, M. 1987. Skeletal development of the wrist and hand in Macaca mulatta and man. T Roentgenographic atlas. Karger: Basel.Miles, A. E. W. Bulman, J. S. 1994. Growth curves of immature bones from a Scottish island population of sixteenth to mid-nineteenth century: Limb-bone diaphyses and some bones of the hand and foot. International Journal of Osteoarchaeology 4(2):121-136.
Mitteroecker, P. Gunza, P. Bernhard, M. Schaefer, K. 2004. Comparison of cranial ontogenetic trajectories among great apes and humans. Journal of Human Evolution 46(6): 679–698.
Mitteroecker, P. Gunz, P. Bookstein, F.L. 2005. Heterochrony and geometric morphometrics: a comparison of cranial growth in Pan paniscus versus Pan troglodytes. Evolution and Development 7(3): 244-258.Monge, J. Mann, A. Stout, A. Rogèr, J. Wadenya, R. 2007. Dental calcification stages of the permanent M1 and M2 in U.S. children of African-American and European-American ancestry born in the 1990s. In: Dental Perspectives on Human Evolution. Bailey, S.W. Hublin,m J.J. (eds). Spring: Netherlands. pp. 263-274.
Morbeck, M.E. Zihlman, A.L. 1989. Body size and proportions in chimpanzees, with special reference to Pan troglodytes schweinfurthii from Gombe National Park, Tanzania. Primates 30(3): 369-382.
Moorrees, C. Fanning, E. Hunt, E. 1963. Age variation of formation stages for ten permanent teeth. Dental Research 42(6): 1490-1502.Morriss-Kay, G.M. 2001. Derivation of the mammalian skull vault. Journal of Anatomy 199(1-2): 143-151.Myatt, J.P. Crompton, R.H. Susannah K. S. Thorpe, S.K.S. 2011. Hindlimb muscle architecture in non-human great apes and a comparison of methods for analysing inter-species variation. Journal of Anatomy 219(2): 150–166.
Nass, G. 1977. Intra-group variations in dental eruption sequence of Macacu fuscata fuscata. Folia Primatological 28(4): 306-314.
Newell-Morris, L. Tarrant, L.H. 1978. Ossification in the hand and foot of the macaque (Macaca nemestrina). American Journal of Physical Anthropology 48(4): 441-454.

230
Newell-Morris, L. Tarrant, L.H. Farenbach, C.E. Sackett, G.P. 1980. Ossification in the hand of the pigtail macaque (Macaca nemestrina) 2. Order of appearance of centers and variability in sequence. American Journal of Physical Anthropology 53(3): 423-439.Newman, M.T. 1953. The Application of Ecological Rules to the Racial Anthropology of the Aboriginal New World. American Anthropologist 55(3): 311–327.
Nilsson, O. Baron, J. 2004. Fundamental limits on longitudinal bone growth: growth plate senescence and epiphyseal fusion. Trends in Endocrinology and Metabolism. 15(8): 370-374.Nishida, T. Corp, N. Hamai, M. Hasegawa, M. Hiraiwa-Hasegawa, H. Hosaka, K. Hunt, K.D. Itoh, N. Kawanaka, K. Matsumoto-Oda, A. Mitani, J.G. Nakamura, M. Norikoshi, K. Sakamaki, T. Turner, L. Uehara, S. Zamma, K. 2003. Demography, female life history, and reproductive profiles among the chimpanzees of Mahale. American Journal of Primatology 59(3): 99–121.
Nissen, H.W. & Riesen, A.H. 1949a. Retardation in onset of ossification in chimpanzee related to various environmental and physiological factors. The Anatomical Record 105(4): 665-675.Nissen, H.W. & Riesen, A.H. 1949b. Onset of ossification in the epiphyses and short bones of the extremities in chimpanzee. Growth 13: 45-70.Nissen, H.W. Riesen, A.H. 1964. The eruption of the permanent dentition of chimpanzees. American Journal of Physical Anthropology 22(3): 285–294.
Noddle, B. 1974. Ages of epiphyseal closure in feral and domestic goats and ages of dental eruption. Journal of Archaeological Science 1(2): 195-204.Nonaka, K. Ichiki, A. Muira, T. 1990. Changes in the eruption order of the first permanent tooth and their relation to season of birth in Japan. American Journal of Physical Anthropology 82(2): 191-198.
Norman, G. 2010. Likert scales, levels of measurement and the “laws” of statistics. Advances in Health Sciences Education 15(5): 625-632.
Nunn, C. L. & Smith, K. K. 1998. Statistical analyses of developmental sequences: the craniofacial region in marsupial and placental mammals. The American Naturalist 152(1): 82–101.Nykänen, R. Espeland, L. Kvaal, S.I. Krogstad, O. 1998. Validity of the Demirjian method for dental age estimation when applied to Norwegian children. Acta Odontologica Scandinavica 56(4): 238-244.Ogden, J.A. 1979. The development and growth of the musculo-skeletal system. In: Scientific Basis of Orthopaedics (J.A. Albright and R. Brands Eds.) Appleton-Century-Crofts: New York pp.41-103.Ogden, J.A. Conlogue, G.J. Rhodin, A.G.J. 1981. Roentgenographic Indicators of Skeletal Maturity in Marine Mammals (Cetacea) Skeletal Radio1ogy 7(2): 119 123.Olze, A. Taniguchi, M. Schmeling, A. Zhu, B.L. Yamada, Y. Maeda, M. Geserick, G. 2004. Studies on the chronology of third molar mineralization in a Japanese population. Legal Medicine 6(2): 73-79.
Palmer, A.R. Strobeck, C. 1986. Fluctuating asymmetry: measurement, analysis, patterns. Annual Review of Ecology and Systematics 17: 391-421.

231
Palmer, A.R. Strobeck, C. 1992. Fluctuating assymetry as a measure of developmental stability: Impications of non-normal distributions and power of statistical tests. Acta Zoologica Fennica 191: 57-72.Parker, S.T. 1996. Using cladistic analysis of comparative data to reconstruct the evolution of cognitive development in hominids. In Martins, E. (ed.) Phylogenies and the Comparative Method in Animal Behavior. Oxford University Press: Oxford. pp. 433–448.
Pearson, O.M. 2000. Activity, climate, and postcranial robusticity. Current Anthropology 41(4): 569-607.
Penin, X. Berge, C. Baylac, M. 2002. Ontogenetic study of the skull in modern humans and the common chimpanzees: Neotenic hypothesis reconsidered with a tridimensional procrustes analysis. American Journal of Physical Anthropology 118(1): 50–62.
Persson, L. Kjell, L. De Roos, A. Gyllenberg, M. Christensen, B. 1998. Ontogenetic Scaling of Foraging Rates and the Dynamics of a Size-Structured Consumer-Resource Model. Theoretical Population Biology 54(3): 270-293.Phillips-Conroy, J. Jolly, C.J. 1988. Dental eruption schedules of wild and captive baboons. American Journal of Primatology 15(1): 17-29.
Prakash, S. Cameron, N. 1981. Skeletal maturity of well-off children in Chandigarh, North India. Annals of Human Biology 8(2): 175-180.Prakash, S. Pathamanathan, G. 1991. Tempo-unconditional 1-year bone score velocities in well-off north-west Indian children. Annals of Human Biology 18(4): 303-310.Prendergast Moore, K. Thorp, S. Van Gerven, D.P. 1986. Pattern of dental eruption, skeletal maturation and stress in a Medieval Population from Sudanese Nubia. Human Evolution 1(4): 325-330.Prieto, J.L. Barbería, E. Ortega, R. Magaña, C. 2005. Evaluation of chronological age based on third molar development in the Spanish population. International Journal of Legal Medicine 119(6): 349-354.
Pyle, S.I. and Hoerr, N.L. 1955. Radiographic Atlas of Skeletal Development of the Knee. C.C. Thomas: Springfield.Pyle, I. Sontag, L.W. 1943. Variability in the onset of ossification in the epiphyses and short bones of the extremities. American Journal of Roentgenology, Radium Therapy, and Nuclear Medicine 49: 795–798.Raaum, R.L. Sterner, K.N. Noviello, C.M. Stewart, C.B. Disotell, T.R. 2005. Catarrhine primate divergence dates estimated from complete mitochondrial genomes: concordance with fossil and nuclear DNA evidence. Journal of Human Evolution 48(3): 237-257.Rae, T.C. Koppe, T. Spoor, F. Benefit, B. McCrossin, M. 2002. Ancestral loss of the maxillary sinus in Old World monkeys and independent acquisition in Macaca. American Journal of Physical Anthropology 117(4): 293–296.
Ramirez Rozzi, F. Lacruz, R.S. 2007. Histological study of an upper incisor and molar of a bonobo (Pan paniscus) individual. In Dental Perspectives on Human Evolution: State of the Art Research in Dental Paleoanthropology. Bailey, S.E. Hublin, J.J. (eds.) Spring: Netherlands pp. 163-176.
Ravosa, M.J. Daniel, A.N. 2010. Ontogeny and phyletic size change in living and fossil lemurs. American Journal of Primatology 72(2): 161-172.

232
Reid, D.J. Dean, M.C. 2006. Variation in modern human enamel formation times. Journal of Human Evolution 50(3): 329–346
Reid, D.J. Schwartz, G.T. Chandrasekera, M.S. 1998. A histological reconstruction of dentaldevelopment in the common chimpanzee, Pan troglodytes. Journal of Human Evolution 35(4–5): 427-448.Rice, S.H. 1997. The analysis of ontogenetic trajectories: When a change in size or shape is not heterochrony. Proceedings of the National Academic of Sciences of the United States of America 94: 907-912.Richardson, M. K., Jeffery, J. E., Coates, M. I. Bininda-Emonds, O. R. P. 2001. Comparative methods in developmental biology. Zoology 104(3-4): 278–283.Richmond, B.G. Jungers, W.L. 1995. Size variation and sexual dimorphism in Australopithecus afarensis and living hominoids. Journal of Human Evolution 29(3): 229–245.Roberts, D.F. 1981. Genetics of growth. British Medical Bulletin 37: 239-246.Roche, A.F. 1992. Growth, Maturation and Body Composition The Fels Longitudinal Study (1929-1991) Cambridge University Press: Cambridge.Roth, V.L. 1984. How Elephants Grow: Heterochrony and the calibration of developmental stages in some living and fossil species. Journal of Vertebrate Paleontology 4(1): 126-145.Ruff, C.B. 1994. Morphological adaptation to climate in modern and fossil hominids. American Journal of Physical Anthropolology 37(S19): 65–107.
Ruff, C. 2002. Variation in Human Body Size and Shape. Annual Review of Anthropology 31: 211-232.Sadler, T.W. 2004. Langman’s medical embryology. 9th Edition. Lippincott Williams and Wilkins: London.Sahni, D. Jit, I. Sanjeev 1995. Time of fusion of epiphyses at the elbow and wrist joints in girls of Northwest India. Forensic Science International 74(1): 47-55.Salter, R.B. Harris, W.R. 1963. Injuries involving the Epiphyseal Plate. An Instructional Course Lecture, The American Academy of Orthopaedic Surgeons. The Journal of Bone and Joint Surgery 45(3):587-622.Sarringhaus, L.A. Stock, J.T. Marchant, L.F. McGrew, W.C. 2005. Bilateral asymmetry in the limb bones of the chimpanzee (Pan troglodytes). American Journal of Physical Anthropology 128(4): 840-845.
Scanes, C. G. 2011. Hormones and Growth in Domestic Animals. Comprehensive Physiology: 99–127.Schafer, J.L. 2000. Analysis of Incomplete Multivariate Data. Monographs on Statistics and Applied Probability 72. Chapman and Hall/CRC. London.Schaefer, M. 2008. A summary of epiphyseal union timings in Bosnian males. International Journal of Osteoarchaeology 18(5): 536-545.

233
Schaefer, M. Black, S. 2007. Epiphyseal Union Sequencing: Aiding in the Recognition and Sorting of Comingled Remains. Journal of Forensic Sciences 52(2): 277-285.Schaefer, M. Black, S. Scheuer, L. 2009. Juvenile Osteology: A Laboratory Field Manual. Academic Press. Amsterdam.Scheuer, L. Black, S.M. 2004. The Juvenile Skeleton. Elsevier Academic Press.Schmeling, A. Reisinger, W. Loreck, D. Vendura, K. Markus, W. Geserick, G. 2000. Effects of ethnicity on skeletal maturation: consequences for forensic age estimations. International Journal of Legal Medicine 113(5): 253-258.Schmeling, A. Schulz, R. Reisinger, W. Müher, M. Wernecke, K.D. 2004. Studies on the time frame for ossification of the medial clavicular epiphyseal cartilage in conventional radiography. International Journal of Legal Medicine 118(1):5-8.Schmidt-Nielsen, K. 1984. Scaling: why is animal size so important? Cambridge University Press: Cambridge.Schultz, A. 1935. Eruption and decay of the permanent teeth in primates. American Journal of Physical Anthropology 19(4): 489-581.
Schultz, A.H. 1940. Growth and development of the chimpanzee. Contributions to Embryology 28: 1–6 Carnegie Institution of Washington publication ; no. 518.Schultz, A.H. 1941. Growth and development of the orangutan. Contributions to Embryology Carnegie Institution 29: 57-110.Schultz, A.H. 1942. Growth and development of the proboscis monkey. Bulletin of the Museum Comparative Zoology 89: 279-323.Schultz, A.H. 1944. Age changes and variability in gibbons: a morphological study on a population sample of a manlike ape. American Journal of Physical Anthropology 2(1): 1-129.Schultz, A.H. 1960. Age changes in primates and their modification in man. In Tanner, J.M. (ed.): Human Growth. Pergamon, Oxford pp. 1–20.
Schwartz, G.T. Reid, D.J. Dean, C. Chandrasekera, M.S. 2000. Aspects of tooth crown development in common chimpanzees (Pan troglodytes) with a note on the possible role of sexual dimorphism in canine growth. Proceedings of 11th International Symposium on Dental Morphology, Oulu, Finland. pp. 323–337.Sciulli, P.W. 2007. Relative dental maturity and associated skeletal maturity in prehistoric native Americans of the Ohio valley area. American Journal of Physical Anthropology 132(4): 545–557
Shea, B.T. 1981. Relative growth of the limbs and trunk in the African apes. American Journal Physical Anthropology 56(2): 179-201.
Shea, B.T. 1983. Allometry and heterochrony in the African apes. American Journal of Physical Anthropology 62(3): 275–289.Shea, B.T. 1984. An Allometric Perspective on the Morphological and Evolutionary Relationships between Pygmy (Pan Paniscus) and Common (Pan troglodytes) Chimpanzees. In The Pygmy Chimpanzee: Evolutionary Biology and Behavior. Randall L. Susman ed. Plenum Press: New York pp.98-130.

234
Shea, B.T. 1985. The ontogeny of sexual dimorphism in the African apes. American Journal of Primatology 8(2): 183–188.Shea, B.T. 1989. Heterochrony in human evolution: The case for neoteny reconsidered. Yearbook of Physical Anthropology 32(S10): 69–101.
Shea, B.T. 1992. Developmental perspective on size change and allometry in evolution. Evolutionary Anthropology 1(4): 125–134.Shigehara, N. 1980. Epiphyseal union, tooth eruption, and sexual maturation in the common tree shrew with reference to its systematic problem. Primates 21(1):1-19.
Simpson, S.W. Kunos, C.A. 1998. A radiographic study of the development of the human mandibular dentition. Journal of Human Evolution 35(4-5): 479-505.
Simpson, S.W. Lovejoy, C.O. Meindl, R.S. 1992. Further evidence on relative dental maturation and somatic developmental rate in hominoids. American Journal of Physical Anthropology 87(1): 29-38.
Small, C.G. 1996. The Statistical Theory of Shape. Springer: New York p.4.Smart, J. L. 1977. Early life malnutrition and later learning ability: a critical analysis. In: Genetics, Environment and Intelligence. Oliviero, A. Ed. pp. 215-235. Elsevier: Amsterdam.Smart, J. L. 1986. Undernutrition, learning and memory: review of experimental studies. In: Proceedings of XIII International Congress of Nutrition. Taylor, T. G. and Jenkins, N. K. (eds.) John Libbey: London. pp. 74-78.Smirthwaite, J.J. Rundle, S.D. Bininda-Emonds, O.R.P Spicer, J.I. 2007. An integrative approach identifies developmental sequence heterochronies in freshwater basommatophoran snails. Evolution & Development 9(2): 122–130.
Smith, A.R. Butler, T.M. Pace, N. 1975. Weight growth of colony-reared chimpanzees. Folia Primatologica 24(1): 29-59.
Smith, B.H. 1991. Standards of human tooth formation and dental age assessment. In: Kelley, M.A. Spencer Larsen, C. (eds.) Advances in Dental Anthropology. Wiley-Liss: New York, pp. 143-168.Smith B.H. 1993. The physiological age of KNM-WT 15000. In: Walker A, Leakey R, editors. The Nariokotome Homo erectus skeleton. Cambridge, MA: Harvard University Press. pp 195–220.Smith, B,H, Crummett, T.L. Brandt, K.L. 1994. Ages of eruption of primate teeth: A compendium for aging individuals and comparing life histories. American Journal of Physical AnthropologySupplement: The American Journal of Physical Anthropology Yearbook Series 37(S19): 177–231.Smith, B.H. Garn, S.M. 1987. Polymorphisms in eruption sequence of permanent teeth in American children. American Journal of Physical Anthropology 74(3): 289–303.
Smith, B.H. Boesch, C. 2011. Mortality and the magnitude of the‘‘wild effect’’ in chimpanzee tooth emergence. Journal of Human Evolution 60(1): 34–46.
Smith, C.B. Garn, S.M. 1987. Polymorphisms in eruption sequence of permanent teeth of American Children. American Journal of Physical Anthropology 74(3): 289-303.
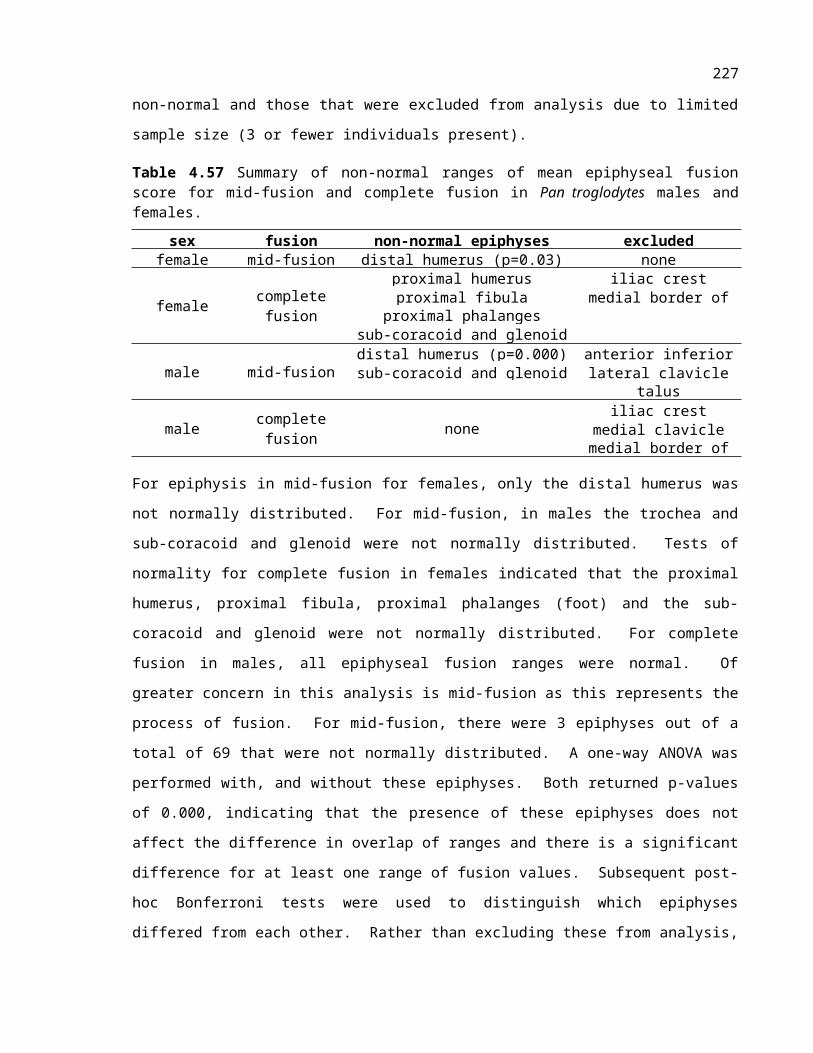
235
Smith, K.K. 1997. Comparative patterns of craniofacial development in eutherian and metatherian mammals. Evolution 51(5): 1663–1678.Smith, K. K. 2001. Heterochrony revisited: the evolution of developmental sequences. Biological Journal of the Linnean Society 73(2): 169–186.Smith, K. K. 2002. Sequence heterochrony and the evolution of development. Journal of Morphology 252(1): 82–97.Smith, S.L. 2004. Skeletal age, dental age, and the maturation of KNM-WT 15000. American Journal of Physical Anthropology 125(2): 105-120.Smith, S.L. Buschang, P.H. 2005. Longitudinal models of long bone growth during adolescence. American Journal of Human Biology 17(6): 731–745.
Smith, T.M. Reid, D.J. Dean, M.C. Olejniczak, A.J. Martin, L.B. 2007. Molar development in common chimpanzees (Pan troglodytes). Journal of Human Evolution 52(2): 201–216.
Smith, T.M. Smith, B.H. Reid, D.J. Siedel, H. Vigilant, L. Hublin, J.J. Boesch, C. 2010. Dental development of the Tai Forest chimpanzees revisited. Journal of Human Evolution 58(5):363-373.Smith, T.M. Machanda, Z. Bernard, A.B. Donovan, R.M. Papakyrikos, A.M. Muller, M.N. Wrangham, R. 2013. First molar eruption, weaning, and life history in living wild chimpanzees. Proceedings of the National Academy of Sciences of the United States of America 110(8): 2787-2791.
Smith, R.N. 1969. Fusion of Ossification Centres in the Cat. Journal of Small Animal Practice 10(9): 523-530.Stanford, C.B. 1999. The Hunting Apes: Meat Eating and the Origins of Human Behavior. Princeton University Press: New Jersey.Steele, J. Mays, S. 1995. Handedness and Directional Asymmetry in the Long Bones of the Human Upper Limb. International Journal of Osteoarchaeology 5(1): 39-49.
Stevens, D. Boyer, B. Bowen, C. Vaughan, A. 1999. Transplantation of Epiphyseal Plate Allografts Between Animals of Different Ages. Journal of Pediatric Orthopeadics 19(3): 398-403.Stevenson, P.H. 1924. Age order of epiphyseal fusion in man. American Journal of Physical Anthropology 7(1): 53-93.Stewart, T.D. 1934. Sequence of epiphyseal fusion, third molar eruption and suture closure in Eskimos and American Indians. American Journal of Physical Anthropology 19(3): 433-452.Stini, W.A. 1969. Nutritional stress and growth: Sex differences in adaptive response. American Journal of Physical Anthropology 31(3): 417-426.Stinson, S. 1985. Sex differences in Environmental Sensitivity During Growth. Yearbook of Physical Anthropology 28(S6): 123-147.Stout, S.D. Lueck, R. 1995. Bone remodeling rates and skeletal maturation in three archaeological skeletal populations. American Journal of Physical Anthropology 98(2): 161-171.Stumpf, R. 2007. Chimpanzees and Bonobos: Diversity within and Between Species. In Campbell, C. Fuentes, A. MacKinnon, K.L. Pagner, M. Bearder, S.K. (Eds.) Primates in Perspective. Oxford University Press: Oxford pp.132-344.

236
Sugiyama, Y. 1989. Population dynamics of chimpanzees at Bossou, Guinea. In Heltne, P.G. and Marquardt, L.G. eds. Understanding Chimpanzees. Harvard University Press: Cambridge pp.134-145.
Sugiyama, Y. 2004. Demographic parameters and life history of chimpanzees at Bossou, Guinea. American Journal of Physical Anthropology 124(2): 154-165.
Sullivan, E.G. Haugen, A.O. 1976. Age determination of foxes by x-ray of forefeet. Journal of Wildlife Management 20(2): 210.Sumner-Smith, G. 1966. Observations on Epiphyseal Fusion of the Canine Appendicular Skeleton. Journal of Small Animal Practice 7(4): 303-311.Surbey, M.K. 1990. Family composition, stress, and the timing of human menarche. In Ziegler, T. E. Bercovitch, F. B. (eds.). Socioendocrinology of primate reproduction. Monographs in primatology, Volume. 13. Wiley-Liss: New York pp. 11-32.
Susman, R.L. 1979. Comparative and functional morphology of hominoid fingers. American Journal of Physical Anthropology 50(2): 215-236.Swindler, D.R. Emel, L.M. Anemone, R.L. 1998. Dental Variability of the Liberian Chimpanzee, Pan troglodytes verus. Human Evolution 13(3-4):235-249.
Tanner, J.M. Whitehouse, R.H. Cameron, N. Marshall W.A. Healy, M.J.R. and Goldstein, H. 1983. Assessment of Skeletal Maturity and Prediction of Adult Height (TW2 Method), 2nd edition. Academic Press: London.Tanner, J.M. Whitehouse, R.H. Cameron, N. Marshall, W.A. Healy, M.J.R. Goldstein, N.H. 2001. Assessment of skeletal maturity and prediction of adult height (TW3 method). 3rd ed. WB Saunders: London.Tappan, N.C. Severson, A. 1971. Sequence of eruption of permanent teeth and epiphyseal union in new world monkeys. Folia Primatologica 15(3-4): 293-312.Teivens A, Mörnstad H. 2001a. A modification of the Demirjian method for age estimation in children. The Journal of Forensic Odonto-stomatology 19(2): 26-30.Teivens A, Mörnstad H. 2001b. A comparison between dental maturity rate in the Swedish and Korean populations using a modified Demirjian method. The Journal of Forensic Odonto-stomatology. 19(2): 31-35.Todd, T.W. 1930. The anatomical features of epiphyseal union. Child Development 1(3): 186-194.Toratora, G.J. and Anagnostakos, N.P. 1984. Principles of Anatomy. Fourth Edition. Harper and Row Publishers: New York. p. 127.Trivers, R.L. Willard, D.E. 1973. Natural Selection of Parental Ability to Vary the Sex Ratio of Offspring. Science 179(4068): 90-92.Ubelaker, D.H. 1987. Estimating age at death from immature human skeletons: An overview. Journal of Forensic Science 32(5): 1254-1263.Ubelaker, D.H. 1989. The estimation of age at death from immature human bone. In Age Markers in the Human Skeleton. Iscan, M.Y. (ed.) Charles C. Thomas: Springfield pp.55-70.Ungar, P.S. M’Kirera, F. 2003. A solution to the worn tooth conundrum in primate functional anatomy. Proceedings of the National Academy of Sciences of the United States of America 100(7): 3874-3877.

237
Velhagen,W. A. 1997. Analyzing developmental sequences using sequence units. Systematic Biology 46:1: 204–210.Vrba, E.S. 1996. Climate, heterochrony, and human evolution. Journal of Anthropological Research 52(1): 1–28.
Wagenen, G. van Asling, C.W. 1958. Roentgenographic estimation of bone age in the rhesus monkey (Macaca mulatta). American Journal of Anatomy 103(2): 163-185.Walker, D.N. 1987. Sequence of epiphyseal fusion in the Rocky Mountain Bighorn Sheep. Western North American Naturalist 47(1): 7-12.Walker, A. Leakey, R. 1993. The Nariokotome Homo Erectus Skeleton. Springer-Verlag: Berlin. p. 235.Wang, J. Zhou, J. Bondy, C.A. 1999. Igf1 promotes longitudinal bone growth by insulin-like actions augmenting chondrocyte hypertrophy. Federation of American Societies for Experimental Biology 13(14):1985-1990.
Watts, E.S. 1971. A comparative study of skeletal maturation in the chimpanzee and rhesus monkey and its relationship to growth and sexual maturity. Ph.D. thesis, University of Pennsylvania, Philadelphia PA.Watts, E.S. 1982. Postnatal growth of nonhuman primates: the problem of adolescent spurt. Human Biology 54(1): 53-70.Watts, E.S. 1985. Adolescent growth and development of monkeys, apes and humans. In: Watts, E.S. (ed.) Nonhuman primate models for human growth and development. Liss: New York. pp.41-65.Watts, E.S. Gavan, J.A. 1982. Postnatal growth of nonhuman primates: The problem of the adolescent spurt. Human Biology 54(1): 53–70.Webb, P.A.O. Suchey, J.M. 1985. Epiphyseal fusion of the anterior iliac crest and the medial clavicle in a modern sample of American males and females. American Journal of Physical Anthropology 68(4): 457-466.Weaver, T.D. Steudel-Numbers, K. 2005. Does climate or mobility explain the differences in body proportions between Neandertals and their Upper Paleolithic successors? Evolutionary Anthropology 14(6): 218-223.
Weise, M. De-Levi, S. Barnes, K.M. Gafni, R.I. Abad, V. Baron, J. 2001. Effects of estrogen on growth plate senescence and epiphyseal fusion. Proceedings of the National Academy of Sciences of the United States of America 98(12): 6871–6876.Wells, J.C.K. 2000. Natural Selection and Sex Differences in Morbidity and Mortality in Early Life. Journal of Theoretical Biology 202(1): 65-76.White, T. 2000. Human Osteology, 2nd Edition. Academic Press: San Diego.Winkler, L.A. 1996. Appearance of Ossification Centers of the Lower Arm, Wrist, Lower Leg, and Ankle in Immature Orangutans and Chimpanzees With an Assessment of the Relationship of Ossification to Dental Development. American Journal of Physical Anthropology 99(1): 191-203.Wintheiser, J.G. Clauser, D.A. Tappen, N.C. 1977. Sequence of Eruption of Permanent Teeth and Epiphyseal Union in Three Species of African Monkeys. Folia Primatologica 27(3): 178-197.

238
Witschi, E. 1962. Development: rat. In: Altman PL, Dittmer DS, editors. Growth Including Reproductive and Morphological Development. Biological Handbooks of the Federation of American Societies for Experimental Biology: Washington. pp 302–314.Ye, Y. Wang, C. Cao, L. 1992. Skeletal maturity of the hand and wrist in Chinese children in Changsha assessed by TW2 method. Annals of Human Biology 19(4): 427-430.Yu, N. Jensen-Seaman, M.I. Chemnick, L. Kidd, J.R. Deinard, A.S. Ryder, O. Kidd, K.K. Li, W.H. 2003. Low nucleotide diversity in chimpanzees and bonobos. Genetics 164(4): 1511-1518.Zihlman, A. 1984. Body Build and Tissue Composition in Pan paniscus and Pan troglodytes, with Comparisons to Other Hominoids. Susman, R.L. (ed.) The Pygmy Chimpanzee. Springer: Netherlands. pp. 179-200.
Zihlman, A. Bolter, D. & Boesch, C. 2004. Wild chimpanzee dentition and its implications for assessing life history in immature hominin fossils. Proceedings of the National Academy of Sciences of the United States of America 101(29), 10541-10543.Zihlman, A. Bolter, D. Boesch, C. 2007. Skeletal and dental growth and development in chimpanzees of the Tai National Park, Cote D’ivoire. Journal of Zoology 273(1): 63-73.Zhilman A.L, & Cramer, D.L. 1978. Skeletal differences between pygmy (Pan paniscus) and common (Pan troglodytes) chimpanzees. Folia Primatologica 29(2): 86-94.Zihlman, A.L. Morbeck, M.E. Goodall, J. 1990. Skeletal biology and individual life history of Gombe chimpanzees. Journal of Zoology 221(1): 37–61.
Zuck, T.T. 1938. The age order of epiphyseal union in the guinea pig. The Anatomical Record 70(4): 389–399.

239
Appendix
8.1 Demographic data
The following tables present location data for the specimens used in this study as discussed in Chapter
3, section 3.1.3.
: Reported locations for wild specimens at the Museum of Central Africa.
Pan troglodytes schweinfurthii Pan paniscuslocation N location N? Epulu 1 ? Ibembo 1
? Stanleyville 1 Basankusu 1
Andudu (Uelé) 1 Batiakayandja, 18 km S.S.W. Ponthierville 2
Bafwanaubo (Ituri bos) 1 Batiamoyowa, 35 km S.S.W. Ponthierville 4
Bururi (Burundi) 1 Biondo, 30 km W. Ponthierville 2Buta 4 Bore, 13 km S.S.W. Ponthierville 1
Congo 1 Coquilhatville 3Epulu 1 Djolu 5
Epulu, terr. Mambasa 1 Dongo, 15 km S.E. Yahuma 3
Kilo 1 Dongo, Oshwe 50 km S. Dekese (Kasai) 1
Lugundu (Nyunzu) 1 Lingomo (Ikela), alt: 350 m 1Mawambi 3 Lulongo district (Mompono) 1
Moba 1 Stanleyville left bank 1
Muma (Prov. Uelé) terr. Abandia 1 Wamba (35 km E. Balangala, terr. Basankusu) 3
Poko 1 unspecified Panregion Bafwasende 2 location N
region Lubongola Chefferie Warega 1 Yahuma, terr. Yahuma 1
Stanley Falls 1 Pan troglodytes troglodytesStanleyville 1 location N
Ubangi 1 Mayumbe 2Unaputi 3

240
: Locations from which Pan troglodytes troglodytes specimens were collected at the Powell-Cotton Museum.
location NBatouri District/Cameroon 4
Beri/Batouri District/Cameroon 1Between Batouri-Lomie/Cameroon 3
Bipindi District/Cameroon 1Ebobonku/Nsang Melima/Cameroon 2Kanyol/Batouri District/Cameroon 1
Kuambo/Bipindi-Kribi Rd/Cameroon 1Lelo/Batouri District/Cameroon 5
Lolodorf-Mbalemajo Rd/Cameroon 1Meyoss/Batouri District/Cameroon 9
Mifiaberg/Bipindi District/Cameroon 1Ndinga/Batouri District/Cameroon 2
Ndokofass/NE of Yabassi/Cameroon 1Obala/Batouri District/Cameroon 31
Olangina/Cameroon 1River Sassa/SE L.Albert/Congo 1
S of Yaounde/Cameroon 4: Provenience for specimens from the University of Zurich and re-classification.
location N sub-species re-classificationunknown 38 nonecaptive 1 none
captive animal from Liberia 1 noneEast Africa 1 none
Equatorial Guinea 2 Pan troglodytes troglodytesLiberia 1 Pan troglodytes verusNigeria 1 Pan troglodytes vellerosus
Sierra Leone, West Africa 1 Pan troglodytes verus

241
8.2 Outputs from Imputation Analysis
8.2.1 Pan paniscus combined-sex analysis of patterns
Presented here is an analysis of missing tooth data used for multiple imputation as discussed in Chapter 3, section 3.3.3. Imputation was calculated using logistic regression. Imputation iteration data available in section 8.1 of the digital appendix. Missing value summaries (Figures 8.1, 8.3, 8.5) provides data for the number of missing cases (individuals) and vales (teeth) used for imputation analysis. Figures 8.2, 8.4 and 8.6 are plots representing the most common patterns of missing tooth entries. The most common patterns are listed in descending order from top to bottom.
Figure 8.1 Summary of missing values for Pan paniscus combined sex multiple imputation
Table 8.4 Variable summary for missing tooth data in Pan paniscus combined sex multiple imputation.
tooth missing valid NN percent
MDL1P4 67 73.60% 24MDR1M3 67 73.60% 24MDR1I1 67 73.60% 24MDL1M3 65 71.40% 26MDL1P3 65 71.40% 26MDL1I1 65 71.40% 26
MDR1M1 65 71.40% 26MDR1M2 64 70.30% 27MDR1I2 64 70.30% 27MDL1M1 62 68.10% 29MDL1C 62 68.10% 29
MDL1M2 61 67.00% 30MDL1I2 61 67.00% 30MDR1P3 61 67.00% 30MDR1P4 60 65.90% 31MDR1C 60 65.90% 31

242
Figure 8.2 Missing value patterns for Pan paniscus combined sex multiple imputation.
8.2.2 Pan troglodytes females analysis of patterns
Figure 8.3 Summary of missing values for Pan troglodytes females multiple imputation

243
Table 8.5 Variable summary for missing tooth data in Pan troglodytes females multiple imputation.
toothmissing
valid NN percent
MDL2M3 23 25.30% 68MDR2M
3 17 18.70% 74
MDL2I1 13 14.30% 78MDR2I1 12 13.20% 79MDL2P3 11 12.10% 80MDL2M2 10 11.00% 81MDL2P4 10 11.00% 81MDL2I2 10 11.00% 81MDR2M
2 10 11.00% 81
a. Maximum number of variables shown: 25b. Minimum percentage of missing values for variable to be included: 10.0%

244
8.2.3 Pan troglodytes males analysis of patterns
Figure 8.4 Summary of missing values for Pan troglodytes males multiple imputation
Table 8.6 Variable summary for missing tooth data in Pan troglodytes males multiple imputation.
toothmissing
valid NN percent
MDR2M3 38 44.20% 48MDL2M3 35 40.70% 51MDR2I1 34 39.50% 52
MDR2M1 32 37.20% 54MDR2P3 32 37.20% 54MDR2M2 31 36.00% 55MDR2P4 31 36.00% 55MDR2I2 31 36.00% 55MDL2P3 30 34.90% 56MDL2I1 30 34.90% 56MDR2C 30 34.90% 56
MDL2M1 29 33.70% 57MDL2M2 28 32.60% 58MDL2P4 28 32.60% 58MDL2C 27 31.40% 59MDL2I2 27 31.40% 59
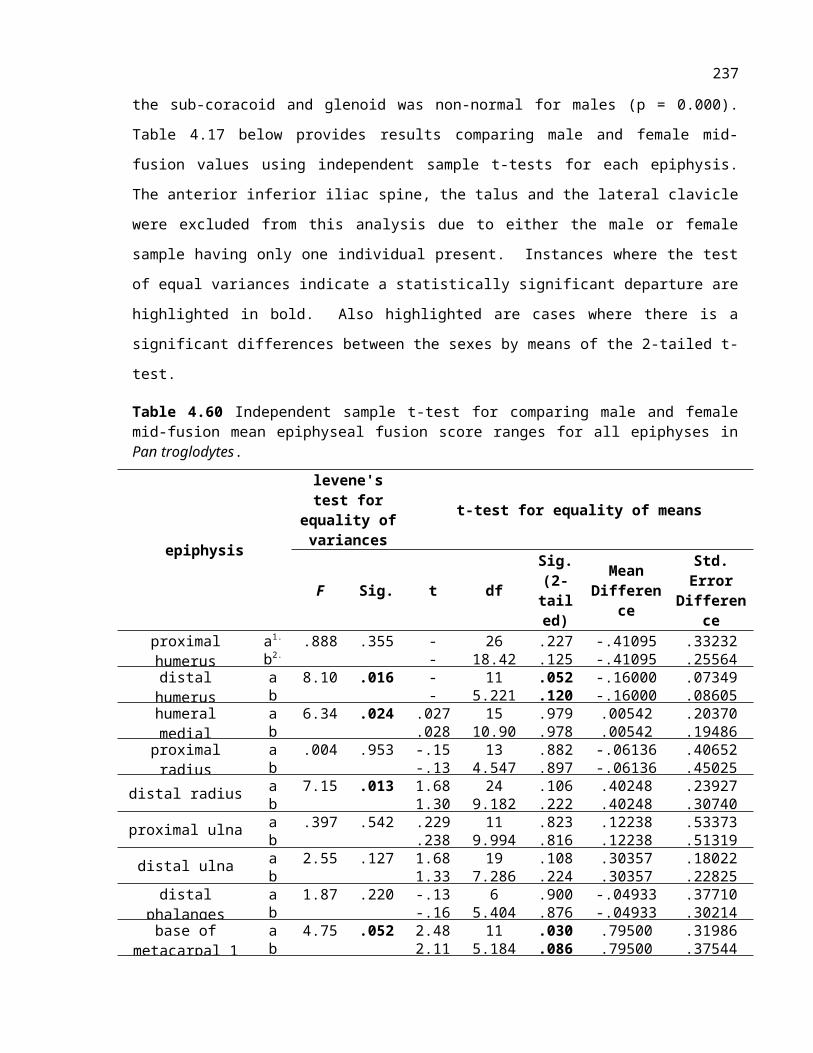
245
Figure 8.5 Missing value patterns for Pan troglodytes males multiple imputation

246
8.3 Linear regression for long-bone length as plotted against dental scoreThese data represent outputs from linear regression analysis considering the relationship between long-bone length and dental score as analysed in Chapter 4, section 4.1.1. Regression equations are presented in the text for section 4.1.1 These tables provide r-square values, ANOVA outputs and regression coefficients from the analysis.
Table 8.7 Regression outputs for linear regression analysis of long-bone length plotted against dental score.
species bone R R2 adjusted R2
std. error of the
estimate
Durbin-Watson
Pan troglodytes females
humerus 0.93 0.866 0.864 5.5815 1.576radius 0.917 0.84 0.838 16.7815 1.959ulna 0.898 0.807 0.803 16.3876 2.441
femur 0.926 0.857 0.855 19.2221 1.674tibia 0.926 0.857 0.855 16.7748 1.741
fibula 0.868 0.753 0.749 15.0836 1.922
Pan troglodytes males
humerus 0.875 0.766 0.761 22.8207 1.705radius 0.933 0.87 0.867 16.0328 1.865ulna 0.956 0.915 0.911 15.6222 1.811
femur 0.951 0.904 0.903 15.4383 1.962
tibia 0.941 0.886 0.884 14.3676 2.026fibula 0.952 0.906 0.904 11.1698 2.082
Table 8.8 Pan troglodytes females linear regression ANOVA outputs for all long-bones as plotted against dental score.
bone model sum of squares df mean square F sig.
humerusregression 15867.07 1 15867.07 509.324 0.000residual 2461.102 79 31.153
total 18328.173 80
radiusregression 106745.598 1 106745.598 379.043 0.000residual 20276.527 72 281.618
total 127022.125 73
ulnaregression 58379.325 1 58379.325 217.386 0.000residual 13964.698 52 268.552
total 72344.023 53
femurregression 176650.194 1 176650.194 478.091 0.000residual 29559.245 80 369.491
total 206209.439 81
tibiaregression 132829.062 1 132829.062 472.042 0.000residual 22229.994 79 281.392
total 155059.056 80
fibularegression 43670.026 1 43670.026 191.943 0.000residual 14333.459 63 227.515
total 58003.485 64

247
Table 8.9 Pan troglodytes males linear regression ANOVA outputs for all long-bones as plotted against dental score.
bone model sum of squares df mean
square F sig.
humerus
regression
83451.57 1 83451.5
7160.24
3 0.000
residual 25518.36 49 520.783
total 108969.9 50
radius
regression
80946.75 1 80946.7
5314.90
8 0.000
residual 12081.31 47 257.049
total 93028.06 48
ulna
regression
60063.74 1 60063.7
4246.10
8 0.000
residual 5613.257 23 244.055
total 65677 24
femur
regression
119512.8 1 119512.
8501.43
6 0.000
residual 12632.08 53 238.341
total 132144.8 54
tibia
regression
83537.95 1 83537.9
5404.68
3 0.000
residual 10734.26 52 206.428
total 94272.21 53
fibula
regression
45765.35 1 45765.3
5366.81
4 0.000
residual 4741.05 38 124.764total 50506.4 39
Table 8.10 Coefficients of linear regression analysis of long-bones as plotted against dental score for Pan troglodytes females.
bone modelunstandardized
Coefficientsstandardize
d t significanceB std. error Beta
humerus
constant -16.47(B1) 3.624927 -4.54623 0.000dental score
0.2659 (B2) 0.014876 0.921215 17.87679
0.000
radiusconstant 82.935(B1) 8.138 10.191 0.000dental score
2.882(B2) 0.148 0.917 19.469 0.000
ulnaconstant 91.52(B1) 11.971 7.646 0.000dental score
3.007(B2) 0.204 0.898 14.744 0.000femur constant 88.54(B1) 7.676 11.535 0.000

248
dental score
3.141(B2) 0.144 0.926 21.865 0.000
tibiaconstant 70.27(B1) 6.7 10.488 0.000dental score
2.724(B2) 0.125 0.926 21.727 0.000
fibulaconstant 77.61(B1) 9.241 8.399 0.000dental score
2.244(B2) 0.162 0.868 13.854 0.000Note: B1 is the y intercept and B2 the slope for the regression equation.

249
Table 8.11 Coefficients of linear regression analysis of long-bones as plotted against dental score for Pan troglodytes males.
bone modelunstandardized
Coefficientsstandardized Coefficients t significance
B std. error Betahumeru
sconstant 95.822(B1) 11.308 8.474 0.000dental score
2.901(B2) 0.229 0.875 12.659 0.000
radiusconstant 77.365(B1) 8.209 9.425 0.000dental score
2.948(B2) 0.166 0.933 17.746 0.000
ulnaconstant 79.1(B1) 10.954 7.221 0.000dental score
3.184(B2) 0.203 0.956 15.688 0.000
femurconstant 80.171(B1) 7.026 11.41 0.000dental score
3.25(B2) 0.145 0.951 22.393 0.000
tibiaconstant 61.505(B1) 6.861 8.964 0.000dental score
2.828(B2) 0.141 0.941 20.117 0.000
fibulaconstant 53.522(B1) 7.086 7.553 0.000dental score
2.597(B2) 0.136 0.952 19.152 0.000Note: B1 is the y intercept and B2 the slope for the regression equation.

250
8.4 Descriptive statistics for mid-fusion and complete fusion relative to dental score
The following tables present descriptive statistics for ranges of dental scores at mid-fusion and complete fusion for all epiphyseal fusion sites as analysed in Chapter 4, section 4.2.1. The production of these was for the purposes of comparing dental development and skeletal fusion. These tables were those referred to but not presented in the text.
Table 8.12 Median values and ranges of dental score for all mid-fusion epiphyses in Pan troglodytes males.
skeletal region epiphyseal fusion site N
median minimum dental score
maximum dental score
dental score
upper limb
proximal humerus 7 63 60 64distal humerus 5 58 43 60
humeral medial epicondyle 7 60 55 61proximal radius 3 61 55 64
distal radius 8 63 55 64proximal ulna 6 60.5 55 64
distal ulna 6 63 60 64
hand
distal phalanges (hand) 2 56.5 55 58base of metacarpal 1 2 58 55 61
proximal and middle phalanges (hand) 5 61 55 63
metacarpal heads 2-5 2 62 61 63
lower limb
femoral head 4 60 55 64greater trochanter 1 61 61 61lesser trochanter 3 58 55 61
distal femur 7 62 59 64proximal tibia 7 62 55 64
distal tibia 6 61 55 64proximal fibula 5 63 60 64
distal fibula 7 60 55 64
foot
calcaneus 3 60 55 61talus 0
distal phalanges (foot) 2 58 55 61middle phalanges (foot) 3 59 55 61metatarsal heads (2-5) 2 62 61 63base of metatarsal 1 2 60 59 61
proximal phalanges (foot) 2 60 59 61
pelvis
triradiate 8 60 31 61anterior inferior iliac spine 1 55 55 55
iliac crest 5 64 63 64ischial epiphysis 4 62.5 60 64
clavicle medial clavicle 4 64 63 64lateral clavicle 1 50 50 50
scapula
coracoid 6 60 58 61sub-coracoid and glenoid 7 58 13 61
acromium 2 60 60 60medial border 4 64 63 64

251
Table 8.13 Median values and ranges of dental score for all complete fusion epiphyses in Pan troglodytes males.
skeletal region epiphyseal fusion site N
median minimum dental score
maximum dental score
dental score
upper limb
proximal humerus 3 64 64 64distal humerus 18 61.5 55 64
humeral medial epicondyle 13 63 59 64proximal radius 10 63 60 64
distal radius 3 64 64 64proximal ulna 12 63 59 64
distal ulna 4 64 63 64
hand
distal phalanges (hand) 5 63 59 64base of metacarpal 1 10 63.5 59 64
proximal and middle phalanges (hand) 8 64 62 64
metacarpal heads 2-5 8 64 62 64
lower limb
femoral head 10 63 60 64greater trochanter 12 63 59 64lesser trochanter 12 63 59 64
distal femur 5 64 63 64proximal tibia 5 64 63 64
distal tibia 6 64 63 64proximal fibula 6 64 62 64
distal fibula 6 64 62 64
foot
calcaneus 11 63 59 64talus 21 61 43 64
distal phalanges (foot) 9 63 59 64middle phalanges (foot) 8 63.5 62 64metatarsal heads (2-5) 7 64 62 64base of metatarsal 1 9 64 62 64
proximal phalanges (foot) 8 64 63 64
pelvis
triradiate 13 63 58 64anterior inferior iliac spine 6 64 63 64
iliac crest 1 64 64 64ischial epiphysis 5 64 63 64
claviclemedial clavicle 1 64 64 64lateral clavicle 9 63 58 64
scapula
coracoid 14 63 55 64sub-coracoid and glenoid 14 63 59 64
acromium 6 64 63 64medial border 1 64 64 64

252
Table 8.14 Median values and ranges of dental score for all mid-fusion epiphyses in Pan paniscus females.
skeletal region epiphyseal fusion site N
median minimum dental score
maximum dental score
dental score
upper limb
proximal humerus 0 - - -distal humerus 1 53 53 53
humeral medial epicondyle 3 53 51 62proximal radius 1 64 64 64
distal radius 4 64 62 64proximal ulna 2 57.5 53 62
distal ulna 3 64 64 64
hand
distal phalanges (hand) 2 53 53 53base of metacarpal 1 1 53 53 53
proximal and middle phalanges (hand) 2 53 53 53
metacarpal heads 2-5 0 - - -
lower limb
femoral head 1 60 60 60greater trochanter 1 60 60 60lesser trochanter 0 - - -
distal femur 1 64 64 64proximal tibia 1 64 64 64
distal tibia 0 - - -proximal fibula 2 64 64 64
distal fibula 0 - - -
foot
calcaneus 1 62 62 62talus 0 - - -
distal phalanges (foot) 2 52 51 53middle phalanges (foot) 2 52 51 53metatarsal heads (2-5) 2 52 51 53base of metatarsal 1 0 - - -
proximal phalanges (foot) 0 - - -
pelvis
triradiate 2 57.5 53 62anterior inferior iliac spine 0 - - -
iliac crest 3 64 51 64ischial epiphysis 1 64 64 64
claviclemedial clavicle 0 - - -lateral clavicle 0 - - -
scapula
coracoid 3 53 51 62sub-coracoid and glenoid 3 53 51 62
acromium 2 64 64 64medial border 1 64 64 64

253
Table 8.15 Median values and ranges of dental score for all complete fusion epiphyses in Pan paniscus females.
skeletal region epiphyseal fusion site N
mediandental score
minimum dental score
maximum dental score
upper limb
proximal humerus 3 64 62 64distal humerus 7 62 51 64
humeral medial epicondyle 4 64 62 64proximal radius 3 64 62 64
distal radius 0 - - -proximal ulna 5 64 51 64
distal ulna 1 62 62 62
hand
distal phalanges (hand) 4 64 62 64base of metacarpal 1 3 64 62 64
proximal and middle phalanges (hand) 4 64 62 64
metacarpal heads 2-5 4 64 62 64
lower limb
femoral head 3 64 64 64greater trochanter 3 64 64 64lesser trochanter 4 64 60 64
distal femur 2 64 64 64proximal tibia 2 64 64 64
distal tibia 3 64 64 64proximal fibula 0 - - -
distal fibula 2 64 64 64
foot
calcaneus 3 64 64 64talus 5 64 53 64
distal phalanges (foot) 3 64 64 64middle phalanges (foot) 3 64 64 64metatarsal heads (2-5) 3 64 64 64base of metatarsal 1 3 64 64 64
proximal phalanges (foot) 3 64 64 64
pelvis
triradiate 5 61 60 64anterior inferior iliac spine 3 64 51 64
iliac crest 0 - - -ischial epiphysis 0 - - -
claviclemedial clavicle 1 62 62 62lateral clavicle 3 64 62 64
scapula
coracoid 4 64 62 64sub-coracoid and glenoid 4 64 62 64
acromium 2 63 62 64medial border 1 62 62 62

254
Table 8.16 Median values and ranges of dental score for all mid-fusion epiphyses in Pan paniscus males.
skeletal region epiphyseal fusion site N
median minimum dental score
maximum dental score
dental score
upper limb
proximal humerus 3 64 61 64distal humerus 5 59 47 64
humeral medial epicondyle 5 60 54 61proximal radius 5 60 54 61
distal radius 0 - - -proximal ulna 1 47 47 47
distal ulna 0 - - -
hand
distal phalanges (hand) 2 46 45 47base of metacarpal 1 2 50.5 47 54
proximal and middle phalanges (hand) 3 54 47 60
metacarpal heads 2-5 5 60 47 64
lower limb
femoral head 6 60.5 59 64greater trochanter 3 60 54 60lesser trochanter 2 59.5 59 60
distal femur 1 64 64 64proximal tibia 1 60 60 60
distal tibia 0 - - -proximal fibula 0 - - -
distal fibula 2 57.5 54 61
foot
calcaneus 2 53.5 47 60talus 0 - - -
distal phalanges (foot) 2 57 54 60middle phalanges (foot) 2 57 54 60metatarsal heads (2-5) 2 57 54 60base of metatarsal 1 4 57 47 61
proximal phalanges (foot) 4 57 47 61
pelvis
triradiate 4 56.5 47 60anterior inferior iliac spine 0 - - -
iliac crest 1 64 64 64ischial epiphysis 4 61 60 64
claviclemedial clavicle 1 54 54 54lateral clavicle 0 - - -
scapula
coracoid 1 54 54 54sub-coracoid and glenoid 3 59 54 60
acromium 0 - - -medial border 1 64 64 64

255
Table 8.17 Median values and ranges of dental score for all complete fusion epiphyses in Pan paniscus males.
skeletal region epiphyseal fusion site N
mediandental score
minimum dental score
maximum dental score
upper limb
proximal humerus 0 - - -distal humerus 7 60 47 64
humeral medial epicondyle 2 60.5 60 61proximal radius 2 64 64 64
distal radius 2 64 64 64proximal ulna 7 60 54 64
distal ulna 2 64 64 64
hand
distal phalanges (hand) 4 62.5 54 64base of metacarpal 1 1 64 64 64
proximal and middle phalanges (hand) 3 64 61 64
metacarpal heads 2-5 2 64 64 64
lower limb
femoral head 1 61 61 61greater trochanter 3 64 61 64lesser trochanter 5 61 54 64
distal femur 1 64 64 64proximal tibia 2 64 64 64
distal tibia 2 64 64 64proximal fibula 2 64 64 64
distal fibula 2 64 64 64
foot
calcaneus 5 61 54 64talus 9 60 47 64
distal phalanges (foot) 3 64 61 64middle phalanges (foot) 3 64 61 64metatarsal heads (2-5) 3 64 61 64base of metatarsal 1 2 64 64 64
proximal phalanges (foot) 2 64 64 64
pelvis
triradiate 5 61 60 64anterior inferior iliac spine 6 61 59 64
iliac crest 0 - - -ischial epiphysis 0 - - -
claviclemedial clavicle 2 64 64 64lateral clavicle 2 59 54 64
scapula
coracoid 6 60.5 59 64sub-coracoid and glenoid 4 62.5 60 64
acromium 2 64 64 64medial border 1 64 64 64

256
Table 8.18 Mid-fusion and complete fusion median, 25th and 75th percentile dental score values for Pan troglodytes males.
epiphysismid-fusion complete fusion
median 25th percentile
75th percentile median 25th
percentile75th
percentileproximal humerus 63 60 63 64.9 64.3 -
distal humerus 58 44.5 60 61.5 60 64.075humeral medial epicondyle 60 58 61 63 60.5 64.45
proximal radius 61 55 - 63 61.5 64.675distal radius 63 60.5 63.75 64.9 64.6 -
proximal ulna 60.5 57.25 61.825 63 60.25 64.45distal ulna 63 61.5 64.075 64.75 63.4 65.125
distal phalanges (hand) 56.5 55 - 63 60 65.05base of metacarpal 1 58 55 - 63.5 62.75 64.675proximal and middle
phalanges (hand) 61 57.5 62 64.15 63 64.825
metacarpals heads 2-5 62 61 - 64.15 63 64.825femoral head 60 56 63.25 63 61.5 64.675
greater trochanter 60 59 - 63 62 64.6lesser trochanter 58 55 - 63 60.5 64.525
distal femur 62 60 63 64.6 63.65 65.05proximal tibia 62 60 63 64.6 63.65 65.05
distal tibia 62 60 63 64.6 63.65 65.05proximal fibula 62.5 60 63.25 64.6 63.65 65.05
distal fibula 61 59.25 63 64.6 63.65 65.05calcaneus 60 55 - 63 62 64.6
talus - - - 61 58.5 63.5distal phalanges (foot) 58 55 - 63 62.5 64.75
middle phalanges (foot) 59 55 - 63.5 63 64.825metatarsal heads 2-5 62 61 - 64 63 64.9base of metatarsal 1 60 59 - 64 63 64.75
proximal phalanges (foot) 60 59 - 64.15 63 64.825triradiate 60 46.75 61 63 60 64.45
anterior inferior iliac spine 55 55 55 64.45 63.75 64.975iliac crest 64.6 63 65.05 64.3 64.3 64.3
ischial epiphysis 62.5 60.5 63.75 64.6 63 65.05medial clavicle 64.3 63.25 64.825 65.2 65.2 65.2lateral clavicle 50 50 50 63 59 64.75
coracoid 60 59 61 63 60.5 64.45sub-coracoid and glenoid 59 37.5 60.5 63 61.25 64.525
acromium 60 60 60 64.45 63 64.975medial border of scapula 64.6 63.325 65.125 64.6 64.6 64.6

257
Table 8.19 Mid-fusion and complete fusion median, 25th and 75th percentile dental score values for Pan paniscus females.
epiphysismid-fusion complete fusion
median 25th percentile
75th percentile median 25th
percentile75th
percentileproximal humerus - - - 64.6 62 -
distal humerus 53 53 53 62 53 64.6humeral medial epicondyle 57.5 53 - 64.3 62.5 65.05
proximal radius 64 64 64 64.6 62 -distal radius 64.3 62.5 65.05 - - -
proximal ulna 57.5 53 - 64 56.5 64.9distal ulna 64.6 64 - 62 62 62
distal phalanges (hand) 53 53 53 64.3 62.5 65.05base of metacarpal 1 53 53 53 64 62 -
proximal and middle phalanges (hand) 53 53 53 64.3 62.5 65.05
metacarpals heads 2-5 - - - 64.3 62.5 65.05femoral head 61 60 - 64.6 64 -
greater trochanter 60 60 60 64.3 62.5 65.05lesser trochanter - - - 64 61 64.9
distal femur 64.6 64 - 63.3 62 -proximal tibia 64 64 64 64.6 62 -
distal tibia - - - 64.3 62.5 65.05proximal fibula 64.3 64 - 62 62 62
distal fibula - - - 64 62 -calcaneus 62 62 62 64.3 62.5 65.05
talus - - - 62 53 64.6distal phalanges (foot) 53 53 53 64.3 62.5 65.05
middle phalanges (foot) 53 53 53 64.3 62.5 65.05metatarsal heads 2-5 53 53 53 64.3 62.5 65.05base of metatarsal 1 - - - 64.3 62.5 65.05
proximal phalanges (foot) - - - 64.3 62.5 65.05triradiate 57.5 53 - 64 56.5 64.9
anterior inferior iliac spine - - - 64 56.5 64.9iliac crest 56.5 51 - - - -
ischial epiphysis 64 64 64 63.3 53.75 65.05medial clavicle - - - 62 62 62lateral clavicle - - - 64 62 -
coracoid 53 51 - 64.3 62.5 65.05sub-coracoid and glenoid 53 51 - 64.3 62.5 65.05
acromium 64.6 64 - 63.3 62 -medial border of scapula 64 64 64 62 62 62

258
Table 8.20 Mid-fusion and complete fusion median, 25th and 75th percentile dental score values for Pan paniscus males.
epiphysismid-fusion complete fusion
median 25th percentile
75th percentile median 25th
percentile75th
percentileproximal humerus 64 61 - 64.9 64.3 -
distal humerus - - - 61.5 60 64.075humeral medial epicondyle 59 50.5 62.3 63 60.5 64.45
proximal radius 60 56.5 60.5 63 61.5 64.675distal radius - - - 64.9 64.6 -
proximal ulna 47 47 47 63 60.25 64.45distal ulna - - - 64.75 63.4 65.125
distal phalanges (hand) 46 45 - 63 60 65.05base of metacarpal 1 50.5 47 - 63.5 62.75 64.675proximal and middle
phalanges (hand) 54 47 - 64.15 63 64.825
metacarpals heads 2-5 57 48.75 60.75 64.15 63 64.825femoral head 60.5 59.75 64.15 63 61.5 64.675
greater trochanter 60 54 - 63 62 64.6lesser trochanter 59.5 59 - 63 60.5 64.525
distal femur 64.3 64 - 64.6 63.65 65.05proximal tibia 60 60 60 64.6 63.65 65.05
distal tibia - - - 64.6 63.65 65.05proximal fibula 64.6 64.6 64.6 64.6 63.65 65.05
distal fibula 57.5 54 - 64.6 63.65 65.05calcaneus 53.5 47 - 63 62 64.6
talus - - - 61 58.5 63.5distal phalanges (foot) 57 54 - 63 62.5 64.75
middle phalanges (foot) 57 54 - 63.5 63 64.825metatarsal heads 2-5 57 54 - 64 63 64.9base of metatarsal 1 57 48.75 60.75 64 63 64.75
proximal phalanges (foot) 57 48.75 60.75 64.15 63 64.825triradiate 56.5 48.75 59.75 63 60 64.45
anterior inferior iliac spine - - - 64.45 63.75 64.975iliac crest 64.6 64.6 64.6 64.3 64.3 64.3
ischial epiphysis 61 60.25 63.7 64.6 63 65.05medial clavicle 54 54 54 65.2 65.2 65.2lateral clavicle 64 64 64 63 59 64.75
coracoid 54 54 54 63 60.5 64.45sub-coracoid and glenoid 59 54 - 63 61.25 64.525
acromium - - - 64.45 63 64.975medial border of scapula 64.6 64.6 64.6 64.6 64.6 64.6

259
8.5 Seriating epiphyseal fusion by mean epiphyseal fusion
These tables represent normality tests for ranges of mean epiphyseal fusion values discussed in Chapter 4 (section 4.2.2b). This is in support of the one-way ANOVA and subsequent post-hoc Bonferroni where normality of the distribution of dental scores was assumed. The use of dental score as a continuous variable is justified in section 4.2.2b. Post-hoc Bonferroni test results are available in the digital appendix section 8.2.2.1.
Table 8.21 Mean epiphyseal fusion normality tests for mid-fusion Pan troglodytes females.
epiphysisKolmogorov-Smirnov1. Shapiro-Wilk
statistic df sig. statistic df sig.proximal humerus .324 8 .013 .755 8 .009
distal humerus .384 8 .001 .708 8 .003humeral medial epicondyle .217 8 .200* .897 8 .269
proximal radius .226 8 .200* .936 8 .575distal radius .175 3 - 1.000 3 1.000
proximal ulna .179 3 - .999 3 .950distal ulna .175 3 - 1.000 3 1.000
distal phalanges (hand) .179 3 - .999 3 .950base of metacarpal 1 (hand) .266 5 .200* .824 5 .126
proximal and middle phalanges (hand) .309 5 .135 .872 5 .276heads of metacarpals 2-5 (hand) .247 5 .200* .961 5 .812
femoral head .400 5 .009 .777 5 .052greater trochanter .210 5 .200* .943 5 .684lesser trochanter .310 5 .131 .808 5 .094
distal femur .282 5 .200* .922 5 .541proximal tibia .153 10 .200* .960 10 .790
distal tibial .162 10 .200* .931 10 .453proximal fibula .190 10 .200* .946 10 .620
distal fibula .188 10 .200* .932 10 .471triradiate .188 9 .200* .898 9 .239
anterior inferior iliac spine - - - - - -iliac crest .175 3 - 1.000 3 1.000
ischial epiphysis .272 3 - .947 3 .554calcaneus .203 3 - .994 3 .850
talus .372 3 - .781 3 .071distal phalanges (foot) .179 3 - .999 3 .950
middle phalanges (foot) .219 4 - .980 4 .903metatarsal heads 2-5 (foot) .219 4 - .980 4 .903proximal phalanges (foot) .316 4 - .779 4 .070
base of metatarsal 1 fusion (foot) .207 4 - .966 4 .816medial clavicle .376 4 - .776 4 .065lateral clavicle .276 4 - .887 4 .370
coracoid .249 8 .153 .842 8 .080sub-coracoid and glenoid .145 8 .200* .928 8 .498
acromium .249 8 .153 .876 8 .171medial border .200 8 .200* .909 8 .346
1. Lilliefors Significance Correction, *. This is a lower bound of the true significance.

260
Table 8.22 Mean epiphyseal fusion normality tests for mid-fusion Pan troglodytes males
epiphysisKolmogorov-Smirnov1. Shapiro-Wilk
statistic df sig. statistic df sig.proximal humerus .344 3 - .841 3 .215
distal humerus .385 3 - .750 3 .000humeral medial epicondyle .307 3 - .903 3 .396
proximal radius .339 3 - .850 3 .242distal radius .177 3 - 1.000 3 .961
proximal ulna .288 3 - .928 3 .482distal ulna .192 3 - .997 3 .893
distal phalanges (hand) .317 3 - .887 3 .346base of metacarpal 1 (hand) .205 3 - .993 3 .839
proximal and middle phalanges (hand) .325 3 - .876 3 .312heads of metacarpals 2-5 (hand) .355 3 - .819 3 .159
femoral head .310 3 - .900 3 .384greater trochanter .245 3 - .971 3 .672lesser trochanter .254 3 - .963 3 .632
distal femur .329 3 - .869 3 .293proximal tibia .177 3 - 1.000 3 .961
distal tibial .177 3 - 1.000 3 .961proximal fibula .313 3 - .895 3 .369
distal fibula .310 3 - .900 3 .384triradiate .238 3 - .976 3 .702
anterior inferior iliac spine - - - - - -iliac crest .365 3 - .797 3 .107
ischial epiphysis .195 3 - .996 3 .882calcaneus .354 3 - .821 3 .165
talus - - - - - -distal phalanges (foot) .284 3 - .934 3 .503
middle phalanges (foot) .339 3 - .850 3 .242metatarsal heads 2-5 (foot) .349 3 - .831 3 .190proximal phalanges (foot) .245 3 - .971 3 .672
base of metatarsal 1 fusion (foot) .245 3 .971 3 .672medial clavicle - - - - - -lateral clavicle .319 3 - .885 3 .340
coracoid .296 3 - .918 3 .446sub-coracoid and glenoid .385 3 - .750 3 .000
acromium .178 3 - .999 3 .954medial border .365 3 - .797 3 .107
1. Lilliefors Significance Correction
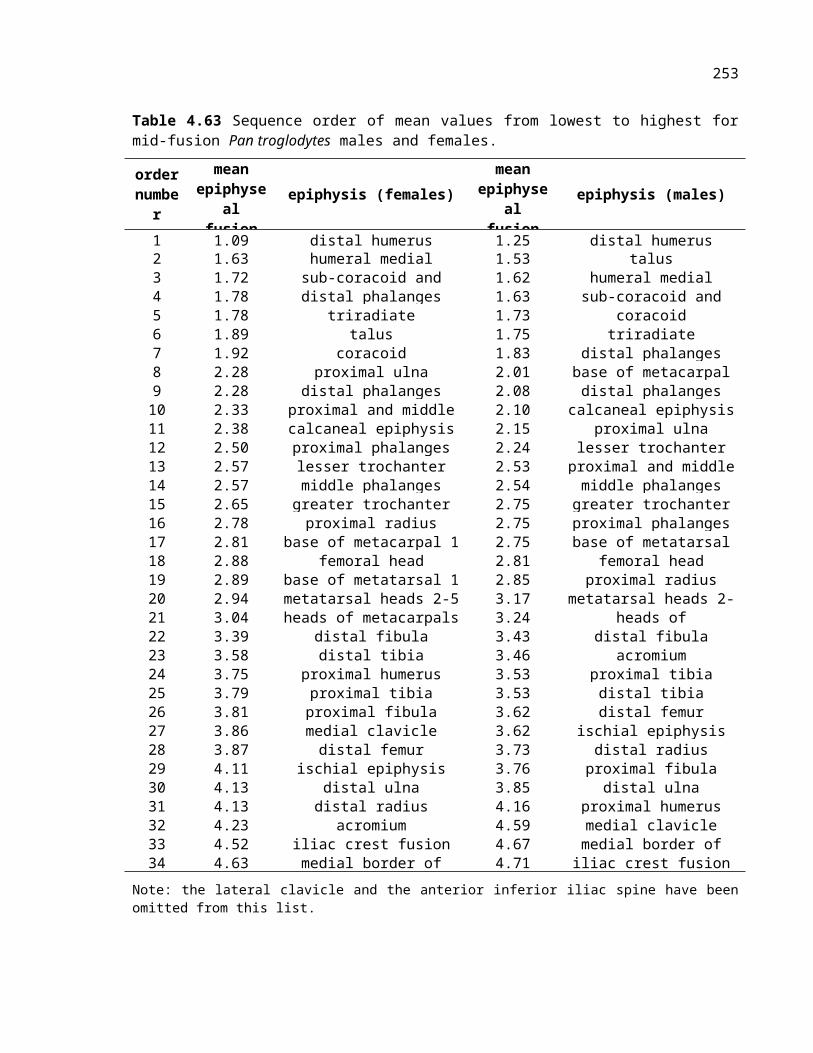
261
Table 8.23 Mean epiphyseal fusion normality tests for complete fusion Pan troglodytes females.
epiphysis Kolmogorov-Smirnov1. Shapiro-Wilkstatistic df sig. statistic df sig.
proximal humerus .423 5 .004 .640 5 .002distal humerus .269 5 .200* .807 5 .092humeral medial epicondyle .315 5 .118 .870 5 .268proximal radius .289 5 .200 .928 5 .582distal radius .263 5 .200* .839 5 .161proximal ulna .159 5 .200* .975 5 .905distal ulna .229 5 .200* .938 5 .655distal phalanges (hand) .264 5 .200* .870 5 .268base of metacarpal 1 (hand) .222 5 .200* .958 5 .794proximal and middle phalanges (hand) .253 5 .200* .883 5 .325heads of metacarpals 2-5 (hand) .171 5 .200* .984 5 .954femoral head .177 5 .200* .980 5 .933greater trochanter .261 5 .200* .936 5 .638lesser trochanter .159 5 .200* .975 5 .905distal femur .274 5 .200* .935 5 .633proximal tibia .222 5 .200* .891 5 .364distal tibial .264 5 .200* .894 5 .376proximal fibula .341 5 .058 .756 5 .034distal fibula .196 5 .200* .968 5 .865triradiate .212 5 .200* .899 5 .406anterior inferior iliac spine .258 5 .200* .904 5 .433iliac crest - - - - - -ischial epiphysis .218 5 .200* .900 5 .412calcaneus .256 5 .200* .826 5 .131talus .212 5 .200* .950 5 .735distal phalanges (foot) .205 5 .200* .921 5 .535middle phalanges (foot) .305 5 .144 .842 5 .170metatarsal heads 2-5 (foot) .245 5 .200* .864 5 .241proximal phalanges (foot) .435 5 .002 .668 5 .004base of metatarsal 1 fusion (foot) .302 5 .155 .803 5 .086medial clavicle .231 5 .200* .886 5 .337lateral clavicle .358 5 .035 .801 5 .082coracoid .268 5 .200* .852 5 .200sub-coracoid and glenoid .337 5 .065 .746 5 .028acromium .253 5 .200* .879 5 .306medial border - - - - - -
1. Lilliefors Significance Correction, *. This is a lower bound of the true significance.
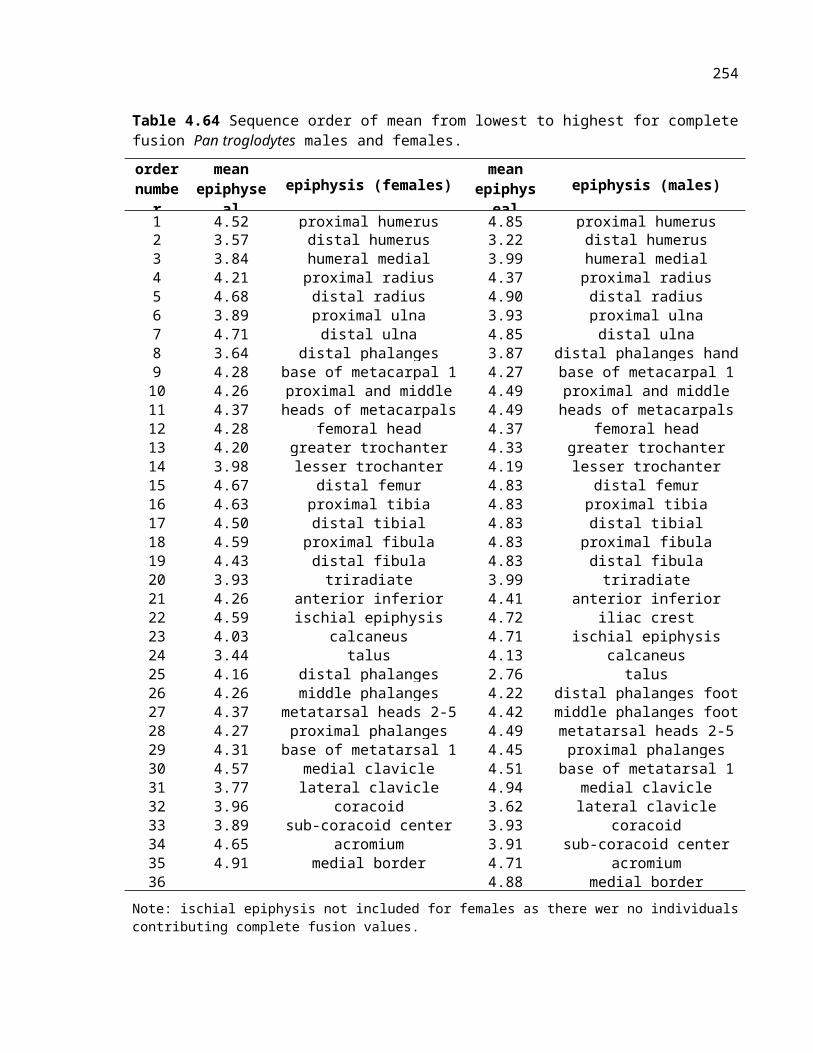
262
Table 8.24 Mean epiphyseal fusion normality tests for complete fusion Pan troglodytes males.
epiphysisKolmogorov-Smirnov1. Shapiro-Wilk
Statistic df sig. statistic df sig.proximal humerus .302 3 - .910 3 .417
distal humerus .328 3 - .870 3 .296humeral medial epicondyle .245 3 - .971 3 .672
proximal radius .344 3 - .841 3 .215distal radius .328 3 - .871 3 .298
proximal ulna .245 3 - .971 3 .672distal ulna .369 3 - .789 3 .089
distal phalanges (hand) .370 3 - .785 3 .080base of metacarpal 1 (hand) .252 3 - .966 3 .643
proximal and middle phalanges (hand) .302 3 - .910 3 .417heads of metacarpals 2-5 (hand) .302 3 - .910 3 .417
femoral head .365 3 - .797 3 .107greater trochanter .289 3 - .927 3 .478lesser trochanter .324 3 - .877 3 .316
distal femur .302 3 - .910 3 .417proximal tibia .302 3 - .910 3 .417
distal tibial .302 3 - .910 3 .417proximal fibula .302 3 - .910 3 .417
distal fibula .302 3 - .910 3 .417triradiate .185 3 - .998 3 .923
anterior inferior iliac spine .175 3 - 1.000 3 .995iliac crest - - - - - -
ischial epiphysis .365 3 - .797 3 .107calcaneus .368 3 - .790 3 .090
talus .178 3 - 1.000 3 .959distal phalanges (foot) .219 3 - .987 3 .780
middle phalanges (foot) .219 3 - .987 3 .780metatarsal heads 2-5 (foot) .227 3 - .983 3 .747proximal phalanges (foot) .219 3 - .987 3 .780
base of metatarsal 1 fusion (foot) .333 3 - .862 3 .274medial clavicle - - - - - -lateral clavicle .363 3 - .802 3 .119
coracoid .339 3 - .850 3 .242sub-coracoid and glenoid .353 3 - .823 3 .170
acromium .291 3 - .925 3 .470medial border - - - - - -
1. Lilliefors Significance Correction

263
8.6 Linear regression comparisons with Shea (1981)
The following data relate to linear regression of log10 transformed upper limb (humerus + radius) and lower limb (femur + tibia) intermembral indicies for comparison to Shea (1981). This is analysed in Chapter 4, section 4.3.1. Regression equations are found in text. Shea (1981) found a highly linear relationship between these indicies and this is reproduced in this study for an expanded number of Pan troglodytes sub-species.Table 8.25 Regression summary for comparison of upper vs. lower limb with Shea (1981) in Pan paniscus and Pan troglodytes.
species sex R R2 adjusted R2 std. error of the estimate
Pan troglodytes males 0.985 0.97 0.969 0.01557females 0.991 0.983 0.983 0.0113
Pan paniscus males 0.995 0.991 0.99 0.01071females 0.995 0.99 0.988 0.00977
Table 8.26 Linear regression ANOVA outputs for Pan troglodytes and Pan paniscus males and females.
species sex model sum of squares df mean
square F sig.
Pan troglodytes
malesregression 0.353 1 0.353 1457.009 0.000residual 0.011 45 0
total 0.364 46
femalesregression 0.526 1 0.526 4120.634 0.000residual 0.009 71 0
total 0.536 72
Pan paniscus
malesregression 0.087 1 0.087 757.571 0.000residual 0.001 7 0
total 0.088 8
femalesregression 0.048 1 0.048 499.006 0.000residual 0 5 0
total 0.048 6Table 8.27 Coefficients for linear regression analysis comparison with Shea (1981) for Pan troglodytes and Pan paniscus males and females.
species sex
unstandardized coefficients
standardized coefficients t significance
B std. error Beta
Pan troglodytesmales
0.215(B1) 0.064 3.38 0.0020.926(B2) 0.024 0.985 38.171 0.000
females0.022(B1) 0.042 0.524 0.602
1(B2) 0.016 0.991 64.192 0.000
Pan paniscusmales
0.042(B1) 0.096 0.436 0.6760.988(B2) 0.036 0.995 27.524 0.000
females0.303(B1) 0.105 2.881 0.0350.889(B2) 0.04 0.995 22.338 0.000
Note: B1 is the y intercept and B2 the slope for the regression equation.

264
8.7 Regression of serially homologous limb elements in Pan troglodytes.
The following tables relate to linear regression of serially homologous limb elements in Pan troglodytes. This is analysed in section 4.3.2. These tables provide r-square values, ANOVA results, and coefficients for regression.
Table 8.28 Multiple limb element linear regression outputs for Pan troglodyes and Pan paniscus males and females.
species sex comparison R R2 adjusted R2
std. error of the estimate
Durbin-
Watson
Pan troglodyte
s
females
humerus-femur 0.992 0.983 0.983 0.012276 1.565
radius-tibia 0.986 0.971 0.971 0.014687 1.637humerus-
radius 0.987 0.975 0.975 0.01351 1.672
tibia-femur 0.99 0.981 0.981 0.013891 1.694
males
humerus-femur 0.856 0.734 0.728 0.045988 1.217
radius-tibia 0.992 0.985 0.985 0.011326 1.631humerus-
radius 0.95 0.903 0.901 0.027957 1.477
tibia-femur 0.995 0.989 0.989 0.010299 1.623
Pan paniscus
females
humerus-femur 0.994 0.989 0.987 0.008689 2.283
radius-tibia 0.988 0.976 0.973 0.013074 3.126humerus-
radius 0.999 0.998 0.998 0.003825 2.287
tibia-femur 0.993 0.986 0.985 0.009504 2.611
males
humerus-femur 0.981 0.962 0.958 0.022096 2.708
radius-tibia 0.996 0.992 0.991 0.009931 1.507humerus-
radius 0.987 0.974 0.972 0.018772 3.014
tibia-femur 0.996 0.992 0.991 0.008924 2.318

265
Table 8.29 Multiple limb-element linear regression ANOVA outputs for Pan troglodytes males and females.
sex comparison model sum of squares df mean square F sig.
females
humerus-femurregression 0.735 1 0.735 4878.193 0.000residual 0.013 83 0
total 0.748 84
radius-tibiaregression 0.556 1 0.556 2579.793 0.000residual 0.016 76 0
total 0.573 77
humerus-radiusregression 0.548 1 0.548 3002.04 0.000residual 0.014 77 0
total 0.562 78
tibia-femurregression 0.827 1 0.827 4283.421 0.000residual 0.016 84 0
total 0.843 85
males
humerus-femurregression 0.309 1 0.309 145.877 0.000residual 0.112 53 0.002
total 0.421 54
radius-tibiaregression 0.417 1 0.417 3249.152 0.000residual 0.006 50 0
total 0.423 51
humerus-radiusregression 0.348 1 0.348 445.029 0.000residual 0.038 48 0.001
total 0.385 49
tibia-femurregression 0.537 1 0.537 5066.315 0.000residual 0.006 56 0
total 0.543 57

266
Table 8.30 Multiple limb-element linear regression ANOVA outputs for Pan paniscus males and females.
sex comparison model sum of squares df mean square F sig.
females
humerus-femurregression 0.053 1 0.053 697.348 0.000residual 0.001 8 0
total 0.053 9
radius-tibiaregression 0.062 1 0.062 364.52 0.000residual 0.002 9 0
total 0.064 10
humerus-radiusregression 0.053 1 0.053 3627.4 0.000residual 0 7 0
total 0.053 8
tibia-femurregression 0.065 1 0.065 717.866 0.000residual 0.001 10 0
total 0.066 11
males
humerus-femurregression 0.124 1 0.124 254.261 0.000residual 0.005 10 0
total 0.129 11
radius-tibiaregression 0.095 1 0.095 964.013 0.000residual 0.001 8 0
total 0.096 9
humerus-radiusregression 0.134 1 0.134 380.651 0.000residual 0.004 10 0
total 0.138 11
tibia-femurregression 0.088 1 0.088 1101.74
90.000
residual 0.001 9 0total 0.088 10
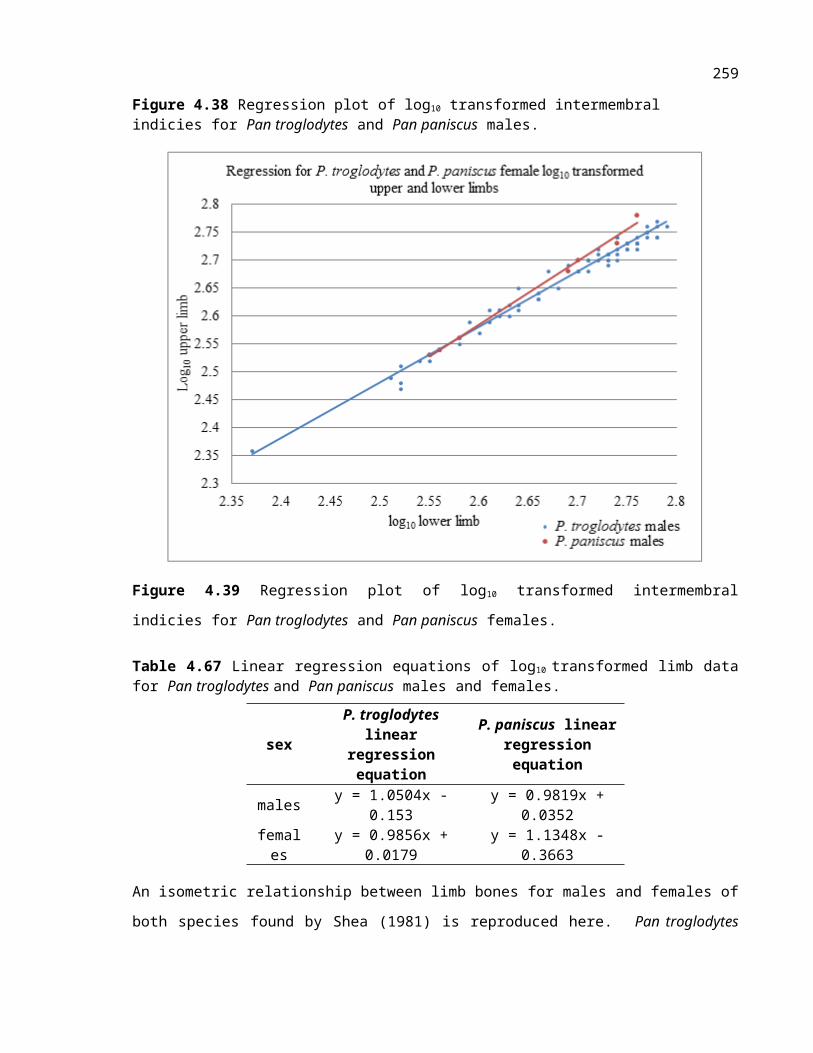
267
Table 8.31 Coefficients for linear regression in Pan troglodytes males and females.
sex comparison
unstandardized coefficients
standardized coefficients t significance
B std. error Beta
females
humerus-femur 0.02(B1) 0.034 0.589 0.5570.99(B2) 0.014 0.992 69.844 0.000
radius-tibia -0.051(B1) 0.047 -1.096 0.2771.005(B2) 0.02 0.986 50.792 0.000
humerus-radius 0.046(B1) 0.043 1.078 0.2840.997(B2) 0.018 0.987 54.791 0.000
tibia-femur 0.175(B1) 0.034 5.178 0.0000.957(B2) 0.015 0.99 65.448 0.000
males
humerus-femur 0.558(B1) 0.15 3.731 0.0000.765(B2) 0.063 0.856 12.078 0.000
radius-tibia 0.212(B1) 0.037 5.684 0.0000.927(B2) 0.016 0.992 57.001 0.000
humerus-radius 0.217(B1) 0.102 2.132 0.0380.92(B2) 0.044 0.95 21.096 0.000
tibia-femur 0.26(B1) 0.029 8.817 0.0000.921(B2) 0.013 0.995 71.178 0.000
Note: B1 is the y intercept and B2 the slope for the regression equation.Table 8.32 Coefficients for linear regression in Pan paniscus males and females.
sex comparisonunstandardized
coefficientsstandardized coefficients t significance
B std. error Beta
females
humerus-femur 0.122(B1) 0.085 1.428 0.1910.946(B2) 0.036 0.994 26.407 0.000
radius-tibia 0.346(B1) 0.105 3.293 0.0090.865(B2) 0.045 0.988 19.092 0.000
humerus-radius 0.084(B1) 0.038 2.195 0.0640.981(B2) 0.016 0.999 60.228 0.000
tibia-femur 0.363(B1) 0.076 4.79 0.0010.877(B2) 0.033 0.993 26.793 0.000
males
humerus-femur 0.118(B1) 0.142 0.832 0.4250.951(B2) 0.06 0.981 15.946 0.000
radius-tibia 0.219(B1) 0.068 3.199 0.0130.919(B2) 0.03 0.996 31.049 0.000
humerus-radius -0.022(B1) 0.123 -0.177 0.8631.025(B2) 0.053 0.987 19.51 0.000
tibia-femur 0.219(B1) 0.066 3.344 0.0090.937(B2) 0.028 0.996 33.193 0.000
Note: B1 is the y intercept and B2 the slope for the regression equation.

268
8.8 Normality tests for fusion as a percentage of long-bone length in Pan troglodytes
Epiphyseal fusion events were evaluated as a function of growth in length of long-bones. Results are presented in Chapter 5, section 5.3. The normality of ranges of epiphyseal fusion as a function of percentage of growth in length was tested to see if data were skewed. The following results demonstrate that the data were normally distributed for all epiphyses.
Table 8.33 Normality plots for fusion as a percentage of long-bone length in Pan troglodytes
sex epiphysisKolmogorov-Smirnova Shapiro-Wilk
statistic df sig. statistic df sig.
females
proximal humerus .171 21 .112 .936 21 .182distal humerus .200 10 .200 .918 10 .340
humeral medial epicondyle .221 8 .200 .942 8 .628proximal radius .143 12 .200 .939 12 .490
distal radius .188 17 .111 .902 17 .075proximal ulna .234 6 .200 .916 6 .476
distal ulna .135 22 .200 .950 22 .322femoral head .255 11 .044 .855 11 .050
greater trochanter .187 11 .200 .907 11 .225lesser trochanter .166 5 .200 .970 5 .873
distal femur .097 21 .200 .964 21 .603proximal tibia .143 21 .200 .949 21 .327
distal tibia .143 14 .200 .975 14 .938proximal fibula .118 16 .200 .973 16 .878
distal fibula .228 10 .150 .955 10 .732
males
proximal humerus .178 6 .200 .977 6 .935distal humerus .290 5 .198 .866 5 .249
humeral medial epicondyle .222 8 .200 .891 8 .237proximal radius .207 8 .200 .902 8 .302
distal radius .273 4 - .860 4 .260proximal ulna .319 6 .056 .843 6 .138
distal ulna .198 6 .200 .924 6 .531femoral head .211 5 .200 .890 5 .358
greater trochanter .354 3 - .821 3 .165lesser trochanter .216 4 - .954 4 .740
distal femur .167 7 .200 .921 7 .477proximal tibia .233 7 .200 .950 7 .732
distal tibia .233 7 .200 .950 7 .732proximal fibula .259 6 .200 .877 6 .255
distal fibula .269 8 .092 .888 8 .225