Introduction to Computer Graphics: ITCS 4120/5120 Dr. Zachary Wartell Revision 1.2 2/16/07 Copyright...
83
roduction to Computer Graphics: ITCS 4120/51 Dr. Zachary Wartell Revision 1.2 2/16/07 Copyright 2006, Dr. Zachary Wartell, UNCC, All Rights Reserved
-
date post
19-Dec-2015 -
Category
Documents
-
view
224 -
download
0
Transcript of Introduction to Computer Graphics: ITCS 4120/5120 Dr. Zachary Wartell Revision 1.2 2/16/07 Copyright...

Introduction to Computer Graphics: ITCS 4120/5120
Dr. Zachary Wartell
Revision 1.22/16/07
Copyright 2006, Dr. Zachary Wartell, UNCC, All Rights Reserved
Introduction to Computer Graphics: ITCS 4120/5120
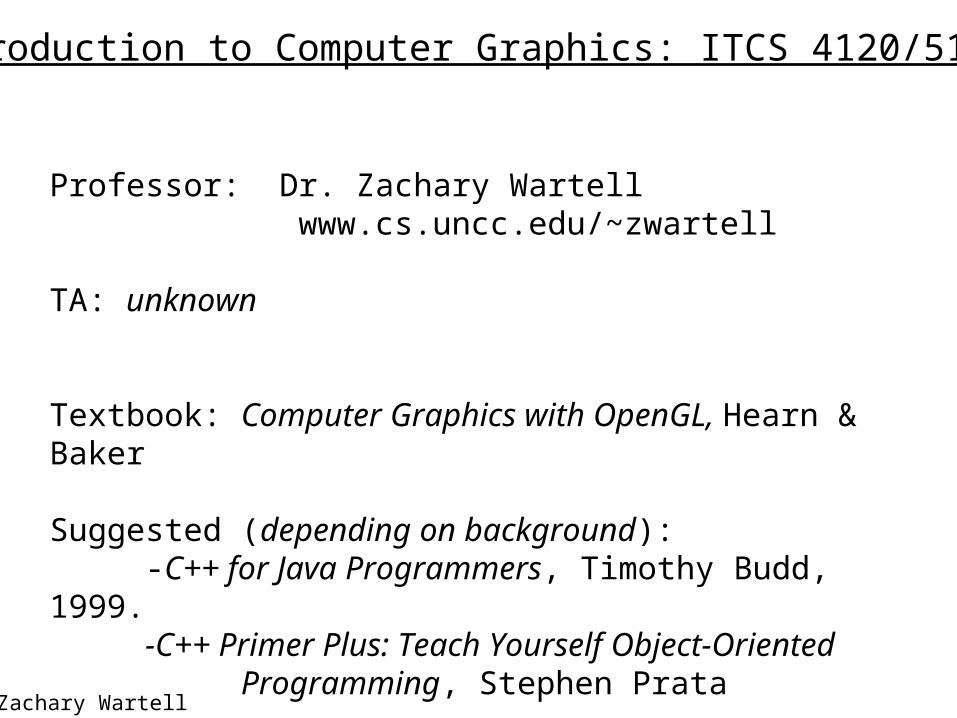
Professor: Dr. Zachary Wartell www.cs.uncc.edu/~zwartell
TA: unknown
Textbook: Computer Graphics with OpenGL, Hearn & Baker
Suggested (depending on background):-C++ for Java Programmers, Timothy Budd, 1999.-C++ Primer Plus: Teach Yourself Object-Oriented
Programming, Stephen Prata
©Zachary Wartell
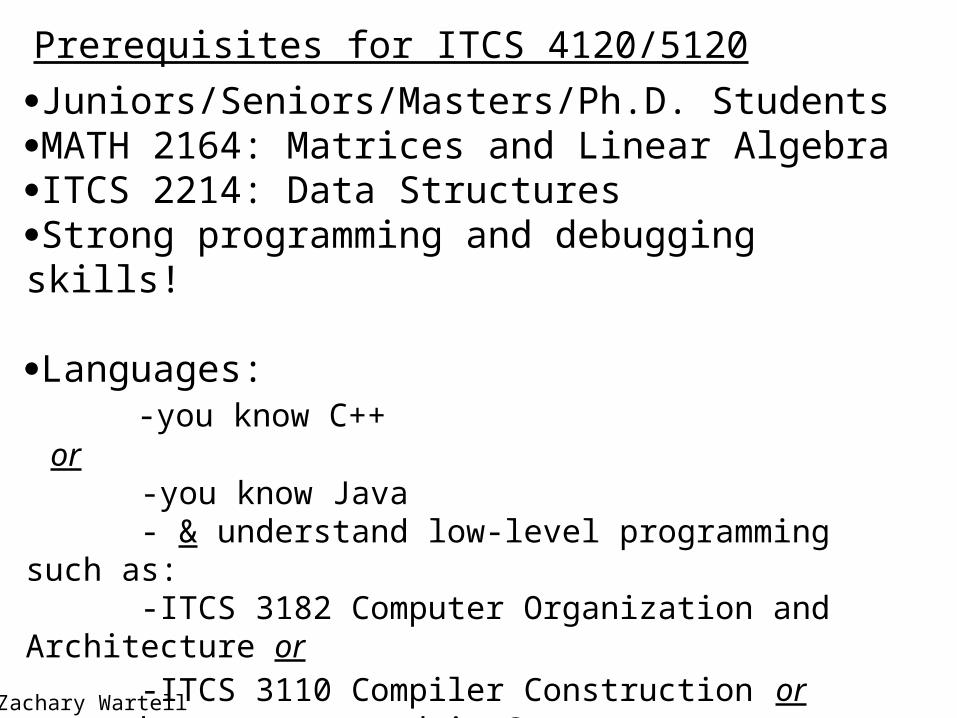
Prerequisites for ITCS 4120/5120
Juniors/Seniors/Masters/Ph.D. StudentsMATH 2164: Matrices and Linear Algebra ITCS 2214: Data StructuresStrong programming and debugging skills!
Languages: -you know C++ or -you know Java - & understand low-level programming such as:
-ITCS 3182 Computer Organization and Architecture or -ITCS 3110 Compiler Construction or -have programmed in C
- & capable of learning a new language on your own
©Zachary Wartell

Tools for Programming Projects in ITCS 4120/5120
C++ Microsoft Visual Studio 2005
Woodward 335COIT/BISOM students MSDNAA: http://www.labs.uncc.edu/basics/compguide.html
OpenGL – [MSVC 2005] – 2D/3D graphics API libraryFLTK – [class website] – GUI API librarySVN – [class website] - source code revision control system. Used for turning in projects.
Assignments are best done in Woodward 335Tools and API’s have been tested in 335
©Zachary Wartell
Author
Comment

What is computer graphics (CG)?
It’s a core software & hardware technology in:
-Computer Aided Design (CAD)-Scientific Visualization-Medical Visualization-Education-Computer Interfaces-Computer/Video Games-Virtual Reality & Visual Simulation-Movies
©Zachary Wartell
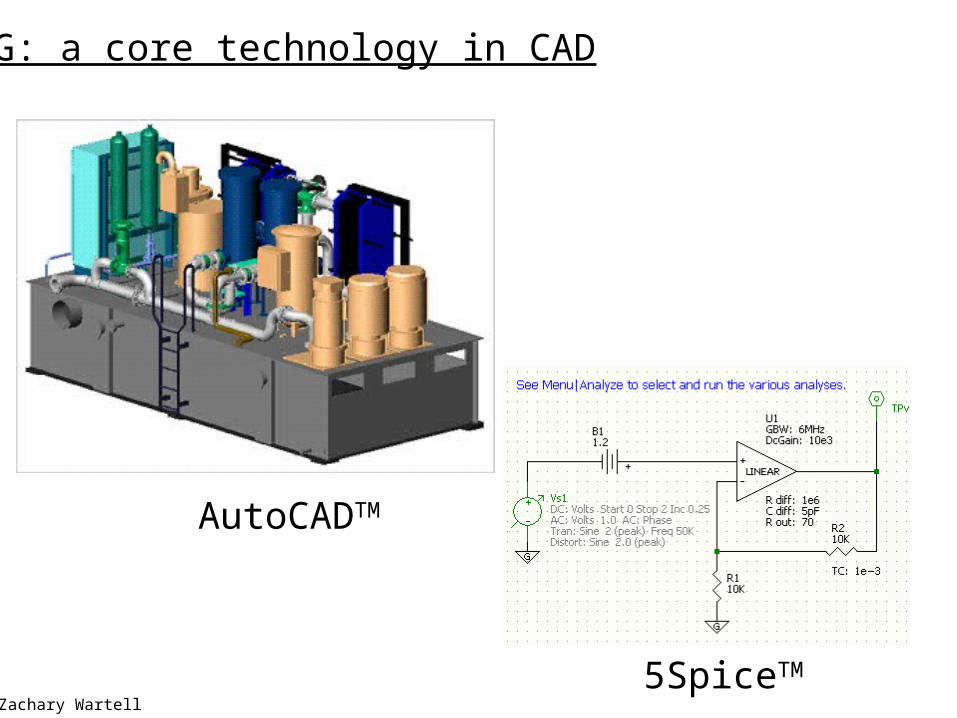
CG: a core technology in CAD
AutoCADTM
5SpiceTM
©Zachary Wartell
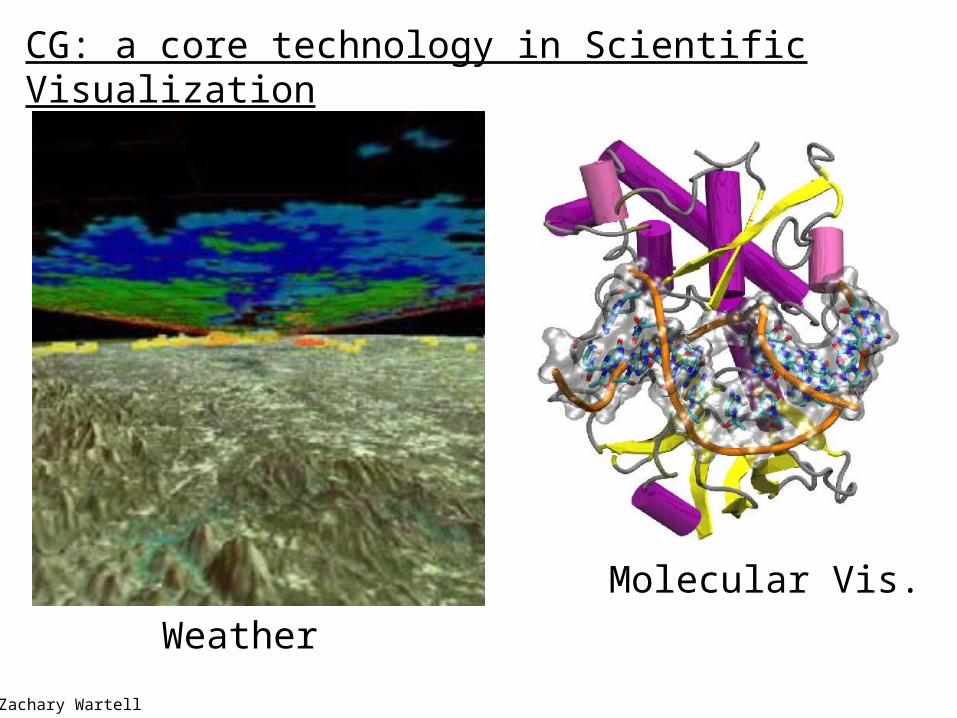
CG: a core technology in Scientific Visualization
Weather
Molecular Vis.
©Zachary Wartell

CG: a core technology in Medical Visualization
©Zachary Wartell
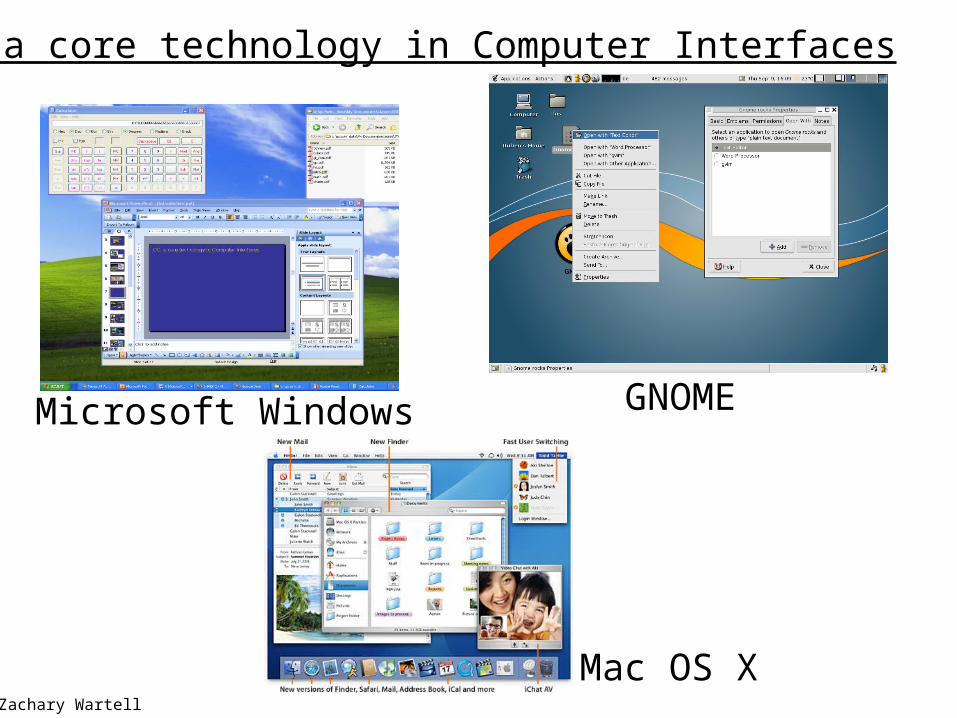
CG: a core technology in Computer Interfaces
Microsoft Windows GNOME
Mac OS X©Zachary Wartell

CG: a core technology in Games
FarCry (UbiSoft)
Falcon 4.0(Microprose)
Zelda (Nitendo)©Zachary Wartell

CG: a core technology in VR & Vis. Sim.
Exposure Therapy for Flying Phobia(Larry Hodges et.al)
Pilot Training(AlSim, Inc.)
©Zachary Wartell

CG: a core technology in VR & Vis. Simulation
Two-hand Interfacefor Weather Vis.
“Holospace” Surround ScreenDisplay(Barco)
©Zachary Wartell

CG: a core technology in Movies
Star Wars: Episode IITM(LucusFilm)
Shrek 2TM(Dreamworks)
©Zachary Wartell

What disciplines does CG technology draw on?
algorithmsmath
-basic graphics (ITCS 4120) – linear/vector algebra, geometry & trig.
-advanced graphics advanced calculus, computational geometry, differential geometry, topology, …..
optics (very approximate in ITCS 4120) software engineering and programminghardware engineeringpsychophysics (branch of psychology)
-human visual systemindustrial art & design
©Zachary Wartell

ITCS 4120 subset of these disciplines
ITCS 4120: Lecture Material45% - algorithms45% - math (linear/vector algebra, geometry & trig.)3% - optics3% - hardware engineering3% - psychophysics1% - programming
ITCS 4120: Projects50(?)% - programming (C++, OpenGL, FLTK)50(?)% - deeply understanding Lecture Material
“you don’t really understand it until you’ve implemented it”
©Zachary Wartell

How long has CG been around?
Ivan Sutherland, SketchPad, 1963 MIT
CRT, light-pen, direct-manipulation 2D graphics
©Zachary Wartell

How long has CG been around?
William Fetter, 1960, Boeing Aircraft Co.
“Boeing Man”, human figure simulation, credited with “computer graphics”
©Zachary Wartell

In what way do CG applications differ?
2D versus 3DSpeed – Frames Per Second (FPS)
Realism
vs$$$
1950’s, Whirlwind, $4.5M, 40K adds/s today’s PC: $1K, 2-3B ops/s
CG: 1995, $100K, SGI = 2004, $1K PC©Zachary Wartell
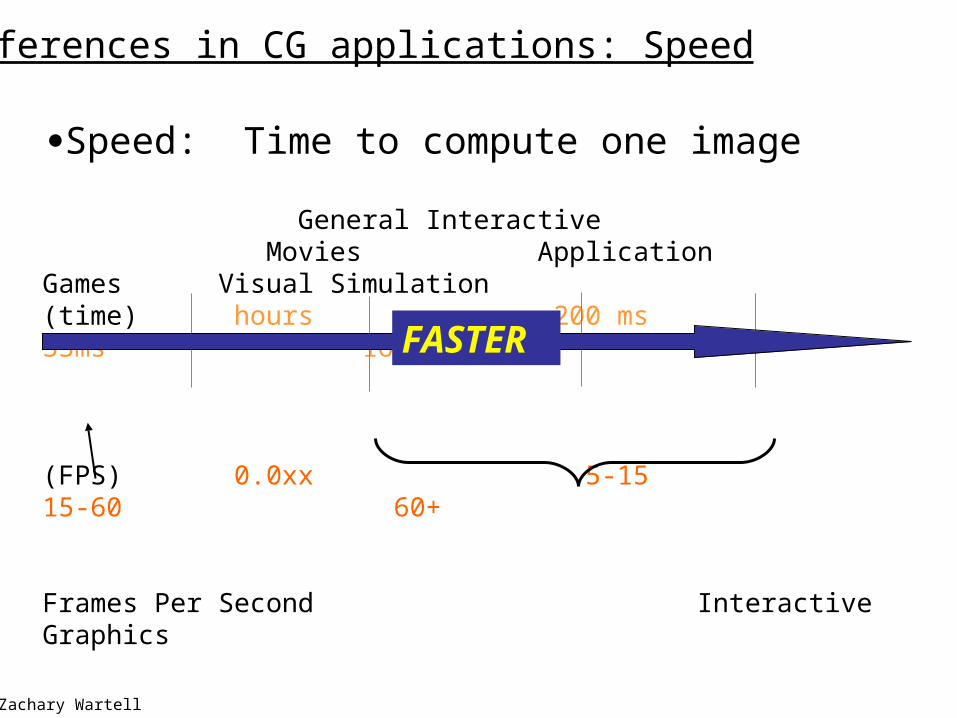
General Interactive Movies Application Games Visual Simulation(time) hours 200 ms 33ms 16 ms
(FPS) 0.0xx 5-15 15-60 60+
Frames Per Second Interactive Graphics
Differences in CG applications: Speed
Speed: Time to compute one image
FASTER
©Zachary Wartell

Realism- more math, more physics → more realism (real-time CG → ray-tracing → radiosity → “rendering equation”)
- display technology & human visual perception (image fidelity, stereopsis, motion parallax)
Differences in across CG applications: Realism
More Photo Realistic
“Cartoon” Movie Special Product Games Vis. Sim. Movies FX Evaluation
©Zachary Wartell

CG: Speed vs. Realism
generally: more realism → less speed
but Moore’s Law continues to reign-price/performance improves 2x every 18 months-since 1995 gaming market driving
graphics hardware
-Nintendo GameCubeTM (ATI)-XboxTM (Nvidia inside)-PC: nVidia Geforce 7900, ATI Radeon X1900
display capability still lags human eye’s precision (but there is substantial and continuing advances)
©Zachary Wartell

What are a CG application’s components?
Eye Brain
Display
Input Device
Body
CG System Software
OS
CG 3D API CG GUI (2D) API
ApplicationSoftware
General Computing Hardware
Graphics Computing Hardware
Image Synthesis
©Zachary Wartell
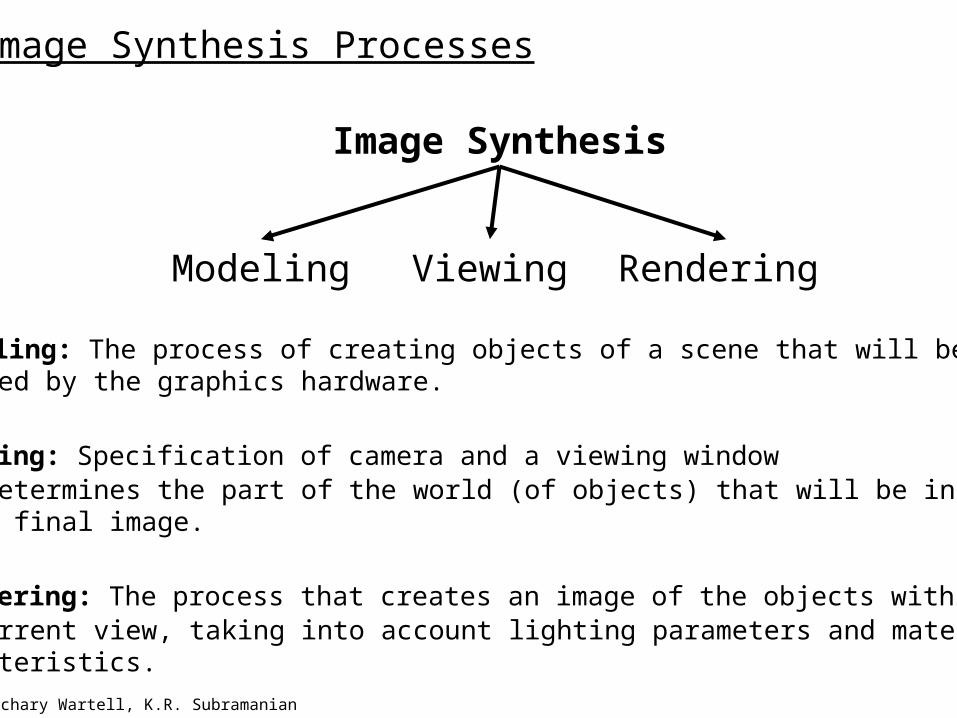
Image Synthesis Processes
Image Synthesis
Modeling: The process of creating objects of a scene that will berendered by the graphics hardware.
Viewing: Specification of camera and a viewing windowthat determines the part of the world (of objects) that will be includedin the final image.
Rendering: The process that creates an image of the objects withinthe current view, taking into account lighting parameters and materialcharacteristics.
Modeling Viewing Rendering
©Zachary Wartell, K.R. Subramanian

2D Image Synthesis: Coordinate Systems (CS)
2D World2D Models
Model CS World CS
View(2D Window)
World CS
View Transform(2D→2D)
ConvertGeometry to Image
CoordinateTransforms
2D Image
[Display] Device CS(DCS)
- Computation
- Data
©Zachary Wartell

3D Image Synthesis: Coordinate Systems (CS)
3D World3D Models
View(Eye &
Window)View
Transform(3D→2D)
ConvertGeometry to Image
CoordinateTransforms
2D Image
[Display] Device CS(DCS)
World CS Model CS
World CS
Lights
- Computation
- Data
©Zachary Wartell

Image Data Structures & Display Hardware
Slide 22
Slide 20
Slide 20
So far: CG application components, Image Synthesis, Coordinate Systems. Let’s start with details about:
©Zachary Wartell
2D Image
[Display] Device CS(DCS)
2D Image
[Display] Device CS(DCS)
General Computing Hardware
Graphics ComputingHardware
General Computing Hardware
Graphics ComputingHardware
Display

©Larry F. Hodges, Zachary Wartell
Basic Definitions
RASTER: A rectangular array of points or dots (either on physical display or a data structure in memory).
PIXEL (Pel): One dot or picture element of the raster
SCAN LINE: A row of pixels
Raster Displays create display an image by sequentially drawing out the pixels of the scan lines that form the raster.

Pixel
• Pixel - The most basic addressable element in a image or on a display
– CRT - Color triad (RGB phosphor dots)
– LCD - Single color element
• Resolution - measure of number of pixels on a image (m by n)
– m - Horizontal image resolution
– n - Vertical image resolution
©Larry F. Hodges, Zachary Wartell

Other meanings of resolution
• Dot Pitch [Display] - Size of a display pixel, distance from center to center of individual pixels on display
• Cycles per degree [Display] - Addressable elements (pixels) divided by twice the FOV measured in degrees.
• Cycles per degree [Eye] - The human eye can resolve 30 cycles per degree (20/20 Snellen acuity).
©Larry F. Hodges, Zachary Wartell

©Larry F. Hodges, Zachary Wartell
Basic Image Synthesis Hardware (Raster Display)
DisplayProcessor Display
ProcessorMemory
FramebufferVideo
Controller
PeripheralDevices
CPU SystemMemory
System Bus
raster imagesfound here

Raster – Bit Depth
• A raster image may be thought of as computer memory organized as a two-dimensional array with each (x,y) addressable location corresponding to one pixel.
• Bit Planes or Bit Depth is the number of bits corresponding to each pixel.
• A typical framebuffer resolution might be
1280 x 1024 x 8
1280 x 1024 x 24
1600 x 1200 x 24
©Larry F. Hodges, Zachary Wartell

Displaying Color
• There are no commercially available small pixel technologies that can individually change color.
• spatial integration – place “mini”-pixels of a few fixed colors very close together. The eye & brain spatially integrate the “mini”-pixel cluster into a perception of a pixel of arbitrary color
• temporal integration - field sequential color uses red, blue and green liquid crystal shutters to change color in front of a monochrome light source. The eye & brain temporally integrate the result into a perception of pixels of arbitrary color
©Larry F. Hodges, Zachary Wartell

CRT Display
©Larry F. Hodges, Zachary Wartell
Focusing System
Electron Guns
Red Input
GreenInput
Blue Input
Deflection Yoke
Shadow Mask
Red, Blue, and Green
Phosphor Dots
CRT

Electron Gun
•Contains a filament that, when heated, emits a stream of electrons.
•Electrons are focused with an electromagnet into a sharp beam and directed to a specific point of the face of the picture tube.
•The front surface of the picture tube is coated with small phosphor dots.
•When the beam hits a phosphor dot it glows with a brightness proportional to the strength of the beam and how often it is excited by the beam.
©Larry F. Hodges, Zachary Wartell

•Red, Green and Blue electron guns.
•Screen coated with phosphor triads.
•Each triad is composed of a red, blue and green phosphor dot.
•Typically 2.3 to 2.5 triads per pixel.
FLUORESCENCE - Light emitted while the phosphor is being struck by electrons.
PHOSPHORESCENCE - Light given off once the electron beam is removed.
PERSISTENCE - Is the time from the removal of excitation to the moment when phosphorescence has decayed to 10% of the initial light output.
Color CRT
©Larry F. Hodges, Zachary Wartell
G R B G
B G R B
G R B G

©Larry F. Hodges, Zachary Wartell
•Shadow mask has one small hole for each phosphor triad.
•Holes are precisely aligned with respect to both the triads and the electron guns, so that each dot is exposed to electrons from only one gun.
•The number of electrons in each beam controls the amount of red, blue and green light generated by the triad.
Shadow Mask
SHADOW MASK
RedGreen
Blue
Convergence Point
Phosphor Dot Screen

CRITICAL FUSION FREQUENCY
•Typically 60-85 times per second for raster displays.
•Varies with intensity, individuals, phosphor persistence, room lighting.
Frame: The image to be scanned out on the CRT.
•Some minimum number of frames must be displayed each second to eliminate flicker in the image.
Scanning An Image
©Larry F. Hodges, Zachary Wartell

•Display frame rate 30 times per second
•To reduce flicker at lesser bandwidths (Bits/sec.), divide frame into two fields—one consisting of the even scan lines and the other of the odd scan lines.
•Even and odd fields are scanned out alternately to produce an interlaced image.
•non-interlaced also called “progressive”©Larry F. Hodges, Zachary Wartell
Time
Interlaced Scanning
1/30 SEC
1/60 SEC
FIELD 1 FIELD 2
FRAME
1/60 SEC
1/30 SEC
1/60 SEC
FIELD 1 FIELD 2
FRAME
1/60 SEC

(0,0)
VERTICAL SYNC PULSE — Signals the start of the next field.
VERTICAL RETRACE — Time needed to get from the bottom of the current field to the top of the next field.
HORIZONTAL SYNC PULSE — Signals the start of the new scan line.
HORIZONTAL RETRACE — Time needed to get from the end of the current scan line to the start of the next scan line.
Scanning
©Larry F. Hodges, Zachary Wartell
Device CS(alternate conventions)
(0,0)

NTSC – ? x 525, 30f/s, interlaced (60 fld/s)PAL – ? x 625, 25f/s, interlaced (50 fld/s)HDTV – 1920 x 1080i, 1280 x 720pXVGA – 1024x768, 60+ f/s, non-interlacedgeneric RGB – 3 independent video signals and synchronization signal, vary in resolution and refresh rategeneric time-multiplexed color – R,G,B one after another on a single signal, vary in resolution and refresh rate
Example Video Formats
©Larry F. Hodges, Zachary Wartell

Calligraphic/Vector CRT
older technologyvector file instead of framebufferwireframe engineering drawings flight simulators: combined raster-vector CRT
P0
P1
P0
P1
Line (P0,P1)Video
Controller
©Zachary Wartell

Flat-Panel Displays
©Zachary Wartell
Flat-Panel
Emissive Non-Emissive
LED
CRT(90°deflected)
Plasma
Thin-Filmelectroluminescent
LCD DMD
Active-Matrix(TFT)
Passive-Matrix

Flat-Panel Displays (Plasma)
©Zachary Wartell
Flat-Panel
Emissive Non-Emissive
LED
CRT(90°deflected)
Plasma
Thin-Filmelectroluminescent
LCD DMD
Active-Matrix
Passive-Matrix
ToshibaTM, 42”, Plasma HTDV$4,500 (circa 2005)

Flat-Panel Displays (LED)
©Zachary Wartell
Flat-Panel
Emissive Non-Emissive
LED
CRT(90°deflected)
Plasma
Thin-Filmelectroluminescent
LCD DMD
Active-Matrix
Passive-Matrix
BarcoTM “Light Street” (LED)

Flat-Panel Displays (DMD)
©Zachary Wartell
Flat-Panel
Emissive Non-Emissive
LED
CRT(90°deflected)
Plasma
Thin-Filmelectroluminescent
LCD DMD
Active-Matrix
Passive-Matrix
Digital Micro-mirror (DMD)
4 μm

LCD
©Larry F. Hodges, Zachary Wartell
• Liquid crystal displays use small flat chips which change their transparency properties when a voltage is applied.
• LCD elements are arranged in an n x m array call the LCD matrix
• Level of voltage controls gray levels.• LCDs elements do not emit light, use backlights
behind the LCD matrix

LCD Components
©Larry F. Hodges, Zachary Wartell
Small fluorescent tubes
Diffuser
Linear Polarizer
LCD Module Color
Filter
Linear Polarizer
Wavefront distortion
filter

LCD Resolution
©Larry F. Hodges, Zachary Wartell
LCD resolution is occasionally quoted as number of pixel elements not number of RGB pixels.
Example: 3840 horizontal by 1024 vertical pixel elements = 4M elements
Equivalent to 4M/3 = 1M RGB pixels
"Pixel Resolution" is 1280x1024
dot pitch

LCD
©Larry F. Hodges, Zachary Wartell
• Passive LCD screens– Cycle through each
element of the LCD matrix applying the voltage required for that element.
– Once aligned with the electric field the molecules in the LCD will hold their alignment for a short time
• Active LCD (TFT)– Each element contains
a small transistor that maintains the voltage until the next refresh cycle.
– Higher contrast and much faster response than passive LCD
– Circa 2005 this is the commodity technology
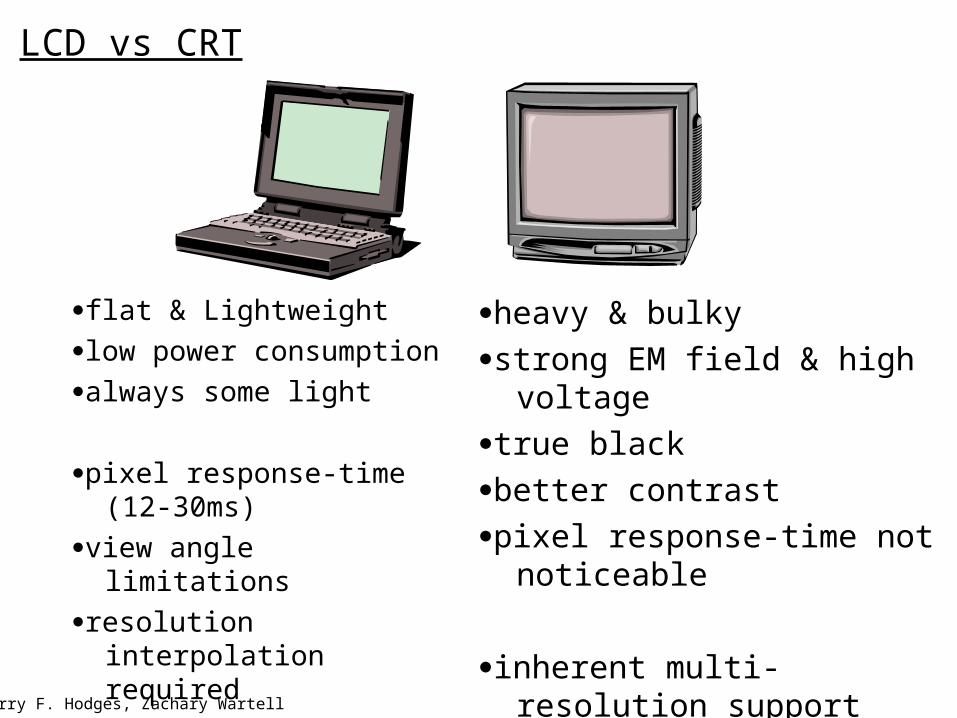
LCD vs CRT
©Larry F. Hodges, Zachary Wartell
flat & Lightweight
low power consumption
always some light
pixel response-time (12-30ms)
view angle limitations
resolution interpolation required
heavy & bulky
strong EM field & high voltage
true black
better contrast
pixel response-time not noticeable
inherent multi-resolution support

Recall our generic CG box…..
©Larry F. Hodges, Zachary Wartell
DisplayProcessor Display
ProcessorMemory
FramebufferVideo
Controller
PeripheralDevices
CPU SystemMemory
System Bus

Framebuffer
©Larry F. Hodges, Zachary Wartell
• A frame buffer may be thought of as computer memory organized as a two-dimensional array with each (x,y) addressable location corresponding to one pixel.
• Bit Planes or Bit Depth is the number of bits corresponding to each pixel.
• A typical frame buffer resolution might be
640 x 480 x 16
1280 x 1024 x 24
1920 x 1600 x 24
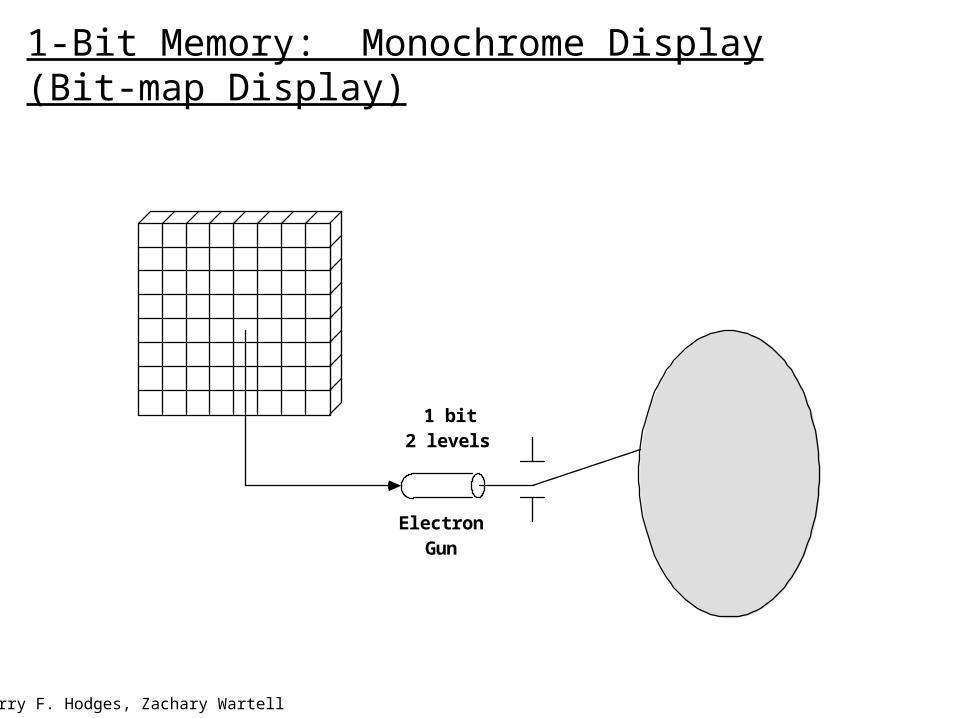
1-Bit Memory: Monochrome Display(Bit-map Display)
©Larry F. Hodges, Zachary Wartell
Electron Gun
1 bit 2 levels

3-Bit Color Display
©Larry F. Hodges, Zachary Wartell
3
red
green
blue
COLOR: black red green blue yellow cyan magenta white
R G B
0 0 0
1 0 0
0 1 0
0 0 1
1 1 0
0 1 1
1 0 1
1 1 1
black red green blue yellow cyan magenta white
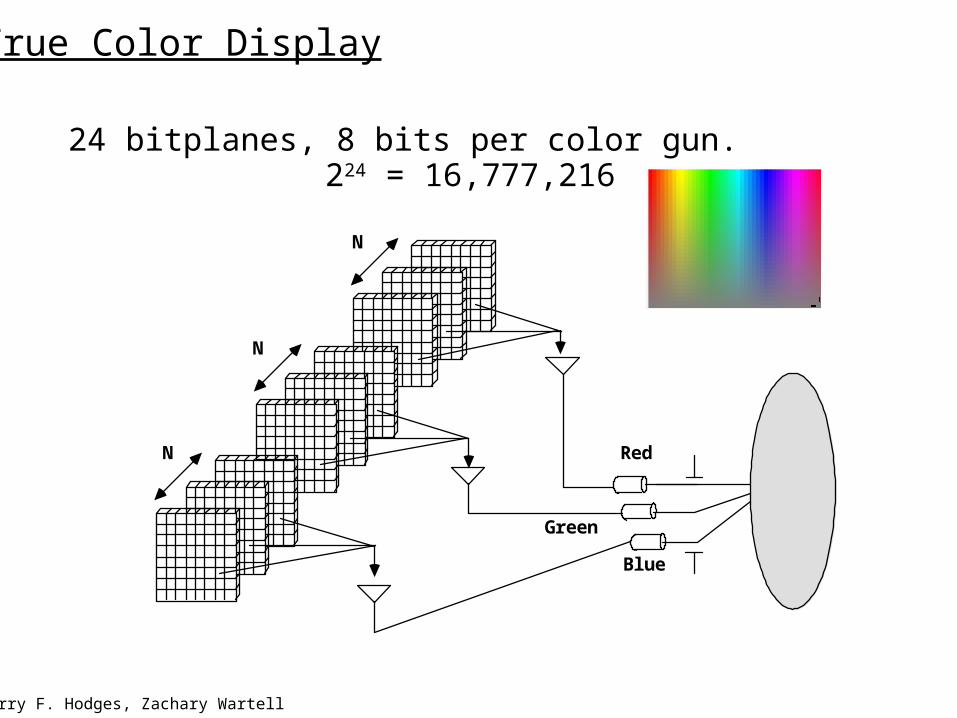
True Color Display
©Larry F. Hodges, Zachary Wartell
24 bitplanes, 8 bits per color gun. 224 = 16,777,216
Green
Red
Blue
N
N
N

Color-Map Lookup Table
©Larry F. Hodges, Zachary Wartell
01000
011
67
100110100001
0
67
255
10011010 0001
R G B
RED
GREEN
BLUE
Pixel displayedat x', y'
Pixel inbit mapat x', y'
0 x0
y
xmax
maxy
Bit map Look-up table Display
extends the number of colors that can be displayed by a given number of bit-planes.
Fig. 4.LUT Video look-up table organization. A pixel with value 67 (binary 01000011) is displayed on the screen with the red electron gun at 9/15 of maximum, green at 10/15, and blue at 1/15. This look-up table is shown with 12 bits per entry. Up to 24 bits per entry are common.

Pseudo-Color: 28 x 24 Color Map LUT
©Larry F. Hodges, Zachary Wartell
0
1
2
3
254
255
RED GREEN BLUE
256 colors chosen from a palette of 16,777,216.
Each entry in the color map LUT can be user defined.
Could be used to define 256 shades of green or
64 shades each of red, blue, green and white,
etc.

Recall our generic CG box…..
©Larry F. Hodges, Zachary Wartell
DisplayProcessor Display
ProcessorMemory
FramebufferVideo
Controller
PeripheralDevices
CPU SystemMemory
System Bus

Display Processor
©Larry F. Hodges, Zachary Wartell, K.R. Subramanian
Synonyms: Graphics Controller, Display Co-Processor, Graphics Accelerator, or GPU
Specialized hardware for rendering graphics primitives into the frame buffer.
b
a
Line(a,b)
a
b
Pixels: P0,0, P1,1, P2,2, P3,2, …. P7,7
Block-Pixel Copy(bitblt)
Scan-Conversion

Display Processor (2)
©Larry F. Hodges, Zachary Wartell
• Fundamental difference among display systems is how much the display processor does versus how much must be done by the graphics subroutine package executing on the general-purpose CPU.
NvidiaTM GTX 285(2009)GPU 1400M trans. 240 shader processors @ 1400Mhz1GB memory 21.4 B pix./sDisplay
Processor
CPUCPU

Video Controller
©Larry F. Hodges, Zachary Wartell
Cycles through the frame buffer, one scan line at a time. Contents of the memory are used the control the CRT's beam intensity or color.
X address
Y address
Pixel value(s)
Raster scan generator
Data
Horizontal and vertical deflection signals
Intensity or color
Linear address
Set or increment
Set or decrement
M e m o r y
Framebuffer
=
RAMDAC

Single Frame Buffer & Animation
Framebuffer
VideoController
GraphicsProcessor
problem with one object
problem with multiple objects
GraphicsProcessor
VideoController
©Zachary Wartell
(Front)
(Back)
(Back)
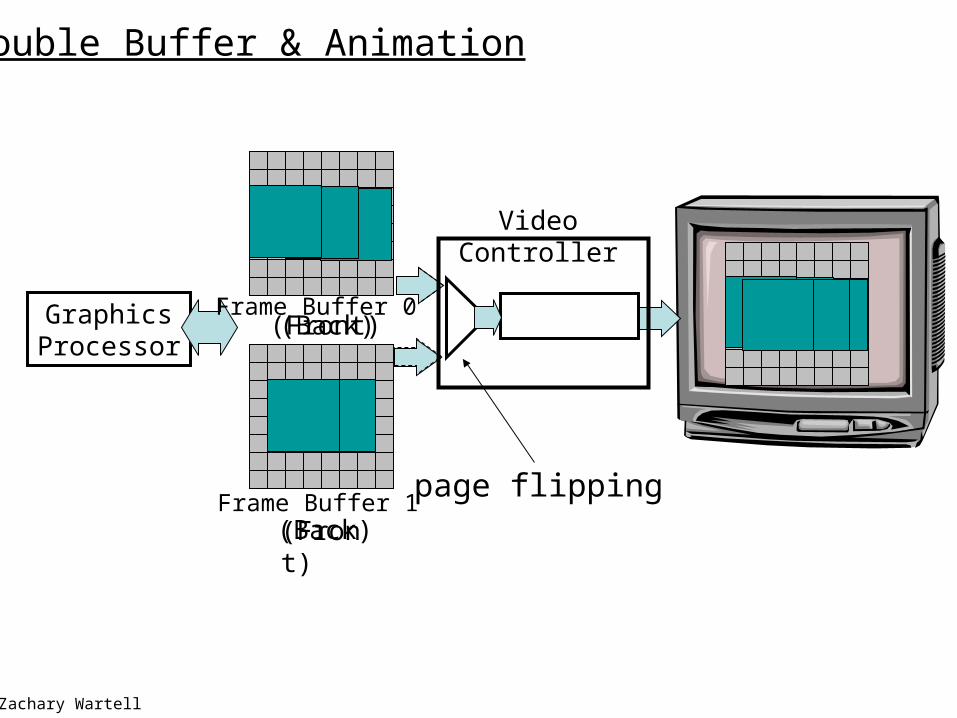
Double Buffer & Animation
GraphicsProcessor
VideoController
Frame Buffer 0
Frame Buffer 1(Front)
©Zachary Wartell
page flipping

Projectors
©Larry F. Hodges, Zachary Wartell
• Use bright CRT, LCD or DMD screens to generate an image which is sent through an optical system to focus on a (usually) large screen.
• Full color obtained by having separate monochromatic projector for each of the R,G,& B color channels

Advantages/Disadvantages of Projection Display
©Larry F. Hodges, Zachary Wartell
• Very large screens can provide large FoV and can be seen by several people simultaneously.
• Image quality can be fuzzy and somewhat dimmer than conventional displays.
• Sensitivity to ambient light.• Delicate optical alignment.

Displays in Virtual Reality
©Larry F. Hodges, Zachary Wartell
• Head-Mounted Displays (HMDs)– The display and a position tracker are
attached to the user’s head
• Head-Tracked Displays (HTDs)– Display is stationary, tracker tracks the
user’s head relative to the display.– Example: CAVE, Workbench, Stereo monitor

3D Display
©Larry F. Hodges, Zachary Wartell
binocular vision & stereopsis – a strong depth cue in physical world
3D Display – must generate at least two different images simultaneously, one per eye. The two images mimic the geometric differences seen in the physical world
volumetric display – pixels physically (or optically) spread over real 3D volume
stereoscopic display – two planar images. Optically channel left image to left eye and right image to right eye. Used in HMD, HTD, and regular displays.
-auto-stereoscopic versus wearing glasses
-commodity products available ($100 for LCD 3D glasses)
”wavefront” display – (in practice a hologram) a single planar display surface. Uses holographic optics to create full (omni-directional) wavefronts of light emanating from the virtual 3D world. [Interactive holography still in pure research phase – MIT, 3” partial-parallax hologram]

Before leaving displays, lets briefly discuss:
• Light
• Eye
- Physiology
- Functionality
• Color
- Perceptually based models
Color and Vision (Brief)

Light & Vision
© Kessler , Watson, Hodges, Ribarsky
• Vision is perception of electromagnetic energy (EM radiation).
• Humans can only perceive a very small portion of the EM spectrum:
Wavelength (nm)
Gamma X UV Infra Radar FM TV AM AC
Violet Blue Green Yellow Red 400 500 600 700

ciliary muscle
Eye Structure
• The eye can be viewed as a dynamic, biological camera: it has a lens, a focal length, and an equivalent of film.
• A simple diagram of the eye's structure:
retina
lens
cornea
© Wartell
suspensory ligments
iris
pupil

Eye: The Lens
• The lens must focus (accommodation) on directly on the retina for perfect vision:
• But age, genetic factors, malnutrition and disease can unfocus the eye, leading to near- and farsightedness:
FarsightedNearsighted
© Kessler , Watson, Hodges, Ribarsky

Eye: The Retina
• The retina functions as the eye's "film".
• It is covered with cells sensitive to light. These cells turn the light into electrochemical impulses that are sent to the brain.
• There are two types of cells, rods and cones
© Kessler , Watson, Hodges, Ribarsky
Retina
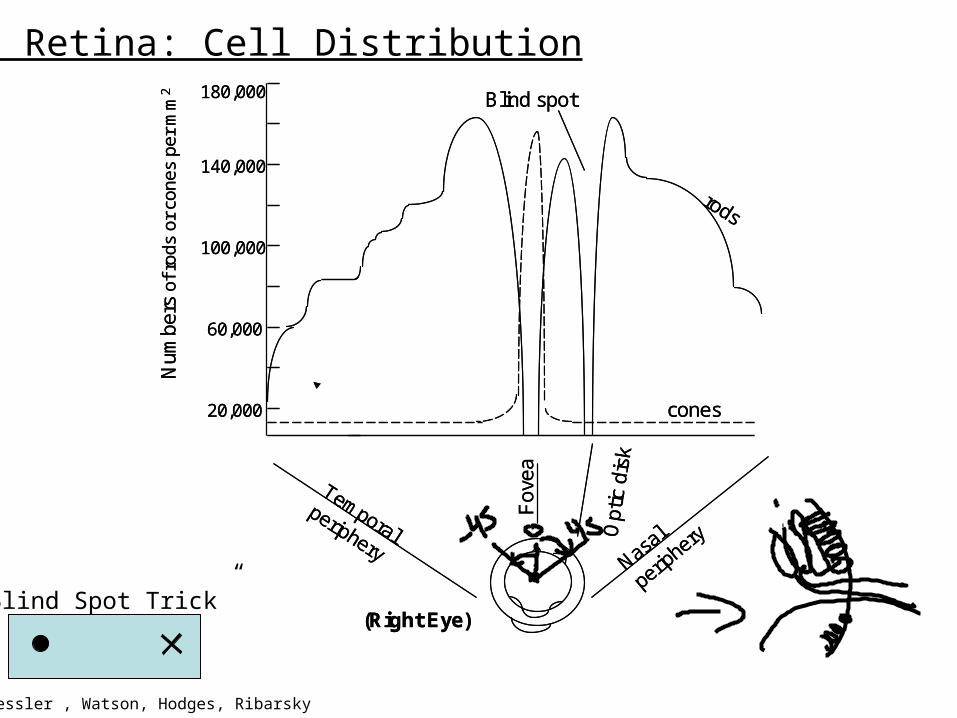
The Retina: Cell Distribution
© Kessler , Watson, Hodges, Ribarsky
20,000
100,000
60,000
180,000
140,000
cones
rods
Blind spot
Num
bers
of r
ods
or c
ones
pe
r m
m2
Temporal periphery
Fov
ea
Opt
ic d
isk
Nasal
periphery
(Right Eye)
20,000
100,000
60,000
180,000
140,000
cones
rods
Blind spot
Num
bers
of r
ods
or c
ones
pe
r m
m2
Temporal periphery
Fov
ea
Opt
ic d
isk
Nasal
periphery
(Right Eye)“Blind Spot Trick”
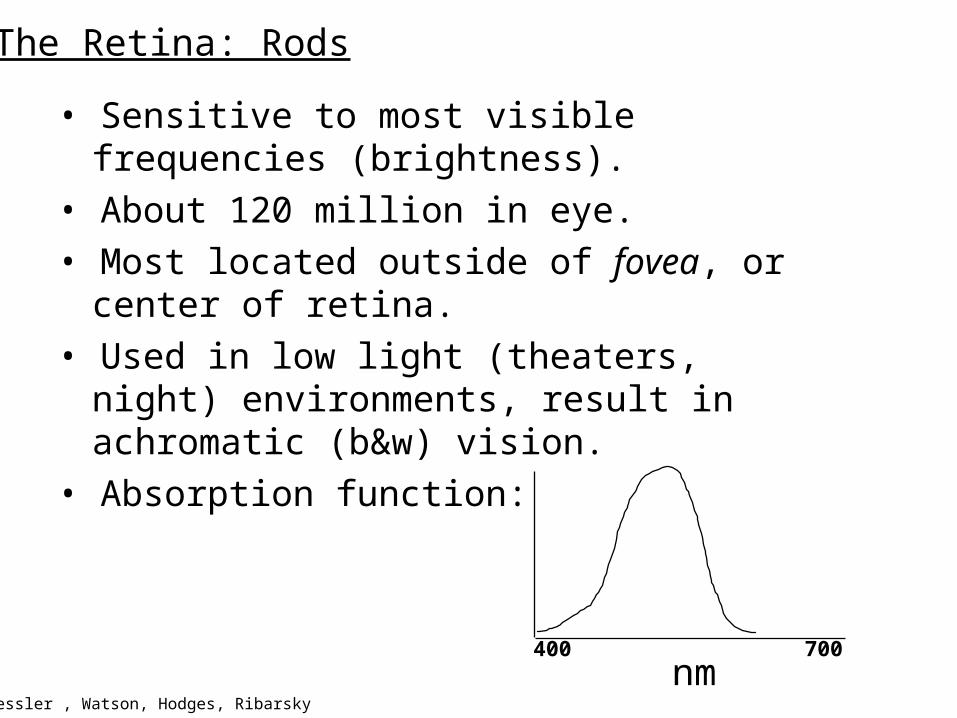
The Retina: Rods
© Kessler , Watson, Hodges, Ribarsky
• Sensitive to most visible frequencies (brightness).
• About 120 million in eye.
• Most located outside of fovea, or center of retina.
• Used in low light (theaters, night) environments, result in achromatic (b&w) vision.
• Absorption function:
400 700nm

The Retina: Cones
© Kessler , Watson, Hodges, Ribarsky
• R cones are sensitive to long wavelengths (nm), G to middle nm, and B to short nm.
• R: 64%, 32% G, 2% B• About 8 million in eye.• Highly concentrated in fovea, with B cones more
evenly distributed than the others (hence less in fovea).
• Used for high detail color vision (CRTs!), so they will concern us most.

The Retina: Cones
© Kessler , Watson, Hodges, Ribarsky
• The absorption functions of the cones are:
400 700
B G R445 nm 535 nm
575 nm

Color Constancy
© Kessler , Watson, Hodges, Ribarsky
• If color is just light of a certain wavelength, why does a yellow object always look yellow under different lighting (e.g. interior/exterior)?
• This is the phenomenon of color constancy.
• Colors are constant under different lighting because the brain responds to ratios between the R, G and B cones, and not magnitudes.
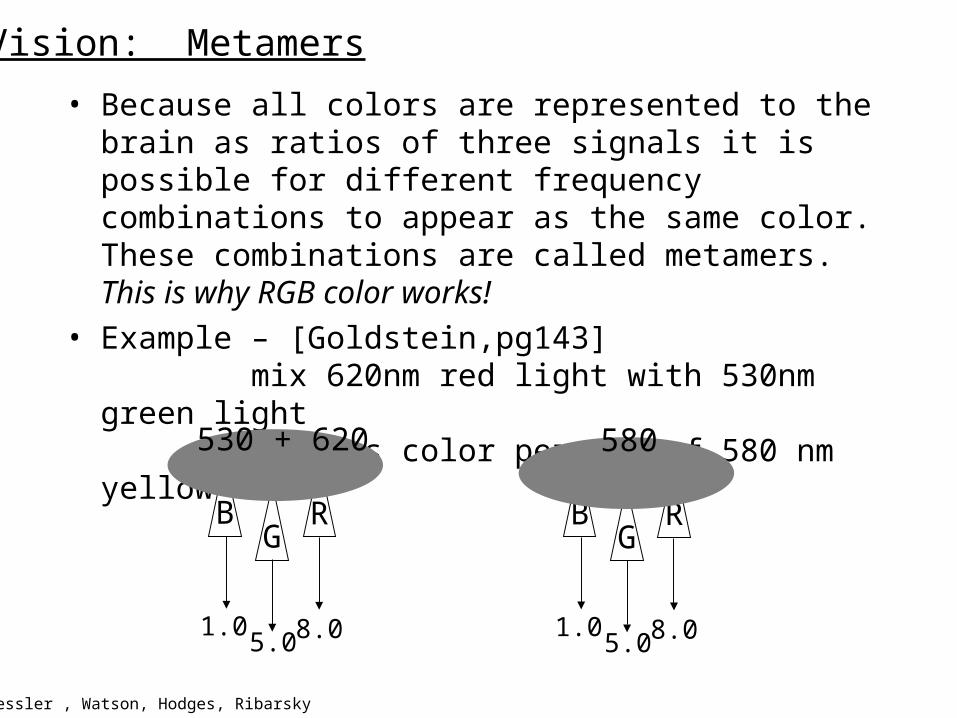
Vision: Metamers
© Kessler , Watson, Hodges, Ribarsky
• Because all colors are represented to the brain as ratios of three signals it is possible for different frequency combinations to appear as the same color. These combinations are called metamers. This is why RGB color works!
• Example – [Goldstein,pg143] mix 620nm red light with 530nm green light matches color percept of 580 nm yellow
BG
R
1.05.0 8.0
BG
R
1.05.0 8.0
530 + 620 580

Sensitivity vs Acuity
© Kessler , Watson, Hodges, Ribarsky
• Sensitivity is a measure of the dimmest light the eye can detect.
• Acuity is a measure of the smallest object the eye can see.
• These two capabilities are in competition.– In the fovea, cones are closely packed. Acuity
is at its highest, sensitivity is at its lowest (30 cycles per degree).
– Outside the fovea, acuity decreases rapidly. Sensitivity increases correspondingly.

Eye Versus 1280 x 1024 Display
© Kessler , Watson, Hodges, Ribarsky
28° 1280 pixel = 640 cycles
33 cm
Pictured: 22.8 c/d (cycles/degree_ with Vres=600/x → 26.25→ 20/26.25 vision (Snellen acuity)Widescreen at 60° → 20/56.25 vision
66 cm
Input Devices
©Larry F. Hodges, Zachary Wartell
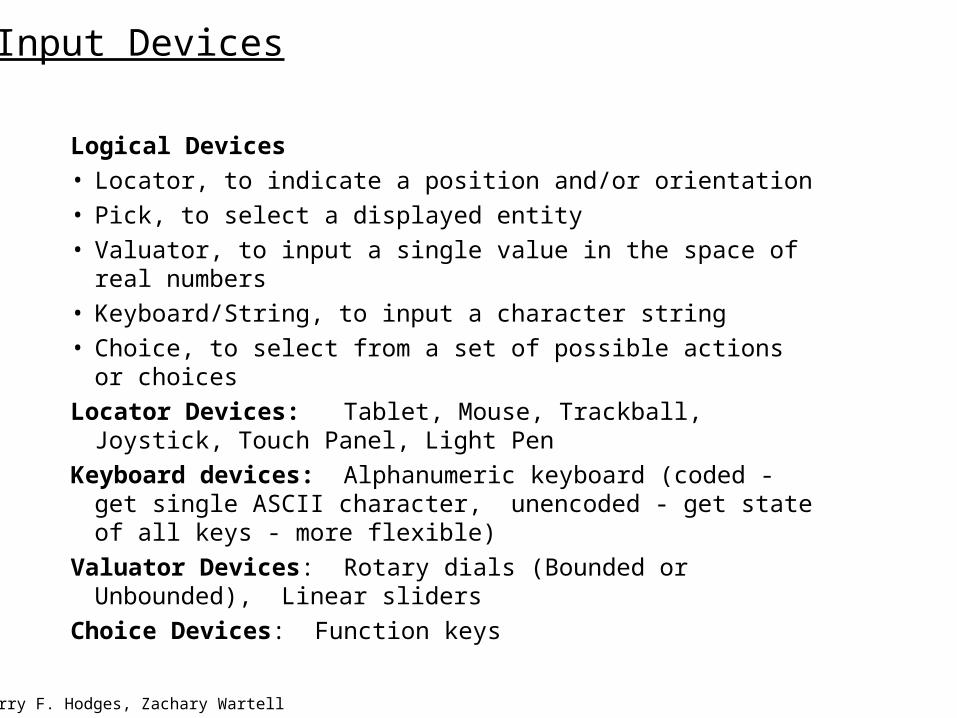
Logical Devices
• Locator, to indicate a position and/or orientation
• Pick, to select a displayed entity
• Valuator, to input a single value in the space of real numbers
• Keyboard/String, to input a character string
• Choice, to select from a set of possible actions or choices
Locator Devices: Tablet, Mouse, Trackball, Joystick, Touch Panel, Light Pen
Keyboard devices: Alphanumeric keyboard (coded - get single ASCII character, unencoded - get state of all keys - more flexible)
Valuator Devices: Rotary dials (Bounded or Unbounded), Linear sliders
Choice Devices: Function keys

Locator Devices
©Larry F. Hodges, Zachary Wartell
degrees of freedom
2 DOF (mouse)
3 DOF (mouse+wheel), 3-space position tracker, mouse with rotation
6 DOF: 3-space position and orientation tracker
isotonic, isometric, elastic
controller order (differential mapping of physical to virtual movement)
0th order – position
1st order – velocity
2nd order – acceleration
SpaceballTM

Revisions
Revision 1.1 – updated slide 75 on metamers, updated eye diagram slide 68Revision 1.2 – added double buffer slides