Introduction 1 Color Theory 1 Color Management 3 · Introduction 1 Color Theory 1 ... in various...
17
Transcript of Introduction 1 Color Theory 1 Color Management 3 · Introduction 1 Color Theory 1 ... in various...
Introduction 1
Color Theory 1
Additive and Subtractive Color 1
Color in Technology 2
Color Management 3
Colorimetry 3
Profi ling 6
The 4 C’s 7
Monitor Calibration and Profi ling 8
Scanner Calibration and Profi ling 9
Digital Camera Calibration and Profi ling 10
Printer Calibration and Profi ling 11
ICC Workfl ow 11
ICC Compatible Applications 12
Conclusion 14


1
COLOR
INTRODUCTIONColor management is using software and hardware to obtain optimal color reproduction from one device to another. Color management uses standard International Color Consortium (ICC) profiles. These ICC profiles contain information about the color characteristics of all devices in a color reproduction system, such as digital cameras, scanners, monitors, proofers and printers. They can also be read by “ICC-aware” applications, including most production software programs such as Photoshop and Illustrator.
Prior to color management, skilled operators used drum scanners to adjust and customize color for specifi c printing presses and papers. The process was highly specialized and very expensive. Today, color management enables almost anyone to get high-quality color from various input devices such as desktop scanners and digital cameras, as well as a variety of output devices, including desktop and large-format color printers.
The benefits of color management include:
• Color is optimized during input, so scans and digital photographs closely match the original.
• Color is optimized upon output, enabling an original photo or scene to be matched closely on any printer, with any substrate or ink.
• Colors appear on-screen as they will look when printed.
• Digital proofs simulate printed products, which means proofs from low-cost or one-off devices will mimic a larger format printing press.
• Professional users have an accurate starting point for manual color corrections.
• Novice users get good plug-and-play color without a lot of color knowledge.
COLOR THEORYAdditive and Subtractive ColorTo understand how color management works, it is helpful to know about the additive and subtractive systems of color reproduction. Both systems use a small number of primary colors that combine to produce a large number (gamut) of colors.
The visible color spectrum, or rainbow, encompasses light wavelengths from approximately 380 to 720 nm. When divided into three primary colors, the rainbow will break down into red, green, and blue (RGB).
Additive color models. The primary additive color model, RGB, uses combinations of red, green and blue light to produce a multitude of colors. When mixed in various combinations, these three colors can create millions of distinct colors. If they are mixed in equal quantities, the color is perceived as white.
The human eye uses the RGB color model. Here’s how it works. Imagine a red apple sitting on a table under a kitchen light. All of the colors of the light are shining on the apple, yet we only see red. This is because the surface of the apple is absorbing (or subtracting) the green and blue rays of the white light and refl ecting the red. So, when you look at the red apple, the eye receives the refl ected red light and sends a message to the brain… This apple is red.

2
COLORCOLOR
Many digital devices also work in RGB. Scanners and digital cameras capture images in RGB, and computer monitors display images in RGB. These devices work by combining combinations of red, green and blue light to capture or represent a multitude of colors.
Subtractive color models. Vice versa, subtractive color systems work by subtracting, or absorbing, selected colors of light that are refl ected off of, or transmitted through them. The CMY color model manipulates refl ective colors by using the colors that sit opposite RGB on the color wheel: cyan, magenta, and yellow. It’s important to understand how the RGB and CMY color models interact.
In the RGB color model, red, green and blue mix to make CMY.
• Green and blue mix to make cyan (C).
• Red and blue mix to make magenta (M).
• Red and green mix to make yellow (Y).
In the CMY color model, the colors mix to make RGB.
• Magenta and yellow mix to make red (R).
• Cyan and yellow make green (G).
• Cyan and magenta make blue (B).
Color in technologySubtractive color printing. Cyan, magenta and yellow are used in all dye and ink on paper processes, including photography, inkjet and offset printing. Digital imaging devices that use these inks work by subtracting, or absorbing, the RGB colors.
Here is an example of how subtractive printing works. To print a red apple, we need a white light source, a white sheet of paper and a pair of eyes to view it. The paper appears to be white because all of the RGB lights from the light source are bouncing off the paper and into the eye. Printing magenta ink on the paper will cause the green light to be absorbed, leaving behind the red and blue light. The eye perceives this color as magenta. Adding a layer of yellow ink will subtract the blue light as well, leaving behind just the red light. From this, the human eye will perceive the printed apple as red.
Due to impurities, printing all three CMY inks creates a grayish-brown color instead of black. To add density and correct the color of image shadows in subtractive color printing, a fourth color, black (K, which stands for “key”) is added. Including black ink is a more cost-effective way to create this popular color, which is used for text and line art. These printers are often called “4-color”, or “CMYK” printers.
yellow
blue
magentacyan
magenta
yellow
ADDITIVE COLOR
SUBTRACTIVE COLOR
cyan
blue
red
green red
green
Write down RGB and CMY in two columns. The opposites fall across from one another. To determine the mixes, eliminate the opposite. For example, to know which two colors in RGB make magenta, eliminate the opposite of
magenta, which is green. The remaining colors, red and blue, mix to create magenta.
How to Remember the Color Models

3
COLOR
Color separations. CMYK color separations were first made on graphic art cameras and photographic enlargers using RGB filters. In the 1980s a technique called gray component replacement (GCR) was developed, in which combinations of CMY colors (which produced a muddy color) were removed from the color separations and replaced with black. The black separation required for GCR became known as a GCR black. A related process, under color removal (UCR), replaces CMY colors, in shadows only, with black. This is known as a UCR black.
Total ink coverage. In CMYK printing it is often important to limit the total amount of ink that prints on the page. Excessive ink can lead to long drying times, smudging, setoff of ink onto the sheet above and excessive ink usage. When making UCR or GCR separations, the total amount of ink in a particular image area can be quantified as total ink coverage. On a scale of 0–400%, each color makes up one hundred percent. So, one hundred percent of each color, C+M+Y+K, would equal 400% total ink coverage. The standard total ink coverage range for CMYK printing is typically between 200% and 320%.
Spot colors. Ink colors that are selected from a specifi cation book, such as PANTONE®, are called spot colors. Each color is mixed in a can and placed
in a printing unit on the press. PANTONE colors are mixed from 14 primary ink colors according to a recipe book. These colors are intended for use on two-color presses, with black plus a spot color, or on multi-unit presses, where CMYK plus a spot color may be printed.
PANTONE colors can be simulated with CMYK tint percentages (which have been developed by Pantone, Inc.), but CMYK simulations are unable to completely match most of the original PANTONE colors.
Multi-color printing. Although process-color printing uses three primary color inks and black (CMYK), it is possible to add more colors. A fifth, sixth, or even seventh color can extend the color gamut to a much wider range of colors. Additional colors may include orange, blue, green or red. PANTONE Hexachrome® is a six-color system, which includes orange and green, for printing with an extended color gamut.
A number of large-format inkjet printers use a six-color system consisting of CMYK, plus light cyan and light magenta. The lighter process colors enable finer tonal gradations in highlights to be printed, with a less conspicuous dot structure, but they do not enhance the gamut.
Colorimetry
CIE Standard Observer experiment (left) was used to defi ne the color gamut of the human eye, which can be graphed in the CIE Chromaticity Diagram (xyY diagram, center). CIE L*a*b* (CIELAB) colorspace is calculated from CIE xyY chromaticity values and provides a more uniform, circular colorspace for color difference comparison. (Courtesy of GretagMacbeth and X-Rite)
standard observer responses
.50
vers
eye
fovea
10˚
CIE standard obser
whi
te s
cree
n observer
400 nm 500 nm 600 nm 700 nm
CIE Standard Observer
Chromaticity
CIE xyY Chromaticity Diagram
whiteL*
green-a*
blue-b*
yellow+b*
black
red+a*
CIELab
90˚yellow
+b*
180˚green
-a*
hue
h˚h˚
C*C*
270˚blue-b*
0˚red+a*
CIELCh
-10
-10
10
10
20
20
30
30
40
40
50
50
60
60
-20
-20
-30
-30
-40
-40
-50
-50
-60
-60
+ b*YYellowellowYellowYYellowY
Hue
Chrom
Chrom
Chromaa
+ a*Red
- b*BBluelue
- a*- a*Greenreen
90°
0°
270°
180°
Chrom
Chrom
Chrom
Chrom
Chrom
CIE L*a*b* Colorspace

4
COLORCOLOR
COLOR MANAGEMENTColorimetryColorimetry is a way of measuring and quantifying the color of an object based on a standard light source and a standard model of human vision.
Three basic types of color measurement instruments are used in the graphic arts. Listed in increasing sophistication, they are densitometers, colorimeters, and spectrophotometers.
Densitometers. Densitometers measure color through red, green, and blue filters that are similar to those used for color separation. Cyan is measured through a red filter, magenta through green, and yellow through blue. To measure black, a special “visual” color filter balances the light source and provides even illumination across the spectrum. Since the filters make their complimentary color inks look dark, densitometers are sometimes said to “see” in black-and-white.
A color reflection densitometer shines light onto a surface, such as a printed press sheet with a color target, and measures the amount of light returned to its sensor.
Colorimeters. Colorimeters also measure color through red, green, and blue filters. However,
unlike densitometers, they calculate values in three-dimensional color spaces that more closely represent human vision. It’s been said that they “see” in color.
They also standardize human visual response by using the CIE Standard Observer, a mathematical model of vision developed in 1932 by the Vienna-based Commission Internationale de l’Eclairage.
Most monitor measuring devices are colorimeters.
Spectrophotometers. Spectrophotometers measure light reflectance across the visible spectrum of light, from approximately 380–720 nm wavelengths. This very precise data can then be converted into densitometric or colormetric data. The spectrophotometer is the most useful measurement device because it can be used for density calibration as well as ICC profiling.
Reflective and Transmissive Measurements. Densitometers, colorimeters and spectrophotometers can all read reflective material. Some are even able to measure transmissive material, such as large-format transperency film and backlit media.
CIE Standard Observer. The CIE Standard Observer is a mathematical model of human vision that is based on a small sample of individuals with normal vision who were tested by the Commission Internationale de l’Eclairage (CIE) in 1932. The individuals sat in front of a white board with a semi-circle of spectral light projected on half of it. The other half of the board contained a mixture of red, green, and blue additive primary light colors that the individual could adjust with dimmers. Each individual was asked to dial in the amount of RGB primaries that he or she felt provided the best match to the spectral color. The results provided a map of the entire spectrum of RGB primary colors, and therefore a model of human vision.
Most colorimeters and spectrophotometers enable the user to select from two Standard Observers:
• The 2° Standard Observer is the original Standard Observer developed by the CIE in 1932, where test subjects’ vision was focused on a
Color Measurement
GretagMacbeth SpectroEye® (left) and X-Rite 500 Spectrodensitometer are two color measurement instruments that take spectral readings. The instruments also function as colorimeters and densitometers. (Courtesy of GretagMacbeth®)

5
COLOR
2° circle of light. The subjects’ vision was focused on the fovea, the area of the retina most sensitive to color. The 2° observer is most commonly used for graphic arts purposes, where viewers look at objects at close distance and scrutinize the color.
• The 10° Standard Observer, developed by the CIE in 1964, used a 10° circle of light, and allowed additional light to fall outside the fovea. The 10° observer is more commonly used for matching colors that people will see over a larger area and at greater distance (covering more of the retina) such as automobile and house paint.
CIE Standard Illuminant. The CIE defi ned several standard illuminants called A, B, C, and D. These illuminants are characterized by spectral power distribution curves, which are like spectral curves for light sources.
Illuminant Description Color Temp.
A Incandescent light 2850
B Noon daylight 4874
C Average daylight 6770
D50 Noon daylight 5000
D65 Avg north sky daylight 6500
D75 North sky daylight 7500
The whiteness of light is characterized on the Kelvin scale, which represents the absolute temperature of a theoretical black body that changes color as it
is heated. This concept is visually represented in a flame, which changes color as it gets hotter. Relatively low temperature candlelight is yellow, while a much hotter welder’s torch is blue. Similarly, warm looking incandescent lights have a color temperature of 2–3000 K, while bluish computer monitors are closer to 9300 K.
The graphic arts Standard Viewing Conditions is D50, or 5000 K. This approximates noon daylight.
Colorimetric Spaces. Color is measured in three-dimensions using colorimetry. The position of a color in colorimetric space is calculated by using a CIE standard illuminant (usually D50 or D65), a CIE Standard Observer (2° or 10°), and the spectral colors reflected (or transmitted) by the object to be measured.
Basic colorimetric measurement is expressed as three values—X, Y, and Z—each representing the relative amounts of red, green, and blue primary colors reflected by the object and detected by the standard observer.
XYZ values are graphed in a three-dimensional plot known as the CIE Chromaticity Diagram, a horseshoe-shaped diagram representing all of the colors perceived by the human eye. Since the color values in the CIE Chromaticity Diagram are x (red-green), y (blue-yellow), and Y (luminance), the diagram is also known as CIE xyY colorspace. This
Colors of White Light
CIE Spectral power distribution curves represent the “color” of light sources. CIE Standard Illuminants A (incandescent light) and D65 (daylight) are compared with a cool white fl uorescent and TL84 daylight fl uorescent bulb. (Courtesy of GretagMacbeth)
Illuminant A
400 700
Nor
mal
ized
Spe
ctra
l Pow
er(W
/%N
M/1
0000
00 L
M)
600
0700
Nor
mal
ized
Spe
ctra
l Pow
er
600TL84
700
Nor
mal
ized
Spe
ctra
l Pow
er(W
/%N
M/1
0000
00 L
M)
600Cool White Fluorescent
400 700
Nor
mal
ized
Spe
ctra
l Pow
er(W
/%N
M/1
0000
00 L
M)
600
0
CIE D65
Wavelength (nm)

6
COLORCOLOR
space is often used to graph and compare the color gamuts of different reproduction processes, such as a color monitor or CMYK printer. CIE xyY color space is not uniform, so it is not helpful for comparing one color to another.
CIE L*a*b* (or CIELAB) is a mathematical transformation of the CIE xyY color space, and provides a circular and more even space. The values represent red-green (a*), blue-yellow (b*), and luminance (L*). CIELAB is much better for comparing colors.
Two colors can be compared in CIELAB color space by measuring the distance between them, called delta E (ΔE). The CIE CMC method of calculating delta E uses non-uniform, elliptical areas of color to quantify color difference. Distance is calculated from the three coordinates of each sample using the algebraic distance formula. If two colors have a delta E of 1 or 2, the difference between them is barely perceptible. Higher delta E values have more noticeable color differences. To try to more closely approximate perceived color distances, three alternative formulas to CIELAB have been introduced: Delta E CMC, Delta E 1994, and Delta E 2000. Each revision in the formula attempted to fi nd a number that more accurately measured color difference as perceived by the eye. Many of these more advanced CIELAB systems are available on today’s measurement instruments.
Delta E
Delta E CMC
Delta E 1994
Delta E 2000
To get an idea of how the different delta-E formulas measure color difference, compare the readings of print samples in the table below. For example, note that the newer delta E formulas tend to produce lower values for saturated colors and higher values for neutral colors, which accurately represents the eye’s sensitivity.
ΔE ΔE
CMC
ΔE
94
ΔE
2000
Green-cyan100 0 100 0 vs,100 0 0 0
62.98 30.21 35.22 34.99
Red-orange0 100 100 0 vs.0 75 100 0
19.94 11.71 11.55 12.51
Fleshtone30 40 50 0 vs.30 45 50 0
3.81 5.87 3.15 3.81
Neutral50 50 50 0 vs.60 50 50 0
7.32 4.31 7.26 6.94
ProfilingEach device used for color reproduction creates, displays and prints color a little differently. Even identical devices built on the same day from the same manufacturer will have slight variations in color. Color devices in technology are similar to fi ngerprints—each is unique.
Color management helps overcome these variations by creating data fi les that describe the unique characteristics of individual digital devices. The result enables color matching between devices, including from monitor to print, between an original photograph and a digital fi le, and even between two prints created on different media with different inks.
Profi ling. Color management is based on colorimetrically measuring samples from a digital device and producing data fi les that describe it. A profi le is essentially a three-dimensional map, or color space, of all of the colors a device can capture, display or print.
Using color management to get consistent color across multiple devices with many different software programs depends greatly on industry standards.
The International Color Consortium was founded by Apple Computer in 1995 with Adobe, Agfa, Kodak, Microsoft, Silicon Graphics, Sun, and other partners. The goal of the ICC was to create a standard profile
ΔE ΔE CMC ΔE 94 ΔE 00

7
COLOR
format that could be used on any platform. The first solution to support the ICC profile format was ColorSync 2.0, introduced at Seybold seminars in March 1995. Since then, the format has been widely adopted and is supported on numerous platforms, including Windows, Macintosh, and UNIX.
The ICC standard provides RGB format profiles for scanners, digital cameras, and monitors, CMYK format for printers and proofers, and multi-color format for multi color processes like PANTONE® Hexachrome® (a six-color printing process using CMYK plus orange and green). The ICC standard also provides ICC-Link profiles, which include the characteristics of two devices. ICC-Link profiles are most often used for simulating one device on another, such to make a digital proof that matches a printing press.
Color profi le technology is widely used in photography and graphics today. Desktop applications like Adobe Photoshop use color profi les, as do most professional color software and devices.
The 4 C’sAlthough profi ling is the key to color management, several other steps are also necessary. Known as the “Four Cs” of color management, these steps form a hierarchy in which each process is dependent upon the preceding step.
Consistency. The first step in color management is to ensure the device is able to reproduce color consistently. Optimized settings provide the best on-screen image reproduction. Consistency is different for every type of device, and often involves operational and environmental factors.
One factor in consistency is repeatability, or whether the device can scan, photograph, display or print color in the same way, every time. For a scanner, this means that any automatic features that evaluate an image and adjust the scan settings must be turned off so that all scans are consistent. Or, an inkjet printer may need to be located in a temperature and humidity controlled environment if these variables are affecting
output.
The device must also be able to reproduce uniform color across the screen or page. For example, if a monitor’s color is not uniform across the screen, an ICC profile cannot help achieve accurate color. An offset press operator has the combined challenge of maintaining uniformity across the width of the press and repeatability throughout the press run by constantly monitoring color control bars.
Calibration. Once a device is reproducing consistent color, it must be calibrated. Calibration adjusts the device to known specifications, and helps compensate for color “drift” over time. The goal of calibration is to either get the best gamut or range of the specifi c device, or to conform to an industry standard.
For example, high-end drum scanners may require a manual calibration on the drum, while most quality flatbeds do this automatically. This calibration brings the scanner’s behavior in line with factory standards. Other settings in the scanner driver may be used to optimize the gamut of the scanner and are also considered part of the calibration. For inkjet printers, the calibration may involve setting ink limits and linearizing to provide for predictable output with the widest gamut. A press is usually calibrated to industry standards to assure that it produces color consistent with other similar presses.
Characterization. After the device is known to reproduce color consistently and has been calibrated, it’s time to determine its color reproduction characteristics. This step is known as characterization. A colorimeter or a spectrophotometer is used to measure the device’s actual RGB or CMYK color values. Profi ling involves comparing these values with the measured colorimetric values of the same sample colors.
To characterize a scanner, a target with hundreds of color patches is scanned and compared to the colorimetric measurements of the same target. A monitor is characterized by flashing a series of known RGB values on the display and reading the resulting colorimetric values. To characterize a CMYK printer,

8
COLORCOLOR
a test chart with anywhere from a few to thousands of color samples is printed and measured with a spectrophotometer or colorimeter. In each of these scenarios, the device’s RGB or CMYK values are used to make an ICC profile.
Conversion. The main goal of color management is to match color appearance as closely as possible from input to output and from one device to another. For example, if an image is captured by an RGB scanner, edited in a design application, then printed on a CMYK printer, it must be converted that many times.
Each device uses slightly different CMYK or RGB formulas to create the same color. The color conversion between devices takes place in a device-independent colorspace known as CIELAB, or profi le connection space. Scanning programs, image-editing programs, workfl ow programs and RIPs can all do color conversion, and profi les help retain the color appearance as the image moves from color space to color space.
ICC profiles are stored in standard locations on computer workstations. In the Apple Macintosh operating system 9, ICC profiles are stored in the System Folder > ColorSync Profiles folder. On Windows 2000, profiles are stored in the WINNT > System 32 > Spool > Drivers > Color folder.
In OSX, ICC can be placed in two places. To make profi les available to all OSX system users, put them into a Root directory of the hard drive: /Library/Colorsync/Profiles. If the profile should only be available to one user, place it in the user’s Home directory: Users/User Name/Library/Colorsync/Profiles (User Name = login name).User Name = login name).User Name
Different applications will look for profiles in different locations. Some scanner drivers will look in the User directory, while others will look in the Root directory. To determine where a specifi c device will look for a profi le, look for the profi les that were installed when the device was installed and put the new custom profile in the same location. Or, copy the profiles to both locations. Profiles are small files that
will not cause any problems.
Monitor Calibration and ProfilingMonitor consistency. To achieve accurate and consistent color, a monitor should have suitable brightness, contrast, and color stability over time. As monitors age, the phosphors become weaker, so older monitors may not be able to achieve satisfactory brightness levels for evaluating color.
Monitor calibration and characterization. To profile the monitor you will need a color profiling program capable of profiling monitors, and a colorimeter that reads emitted light from a screen. Keep in mind that not all colorimeters can read LCD flat-panel displays.
The fi rst step in monitor profi ling is to achieve consistency on the monitor by optimizing the hardware settings (if available) for contrast, brightness and color temperature. Optimized settings provide the best image reproduction.
Calibration means achieving a known standard of performance. Some monitor profiling applications provide feedback to help set the optimal brightness
Monitor Calibration and Profiling
Select the desired gamma and white point and calibrate the monitor to the same gamma and white point. After profi ling the monitor, the profi le is selected in applications for accurate soft proofi ng on the display. (Courtesy of GretagMacbeth)
x
y
0.1
0.1
0.2
0.2
0.3
0.4
0.5
0.6
0.7
0.8
0.3 0.4 0.5 0.6 0.7
Adobe RGB
(1998)
BruceRGB
ColorMatch
RGB
sRGB
SWOP
(ANSI/CGATS
TR001)
Wide Gamut
RGB

9
COLOR
and contrast. Before calibrating the monitor, determine the standards you want to match.
To calibrate the monitor, set the gamma and white point to match that of the selected RGB working space. Some users prefer D50 because it matches the international graphic arts standard for color viewing, while others prefer D65 because it allows the monitor to be brighter.
When selecting a white point, consider the following: D50 has a yellower appearance and usually works well for commercial printing environments where prints are run on duller, yellower stock or media. D65 is a little brighter and bluer, and works well for brighter white media like inkjet and photographic paper.
After calibrating, the monitor calibration program will create an ICC profi le. Save it to the “ColorSync” profiles folder (Macintosh) or “Color” folder (Windows). Most display applications will
automatically recognize the new monitor profi le, but it is a good idea to go to the display control panel to confi rm that it is set correctly.
Most desktop publishing applications will also reference the new monitor profi le automatically, but some applications will require you to select it in the preferences.
Scanner Calibration and ProfilingScanner consistency. To scan consistent color, a scanner should be able to reproduce uniform densities across the bed or drum. To check uniformity, scan a Kodak gray card or similar target. The scanner should be able to reproduce the entire range of densities that the manufacturer specifies. This can be verifi ed by scanning a transparent or reflective gray scale.
Scanner Profiling
To profi le a scanner, scan the profi ling target (upper left) and save it as a TIFF fi le. A color profi ling application compares the colors in the scanned TIFF fi le with the color measurements of the target contained in the accompanying data reference fi le (left) to calculate a correction. The resulting profi le will help make all colors more accurate to “match the original” and will help synchronize the appearance of multiple scans/fi les.
IT8.7/2ORIGINATOR "Eastman Kodak Company"DESCRIPTOR "Q60R1, IT8.7/2 Data Files, 5x7 inch Ektacolor"CREATED "AUGUST 13, 1998"MANUFACTURER " Eastman Kodak Company"PROD_DATE "1998:07 "SERIAL "1998:07 BATCH AVERAGE DATA"MATERIAL "Ektacolor Product Family"KEYWORD "MEAN_DE" # Mean Delta E of samples compared to batch average## STDEV_DE in this data set is the average of the standard deviations of# L*, a* and b*. It is used to derive an estimate of the chi-squared# parameter which is recommended as the predictor of the variability of# DELTAE. SEE FILE ON THIS DISK CALLED CHI-SQ.*#NUMBER_OF_FIELDS 12BEGIN_DATA_FORMATSAMPLE_ID XYZ_X XYZ_Y XYZ_Z LAB_L LAB_A LAB_B STDEV_X STDEV_Y STDEV_Z MEAN_DE STDEV_DEEND_DATA_FORMATNUMBER_OF_SETS 264BEGIN_DATA#ID X Y Z L A B S_X S_Y S_Z M_DE S_DEA01 3.61 2.98 1.83 19.97 12.17 5.88 0.17 0.13 0.10 0.71 0.44A02 4.65 3.08 1.53 20.35 25.27 9.76 0.19 0.12 0.08 0.70 0.43A03 5.59 3.15 1.27 20.62 35.63 13.36 0.17 0.09 0.06 0.66 0.41A04 6.04 3.24 1.14 21.00 39.09 15.82 0.15 0.08 0.05 0.65 0.40A05 12.26 10.59 7.31 38.87 14.92 5.48 0.39 0.34 0.34 0.91 0.54A06 15.15 11.08 6.45 39.71 29.68 10.57 0.39 0.30 0.30 0.88 0.51A07 18.38 11.62 5.79 40.61 43.75 15.14 0.36 0.25 0.28 0.84 0.47A08 19.50 11.30 5.03 40.08 51.71 17.99 0.30 0.20 0.25 0.84 0.45A09 41.14 40.11 31.44 69.55 7.66 2.51 0.80 0.79 0.79 0.88 0.52A10 43.23 39.77 29.82 69.30 14.99 4.62 0.75 0.75 0.79 0.90 0.53A11 46.52 40.53 28.82 69.84 22.13 7.17 0.66 0.69 0.76 0.92 0.55A12 48.25 41.35 28.93 70.42 24.44 7.99 0.61 0.67 0.76 0.95 0.56A13 72.14 76.38 65.70 90.03 -3.12 -2.55 0.47 0.42 0.31 0.33 0.21A14 73.21 73.68 63.56 88.77 4.54 -2.70 0.37 0.45 0.31 0.37 0.24A15 76.05 78.90 64.92 91.19 -0.06 0.18 0.31 0.33 0.29 0.28 0.16A16 68.09 70.67 58.56 87.33 -0.11 -0.24 0.51 0.52 0.48 0.42 0.25A17 72.40 73.09 59.86 88.49 4.06 0.45 0.39 0.47 0.43 0.43 0.27A18 70.31 74.69 59.50 89.25 -3.62 2.12 0.45 0.41 0.45 0.38 0.24A19 70.63 72.80 64.19 88.35 0.93 -4.02 0.45 0.48 0.30 0.35 0.22B01 3.24 2.84 1.36 19.37 8.86 10.14 0.16 0.13 0.06 0.69 0.43B02 4.13 3.02 0.87 20.11 19.19 18.48 0.17 0.12 0.03 0.66 0.43B03 4.73 3.02 0.54 20.11 27.32 24.37 0.19 0.12 0.02 0.74 0.49B04 4.87 2.92 0.44 19.70 30.85 25.63 0.17 0.10 0.02 0.72 0.48B05 12.48 10.68 5.32 39.03 15.73 14.70 0.39 0.34 0.26 0.92 0.53B06 14.98 11.12 3.51 39.77 28.35 26.38 0.39 0.31 0.17 0.79 0.46B07 18.10 11.64 2.06 40.64 42.17 39.22 0.33 0.24 0.09 0.60 0.35B08 18.73 10.85 1.08 39.32 51.11 48.24 0.24 0.17 0.04 0.41 0.24B09 40.15 39.48 28.61 69.09 6.57 6.22 0.76 0.76 0.79 0.91 0.53B10 42.76 39.88 25.26 69.38 13.25 12.44 0.75 0.75 0.77 0.96 0.55B11 45.85 40.61 22.47 69.90 19.99 18.48 0.64 0.67 0.71 0.99 0.57B12 47.22 40.64 20.68 69.92 23.76 22.06 0.55 0.62 0.68 1.04 0.60B13 63.97 70.24 64.42 87.11 -8.37 -6.38 0.65 0.54 0.30 0.49 0.30
IT8.7 data reference fi le
Scan Without Profi le Scan With Profi le
Scan the target and save as TIFF
10
COLORCOLOR
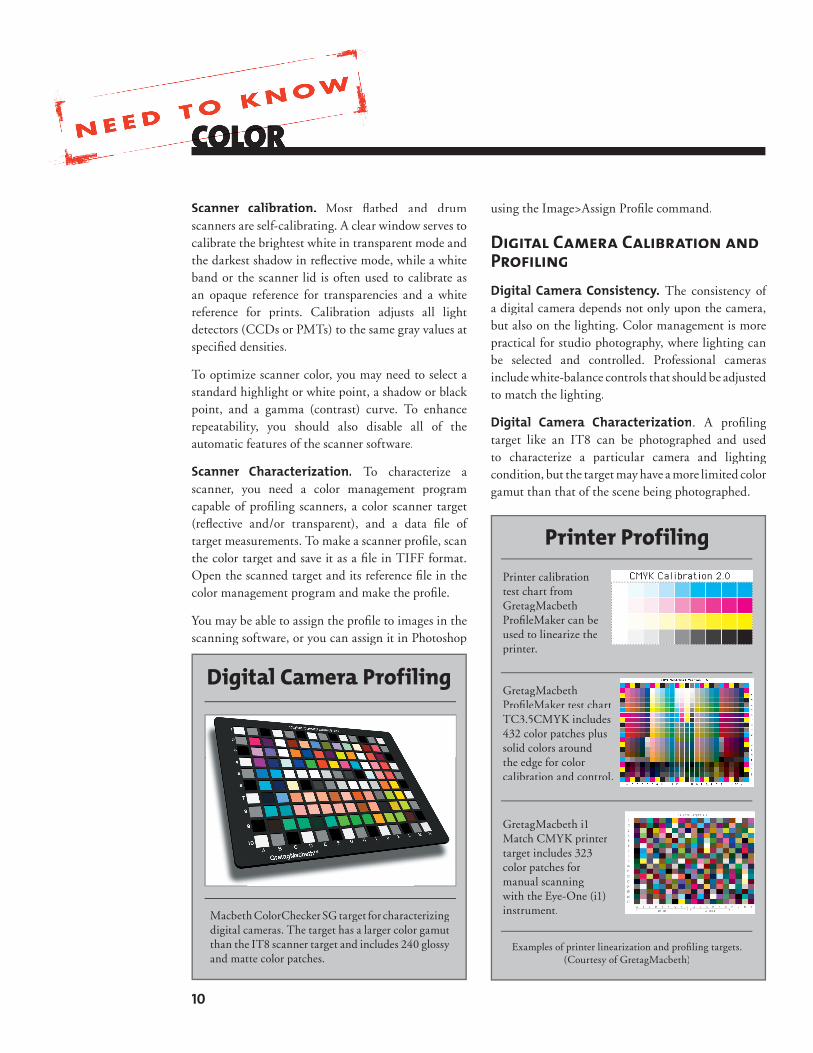
Scanner calibration. Most flatbed and drum scanners are self-calibrating. A clear window serves to calibrate the brightest white in transparent mode and the darkest shadow in reflective mode, while a white band or the scanner lid is often used to calibrate as an opaque reference for transparencies and a white reference for prints. Calibration adjusts all light detectors (CCDs or PMTs) to the same gray values at specified densities.
To optimize scanner color, you may need to select a standard highlight or white point, a shadow or black point, and a gamma (contrast) curve. To enhance repeatability, you should also disable all of the automatic features of the scanner software.
Scanner Characterization. To characterize a scanner, you need a color management program capable of profiling scanners, a color scanner target (reflective and/or transparent), and a data file of target measurements. To make a scanner profile, scan the color target and save it as a file in TIFF format. Open the scanned target and its reference file in the color management program and make the profile.
You may be able to assign the profile to images in the scanning software, or you can assign it in Photoshop
using the Image>Assign Profile command.
Digital Camera Calibration and ProfilingDigital Camera Consistency. The consistency of a digital camera depends not only upon the camera, but also on the lighting. Color management is more practical for studio photography, where lighting can be selected and controlled. Professional cameras include white-balance controls that should be adjusted to match the lighting.
Digital Camera Characterization. A profiling target like an IT8 can be photographed and used to characterize a particular camera and lighting condition, but the target may have a more limited color gamut than that of the scene being photographed.
Printer ProfilingPrinter calibration test chart from GretagMacbeth Profi leMaker can be used to linearize the printer.
Examples of printer linearization and profi ling targets. (Courtesy of GretagMacbeth)
Digital Camera Profiling
Macbeth ColorChecker SG target for characterizing digital cameras. The target has a larger color gamut than the IT8 scanner target and includes 240 glossy and matte color patches.
GretagMacbeth Profi leMaker test chart TC3.5CMYK includes 432 color patches plus solid colors around the edge for color calibration and control.
GretagMacbeth i1 Match CMYK printer target includes 323 color patches for manual scanning with the Eye-One (i1) instrument.

11
COLOR
GretagMacbeth manufacturers a special target for profiling digital cameras, known as the Macbeth ColorChecker SG. This target has 140 color and gray patches.
Digital camera profiling is similar to that of scanners. Make sure the target is square and evenly illuminated when photographing. It is critical to avoid glare on the patches to produce an accurate profile.
Printer Calibration and ProfilingPrinter Consistency. To be consistent, a color printer should be capable of reproducing color at the same densities and tone values from print to print and over time. A controlled environment may be necessary if the colorant and substrate are sensitive to temperature and humidity.
To check the consistency of desktop printers and proofers, try printing a light gray patch of 15% CMY across the sheet. This will reveal streaks or patches of inconsistent density.
Printing presses should be outfitted with color control bars and densitometric color control.
Printer Calibration. Digital printers and proofers should be calibrated to standard densities and tone values using the manufacturer’s calibration routine. Many RIPs and color management software programs include calibration functions.
Printer Characterization. To characterize a printer/proofer, you will need a color management program capable of profiling printers and a color measurement instrument that can read reflective color values.
To characterize a RIP and printer, print the color target with color management settings off, read the target with the color measurement instrument and save the profile. Before making the profile, you may need to determine settings for total ink coverage, maximum black, and other settings. These settings may be included in the calibration functions.
A printer profi le represents the printer, RIP, media, ink and print settings that you used to create the profi le. If you change any of these variables, you must create a new profi le.
Printer Profiling
Color palettizer programs like GretagMacbeth Eye-One Share and X-Rite ColorShop enable users to measure or “pick up” colors with a spectrophotometer, fi nd the closest CMYK or PANTONE® color, and export palettes to other applications.
out-of-gamut color (100% green)
color is converted to in-gamut color
BEFORE. When the user selects RGB colors in a CMYK document, the colors are compared with the selected CMYK profi le and fl agged with an exclamation point if they are out-of-gamut.
AFTER. Upon clicking the warning symbol, the out-of-gamut color will be converted to an in-gamut color.
ICC-compatible illustration software enables users to preview color on the screen the way it will look when printed. Gamut-warning features warn when colors are out of the printable gamut and calculate the closest in-gamut colors.
12
COLORCOLOR
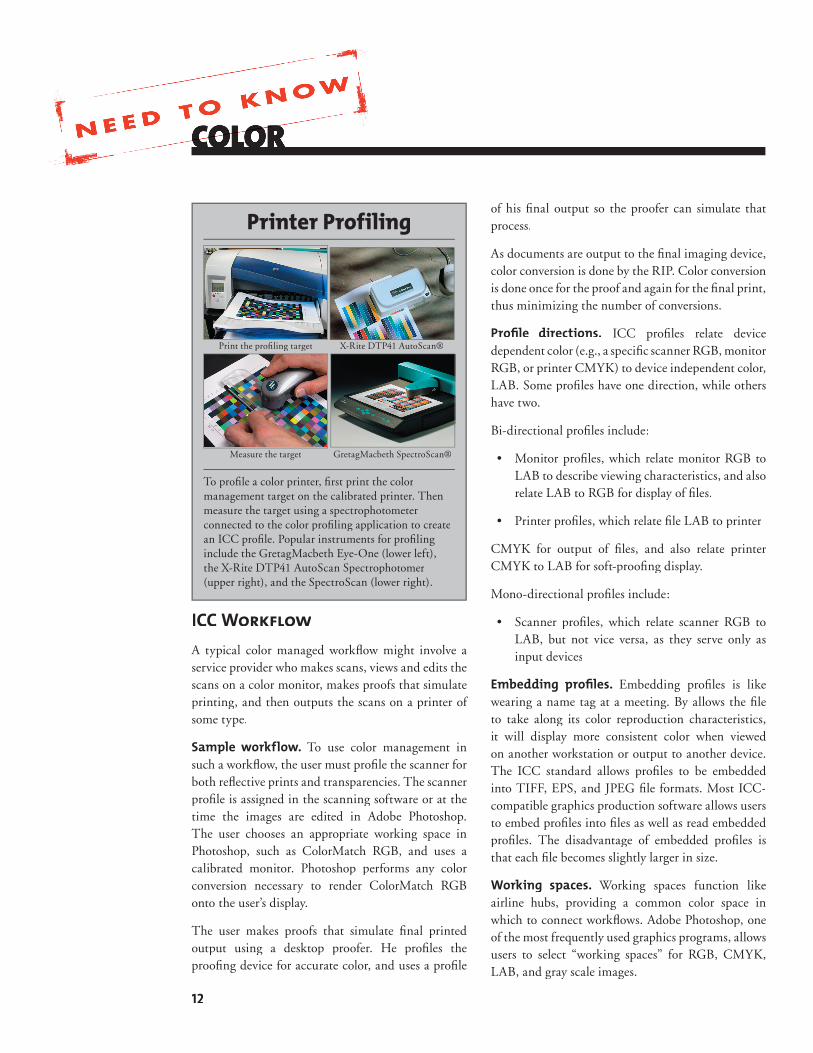
ICC WorkflowA typical color managed workflow might involve a service provider who makes scans, views and edits the scans on a color monitor, makes proofs that simulate printing, and then outputs the scans on a printer of some type.
Sample workflow. To use color management in such a workflow, the user must profile the scanner for both reflective prints and transparencies. The scanner profile is assigned in the scanning software or at the time the images are edited in Adobe Photoshop. The user chooses an appropriate working space in Photoshop, such as ColorMatch RGB, and uses a calibrated monitor. Photoshop performs any color conversion necessary to render ColorMatch RGB onto the user’s display.
The user makes proofs that simulate final printed output using a desktop proofer. He profiles the proofing device for accurate color, and uses a profile
of his final output so the proofer can simulate that process.
As documents are output to the final imaging device, color conversion is done by the RIP. Color conversion is done once for the proof and again for the final print, thus minimizing the number of conversions.
Profile directions. ICC profiles relate device dependent color (e.g., a specific scanner RGB, monitor RGB, or printer CMYK) to device independent color, LAB. Some profiles have one direction, while others have two.
Bi-directional profiles include:
• Monitor profiles, which relate monitor RGB to LAB to describe viewing characteristics, and also relate LAB to RGB for display of files.
• Printer profiles, which relate file LAB to printer
CMYK for output of files, and also relate printer CMYK to LAB for soft-proofing display.
Mono-directional profiles include:
• Scanner profiles, which relate scanner RGB to LAB, but not vice versa, as they serve only as input devices
Embedding profiles. Embedding profiles is like wearing a name tag at a meeting. By allows the fi le to take along its color reproduction characteristics, it will display more consistent color when viewed on another workstation or output to another device. The ICC standard allows profi les to be embedded into TIFF, EPS, and JPEG file formats. Most ICC-compatible graphics production software allows users to embed profiles into files as well as read embedded profiles. The disadvantage of embedded profi les is that each file becomes slightly larger in size.
Working spaces. Working spaces function like airline hubs, providing a common color space in which to connect workflows. Adobe Photoshop, one of the most frequently used graphics programs, allows users to select “working spaces” for RGB, CMYK, LAB, and gray scale images.
Printer Profiling
To profi le a color printer, fi rst print the color management target on the calibrated printer. Then measure the target using a spectrophotometer connected to the color profi ling application to create an ICC profi le. Popular instruments for profi ling include the GretagMacbeth Eye-One (lower left), the X-Rite DTP41 AutoScan Spectrophotomer (upper right), and the SpectroScan (lower right).
X-Rite DTP41 AutoScan®
GretagMacbeth SpectroScan®Measure the target
Print the profi ling target
13
COLOR
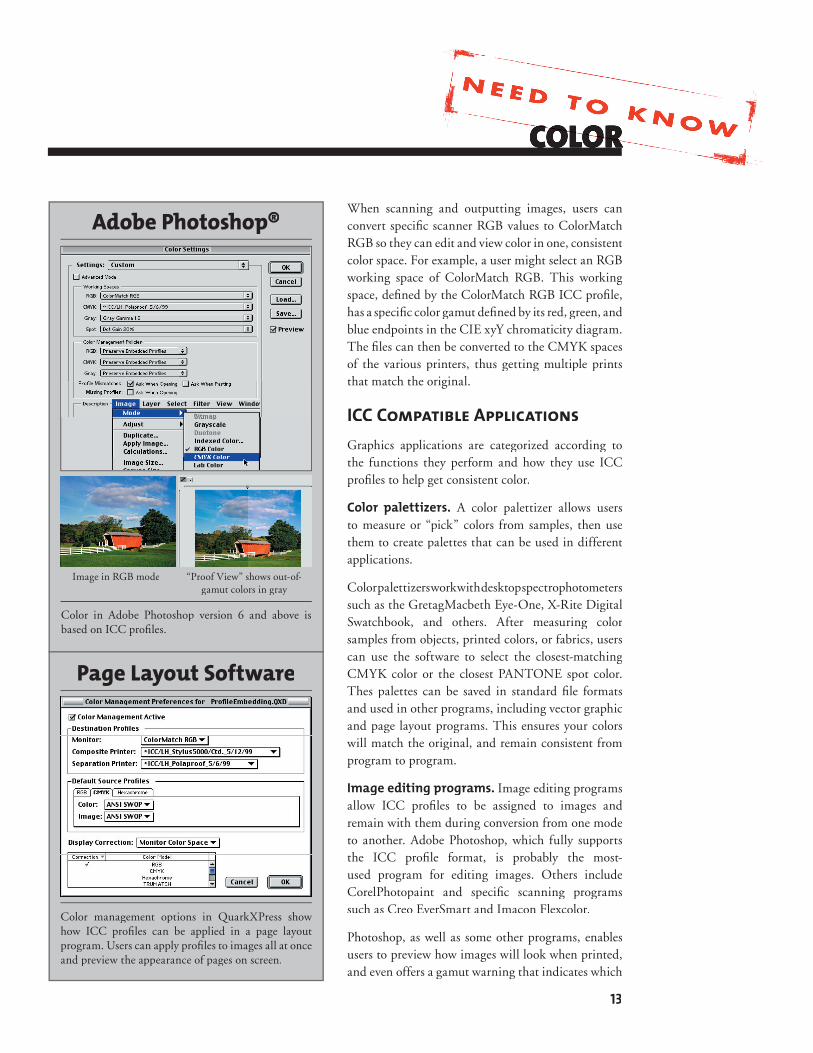
When scanning and outputting images, users can convert specific scanner RGB values to ColorMatch RGB so they can edit and view color in one, consistent color space. For example, a user might select an RGB working space of ColorMatch RGB. This working space, defined by the ColorMatch RGB ICC profile, has a specific color gamut defined by its red, green, and blue endpoints in the CIE xyY chromaticity diagram. The fi les can then be converted to the CMYK spaces of the various printers, thus getting multiple prints that match the original.
ICC Compatible ApplicationsGraphics applications are categorized according to the functions they perform and how they use ICC profiles to help get consistent color.
Color palettizers. A color palettizer allows users to measure or “pick” colors from samples, then use them to create palettes that can be used in different applications.
Color palettizers work with desktop spectrophotometers such as the GretagMacbeth Eye-One, X-Rite Digital Swatchbook, and others. After measuring color samples from objects, printed colors, or fabrics, users can use the software to select the closest-matching CMYK color or the closest PANTONE spot color. Thes palettes can be saved in standard file formats and used in other programs, including vector graphic and page layout programs. This ensures your colors will match the original, and remain consistent from program to program.
Image editing programs. Image editing programs allow ICC profiles to be assigned to images and remain with them during conversion from one mode to another. Adobe Photoshop, which fully supports the ICC profile format, is probably the most-used program for editing images. Others include CorelPhotopaint and specific scanning programs such as Creo EverSmart and Imacon Flexcolor.
Photoshop, as well as some other programs, enables users to preview how images will look when printed, and even offers a gamut warning that indicates which
Adobe Photoshop®
Color in Adobe Photoshop version 6 and above is based on ICC profi les.
Image in RGB mode “Proof View” shows out-of-gamut colors in gray
Page Layout Software
Color management options in QuarkXPress show how ICC profi les can be applied in a page layout program. Users can apply profi les to images all at once and preview the appearance of pages on screen.
14
COLORCOLOR
colors will not match because they are outside of the printer’s reproducible color gamut.
Vector graphic programs. Adobe has integrated Photoshop’s color space model into its vector program, Illustrator, and its PDF utility, Acrobat. This allows users to preview the on-screen appearance of RGB colors and the printed appearance of CMYK colors. Illustrator also features a gamut warning that will highlight RGB colors that are out of the CMYK printer gamut. Similar options are available in Macromedia FreeHand and CorelDRAW.
Page layout programs. Page layout programs allow users to assemble vector graphics, bitmapped graphics, and type into multi page documents. Page layout programs offer users the opportunity to apply an ICC profiles, even if it has not yet been applied in
an image editing or vector graphic program. These programs also read ICC profiles that are embedded in images, and allow users to preview how the page will look on the printer or proofer.
Adobe Acrobat’s Portable Document Format.PDF was originally developed for sharing documents across networks, independent of platform, fonts, and creation software. However, the compressed, reliable format of PDF appealed to graphics users as a way of submitting files to service providers.
Adobe Acrobat shares the working space model of Photoshop, which enables users to preview color and gray scale images on-screen. Acrobat Distiller, which transforms files into PDF, can assign input profiles to images and vector graphics, however it will not read profiles embedded in PostScript files that are distilled.
Server-based applications. Although users new to color management often apply ICC profiles to images individually, once gaining confidence that color management works they may look for a method of automating profile application. Automated workflow tools are available from several software developers to apply profiles and convert images on the server. These tools are useful both for streamlining simple production, such as from one scanner to one printer, and for coordinating color transformation from several input devices to numerous output processes.
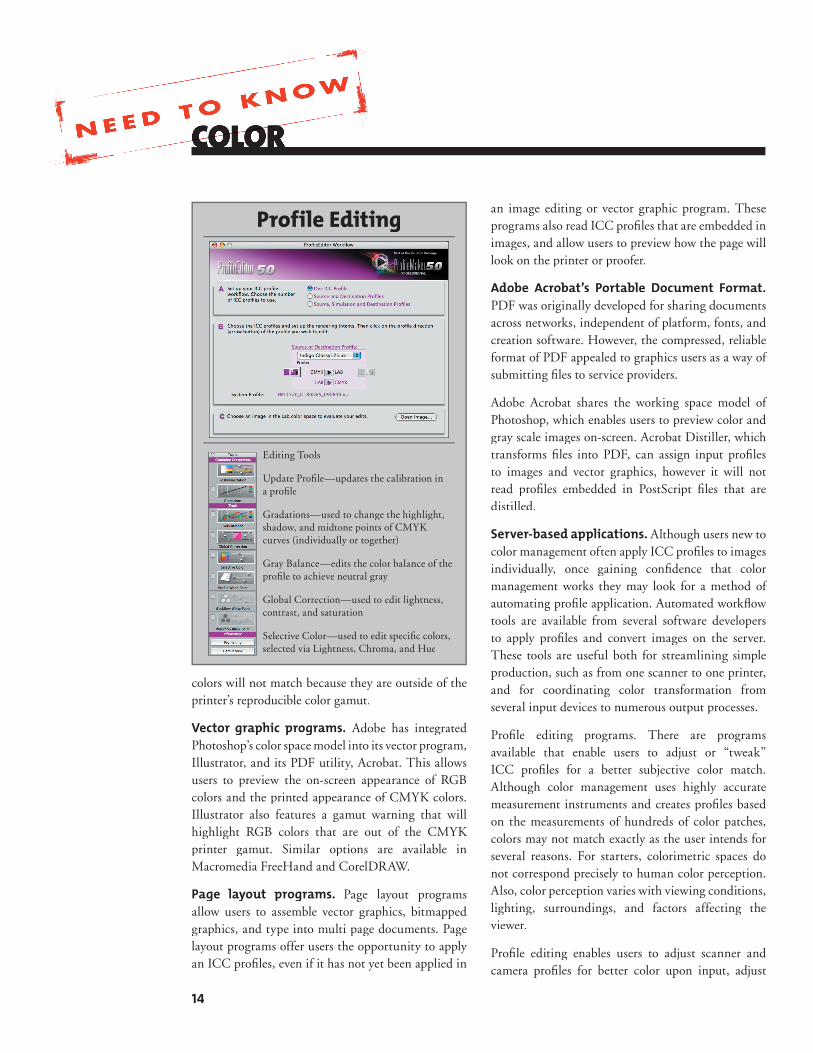
Profile editing programs. There are programs available that enable users to adjust or “tweak” ICC profiles for a better subjective color match. Although color management uses highly accurate measurement instruments and creates profiles based on the measurements of hundreds of color patches, colors may not match exactly as the user intends for several reasons. For starters, colorimetric spaces do not correspond precisely to human color perception. Also, color perception varies with viewing conditions, lighting, surroundings, and factors affecting the viewer.
Profile editing enables users to adjust scanner and camera profiles for better color upon input, adjust
Profile Editing
Editing Tools
Update Profi le—updates the calibration in a profi le
Gradations—used to change the highlight, shadow, and midtone points of CMYK curves (individually or together)
Gray Balance—edits the color balance of the profi le to achieve neutral gray
Global Correction—used to edit lightness, contrast, and saturation
Selective Color—used to edit specifi c colors, selected via Lightness, Chroma, and Hue
15
COLOR
printer profiles for better color match or subjective color preferences, adjust monitor profiles for better soft proofing, and adjust proofer profiles for better color simulation.
When editing a profile, keep in mind the workflow, including the rendering intent and profile direction. For example, to edit a printer profile for better color:
1. Select the printer profile.
2. Select the rendering intent, such as perceptual rendering.
3. Select the profile direction, which would be LAB-to-CMYK. It is the profi le’s “output” direction that affects color conversion.
To edit a printer profile for more accurate soft proofing on the display:
1. Select the printer profile.
2. Select the rendering intent, which, for soft proofi ng is relative colorimetric.
3. Select the profile direction, or “output” direction, which is CMYK-to-LAB (from print back to the monitor).
CONCLUSIONColor management can be challenging to understand and set up. However, once in place, it makes color reproduction easier and more accurate from input to output, and across many different segments of the graphics industry, including offset printing, print-for-pay color copying, large-format sign and banner printing, and even web publishing. Color management offers something for everyone, from the beginner to the most advanced user.