Intrametropolitan Employment Structure – Polycentricity, Scatteration… (Shearmur 2006)
28
Intrametropolitan Employment Structure: Polycentricity, Scatteration, Dispersal and Chaos in Toronto, Montreal and Vancouver, 1996 – 2001 Richard Shearmur, William Coffey, Christian Dube ´ and Re ´my Barbonne [Paper first received, June 2006; in final form, October 2006] Summary. There is little consensus on where and how employment is decentralising in metropolitan areas. However, a number of key processes have been brought to light, and different cities have tended to display different processes: strong CBDs, suburban polynucleation, job dispersal, scattering, edgeless cities and perhaps ‘keno capitalism’. This paper explores the distribution and growth of employment at a fine spatial scale. It is shown that, at this scale, there are very dynamic processes of growth and decline throughout metropolitan areas, but that these processes are organised at a wider scale by stable employment centres and by links between these centres. The structures and processes thus revealed suggest that the spatial economy of metropolitan areas should be approached as a chaotic system. From an empirical perspective, this means that, depending on the scale of analysis and the way data are considered, polynucleation, dispersal and chaos are all observed: this may partly explain the lack of consensus in the literature. The only process not evident within Canadian cities is scattering, but this process may in fact be occurring within some areas identified as suburban employment zones. Introduction Interest in the location of employment within North American metropolitan areas, and the resulting spatial form of the latter, has been growing since the late 1980s and early 1990s when the phenomenon of intrametropolitan employment decentralisation began to receive considerable attention in both academic and public policy milieux. Important contributions by Gad (1985), McDonald (1987), Cervero (1989), Hartshorn and Muller (1989), Garreau (1991), Stanback (1991) and Giuliano and Small (1991), among others, called attention to the relative, and sometimes absolute, decline of many CBDs as centres of employment and the corresponding rise of ‘suburban downtowns’ or ‘edge cities’. The ensuing set of research (for example, Cervero and Wu, 1997; Forstall and Greene, 1997; Bogart and Ferry, 1999; McDonald and Prather, 1994; McMillen and McDonald, 1997, 1998; Gad and Matthew, 2000) extended the range of metropolitan areas examined and refined methods for identifying suburban downtowns. In addition, several authors (Fujii and Hartshorn, 1995; Gordon and Richardson, 1996) began to question the relevance of the suburban downtown phenomenon, arguing that it was perhaps only a transitory state in Urban Studies, Vol. 44, No. 9, 1713–1738, August 2007 Richard Shearmur, Christian Dube ´ and Re ´my Barbonne are in INRS—UCS, 385 Sherbrooke east, Montre ´al, Quebec H2X IE3, Canada. Fax: 514 499 4065. E-mails: [email protected]; [email protected]; and [email protected]. William Coffey is in the De ´partement de Ge ´ographie, Universite ´ de Montre ´al, C. P. 6128, Succursale Centre-Ville, Montre ´al, Quebec H3C 3J7, Canada. Fax: 514 343 8008. E-mail: [email protected]. 0042-0980 Print/1360-063X Online/07/091713 – 26 # 2007 The Editors of Urban Studies DOI: 10.1080/00420980701426640
-
Upload
stephie-lee -
Category
Documents
-
view
22 -
download
0
Transcript of Intrametropolitan Employment Structure – Polycentricity, Scatteration… (Shearmur 2006)

Intrametropolitan Employment Structure:Polycentricity, Scatteration, Dispersal and Chaosin Toronto, Montreal and Vancouver, 1996–2001
Richard Shearmur, William Coffey, Christian Dube and Remy Barbonne
[Paper first received, June 2006; in final form, October 2006]
Summary. There is little consensus on where and how employment is decentralising inmetropolitan areas. However, a number of key processes have been brought to light, anddifferent cities have tended to display different processes: strong CBDs, suburban polynucleation,job dispersal, scattering, edgeless cities and perhaps ‘keno capitalism’. This paper explores thedistribution and growth of employment at a fine spatial scale. It is shown that, at this scale, thereare very dynamic processes of growth and decline throughout metropolitan areas, but that theseprocesses are organised at a wider scale by stable employment centres and by links between thesecentres. The structures and processes thus revealed suggest that the spatial economy ofmetropolitan areas should be approached as a chaotic system. From an empirical perspective,this means that, depending on the scale of analysis and the way data are considered,polynucleation, dispersal and chaos are all observed: this may partly explain the lack ofconsensus in the literature. The only process not evident within Canadian cities is scattering, butthis process may in fact be occurring within some areas identified as suburban employment zones.
Introduction
Interest in the location of employment withinNorth American metropolitan areas, and theresulting spatial form of the latter, has beengrowing since the late 1980s and early 1990swhen the phenomenon of intrametropolitanemployment decentralisation began to receiveconsiderable attention in both academic andpublic policy milieux. Important contributionsby Gad (1985), McDonald (1987), Cervero(1989), Hartshorn and Muller (1989), Garreau(1991), Stanback (1991) and Giuliano andSmall (1991), among others, called attentionto the relative, and sometimes absolute,decline of many CBDs as centres of
employment and the corresponding rise of‘suburban downtowns’ or ‘edge cities’. Theensuing set of research (for example, Cerveroand Wu, 1997; Forstall and Greene, 1997;Bogart and Ferry, 1999; McDonald andPrather, 1994; McMillen and McDonald,1997, 1998; Gad and Matthew, 2000) extendedthe range of metropolitan areas examinedand refined methods for identifying suburbandowntowns. In addition, several authors (Fujiiand Hartshorn, 1995; Gordon and Richardson,1996) began to question the relevance of thesuburban downtown phenomenon, arguingthat it was perhaps only a transitory state in
Urban Studies, Vol. 44, No. 9, 1713–1738, August 2007
Richard Shearmur, Christian Dube and Remy Barbonne are in INRS—UCS, 385 Sherbrooke east, Montreal, Quebec H2X IE3,Canada. Fax: 514 499 4065. E-mails: [email protected]; [email protected]; and [email protected] Coffey is in the Departement de Geographie, Universite de Montreal, C. P. 6128, Succursale Centre-Ville, Montreal, QuebecH3C 3J7, Canada. Fax: 514 343 8008. E-mail: [email protected].
0042-0980 Print/1360-063X Online/07/091713–26 # 2007 The Editors of Urban Studies
DOI: 10.1080/00420980701426640

the evolution of a more dispersed intrametropo-litan employment geography—‘scatteration’.More recently, this latter approach hasculminated in the concept of the ‘edgelesscity’ (Lang, 2003), a highly dispersed metropo-litan form.
In a series of previous papers (Coffey andShearmur, 2001a, 2001b, 2002; Shearmurand Coffey, 2002a, 2002b; Shearmur andAlvergne, 2002), we have contributed tothe analysis of the intrametropolitan space-economy, both methodologically and byextending the range of cities examined toinclude the Canadian and French contexts. Inthe present paper, we attempt to extend ouranalyses and to contribute to the more recentdebate concerning the nature of the evolvingspatial structure of employment in NorthAmerican metropolitan areas. The presentanalysis extends our previous research inthree ways. First, our data cover the morerecent 1996–2001 period, one of rapidemployment growth in Canadian cities. Sec-ondly, we employ a finer set of spatial unitsthan was possible in our previous research;this, in turn, has enabled us to refine ourmethodological approach. And, finally, ourconceptual approach is considerably broaderthan was the case in our previous analyses;rather than seeking simply to identify‘employment centres’, our goal is to identifyand to achieve a better understanding of thespatial structure of employment in Canada’sthree largest metropolitan areas. Our principalpoint is that the intrametropolitan space-economy is much more complex than eitherthe ‘edge city’ (polycentricity) or ‘edgelesscity’ (scatteration) approaches appears toacknowledge.
Before presenting our data and method-ology, and then our empirical results, wefirst examine in more detail the issue of thespatial form of the intrametropolitan space-economy.
The Intrametropolitan Geography ofEmployment
There is a general consensus in the literaturethat employment has been decentralising
within North American metropolitan areas.The relative proportion, and sometimes eventhe absolute number, of metropolitan jobslocated in the CBD has been steadily declin-ing. The CBD is no longer the sole (or even,necessarily, the principal) locus of metropoli-tan employment; the monocentric model ofmetropolitan spatial form now appears to bea relic of the past. A point concerning whichthere is much less consensus, however, is thespatial form of the decentralisation that isoccurring.
As noted briefly in the preceding section,during the past two decades, much emphasishas been given to the ‘edge city’ or ‘suburbandowntown’ phenomenon—the reagglomera-tion of decentralising employment in employ-ment centres outside the CBD. According tothis literature, a new wave of suburbanisationinvolving high-order services or front-officefunctions, which began to manifest itself inthe early 1980s, has profoundly modified thespace-economy of North American metro-politan regions. The economies of certainsuburban areas have become increasinglylarge and diversified, and have developedagglomeration economies of a sufficientforce to attract the types of activities formerlyfound uniquely in the CBD. In particular, thisgrowth has concentrated, and is continuing toconcentrate, in a limited number of ‘suburbanemployment centres’ (Cervero, 1989), ‘subur-ban downtowns’ (Hartshorn and Muller, 1989;Gad and Matthew, 2000), ‘magnet areas’(Stanback, 1991), or ‘edge cities’ (Garreau,1991), which are increasingly in directcompetition with the CBD for the locationof high-order service functions. In certainNorth American metropolitan areas, theCBD has been able to maintain its traditionaleconomic role and importance; in others,growth is now shared between the CBD andsuburban agglomerations; in others still, theCBD is losing ground to edge cities. Thus,North American metropolitan areas appearto have entered into a new phase of spatial-economic development. Due to employ-ment decentralisation, most North Americanmetropolitan areas are now characterisedby multinucleated or polycentric economic
1714 RICHARD SHEARMUR ET AL.

structures. In many metropolitan areas, one ormore of these suburban centres now has alarger share of high-order office employmentthan that found in the CBD. In the majorCanadian cities, the CBD retains a prominentrole (Filion and Gad, 2006; Gad and Matthew,2000; Shearmur and Coffey, 2002a), althoughlarge suburban office centres are emerging,particularly in Toronto (Charney, 2005).
Other authors have observed a differentform of decentralisation—‘scatteration’, thegeneralised dispersion of employment at rela-tively low densities, rather than the reagglo-meration noted above. In the case of Atlanta,Fujii and Hartshorn (1995) have found that,while some office jobs have concentratedin employment centres, much employmentremains scattered throughout the remainingzones of the metropolitan area. Similarly,Gordon and Richardson (1996) demonstratethat in Los Angeles, over the period 1970–90, the proportion of jobs in employmentcentres actually fell; in 1990, only 12 percent of jobs were located in such centres.More recently, Lang (2003) has concep-tualised this generalised dispersion as theformation of ‘edgeless cities’—a form ofsprawling office development that is charac-terised by neither the density nor the relativelyclear boundaries of edge cities. In his study of13 US metropolitan areas, he finds that, in1999, edgeless cities account for two-thirdsof the office space found outside the CBDand for nearly twice the office space foundin edge cities.
The distinction between polycentricity andscatteration is a significant one in terms ofwhat it has to tell us about the role of agglom-eration economies at the intrametropolitanscale. On the one hand, the appearance of asmall number of employment centres oredge cities in a metropolitan area underscoresthe important role played by agglomerationeconomies; such a multinodal structurereinforces the idea that there are distinctadvantages to economic activities beinglocated in spatial proximity. Indeed, Filionet al. (2000), in their survey of workers inToronto suburban centres, highlight the pre-sence of agglomeration economies, but also
suggest that these are moderated by the inhos-pitability of the suburban environment topedestrians. On the other hand, the appearanceof generalised dispersion suggests that theadvantages (largely involving the facility offace-to-face contact) accruing to economicactivities that locate close to one another inspace are now diminishing (which is alsopartly in keeping with Filion et al.’s (2000)observations). Gordon and Richardson (1996)observe that, just when urban researchershave begun to devote considerable attentionto polycentricity, urban form has perhapsmoved beyond this phenomenon. Dear andFlusty (2001), building upon this type of obser-vation, suggest that such scattering can betheorised as ‘keno capitalism’—an increas-ingly random and chaotic organisation (ordisorganisation) of urban space under the influ-ence of global capital and mobile comm-unication technologies. Thus, the polycentricversus scatteration issue is very importantfrom both practical and theoretical perspectives.
This latter observation by Gordon andRichardson (1996), in turn, raises anotherissue. Are polycentricity and scatterationsimply successive stages in the evolution ofthe intrametropolitan geography of employ-ment or, rather, do these two seemingly con-tradictory processes operate simultaneouslywithin a given metropolitan context? If thelatter is the case, as suggested by Charney(2005) for Toronto, not only would the twoprocesses be more correctly viewed as comp-lementary rather than contradictory, but also,and more fundamentally, it would appearthat the intrametropolitan geography ofemployment is much more complex thaneither the polycentric or scatteration app-roaches, individually, appears to recognise.This issue forms a central theme of ourempirical analysis.
Data and Methodology
Data
The data used in this analysis are 1996 and2001 census data by place of work coveringthe census metropolitan areas (CMAs) of
INTRAMETROPOLITAN EMPLOYMENT STRUCTURE 1715

Montreal, Toronto and Vancouver. Theprimary spatial unit of analysis is the enumer-ation area (EA), of which there are 4733 inMontreal, 5598 in Toronto and 2645 inVancouver. Enumeration areas are the basicbuilding-blocks of census tracts, the unit ofanalysis that we have used in our previousstudies. They are compact spatial units,usually—in urbanised areas—comprising afew blocks at most, and their boundariesfollow visible features such as streets andrivers when possible: the number of dwellingsin an EA generally varies between amaximum of 650 in CMAs to a minimumof 125 in rural areas. These data have beenchosen because most previous work onintrametropolitan employment location hasbeen conducted using larger units, oftencensus tracts or transport analysis zones:EAs provide a much finer level of spatial dis-crimination and one of the primary aims ofthis article is to explore the extent to whichthese fine-grained data add to our understand-ing of intrametropolitan employment locationand growth.
However, the EA place of work data areproblematic for two reasons. On the onehand, the 2001 spatial classification is nolonger EAs, but dissemination areas (DAs)—roughly equivalent, but different, units.Although Statistics Canada recoded the 2001data to the 1996 EA boundaries using 2001block faces, when a boundary between twoEAs intersected a block face employmentwas arbitrarily assigned to one or otherEA. Because of the uncertainty surroundingwhich EA the employment is actually in, wehave merged EAs in each of these cases,reducing the number of spatial units available,as indicated below. On the other hand, evenafter these merges, a few suspicious casesremained—about 50 or so in each CMA—where contiguous EAs had very similar (butopposite in sign) employment changes. Insome cases, this is due to employment geo-coding inconsistencies by Statistics Canadabetween 1996 and 2001, and highlights thefact that employment location at such a finescale is actually somewhat uncertain. Forexample, depending on the exact location
assigned to people working at the Universityof Quebec in downtown Montreal, their work-place could conceivably be in any of two orthree EAs. In our data, the whole universityappears to have shifted from one EA toanother between 1996 and 2001, presumablybecause the EA to which it has been assignedhas changed. It is this type of error that wehave sought to correct: all contiguous EAswhere employment gain/loss of over 500jobs is noted (and where the ratio of gain toloss is between 0.5 and 1.5) are merged. Inthis way, straightforward shifts between EAsare smoothed, but areas where some actualjob gain or loss has occurred will stillappear. It should be emphasised that, after dis-cussions with Statistics Canada and analysisof the data, we do not think that thesecoding errors are too widespread, althoughtheir exact extent is unknown. After thesevarious manipulations, 3732 EAs are avail-able for analysis in Montreal, 4658 inToronto and 2034 in Vancouver.
The basic uncertainty surrounding the exactlocation of employment at the EA level mustbe borne in mind throughout this analysis.Having said that, however, we are confidentthat most of the errors introduced by StatisticsCanada’s geocoding inconsistencies havebeen corrected and that the shifts, growthand decline observed in the subsequent analy-sis are by and large ‘real’ and not an artefactof the coding.
Methodology
Our study proceeds in two stages. In the firststage, we build upon our previous work andidentify employment zones in the three cities.We conceptualise the city as consisting of aCBD and of a number of other—suburban—employment zones. Such a conceptualisationrests upon two basic and well documentedtheoretical understandings of city form. Onthe one hand, the monocentric city as observedby Burgess (1925), and as modelled by Alonso(1964), has long served as a starting-point forunderstanding the geography of metropolitanareas. On the other hand, the idea of a poly-centric city, first formalised by Harris and
1716 RICHARD SHEARMUR ET AL.

Ullman (1945/1970), has become a key way ofunderstanding late 20th century cities (Yeates,1998). These two complementary buildingblocks form the basis of our classification ofemployment zones and from them it is possibleto assess whether it is the CBD or suburbancentres that are tending to grow faster. Pro-cesses of ‘scatteration’ and ‘edgeless cities’can also be studied within this framework,since they are defined relative to the CBDand to suburban centres: thus, by conceptualis-ing the city as polycentric, we also identifyareas outside employment centres to whichjobs may be dispersing. In addition to thisbasic conceptualisation, we also draw uponthe core–frame structure described byHorwood and Boyce (1959). They suggestthat employment concentrations in citiesconsist of a densely developed ‘core’, sur-rounded by a more diffuse employment zonewhich they call a ‘frame’. Each of our majoremployment zones is thus divided into a coreand a frame, or fringe. We also identify somesecondary and isolated employment zonesthat do not meet our definition of majoremployment zone but that meet the criterianecessary for inclusion in the frame. Our citythus imagined is illustrated in Figure 1.
In order to operationalise these concepts,certain classification criteria have been deter-mined. To be classified as an employmentzone (core or frame), an EA must meet twocriteria. First, the ratio of employment to resi-dent workers (the E/R ratio) must be superiorto one. Thus, an employment zone is a zonethat tends to attract workers from theoutside. Secondly, total employment must begreater than 500 workers. This criterion isincluded in order to clarify our observationsand to limit our analysis to areas with a sig-nificant number of jobs. All attempts toidentify employment zones establish certainthresholds (whether these thresholds be devi-ations from a density gradient, job densitylevels, etc.) and the necessity for suchthresholds has been discussed in Coffey andShearmur (2001a). The number 500 has beenchosen as a threshold in this study for tworeasons: first, a threshold in this vicinityenables a clear majority of jobs to be captured
in all three cities (between 71 and 77 per centof them); secondly, given the area in which weare searching for a cut-off, 500 is close to theoptimum, in all three cities, in terms of jobsper EA.1
Given such criteria, employment zonescapture over 70 per cent of all jobs in eachCMA whilst including 10–12 per cent ofEAs (Table 1). To distinguish the core fromthe frame, and to identify secondary and iso-lated employment zones, employment zonesare classified into six types, illustrated inFigure 1
—1a. CBD core: EAs in the CBD with over5000 jobs.
—1b. CBD fringe: EAs with between 500 and5000 jobs contiguous, or linked, to the CBDcore.
—2a. Major zone core: EAs outside the CBDwith over 5000 jobs.
—2b. Major zone fringe: EAs with 500 to5000 jobs, contiguous, or linked, to amajor zone core.
—3. Secondary employment zones: groups ofcontiguous EAs, each with between 500and 5000 jobs.
—4. Isolated zones: single EAs with between500 and 5000 jobs.
—The remaining zones are non-employmentzones, coded 9 in Figure 1.
The CBD and major zone cores are sets ofcontiguous EAs, or individual EAs, thatmeet the 1a or 2a criteria. Fringe zones aredirectly, or indirectly via other fringe EAs,contiguous to a core. In order, where necess-ary, to separate the CBD fringe from thefringes of other major zones, cuts havebeen made at EAs with between 500 and2500 jobs (the EA where the cut occursbecoming part of the CBD fringe, theEA beyond becoming part of the majorzone fringe).
The threshold of 5000 corresponds to abreak in the size distribution of EAs in allthree cities. In Montreal, there is a clearbreak between EAs with fewer than 5000jobs (the highest being 4615) and those withmore (the lowest being 5145 jobs). InToronto, a break occurs between 5205 and
INTRAMETROPOLITAN EMPLOYMENT STRUCTURE 1717
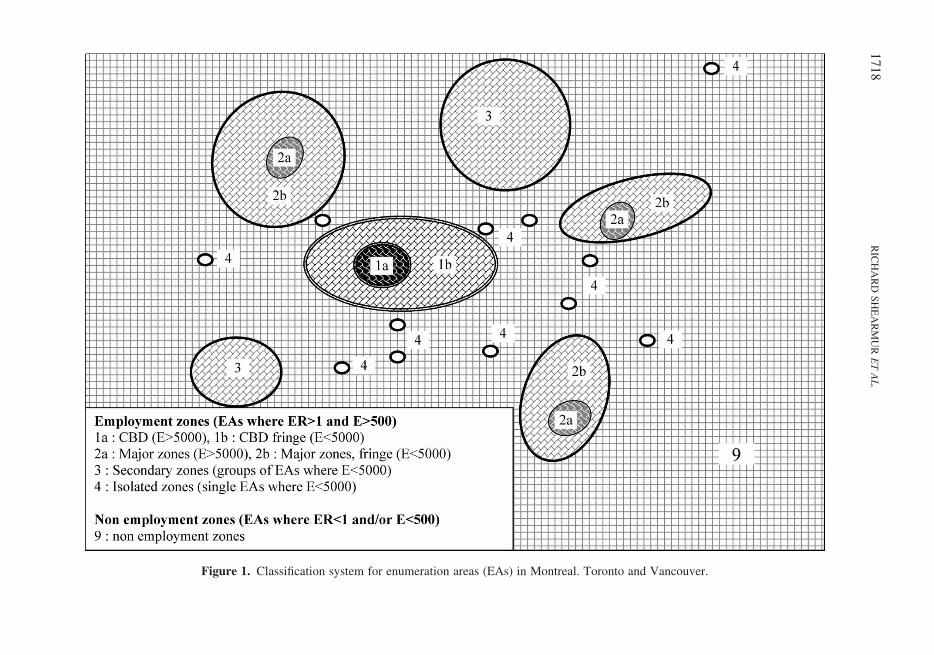
Figure 1. Classification system for enumeration areas (EAs) in Montreal. Toronto and Vancouver.
17
18
RIC
HA
RD
SH
EA
RM
URETAL.

5540 jobs, and in Vancouver between 5265and 5615. In order to use the same thresholdin each city—and to be as inclusive as poss-ible—the 5000 threshold is retained. In allcities, no break of a similar size occursbefore reaching 6000 jobs and none occursbelow 5000 jobs.
Employment growth and decline are ana-lysed relative to these six types of employ-ment zone. The basic question we seek toaddress in the first part of the analysis is theextent to which employment has tended togrow in these employment zones, or hastended to disperse throughout the CMA.
The choice of the term ‘employment zone’to describe areas of the CMA where employ-ment (and hence economic activity) tends tolocate is deliberate and is a departure fromterms such as ‘employment pole’ (Coffeyand Shearmur, 2001a, 2001b), ‘employmentcentre’ (Bogart and Ferry, 1999; Freestoneand Murphy, 1998), ‘nuclei’ (Dieleman andFaludi, 1998), ‘edge city’ (Garreau, 1991)and ‘suburban downtown’ (Stanback, 1991;Gad and Matthew, 2000)—all of which tendto emphasise agglomeration. It is also a depar-ture from terms such as ‘scatteration’ (Gordonand Richardson, 1996), ‘edgeless city’ (Lang,2003) and ‘exopolis’ (Soja, 1992) that tend toimply sprawl in one form or another. Indeed,the first part of our analysis leads us to ques-tion whether it is possible to state clearlywhether dispersion or polarisation of employ-ment is occurring. This leads us, in the secondstage of our analysis, to take a closer look atthe actual shape of employment zones inMontreal. In doing so, we reconceptualisethe classification introduced above (a classifi-cation that closely mirrors that in our previouswork—see Figure 1). Without calling intoquestion the definition of employment zones,
we nevertheless propose some new ways toqualify and understand them.
Growth, Agglomeration and Dispersalof Employment
If the dispersal of employment is defined asemployment growth outside employmentzones, then in all three CMAs there has beenmoderate dispersal between 1996 and 2001(Table 2). When employment zones aredefined at the beginning of the period (using1996 data), above-average growth is observedin non-employment zones in all three cities.Similarly, isolated zones tend to decline andsecondary zones and major zone fringesgrow more slowly than the CMA as a whole.In all cities, the CBD fringe and the coremajor zones grow faster than the CMA.Despite growing in all cities, only inToronto does the core CBD outperform theCMA as a whole.
Notwithstanding these clear results, thenumbers in Table 2 hint at an interestingphenomenon, that of employment decline inisolated zones (some of which change theirstatus to non-employment zones) and thegrowth of employment in non-employmentzones (some of which change their status todifferent types of employment zones).Indeed, the fact that there have been changesin the composition of employment zones isevident from Table 3, which is identical toTable 2 except that the definition of employ-ment zones and non-employment zones isaccomplished using 2001, rather than 1996,data, then carried backwards to 1996. Accord-ing to this table—in which employment zonesare defined at the end of the period—there hasbeen agglomeration of employment in andaround all types of employment zones
Table 1. Number of EAs and number of jobs classified as employment zones, 2001
EAs Jobs
City Number Percentage of total Number Percentage of total
Montreal 448 12 1 133 800 73Toronto 474 10 1 769 845 77Vancouver 245 12 620 780 71
INTRAMETROPOLITAN EMPLOYMENT STRUCTURE 1719

Table 2. Employment and growth (1996–2001) of employment zones as of 1996
Montreal Toronto Vancouver
Percentage of total jobs Percentagegrowth
1996–2001
Percentage of total jobs Percentagegrowth
1996–2001
Percentage oftotal jobs Percentage
growth1996–20011996 2001 1996 2001 1996 2001
CBD core 1a 12.1 11.9 9.4 12.1 12.5 20.0 7.7 7.3 3.4CBD fringe 1b 6.3 6.8 20.0 3.7 3.7 18.0 4.5 4.8 16.3Major zones, core 2a 19.6 20.5 16.2 33.0 34.4 21.3 18.7 19.6 13.8Major zones, fringe 2b 13.1 12.6 7.2 14.3 13.9 13.1 16.9 16.9 9.4Secondary zones 3 13.0 12.2 5.2 9.0 7.7 0.1 14.8 14.5 6.7Isolated zones 4 4.6 3.7 211.7 2.5 1.9 210.2 5.1 4.3 29.2Non-employment zones 9 31.3 32.4 15.2 25.4 25.8 18.4 32.2 32.5 10.1Total employment CMA 1 436 735 1 600 515 11.4 2 005 225 2 334 150 16.4 817 375 890 530 8.9
17
20
RIC
HA
RD
SH
EA
RM
URETAL.

Table 3. Employment and growth (1996–2001) of employment zones defined as of 2001
Montreal Toronto Vancouver
Percentage of total jobs Percentagegrowth
1996–2001
Percentage of total jobs Percentagegrowth
1996–2001
Percentage oftotal jobs Percentage
growth1996–20011996 2001 1996 2001 1996 2001
CBD core 1a 12.5 12.6 12.5 13.3 13.7 19.8 7.1 6.8 4.2CBD fringe 1b 7.3 8.2 24.3 4.2 4.6 29.7 4.9 5.4 21.2Major zones, core 2a 20.4 21.6 17.7 33.9 36.7 25.7 23.9 26.7 21.6Major zones, fringe 2b 14.3 15.4 20.2 13.7 13.7 16.3 14.1 14.4 11.2Secondary zones 3 8.1 8.6 18.6 4.5 4.6 20.6 13.4 13.9 13.3Isolated zones 4 4.2 4.6 19.9 2.0 2.5 44.8 2.5 2.5 9.1Non-employment zones 9 33.3 29.2 22.3 28.4 24.2 20.9 34.1 30.3 23.3Total employment CMA 1 436 735 1 600 515 11.4 2 005 225 2 334 150 16.4 817 375 890 530 8.9
INT
RA
ME
TR
OP
OL
ITA
NE
MP
LO
YM
EN
TS
TR
UC
TU
RE
17
21

(except for the Vancouver CBD) and a markedrelative (absolute in the cases of Montreal andVancouver) decline in employment outsideemployment zones.
It can of course be argued that dispersalshould be assessed relative to employmentzones at the beginning of the period, andhence some dispersal has occurred (Table 2).However, although this is the case, Table 3shows that this dispersal has not been hapha-zard: it has been sufficiently focused tocreate new employment zones. It is thereforeuseful to go beyond these net employmentfigures and investigate the changes in employ-ment zones between 1996 and 2001.
Table 4 presents the transition matrices forthe EAs of each CMA between the differentcategories of employment zone illustrated inFigure 1. The first item to note is the stabilityat the core of major employment zones and ofthe CBD. In Montreal and Toronto, the 1996CBD core is included in the 2001 core, andin Vancouver, only one constituent of thecore has transitioned to the CBD fringe. InMontreal and Vancouver, the 1996 majorzone cores are all included in the 2001 coresand, in Toronto, only 2 of the 56 constituentsof major zone cores have transitioned out, onetowards the CBD core, one towards the majorzone fringe.
Thus, the basic architecture of employmentdistribution in the three CMAs has not beenfundamentally altered over the five-yearperiod. This is not altogether surprising,although all CMAs, particularly Montrealand Toronto, witnessed very rapid employ-ment growth over the period. Growth of 11–16 per cent over 5 years is rapid and—inview of the hypotheses of scatteration, job dis-persal and ‘keno capitalism’—more changecould have been expected.
There has been some limited change in thecomposition of the CBD and major zonefringes; however, a key element in thischange is the large number of non-employ-ment zones that have transitioned towardsthese fringe areas. In other words, many ofthe fast-growing non-employment zones—those towards which employment has ‘dis-persed’—are in fact very close to core
employment zones. This growth, far frombeing dispersed, is in fact on the edges ofcore employment areas. Similarly, a large(but lesser) number of CBD and major zonefringe constituents have transitioned towardsnon-employment zone status.
It is primarily these numerous transitions toand from the fringes of the CMA’s principalemployment zones that account for the differ-ences between Tables 2 and 3. In Table 2,the declining EAs are included as part ofemployment zones—this gives the impressionthat between 1996 and 2001 employmenthas moved away from employment zones. InTable 3, the growing EAs are included as partof employment zones—this gives the imp-ression that between 1996 and 2001 employ-ment has moved towards employment zones.
A key question is whether these transitionsare just picking up data noise—StatisticsCanada misclassifications—or are revealinga very dynamic process of job loss and gainat the edges of major employment zones andthe CBD. Although it is not possible toprovide a definitive answer to this question,certain elements lead us to believe that,although the dynamic process may be some-what overstated in our data, a real process isbeing picked up. First, when EAs that tran-sition in and out of employment zone statusare mapped concurrently, few are neighbours.In other words, it cannot be said that there hasbeen a straightforward transfer of jobsbetween neighbouring EAs leading to anapparent dynamic process (but in fact reflect-ing the misallocation of jobs in either 1996 or2001). Secondly, the data have been screenedand prepared with this problem in mind;although we have most probably not pickedup all of the misallocated jobs, we have sys-tematically smoothed out any sizeable appar-ent error. Thirdly, growth and decline arenot just observed in EAs that change status:Table 5 (to which we will return) shows thatgrowth and decline are apparent in EAs ofall status, including stable core zones. Thusthe process appears to be widespread and uni-versal, not just confined to EAs with smallemployment totals at the edges of the fringe.Finally, and most importantly, this dynamic
1722 RICHARD SHEARMUR ET AL.
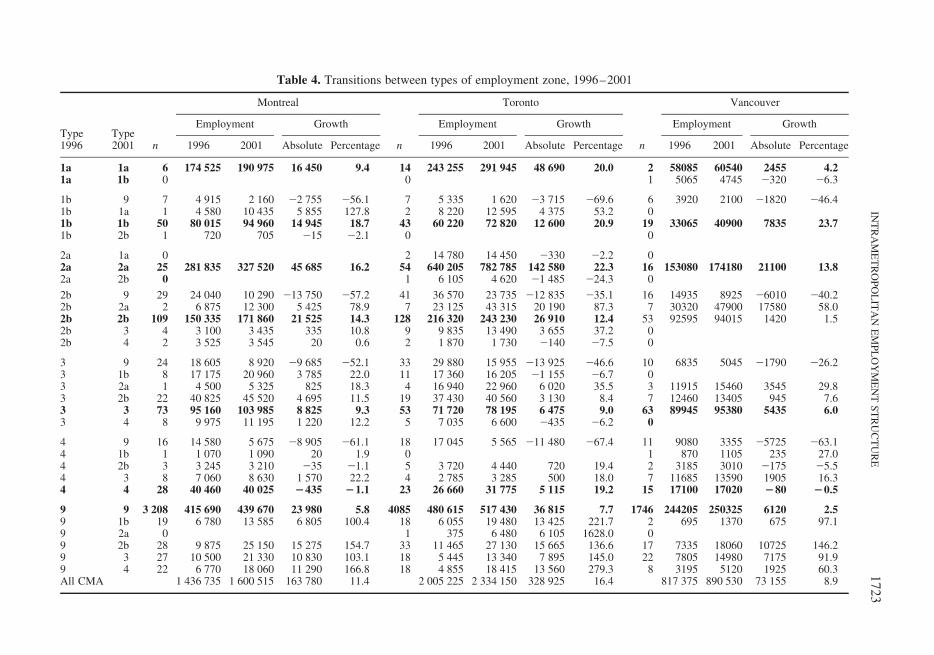
Table 4. Transitions between types of employment zone, 1996–2001
Type1996
Type2001 n
Montreal
n
Toronto
n
Vancouver
Employment Growth Employment Growth Employment Growth
1996 2001 Absolute Percentage 1996 2001 Absolute Percentage 1996 2001 Absolute Percentage
1a 1a 6 174 525 190 975 16 450 9.4 14 243 255 291 945 48 690 20.0 2 58085 60540 2455 4.21a 1b 0 0 1 5065 4745 2320 26.3
1b 9 7 4 915 2 160 22 755 256.1 7 5 335 1 620 23 715 269.6 6 3920 2100 21820 246.41b 1a 1 4 580 10 435 5 855 127.8 2 8 220 12 595 4 375 53.2 01b 1b 50 80 015 94 960 14 945 18.7 43 60 220 72 820 12 600 20.9 19 33065 40900 7835 23.71b 2b 1 720 705 215 22.1 0 0
2a 1a 0 2 14 780 14 450 2330 22.2 02a 2a 25 281 835 327 520 45 685 16.2 54 640 205 782 785 142 580 22.3 16 153080 174180 21100 13.82a 2b 0 1 6 105 4 620 21 485 224.3 0
2b 9 29 24 040 10 290 213 750 257.2 41 36 570 23 735 212 835 235.1 16 14935 8925 26010 240.22b 2a 2 6 875 12 300 5 425 78.9 7 23 125 43 315 20 190 87.3 7 30320 47900 17580 58.02b 2b 109 150 335 171 860 21 525 14.3 128 216 320 243 230 26 910 12.4 53 92595 94015 1420 1.52b 3 4 3 100 3 435 335 10.8 9 9 835 13 490 3 655 37.2 02b 4 2 3 525 3 545 20 0.6 2 1 870 1 730 2140 27.5 0
3 9 24 18 605 8 920 29 685 252.1 33 29 880 15 955 213 925 246.6 10 6835 5045 21790 226.23 1b 8 17 175 20 960 3 785 22.0 11 17 360 16 205 21 155 26.7 03 2a 1 4 500 5 325 825 18.3 4 16 940 22 960 6 020 35.5 3 11915 15460 3545 29.83 2b 22 40 825 45 520 4 695 11.5 19 37 430 40 560 3 130 8.4 7 12460 13405 945 7.63 3 73 95 160 103 985 8 825 9.3 53 71 720 78 195 6 475 9.0 63 89945 95380 5435 6.03 4 8 9 975 11 195 1 220 12.2 5 7 035 6 600 2435 26.2 0
4 9 16 14 580 5 675 28 905 261.1 18 17 045 5 565 211 480 267.4 11 9080 3355 25725 263.14 1b 1 1 070 1 090 20 1.9 0 1 870 1105 235 27.04 2b 3 3 245 3 210 235 21.1 5 3 720 4 440 720 19.4 2 3185 3010 2175 25.54 3 8 7 060 8 630 1 570 22.2 4 2 785 3 285 500 18.0 7 11685 13590 1905 16.34 4 28 40 460 40 025 2435 21.1 23 26 660 31 775 5 115 19.2 15 17100 17020 280 20.5
9 9 3 208 415 690 439 670 23 980 5.8 4085 480 615 517 430 36 815 7.7 1746 244205 250325 6120 2.59 1b 19 6 780 13 585 6 805 100.4 18 6 055 19 480 13 425 221.7 2 695 1370 675 97.19 2a 0 1 375 6 480 6 105 1628.0 09 2b 28 9 875 25 150 15 275 154.7 33 11 465 27 130 15 665 136.6 17 7335 18060 10725 146.29 3 27 10 500 21 330 10 830 103.1 18 5 445 13 340 7 895 145.0 22 7805 14980 7175 91.99 4 22 6 770 18 060 11 290 166.8 18 4 855 18 415 13 560 279.3 8 3195 5120 1925 60.3All CMA 1 436 735 1 600 515 163 780 11.4 2 005 225 2 334 150 328 925 16.4 817 375 890 530 73 155 8.9
INT
RA
ME
TR
OP
OL
ITA
NE
MP
LO
YM
EN
TS
TR
UC
TU
RE
17
23

process is commensurate with a theoreticalunderstanding of the dynamic processes atplay: there is a good reason for these numer-ous cases of growth and decline, which wewill outline below.
Indeed, many, if not most, studies of intra-metropolitan employment distribution,including our own, have demonstrated thatgeneral patterns of employment location arequite stable over time. However, such stabilityhas usually been observed at the census tract(CT) or transport analysis zone (TAZ) level.Analysis at this scale hides the type of microvariation that shows up when enumerationareas are studied. To verify this, we have ana-lysed our data at the CT level. Whetheremployment zones are defined as of 1996 or2001, similar conclusions are drawn in bothcases: employment is tending to grow inemployment zones and there is no evidenceof generalised dispersal.2 However, at thefine scale of analysis rendered possible bythe use of enumeration areas, a hitherto littlenoticed phenomenon has been brought tolight. In urban areas there seems to be a con-stant churning of growth and decline, whichhas perhaps not been noticed because analyststend to look at net employment growth oversizeable areas. Our results at a finer scale aresimilar to those obtained by researchers whohave analysed employment growth in smalland medium-sized companies (SMEs): theyhave often pointed out that, even if SMEstend to generate employment, this net resultis the outcome of numerous start ups andnumerous failures (Davis et al., 1996). Simi-larly, even if employment is tending to growin and around employment zones, our resultsshow that this is the result, particularly at thefringes where smaller concentrations ofemployment are found, of a process ofgrowth and decay. In practice, this processmay be linked to establishments moving asthey grow or decline, to developers buildingpremises or converting spaces to differentuses, etc.—in sum, to the every-day function-ing of a commercial property market. Thus, inmicro areas, a high level of instability isapparent. However, more broadly, the basicemployment structures (core EAs, the
general position of new employment zonesrelative to core areas) of a metropolitan arearemain stable; if these structures vary—andthey quite clearly do—they do so over thelonger term and in an ordered way, in accord-ance with the accessibility, employment andinfrastructure needs of employers andemployees. The very rapid rates of growthand decline that are observed for enumerationareas moving into or out of employment zonestatus (Table 4) result from the smaller size ofEAs that make the transition. By definition,they are fluctuating around 500 jobs,3 whichmeans that the departure of a medium-sizedestablishment of, say, 200–250 jobs (or thearrival of one) can lead to rates of growth ordecline of 40–50 per cent.
This type of churning, of growth anddecline, although most evident at the fringesof core zones, is in fact happening within alltypes of employment zone, and across theentire intrametropolitan space-economy.Table 5 analyses only those EAs that havenot changed status between 1996 and 2001,identifying, for each EA type, those EAswhere employment has grown and thosewhere employment has declined. For everytype of EA, whether CBD core, major coreor non-employment zone, there are cases ofboth growth and decline. Thus, even if, at ahigher scale (say at the census tract level),one can safely say that certain areas havegrown (for example, the CBD) and othershave declined (for example, non-employmentzones), at a finer scale of analysis it is imposs-ible to be so categorical; one can only say thatcertain types of EA have, on balance and in anet sense, grown or declined.
In the next section, we analyse a map ofMontreal in order to reach a better understand-ing of the geography of employment zones.So far, the analysis has been conducted inthe abstract space depicted in Figure 1. Byobserving the real space of Montreal in thelight of this analysis of growth and decline,we can achieve a better understanding of thenature of employment zones.
Turning now to the secondary and isolatedemployment zones, an interesting phenom-enon is the move of many secondary
1724 RICHARD SHEARMUR ET AL.

Table 5. Growth and decline amongst EAs that do not change status, 1996–2001
Type n
Montreal
n
Toronto
n
Vancouver
Employment Growth Employment Growth Employment Growth
1996 2001 Absolute Percentage 1996 2001 Absolute Percentage 1996 2001 Absolute Percentage
1a Decline 2 36 010 27 615 28 395 223 2 29 970 29 395 2575 22 1 12 210 12 060 2150 211a Grow 4 138 515 163 360 24 845 18 12 213 285 262 550 49 265 23 1 458 75 48 480 2 605 6
1b Decline 15 25 280 20 215 25 065 220 12 13 915 11 300 22 615 219 5 740 5 6 925 2480 261b Grow 35 54 735 74 745 20 010 37 31 46 305 61 520 15 215 33 14 256 60 33 975 8 315 32
2a Decline 3 24 465 23 970 2495 22 5 45 785 43 915 21 870 24 4 29 060 27 965 21 095 242a Grow 22 257 370 303 550 46 180 18 49 594 420 738 870 144 450 24 12 124 020 146 215 22 195 182b Decline 37 50 890 44 780 26 110 212 49 86 075 74 825 211 250 213 31 69 425 60 435 28 990 2132b Grow 72 99 445 127 080 27 635 28 79 130 245 168 405 38 160 29 22 23 170 33 580 10 410 45
3 Decline 29 41 080 34 730 26 350 215 23 27 395 23 695 23 700 214 31 41 055 35 960 25 095 2123 Grow 44 54 080 69 255 15 175 28 30 44 325 54 500 10 175 23 32 48 890 59 420 10 530 22
4 Decline 13 19 365 14 825 24 540 223 6 4 850 4 515 2335 27 7 9 070 7 165 21 905 2214 Grow 15 21 095 25 200 4 105 19 17 21 810 27 260 5 450 25 8 8 030 9 855 1 825 23
9 Decline 1 205 234 055 138 905 295 150 241 1 375 266 095 155 460 2110 635 242 682 137 210 87 450 249 760 2369 Grow 2 003 181 635 300 765 119 130 66 2 710 214 520 361 970 147 450 69 1 064 106 995 162 875 55 880 52
Total 3 499 4 400 1 914
INT
RA
ME
TR
OP
OL
ITA
NE
MP
LO
YM
EN
TS
TR
UC
TU
RE
17
25

enumeration areas to major fringe status(Table 4). Far fewer EAs make the reversetransition from major fringe to secondary orisolated status. Two processes, both illustrat-ing a certain type of concentration of employ-ment, lead to this. On the one hand, in the threeCMAs, geographical ‘links’ are being createdbetween secondary zones and major zones,thereby annexing the secondary zones to themajor ones:4 some of the EAs transitioningfrom non-employment to employment statusare located in such a way as to bridge the gapbetween the geographically isolated and themajor zones. On the other hand, employmentin some EAs within secondary zones has risento over 5000, thereby transforming the second-ary zone into a major zone with its own fringe.
The Geography of Montreal EmploymentZones
We have, so far, analysed data that have beenclassified, rather abstractly, according to theconceptual model in Figure 1, itself derivedfrom previous theorisation and studies ofemployment location. We now turn to theactual geography of employment zones inMontreal, a city we have chosen as anexample because it is one that we are familiarwith. Figure 2 shows core EAs in a dark tone;non-core, secondary and isolated zones are ina lighter shade. Rather than analyse the map aswhole, we will comment upon certain keyfeatures.
Key Features
Edgeless cities. A cursory glance at the mapdoes not reveal any edgeless cities (areaswhere employment has located in a series ofisolated buildings along highways). Thisdoes not mean that they do not exist in Mon-treal, nor that they lie outside our employmentzones. Indeed, there are two suburbanemployment zones (Mirabel and Varennes)which cover large areas. Both have highwayspassing through them and for neither do wehave any information on the precise locationof jobs within the large area. In Varennes inparticular, we note that there is a low
number of jobs per kilometre of highway5
and we know that the area is largely agricul-tural with a few buildings scattered along thehighway. Although such an analysis is in noway rigorous, it suggests that further explora-tion is needed in order to assess whether eitherof these apparently very diffuse suburbanpoles meets the criteria suggested by Lang(2003) for edgeless cities. By combiningdetailed origin-destination survey data withindicators such as jobs per km of road, weeventually hope to be able to qualify more rig-orously the nature of employment locationwithin these suburban employment zones.
Linear zones. The vocabulary of ‘poles’,‘centres’, ‘edge cities’ implies a compact,nodal type of development. Very few of thezones identified on the map are of a compactshape. The Varennes zone follows highway30, and the intersection of highways 30 and20 appears to be the intersection of twolinear zones, each following one of the high-ways. Highway 40, which crosses Montrealisland from south-west to north-east, hasfour major zones and numerous secondaryand isolated zones strung along it. To someextent, dividing employment along highway40 into discrete employment zones is artifi-cial, since the entire length of the highway isan employment zone. Only our local knowl-edge, and the fact that certain minor breaksdo appear, has enabled us to separate out thevarious different types of employment zonealong this road. Also evident on this map aretwo smaller linear zones. The south-east tonorth-west St Laurent axis, which is the his-torical backbone of Montreal’s space-economy, emerges clearly on the map andemerges more clearly still when the E/R cri-terion is relaxed (St Laurent is a road charac-terised by high employment and residentialdensity). In the southern suburbs, the Tascher-eau boulevard zone clearly emerges; this is amajor suburban shopping strip, with big boxstores facing onto the road and residencesimmediately behind. Here, too, the proximityof retail employment and suburban housingattenuates, but does not obliterate, this linearzone. Finally, highway 15, which heads
1726 RICHARD SHEARMUR ET AL.

Fig
ure
2.
Mo
ntr
eal
emp
loy
men
tzo
nes
,2
00
1.
INTRAMETROPOLITAN EMPLOYMENT STRUCTURE 1727

north-west from highway 40, joins four majorzones together along a distance of about30 km. Whilst each of these zones is separate,fringe EAs and certain secondary zones makethis entire stretch of highway another majoremployment axis.
Links between major zones. Going south-westfrom the CBD, a series of fringe EAs link theCBD with another major zone, the Angrignonretail zone. From there, some more fringeEAs link Angrignon with Ville St Laurent/Dorval. North-east from this major zone, asmall non-core EA links it with the MarcheCentral, itself very nearly linked to Anjou(along highway 40) and Laval (alonghighway 15). South-east from MarcheCentral, the St Laurent linear zone links backtowards the CBD. Thus, a series of majorzones—employment centres that also emergewhen census tracts are used and that wouldbe well recognised by most Montrealers—arelinked together by secondary zones usuallystretching along highways or major arteries.These links emerge even more clearly ifcertain employment zone criteria are relaxedor if other criteria are used (such as jobs perkm of road). This suggests an alternative wayof conceptualising the distribution of employ-ment in intrametropolitan space, one thatdraws upon the concepts of employment‘poles’ or ‘centres’, but also upon economi-cally important physical links between thesecentres. It is no longer just the ‘edge cities’and suburban centres that are important, butalso the spaces in between. Indeed, in the pre-vious section, our analysis suggests thatbetween 1996 and 2001 these links have beendeveloping and consolidating. This conceptcan be distinguished from edgeless cities bythe fact that the physical linking of employ-ment centres is a key component of it.
Employment centres and theirfringes. Notwithstanding the possible exist-ence of edgeless city phenomena and therelated—although distinct—urban forms oflinear zones and links between employmentcentres, Figure 2 also underscores the factthat there are a small number of well defined
core employment zones in Montreal aroundwhich the rest of employment zones areorganised. These core zones existed in 1996and have not changed significantly (at leastwhen analysed at the census tract level)since 1981. Whether from the perspective ofgeography (Figure 2), or from the perspectiveof analysing the employment ‘status’ of EAs(Tables 4 and 5), it is clear that a smallnumber of core EAs structure the remainingemployment zones. These remaining zones,whilst often linking core zones to each other,also follow highways and principal arteries.
Figures 3 and 4, which represent Torontoand Vancouver respectively, display similargeneral patterns. We have chosen not tocomment on these maps in detail, bearing inmind our more limited knowledge of thesecities: naming employment zones with anydegree of accuracy requires such knowledge.However, possible edgeless cities, definitelinear zones, links between major zones andstable employment core zones are all identifi-able in these cities.
Measurement Error6
So far in this analysis, we have treated ourdata as if they were error-free except for theerrors in geographical coding that we haveto a large extent corrected by aggregatingcensus sub-divisions where necessary.However, Statistics Canada (2003) estimatesthat, for a count of 500 (our cut-off point foremployment zones), there is a standard errorof 45. In other words, there exists an irre-ducible uncertainty not only with regard tothe precise extent of employment zones, butalso—and perhaps more importantly in thecontext of this analysis—with regard to thequalification of transitions between employ-ment zone and non-employment zone status.In Table 4, we document these transitionsand conclude that there is considerableinstability at the fringe of employmentzones. This instability may be due to thechaotic nature of urban spatial processes atsuch a fine scale (and we believe that this isso), but some may also be attributable tomeasurement error.
1728 RICHARD SHEARMUR ET AL.

Fig
ure
3.
To
ron
toem
plo
ym
ent
zon
es,
20
01
.
INTRAMETROPOLITAN EMPLOYMENT STRUCTURE 1729

Figure 4. Vancouver employment zones, 2001.
17
30
RIC
HA
RD
SH
EA
RM
URETAL.

In Table 6, each transition to and fromemployment zone status has been classifiedaccording to its level of certainty.7 For eachyear—1996 and 2001—each EA is either cer-tainly an employment zone, certainly not anemployment zone, or its classification is notknown. From these three classifications,eight possible types of transition are possible(the ninth one, from ‘certainly not an employ-ment zone’ to ‘certainly not an employmentzone’ is omitted since we are not analysingEAs which have no chance of being anemployment zone in either year). The tablethus derived gives an idea of the maximumpossible uncertainty attributable to measure-ment error (given our definition of certainty).It is a maximum for two reasons: first, each
transition is considered independently. How-ever, as the number of transitions consideredrises, errors in one direction will tend to becompensated by errors in the other. Secondly,we have not attempted to estimate the way inwhich measurement errors for the ER ratioand measurement errors for E combine:since these two errors are not completely inde-pendent, we are in fact slightly overestimatingthe probability of uncertainty for each individ-ual transition. Figures 2–4 indicate, for 2001,the EAs which are in the uncertain category.
Bearing this in mind, Table 6 and Figures2–4 show that, although measurement error cer-tainly increases the noisiness in our results, itmost probably does not fundamentally affecttheir general thrust. Very few uncertain EAs
Table 6. Transitions from and to employment zone status, 1996–2001
Type Change n E in 1996 E in 2001 Growth Sum by typea
Montreal changesCertain EZ96 and EZ01 329 909 375 1 038 595 129 220Certain EZ96 to Not01 48 44 755 16 220 228 535Certain Not96 to EZ01 54 15 875 50 035 34 160 191 915Uncertain DNK to EZ01 31 16 495 25 195 8 700Uncertain DNK to not01 38 19 045 12 230 26 815Uncertain EZ96 to DNK 21 16 935 12 455 24 480Uncertain Not96 to DNK 53 15 505 26 570 11 065 31 060Do not know do_not_know 17 8 400 8 380 220 220
Toronto changesCertain EZ96 and EZ01 369 1 395 785 1 672 830 277 045Certain EZ96 to Not01 57 53 480 24 345 229 135Certain Not96 to EZ01 56 16 230 63 260 47 030 353 210Uncertain DNK to EZ01 23 11 040 17 960 6 920Uncertain DNK to not01 42 25 300 16 195 29 105Uncertain EZ96 to DNK 21 24 195 16 420 27 775Uncertain Not96 to DNK 40 13 625 21 325 7 700 31 500Do not know do_not_know 13 7 700 8 140 440 440
Vancouver changesCertain EZ96 and EZ01 181 510 030 571895 61 865Certain EZ96 to Not01 27 25 230 12 925 212 305Certain Not96 to EZ01 30 10 175 24 545 14 370 88 540Uncertain DNK to EZ01 13 6 420 10 350 3 930Uncertain DNK to not01 24 12 795 7 435 25 360Uncertain EZ96 to DNK 10 7 710 5 485 22 225Uncertain Not96 to DNK 22 11 145 16 070 4 925 16 440Do not know do_not_know 8 3 995 4 190 195 195
aThis column contains the sum of absolute values by level of certainty.
Note: Population: all SDs where ER . 0.938 and E . 455 in 1996 or where ER . 0.938 and E . 455 in 2001.
Key: DNK: Do not know. Probability that the SD is an employment zone ,84.2 per cent.
EZxx: Probability that SD is an employment zone in year XX � 84.2 per cent.
Notxx: Probability that SD is not an employment zone in year XX � 84.2 per cent.
INTRAMETROPOLITAN EMPLOYMENT STRUCTURE 1731
are geographically isolated from certain EAs: inother words, uncertainty is mainly confined tothe fringes of employment zones. Furthermore,the scope of measurement error is limited. Ineach city, a vast majority of jobs qualified asbeing in employment zones are in ‘certain’zones: in Montreal in 2001, for instance,1 113 825 jobs are in ‘certain’ employmentzones, and 47 405 are in zones qualified asuncertain. This can be compared with thefigure of 1 133 800 jobs in employment zones(see Table 1) if no account is taken of measure-ment error.
Measurement error has greater impact iftransitions are considered: between 1996 and2001, from 8 per cent (in Toronto) to 16 percent (in Vancouver) of jobs involved in tran-sitions8 are involved in uncertain transitions.As can be seen from Table 6, however, theseuncertain transitions tend to cancel eachother out: the net number of jobs (and thenet number of EAs) involved in uncertaintransitions is small. If only the certain tran-sitions are considered, Table 6 reveals thatin each city a large proportion of EAs inemployment zones remain stable, and thereis also considerable churning—fairly largenumbers of EAs gain or lose employmentzone status over the period. These conclusionsare the same as those reached when errorswere not considered.
It is not feasible, in this article, to apply thisapproach to the entire analysis in the preced-ing sections. However, by considering theprobable impact of measurement error onour results, two conclusions can be drawn.First, notwithstanding our use of the word‘certain’ in order to simplify our exposition,there is no absolute certainty involved in theidentification of employment zones. Employ-ment zones can more accurately be definedas fields of probability—with extremely highprobability of employment zone status forthe cores and decreasing probability ofemployment zone status as either ER, E orboth get closer to the cut-off points. Secondly,whilst introducing a level of uncertainty, andthe necessity of thinking in probabilisticterms, the consideration of measurementerror does not fundamentally alter our
aggregate conclusions at the metropolitanlevel. The processes we describe in the pre-vious section, and their geography, remainobservable (although less clearly) even afteraccounting for measurement error.
Discussion and Conclusion
Some Conceptual and MeasurementConsiderations
In beginning the research for this paper, ourintention was to document in greater detailthe evolution of the metropolitan space-economy in Canadian cities. We expectedour principal contributions to follow fromthe increased level of detail permitted byanalysis at the enumeration area scale. Ourempirical results do provide some insightsinto evolving metropolitan form and its com-plexity, and these will be discussed in the fol-lowing section. More unexpectedly, ouranalysis highlights some important conceptualconsiderations linked to measurement andscale of analysis.
In interpreting our results, two types ofuncertainty have been considered. The firstis uncertainty at the fringes of employmentzones as EAs enter and leave employmentzone status in a chaotic manner. From oneperiod to the next, and abstracting from anymeasurement error, it is impossible toforesee which EAs will undergo a change instatus. Despite this small area chaos, thereis great stability in overall metropolitan struc-ture. Thus, the metropolitan space economycan be understood as a chaotic system(Prigogine, 1994; Manson, 2001).9 Suchsystems can be studied from two perspectives(Prigogine, 1994, p. 9): first, from the perspec-tive of individual members; and, secondly,from the perspective of the system as awhole. In our analysis, individual membersare the EAs and their trajectories over timeare not predictable: one cannot ascertain, atthe beginning of a period, whether a givenEA will grow or decline over the next periodand whether it will have employment zonestatus or not. At most, one could assign a prob-ability to each possible trajectory. The system
1732 RICHARD SHEARMUR ET AL.

as a whole is the metropolitan area: at thisscale, there is great stability, notwithstandingthe unpredictable trajectories of each individ-ual EA. Although change does occur at thisscale, it occurs along broadly predictablelines in an ordered fashion.
The second type of uncertainty revealed inour study is that attributable to measurementerror. Although measurement error shouldcome as no surprise, few—if any—studies ofthe metropolitan space-economy have dis-cussed its effect on results. This can be attrib-uted to the broader scale of analysis in mostother studies: at the census tract level, forinstance, the effect of measurement error canbe overlooked.10 The consequence ofmeasurement error is that it is impossible toknow with certainty whether a particular EAhas experienced growth or decline, andwhether—at a given point in time—it is anemployment zone or not. Such measurementerror is fundamentally different from uncer-tainty due to chaotic processes: even error-free observation would reveal instabilityover time at the fringes of employmentzones (as suggested by the ‘certain’ resultsin Table 6). Measurement error means thateven for a given year our data do not enableus to be sure of the exact number of jobs ina particular EA. Our experience in analysingthese data is reminiscent of Heisenberg’suncertainty principle: the closer we havecome to our object of analysis (ultimately,we would like to analyse the point pattern dis-tribution of jobs), the less certain we are of ourmeasure of employment. Conversely, as wetake steps back and distance ourselves fromour object of analysis (by aggregating obser-vations over wider areas), the more confidencewe have in our measure of employment.Thus, the uncertainty principle as applied toour analysis would be: the more precise themeasurement of location, the less precise themeasurement of the phenomenon beinganalysed.
These two conceptual considerations arenot new: many analysts have used chaostheory to model urban growth (see, forinstance, Allen and Sanglier, 1978; Makseet al., 1998) and the idea that measurement
error exists is fundamental to all statisticalanalysis. However, the fact that these con-siderations arise in a straightforward piece ofdescriptive empirical work has some widertheoretical considerations, to which we willnow turn.
Empirical Results and Theory
There has been some debate in recent yearsover whether employment has been polynu-cleating (Garreau, 1991) or dispersing(Gordon and Richardson, 1996), and overwhether the development of metropolitanareas is chaotic (Dear and Flusty, 2001) orordered (Shearmur and Charron, 2004). Ourresults seem to suggest that all of these pro-cesses are occurring at the same time and inthe same places11 and generalise Charney’s(2005) whose analysis of Toronto’s officemarket leads her to conclude that clusteringand dispersal can occur simultaneouslywithin suburbs.
This does not mean, however, that there areno regular processes at work and that no con-clusions can be drawn about what is occurringin Canada’s three largest cities. It shows, inkeeping with chaos theory, that different pro-cesses occur at different scales and that thechoice of scale and of object of analysis willbring to the fore one or another of the appar-ently contradictory trends mentioned above.
Polynucleation is occurring in Canada’sthree largest cities: if the 2001 employmentzones are analysed, it is clear that employ-ment grows fastest in ‘employment centres’.Furthermore, despite apparent dispersal whenone analyses the 1996 employment zones, theenumeration areas towards which employ-ment has ‘dispersed’ are predominantlycontiguous to the fringes of existing employ-ment zones. Finally, at the scale of censustracts, there is a tendency (albeit a relativelymodest one) for employment to grow fasterin employment zones, irrespective of theyear chosen for defining the zones.
Dispersal is also occurring: strictly speak-ing, dispersal should be measured taking theinitial year as a base. It is undeniable thatemployment has been growing in areas
INTRAMETROPOLITAN EMPLOYMENT STRUCTURE 1733

outside the 1996 employment zones—and thiscould be called dispersal. However, there islittle evidence of scattering, as this impliesthat the dispersal is widespread across themetropolitan area. Although some employ-ment growth is occurring away from 1996employment zones (in Table 4, it can beseen that a number of rapidly growing 1996non-employment zones have become isolatedemployment zones in 2001), most of the 1996non-employment zones that change status doso by joining a secondary zone or the fringesof the CBD and major zones. However, tothe extent that edgeless cities are also a formof dispersal, then maybe some of the suburbanemployment zones we have identified shouldqualify as dispersed. Given the large size ofsome of these employment zones (and thelarge size of the EAs they gather), it is quitepossible that dispersal could be occurringwithin areas we have identified as employmentzones. Further study—with alternative datasources—will be necessary to investigate this.
At the enumeration area scale (that of a fewcity blocks), employment growth is chaoticand the churning of employment betweendifferent EAs somewhat resembles the hapha-zard location decisions posited by ‘keno capit-alism’ (Dear and Flusty, 2001). Even amongstthe stable core EAs of each of the three CBDs,some EAs have declined and others havegrown over the 1996–2001 period. At theunstable fringes of the CBD and majorzones, numerous EAs have declined and losttheir employment zone status, whilst othershave emerged as economic locations. It istherefore not possible to assert, for instancethat, because an EA is part of a major employ-ment zone core (the type of zone that consist-ently grows the fastest across the 1996–2001period—Tables 2 and 3), then it will necess-arily have benefited from employmentgrowth (Table 5). At this scale, and giventhis evidence, Dear and Flusty’s (2001) con-tention that there are no organising principlesto intraurban economic development appearsto be justified. Casual observation of each ofthese three CMAs, and case studies of smallareas, will reveal only chaos—with somecity blocks growing, others declining. Their
contention that there are no structures and pro-cesses operating at a wider urban scale is not,however, supported.
Indeed, it is only by drawing back from theenumeration area scale, by looking at patternsbeyond the city block using means other thancasual observation, that coherent patterns andprocesses emerge. Taking a wider view, clearstructures can be seen. Montreal, for instance,is organised around a small number of coreemployment zones, which are on the wholestable despite many micro-level fluctuations.These employment zones are surrounded bynon-core zones which are organised accordingto two related principles. First, they link majorzones: secondary, isolated and non-coreemployment zones are located in such a waythat they form links (which are sometimescontinuous, sometimes interrupted by non-employment zones) between core zones. Sec-ondly, many of these non-core zones consti-tute linear zones, following major highwaysand arteries. These processes and conceptsare somewhat removed from our initial con-ceptualisation of metropolitan areas inFigure 1. Although Figure 1 remains a usefulway of thinking about a metropolitan space-economy, our results qualify and refine ourunderstanding of the way non-core employ-ment zones are organised, as illustrated inFigure 5.
In this paper, little attention has been paidto the differences between Montreal, Torontoand Vancouver or to their particularities.Rather, the similarities between them havebeen used to highlight some key aspects ofemployment location and growth withinmetropolitan areas. A key finding is that,even in a context of rapid growth (the late1990s), there are pockets of growth anddecline across the whole CMA, even withinthe (ostensibly) fastest-growing zones. Thischurning is particularly evident around thefringes of core employment zones andmakes difficult any simple answer to the ques-tion: has employment dispersed or nucleated?Although both processes occur simul-taneously, our data do not support the ideathat employment has scattered; if it has tosome extent dispersed, it has done so
1734 RICHARD SHEARMUR ET AL.

Figure 5. The metropolitan space-economy: some additional concepts.
INT
RA
ME
TR
OP
OL
ITA
NE
MP
LO
YM
EN
TS
TR
UC
TU
RE
17
35

following highways, consolidating linksbetween core zones and on the fringes ofthese core zones.
Finally, a key to making sense of thesecomplex phenomena is not to lose sight ofthe scale at which processes occur and canbe observed; regularities are observed at thescale of the metropolitan area. Census tractsare large enough to absorb most of the ‘churn-ing effect’. On the other hand, enumerationareas allow more subtle spatial forms to beobserved, but also introduce a lot of ‘noise’into the analysis. This noise is partly due tothe day-to-day workings of property marketsand firms within the city and partly due tomeasurement error: it is impossible to differ-entiate completely between these twosources of ‘noise’ and there is therefore anirreducible level of uncertainty. Thus,although we can present no overarchingresults—we have not resolved the scatteringversus polarisation argument, and we are notyet able to investigate fully the edgeless cityphenomenon—we have shown that manyapparently contradictory trends can beobserved in a city without these trends beingeither contradictory or unstructured.
Notes
1. As one increases the threshold in steps of100 between 100 and 1000, the largestincrease in jobs per EA occurs between400 and 500 in Montreal, between 500 and600 in Vancouver and between 600 and700 in Toronto. The lowest of the threeoptima has been retained, that for Montreal.
2. These results are available upon request.3. Theoretically, a transition could also be due
to changes in population (that may lead tochanges in the ER ratio). The number ofEAs that change status because of changesin population or changes in the ER ratio isnegligible.
4. Such ‘annexing’ is, of course, a product ofour methodology which relies on chains ofcontiguity (or lack of it) to distinguish thefringes from secondary and isolated zones.We will return to this in the next section.
5. Results available on request.6. We are grateful to an anonymous referee
who raised this point.7. One-tail tests are used. ‘Certainty’ is defined
as being at least one standard error above (or
below) the cut-off point for both the ER andthe employment criterion, giving a one-tailed probability of error of 15.6 per centfor each criterion. ‘Uncertainty’ is definedas being within one standard error of thecut-off point. The standard error for the ERratio is calculated using the estimationformula given in US Census (n.d.), and isestimated to be 0.062.
8. The percentages are the ratio of ‘absolutenumber of jobs involved in uncertain tran-sitions’ to ‘all jobs involved in a certain oruncertain transition’. These numbers are inthe ‘Sum by type’ column of Table 6.
9. Both these sources provide good overviewsof chaos and complexity theory.
10. Although it is not completely negligible—the standard error in Canadian census datafor a count of 5000 being 160 (StatisticsCanada, 2003).
11. Thietart and Forgues (1995, p. 19) make avery similar observation concerning organi-sations. They write that “many authorshave stressed the existence of continuousprocesses of convergence and divergence,stability and instability, evolution and revo-lution in every organisation”.
References
ALLEN, P. and SANGLIER, M. (1978) Dynamicmodels of urban growth, Journal of Social andBiological Structures, 1, pp. 265–280.
ALONSO, W. (1964) Location and Land Use. Cam-bridge, MA: Harvard University Press.
BOGART, W. T. and FERRY, W. C. (1999) Employ-ment centres in greater Cleveland: evidence ofevolution in a formerly monocentric city,Urban Studies, 36, pp. 2099–2110.
BURGESS, E. (1925) The growth of the city, in:R. PARK, E. BURGESS and R. MCKENZIE (Eds)The City, pp. 37–44. Chicago, IL: Chicago Uni-versity Press.
CERVERO, R. (1989) America’s Suburban Centers.Boston, MA: Unwin Hyman.
CERVERO, R. and WU, K. L. (1997) Polycentrism,commuting and residential location in the SanFrancisco Bay area, Environment and PlanningA, 29, pp. 865–886.
CHARNEY, I. (2005) Reexamining suburban disper-sal: evidence from suburban Toronto, Journal ofUrban Affairs, 27(5), pp. 467–484.
COFFEY, W. J. and SHEARMUR, R. G. (2001a) Theidentification of employment centres in Cana-dian metropolitan areas: the example of Mon-treal, 1996, Canadian Geographer, 45, pp.371–386.
COFFEY, W. J. and SHEARMUR, R. G. (2001b)Intrametropolitan employment distribution in
1736 RICHARD SHEARMUR ET AL.

Montreal, 1981–1996, Urban Geography, 22,pp. 106–129.
COFFEY, W. J. and SHEARMUR, R. G. (2002)Agglomeration and dispersion of high-orderservice employment in the Montreal metropoli-tan region, 1981–96, Urban Studies, 39, pp.359–378.
DAVIS S., HALTIWANGER, J. and SCHUH, S. (1996)Job Creation and Destruction. Cambridge, MA:MIT Press.
DEAR, M. J. and FLUSTY, S. (Eds) (2001) TheSpaces of Post-modernity. Oxford: Blackwell.
DIELEMAN, F. and FALUDI, S. (1998) Polynu-cleated metropolitan regions in north westernEurope, European Planning Studies, 6, pp.365–378.
FILION, P. and GAD, G. (2006) Urban and suburbandowntowns: trajectories of growth and decline,in: T. BUNTING and P. FILION (Eds) CanadianCities in Transition: Local through GlobalPerspectives, 3rd edn., ch. 10. Toronto: OxfordUniversity Press.
FILION, P., MCSPURREN, K. and HUETHER, N.(2000) Synergy and movement within sub-urban mixed-use centres: the Toronto experi-ence, Journal of Urban Affairs, 22(4), pp.419–438.
FORSTALL, R. L. and GREENE, R. P. (1997) Defin-ing job concentrations: the Los Angeles case,Urban Geography, 18, pp. 705–739.
FREESTONE, R. and MURPHY, P. (1998) Metro-politan restructuring and suburban employ-ment centers: cross-cultural perspectives onthe Australian experience, Journal of theAmerican Planning Association, 64, pp.286–297.
FUJII, T. and HARTSHORN, T. A. (1995) The chan-ging metropolitan structure of Atlanta, GA:locations of functions and regional structure ina multinucleated urban area, Urban Geography,16, pp. 680–707.
GAD, G. (1985) Office location dynamics inToronto: suburbanization and central districtspecialization, Urban Geography, 6, pp. 331–351.
GAD, G. and MATTHEW, M. (2000) Central andsuburban downtowns, in: T. BUNTING andP. FILION (Eds) Canadian Cities in Transition:The Twenty–first Century, 2nd edn., ch. 11.Toronto: Oxford University Press.
GARREAU, J. (1991) Edge City. New York:Doubleday.
GIULIANO, G. and SMALL, K. A. (1991) Subcentersin the Los Angeles region, Regional Science andUrban Economics, 21, pp. 163–182.
GORDON, P. and RICHARDSON, H. W. (1996)Beyond polycentricity: the dispersed metropolis,Los Angeles, 1970–1990, Journal of the Amer-ican Planning Association, 62, pp. 289–295.
HARRIS, C. and ULLMAN, E. (1945/1970) Thenature of cities, Annals of the AmericanAcademy of Political and Social Science, 242,pp. 7–17, reprinted in: R. PUTNAM, F. TAYLOR
and P. KETTLE (Eds) A Geography of UrbanPlaces, pp. 91–101. London: Methuen.
HARTSHORN, T. A. and MULLER, P. O. (1989) Sub-urban downtowns and the transformation ofmetropolitan Atlanta’s business landscape,Urban Geography, 10, pp. 375–395.
HORWOOD, E. M. and BOYCE, R. R. (1959) Studiesof the Central Business District and UrbanFreeway Development. Seattle, WA: Universityof Washington Press.
LANG, R. E. (2003) Edgeless Cities: Exploring theElusive Metropolis. Washington, DC: TheBrookings Institution Press.
MAKSE, H., ANDRADE, J. JR., BATTY, M. ET AL.
(1998) Modeling urban growth patterns withcorrelated percolation, Physical Review, 58(6),pp. 7054–7063.
MANSON, S. (2001) Simplifying complexity: a reviewof complexity theory,Geoforum, 32, pp. 405–414.
MCDONALD, J. (1987) The identification of urbanemployment subcenters, Journal of UrbanEconomics, 21, pp. 242–258.
MCDONALD, J. and PRATHER, P. (1994) Suburbanemployment centres: the case of Chicago, UrbanStudies, 31, pp. 201–218.
MCMILLEN, D. P. and MCDONALD, J. F. (1997) Anonparametric analysis of employment densityin a polycentric city, Journal of RegionalScience, 37, pp. 591–612.
MCMILLEN, D. P. and MCDONALD, J. F. (1998)Suburban subcenters and employment densityin metropolitan Chicago, Journal of UrbanEconomics, 43, pp. 157–180.
PRIGOGINE, I. (1994) Les lois du Chaos. Paris: Nou-velle Bibliotheque Scientifique, Flammarion.
SHEARMUR, R. G. and ALVERGNE, C. (2002) Intra-metropolitan patterns of high-order businessservice location: a comparative study of seven-teen sectors in Ile-de-France, Urban Studies,39, pp. 1143–1163.
SHEARMUR, R. G. and CHARRON, M. (2004) FromChicago to LA and back again: a Chicago-inspired quantitative analysis of income distri-bution in Montreal, The Professional Geogra-pher, 56(1), pp. 109–126.
SHEARMUR, R. G. and COFFEY, W. J. (2002a) Atale of four cities: intrametropolitan employmentdistribution in Montreal, Toronto, Vancouverand Ottawa, 1981–1996, Environment andPlanning A, 34, pp. 575–598.
SHEARMUR, R. G. and COFFEY, W. J. (2002b)Urban employment sub-centres and sectoralclustering in Montreal: a complementaryapproach to the study of urban form, UrbanGeography, 23, pp. 103–130.
INTRAMETROPOLITAN EMPLOYMENT STRUCTURE 1737

SOJA, E. (1992) Inside exopolis: scenes fromOrange County, in: M. SORKIN (Ed.) Variationson a Theme Park: The New American City andthe End of Public Space, pp. 94–122.New York: The Noonday Press.
STANBACK, T. M. (1991) The New Suburbaniza-tion. Boulder, CO: Westview Press.
STATISTICS CANADA (2003) Census Dictionary.Ottawa: Statistics Canada.
THIETART, R. and FORGUES, B. (1995) Chaostheory and organization, Organization Science,6(1), pp. 19–31.
US CENSUS (n.d.) Estimates for 1996–1997 DataProducts (http://www.census.gov/acs/www/Downloads/ACS/Est9697.pdf#search¼%22ratio%20standard%20error%22).
YEATES, M. (1998) The North American City, 5thedn. New York: Harper Collins.
1738 RICHARD SHEARMUR ET AL.