Intersection Sight Distance - Oregon State...
32
The Kiewit Center for Infrastructure and Transportation Intersection Sight Distance Discussion Paper #3 by Robert Layton Kiewit -2012/04 April 2012 Prepared for Oregon Department of Transportation Salem, OR The Kiewit Center for Infrastructure and Transportation Oregon State University 111 Kearney Hall Corvallis, OR 97331 cce.oregonstate.edu
Transcript of Intersection Sight Distance - Oregon State...
The Kiewit Center for Infrastructure and Transportation
Intersection Sight Distance
Discussion Paper #3
by Robert Layton
Kiewit -2012/04
April 2012
Prepared for Oregon Department of Transportation Salem, OR
The Kiewit Center for Infrastructure and Transportation Oregon State University 111 Kearney Hall Corvallis, OR 97331 cce.oregonstate.edu
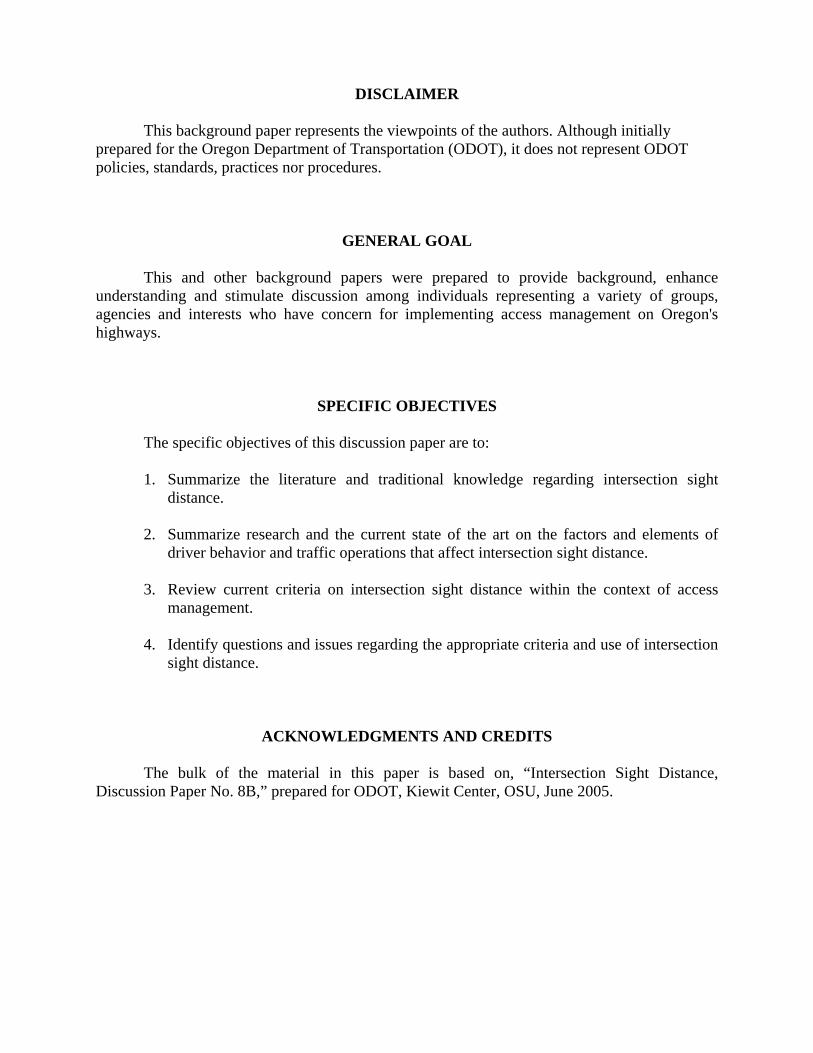
DISCLAIMER
This background paper represents the viewpoints of the authors. Although initially prepared for the Oregon Department of Transportation (ODOT), it does not represent ODOT policies, standards, practices nor procedures.
GENERAL GOAL This and other background papers were prepared to provide background, enhance understanding and stimulate discussion among individuals representing a variety of groups, agencies and interests who have concern for implementing access management on Oregon's highways.
SPECIFIC OBJECTIVES The specific objectives of this discussion paper are to:
1. Summarize the literature and traditional knowledge regarding intersection sight distance.
2. Summarize research and the current state of the art on the factors and elements of
driver behavior and traffic operations that affect intersection sight distance. 3. Review current criteria on intersection sight distance within the context of access
management. 4. Identify questions and issues regarding the appropriate criteria and use of intersection
sight distance.
ACKNOWLEDGMENTS AND CREDITS The bulk of the material in this paper is based on, “Intersection Sight Distance, Discussion Paper No. 8B,” prepared for ODOT, Kiewit Center, OSU, June 2005.
Intersection Sight Distance 1
I. OVERVIEW A. Background
The safe operation at intersections or driveways requires adequate sight distance so drivers can enter the roadway safely. The primary definition for intersection sight distance has been provided by the AASHTO Policy on Geometric Design for Streets and Highways, i.e., the Greenbook. Four recent editions of this policy, 1984, 1990, 1994, and 2001 each altered the recommended criteria.
Until 2001, the methods to determine intersection sight distance have been based on models that describe the operation of the entering vehicle and the conflicting vehicle on the major roadway.
These methods, or cases as defined in the Greenbooks up to 1994, treat:
Case I Uncontrolled Intersections Case II Yield Controlled Intersections Case III Stop Controlled Intersections Case IV Signal Controlled Intersections Case V Left Turns from Major Highway
The primary changes in intersection sight distance arose from the change in vehicle acceleration characteristics.
The new criteria for the 2001/2004/2011 AASHTO Policy on Geometric Design are fundamentally different than this pre-existing criteria. It is structured around a “gap acceptance” concept, which is based on observed driver behavior on entering intersections.
B. Content
This background paper summarizes the literature, standards and current practice on intersection sight distance. The primary emphasis of this discussion is on the driver behavior, traffic operation conditions and vehicle operating characteristics that influence the required intersection sight distance. The discussion also deals with the height of eye, height of object and location from which intersection sight distance should be measured.
The discussion includes information drawn from policies, standards, current practice and recent research. The primary sources of the policies and standards are the AASHTO Policies on Geometric Design, 1984, 1990, 1994, 2001, 2004 and 2011 Editions, and the Oregon Highway Design Manual. The changes in policy and criteria for the 2001/2004 Greenbook are presented and supported in the NCHRP Report 383, TRB.
The last section of this paper documents the criteria and methods for intersection sight distance for the 2001/2004/2011 AASHTO Greenbook. The changes in
Intersection Sight Distance 2
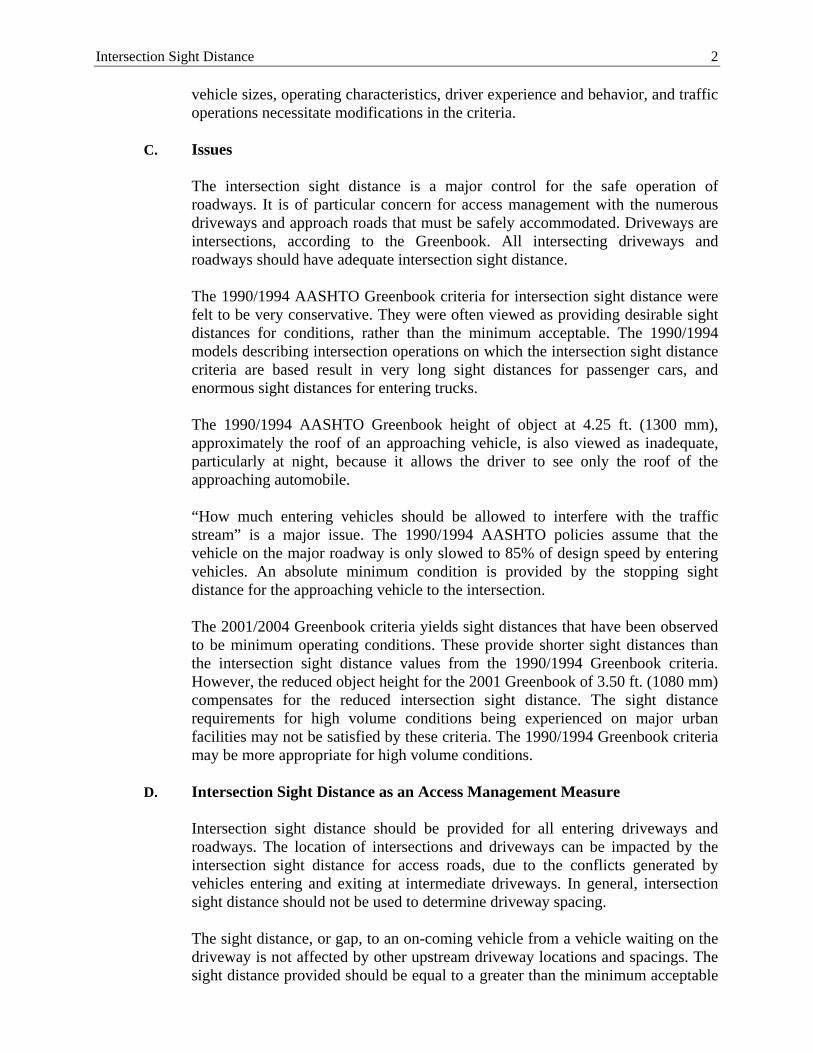
vehicle sizes, operating characteristics, driver experience and behavior, and traffic operations necessitate modifications in the criteria.
C. Issues
The intersection sight distance is a major control for the safe operation of roadways. It is of particular concern for access management with the numerous driveways and approach roads that must be safely accommodated. Driveways are intersections, according to the Greenbook. All intersecting driveways and roadways should have adequate intersection sight distance.
The 1990/1994 AASHTO Greenbook criteria for intersection sight distance were felt to be very conservative. They were often viewed as providing desirable sight distances for conditions, rather than the minimum acceptable. The 1990/1994 models describing intersection operations on which the intersection sight distance criteria are based result in very long sight distances for passenger cars, and enormous sight distances for entering trucks.
The 1990/1994 AASHTO Greenbook height of object at 4.25 ft. (1300 mm), approximately the roof of an approaching vehicle, is also viewed as inadequate, particularly at night, because it allows the driver to see only the roof of the approaching automobile.
“How much entering vehicles should be allowed to interfere with the traffic stream” is a major issue. The 1990/1994 AASHTO policies assume that the vehicle on the major roadway is only slowed to 85% of design speed by entering vehicles. An absolute minimum condition is provided by the stopping sight distance for the approaching vehicle to the intersection.
The 2001/2004 Greenbook criteria yields sight distances that have been observed to be minimum operating conditions. These provide shorter sight distances than the intersection sight distance values from the 1990/1994 Greenbook criteria. However, the reduced object height for the 2001 Greenbook of 3.50 ft. (1080 mm) compensates for the reduced intersection sight distance. The sight distance requirements for high volume conditions being experienced on major urban facilities may not be satisfied by these criteria. The 1990/1994 Greenbook criteria may be more appropriate for high volume conditions.
D. Intersection Sight Distance as an Access Management Measure
Intersection sight distance should be provided for all entering driveways and roadways. The location of intersections and driveways can be impacted by the intersection sight distance for access roads, due to the conflicts generated by vehicles entering and exiting at intermediate driveways. In general, intersection sight distance should not be used to determine driveway spacing. The sight distance, or gap, to an on-coming vehicle from a vehicle waiting on the driveway is not affected by other upstream driveway locations and spacings. The sight distance provided should be equal to a greater than the minimum acceptable
Intersection Sight Distance 3
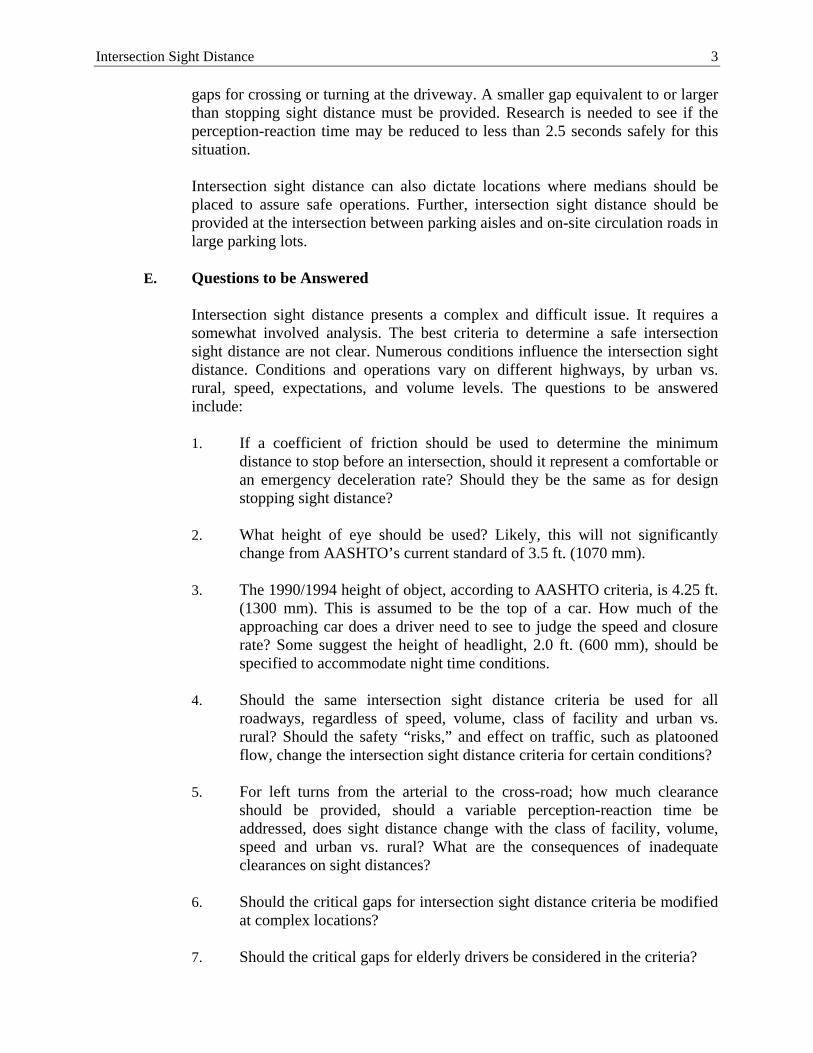
gaps for crossing or turning at the driveway. A smaller gap equivalent to or larger than stopping sight distance must be provided. Research is needed to see if the perception-reaction time may be reduced to less than 2.5 seconds safely for this situation.
Intersection sight distance can also dictate locations where medians should be placed to assure safe operations. Further, intersection sight distance should be provided at the intersection between parking aisles and on-site circulation roads in large parking lots.
E. Questions to be Answered
Intersection sight distance presents a complex and difficult issue. It requires a somewhat involved analysis. The best criteria to determine a safe intersection sight distance are not clear. Numerous conditions influence the intersection sight distance. Conditions and operations vary on different highways, by urban vs. rural, speed, expectations, and volume levels. The questions to be answered include:
1. If a coefficient of friction should be used to determine the minimum
distance to stop before an intersection, should it represent a comfortable or an emergency deceleration rate? Should they be the same as for design stopping sight distance?
2. What height of eye should be used? Likely, this will not significantly
change from AASHTO’s current standard of 3.5 ft. (1070 mm).
3. The 1990/1994 height of object, according to AASHTO criteria, is 4.25 ft. (1300 mm). This is assumed to be the top of a car. How much of the approaching car does a driver need to see to judge the speed and closure rate? Some suggest the height of headlight, 2.0 ft. (600 mm), should be specified to accommodate night time conditions.
4. Should the same intersection sight distance criteria be used for all
roadways, regardless of speed, volume, class of facility and urban vs. rural? Should the safety “risks,” and effect on traffic, such as platooned flow, change the intersection sight distance criteria for certain conditions?
5. For left turns from the arterial to the cross-road; how much clearance
should be provided, should a variable perception-reaction time be addressed, does sight distance change with the class of facility, volume, speed and urban vs. rural? What are the consequences of inadequate clearances on sight distances?
6. Should the critical gaps for intersection sight distance criteria be modified
at complex locations?
7. Should the critical gaps for elderly drivers be considered in the criteria?
Intersection Sight Distance 4
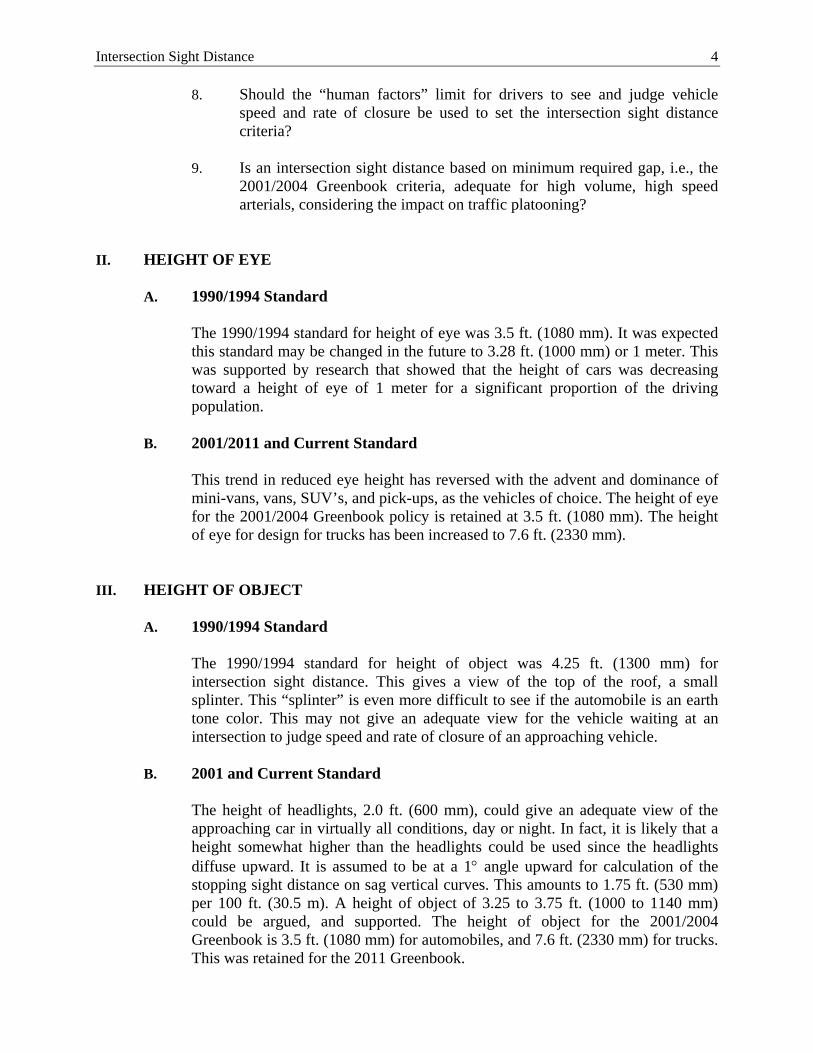
8. Should the “human factors” limit for drivers to see and judge vehicle speed and rate of closure be used to set the intersection sight distance criteria?
9. Is an intersection sight distance based on minimum required gap, i.e., the
2001/2004 Greenbook criteria, adequate for high volume, high speed arterials, considering the impact on traffic platooning?
II. HEIGHT OF EYE
A. 1990/1994 Standard
The 1990/1994 standard for height of eye was 3.5 ft. (1080 mm). It was expected this standard may be changed in the future to 3.28 ft. (1000 mm) or 1 meter. This was supported by research that showed that the height of cars was decreasing toward a height of eye of 1 meter for a significant proportion of the driving population.
B. 2001/2011 and Current Standard
This trend in reduced eye height has reversed with the advent and dominance of mini-vans, vans, SUV’s, and pick-ups, as the vehicles of choice. The height of eye for the 2001/2004 Greenbook policy is retained at 3.5 ft. (1080 mm). The height of eye for design for trucks has been increased to 7.6 ft. (2330 mm).
III. HEIGHT OF OBJECT A. 1990/1994 Standard
The 1990/1994 standard for height of object was 4.25 ft. (1300 mm) for intersection sight distance. This gives a view of the top of the roof, a small splinter. This “splinter” is even more difficult to see if the automobile is an earth tone color. This may not give an adequate view for the vehicle waiting at an intersection to judge speed and rate of closure of an approaching vehicle.
B. 2001 and Current Standard
The height of headlights, 2.0 ft. (600 mm), could give an adequate view of the approaching car in virtually all conditions, day or night. In fact, it is likely that a height somewhat higher than the headlights could be used since the headlights diffuse upward. It is assumed to be at a 1 angle upward for calculation of the stopping sight distance on sag vertical curves. This amounts to 1.75 ft. (530 mm) per 100 ft. (30.5 m). A height of object of 3.25 to 3.75 ft. (1000 to 1140 mm) could be argued, and supported. The height of object for the 2001/2004 Greenbook is 3.5 ft. (1080 mm) for automobiles, and 7.6 ft. (2330 mm) for trucks. This was retained for the 2011 Greenbook.
Intersection Sight Distance 5
IV. VEHICLE POSITION FOR SIGHTING
A. Driver’s Eye Position
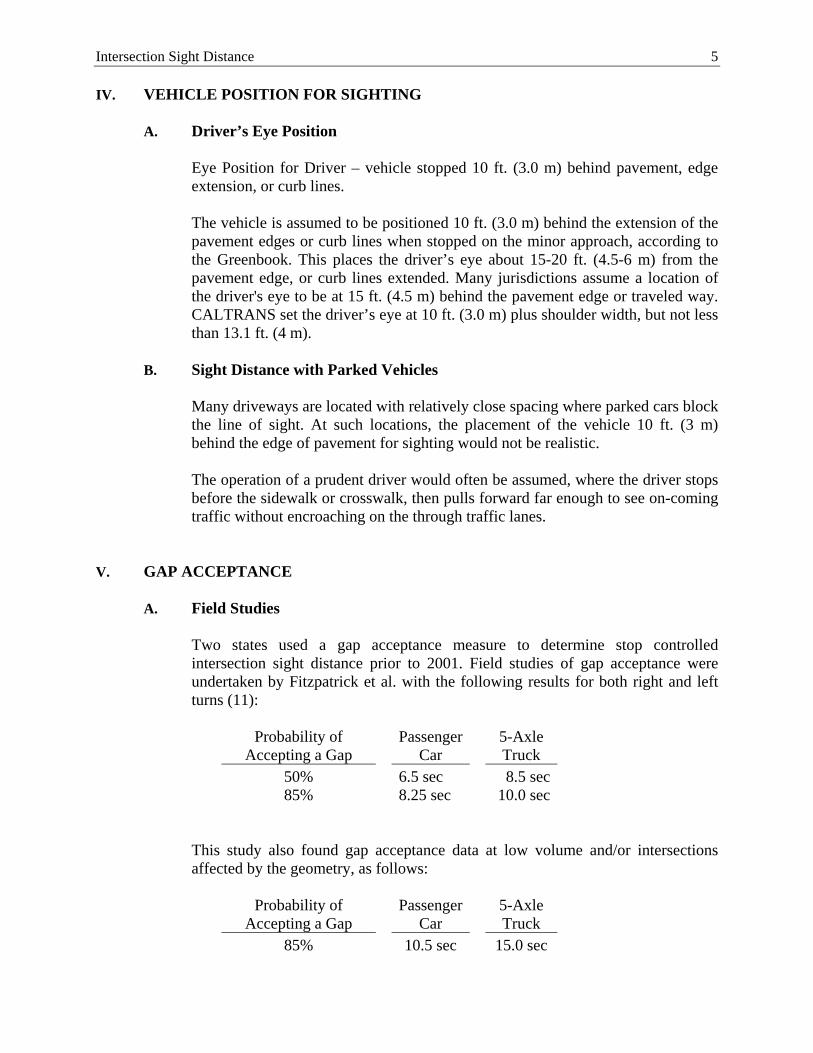
Eye Position for Driver – vehicle stopped 10 ft. (3.0 m) behind pavement, edge extension, or curb lines. The vehicle is assumed to be positioned 10 ft. (3.0 m) behind the extension of the pavement edges or curb lines when stopped on the minor approach, according to the Greenbook. This places the driver’s eye about 15-20 ft. (4.5-6 m) from the pavement edge, or curb lines extended. Many jurisdictions assume a location of the driver's eye to be at 15 ft. (4.5 m) behind the pavement edge or traveled way. CALTRANS set the driver’s eye at 10 ft. (3.0 m) plus shoulder width, but not less than 13.1 ft. (4 m).
B. Sight Distance with Parked Vehicles
Many driveways are located with relatively close spacing where parked cars block the line of sight. At such locations, the placement of the vehicle 10 ft. (3 m) behind the edge of pavement for sighting would not be realistic.
The operation of a prudent driver would often be assumed, where the driver stops before the sidewalk or crosswalk, then pulls forward far enough to see on-coming traffic without encroaching on the through traffic lanes.
V. GAP ACCEPTANCE
A. Field Studies
Two states used a gap acceptance measure to determine stop controlled intersection sight distance prior to 2001. Field studies of gap acceptance were undertaken by Fitzpatrick et al. with the following results for both right and left turns (11):
Probability of
Accepting a Gap Passenger
Car 5-Axle Truck
50% 85%
6.5 sec 8.25 sec
8.5 sec10.0 sec
This study also found gap acceptance data at low volume and/or intersections affected by the geometry, as follows:
Probability of
Accepting a Gap Passenger
Car 5-Axle Truck
85% 10.5 sec 15.0 sec
Intersection Sight Distance 6
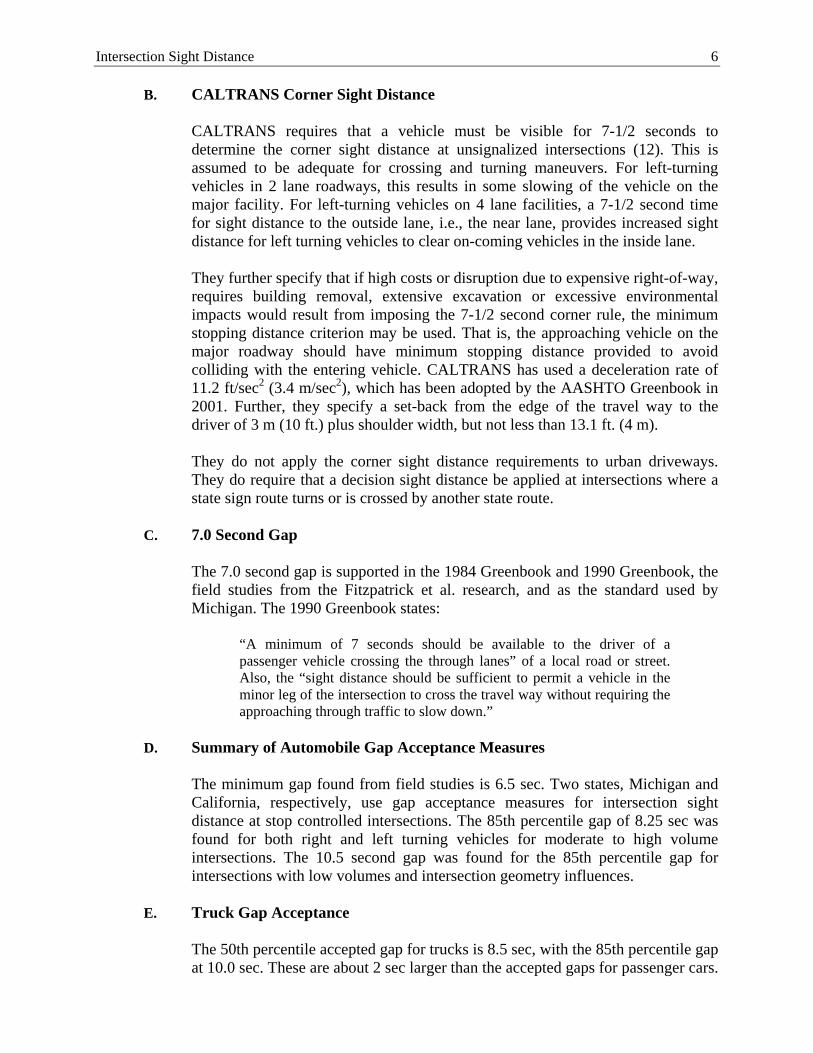
B. CALTRANS Corner Sight Distance
CALTRANS requires that a vehicle must be visible for 7-1/2 seconds to determine the corner sight distance at unsignalized intersections (12). This is assumed to be adequate for crossing and turning maneuvers. For left-turning vehicles in 2 lane roadways, this results in some slowing of the vehicle on the major facility. For left-turning vehicles on 4 lane facilities, a 7-1/2 second time for sight distance to the outside lane, i.e., the near lane, provides increased sight distance for left turning vehicles to clear on-coming vehicles in the inside lane.
They further specify that if high costs or disruption due to expensive right-of-way, requires building removal, extensive excavation or excessive environmental impacts would result from imposing the 7-1/2 second corner rule, the minimum stopping distance criterion may be used. That is, the approaching vehicle on the major roadway should have minimum stopping distance provided to avoid colliding with the entering vehicle. CALTRANS has used a deceleration rate of 11.2 ft/sec2 (3.4 m/sec2), which has been adopted by the AASHTO Greenbook in 2001. Further, they specify a set-back from the edge of the travel way to the driver of 3 m (10 ft.) plus shoulder width, but not less than 13.1 ft. (4 m).
They do not apply the corner sight distance requirements to urban driveways. They do require that a decision sight distance be applied at intersections where a state sign route turns or is crossed by another state route.
C. 7.0 Second Gap
The 7.0 second gap is supported in the 1984 Greenbook and 1990 Greenbook, the field studies from the Fitzpatrick et al. research, and as the standard used by Michigan. The 1990 Greenbook states:
“A minimum of 7 seconds should be available to the driver of a passenger vehicle crossing the through lanes” of a local road or street. Also, the “sight distance should be sufficient to permit a vehicle in the minor leg of the intersection to cross the travel way without requiring the approaching through traffic to slow down.”
D. Summary of Automobile Gap Acceptance Measures
The minimum gap found from field studies is 6.5 sec. Two states, Michigan and California, respectively, use gap acceptance measures for intersection sight distance at stop controlled intersections. The 85th percentile gap of 8.25 sec was found for both right and left turning vehicles for moderate to high volume intersections. The 10.5 second gap was found for the 85th percentile gap for intersections with low volumes and intersection geometry influences.
E. Truck Gap Acceptance
The 50th percentile accepted gap for trucks is 8.5 sec, with the 85th percentile gap at 10.0 sec. These are about 2 sec larger than the accepted gaps for passenger cars.
Intersection Sight Distance 7
At low volume locations and/or locations with intersection geometric influences the 85th percentile gap increases by 5 seconds to 15 sec.
VI. OTHER INTERSECTION SIGHT DISTANCE MEASURES
A. Emergency Stopping Distance
Other sight distance measures should be referenced before a comparison or recommendation can be made.
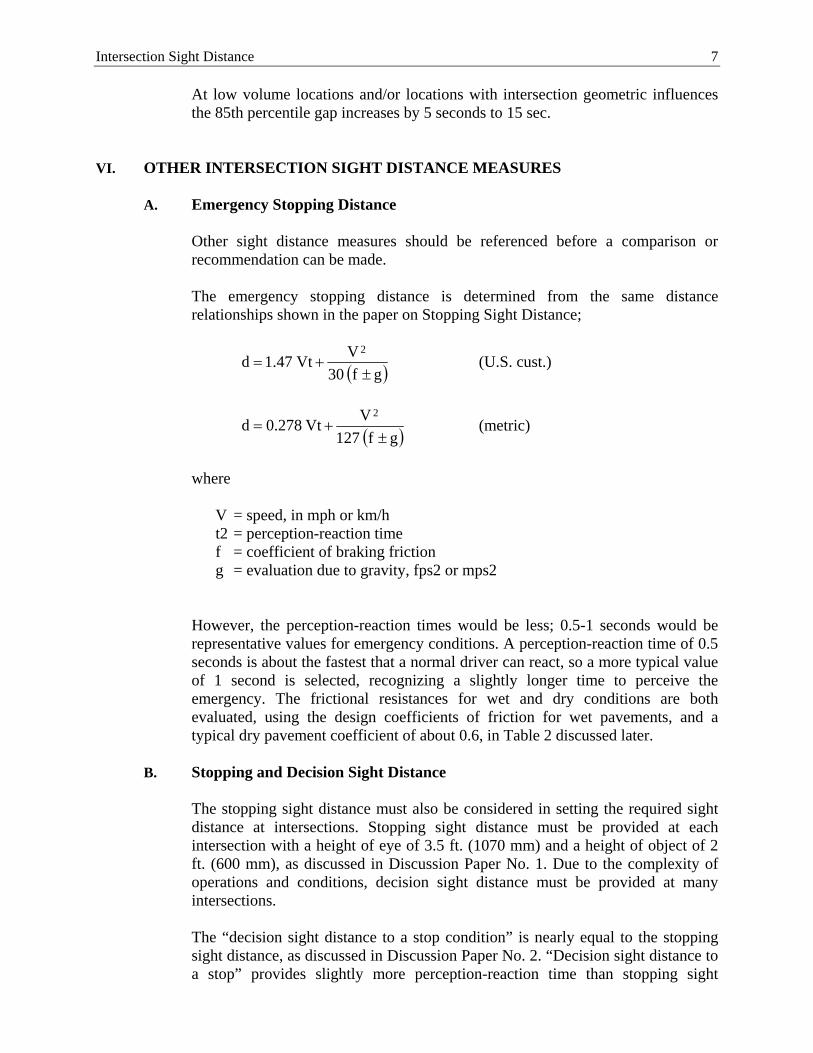
The emergency stopping distance is determined from the same distance relationships shown in the paper on Stopping Sight Distance;
gf30
VVt47.1d
2
(U.S. cust.)
gf127
VVt278.0d
2
(metric)
where V = speed, in mph or km/h t2 = perception-reaction time f = coefficient of braking friction g = evaluation due to gravity, fps2 or mps2
However, the perception-reaction times would be less; 0.5-1 seconds would be representative values for emergency conditions. A perception-reaction time of 0.5 seconds is about the fastest that a normal driver can react, so a more typical value of 1 second is selected, recognizing a slightly longer time to perceive the emergency. The frictional resistances for wet and dry conditions are both evaluated, using the design coefficients of friction for wet pavements, and a typical dry pavement coefficient of about 0.6, in Table 2 discussed later.
B. Stopping and Decision Sight Distance
The stopping sight distance must also be considered in setting the required sight distance at intersections. Stopping sight distance must be provided at each intersection with a height of eye of 3.5 ft. (1070 mm) and a height of object of 2 ft. (600 mm), as discussed in Discussion Paper No. 1. Due to the complexity of operations and conditions, decision sight distance must be provided at many intersections.
The “decision sight distance to a stop condition” is nearly equal to the stopping sight distance, as discussed in Discussion Paper No. 2. “Decision sight distance to a stop” provides slightly more perception-reaction time than stopping sight
Intersection Sight Distance 8
distance, which would aid the driver in judging whether a vehicle were going to enter the intersection from a stop unsafely with complex conditions and conflicts. So, it is a logical minimum criteria for sight distance at intersections.
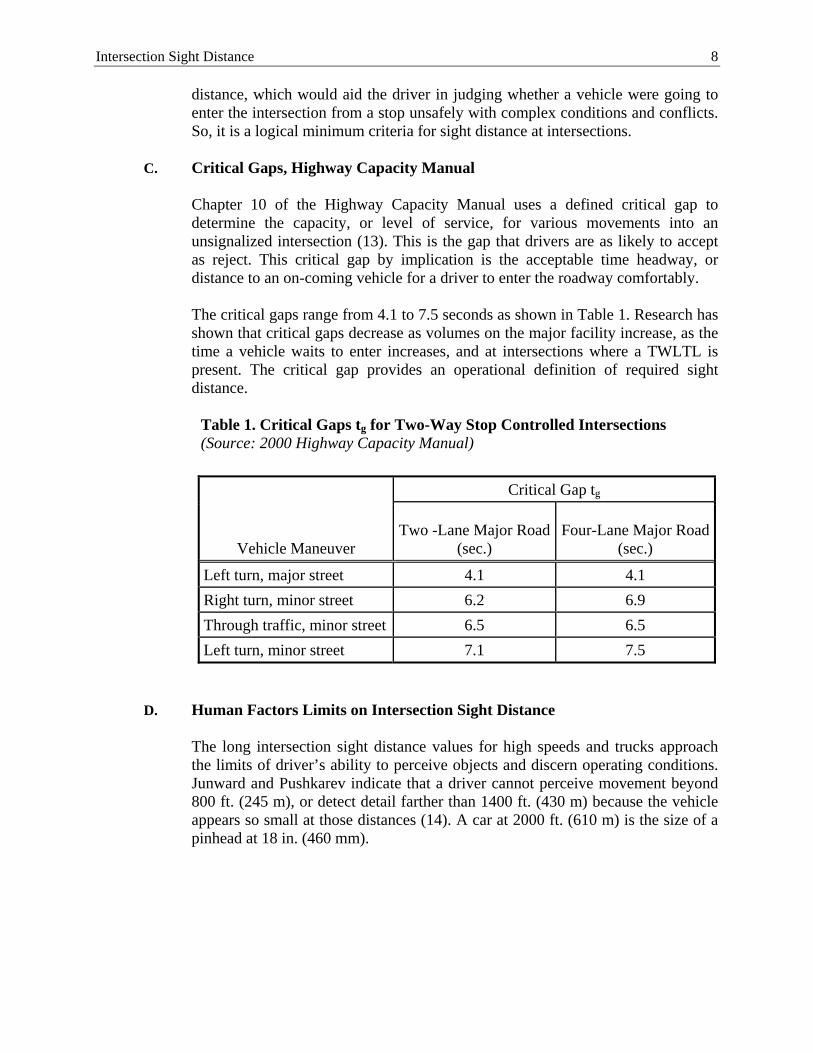
C. Critical Gaps, Highway Capacity Manual
Chapter 10 of the Highway Capacity Manual uses a defined critical gap to determine the capacity, or level of service, for various movements into an unsignalized intersection (13). This is the gap that drivers are as likely to accept as reject. This critical gap by implication is the acceptable time headway, or distance to an on-coming vehicle for a driver to enter the roadway comfortably.
The critical gaps range from 4.1 to 7.5 seconds as shown in Table 1. Research has shown that critical gaps decrease as volumes on the major facility increase, as the time a vehicle waits to enter increases, and at intersections where a TWLTL is present. The critical gap provides an operational definition of required sight distance.
Table 1. Critical Gaps tg for Two-Way Stop Controlled Intersections (Source: 2000 Highway Capacity Manual)
Vehicle Maneuver
Critical Gap tg
Two -Lane Major Road(sec.)
Four-Lane Major Road(sec.)
Left turn, major street 4.1 4.1
Right turn, minor street 6.2 6.9
Through traffic, minor street 6.5 6.5
Left turn, minor street 7.1 7.5
D. Human Factors Limits on Intersection Sight Distance
The long intersection sight distance values for high speeds and trucks approach the limits of driver’s ability to perceive objects and discern operating conditions. Junward and Pushkarev indicate that a driver cannot perceive movement beyond 800 ft. (245 m), or detect detail farther than 1400 ft. (430 m) because the vehicle appears so small at those distances (14). A car at 2000 ft. (610 m) is the size of a pinhead at 18 in. (460 mm).
Intersection Sight Distance 9
VII. COMPARISON OF INTERSECTION SIGHT DISTANCE CRITERIA AND OTHER SIGHT DISTANCES
A. 1994 AASHTO Intersection Sight Distance Criteria
The sight distance requirements at intersections as required by AASHTO provides a comfortable operation and safe design.
The relative severity, or safety, of the various cases should be reviewed to determine the reasonability of the various requirements. Most sight distance requirements are based on the limiting conditions to provide a minimum acceptable design for safety. The 1994 criteria for the left-turning intersection sight distance with the vehicle approaching from the right, Case IIIBR, and the sight distance for a right turning vehicle with a vehicle approaching from the left, Case IIIC, were based on a comfortable or desirable condition. For both of these cases, the vehicle on the major facility was expected to decelerate to 85% of design speed, which is often nearly equal to the 85th percentile speed for the roadway and typically greater than the mean speed. This is a desirable, or comfortable, condition. Where these sight distance could not be achieved easily or at low cost, these two cases were viewed as desirable, not a minimum or limiting condition.
B. Comparison of 2001/2004 Sight Distance and Other Criteria
The various sight distance requirements and criteria are shown in Table 2. The AASHTO intersection sight distance requirements cover a limited range of sight distances. For example, at 60 mph (100 km/h), the required sight distance is only 90 ft. more for Case B3 (2001)“crossing” than for Case B1 (2001) “left turning,” respectively. The Case B3 (2001) crossing requirements provides adequate clearance for the crossing vehicle, avoiding a potential right angle collision, however, some slowing of the major street vehicle may occur.
The “crossing” intersection sight distance, Case B3 (2001) provides for greater sight distance than for stopping sight distance up to 60 mph (100 km/h). However, it does not provide for sight distances greater than decision sight distance, which may be appropriate limits for Oregon, since it recognizes the changes in complexity and expectations in urban and rural conditions. The decision sight distance for the urban/suburban and rural areas for speed, path or direction change would be appropriate for many conditions on multi-lane roadways. However, these sight distances are for vehicles traveling on the major facility, rather than stopped on the minor approach, where intersection sight distance is measured. These values are shown in Table 2.
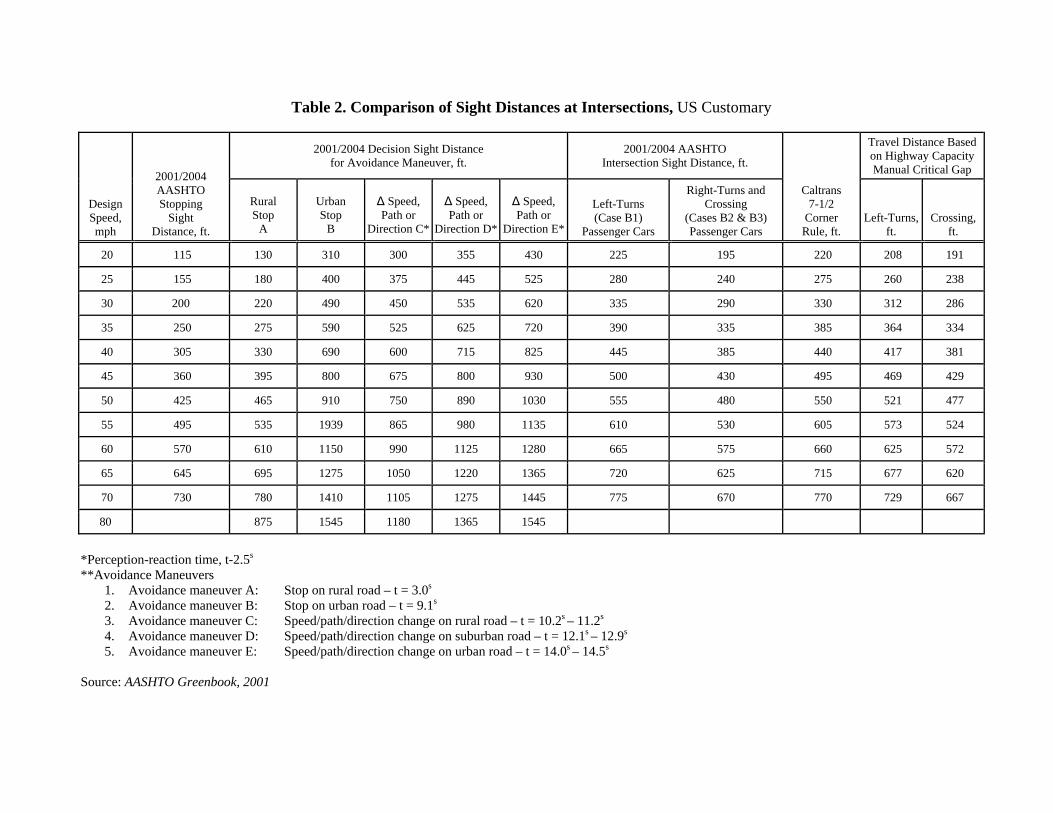
Table 2. Comparison of Sight Distances at Intersections, US Customary
Design Speed, mph
2001/2004 AASHTO Stopping
Sight Distance, ft.
2001/2004 Decision Sight Distance for Avoidance Maneuver, ft.
2001/2004 AASHTO Intersection Sight Distance, ft.
Caltrans 7-1/2
Corner Rule, ft.
Travel Distance Based on Highway Capacity Manual Critical Gap
Rural Stop
A
Urban Stop
B
∆ Speed, Path or
Direction C*
∆ Speed, Path or
Direction D*
∆ Speed, Path or
Direction E*
Left-Turns (Case B1)
Passenger Cars
Right-Turns and Crossing
(Cases B2 & B3) Passenger Cars
Left-Turns,ft.
Crossing, ft.
20 115 130 310 300 355 430 225 195 220 208 191
25 155 180 400 375 445 525 280 240 275 260 238
30 200 220 490 450 535 620 335 290 330 312 286
35 250 275 590 525 625 720 390 335 385 364 334
40 305 330 690 600 715 825 445 385 440 417 381
45 360 395 800 675 800 930 500 430 495 469 429
50 425 465 910 750 890 1030 555 480 550 521 477
55 495 535 1939 865 980 1135 610 530 605 573 524
60 570 610 1150 990 1125 1280 665 575 660 625 572
65 645 695 1275 1050 1220 1365 720 625 715 677 620
70 730 780 1410 1105 1275 1445 775 670 770 729 667
80 875 1545 1180 1365 1545
*Perception-reaction time, t-2.5s **Avoidance Maneuvers 1. Avoidance maneuver A: Stop on rural road – t = 3.0s 2. Avoidance maneuver B: Stop on urban road – t = 9.1s 3. Avoidance maneuver C: Speed/path/direction change on rural road – t = 10.2s – 11.2s 4. Avoidance maneuver D: Speed/path/direction change on suburban road – t = 12.1s – 12.9s 5. Avoidance maneuver E: Speed/path/direction change on urban road – t = 14.0s – 14.5s Source: AASHTO Greenbook, 2001
Intersection Sight Distance 11
C. Highway Capacity Manual
The larger critical gap, according to the Highway Capacity Manual, for left turn vehicles at stop controlled intersections yields travel distances that are essentially identical to the crossing sight distance requirements. This condition is the typical gap that is as likely for a driver to accept as reject in entering the roadway from a stop sign.
D. CALTRANS 7-1/2 Second Corner Rule
The CALTRANS 7-1/2 second corner rule yields sight distances that are greater than all other sight distance requirements, regardless of design speed, except for the left turn Case B1 and decision sight distance except to a stop in rural areas. The effectiveness of the 7-1/2 second corner rule as an intersection sight distance criterion can be seen in Table 4 with a comparison of the travel times, at speed, corresponding to the various sight distance requirements for speeds from 30 to 60 mph (50 to 100 kph). The 7-1/2 second corner accommodates all of the sight distance conditions that are limiting for safety.
E. Michigan 7 Second Gap Criteria
The Michigan 7 second gap criterion yields intersection sight distance requirements that are nearly equal to those for AASHTO for a left turning vehicle. Only the AASHTO left turn criteria with the vehicle coming from the right and the CALTRANS 7.5 second Corner rule yield sight distances greater than the Michigan 7 second gap. This criteria would serve well as a minimum criteria for intersection sight distance, since the AASHTO left turn criteria would provide desirable operating conditions, and significantly exceed minimum distances for safety.
F. Comparison of Travel Times and Gaps
A perspective on the various possible intersection sight distance criteria is provided by reviewing the travel times or gaps required by each (see Table 3). The Highway Capacity Manual critical gaps give a good measure of what normal operating conditions would require. The left turn maneuver requires excessively long gaps in the traffic stream, unless trucks are likely to be turning at the intersection. Also, notice that the decision sight distance to a stop in urban areas gives gaps that are longer than the Case B1 Left Turn. The decision time of 13 seconds for 45 mph (72 kph), urban environment, is at the upper limit for driver to be able to perceive speed and operating characteristics of an on-coming vehicle.
Under most conditions, the 7 or 7-1/2 second gap criteria are adequate. With trucks or urban areas, the need to provide decision time may require much longer distances. However, the 7.5s gap is the largest intersection sight distance gap, according to the 2001/2004 Greenbook.
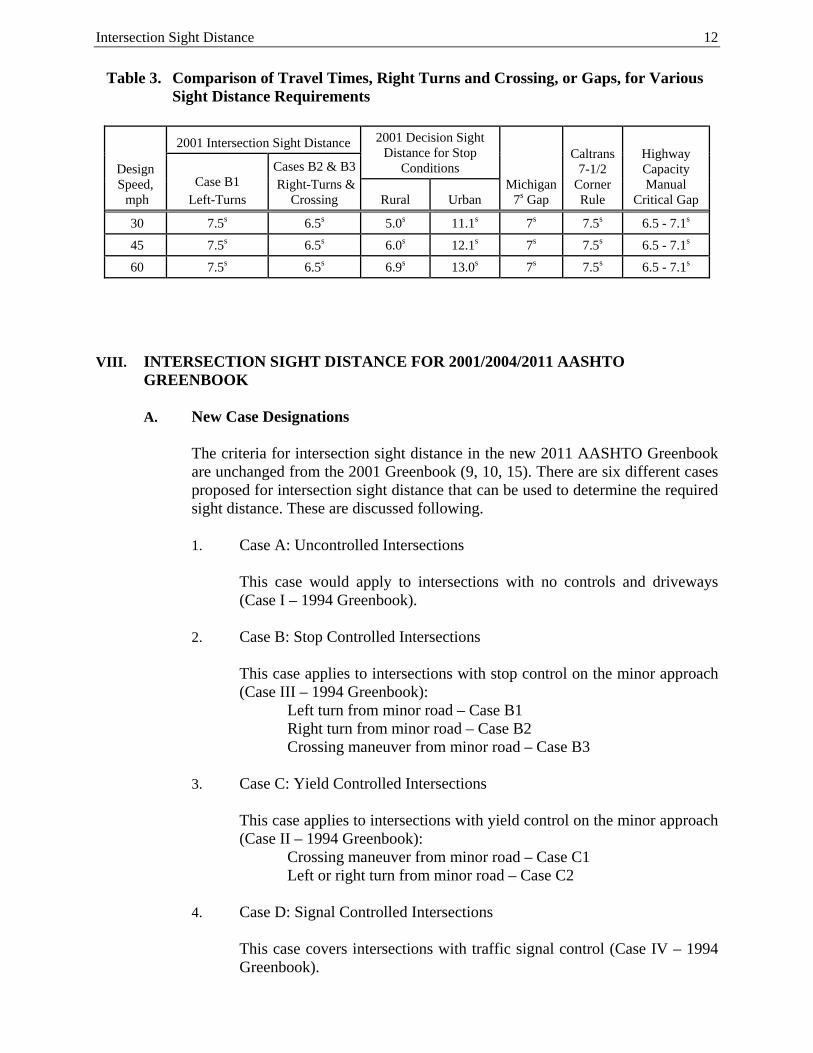
Intersection Sight Distance 12
Table 3. Comparison of Travel Times, Right Turns and Crossing, or Gaps, for Various Sight Distance Requirements
Design Speed, mph
2001 Intersection Sight Distance 2001 Decision Sight Distance for Stop
Conditions Michigan
7s Gap
Caltrans 7-1/2
Corner Rule
Highway Capacity Manual
Critical Gap Case B1
Left-Turns
Cases B2 & B3 Right-Turns &
Crossing Rural Urban
30 7.5s 6.5s 5.0s 11.1s 7s 7.5s 6.5 - 7.1s
45 7.5s 6.5s 6.0s 12.1s 7s 7.5s 6.5 - 7.1s
60 7.5s 6.5s 6.9s 13.0s 7s 7.5s 6.5 - 7.1s
VIII. INTERSECTION SIGHT DISTANCE FOR 2001/2004/2011 AASHTO
GREENBOOK
A. New Case Designations
The criteria for intersection sight distance in the new 2011 AASHTO Greenbook are unchanged from the 2001 Greenbook (9, 10, 15). There are six different cases proposed for intersection sight distance that can be used to determine the required sight distance. These are discussed following.
1. Case A: Uncontrolled Intersections
This case would apply to intersections with no controls and driveways (Case I – 1994 Greenbook).
2. Case B: Stop Controlled Intersections
This case applies to intersections with stop control on the minor approach (Case III – 1994 Greenbook): Left turn from minor road – Case B1 Right turn from minor road – Case B2 Crossing maneuver from minor road – Case B3
3. Case C: Yield Controlled Intersections
This case applies to intersections with yield control on the minor approach (Case II – 1994 Greenbook): Crossing maneuver from minor road – Case C1 Left or right turn from minor road – Case C2
4. Case D: Signal Controlled Intersections
This case covers intersections with traffic signal control (Case IV – 1994 Greenbook).
Intersection Sight Distance 13
5. Case E: All-Way Stop Controlled Intersections
This is a new case that covers all-way stop controlled intersections (not covered – 1994 Greenbook).
6. Case F: Left Turns from Major Road
This applies to situations where left turns from a major roadway must be made, such as median left turn bays (Case V – 1994 Greenbook).
B. New Height of Eye
A slight change in height of eye has been adopted at 3.5 ft. (1080 mm) for intersection sight distance. The proposed height of eye for trucks is 7.6 ft. (2330 mm).
C. New Height of Object
The new object height is reduced from 4.25 ft. (1300 mm) to 3.5 ft. (1080 mm). This is the same standard used by the Manual on Uniform Traffic Control Devices for passing sight distance. It is also recommended by the California Traffic Manual for the object height for passing sight distance, however they retained 3.5 ft. (1300 mm) for the object for intersection sight distance.
D. Confounding Effect of Height of Object and Shorter Sight Distances
The 2001/2004 height of object is more conservative than the previous 4.25 ft. (1300 mm) height of object. If the intersection sight distances for 1990 and 1994 AASHTO Greenbook were retained and used with the new 3.5 ft. object height, the resulting sight distances would be extremely conservative. However, the intersection sight distances according to the 2001/2004 AASHTO Greenbook criteria are significantly shorter than the previous values. These new intersection sight distances are appropriate if the height of object is the more conservative 3.5 ft. (1080 mm). If the shorter sight distances for 2001 are used with a 4.25 ft. (1300 mm) height of object for the 1990/1994 Greenbook, the intersection sighting condition is more restrictive than based on either the 1990, 1994 or 2001 criteria, and does not meet either.
IX. 2001/2004/2001 NEW INTERSECTION SIGHT DISTANCE CRITERIA
A. Case A: Uncontrolled Intersection – Vehicles Adjust Speeds
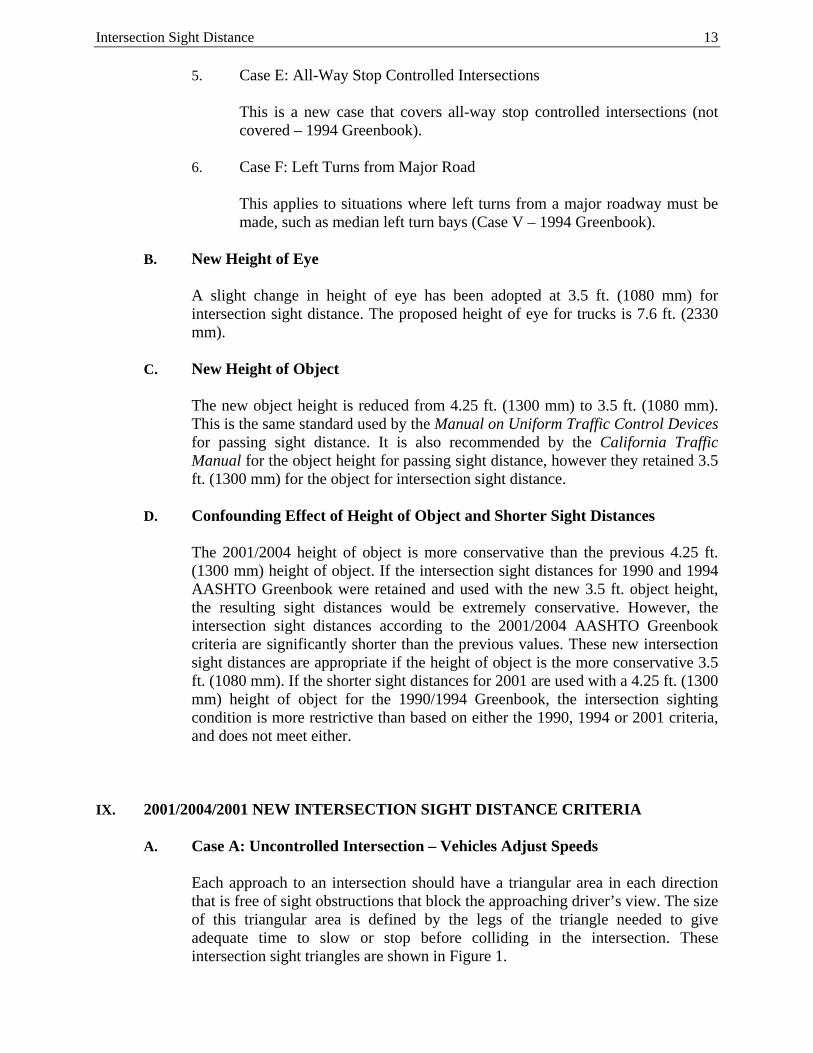
Each approach to an intersection should have a triangular area in each direction that is free of sight obstructions that block the approaching driver’s view. The size of this triangular area is defined by the legs of the triangle needed to give adequate time to slow or stop before colliding in the intersection. These intersection sight triangles are shown in Figure 1.
Intersection Sight Distance 14
The model assumes that drivers will slow down at a deceleration rate of 5 ft/sec2 (1.5 m/sec2) from mid-block running speed to 50% of mid-block running speed when approaching an intersection. If a crossing vehicle comes into view, a stopping distance is determined based on a perception-reaction time of 2.5 sec and the same deceleration ratio used for stopping sight distance.
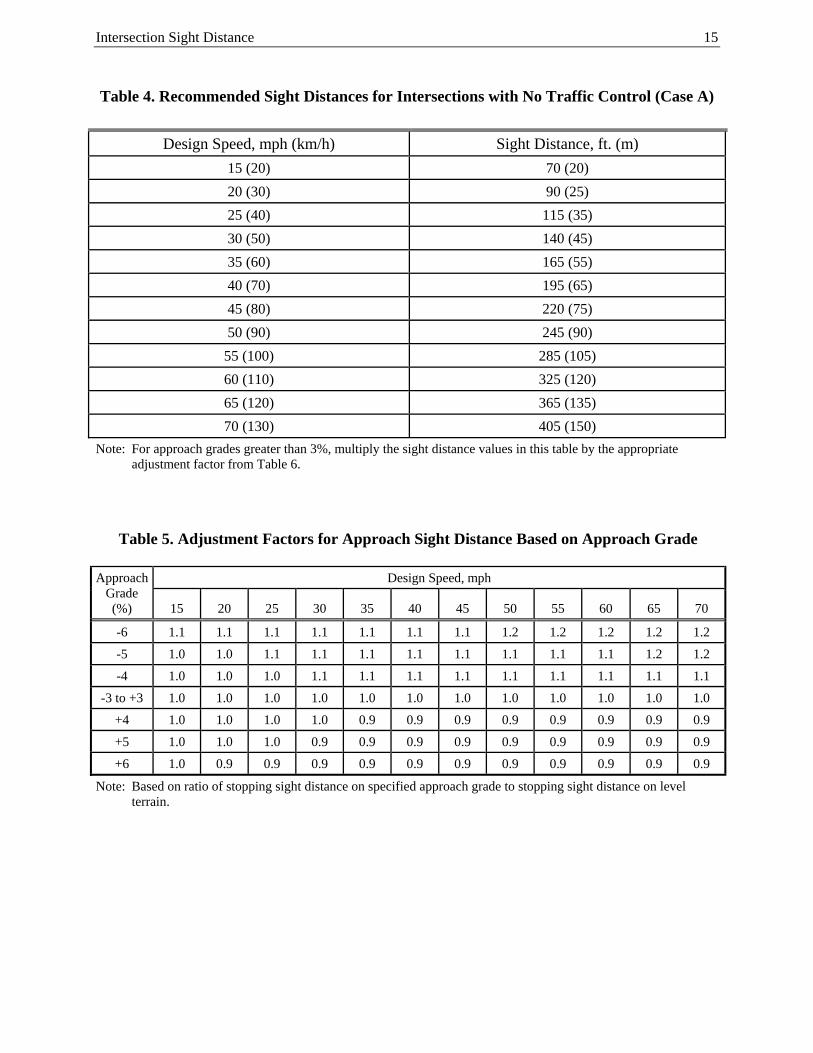
The intersection sight distances for Case A are given in Figure 2, and adjustments for approach grades that exceed 37% are given in Tables 4 and 5, respectively.
Figure 1. Intersection Sight Triangles (Source: 2001 AASHTO Greenbook)
Intersection Sight Distance 15
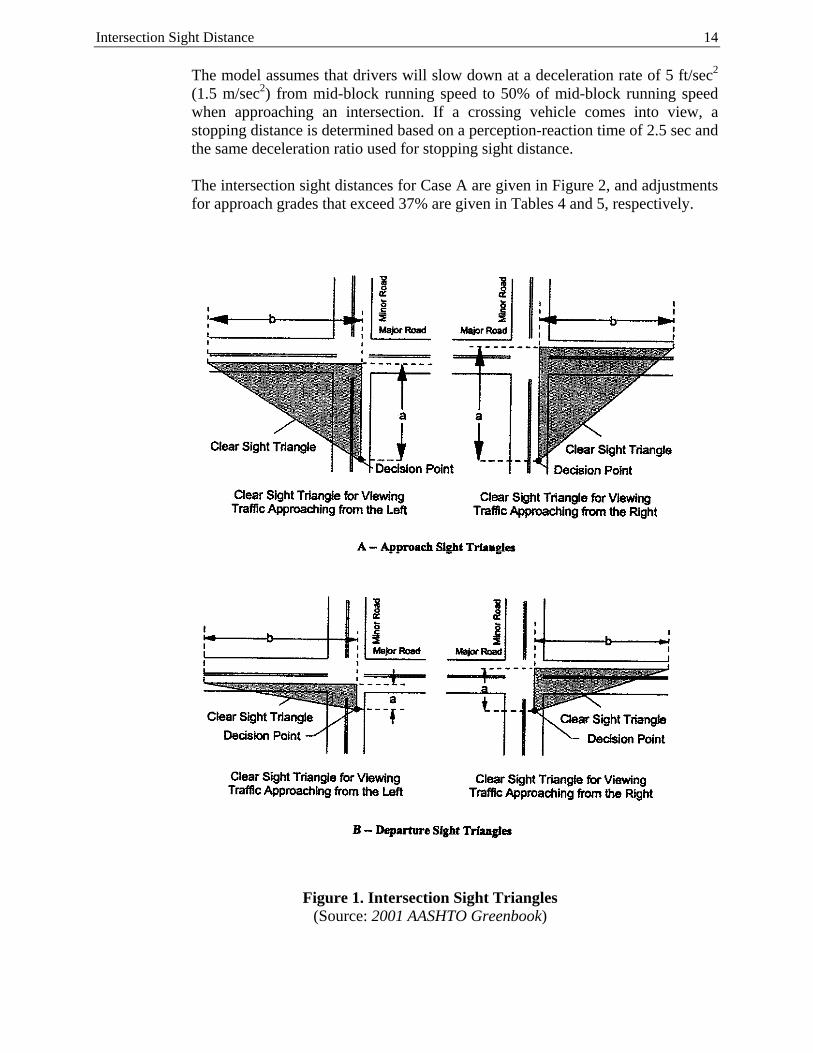
Table 4. Recommended Sight Distances for Intersections with No Traffic Control (Case A)
Design Speed, mph (km/h) Sight Distance, ft. (m)
15 (20) 70 (20)
20 (30) 90 (25)
25 (40) 115 (35)
30 (50) 140 (45)
35 (60) 165 (55)
40 (70) 195 (65)
45 (80) 220 (75)
50 (90) 245 (90)
55 (100) 285 (105)
60 (110) 325 (120)
65 (120) 365 (135)
70 (130) 405 (150)
Note: For approach grades greater than 3%, multiply the sight distance values in this table by the appropriate adjustment factor from Table 6.
Table 5. Adjustment Factors for Approach Sight Distance Based on Approach Grade
Approach Grade (%)
Design Speed, mph
15 20 25 30 35 40 45 50 55 60 65 70
-6 1.1 1.1 1.1 1.1 1.1 1.1 1.1 1.2 1.2 1.2 1.2 1.2
-5 1.0 1.0 1.1 1.1 1.1 1.1 1.1 1.1 1.1 1.1 1.2 1.2
-4 1.0 1.0 1.0 1.1 1.1 1.1 1.1 1.1 1.1 1.1 1.1 1.1
-3 to +3 1.0 1.0 1.0 1.0 1.0 1.0 1.0 1.0 1.0 1.0 1.0 1.0
+4 1.0 1.0 1.0 1.0 0.9 0.9 0.9 0.9 0.9 0.9 0.9 0.9
+5 1.0 1.0 1.0 0.9 0.9 0.9 0.9 0.9 0.9 0.9 0.9 0.9
+6 1.0 0.9 0.9 0.9 0.9 0.9 0.9 0.9 0.9 0.9 0.9 0.9
Note: Based on ratio of stopping sight distance on specified approach grade to stopping sight distance on level terrain.
Intersection Sight Distance 16
Figure 2. Length of Sight Triangle Leg – Case A – No Traffic Control (Source: 2001 AASHTO Greenbook, Ex.9-52)
Intersection Sight Distance 17
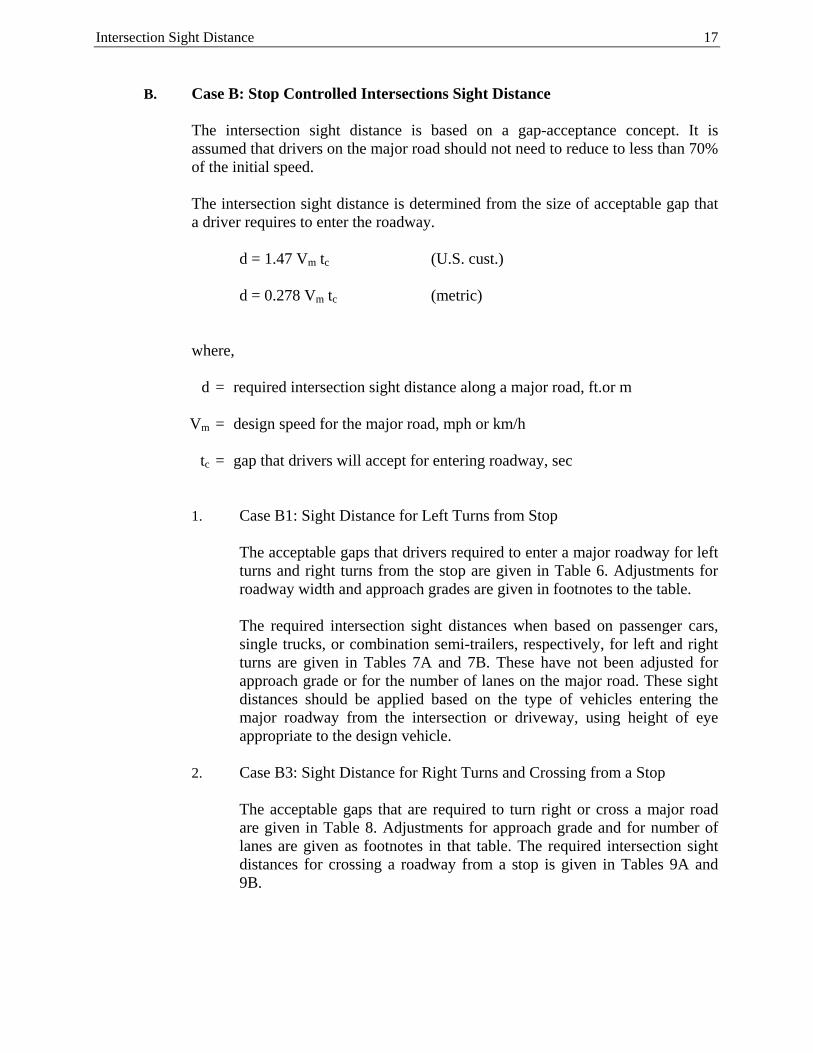
B. Case B: Stop Controlled Intersections Sight Distance
The intersection sight distance is based on a gap-acceptance concept. It is assumed that drivers on the major road should not need to reduce to less than 70% of the initial speed.
The intersection sight distance is determined from the size of acceptable gap that a driver requires to enter the roadway.
d = 1.47 Vm tc (U.S. cust.) d = 0.278 Vm tc (metric)
where,
d = required intersection sight distance along a major road, ft.or m
Vm = design speed for the major road, mph or km/h
tc = gap that drivers will accept for entering roadway, sec
1. Case B1: Sight Distance for Left Turns from Stop
The acceptable gaps that drivers required to enter a major roadway for left turns and right turns from the stop are given in Table 6. Adjustments for roadway width and approach grades are given in footnotes to the table.
The required intersection sight distances when based on passenger cars, single trucks, or combination semi-trailers, respectively, for left and right turns are given in Tables 7A and 7B. These have not been adjusted for approach grade or for the number of lanes on the major road. These sight distances should be applied based on the type of vehicles entering the major roadway from the intersection or driveway, using height of eye appropriate to the design vehicle.
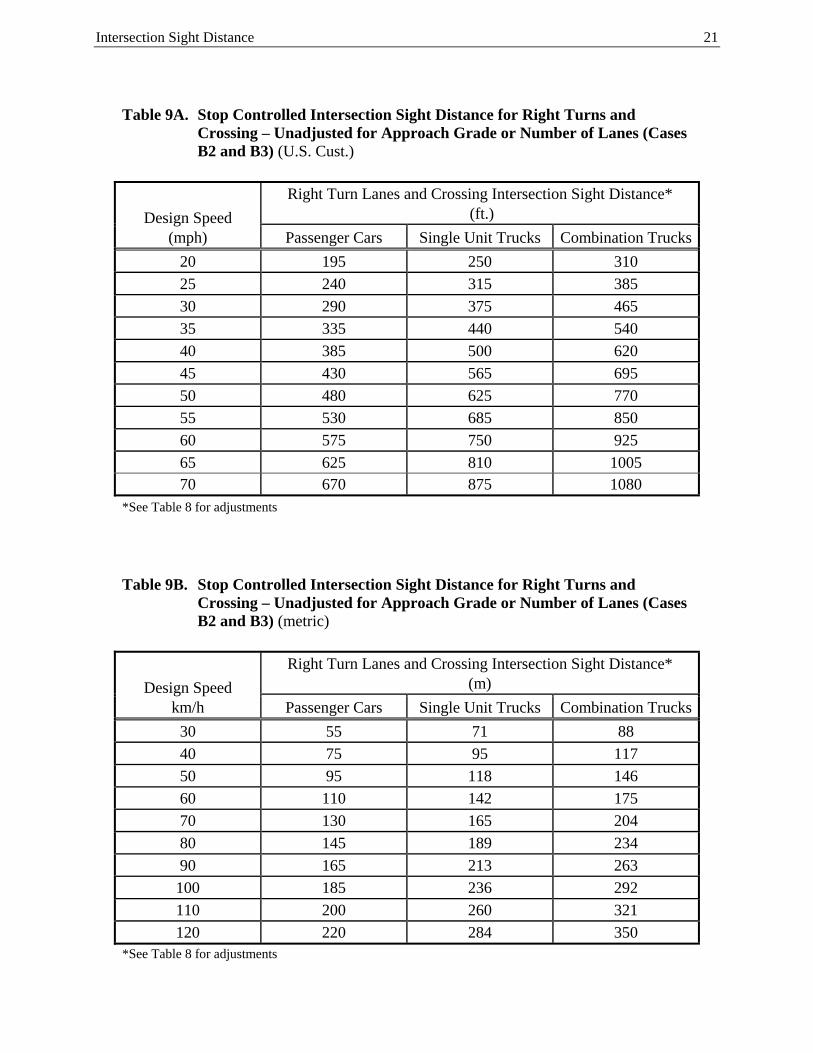
2. Case B3: Sight Distance for Right Turns and Crossing from a Stop
The acceptable gaps that are required to turn right or cross a major road are given in Table 8. Adjustments for approach grade and for number of lanes are given as footnotes in that table. The required intersection sight distances for crossing a roadway from a stop is given in Tables 9A and 9B.
Intersection Sight Distance 18
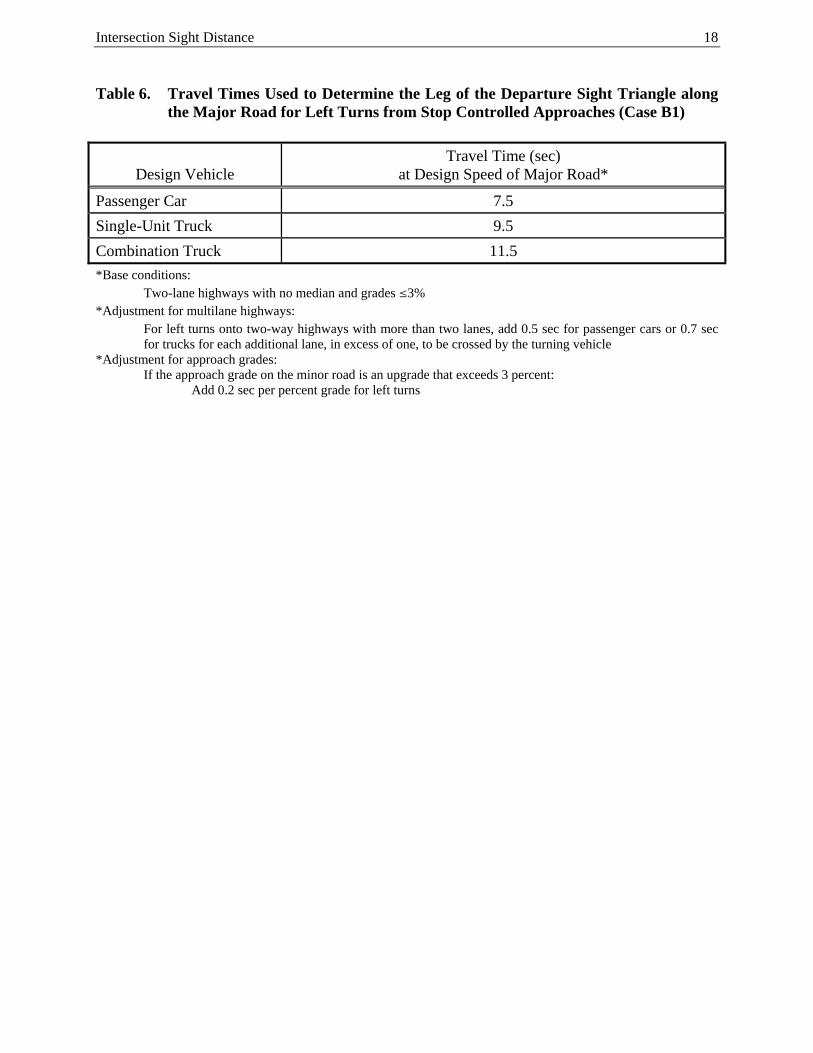
Table 6. Travel Times Used to Determine the Leg of the Departure Sight Triangle along
the Major Road for Left Turns from Stop Controlled Approaches (Case B1)
Design Vehicle Travel Time (sec)
at Design Speed of Major Road*
Passenger Car 7.5
Single-Unit Truck 9.5
Combination Truck 11.5
*Base conditions: Two-lane highways with no median and grades §3% *Adjustment for multilane highways:
For left turns onto two-way highways with more than two lanes, add 0.5 sec for passenger cars or 0.7 sec for trucks for each additional lane, in excess of one, to be crossed by the turning vehicle
*Adjustment for approach grades: If the approach grade on the minor road is an upgrade that exceeds 3 percent:
Add 0.2 sec per percent grade for left turns
Intersection Sight Distance 19
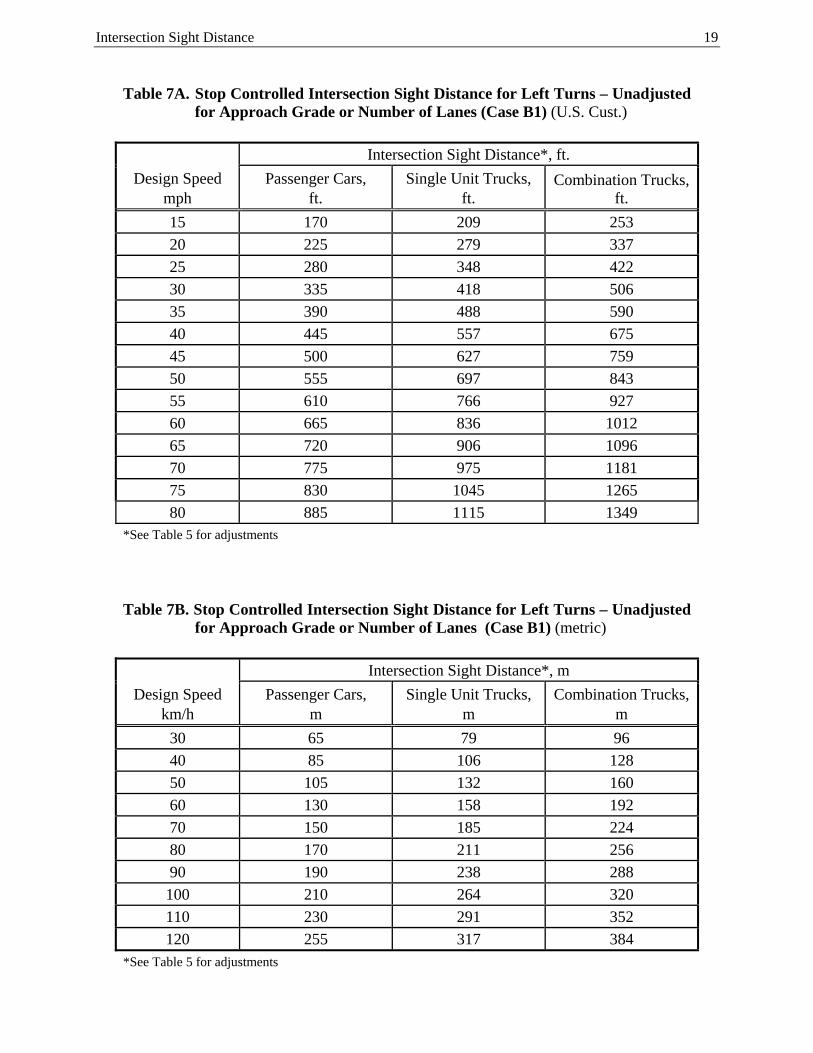
Table 7A. Stop Controlled Intersection Sight Distance for Left Turns – Unadjusted
for Approach Grade or Number of Lanes (Case B1) (U.S. Cust.)
Design Speed mph
Intersection Sight Distance*, ft.
Passenger Cars, ft.
Single Unit Trucks, ft.
Combination Trucks, ft.
15 170 209 253
20 225 279 337
25 280 348 422
30 335 418 506
35 390 488 590
40 445 557 675
45 500 627 759
50 555 697 843
55 610 766 927
60 665 836 1012
65 720 906 1096
70 775 975 1181
75 830 1045 1265
80 885 1115 1349 *See Table 5 for adjustments
Table 7B. Stop Controlled Intersection Sight Distance for Left Turns – Unadjusted for Approach Grade or Number of Lanes (Case B1) (metric)
Design Speed km/h
Intersection Sight Distance*, m
Passenger Cars, m
Single Unit Trucks, m
Combination Trucks, m
30 65 79 96
40 85 106 128
50 105 132 160
60 130 158 192
70 150 185 224
80 170 211 256
90 190 238 288
100 210 264 320
110 230 291 352
120 255 317 384 *See Table 5 for adjustments
Intersection Sight Distance 20
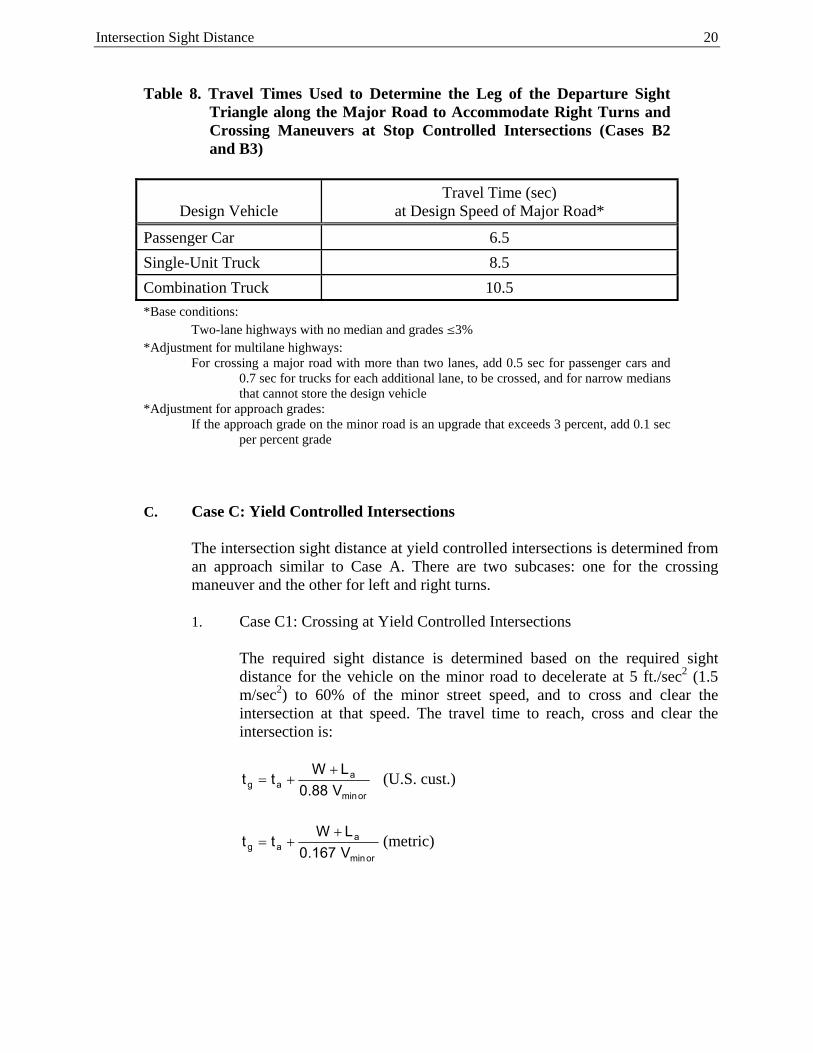
Table 8. Travel Times Used to Determine the Leg of the Departure Sight
Triangle along the Major Road to Accommodate Right Turns and Crossing Maneuvers at Stop Controlled Intersections (Cases B2 and B3)
Design Vehicle Travel Time (sec)
at Design Speed of Major Road*
Passenger Car 6.5
Single-Unit Truck 8.5
Combination Truck 10.5
*Base conditions: Two-lane highways with no median and grades §3% *Adjustment for multilane highways:
For crossing a major road with more than two lanes, add 0.5 sec for passenger cars and 0.7 sec for trucks for each additional lane, to be crossed, and for narrow medians that cannot store the design vehicle
*Adjustment for approach grades: If the approach grade on the minor road is an upgrade that exceeds 3 percent, add 0.1 sec
per percent grade
C. Case C: Yield Controlled Intersections
The intersection sight distance at yield controlled intersections is determined from an approach similar to Case A. There are two subcases: one for the crossing maneuver and the other for left and right turns.
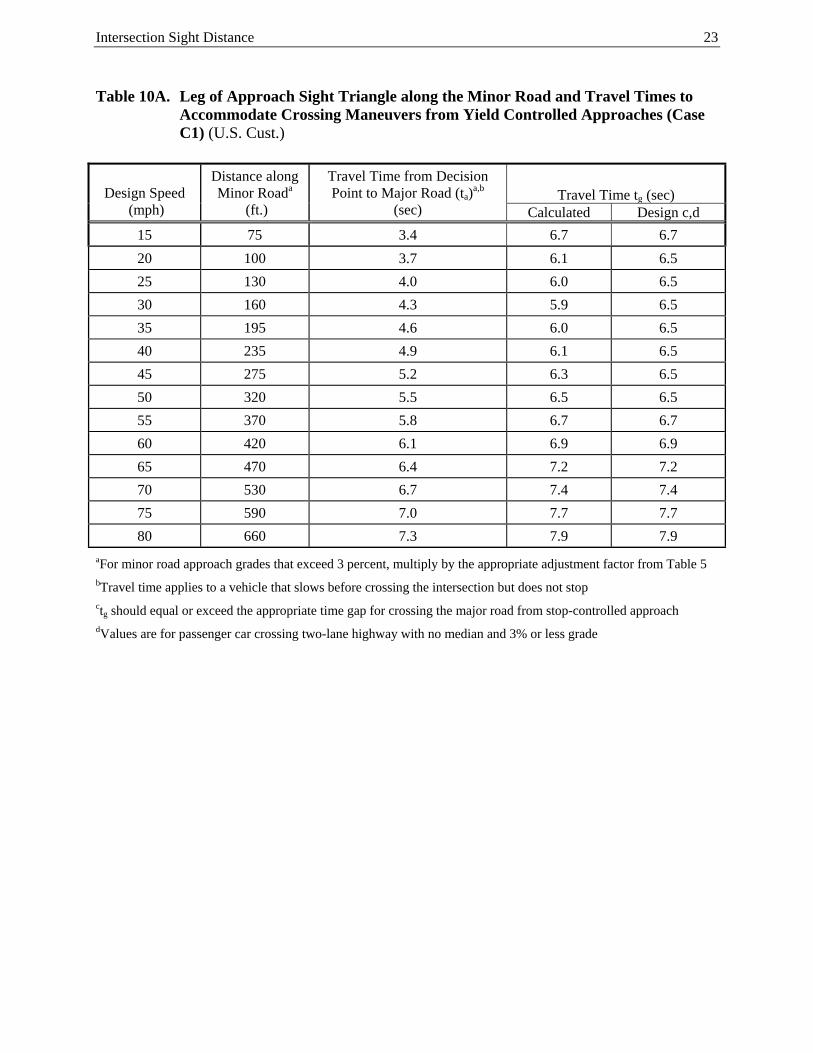
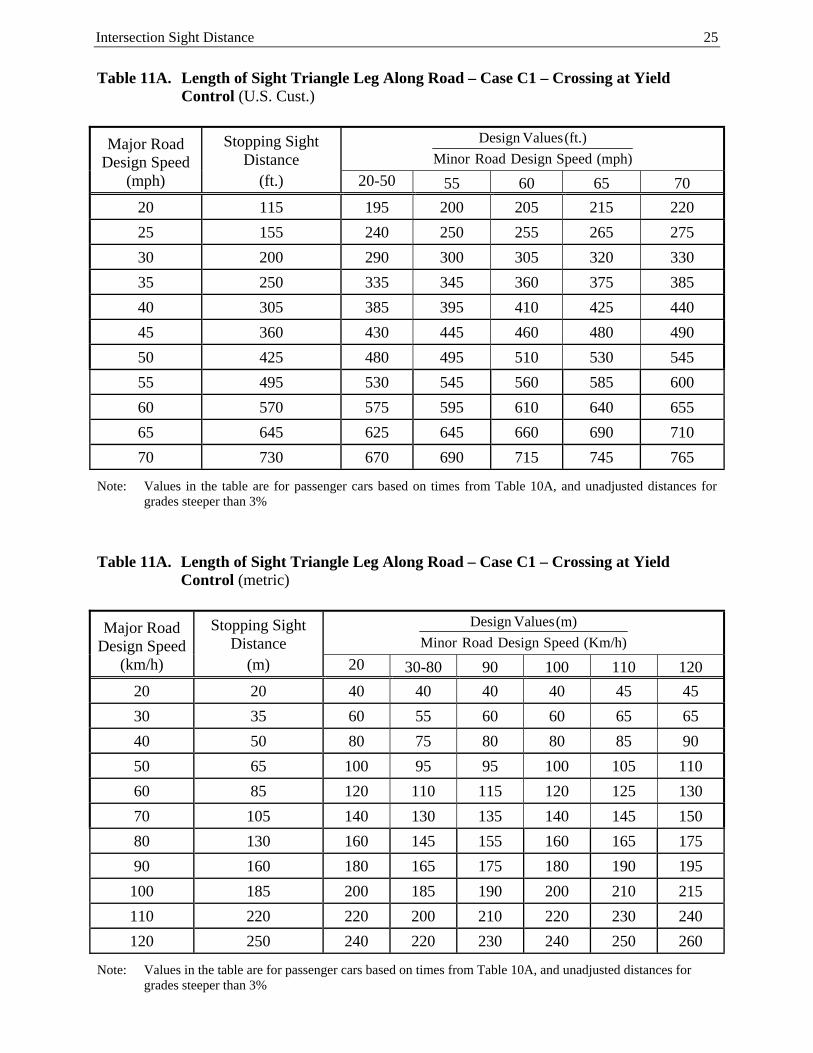
1. Case C1: Crossing at Yield Controlled Intersections
The required sight distance is determined based on the required sight distance for the vehicle on the minor road to decelerate at 5 ft./sec2 (1.5 m/sec2) to 60% of the minor street speed, and to cross and clear the intersection at that speed. The travel time to reach, cross and clear the intersection is:
ormin
aag V88.0
LWtt
(U.S. cust.)
ormin
aag V167.0
LWtt
(metric)
Intersection Sight Distance 21
Table 9A. Stop Controlled Intersection Sight Distance for Right Turns and Crossing – Unadjusted for Approach Grade or Number of Lanes (Cases B2 and B3) (U.S. Cust.)
Design Speed (mph)
Right Turn Lanes and Crossing Intersection Sight Distance* (ft.)
Passenger Cars Single Unit Trucks Combination Trucks
20 195 250 310
25 240 315 385
30 290 375 465
35 335 440 540
40 385 500 620
45 430 565 695
50 480 625 770
55 530 685 850
60 575 750 925
65 625 810 1005 70 670 875 1080
*See Table 8 for adjustments
Table 9B. Stop Controlled Intersection Sight Distance for Right Turns and Crossing – Unadjusted for Approach Grade or Number of Lanes (Cases B2 and B3) (metric)
Design Speed km/h
Right Turn Lanes and Crossing Intersection Sight Distance* (m)
Passenger Cars Single Unit Trucks Combination Trucks
30 55 71 88
40 75 95 117
50 95 118 146
60 110 142 175
70 130 165 204
80 145 189 234
90 165 213 263
100 185 236 292
110 200 260 321
120 220 284 350 *See Table 8 for adjustments
Intersection Sight Distance 22
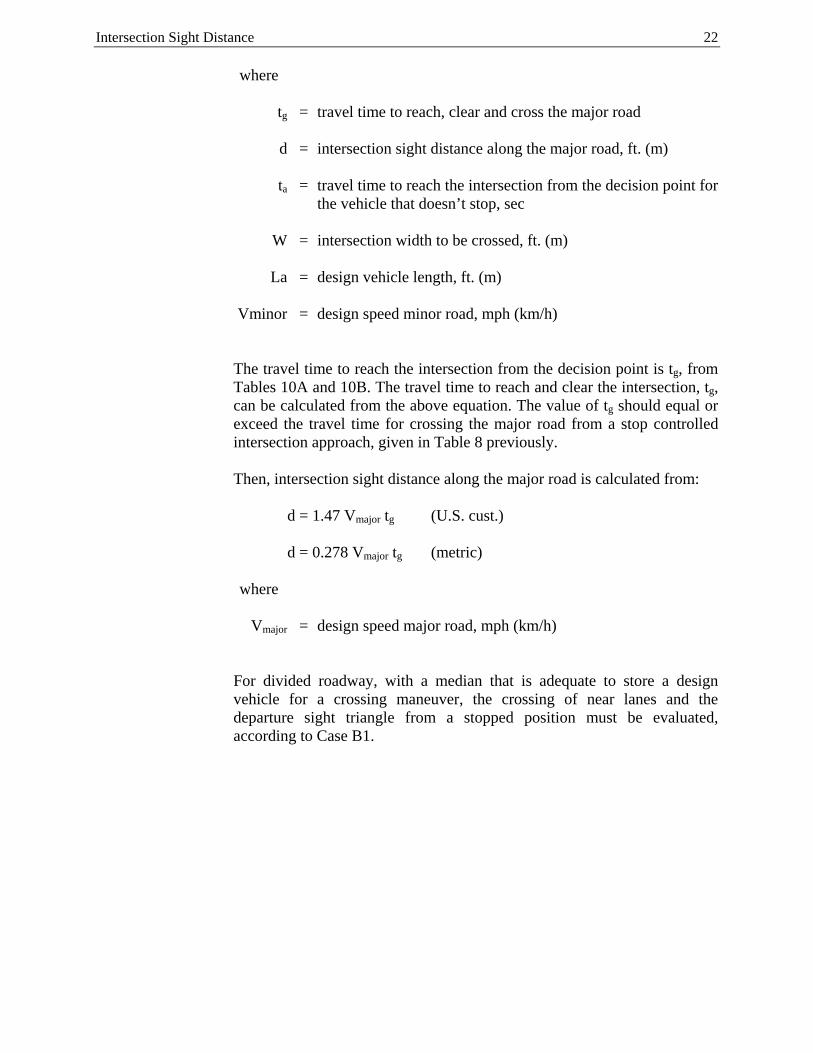
where
tg = travel time to reach, clear and cross the major road d = intersection sight distance along the major road, ft. (m) ta = travel time to reach the intersection from the decision point for
the vehicle that doesn’t stop, sec W = intersection width to be crossed, ft. (m) La = design vehicle length, ft. (m) Vminor = design speed minor road, mph (km/h)
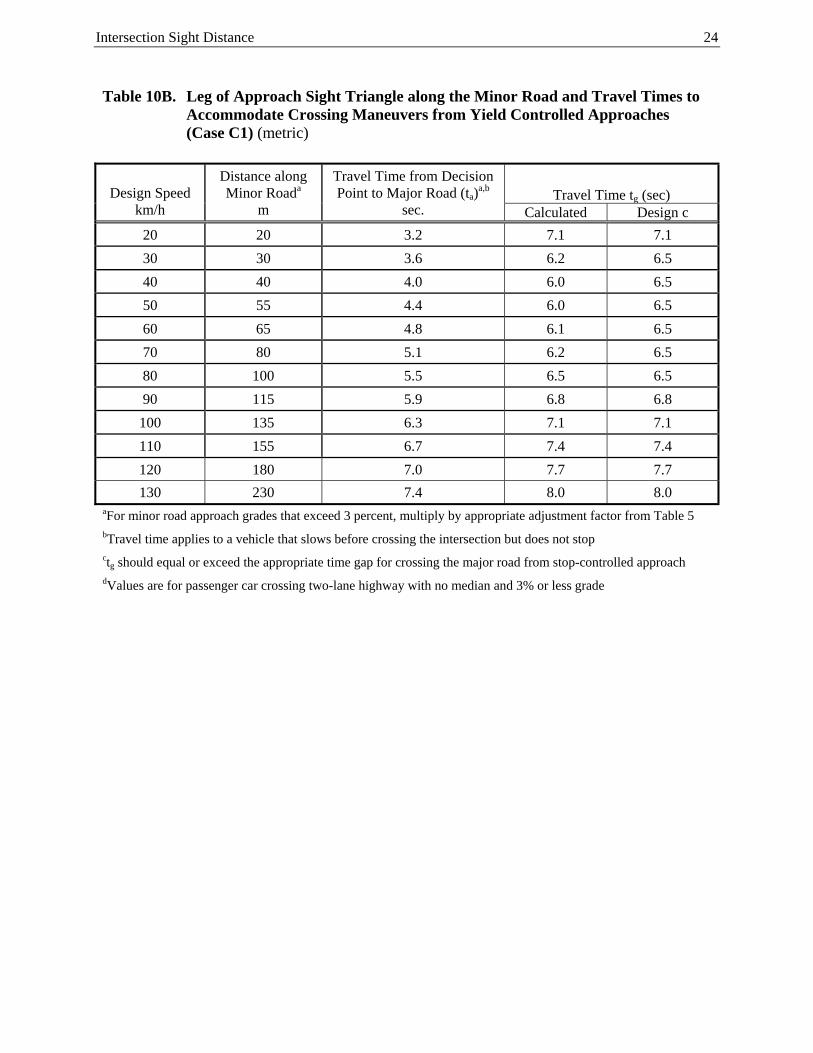
The travel time to reach the intersection from the decision point is tg, from Tables 10A and 10B. The travel time to reach and clear the intersection, tg, can be calculated from the above equation. The value of tg should equal or exceed the travel time for crossing the major road from a stop controlled intersection approach, given in Table 8 previously.
Then, intersection sight distance along the major road is calculated from:
d = 1.47 Vmajor tg (U.S. cust.)
d = 0.278 Vmajor tg (metric) where
Vmajor = design speed major road, mph (km/h)
For divided roadway, with a median that is adequate to store a design vehicle for a crossing maneuver, the crossing of near lanes and the departure sight triangle from a stopped position must be evaluated, according to Case B1.
Intersection Sight Distance 23
Table 10A. Leg of Approach Sight Triangle along the Minor Road and Travel Times to
Accommodate Crossing Maneuvers from Yield Controlled Approaches (Case C1) (U.S. Cust.)
Design Speed (mph)
Distance along Minor Roada
(ft.)
Travel Time from Decision Point to Major Road (ta)
a,b (sec)
Travel Time tg (sec) Calculated Design c,d
15 75 3.4 6.7 6.7
20 100 3.7 6.1 6.5
25 130 4.0 6.0 6.5
30 160 4.3 5.9 6.5
35 195 4.6 6.0 6.5
40 235 4.9 6.1 6.5
45 275 5.2 6.3 6.5
50 320 5.5 6.5 6.5
55 370 5.8 6.7 6.7
60 420 6.1 6.9 6.9
65 470 6.4 7.2 7.2
70 530 6.7 7.4 7.4
75 590 7.0 7.7 7.7
80 660 7.3 7.9 7.9
aFor minor road approach grades that exceed 3 percent, multiply by the appropriate adjustment factor from Table 5 bTravel time applies to a vehicle that slows before crossing the intersection but does not stop ctg should equal or exceed the appropriate time gap for crossing the major road from stop-controlled approach dValues are for passenger car crossing two-lane highway with no median and 3% or less grade
Intersection Sight Distance 24
Table 10B. Leg of Approach Sight Triangle along the Minor Road and Travel Times to
Accommodate Crossing Maneuvers from Yield Controlled Approaches (Case C1) (metric)
Design Speed km/h
Distance along Minor Roada
m
Travel Time from Decision Point to Major Road (ta)
a,b sec.
Travel Time tg (sec) Calculated Design c
20 20 3.2 7.1 7.1
30 30 3.6 6.2 6.5
40 40 4.0 6.0 6.5
50 55 4.4 6.0 6.5
60 65 4.8 6.1 6.5
70 80 5.1 6.2 6.5
80 100 5.5 6.5 6.5
90 115 5.9 6.8 6.8
100 135 6.3 7.1 7.1
110 155 6.7 7.4 7.4
120 180 7.0 7.7 7.7
130 230 7.4 8.0 8.0 aFor minor road approach grades that exceed 3 percent, multiply by appropriate adjustment factor from Table 5 bTravel time applies to a vehicle that slows before crossing the intersection but does not stop ctg should equal or exceed the appropriate time gap for crossing the major road from stop-controlled approach dValues are for passenger car crossing two-lane highway with no median and 3% or less grade
Intersection Sight Distance 25
Table 11A. Length of Sight Triangle Leg Along Road – Case C1 – Crossing at Yield Control (U.S. Cust.)
Major Road Design Speed
(mph)
Stopping Sight Distance
(ft.)
(mph)SpeedDesignRoadMinor
(ft.)ValuesDesign
20-50 55 60 65 70
20 115 195 200 205 215 220
25 155 240 250 255 265 275
30 200 290 300 305 320 330
35 250 335 345 360 375 385
40 305 385 395 410 425 440
45 360 430 445 460 480 490
50 425 480 495 510 530 545
55 495 530 545 560 585 600
60 570 575 595 610 640 655
65 645 625 645 660 690 710
70 730 670 690 715 745 765
Note: Values in the table are for passenger cars based on times from Table 10A, and unadjusted distances for grades steeper than 3%
Table 11A. Length of Sight Triangle Leg Along Road – Case C1 – Crossing at Yield
Control (metric)
Major Road Design Speed
(km/h)
Stopping Sight Distance
(m)
(Km/h)SpeedDesignRoadMinor
(m)ValuesDesign
20 30-80 90 100 110 120
20 20 40 40 40 40 45 45
30 35 60 55 60 60 65 65
40 50 80 75 80 80 85 90
50 65 100 95 95 100 105 110
60 85 120 110 115 120 125 130
70 105 140 130 135 140 145 150
80 130 160 145 155 160 165 175
90 160 180 165 175 180 190 195
100 185 200 185 190 200 210 215
110 220 220 200 210 220 230 240
120 250 240 220 230 240 250 260
Note: Values in the table are for passenger cars based on times from Table 10A, and unadjusted distances for grades steeper than 3%
Intersection Sight Distance 26
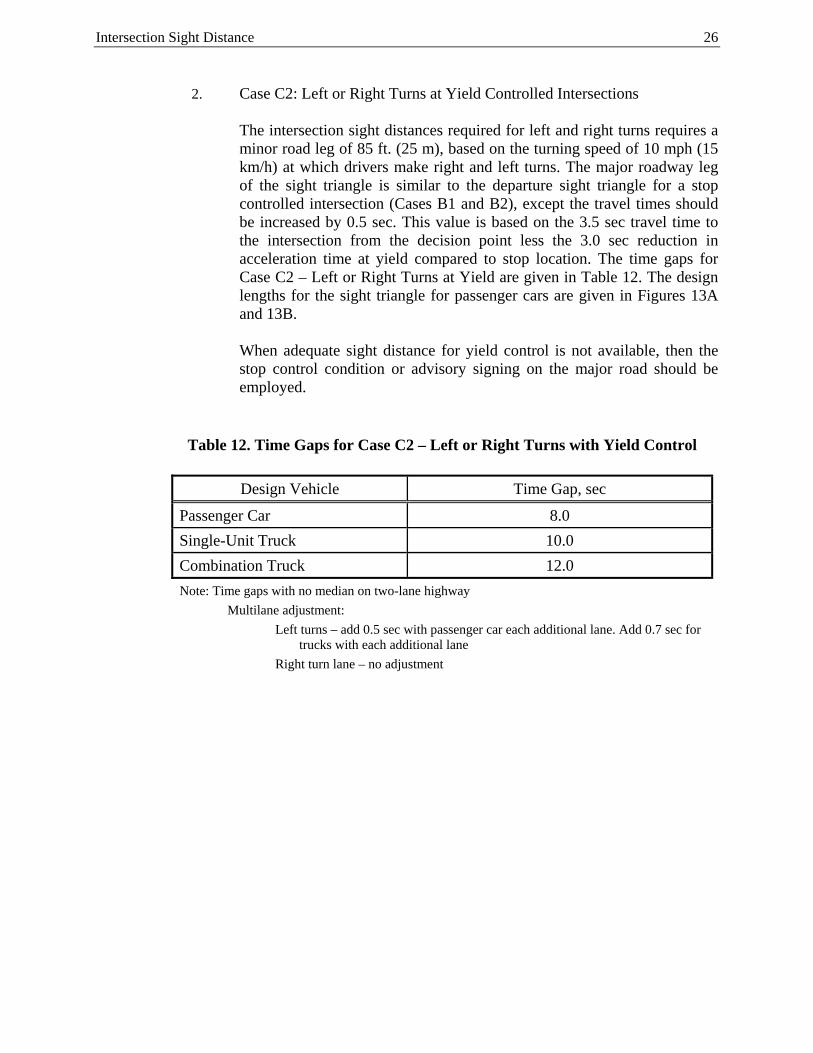
2. Case C2: Left or Right Turns at Yield Controlled Intersections
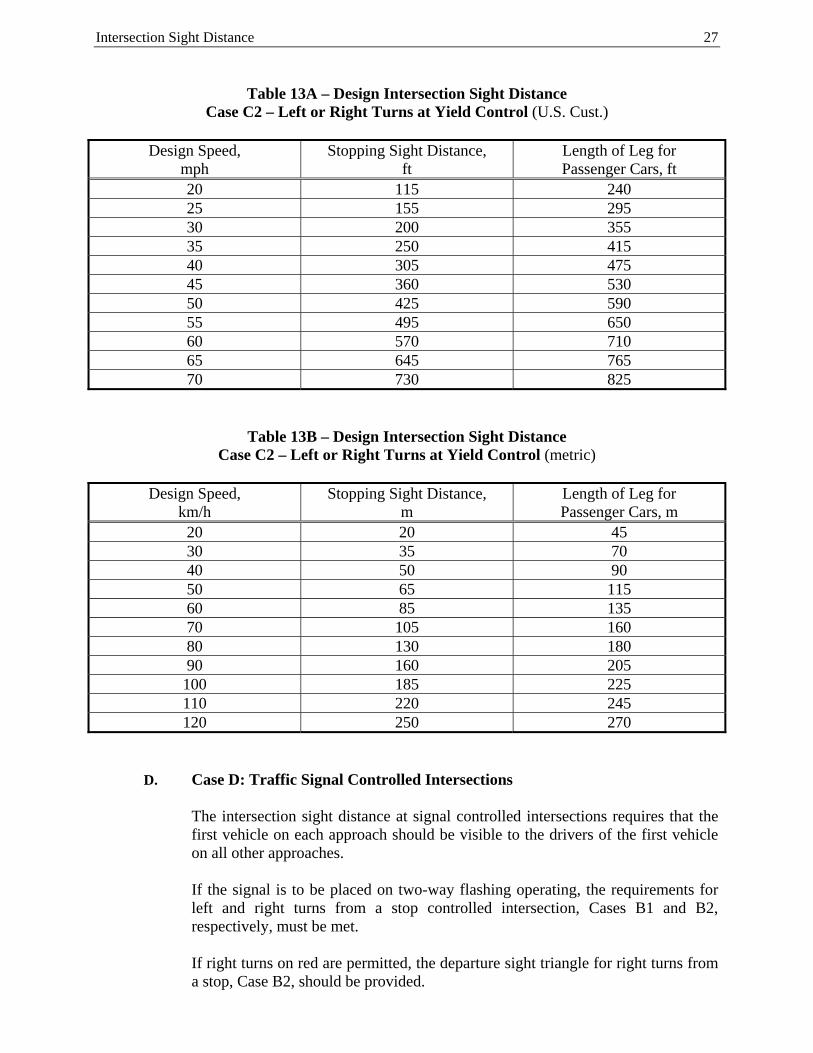
The intersection sight distances required for left and right turns requires a minor road leg of 85 ft. (25 m), based on the turning speed of 10 mph (15 km/h) at which drivers make right and left turns. The major roadway leg of the sight triangle is similar to the departure sight triangle for a stop controlled intersection (Cases B1 and B2), except the travel times should be increased by 0.5 sec. This value is based on the 3.5 sec travel time to the intersection from the decision point less the 3.0 sec reduction in acceleration time at yield compared to stop location. The time gaps for Case C2 – Left or Right Turns at Yield are given in Table 12. The design lengths for the sight triangle for passenger cars are given in Figures 13A and 13B.
When adequate sight distance for yield control is not available, then the stop control condition or advisory signing on the major road should be employed.
Table 12. Time Gaps for Case C2 – Left or Right Turns with Yield Control
Design Vehicle Time Gap, sec
Passenger Car 8.0
Single-Unit Truck 10.0
Combination Truck 12.0
Note: Time gaps with no median on two-lane highway
Multilane adjustment:
Left turns – add 0.5 sec with passenger car each additional lane. Add 0.7 sec for trucks with each additional lane
Right turn lane – no adjustment
Intersection Sight Distance 27
Table 13A – Design Intersection Sight Distance
Case C2 – Left or Right Turns at Yield Control (U.S. Cust.)
Design Speed, mph
Stopping Sight Distance, ft
Length of Leg for Passenger Cars, ft
20 115 240 25 155 295 30 200 355 35 250 415 40 305 475 45 360 530 50 425 590 55 495 650 60 570 710 65 645 765 70 730 825
Table 13B – Design Intersection Sight Distance Case C2 – Left or Right Turns at Yield Control (metric)
Design Speed,
km/h Stopping Sight Distance,
m Length of Leg for Passenger Cars, m
20 20 45 30 35 70 40 50 90 50 65 115 60 85 135 70 105 160 80 130 180 90 160 205 100 185 225 110 220 245 120 250 270
D. Case D: Traffic Signal Controlled Intersections
The intersection sight distance at signal controlled intersections requires that the first vehicle on each approach should be visible to the drivers of the first vehicle on all other approaches.
If the signal is to be placed on two-way flashing operating, the requirements for left and right turns from a stop controlled intersection, Cases B1 and B2, respectively, must be met.
If right turns on red are permitted, the departure sight triangle for right turns from a stop, Case B2, should be provided.
Intersection Sight Distance 28
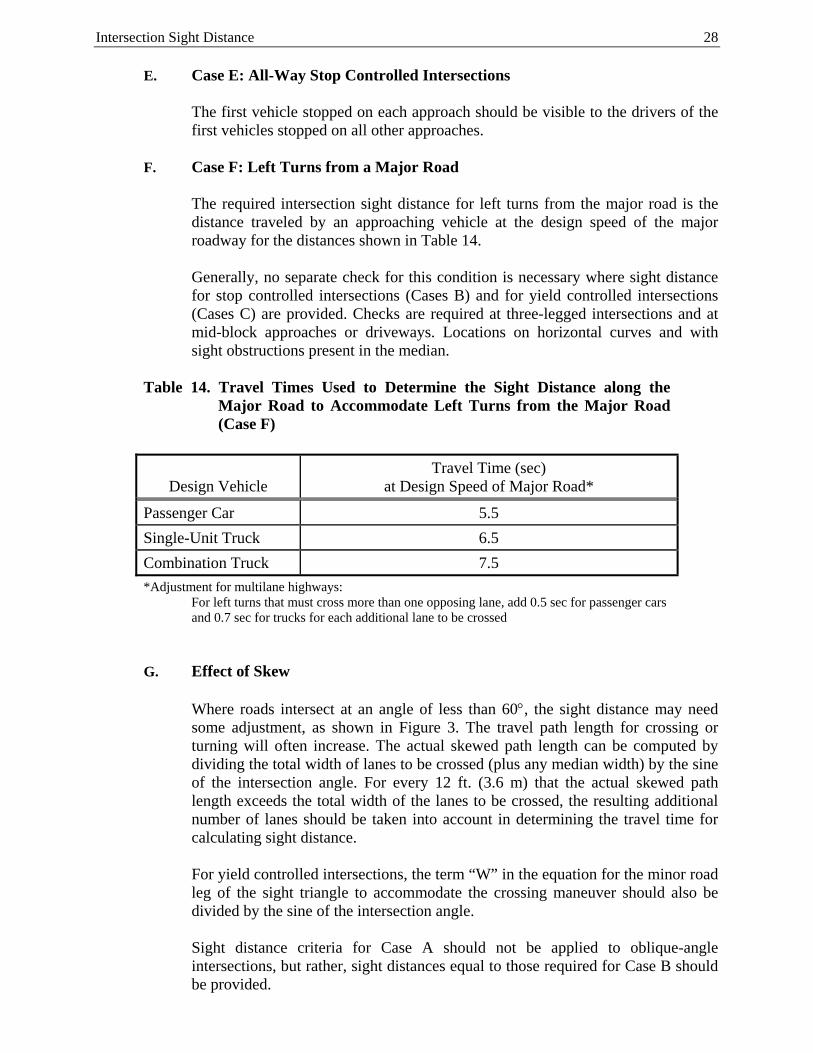
E. Case E: All-Way Stop Controlled Intersections
The first vehicle stopped on each approach should be visible to the drivers of the first vehicles stopped on all other approaches.
F. Case F: Left Turns from a Major Road
The required intersection sight distance for left turns from the major road is the distance traveled by an approaching vehicle at the design speed of the major roadway for the distances shown in Table 14.
Generally, no separate check for this condition is necessary where sight distance for stop controlled intersections (Cases B) and for yield controlled intersections (Cases C) are provided. Checks are required at three-legged intersections and at mid-block approaches or driveways. Locations on horizontal curves and with sight obstructions present in the median.
Table 14. Travel Times Used to Determine the Sight Distance along the
Major Road to Accommodate Left Turns from the Major Road (Case F)
Design Vehicle Travel Time (sec)
at Design Speed of Major Road*
Passenger Car 5.5
Single-Unit Truck 6.5
Combination Truck 7.5
*Adjustment for multilane highways: For left turns that must cross more than one opposing lane, add 0.5 sec for passenger cars and 0.7 sec for trucks for each additional lane to be crossed
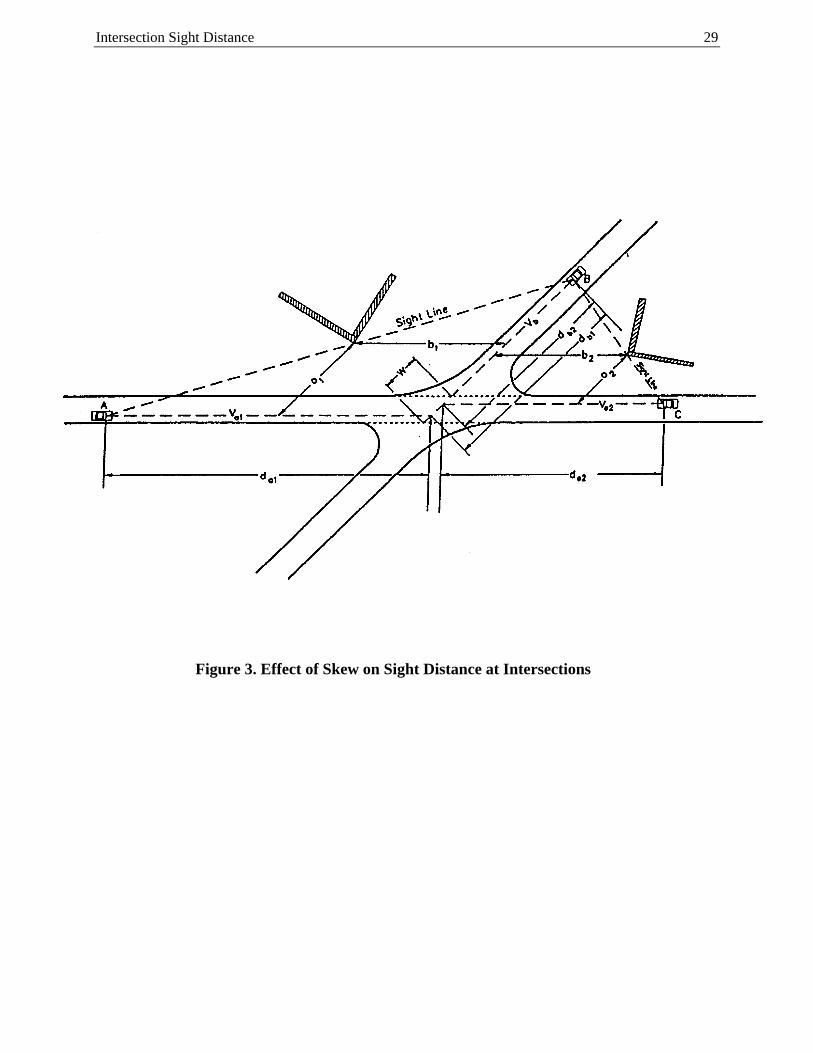
G. Effect of Skew
Where roads intersect at an angle of less than 60, the sight distance may need some adjustment, as shown in Figure 3. The travel path length for crossing or turning will often increase. The actual skewed path length can be computed by dividing the total width of lanes to be crossed (plus any median width) by the sine of the intersection angle. For every 12 ft. (3.6 m) that the actual skewed path length exceeds the total width of the lanes to be crossed, the resulting additional number of lanes should be taken into account in determining the travel time for calculating sight distance.
For yield controlled intersections, the term “W” in the equation for the minor road leg of the sight triangle to accommodate the crossing maneuver should also be divided by the sine of the intersection angle.
Sight distance criteria for Case A should not be applied to oblique-angle intersections, but rather, sight distances equal to those required for Case B should be provided.
Intersection Sight Distance 29
Figure 3. Effect of Skew on Sight Distance at Intersections
Intersection Sight Distance 30
X. REFERENCES
1. “A Policy on Geometric Design of Highway and Streets,” American Association of State
Highway and Transportation Officials, Washington, DC, 1990 (English Units Edition). 2. “A Policy on Geometric Design of Highway and Streets,” American Association of State
Highway and Transportation Officials, Washington, DC, 1994 (Metric Units Edition). 3. P.L. Olson, D.E. Cleveland, P.S. Fancher, L.P. Kostyniuk and L.W. Schneider,
“Parameters Affecting Stopping Sight Distance,” NCHRP Report 270, Transportation Research Board, National Research Council, Washington, DC, June 1984.
4. J.W. Hall and D.S. Turner, “Stopping Sight Distance: Can We See Where We Now
Stand?,” Transportation Research Record 1208, Transportation Research Board, National Reseach Council, 1989.
5. D.L. Woods, “Small Car Impacts on Highway Design,” ITE Journal, April 1983. 6. J.C. Glennon, “Highway Sight Distance Design Issues: An Overview,” Transportation
Research Record 1208, Transportation Research Board, National Research Council, Washington, DC, 1989.
7. P.B. Middleton, M.Y. Wong, J. Taylor, H. Thompson and J. Bennett, “Analysis of Truck
Safety on Crest Vertical Curves,” Report FHWA/RD-86/060, FHWA, USDOT, 1983. 8. Urban Behavioral Research Associates, “The Investigation of Driver Eye Height and
Field of Vision,” Report DOT-FH-11-9141, FHWA, USDOT, 1978. 9. “A Policy on Geometric Design for Streets and Highways,” AASHTO, Washington, DC,
2001. 10. “A Policy on Geometric Design for Streets and Highways,” AASHTO, Washington, DC,
2004. 11. Kay Fitzpatrick, J. Mason, Jr. and D. Harwood, “Comparison of Sight Distance
Procedures for Turning Vehicles from a Stop-Controlled Approach,” 1991 Annual TRB Meeting, Washington D.C.
12. Highway Design Manual, CALTRANS, Sacramento, CA. 13. Highway Capacity Manual, TRB, Washington, DC, 2010. 14. C. Junward and B. Pushkarev. Man-Made Criteria: Chaos or Comfort? Yale Univ. Press,
1963. 15. “A Policy on Geometric Design for Streets and Highways,” AASHTO, Washington, DC,
2011.