School Bus Acceleration Characteristics - Microsoft€¦ · grade crossings used by school buses....
90
SCHOOL BUS ACCELERATION CHARACTERISTICS MBTC FR 1054-2 J. L GATTIS, SCOTT H. NELSON, and J. D.TUBBS DISCLAIMER II I IIII II lllllll 111111111111111 PB99-111890 The contents of this report reflect the views of the authors, who are responsible for the facts and accuracy of the information presented herein. This document is disseminated under the sponsorship of the Department of Transportation, University Centers Program, in the interest of information exchange. The U. S. government assumes no liability for the contents or use thereof . . U.S. D~::~~~~~~i!!~ercetn:§ National Technical lnfonnation Service Springfield, Virginia 22161
Transcript of School Bus Acceleration Characteristics - Microsoft€¦ · grade crossings used by school buses....
SCHOOL BUS ACCELERATION CHARACTERISTICS
MBTC FR 1054-2
J. L GATTIS, SCOTT H. NELSON, and J. D.TUBBS
DISCLAIMER
II I IIII II lllllll 111111111111111 PB99-111890
The contents of this report reflect the views of the authors, who are responsible for the facts and accuracy of the information presented herein. This document is
disseminated under the sponsorship of the Department of Transportation, University Centers Program, in the interest of information exchange. The U. S.
government assumes no liability for the contents or use thereof .
. U.S. D~::~~~~~~i!!~ercetn:§ National Technical lnfonnation Service
Springfield, Virginia 22161

Technical Report Documentation Page
1. Report No. 2. Government Accession No. FHWA/AR-98-009
4. Title and Subtitle
SCHOOL BUS ACCELERATION CHARACTERISTICS
7. Authors
J. L. GATTIS, Ph.D., P.E., SCOTT H. NELSON, and J. D. TUBBS, Ph.D.
9. Performing Organization Name and Address
MACK-BLACKWELL TRANSPORTATION CENTER UNIVERSITY OF ARKANSAS 4190 BELL ENGINEERING CENTER FAYETTEVILLE, AR 72701
12. Sponsoring Agency Name and Address
ARKANSAS STATE HIGHWAY & TRANSPORTATION DEPARTMENT P. 0. BOX 2261 LITTLE ROCK, AR 72203
15. Supplementary Notes
3. Recipient's Catalog No.
5. Report Date SEPTEMBER 1998
6. Performing Organization Code
0402-12003-21-1054
8. Performing Organization Report No.
MBTC FR 1054-2
10. Work Unit No. (TRAIS)
11 . Contract or Grant No.
DTRS92-G-0013
1 3. Type of Report and Period Covered
FINAL REPORT NOV. 1995 -- DEC. 1998
14. Sponsoring Agency Code
SUPPORTED BY A GRANT FROM THE U.S. DEPARTMENT OF TRANSPORTATION CENTERS PROGRAM
1 6. Abstract
Research was conducted to collect speed, time, and distance data for Type C and Type D ("full size") school buses accelerating from a stopped position. Most of the tests were conducted on level terrain. By combining the knowledge of how quickly a school bus can accelerate with assumed speeds of oncoming throughstreet vehicles, the needed intersection sight distance can be calculated. Another application of the findings is analyzing departure sight distance at railroad grade crossings used by school buses.
17. Key Words
SCHOOL BUS, INTERSECTION SIGHT DISTANCE, RAILROAD GRADE CROSSING
19. Security Classif. (of this report)
UNCLASSIFIED
18. Distribution Statement
NO RESTRICTIONS. THIS DOCUMENT IS AVAILABLE FROM THE NATIONAL TECHNICAL INFORMATION SERVICE, SPRINGFIELD, VA. 22161
20. Security Class. (of this page)
UNCLASSIFIED 21. No. of Pages 22. Price
N/A
Form DOT F 1700.7 (8-72) Reproduction of completed page authorized
REPORT DOCUMENTATION PAGE Form Approved
0MB No. 0704-0188
Public reoort1ng burden for thrs cotlect1on of ;nformat1on rs est1mat£"d to average t hour per resp0nse, including the time tor rev,ewmg 1nstruct1ons, searching existing data sources,
zi,1~:1~~ ir~n~~~~~:~~~~~~~il~~ Snu~~~;Oannsdt~~';'~~~l1~i ~~~ ~euv:~:~~iot:';a~~lll~;i; ~!~~~o~;;:;~~~er~~~~.cg7::~~rt~t~eri:1~76r~~\~~r~e;;~::~~t~nO~ ~~~O~~~;:~~~J:,!~~ Davis Highway. Suite 1 204. Arlington, VA 2 2202-4302. and to the Office of Management and Budget. Paperwork Reduction Pro1ect (0704-0, 88). Washington, DC 20503.
1. AGENCY USE ONLY (Leave blank) 12. REPORT DATE 13- REPORT TYPE AND DATES COVERED SEPTEMBER 1998 FINAL REPORT NOV.1995 - DEC.1998
4. TITLE AND SUBTITLE 5. FUNDING NUMBERS
SCHOOL BUS ACCELERATION CHARACTERISTICS
6. AUTHOR(S)
J .L.GATTIS, PH.D., P.E., SCOTT NELSON and J.D.TUBBS, PH.D.
7. PERFORMING ORGANIZATION NAME(S) AND ADDRESS(ES) 8. PERFORMING ORGANIZATION
MACK BLACKWELL TRANSPORTATION CENTER REPORT NUMBER
UNIVERSITY OF ARKANSAS MBTC FR 1054-2
4190 BELL ENGINEERING CENTER FAYETTEVILLE, AR 72701
9. SPONSORING/MONITORING AGENCY NAME(S) AND ADDRESS(ES) 10. SPONSORING/MONITORING
ARKANSAS STATE HIGHWAY & TRANSPORTATION DEPARTMENT AGENCY REPORT NUMBER
P.O. BOX 2261 FHWA/AR-98-009 LITTLE ROCK, AR 72203
11. SUPPLEMENTARY NOTES
SUPPORTED BY A GRANT FROM THE U.S. DEPARTMENT OF TRANSPORTATION CENTERS PROGRAM
12a. DISTRIBUTION/ AVAILABILITY STATEMENT 12b. DISTRIBUTION CODE
NATIONAL TECHNICAL INFORMATION SERVICE N/A 5285 PORT ROYAL ROAD SPRINGDALE, VA 22161
13. ABSTRACT (Maximum 200 words)
Research was conducted to collect speed, time, and distance data for Type C and D ("full size") school buses accelerating from a stopped position. Most of the tests were conducted on level terrain. By combining the knowledge of how quickly a school bus can accelerate with assumed speeds of oncoming through-street vehicles, the needed intersection sight distance can be calculated. Another application of the findings is analyzing departure sight distance at railroad grade crossings used by school buses.
14. SUBJECT TERMS 15. NUMBER OF PAGES
SCHOOL BUS, INTERSECTION SIGHT DISTANCE, CROSSING
17. SECURITY CLASSIFICATION 18. SECURITY CLASSIFICATION OF REPORT OF THIS PAGE
UNCLASSIFIED UNCLASSIFIED
NSN 7540-01-280-5500
RAILROAD GRADE
19. SECURITY CLASSIFICATION OF ABSTRACT UNCLASSIFIED
16. PRICE CODE
N/A 20. LIMITATION OF ABSTRACT
N/A
Standard Form 298 (Rev. 2-89) Prescribed by ANSI Std Z39-18 198-102

Sch Bus Accel. - Sep. 1998
ACKNOWLEDGMENTS
The authors wish to thank the following staff and students who assisted with this project.
Cynthia Douthit
Micheal Howard
Mark Kuss
Sonny Low
MBTC Mack-Blackwell National Rural Transportation Study Center
iii
The support of the Arkansas State Highway and Transportation Department and the Mack-Blackwell National
Rural Transportation Study Center at the University of Arkansas made this research possible. The authors
wish to thank the Missouri Highway and Transportation Department, the Alma Public School District, the
Elkins Public School District, the Greenwood Public School District, the Huntsville Public School District, the
McDonald County Public School District, the Waldron Public School District, and the Washburn Public
School District.
PROTECTED UNDER INTERNATIONAL COPYRIGHT ALL RIGHTS RESERVED. NATIONAL TECHNICAL INFORMATION SERVICE U.S. DEPARTMENT OF COMMERCE

iv Sch Bus Accel. - Sep. 1998

Sch Bus Accel. - Sep. 1998 V
SCHOOL BUS ACCELERATION CHARACTERISTICS
TABLE OF CONTENTS
CHAPTER page
1 INTRODUCTION . . . . . . . . . . . . . . . . . . . . . . . . . . . . . . . . . . . . . . . . . . . . . . . . . . . . . . . . . 1
2 BACKGROUND . . . . . . . . . . . . . . . . . . . . . . . . . . . . . . . . . . . . . . . . . . . . . . . . . . . . . . . . . . 3
Acceleration Characteristics. . . . . . . . . . . . . . . . . . . . . . . . . . . . . . . . . . . . . . . . . . . . . . . . . . . 3
Intersection Sight Distance .................................................... 5
School Bus Survey . . . . . . . . . . . . . . . . . . . . . . . . . . . . . . . . . . . . . . . . . . . . . . . . . . . . . . . . . 8
3 RESEARCH PROCEDURES . . . . . . . . . . . . . . . . . . . . . . . . . . . . . . . . . . . . . . . . . . . . . . . . . 11
Equipment Selection . . . . . . . . . . . . . . . . . . . . . . . . . . . . . . . . . . . . . . . . . . . . . . . . . . . . . . . . 11
Site Selection . . . . . . . . . . . . . . . . . . . . . . . . . . . . . . . . . . . . . . . . . . . . . . . . . . . . . . . . . . . . . 12
Field Data Collection . . . . . . . . . . . . . . . . . . . . . . . . . . . . . . . . . . . . . . . . . . . . . . . . . . . . . . . . 14
Downloading Data . . . . . . . . . . . . . . . . . . . . . . . . . . . . . . . . . . . . . . . . . . . . . . . . . . . . . . . . . . 21
Adding Weight, Power, Engine Age, and Transmission .............................. 22
4 DATA ANALYSIS AND RES UL TS ........................................... 23
Data Inspection and Adjustment . . . . . . . . . . . . . . . . . . . . . . . . . . . . . . . . . . . . . . . . . . . . . . . 23
Data Analysis . . . . . . . . . . . . . . . . . . . . . . . . . . . . . . . . . . . . . . . . . . . . . . . . . . . . . . . . . . . . . 24
Results of Analysis . . . . . . . . . . . . . . . . . . . . . . . . . . . . . . . . . . . . . . . . . . . . . . . . . . . . . . . . . 25
Applying These Findings ..................................................... 49
5 CONCLUSION AND RECOMMENDATIONS .................................. 51
REFERENCES .................................................................. 53
APPENDIX
A Survey Sent to States . . . . . . . . . . . . . . . . . . . . . . . . . . . . . . . . . . . . . . . . . . . . . . . . . . . . . . . . 55
B School Bus Information Provided by Each School District ........................... 56
C Raw Data Collected at Each Testing Site ........................................ 58
D Most Complete Data Including the Information Provided by School Districts . . . . . . . . . . . . . . 71
E Washburn Straight-line Acceleration Data ....................................... 79
F McDonald County Upgrade Acceleration Data . . . . . . . . . . . . . . . . . . . . . . . . . . . . . . . . . . . . 81

vi
Number
1
2 3
4
5
6
7
8
9
10
11
12
13
14
15
16
17
18
19
20
21
22 23
24
1
2
3
4
5
6
7
8
9
10
11
Sch Bus Accel. - Sep. 1998
Title page
LIST OF FIGURES Time/Distance Relationship for PC, SU, and WB-15 ........................... 7
Field Data Collection Setup . . . . . . . . . . . . . . . . . . . . . . . . . . . . . . . . . . . . . . . . . . . . . 17
School Bus Passing Over Sensors . . . . . . . . . . . . . . . . . . . . . . . . . . . . . . . . . . . . . . . . 17
Profile of McDonald County Upgrade Testing Area ........................... 20
Profile of Alma Primary School Testing Area ............................... 20
Scatter Plot of Turning Bus Speed and Distance ............................. 27
Scatter Plot of Turning Bus Speed and Distance at 18 m ...................... 28
Scatter Plot of Turning Bus Speed and Distance at 100 m ...................... 29
Scatter Plot of Turning Bus Speed and Distance at 200 m ...................... 30
Scatter Plot of Turning Bus Speed and Distance at 300 m ...................... 31
Scatter Plot of Turning Bus Speed and Distance at 400 m ...................... 32
Scatter Plot of Turning Bus Speed and Distance at 500 m ...................... 33
Scatter Plot of Washburn Straight-line Speed and Distance ..................... 34
Scatter Plot of Washburn Straight-line Speed and Distance at 18 m ............... 35
Scatter Plot of Washburn Straight-line Speed and Distance at 100 m .............. 36
Diagram of Turning Arc Excess ......................................... 37
Mean Speeds for School Buses Stopping and Running the Stop Sign ............. 39
School Bus Speeds with PC and Truck Acceleration Curves .................... 40
School Bus Acceleration Time Against Distance . . . . . . . . . . . . . . . . . . . . . . . . . . . . . 41
Mean School Bus Speeds for Top 1/3 and Bottom 1/3 Weight/PowerRatios ........ 43
Mean School Bus Speeds for Standard and Automatic Transmissions ............. 44
Mean School Bus Speeds for Oldest 1/3 and Newest 1/3 Engines ................. 45
Final 12.5 Percentile School Bus Cumulative Acceleration Times ................ 47
Cumulative Acceleration Times for PC, SU, WB-15, and 12.5 Percentile School Bus . 24
LIST OF TABLES
Final Climbing Speeds of 12.5 Percentile Vehicles ............................. 4
Final Climbing Speeds of 50th Percentile Vehicles . . . . . . . . . . . . . . . . . . . . . . . . . . . . 4
Speed/rime/Distance Info From N. Carolina Survey . . . . . . . . . . . . . . . . . . . . . . . . . . 9
School Districts Contacted . . . . . . . . . . . . . . . . . . . . . . . . . . . . . . . . . . . . . . . . . . . . 13
Average Acceleration Times and Speeds . . . . . . . . . . . . . . . . . . . . . . . . . . . . . . . . . . 26
Analysis of Mean Speeds for Buses That Ran the Stop Sign and Those That Stopped 39
Analysis of Mean Speeds for Top 1/3 and Bottom 1/3 Weight/Power Ratios . . . . . . . 43
Analysis of Mean Speeds for Standard and Automatic Transmissions . . . . . . . . . . . . 44
Analysis of Mean Speeds for the Oldest and Newest 1/3 Engine Ages . . . . . . . . . . . . 45
Analysis of 12.5 Percentile School Bus Speeds . . . . . . . . . . . . . . . . . . . . . . . . . . . . . 46
School Bus 12.5 Percentile Speeds and Acceleration Times . . . . . . . . . . . . . . . . . . . . 47

Sch Bus Accel. - Sep. 1998
SCHOOL BUS ACCELERATION CHARACTERISTICS
by J. L. Gattis, Ph.D., P.E., Scott H. Nelson, and J. D. Tubbs, Ph.D.
CHAPTER 1
INTRODUCTION
1
In order to properly design streets and highways, roadway design engineers need to know the dimensions
and operating characteristics of vehicles likely to operate on the road. One characteristic that designers need
to know is the acceleration performance of vehicles. By knowing the time required for a vehicle to accelerate,
one can calculate the amount of sight distance needed at an intersection.
The American Association of State Highway and Transportation Officials (AASHTO) publishes the
Green Book as a guide for roadway design engineers. The 1994 Green Book (AASHTO, 1994) included fifteen
"design vehicles". Design vehicles are composite vehicles that represent the longest, widest, slowest, etc.
dimensions for each class or type of vehicle. The current Green Book does not contain school bus dimensions,
turning radii, or acceleration characteristics.
By knowing how quickly a school bus can accelerate from a stopped position, intersections and railroad
grade crossings can be designed more safely. The objectives of this research project included investigating
performance characteristics of"full-size" Type C and Type D school buses as they entered through roadways
from side streets, or accelerated after stopping at a railroad grade crossing. Several school buses were tested
to collect data which enabled researchers to construct school bus speed/time/distance curves.
2 Sch Bus Accel. - Sep. 1998
this page left blank
Sch Bus Accel. - Sep. 1998
CHAPTER2
BACKGROUND
3
A literature review was conducted to find information related to school bus acceleration characteristics,
intersection sight distance requirements, and what kind of equipment and procedures had been used
previously to determine this information for other types of vehicles. A survey was sent to state departments
of transportation to determine if they had any related information.
ACCELERATION CHARACTERISTICS
A literature review conducted to identify acceleration testing methods found both level terrain and at-grade
testing procedures for passenger cars and trucks. No information was found specifically related to school
buses.
Level Terrain Testing
To investigate interrelationships between vehicles' acceleration characteristics and highway design policies,
one study employed principles of physics to generate or predict vehicle performance (Fancher). The
acceleration performance of pneumatic-tired vehicles depended on the difference between the power
available from the engine and the power required to overcome resistance to motion.
There was a general trend toward lower weight-to-horsepower ratios from 1949 to 1977. This in
tum lead to increased acceleration capabilities. The 1977 "Truck Inventory and Use Survey" (U.S.
Census, 1977) determined that a 300 lb/hp design vehicle was "substantially below average" rather than
"typical". Arguments were made, though, that a 300 lb/hp vehicle represented a reasonable highway and
climbing lane design vehicle since this value was within one standard deviation of the mean weight-to
horsepower ratio of 248 lb/hp.
At-grade Testing
Tests have been conducted to find the deceleration rates of vehicles such as trucks traveling up grades
(Gillespie). Experimental measurements were taken at twenty sites across the United States. These
measurements were compared to the then-current design guidelines in the 1984 AASHTO Green Book
(AASHTO, 1984). Methods were developed to model the hill climbing performance at the 12.5 and 50th
percentile population level using empirically determined weight-to-horsepower (wt/hp) ratios. A truck's
wt/hp ratio was considered to be the most important characteristic affecting hill climbing performance. In
this experiment, each truck was tracked throughout its climb up the grade. No attempt was made to
observe the trucks' speeds as they entered the grade because it was desired that the trucks be under a full
throttle during all measurements. Thus, the first measurements were obtained at a distance of 152 to 305 m

4 Sch Bus Accel. - Sep. 1998
(500 to 1000 ft) up the grade. The final climbing speeds for the 12.5 and 50th percentile trucks are
summarized in Tables 1 and 2. Note the AASHTO final climbing speeds were in the range of the 12.5
percentile speeds and generally lower than the 50th percentile speeds.
TABLE 1 Final Climbing Speeds (km/h) of 12.5 Percentile Vehicles
Grade Straight Trucks with Tractor- 65-ft
(%) Trucks Trailers Trailers Doubles AASHTO
1.5 76.4 68.1 76.4 64.2
2.0 64.9 54.2 64.9 54.4
3.0 49.7 38.6 49.7 41. 7 42.6
4.0 40.2 29.9 40.2 33.8 35.4
5.0 33.8 24.5 33.8 28.5 29.6
6.0 29.1 20.6 29.1 24.5 24.9
7.0 25.6 17.9 25.6 21. 6 22.2
8.0 22.9 15.8 22.9 19.3 19.6
9.0 12.8 14.2 20.6 17.4 17.1
TABLE 2 Final Climbing Speeds (km/h) of 50th Percentile Vehicles
Grade Straight Trucks with Tractor- 65-ft
(%) Trucks Trailers Trailers Doubles AASHTO
1.5 81. 9 77.2 81.9 71.0
2.0 73.5 67.3 73.8 62.4
3.0 60.8 53.6 60.8 50.4 42.6
4.0 52.0 44.4 52.0 42.2 35.4
5.0 45.4 38.0 45.4 36.2 29.6
6.0 40.2 33.2 40.2 31. 7 24.9
7.0 36.2 29.5 36.2 28.3 22.2
8.0 32.8 26. 4 32.8 25.4 19.6
9.0 30.1 24.0 30.1 23.2 17.1
A 1979 study in California (Ching and Rooney) recorded speed information using calibrated radar
guns; radar was not being used for law enforcement purposes along rural freeways and e,xpressways in
California at that time. Most of the speed readings were made from unmarked vehicles. The vehicles were
usually parked eight to twelve feet from the edge of the outer lane. The radar equipment was set up in the
van so that it would not be easily visible to passing drivers. Some of the radar information, though, was

Sch Bus Accel. - Sep. 1998
obtained without a vehicle present. The speed information was obtained during weekday free-flow traffic
conditions, when the weather was pleasant and wind velocities were seven knots or less. Speeds were
measured without regard to whether the trucks were empty, partially loaded, or loaded. Speeds were not
recorded for trucks which were following other trucks in a lane at intervals of less than seven seconds.
This report presented some information for intercity buses. Sustained speed information for 50 intercity
buses along a +3.00% grade follows.
Speed Limit= 55 mph
Mean Speed= 53.70 mph
15th percentile speed= 45.63 mph
50th percentile speed= 53.00 mph
85th percentile speed= 58.50 mph
INTERSECTION SIGHT DISTANCE
Available sight distance at street and driveway intersections should be great enough so that vehicles on the
side road about to make a maneuver (e.g., crossing, left-tum, right-tum) can avoid a collision with a
through roadway vehicle operating at the design speed and appearing after the side road vehicle has begun
its maneuver. Providing proper sight distance would improve safety and result in better operating
conditions (Bhesania). Many times in the design process, intersection sight distance is overlooked. This
leads to traffic operations problems that are difficult to solve once the roadway has been built.
Acceleration characteristics of design vehicles are critical parameters in intersection design. Each
intersection requires a different minimum intersection sight distance based on the speed of the approaching
vehicle, the acceleration of the stopped vehicle, and the type of maneuver that is being performed.
Departure Sight Triangle Conditions
5
For a vehicle stopped at an intersection, the presence of a triangular area to the side of the road, free of
obstructions, allows the driver to make a safer departure and enter the intersection. The design of the
intersection should provide a "sight triangle" adequate for any of the maneuvers that side street drivers will
make at the intersection.
The unobstructed sight distance needed by the side street driver is determined by the following
equation:
d = 0.28 V (J + t.)
where: d = sight distance measured along the major roadway from the intersection, m,
V = design speed on the major roadway, kph,
(2-1)

6 Sch Bus Accel. - Sep. 1998
J = the sum of the perception time and the time required to actuate the clutch or automatic shift,
assumed for design to be 2.0 sec. and,
ta = time required to accelerate and traverse a certain distance, such as the distance S to cross the
major roadway, sec.
The total distance of a crossing maneuver is the distance S, which is the sum of three components:
S = D + W + L (2-2)
where: D = distance from the near edge of the pavement to the front of a stopped vehicle, m,
W = pavement width along the path of crossing vehicle, m, and
L = overall length of vehicle, m.
For general design purposes, D is assumed to be 3 m. The value of W depends on the number of lanes the
side street vehicle must cross. A value of 3.6 mis a commonly-assumed lane width.
The needed sight distance is based on the time it takes for the stopped vehicle to accelerate and clear
the intersection and the distance that an oncoming through road vehicle will travel in that same amount of
time. The value for ta is dependent on the driver and the vehicle's performance. The passenger car (PC)
solid line in Figure 1 is the recommended time-distance relationship of a passenger car for calculating t,..
The acceleration times of the SU and WB-15 vehicles in Figure 1 are 140%-170% of those for passenger
cars. The time-distance data were developed from research at the University of Michigan Transportation
Research Institute (Fancher). The acceleration rates of buses and trucks are substantially lower than those
of passenger cars.
A somewhat different situation exists when a side road vehicle is turning right or left onto a through
road. For this, it is necessary to calculate a sight distance that permits the side road driver to tum onto the
through road and accelerate up to speed before an oncoming through road vehicle could overtake and
collide with the turning vehicle. The current Green Book (AASHTO, 1994) procedure incorporates the
assumption that the oncoming through road vehicle will slow down to 85% of the roadway design speed.
Railroad Crossings
It is also necessary to analyze the adequacy of the available sight distance at railroad grade crossings.
There are two design cases to consider at a railroad crossing without train-activated warning devices. The
first case considers a vehicle approaching a grade crossing: the vehicle operator can either safely cross the
railroad tracks before the oncoming train arrives or the vehicle operator can stop the vehicle in advance of
the railroad tracks. The second case considers a vehicle stopped at the railroad crossing. The available
sight distance must be great enough to permit the driver to see any oncoming train that is close enough to
strike the vehicle before that vehicle can accelerate and cross the railroad tracks.

Sch Bus Accel. - Sep. 1998 7
--------· :1 -+- PC acceleration time
-su acceleration time
-lr-WB-15 acceler~!ion time
20 r------------------------------
18 -----------------
16 ·-------
_ 14 --------------~--------------u ~ Cl) -~ E 12 .= C 0 ;: l'! ~
"i u u c(
2 +----+----+------+---+---+----+-----+---+---+-----'
10 15 20 25 30 35
Distance (m)
FIGURE 1 Time/Distance Relationship for PC, SU, and WB-15
40 45 50 55 60

8 Sch Bus Accel. - Sep. 1998
For this second case, the Green Book presents the following equation to calculate the needed sight
distance along the railroad track.
dr=0.28 Yr [ Vda1 + (L +2D +W -d.i)NG+ J]
where: dr = sight distance along railroad tracks, m,
V r = velocity of a train, kph,
VG= maximum speed of a vehicle in first gear, assumed to be 2. 7 mis,
a 1 = acceleration of a vehicle in first gear, which is assumed to be 0.45 m/s2,
L = length of a vehicle, which is assumed to be 20 m,
D = distance from stop line to nearest rail, which is assumed to be 4.5 m,
W = distance between the outer rails; for a single track, this value is 1.5 m, and
<la= Vl/2a1 = 8.1 m.
SCHOOL BUS SURVEY
(2-3)
A school bus survey (Appendix A) was sent to the departments of transportation for the fifty states and
Puerto Rico. This survey was sent to determine what information they currently possessed and what
methods they currently employed, if any, to determine roadway design needs to accommodate school buses.
The survey included questions related to:
1. school bus vehicle design dimensions,
2. inner and outer turning radius at both crawl and at normal turning speeds,
3. vehicle acceleration capabilities when making intersection turns, and
4. vehicle acceleration capabilities going up grades.
Responses were received from 36 states and Puerto Rico. Only two of the states (Indiana and North
Carolina) sent information about the acceleration capabilities of school buses.
Indiana's Department of Transportation forwarded their survey to the Indianapolis Public Schools
(JPS) Transportation Department. JPS stated that an 84 passenger school bus with a 210 horsepower
engine and a gross vehicle weight of 36,400 lb could accelerate to 95 kph in 67 seconds.
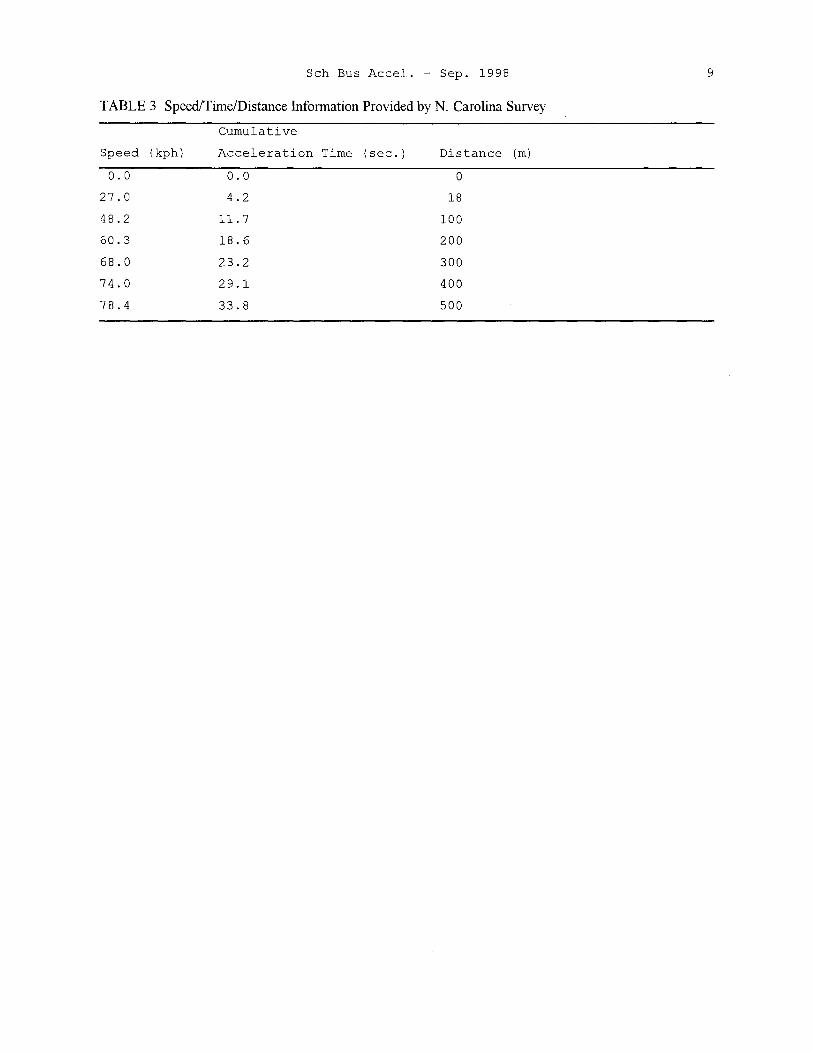
North Carolina's Department of Transportation forwarded their survey to the North Carolina
Department of Education's Division of Transportation Services. The Division of Transportation Services
provided speeds of a Thomas school bus over known distances. Table 3 summarized the information that
was provided by the Division of Transportation Services.
Sch Bus Accel. - Sep. 1998 9
TABLE 3 Speed/Time/Distance Information Provided by N. Carolina Survey
Cumulative
Speed (kph) Acceleration Time (sec.) Distance (m)
0.0 0.0 0
27.0 4.2 18
48.2 11. 7 100
60.3 18.6 200
68.0 23.2 300
74.0 29.1 400
78.4 33.8 500

10 Sch Bus Accel. - Sep. 1998
this page left blank

Sch Bus Accel. - Sep. 1998
CHAPTER3
RESEARCH PROCEDURES
11
To determine school bus acceleration rates, the researchers had to identify suitable school bus testing sites
and then collect speed and travel time information for the school buses at the sites. Before any testing
could begin, equipment that would record the field data had to be identified and purchased.
EQUIPMENT SELECTION
This project required equipment that could record and store data for each individual school bus as the
school bus drove by a data collection point. This necessitated a machine that could both identify each
vehicle separately (since there would be other vehicles on the roadway besides school buses) and store data
such as speed for each vehicle into a file, where the information could be retrieved at a later time.
Equipment Testing
Several traffic recording equipment manufacturers were contacted. Conversations with these businesses
about the project requirements led to the decision that a "traffic classifier" was needed for this study.
Classifiers are machines that, when connected with appropriate sensors, can identify each vehicle
separately, classify the vehicle by the axle spacing and number of axles, and determine each individual
vehicle's speed. The various brands have differing capabilities, so an evaluation of research needs and
product capabilities was made.
The Arkansas State Highway and Transportation Department (AHTD) lent one Phoenix classifier
and two sections of road tube. The AHTD classifier and road tubes were tested in the field to see if the
setup would provide the needed information on the school buses. This equipment was able to provide the
desired information.
Final Equipment Selection
Two Diamond Traffic Products Phoenix Classifiers were purchased. The Phoenix classifier could be set
up to display the time to hundredths of a second and speeds to tenths of a mph. It would also display the
axle spacing of each vehicle as it passed over the sensors. All of this information could also be stored
individually into a file to be retrieved and downloaded for analysis at a later time.
A software program created for the Phoenix classifier called "Trafinan" came with the classifiers.
For this project, the software was programmed to:
1. record each vehicle individually as it crossed over the sensors,
2. display the time to hundredths of a second,
3. display the speed to tenths of a mph, and

12 Sch Bus Accel. - Sep. 1998
4. display the axle spacing of each individual vehicle to tenths of a foot.
A pneumatic tube placed across the roadway sensed the passage of each vehicle.
SITE SELECTION
Several potential school bus study sites were identified before any field tests were done. For a school bus
site to be considered acceptable, it had to meet several testing criteria.
Site Criteria
In order for a site to be suitable, the roadway had to be fairly straight (and level for the level terrain tests)
so that the buses would be under full acceleration during testing and not be slowing down for a curve. The
sites had to have relatively higher speed limits, preferably greater than 64 km/h (40 mph). This criterion
was established so it would be possible to test a wider range of travel times, speeds, and distances.
There had to be at least five school buses operating at the site. Fewer than five would produce too
little speed/acceleration information to make the site worthwhile for testing.
The school bus testing site had to be free from traffic congestion. Areas with high traffic volumes,
and/or having several driveways or intersections would cause too many situations in which the school bus
would not be under a full acceleration.
Potential Sites
Maps of northwest Arkansas, northeast Oklahoma, and southwest Missouri were used to identify a list of
possible school bus sites. Table 4 lists the school bus testing sites that were considered.
Once the list of possible school bus sites was created, the superintendent or bus garage manager of
each school was contacted by telephone. The following questions were asked:
1. Does your district have any schools located adjacent to a roadway with a speed limit greater
than or equal to 40 mph?
2. Is the roadway in front of the school two lanes or four lanes?
3. How many buses tum right, left, or go straight?
4. Is the roadway in front of or near the school flat or on a grade?
5. Are there any sharp turns on the roadway near the school that may affect the school buses'
performance?
Telephone conversation responses reduced the number of potential testing sites in the region to eight.
Trips were taken to field inspect the remaining potential testing areas and verify that the sites were suitable
for testing the school buses. The Alma school district had two possible testing sites; the middle and the
primary school. The middle school testing site at Alma was considered unacceptable after observing

Sch Bus Accel. - Sep. 1998
TABLE 4 School Districts Contacted
County
Benton, AR
Carroll, AR
Crawford, AR
Franklin, AR
Johnson, AR
Logan, AR
Madison, AR
Scott, AR Sebastian, AR
School District
Bentonville Decatur Gentry Gravette Pea Ridge Rogers Siloam Springs Berryville Eureka Springs Green Forest Alma Cedarville Mountainburg Mulberry Altus-Denning Charleston County Line Ozark Pleasant View Clarksville Lamar Booneville Magazine Paris Scranton Brashears Huntsville Kingston Saint Paul Waldron Fort Smith Greenwood Hackett Hartford Lavaca Mansfield
Washington, AR Elkins
Barry, MO McDonald, MO Adair, OK
Delaware, OK
Farmington Fayetteville Greenland Lincoln Prairie Grove Springdale West Fork Winslow Washburn McDonald Co. Stilwell Watts Westville Colcord Jay Kansas Moseley
Telephone conversation outcome
not a possible site not a possible site not a possible site not a possible site not a possible site not a possible site not a possible site not a possible site not a possible site not a possible site possible level grade testing not a possible site not a possible site not a possible site not a possible site not a possible site not a possible site not a possible site not a possible site not a possible site not a possible site not a possible site not a possible site not a possible site not a possible site not a possible site possible level grade testing not a possible site not a possible site possible level grade testing not a possible site possible level grade testing not a possible site not a possible site not a possible site not a possible site possible level grade testing not a possible site not a possible site not a possible site not a possible site not a possible site not a possible site not a possible site not a possible site possible straight line acceleration possible level and upgrade testing not a possible site not a possible site not a possible site not a possible site not a possible site not a possible site not a possible site
13
14 Sch Bus Accel. - Sep. 1998
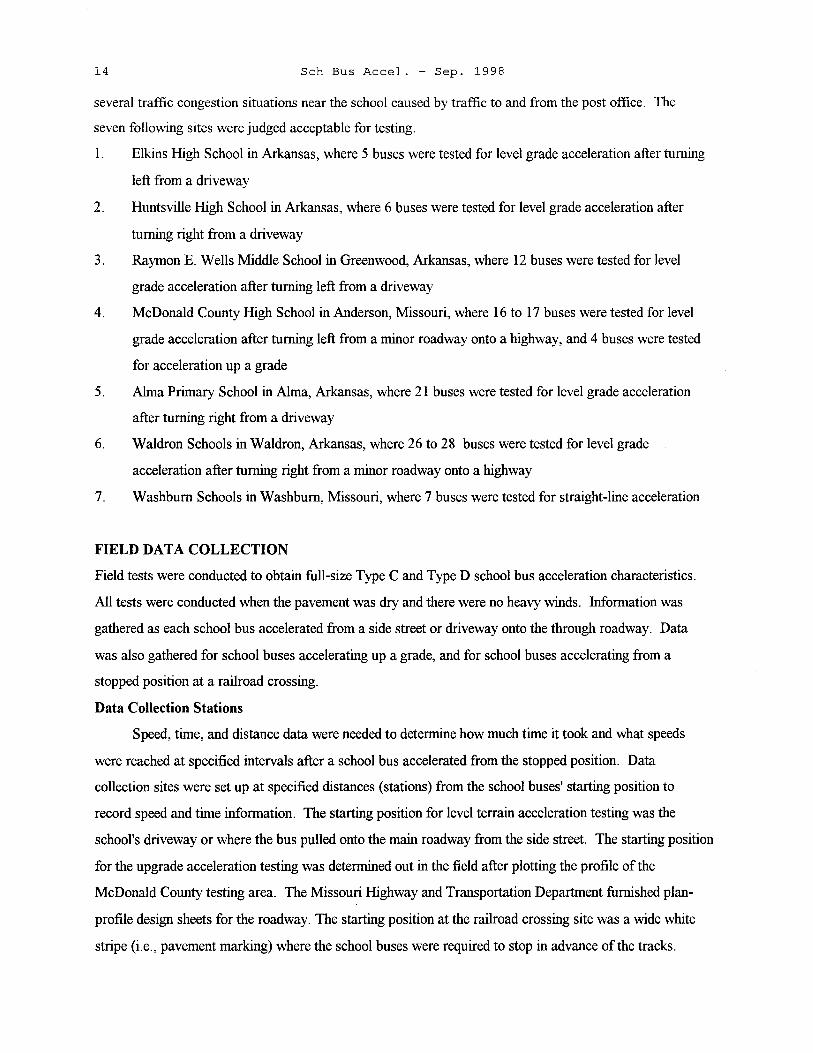
several traffic congestion situations near the school caused by traffic to and from the post office. The
seven following sites were judged acceptable for testing.
1. Elkins High School in Arkansas, where 5 buses were tested for level grade acceleration after turning
left from a driveway
2. Huntsville High School in Arkansas, where 6 buses were tested for level grade acceleration after
turning right from a driveway
3. Raymon E. Wells Middle School in Greenwood, Arkansas, where 12 buses were tested for level
grade acceleration after turning left from a driveway
4. McDonald County High School in Anderson, Missouri, where 16 to 17 buses were tested for level
grade acceleration after turning left from a minor roadway onto a highway, and 4 buses were tested
for acceleration up a grade
5. Alma Primary School in Alma, Arkansas, where 21 buses were tested for level grade acceleration
after turning right from a driveway
6. Waldron Schools in Waldron, Arkansas, where 26 to 28 buses were tested for level grade
acceleration after turning right from a minor roadway onto a highway
7. Washburn Schools in Washburn, Missouri, where 7 buses were tested for straight-line acceleration
FIELD DATA COLLECTION
Field tests were conducted to obtain full-size Type C and Type D school bus acceleration characteristics.
All tests were conducted when the pavement was dry and there were no heavy winds. Information was
gathered as each school bus accelerated from a side street or driveway onto the through roadway. Data
was also gathered for school buses accelerating up a grade, and for school buses accelerating from a
stopped position at a railroad crossing.
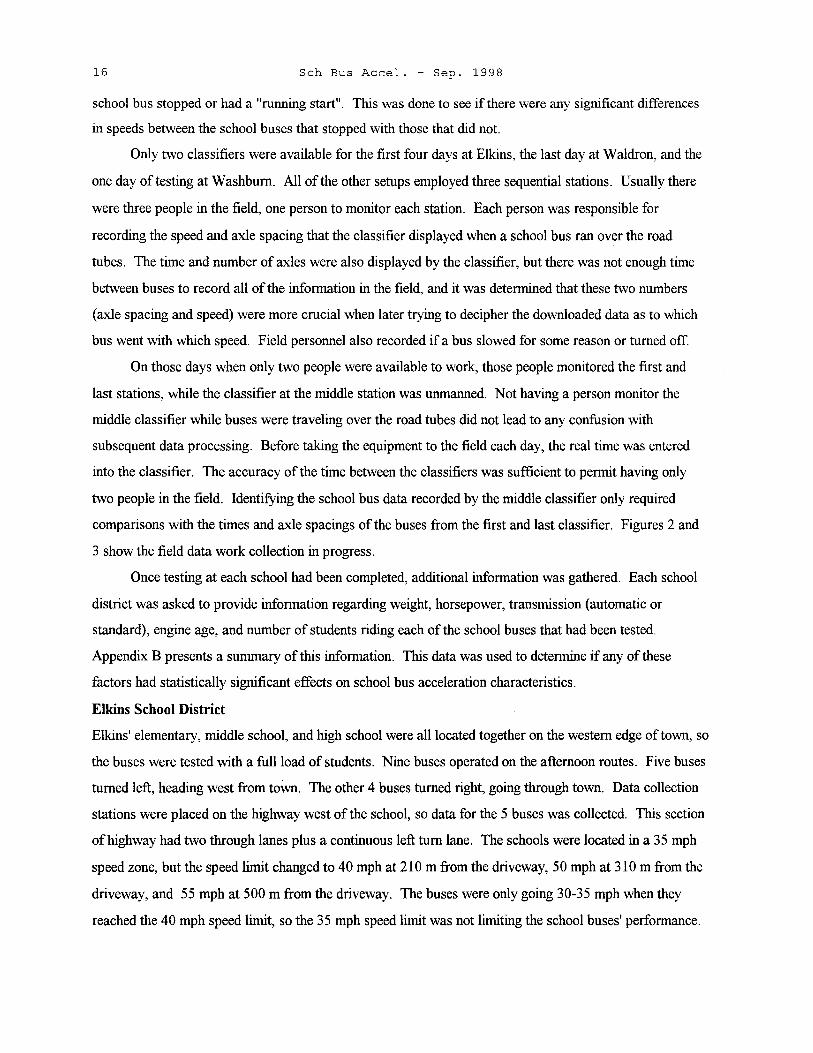
Data Collection Stations
Speed, time, and distance data were needed to determine how much time it took and what speeds
were reached at specified intervals after a school bus accelerated from the stopped position. Data
collection sites were set up at specified distances (stations) from the school buses' starting position to
record speed and time information. The starting position for level terrain acceleration testing was the
school's driveway or where the bus pulled onto the main roadway from the side street. The starting position
for the upgrade acceleration testing was determined out in the field after plotting the profile of the
McDonald County testing area. The Missouri Highway and Transportation Department furnished plan
profile design sheets for the roadway. The starting position at the railroad crossing site was a wide white
stripe (i.e., pavement marking) where the school buses were required to stop in advance of the tracks.

Sch Bus Accel. - Sep. 1998 15
Data collection stations were positioned at 18 m, 100 m, 200 m, 300 m, 400 m, and 500 m from the
school buses' starting position. A few stations were not set up at these exact distances, because at these
locations there were obstructions such as islands in the roadway or intersections, so the speeds had to be
interpolated later on to reflect the speeds at the 18 m, 100 m, 200 m, 300 m, 400 m, and 500 m interval
stations.
The station distances were measured from the point at which the bus entered the roadway. For buses
turning right, stations were measured from the right edge of the drive, and for buses turning left, from the
centerline of the driveway. However, the station distances do not reflect the actual distance that the school
bus traveled. The actual distance was slightly longer due to the turning path of the school bus.
For some of the early tests at Elkins and Huntsville, the initial data collection station was set at 15
m. During the early tests it appeared that buses were barely able to straighten out from their tum out of the
school's driveway at this distance. The distance to the first station was increased to 18 m to allow a margin
in case buses in subsequent tests required more than 15 m to straighten out from a turn.
Data Collection Procedure
Field personnel collected the data with the classifier/road tube and a video camera. The field setup
consisted of placing two road tubes across the road. A knot was tied in the middle of the road tube to cut
off any pulses produced by vehicles in the far lane. This was necessary because only one direction of
traffic, the near lane, needed to be monitored. The road tubes were spaced ten feet apart (common setup
spacing for the classifier) and brackets holding the tubes were nailed into the gravel shoulder with six inch
spikes. The classifier was placed on the side of the road that the school buses would be traveling. The two
ends of the road tubes were placed in the appropriate inputs on the classifier. Input one was for the first
road tube to be driven over, input two was for the second road tube. The classifier was turned on, and
input codes were entered. The classifier was then ready to record the data. The classifier/road tube setup
was able to provide all of the school bus speed and real time information at each of the setup stations.
A video camera was used to monitor the buses from O m ( i.e., the side street or driveway) to 18 m.
The video tapes were viewed in the office to record the time each bus took to travel from the starting
position to the 18 m station. Some of the Om to 18 m times were recorded in the field (when personnel
were available) and then compared to times from the videotape as a check.
The school bus numbers were not readable in the video record. The field person at the first testing
station recorded the number of each school bus. Persons at the subsequent stations were asked to record
the bus numbers if they had time.
All buses were supposed to stop before proceeding onto the main roadway. Some buses made
"rolling stops" because of the absence of traffic on the main roadway. A note was made as to whether the
16 Sch Bus Accel. - Sep. 1998
school bus stopped or had a "running start". This was done to see if there were any significant differences
in speeds between the school buses that stopped with those that did not.
Only two classifiers were available for the first four days at Elkins, the last day at Waldron, and the
one day of testing at Washburn. All of the other setups employed three sequential stations. Usually there
were three people in the field, one person to monitor each station. Each person was responsible for
recording the speed and axle spacing that the classifier displayed when a school bus ran over the road
tubes. The time and number of axles were also displayed by the classifier, but there was not enough time
between buses to record all of the information in the field, and it was determined that these two numbers
(axle spacing and speed) were more crucial when later trying to decipher the downloaded data as to which
bus went with which speed. Field personnel also recorded if a bus slowed for some reason or turned off.
On those days when only two people were available to work, those people monitored the first and
last stations, while the classifier at the middle station was unmanned. Not having a person monitor the
middle classifier while buses were traveling over the road tubes did not lead to any confusion with
subsequent data processing. Before taking the equipment to the field each day, the real time was entered
into the classifier. The accuracy of the time between the classifiers was sufficient to permit having only
two people in the field. Identifying the school bus data recorded by the middle classifier only required
comparisons with the times and axle spacings of the buses from the first and last classifier. Figures 2 and
3 show the field data work collection in progress.
Once testing at each school had been completed, additional information was gathered. Each school
district was asked to provide information regarding weight, horsepower, transmission (automatic or
standard), engine age, and number of students riding each of the school buses that had been tested.
Appendix B presents a summary of this information. This data was used to determine if any of these
factors had statistically significant effects on school bus acceleration characteristics.
Elkins School District
Elkins' elementary, middle school, and high school were all located together on the western edge of town, so
the buses were tested with a full load of students. Nine buses operated on the afternoon routes. Five buses
turned left, heading west from town. The other 4 buses turned right, going through town. Data collection
stations were placed on the highway west of the school, so data for the 5 buses was collected. This section
of highway had two through lanes plus a continuous left turn lane. The schools were located in a 35 mph
speed zone, but the speed limit changed to 40 mph at 210 m from the driveway, 50 mph at 310 m from the
driveway, and 55 mph at 500 m from the driveway. The buses were only going 30-35 mph when they
reached the 40 mph speed limit, so the 35 mph speed limit was not limiting the school buses' performance.

Sch Bus Accel. Sep. 1998 17
FIGURE 2 Field Data Collection Setup
FIGURE 3 School Bus Passing Over Sensors

18 Sch Bus Accel. - Sep. 1998
Six days of data were collected at Elkins. The third classifier became available after the fourth day
of testing. One set of 15 m data, three sets of 18 m data, and two sets of 105.60 m, 200 m, 300 m, 400 m
and 500 m data were collected.
The first day of data was taken at 15 m and 105. 60 m. It was not known exactly where the buses
straightened out from their turn, so 15 m was originally selected for the initial data collecting station. After
observing the buses in the field and viewing the video camera tape, it was determined that 18 m was a more
appropriate starting distance. The second setup station was located at 105.60 m instead of 100 m because
a driveway was located at 100 m.
The last or fifth bus usually had to stop near the 300 m station. Data from the 200 m, 300 m, 400
m, and 500 m stations were tagged so that the data for this bus would not be included when evaluating the
performance times later on.
Huntsville School District
Huntsville High School was located on the south edge of town. The buses already had picked up the
elementary and middle school students before arriving at the high school, so these buses were loaded when
they left the high school. There were 31 buses used for afternoon routes. Twenty-five of the buses turned
left, heading back into town. The other 6 turned right, or south, heading away from town on Highway 23
(a two-lane highway). The 6 buses that turned right were tested because the roadway was level and
straight and the buses were able to achieve the higher speeds required. The speed limit was 45 mph in front
of the school, but 75 m south of the driveway it changed to 55 mph.
Six days of testing were conducted at Huntsville High School. Two sets of data were taken at 15 m,
96 m, 205 m, 300 m, 385 m, and 500 m. Due to the wide variation of school bus speeds in the initial data,
two more sets of 96 m, 205 m, and 300 m data were taken . The two extra sets of data showed more
consistent bus speeds.
There was a gentle curve to the left on Highway 23 approximately 550 m south of the school's
driveway. Both observation and data analysis showed that the school buses were not slowing to negotiate
the curve.
Greenwood School District
Raymon E. Wells Junior High was located about two miles east of Greenwood on Highway 10 (a two-lane
highway). Twelve buses started at this school. All 12 turned left, or west, on Highway 10 and headed
toward town.
All 12 buses were tested. The speed limit was 55 mph, so there were no concerns about any buses
not being under a full acceleration. The geometry of the roadway limited the number of stations at which
data could be collected, though. There was a gradual upgrade hill approximately 220 m from the school's

Sch Bus Accel. - Sep. 1998 19
driveway. This limited the number of stations used for testing to the 18 m, 100 m, and 200 m stations. so
only two days were required to gather the speed information for Greenwood.
McDonald County School District
McDonald County High School was located in Anderson, Missouri on US Highway 71 (a two-lane
highway). The speed limit on US 71 in front of the school was 45 mph. Depending on the test day, 16 to
17 buses turned left onto Highway 71, heading south from the high school. The high school was the
starting point for most of these routes, thus, the school buses had few passengers.
Speed data was collected for four days. Two sets of data were collected for all the buses at the 18
m, 100 m, 200 m, 300 m, 400 m, and 500 m stations. Data for the last 8 buses at the 400 m and 500 m
stations were tagged for exclusion because these buses slowed at an intersection to make a right tum.
Other McDonald County school buses were also used for upgrade testing. Two days of data were
collected for the upgrade tests. The school itself was located in a long valley, and the few buses that turned
right or north proceeded up a grade. Four buses were tested, so only a small amount of information was
collected.
The upgrade testing area included a 150 m long bridge. The bridge itself was on a +2.95% grade
(Figure 4). The testing stations were set up at 150 m south of the south end of the bridge (to measure the
school bus speed on level terrain as it entered the upgrade portion of the roadway), the south end of the
bridge (to measure the speed as the school bus reached the constant +2.95% upgrade portion), and the
north end of the bridge (to measure the speed after an interval on a constant upgrade).
Alma School District
Alma's school district had two school sites (the middle school and primary school) that were thought to be
suitable for testing. The primary school was tested first, since it was located farther east of town, which
meant that these buses traveled more open highway and therefore had a better opportunity to achieve higher
speeds.
Alma Primary School was located approximately two miles east of Alma on US Highway 64 (a two
lane highway). Data was initially collected for 21 school buses at the 18 m, 100 m, and 200 m stations.
After reviewing the speeds recorded, it was suspected that a small downward slope on the roadway about
30 m from the school's driveway might be helping the buses accelerate. A surveying transit was used to
profile the roadway (Figure 5). After reviewing the profile and the data, it was determined that the 1.68%
grade could be helping the buses accelerate, so only the 18 m speeds were deemed valid. Two days of data
were collected at the 18 m station.
Alma Middle School was located one mile east of town on US Highway 64. The post office was
located next to the school and caused several traffic congestion situations. During the first day of testing,

20 Sch Bus Accel. - Sep. 1998
,... £ ...., 9 C 8
North Encl of' Bridge
0 7 +> C, 6 > 5 (I/
w 4 3 2 1 0
0 38.1 68.58 99.06 160.02 304,B
Dlsto.nce (M)
FIGURE 4 Profile of McDonald County Upgrade Testing Area
-E:. ',J 1,5240
C 1.2192 0 Gro.cie = 1.68 % +> 0.9144 d > 0.6096 a, _, w 0.3048
0 0 15.24 30.48 45.72 60.16 76.20 91.44 106.68 121.92 137.16 152.40
Horizonto.l Disto.nce FroM Drivewo.y (M)
FIGURE 5 Profile of Alma Primary School Testing Area

Sch Bus Accel. - Sep. 1998
only one of the 21 buses leaving this school was under full acceleration through all of the stations ( 18 m,
100 m, and 200 m). Due to the congestion at this site, it was abandoned.
Waldron School District
Waldron's elementary and middle schools were located on the west edge of town along the bypass. The
testing area was a 650 m section of US 71 Bypass (a two-lane highway with a continuous left turn lane)
that the buses traveled to get from the middle school to the high school.
21
Depending on the test day, 26 to 28 buses were observed. Two days of testing the 18 m, 100 m, and
200 m and one day of testing the 300 m and 400 m stations were conducted. Data was not collected at the
500 m station because it was too close to the intersection where the buses turned off.
Washburn School District
Washburn's elementary, middle, and high schools were located in Washburn, Missouri. There was a
railroad grade crossing approximately 305 m west of the school. Seven buses turned right and headed west
on Highway 90 (a two-lane highway). The buses were required to stop at the railroad tracks and then
accelerate (i.e., the straight-line acceleration test). Data was recorded for 7 buses at the 18 m and 100 m
stations.
DOWNLOADING DATA
Field personnel had collected speed and time-of-passage data with the Phoenix classifiers for each school
bus as it proceeded through a sequence of data collection stations. After each day of data collection, the
classifiers were brought into the office so that the information could be retrieved.
The classifiers were connected to a laptop computer equipped with the ''Trafinan" software. The
"Trafinan" software was used to retrieve the data files and convert these files into a readable format where
the data could be analyzed.
Once the data files from the field tests were retrieved and converted into a readable format, the files
were imported into a spreadsheet (Appendix C). This spreadsheet contained all the raw data that had been
collected at each of the level grade acceleration testing sites (including the Washburn straight-line
acceleration data). The raw data contained the speeds, time-of-passage, and axle spacing of each school
bus from the classifier.
Information recorded by the field personnel was also added to the spreadsheet. This included the
school bus number, the school buses' 0-18 m travel times, whether the bus stopped or ran the stop sign, and
notes of any school buses that slowed down or stopped. Some of these notations were added to identify
buses that should be eliminated from the raw data set, before the data was analyzed.
22 Sch Bus Accel. - Sep. 1998
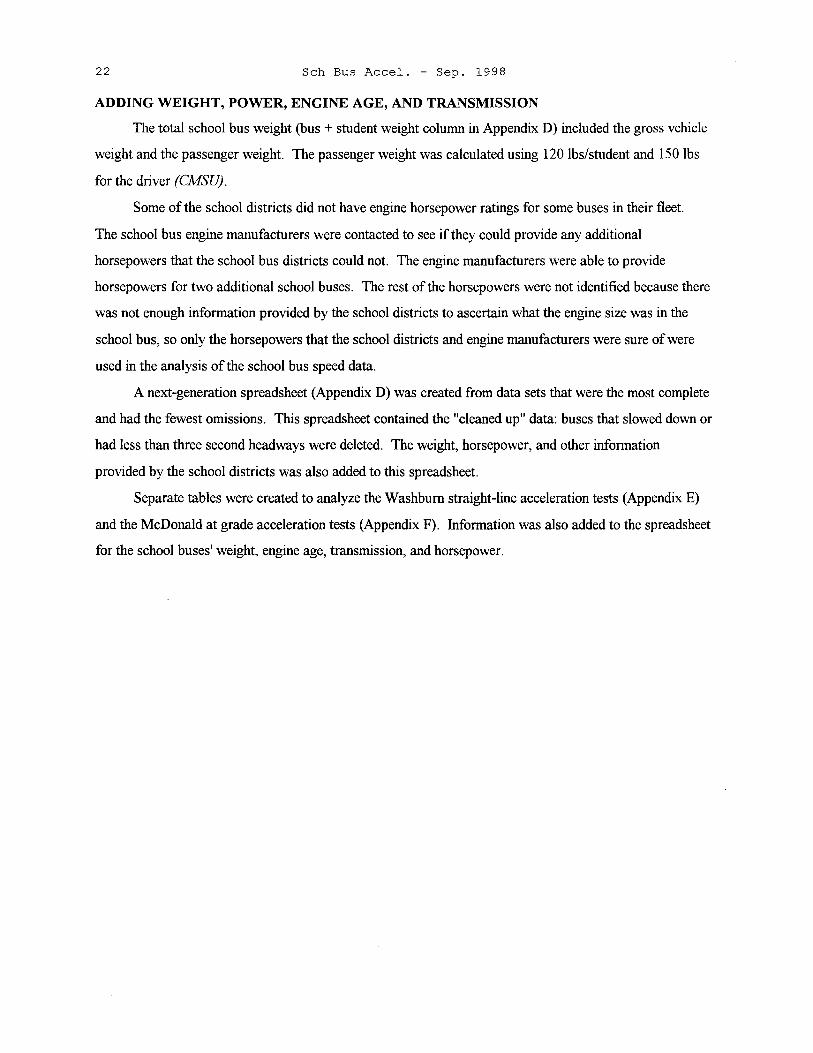
ADDING WEIGHT, POWER, ENGINE AGE, AND TRANSMISSION
The total school bus weight (bus+ student weight column in Appendix D) included the gross vehicle
weight and the passenger weight. The passenger weight was calculated using 120 lbs/student and 150 lbs
for the driver (CMSU).
Some of the school districts did not have engine horsepower ratings for some buses in their fleet.
The school bus engine manufacturers were contacted to see if they could provide any additional
horsepowers that the school bus districts could not. The engine manufacturers were able to provide
horsepowers for two additional school buses. The rest of the horsepowers were not identified because there
was not enough information provided by the school districts to ascertain what the engine size was in the
school bus, so only the horsepowers that the school districts and engine manufacturers were sure of were
used in the analysis of the school bus speed data.
A next-generation spreadsheet (Appendix D) was created from data sets that were the most complete
and had the fewest omissions. This spreadsheet contained the "cleaned up" data: buses that slowed down or
had less than three second headways were deleted. The weight, horsepower, and other information
provided by the school districts was also added to this spreadsheet.
Separate tables were created to analyze the Washburn straight-line acceleration tests (Appendix E)
and the McDonald at grade acceleration tests (Appendix F). Information was also added to the spreadsheet
for the school buses' weight, engine age, transmission, and horsepower.

Sch Bus Accel. - Sep. 1998 23
CHAPTER4
DATA ANALYSIS AND RESULTS
Once the data had been collected from each of the school bus testing sites and retrieved from the classifiers,
the data were analyzed. A few of the data points had to be removed because of testing problems.
The school bus speed data were used to create figures using the school bus speeds. Later, the weight
and horsepower, engine age, and transmission of the school buses were factored into the analysis to see
what effects these factors had on the school buses' speed.
DA TA INSPECTION AND ADJUSTMENT
The initial spreadsheet contained all of the raw data that had been collected at each of the level terrain
testing sites. This data was inspected, and appropriate adjustments were made.
Eliminating Obvious Problems
The data were first visually inspected for omissions and possible errors. Inspections were also made for
instances where one bus was closely following another bus (i.e., short bus headways).
At two of the Alma stations, school bus data were not used. The Alma data was deemed invalid at
the I 00 m and 200 m station because the downward grade along the highway seemed to be helping the
school buses accelerate.
On one occasion, the classifier misidentified two school buses as one four-axle vehicle on March 20
at McDonald County. This data was also deleted.
The raw data spreadsheet was inspected to find any sequential passage times ofless than 3.0 seconds
at any station, because it was felt that a headway ofless than 3.0 seconds could cause a driver to be
influenced by the speed of the school bus in front of him/her. In such cases, the school bus may not have
been under full acceleration. The real time associated with the passage of each vehicle was used to identify
school buses that were following too close behind a preceding bus. For the few cases ofless than a 3.0
second headway found, the data for the following bus was removed from that station.
Other school buses were deleted from the spreadsheet because of characteristics observed in the
field. In some instances, school buses had to make a stop to discharge students. Other times, school buses
had to slow down to make a left or right turn off of the highway.
Selecting Best Data Sets
At least two sets of data were collected at most stations at each of the testing sites. The two best
(most complete) sets of data from each station were those chosen for Appendix D.
24 Sch Bus Accel. - Sep. 1998
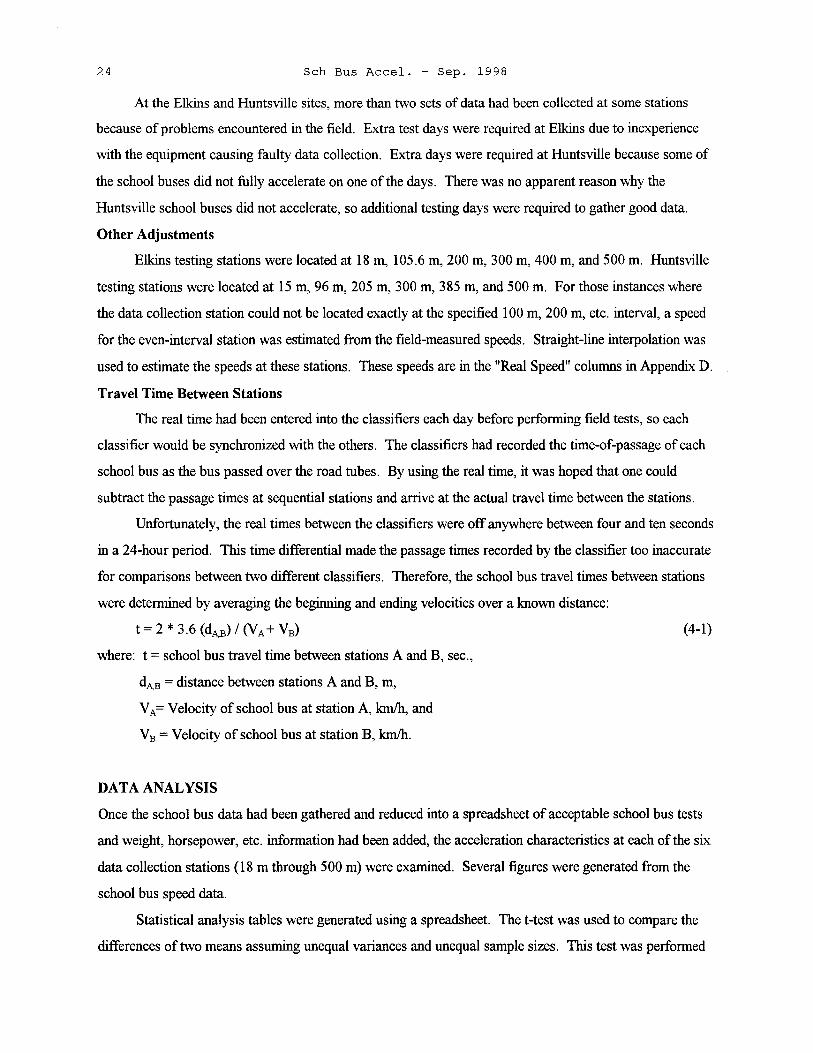
At the Elkins and Huntsville sites, more than two sets of data had been collected at some stations
because of problems encountered in the field. Extra test days were required at Elkins due to inexperience
with the equipment causing faulty data collection. Extra days were required at Huntsville because some of
the school buses did not fully accelerate on one of the days. There was no apparent reason why the
Huntsville school buses did not accelerate, so additional testing days were required to gather good data.
Other Adjustments
Elkins testing stations were located at 18 m, 105.6 m, 200 m, 300 m, 400 m, and 500 m. Huntsville
testing stations were located at 15 m, 96 m, 205 m, 300 m, 385 m, and 500 m. For those instances where
the data collection station could not be located exactly at the specified 100 m, 200 m, etc. interval, a speed
for the even-interval station was estimated from the field-measured speeds. Straight-line interpolation was
used to estimate the speeds at these stations. These speeds are in the "Real Speed" columns in Appendix D.
Travel Time Between Stations
The real time had been entered into the classifiers each day before performing field tests, so each
classifier would be synchronized with the others. The classifiers had recorded the time-of-passage of each
school bus as the bus passed over the road tubes. By using the real time, it was hoped that one could
subtract the passage times at sequential stations and arrive at the actual travel time between the stations.
Unfortunately, the real times between the classifiers were off anywhere between four and ten seconds
in a 24-hour period. This time differential made the passage times recorded by the classifier too inaccurate
for comparisons between two different classifiers. Therefore, the school bus travel times between stations
were determined by averaging the beginning and ending velocities over a known distance:
t = 2 * 3.6 (dA,B) /(VA+ VB)
where: t = school bus travel time between stations A and B, sec.,
dA.8 = distance between stations A and B, m,
VA= Velocity of school bus at station A, km/h, and
V 8 = Velocity of school bus at station B, km/h.
DATA ANALYSIS
(4-1)
Once the school bus data had been gathered and reduced into a spreadsheet of acceptable school bus tests
and weight, horsepower, etc. information had been added, the acceleration characteristics at each of the six
data collection stations (18 m through 500 m) were examined. Several figures were generated from the
school bus speed data.
Statistical analysis tables were generated using a spreadsheet. The t-test was used to compare the
differences of two means assuming unequal variances and unequal sample sizes. This test was performed

Sch Bus Accel. - Sep. 1998 25
to determine if there were any statistical differences in the mean speeds of various bus groups.
Comparisons were based on whether the school buses stopped or ran the stop sign; the school buses' weight
and power; transmission type; or the age of the school buses. The test statistic equations used are given
below:
and
where: t = test statistic
df = degrees of freedom
n1 = size of sample I
Y1 = mean of sample I
s/ = variance of sample I
y2 = mean of sample 2
n2 = size of sample 2
s} = variance of sample 2
D0 = hypothesized difference between the means
(4-2)
(4-3)
In all of the statistical analysis tests, the value for D0 was assumed 0. The confidence interval for all tests
was 90%. The t-critical value ranged between 1.65 and 1.72, depending on the sample size.
A statistical analysis on the school bus speed data was performed to determine the 12.5 percentile
school bus speeds at each individual station. The 100 and 200 m speeds for those buses running the stop
sign were removed from the analysis because there were significant differences between these speeds and
the speeds of the school buses that had come to a full stop. The procedure consisted of taking one speed
out of the sample size "n" (at the particular testing station) and then placing it back into the sample. This
was done "n" times to get one iteration. The speeds were averaged to get a mean speed for the iteration.
This procedure ("bootstrapping the data", using software called "S-plus") was repeated 500 times with the
individual school bus speeds at each testing station to get the 12.5 percentile speeds at each station.
RESULTS OF ANALYSIS
The school buses' average acceleration times, average speeds, and 12.5 percentile speeds are shown in
Table 5.

26 Sch Bus Accel. - Sep. 1998
TABLES School Bus Average Acceleration Times and Speeds
Distance (m)
Averages Om 18m 100m 200m 300m 400m 500m
Avg. travel time
between stations (sec.) 5.1 8.9 7.6 6.3 5.6 5.2
Avg. accumulated
travel time (sec.) 5.1 14.0 21. 6 27.9 33.4 38.7
Avg. speed (kph) 0 25.1 42.8 53.1 61. 9 68.0 70.7
Avg. 12.5 percentile
speed (kph) 0 22.2 38.9 46.6 56.6 64.3 67.1
Turning Acceleration
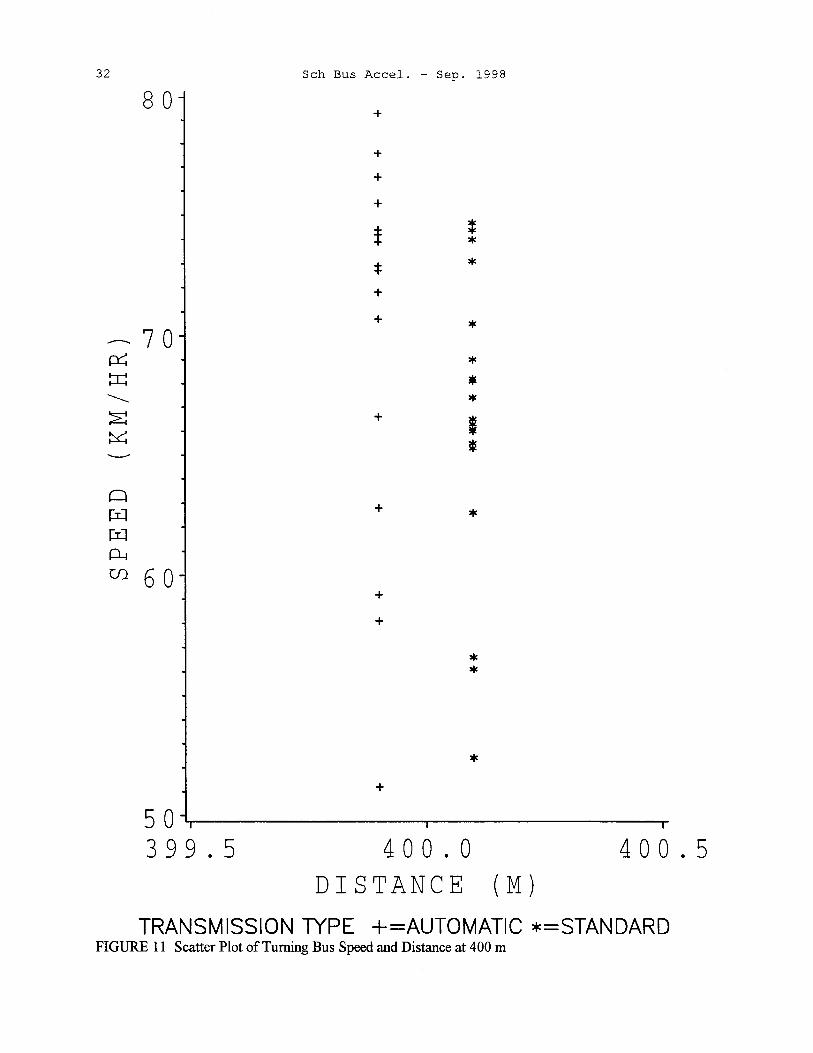
Figures 6-12 showed the scatter plots for right or left turn school bus speeds at each of the level terrain
testing stations. Figure 6 showed the speeds at all six testing stations, while Figures 7-12 showed the
speeds at each testing station individually. In these figures, the speeds were shifted to the left and the right
of the actual x-coordinate of the testing stations. This was done so that the speeds of the automatic
transmission school buses could be differentiated from the speeds of the standard transmission school
buses.
The figures demonstrated two distinct patterns for the school buses tested. First, they showed that
the school bus acceleration rate was decreasing from O m to I 00 m. Second, they showed that from I 00 m
to 500 m, the acceleration pattern of the school buses was somewhat linear.
The figures showed that several of the automatic transmission school buses accelerated faster than
the standard transmission school buses up to the 200 m station. At the 300 m, 400 m, and 500 m stations,
though, the standard transmission school bus speeds were close to those of buses with the automatic
transmissions.
Straight Acceleration
Figures 13-15 showed the Washburn straight-line data (Appendix E) superimposed on the turning school
bus data from Oto 100 m. The Washburn data is to the left of the data from the other turning school buses.

-------i:r:: ::r:::
-----~ ~ ---~ µ::J
µ::J
P-i U).
9 0 Sch Bus Accel. - Sep. 1998 27
* 8 0 + + 5 + +
~ + J 7 0 * +.it<
I i + += + :f: + +.it< * +
6 0 + * + * :j: * #
+ ~
! * + 50 +
*
* 4 0
+
=I= +
3 o·
2 0
10'---------------------0 100 200 300 400 500 600
DISTANCE (M)
TRANSMISSION TYPE +=AUTOMATIC *=STANDARD
FIGURE 6 Scatter Plot of Turning Bus Speed and Distance

28 3 4
3 3
32
3 1
3 0
29 ---0-::: 2 8 ~
._______ 2 7 ~ ~ 2 6
2 5 Q
µ_:i 2 4 µ.:J
~ 2 3
22
21
2 0
19
18
Sch Bus Accel. - Sep. 1998
+ +
+ +
+ :j:
* + + :j:
:j: + +
* + * + + + +
* + * + + + + + ! +
+
*
i * * * * * * * * * * * * • • * * * * ! * 17~-------T--*---------
17.5 1 8 . 0 DISTANCE (M)
18.5
TRANSMISSION TYPE +=AUTOMATIC *=STANDARD
FIGURE 7 Scatter Plot of Turning Bus Speed and Distance at 18 m

Sch Bus Accel. - Sep. 1998 29
6 0
$ -- 5 0 :j:
~ I ::r:: * ..._______ * ~ * ~
* i --- t i Q +
=I= µ::J +
* µ::J + I ~ + Cf)_ 4 0 $ + * + I + * + * *
$ *
+
30~-----r--------.-99.5 1 0 0 . 0
DISTANCE (M)
100.5
TRANSMISSION TYPE +=AUTOMATIC *=STANDARD FIGURE 8 Scatter Plot of Turning Bus Speed and Distance at 100 m

30
-----~ :=i=:
--------~ ~
----Q µ:::J
µ:::J
~ U).
7 0 Sch Bus Accel. - Sep. 1998
+
+
+
:f:
t 6 0
Ill
* = ! * $ * * + = :f: * * • i 50 :t: + i + + I + * + ! +
* *
4 0 +
30------r--------199.5 2 0 0 . 0
DISTANCE (M)
2 0 0 . 5
TRANSMISSION TYPE +=AUTOMATIC *=STANDARD FIGURE 9 Scatter Plot of Turning Bus Speed and Distance at 200 m

---0::: ::c:
.....______
~ ~ ---Q µ::j
µ::j
~ U)
Sch Bus Accel. - Sep. 1998 31
8 0
+
+
7 0 i :j: = * * *
* * * * * + • :j:
:j: i + 6 0 + *
+ = + * + * + * * * Iii
• * 5 0 +
*
*
40.,__-------r---------2 9 9 . 5 3 0 0 . 0
DISTANCE (M)
3 0 0 . 5
TRANSMISSION TYPE +=AUTOMATIC *=STANDARD FIGURE 10 Scatter Plot of Turning Bus Speed and Distance at 300 m
32 Sch Bus Accel. - Sep. 1998
8 0 +
+
+
+
! ; *
* * +
+ * --- 7 0
~ * :I! * ----- * ~ + • ~ f ----Q ~ +
* ~ ~ U) 60
+
+
* *
* +
50--------r--------3 9 9 . 5 4 0 0 . 0 4 0 0 . 5
DISTANCE (M)
TRANSMISSION TYPE +=AUTOMATIC *=STANDARD FIGURE 11 Scatter Plot of Turning Bus Speed and Distance at 400 m

-----~ ~
----~ ~ ---Q µ::J
µ::J
P-i Cf)
9 0 Sch Bus Accel. - Sep. 1998 33
+ 8 0
+ * + + = + *
+ * * * I 7 0 + * * * +
+ +
* +
6 0 * *
+ *
50-------------~ 499.5 5 0 0 . 0
DISTANCE (M)
5 0 0 . 5
TRANSMISSION TYPE +=AUTOMATIC *=STANDARD FIGURE 12 Scatter Plot of Turning Bus Speed and Distance at 500 m

34 Sch Bus Accel. - Sep. 1998
60
5 0
--- 4 0 >lq: +
p::; *1 ~
----- * ~ * ~ +
--- 3 0 Q ~
~ ~ (/) 2 0
*+I *
10
0 L,-----r---........----.-----.-----r-----r-
0 2 0 4 0 6 0 80 100 120 DISTANCE ( M)
TRANSMISSION TYPE +=AUTOMATIC *=STANDARD FIGURE 13 Scatter Plot of Washburn Straight-line Speed and Distance

3 4 3 3
32 3 1
3 0 2 9 2 8
~ 2 7 ~ 2 6 -----~ 2 5 ~
--- 24 Q 2 3
: 2 2 ~ 21
2 0 19 18 17 16 15
+
+
+
Sch Bus Accel. - Sep. 1998
*
*
*
*
+ +
:j:
* * +
* * =I=
:j: ;t
i t
! i t * * i i i :j: * l * t * + • • * *
* *
+ ! * *
14Lr------T---~-----..-----.-17 18 19
DISTANCE 2 0
( M)
TRANSMISSION TYPE +=AUTOMATIC *=STANDARD
FIGURE 14 Scatter Plot of Washburn Straight-line Speed and Distance at 18 m
21
35

0 µ::J
µ::J
P-i
36
6 0 Sch Bus Accel. - Sep. 1998
+
+
*
* CJ) 4 0
*
$ * *
+
30~----,-----._----,-----9 9 100 101
DISTANCE 102
( M)
103
TRANSMISSION TYPE +=AUTOMATIC *=STANDARD FIGURE 15 Scatter Plot of Washburn Straight-line Speed and Distance at 100 m

Sch Bus Accel. - Sep. 1998 37
When comparing the straight and turning school buses, adjustments were made to calculate the
actual distance that the turning school buses traveled to the first testing station at 18 m. It was assumed
that the school bus began the right tum onto the highway from a position 3.048 m (10.0 ft) back from the
edge of the road. Based on other research conducted, it was assumed that the turning radius of the school
bus was 9.144 m (30.0 ft). It was also assumed that the bus made a 90° tum. After taking these
assumptions into consideration, the distance traveled to the first station (18 m) was actually 20.6 m, or an
extra 2.6 m above the nominal 18 m (Figure 16).
The figures showed that the straight-line acceleration school buses' speeds from Washburn were very
similar to those of the turning school buses. Since the data did not suggest any great differences, it was
assumed that the results of the straight-line and the turning tests could be used interchangeably for design
purposes.
ClrcuMference = pl * dlo.Meter
Arc Tro.vel of School Bus = pl 111; 62.1819/360 *dlo.Meter
= 3.14 Iii; 0.1727 Iii; 18.288 M
= 9,924 M
Horlzonto.l Tro. vel = 10.6863 M Toto.l Tro. vel Dlsto.nce = 20.61 M
Delta. = 20.61 M - 18 M = 2.61 M, or o.pproxlMo.tely 2.6 M
~----Actuo.l Sto.rtlng Point of Turning School Buses
4,8 68 i---------10.6860-------t
4.2672
1.8288 --------------10.0012-------------1
Note, All cllr1enslons o.re In Meters (r,),
FIGURE 16 Diagram of Turning Arc Excess

38 Sch Bus Accel. - Sep. 1998
Upgrade
Figure 4 showed the profile of Highway 71 where the buses were tested for upgrade acceleration. There
were two sections of the upgrade. The first was 150 m south of the southern end of the bridge to the
southern end of the bridge. This is where the grade changed from 0% to 2.95%. The second section was
the constant 2.95% grade portion from the southern end of the bridge to the northern end of the bridge.
This section was also 150 m long.
Appendix F showed the data collected for the upgrade acceleration tests at McDonald County. Only
4 school buses were tested (six data points), so no statistical information was generated from this test. The
school buses maintained speeds ranging from 60 to 80 km/h while traveling up a 150 m long 2.95%
upgrade. The observed school buses exhibited very little (if any) acceleration while traveling up this grade.
This observed school bus performance can be compared with the "speed loss which equals or
exceeds 87.5% of all tractor-trailers and trucks" from the 1994 Green Book, Figure III-25(C) (AASHTO,
1994). The Green Book figure showed the 12.5 percentile truck was decelerating from 85 to 80 km/h over
a 3% grade (between 150 and 300 m of travel), with the speed not leveling out until the truck speed
declined to 50 km/h. The small sample of observed school buses maintained speed on a 3% grade much
better than the Green Book 12.5 percentile design truck did. The speeds of the 50 intercity buses on a
3.0% grade from the previously-mentioned California study (Ching and Rooney) were slightly higher than
those of the small observed sample at McDonald County.
Stop vs. Run
Figure 17 showed the mean speeds of the stopped school buses compared with those that ran the stop
sign. Up to the 300 m station, the school buses that ran the stop sign had higher speeds than the school
buses that stopped. However, the average speeds of school buses that stopped were higher than the average
speeds of school buses that ran the stop sign at the 400 m and 500 m stations.
The results of the statistical analysis of the stopped and running school buses are shown in Table 6.
Since the statistical analysis showed significant differences between the mean speeds of the two groups at
the 100 m and the 200 m stations, data from those school buses that ran the stop signs were deleted from
the 100 and 200 m station columns during the subsequent "comparison tests".
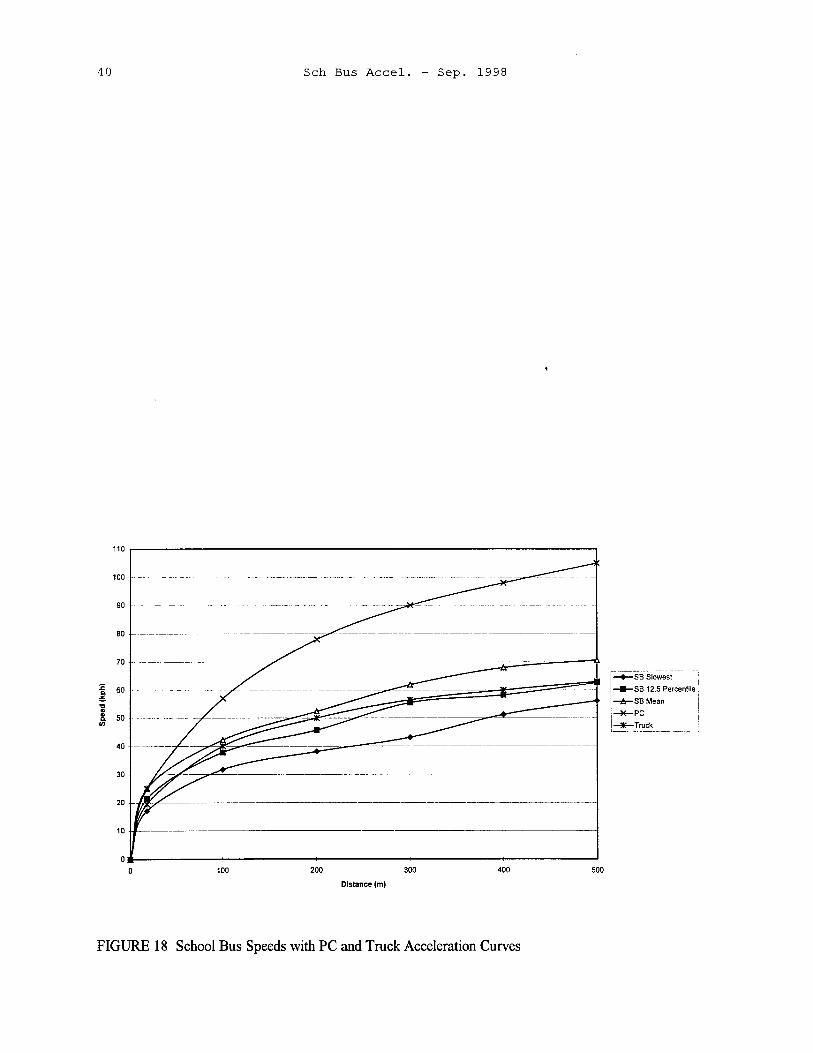
Figure 18 showed the slowest, 12.5 percentile, and the average school bus speeds for the turning
buses on level terrain, along with the passenger car and truck (300 lb/hp) acceleration curves from the 1994
Green Book (AASHTO, 1994). The slope of the average speed plot between the 100 m and 500 m stations
is almost a straight line. This again points out the school buses' tendency toward constant acceleration
after passing 100 m station. Note that the 12.5 percentile school bus curve was very similar to the truck
curve.

Sch Bus Accel. - Sep. 1998
80 ,------------------------------~
70
60 - --- - -- ---- ---
50
30
20
10
0-------------------------------------1 0 100 200 300 400 500
Distance (m)
FIGURE 17 Mean Speeds for School Buses Stopping and Running the Stop Sign
39
I ~avg run speed
L---avg stop speed !
TABLE 6 Analysis of Mean Speeds of Buses That Ran the Stop Sign and Those That Stopped
Mean Speed Standard
(km/h) Deviation
Distance (m) Run Stop Run Stop n t-stat t-crit
18 26.1 25.7 3.13 3.36 125 0.59 1. 67
100 45.3 43.3 4.54 4.57 82 1. 89 1. 68
200 56.1 53.4 5.45 5.81 81 2.06 1. 68
300 62.7 62.2 8.41 4.87 65 0.26 1. 69
400 67.4 70.6 8.94 6.32 27 1.05 1. 72
500 70.2 72. 7 8.22 6.14 28 0.91 1. 71
40 Sch Bus Accel. - Sep. 1998
110
100
90
80
70
:c 60 CL ,!!. ,, " 8. 50 .,
40
30
20
10
0
0 100 200 300 400
Distance (m)
FIGURE 18 School Bus Speeds with PC and Truck Acceleration Curves
500
--.-ss Slowest I
---SB 12.5 Percentile
-i!r-SB Mean
--M-PC
-¼-Truck

Sch Bus Accel. - Sep. 1998 41
Figure 19 was based data in Appendix D under the column heading "Calculated Times from
Speeds". The travel times between each pair of successive stations were added to derive the cumulative
times for acceleration. Most of the individual times were calculated from data collected during the same
day of testing. The travel times between the 200 m and 300 m stations were based on data from different
days, since due to the limited number of classifiers that were available for field work, data was collected
between the 18 and 200 m stations on different days than the data between the 300 and 500 m.
u ., .!?. .. E i=
01:00.0 ,--------------------------------.
00:50.0
00:40.0
!i 00:30.0 ·--- ----------· --
~ ., ;; u u <
00:10.0 --- -
oo:oo.on--------~-------+------~-----~--------1 0 100 200 300 400 500
Distance (m)
FIGURE 19 School Bus Acceleration Time Against Distance
~
-·· - -· ... ' -+-avg. time i
--12.5 %ile timej -A-max.time -----· -- - --- --

42 Sch Bus Accel. - Sep. 1998
Comparison Tests
The first statistical test compared the mean speeds of the school buses that ran the stop sign with those that
did not. This test was performed first so if any of the test statistic (t-stat) values at the testing stations were
found to be significantly different (t-stat > t-critical), then the speeds of school buses that ran the stop sign
could be removed from the data at that station before conducting statistical analyses of the weight and
power, transmission, and bus engine age.
Weight and Power
Figure 20 showed the mean speeds of those school buses in the top 1/3 and the bottom 1/3 wt/hp ratios.
The differences between the mean speeds ranged from 2.3 km/h at the 18 m station to 5.6 km/h at the 200
m station. At every station, the mean speeds of the top 1/3 wt/hp ratio school buses were higher than the
speeds of the bottom 1/3 wt/hp ratio school buses. The middle 1/3 wt/hp ratio mean school bus speeds fell
between the top and bottom 1/3 wt/hp ratio school bus speeds except at the 300 m station. At the 300 m
station, the middle 1/3 wt/hp mean speed was 62.5 km/h, which was lower than the bottom 1/3 wt/hp ratio
speed of 63 .1 km/h. It is not known why this occurred at this particular station.
The results of the statistical analysis of the mean school bus speeds for the top 1/3 and bottom 1/3
wt/hp ratios are shown in Table 7. The two weight/power groups at the 18 m, 100 m, and 200 m stations
were found to have statistically significant differences between their mean speeds, while there were no
statistically significant differences at the 300 m station. Data were not analyzed at the 400 and 500 m
stations because the sample sizes at these stations were smaller.
Transmission
Figure 21 showed the mean speeds of the buses with standard and automatic transmissions. The
differences in the mean speeds ranged from 3.0 km/h at the 18 m station to 4.2 km/h at the 100 m station.
At every station, the mean speeds of the automatic transmission school buses were higher than the mean
speeds of the standard transmission school buses.
Table 8 presents the comparison by transmission type. Significant differences between the mean
speeds of the buses with standard and automatic transmissions were found at the 18 m, 100 m, 200 m, and
300 m stations. Data were not included for the 400 and 500 m stations due to the small sample sizes.
Age
Figure 22 showed the mean speeds of the oldest 1/3 and newest 1/3 school bus engine ages. The
differences in the mean speeds ranged from 2.4 km/h at the 18 m station to 6.1 km/h at the 300 m station.
At every station, the mean speeds of the newest 1/3 school bus engine ages were higher than the mean
speeds of the lowest 1/3 school bus engine ages.
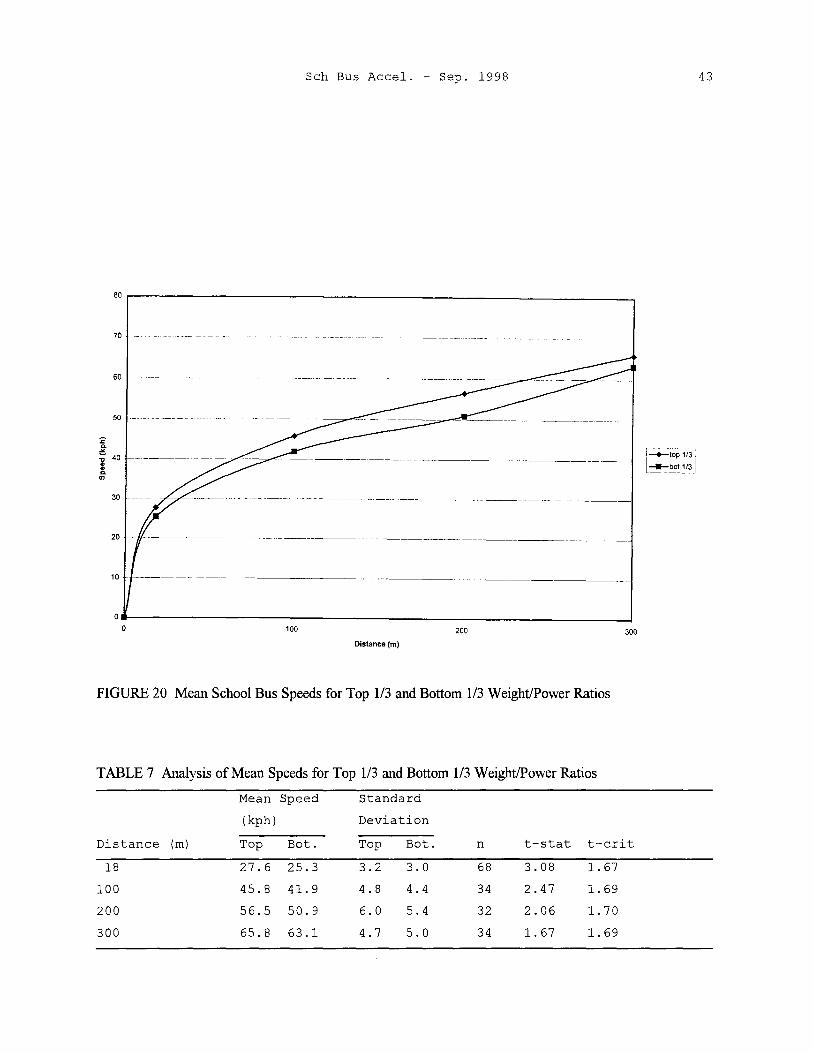
Sch Bus Accel. - Sep. 1998
80 ,-------------------------------~
:i:' ll. ...
70 ...
:;; 40 I: ll.
"'
20
10
o-------------+-------------,--------------! o 100 200 300
Distance (m)
FIGURE 20 Mean School Bus Speeds for Top 1/3 and Bottom 1/3 Weight/Power Ratios
TABLE 7 Analysis of Mean Speeds for Top 1/3 and Bottom 1/3 Weight/Power Ratios
Mean Speed Standard
(kph) Deviation
Distance (ml Top Bot. Top Bot. n t-stat t-crit
18 27.6 25.3 3.2 3.0 68 3.08 1.67
100 45.8 41. 9 4.8 4.4 34 2.47 1. 69
200 56.5 50.9 6.0 5.4 32 2.06 1. 70
300 65.8 63.1 4.7 5.0 34 1. 67 1. 69
43
I, --top 1/3 .
--II-:" _!:?I !13 _I

44 Sch Bus Accel. - Sep. 1998
50
:i: C. ... :; 40 .. .. C.
i~stdspeed
I ~auto speed i "'
30
20
10
0
0 100 200 300
distance (m)
FIGURE 21 Mean School Bus Speeds for Standard and Automatic Transmissions
TABLE 8 Analysis of Mean Speeds for Standard and Automatic Transmissions
Mean Speed Standard
(km/h} Deviation
Distance (m} Std Auto Std Auto n t-stat t-crit
18 23.3 26.3 2.9 3.1 171 6.64 1. 65
100 40.3 44.5 3.3 4.5 103 5.33 1. 66
200 50.6 54.4 3.8 6.1 102 3. 72 1. 67
300 60.0 64.0 5.7 6.1 77 2. 96 1.67
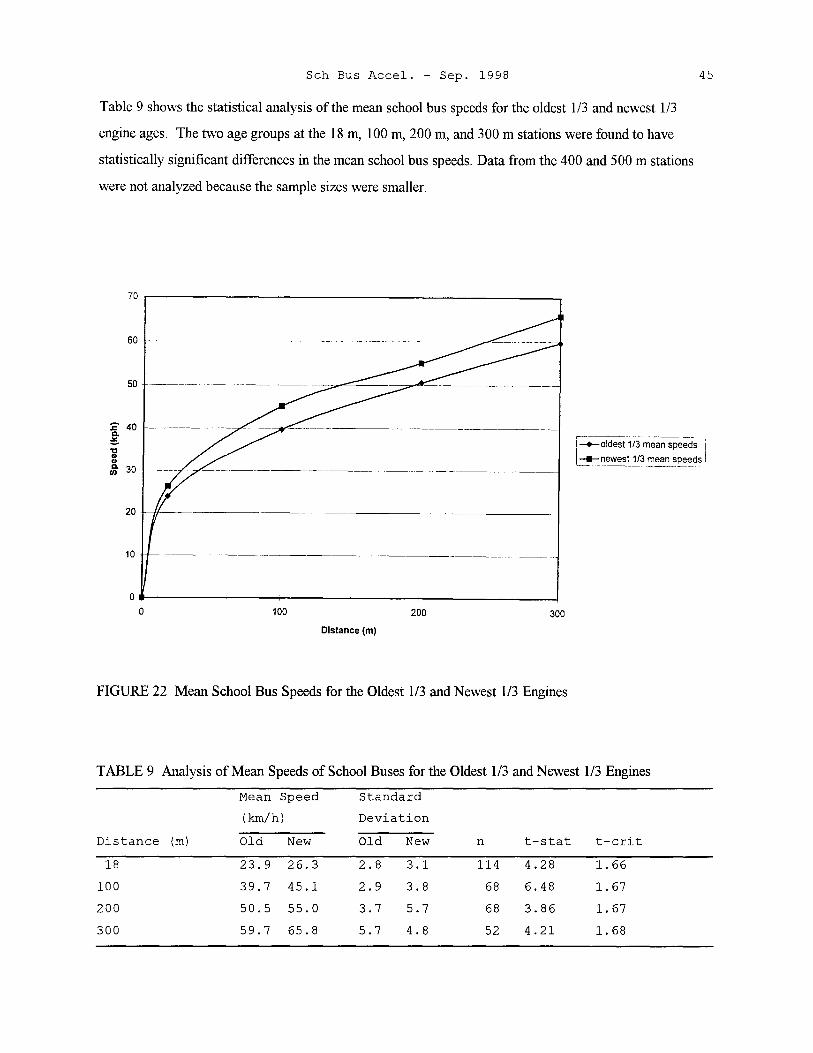
Sch Bus Accel. - Sep. 1998
Table 9 shows the statistical analysis of the mean school bus speeds for the oldest 1/3 and newest 1/3
engine ages. The two age groups at the 18 m, 100 m, 200 m, and 300 m stations were found to have
statistically significant differences in the mean school bus speeds. Data from the 400 and 500 m stations
were not analyzed because the sample sizes were smaller.
70 ,--------------------------~
60 ·
50 --~-···
45
:C- 40 ,.___ __ Cl. ~ ,, .. .. /Ji 30
i-+-oldest1/3 mean spe;ds i
l::!--newest 1 /3 mean speeds I -·- .. --··-·-------------,
20
10 ++-------------------------
0.----------,---------+--------~ 0 100 200 300
Distance (m)
FIGURE 22 Mean School Bus Speeds for the Oldest 1/3 and Newest 1/3 Engines
TABLE 9 Analysis of Mean Speeds of School Buses for the Oldest 1/3 and Newest 1/3 Engines
Mean Speed Standard
(km/h) Deviation
Distance (m) Old New Old New n t-stat t-crit
18 23.9 26.3 2.8 3.1 114 4.28 1. 66
100 39.7 45.1 2.9 3.8 68 6.48 1. 67
200 50.5 55.0 3.7 5.7 68 3.86 1. 67
300 59.7 65.8 5.7 4.8 52 4.21 1. 68

46 Sch Bus Accel. - Sep. 1998
12.5 Percentile School Bus Speeds, Distances, and Travel Times
The 12.5 percentile school bus speeds were determined by performing a "bootstrapping" procedure. The
procedure consisted of taking one speed out of the sample size "n" (at the particular testing station) and
then placing it back into the sample. This was done "n" times to get one iteration. The speeds were
averaged to get a mean speed for the iteration. This procedure was repeated 500 times at each testing
station to get the 12.5 percentile speeds at each station. Table 10 listed the 12.5 percentile speeds for the
mean school bus speeds at common confidence intervals.
TABLEl0 Statistical Analysis of 12.5 Percentile School Bus Speeds
12.5 Percentile Speed Confidence Interval
Distance (m) 2.5% 5.0% 10.0% 50.0% 90.0% 95.0% 97.5%
18 21.10 21.14 21.44 22.20 22.91 23.00 23.18
100 37.80 37.80 37.80 38.90 40.20 40.20 40.53
200 45.07 45.10 45.70 46.83 48.40 48.61 48.90
300 54.40 54.40 55.50 56.60 58.10 58.76 59.10
400 56.60 56.60 58.23 65.88 68.89 69.40 70.41
500 59.50 59.50 62. 60 67.39 69.80 70.03 70.70
The lower 10% confidence interval speeds were selected for design purposes. The values were
analyzed to determine a "best fit curve" that best represented these speed values. With x as distance (m)
and y as speed (km/h), the equation generated for this curve was:
1n y = 2.12994 + 0.324306 1n X (4-4)
This equation was only valid for distances between 18 and 500 m. Table 11 showed the 12.5 percentile
speeds (at the 10% confidence interval) generated from the speed data, the 12.5 percentile speeds (at the
10% confidence interval) calculated from equation 4-4, and the individual and cumulative acceleration
times from the speeds calculated from equation 4-4. The school bus speeds and travel times furnished by
North Carolina (Table 3) were "quicker" than these 12.5 percentile, 10% confidence interval values in
Table 11.
Figure 23 showed the 12.5 percentile speed/time/distance information. These are the school bus
acceleration times that should be used for calculating intersection sight distance values.
Figure 24 showed the speed/time/distance curves for the 12.5 percentile school buses compared with
the PC, SU, and WB-15 design vehicle curves.

Sch Bus Accel. - Sep. 1998
TABLE 11 School Bus 12.5 Percentile Speeds and Acceleration Times
School Bus
12.5 %ile Speed @ 10% CI
(kph)
12.5 %ile Speed per Eq 4-4
Acceleration Time
Cumulative Accel.
00:50.0
00:45.0 ·
00:40.0
u Cl)
.!!!. 00:35.0 Cl)
! 00 30.0 ·----- _i ------C
~ E Cl) .; 00:25.0 - .
u u < ., 00:20.0
~ :i 00:15.0 E :::, 0
00:10.0
00:05.0
00:00.0
0 100
Time
(kph)
(sec)
i r--
(sec)
!
I
- I-
200
Distance (m)
0 m 18 m 100 m 200 m
0 21. 4 37.8 45.7
0 21. 5 37.5 46.9
6.0 10.0 8.5
0 6.0 16.1 24.6
I
300 400
Distance (m)
7.2
500
FIGURE 23 Final 12.5 Percentile School Bus Cumulative Acceleration Times
47
300 m 400 m 500 m
55.5 58.2 62.6
53.5 58.7 63.1
6.4 5.9
31. 8 38.2 44.1
r-----·--------- ---- - ..... . l-+-12.5 ¾ile Accelerati~n_!ime]

48
20
18
16
u 14 ., .!!. GI E j::
12
C
~ 10 E GI .; u u < 8
6
4
2 10 15 20 25
Sch Bus Accel. - Sep. 1998
-- ------ - ·----------
30 35
Distance (m)
40 45 50 55 60
j-+-PC acceleration time
; --su acceleration time
l-¼-WB-15 acceleration time
L~12.5 ¾ile School Bus Acceleration Time I
FIGURE 24 Cumulative Acceleration Times for PC, SU, WB-15, and 12.5 Percentile School Bus
A regression analysis was performed to fit a predictive curve between time and distance. With x as
distance traveled from a stopped position (meters), the equation
y = 0.06 J x 2 + 612.46x (4-5)
predicts y, the elapsed travel time (seconds) from the stopped position. This equation was constructed with
data from up to 500 m from the stopped position, and had a R2=0.99.
Sch Bus Accel. - Sep. 1998
APPL YING THESE FINDINGS
The following two example problems illustrate the use of these findings.
Intersection Sight Distance Sample Calculation
Suppose a school bus needs to cross a 30 m wide highway. The speed limit on the highway is 90 km/h.
How much intersection sight distance is needed along the highway?
49
The first step is to find the total distance S. The distance S is the sum of three distances; D, W, and
L. In this case, D is assumed to be 3. 0 m and L = 12 .192 m (CMSU). The given width-of-highway from
near side to far edge, 30 m, equals W.
S=D+W+L= 3.0m+30.0m+l2.192m =45.192m
The next step is to find t. from Figure 23 (using a distance of 45 .192 m), which is approximately
9.9 seconds. Alternatively, the time required for the school bus to traverse the distance S could be
calculated by means of Equation 4-5.
y = 0.06 J x 2 + 612.46x
With x = 45 .192 m, y = 10 .3 sec. The calculated value is slightly larger than the value found by reading
the graph.
The last step is to calculate the needed intersection sight distance measured along the through
highway. Using Equation 2-1:
d = 0.28 V (J + t.) = 0.28 (90) (2.0 + 10.3) = 311 m
The needed intersection sight distance for the school bus to cross the entire highway in one maneuver is 311
m.
Example Railroad Crossing Problem
Suppose a school bus has stopped at a railroad crossing. A train is approaching this crossing at 60 km/h.
What is the distance up the railroad track for which if the train were any closer, the school bus driver may
not see the oncoming train in time to get across (i.e., how much sight distance is needed)?
The length of the school bus, L, is equal to 12.2 m. The value for D, the clearance distance back
from the railroad tracks, is assumed to be 4.5 m. The track width, W, of a single-line railroad is assumed
to be 1.5 m. The distance traveled by the school bus while crossing the tracks is:
dsB= L +2D +W = 12.2 + 2*4.5 + 1.5 = 22.7 m
This is analogous to the distance S for crossing the through highway.
Again, use Equation 4-5 to find the time needed by the school bus to travel that distance, 7.2 sec.
y = 0.06 J x 2 + 612.46x
50 Sch Bus Accel. - Sep. 1998
The distance traveled by the train during this time is:
dr =Yr* (J + t.) = 60 kph* (2.0 s + 7.2 s) = 16.67 mis* 9.2 s = 153 m
The needed sight distance along the railroad track for this particular situation is 153 m.
Sch Bus Accel. - Sep. 1998 51
CHAPTERS
CONCLUSION AND RECOMMENDATIONS
Intersection sight distance is a significant parameter in the geometric design of streets and highways.
Intersection sight distance design values are affected by the speed of the vehicle approaching on the through
roadway, the side street vehicle's acceleration capability, and the type of maneuver (e.g., crossing, turning
left, etc.) that the side street vehicle is performing.
In order to ascertain sight distance needs at intersections and at railroad grade crossings, research
was conducted to determine the acceleration characteristics of school buses. Traffic classifiers and road
tubes were used at seven testing sites to collect speed, time, and distance data for school buses as they
accelerated from a stopped position at a side street or a railroad grade crossing. This data was collected at
a distance up to 500 m from the initial stopped position. Most of the tests were conducted on level terrain.
Speed and time data were recorded for type C and type D full-size school buses. The total number
of school bus speeds available at each station (Appendix D) were: 171 at 18 m, 129 at 100 m, 127 at 200
m, 77 at 3 00 m, 3 5 at 400 m, and 3 6 at 5 00 m. The measured speeds ranged between 17 .1-3 3. 3 kph at 18
m, 31.7-53.9 kph at 100 m, 38.1-67.6 kph at 200 m, 43.1-72.1 kph at 300 m, 51.2-79.3 kph at 400 m, and
56.2-82.2 kph at 500 m.
A number of analyses were performed. The data were first analyzed for any significant differences
between the mean speeds of school buses that had come to a full stop before accelerating with those that
ran the stop sign. There were significant differences at the 100 and 200 m stations, so the speed data for
those running the stop were removed from the analysis before determining the 12.5 percentile speeds.
The mean school bus speeds for the top 1/3 and the bottom 1/3 weight/power ratios were compared.
There were significant differences between the speeds at the 18, 100, and 200 m stations. The 300 m
speeds showed no significant differences. Due to the smaller sample sizes, comparisons were not made at
the 400 and 500 m stations. At each station, the top 1/3 wt/hp school bus speeds were higher than the
bottom 1/3 wt/hp school bus speeds.
The mean speeds were compared for school buses having standard and automatic transmissions.
There were significant differences at each of the stations (18-300 m; the 400 m and 500 m sample sizes
were smaller). The automatic transmission school bus mean speeds were higher than the standard
transmission school bus speeds at each of the testing stations.
The mean speeds of the school buses with the oldest 1/3 and newest 1/3 engines were compared.
The speeds of buses with the newest 1/3 of the engines were significantly higher than those with the oldest
1/3 engines at each of the 18 to 300 m testing stations. Due to the smaller sample sizes, comparisons were

52 Sch Bus Accel. - Sep. 1998
not made at the 400 and 500 m stations.
The speed data were analyzed to estimate the 12.5 percentile school bus speeds. From these speeds,
the lower 10th percentile confidence interval 12.5 percentile speeds were found. Finally, the research
produced
1. an equation to estimate school bus speed achieved at a certain distance after accelerating from a
stop;
2. a graph to estimate the time it takes a school bus to travel a certain distance after accelerating from a
stop; and
3. an equation to estimate the time it takes a school bus to travel a certain distance after accelerating
from a stop.
By combining the knowledge of how quickly a school bus can accelerate with assumed speeds of oncoming
through street vehicles, the needed intersection sight distance can be calculated. Another application of the
findings is analyzing departure sight distance at railroad grade crossings used by school buses.

Sch Bus Accel. - Sep. 1998
REFERENCES
AASHTO. A Policy on Geometric Design of Highways and Streets. Washington, D. C., 1984
AASHTO. A Policy on Geometric Design of Highways and Streets. Washington, D. C., 1994.
Bhesania, Russi P. Need For Adequate Intersection Sight Distance in Roadway Design. ITE Journal,
Vol. 58, No. 8, August 1988. pp 43-45.
Central Missouri State University. 1995 National Standards For School Buses. The Twelfth National
Conference on School Transportation. Warrensburg, Missouri, 1995. p 19.
Ching, P.Y., and F.D. Rooney. Truck Speeds on Grades in California. California DOT, Sacramento,
California, June 1979.
Fancher, P.S. Vehicle Acceleration Characteristics Influencing Highway Design, Appendix F. NCHRP
Report No. 270, 1984, pp 146-169.
Gillespie, Thomas D. Methods For Predicting Truck Speed Loss On Grades. Transportation Research
Institute, University of Michigan, Ann Arbor, Michigan, November 1985.
53
U.S. Bureau of the Census. 1977 Census of Transportation. U.S. Department of Commerce, Washington,
D. C., 1977.

54 Sch Bus Accel. - Sep. 1998
this page left blank

Appendix A 55
APPENDIX A -- Survey Sent to States
SURVEY OF GEOMETRIC DESIGN INFORMATION FOR "FULL-SIZE" SCHOOL BUSES please respond with checkmarks or short answers
YES NO 1. Do you have any of the following geometric data for "full-size" school bus design vehicles?
□ □ vehicle dimensions (body length, width, overall height, wheelbase, overhang, etc.)
□ □ inner and outer turning radius at either crawl or normal turning speeds
□ □ acceleration capabilities (time, speed, distance covered) when departing from a stopped position at an intersection, as would be used to determine intersection sight distance
□ □ acceleration capabilities (speed, distance vs. grade) for school buses going up grades
□ □ school bus braking distances □ □ software to generate school bus vehicle turning paths
If you responded "yes" to software, please tell us the name of the software.
IF YOU HAVE ANY OF THE ABOVE GEOMETRIC DESIGN DATA FOR SCHOOL BUSES, PLEASE SEND ME A COPY OF IT
2. Do you use attributes (dimensions, turning path) of another design vehicle to "come close to" (i.e., as a surrogate for) an actual school bus?
□ no □ yes, use AASHTO "Green Book" BUS vehicle when a school bus
design vehicle is needed □ yes, use ... (please state what you use)
========================================--====----==-------------Your name Your
address
Phone number
Title
Fax number
PLEASE MAIL YOUR SURVEY, WITH ANY ENCLOSURES, TO
J. L. Gattis Mack-Blackwell Transportation Center 41 90 Bell Engineering Center Fayetteville, AR 72701 thank you for your help THE END

56 Appendix B
APPENDIXB School Bus Information Provided by the School District District Bus# GVW (lb) Trans Year Engine Size HP Rating Elkins 12 23,160 std 1980 366 cu in. 190
8 23,660 std 84 366 cu in. 190 11 27,800 auto 92
1 23,660 auto 81 366 cu in. 190 4 27,800 auto 90
Huntsville 15 19,000 std 88 366 cu in. 34 22,000 std 88 366 cu in. 39 22,000 std 90 366 cu in. 44 22,000 auto 90 8.2 L diesel 57 22,000 auto 95 175 Cat 175 30 22,000 std 88 366 v/8 gas
Greenwood 9 27,000 std 89 370 cu in gas 26 33,080 auto 95 230 cu in dsl 23 33,080 auto 96 230 cu in dsl
1 25,580 auto 89 366 cu in gas 2 28,000 auto 89 429 cu in gas 232
11 26,500 std 87 370 cu in gas 22 26,500 std 87 370 cu in gas 28 33,080 auto 95 230 cu in dsl 29 33,080 auto 96 230 cu in dsl 17 25,580 auto 97 366 cu in gas
3 27,000 std 89 370 cu in gas 21 23,660 std 86 366 cu in gas
McDnld Co. 45 27,800 auto 92 Cummins Turbo 190 49 27,800 auto 95 Cummins Turbo 190 37 27,080 std 89 8.2 L Cummins 150 46 27,800 auto 94 Cummins Turbo 190
1 28,000 std 89 8.2 L Cummins 150 2 22,000 std 90 8.2 L Cummins 150
41 27,080 std 88 8.2 L Cummins 150 6 27,080 std 90 8.2 L Cummins 150
32 27,500 std 91 7.3 L 155 25 27,500 std 91 7.3 L 155 51 27,960 auto 96 3116 Cat 185 43 31,000 auto 93 466 cu in. 190
3 27,080 std 88 8.2 L Cummins 150 52 27,960 auto 96 3116 Cat 185 50 27,800 auto 95 Cummins Turbo 190 35 32,220 auto 91 Cummins Turbo 190 27 27,500 std 91 7.3 L 155 47 27,800 auto 95 Cummins Turbo 190 48 27,800 auto 95 Cummins Turbo 190 10 27,080 std 90 8.2 L Cummins 150
Alma 19 36,000 auto 92 3116 Cat 250 2 34,000 auto 84 3208 Cat 210
28 36,000 auto 92 3116 Cat 250 10 34,000 auto 84 3208 Cat 210 12 36,000 auto 88 3208 Cat 210 14 36,000 auto 92 3116 Cat 250 27 34,000 auto 81 3208 Cat 210 21 36,000 auto 92 3116 Cat 250 25 36,000 auto 92 3116 Cat 250

Appendix B 57
7 34,000 auto 88 3208 Cat 210 1 34,000 auto 86 3208 Cat 210
17 34,000 auto 86 3208 Cat 210 9 36,000 auto 92 3116 Cat 250
24 36,000 auto 92 3116 Cat 250 5 34,000 auto 84 3208 Cat 210
26 24,000 std 79 366 cu in 225 29 36,000 auto 92 3116 Cat 250
8 34,000 auto 84 3208 Cat 210 11 36,000 auto 92 3116 Cat 250 18 36,000 auto 92 3116 Cat 250 23 36,000 auto 92 3116 Cat 250
6 36,000 auto 92 3116 Cat 250 20 24,000 std 79 350 cu in 175 15 24,000 std 80 350 cu in 175
Washburn 8 24,500 std 84 366 cu in 190 11 25,580 std 88 366 cu in 190
5 27,800 auto 91 6cyl 190 2 25,000 std 86 366 cu in 190 6 25,580 std 88 366 cu in 190
18 29,800 auto 95 DT 466 20 29,800 auto 96 DT 466
Waldron 31 23,960 std 90 366 cu in 190 12 25,160 std 86 370 cu in 14 23,960 std 87 366 cu in 190 15 28,000 auto 95 190 47 26,500 auto 92 190 21 26,500 auto 93 190
1 23,160 std 83 366 cu in 190 46 26,500 auto 92 190 26 23,960 std 89 366 cu in 190 16 28,000 auto 95 190 18 26,500 auto 93 190
9 25,160 std 85 366 cu in 190 8 25,160 std 85 366 cu in 190
17 28,960 auto 95 190 19 26,500 auto 93 190 29 23,960 std 90 366 cu in 190 13 23,960 std 87 366 cu in 190 39 27,060 std 81 165 27 23,960 std 89 366 cu in 190
4 25,160 std 84 366 cu in 190 5 25,160 std 84 366 cu in 190
30 23,960 std 90 366 cu in 190 6 25,160 std 90 366 cu in 190
48 26,500 auto 92 190 28 23,960 std 89 366 cu in 190 22 30,000 auto 93 190 45 30,000 auto 91 190 40 27,060 std 81 165 20 23,960 std 87 366 cu in 190 10 25,160 std 86 366 cu in 190 44 27,800 auto 91 190

58
APPENDIX C Raw Data Collected at Each Testing Site

18m ' !IOOm I -- ~- ---------------------------~--+---+-----+----+-----------• _ _ ___ _ __ Q:-_1_~11 _____ --=----:~Sp~e_ed_I _lrti_m_e_l ___ ,_+----t'----+------+!~Sp~e_ed_I -t-ti_m_e_l_~--------l
Tunes ,Bus# i(km./hr.) , : (km./hr.) , Elkins !S 12 19.8 17:32.2: Elkins
1 12 42.5 17:42.21
_--2~-17-/97 ___ --------,-iS=-------8-,--c-cl8::-.5c-+1--,--l8::-:ccl3---,.2:-.i--, -e-i --+l-2,..,/-17-/9,--7'! ___ 8+------,-36-,--.2--,---18_:_25 __ __,l!--------l
J_5m _________ S ______ l_l .-i __ 2_4_.9+1 _1_8_:3_8_.2+· ___.1 _ __,_i_,_1_05_._6m_-+--' ___ !_! 1----4_9_.2+-_1_8_:4_6_.7+i _____ ____,
S JI 18.3 18:48.41 i I i , I 38.9 18:59.4 s : 4i 22.21 19:07.61 4 38.6 t9:ts.0I
I I I I ! ----------c+c---------+---+---:---1-----+----l-----t----+---------I Elkins 5.03!S , 121 26.41 17:08.21 i
2/18/97 5.08!S Bl 231 17:13.9! 18m I 5.0IIS II' 24.91 17:39.21 --------5-.2-6-:S-----,-' ---!-, ---18-.8-+--17-:4-,--6-.8ct1--,-! -t-, -,----+1---+----1-----,1---------1
5.551S 4' 21-2! 18:05.9 1
------- --------+-----+----+-----+----+--+---+-----------+-----+-------I i i i
Elkins ---·
2i25/97 iDK I I
!DK i ! i
! DK ' i I i i ' i
--------+iD-K-+-----+,,-----1-j---+--+--1 ---1-+----+----+-----+---+--------l
IDK i I I I
I I I I i Elkins DK I 121 24.5 15:29.3 Elkins 1 12 38_9 15:37.3
2/27/97 i DK I 81 25.1 16:10.1 I 2/27/97 8 43.1 16:18.0 !Sm DK j II' 26.1 16:37.0 I 105.60m II 44.7 16:43.9
DK I 41 22.7 17:05.4 ! 4 38 17:13.5 ,DK 24.3 17:10.3 41.4 17:17.7
i Elkins 5.98S, 12: 24.5 15:45.7, :
3/3/97 4.13 S i 81 24.1 15:52.9 i 5.2!S I I I,
-----------4-_-,-,97:t-R---t:---44 ,---2-21---l--,-6:-07-_-4 .--+--+, ---1-----,--------'----+---t-,, ---------1 18m 23.8 16:00.7 , I
6.631S I I' 21.4! 16:21.6 I I
I i !DK ! I
--3/-4/_9_7_, ____ i_D_K-----'----+------+, ---+,-----,-ctl-+-----+-i' ---+------+---+-----------1 Elkins
DK ! IDK : i ! DK I ' i :
I I i ' I I I i I
Huntsville 1DK 1 23.8 26:49.0 I Huntsville 15 38.1 26:55.3 3/7/97 4.34 S ! 34 i 17.9 29:28.2 i i 3n/97 34 38.1 29:35 .2
15m 4.05IS 39 17 .4 29:34.3' ' 96m 39 32 29:43.1 3.86iR i 441 23.3 30:16.7 i I 44 43.8 30:22.7
57: 26.7 31:00.3 i : 57 47.2 31:05.4 4.071R 20 31:49.8 i 30 39.6 31:57.8
' ' Huntsville 4.37 R I 15 1 25.41 26:24.1 i 1 15 41.4 26:34.0
3/10/97 4.0SIR I 34; 20.9' 29:00.8 , 34 47.5 29:11.0 __________ 4_.3_1-i-R---+i---3-9+i--2-,--l-.4ct
1i--29_:_I0-.8-+---+-t---+,---+---3::-::9+-----:-42::-t----::-29::-:-=-21::-.,.,l--------1
4.76 R ' 44 ! 25.1 i 29:55.4 i 1 44 46.7 30:05.0 4.4 R I 57, 22.7 30:39.4 1 57 48.3 30:49.2
4.79!R 1 30i 20.6 31:18.4 i ! 30 40.7 31:30.0
: i Huntsville ' DK : I
3/11/97: DK I : i
IDK i I I i iDK i I
!DK I ! iDK I I
-·-------~.::.__-i--------i-1, ---!--, --,--+--+------11----+---t-----+--------1
~ville DK ! I I
__ 3/_1_~9~7 ____ __;1.::D_:_:K'-----!i----+----1------+--+l-+--+-------llf-__ --t-___ t--__ -+-------l !DK ! i I i iDK i : I
DK I
-------~D::_:K_:___i-1 ___ .;_ __ ---J-i ___ +'-t-' -----l-+-----+---+------i----t-------1 : i I i I i

Huntsville ----·--- DK I Huntsville I 15 i 38: 24:08.4'
3/31/97 DK I ! I 3/31/971 .. 34 15.4: 27:57.1 •• #34 drove slow --·---------- --,DK : I i96m ; ••39 23 I 28:07.5 for no reason and -- - ------- ---1DK I 44 42i 28:46.5 kept #39 from --- .. - - ------
--- !DK I i 57 48.41 29: I 8.4 accelerating --- - -----
,DK ' 30 44.4 29:47.81
- -------- -~----: i ' ' -----
Huntsville ;DK i i i Huntsville i 15 I 43.3 25:55.31 4/2/97 IDK ' I ' 4/2/97 34 39.9 27:52.4
-· IDK ' :
' i I I 96m 39 37 28:01.8 1DK ! i I I 44 47.6 28:34.8; !DK : :
' i i 57 47.2 29:32.5
1DK ' : ! : 30 38.5 30:25.8 ; ' I ' I I I I I I i I I i
Gre~;_,ood IDK ! 91 21.4 09:07.5 1 I Greenwd 9 40.91 09:17.61 3/17/97' DK ! 261 24.8 09:23.7 I I I 3/17/97 26 44.61 09:32.2 1
18m DK i 23 24.8 09:35.5 i 100m 23 47.8 09:43.8 DK I 24.5 09:44.4 i I 46.7 09:53.01 DK ! 2 25.9 09:49.1 I 2 48.9 09:57.2
--· DK I II 23.3 09:56.6 I II 44.3 10:06.0
. DK I 22 22.5 10:40.9 I 22 41.5 10:50.7 DK i 28' 22.9 1 10:51.7 i 28 43.1 11:00.7 DK : 29 26.1 10:55.6 I I ••29 48.8 11:03.6 <3sec. headway.
IDK ! 17 23.5 11:11.8 17 45.7 11:20.3 IDK : 3 29.3 11:15.1 I
I 3 39.1 11:24.0 DK i 21 i 24.9 11:26.7 i I 21 41.8 11:35.5
I : ! : Greenwood' 4.21S 9 22.9 08:17.4 i Greenwd : 9 38.5 08:25.7
3/19/97: 3.861S 26 24.8 08:23.0, 3/19/97 26 43.9 08:29.1 18m 5.82 S I 23 24.8 08:54.4 i I 100m 23 47 09:01.0
5.93 S I 25.7 09:05.9 I 47.3 09:12.3 3.61 S I 2 26.9 09:10.9 I 2 48 09:17.2 1
4.91 S ' II 22.91 09:17.5 i I I : 11 38.3 09:25.1 i 5.461S i 221 23.5i 09:32.I : I 22 38.9 09:39.1 4.59IR I 281 23.8 09:38.4 I I I 28 43 09:45.5 6.21 IS 291 24.5 i 09:49.7
' ; 29 46.2 09:56.4 1
4.02IR 171 28.2 09:53.0i : ; ••17 i 47 09:59.I <3sec. headway. 5.331S ' 3 22.2 10:08.5, ; 3 36.5 10:16.8 4.61S I 21 ! 25.41 10:32.4 21 I 42.3 10:39.5
' i I I ; I
I I I !
McDnld IR 45i 31.5 15:44.3 McDonld 45 50.2 15:51.4 1
18m R I 491 27.2 15:48.4 3/20/97 49 50.7 15:55.0 3/20/97 R 37 25.4 15:52.4 100m 37 46.8 16:00.3
R i 461 26.2 15:59.5 I 46 50 16:07.2
IR I I 25.1 16:02.7 I 44.4 16:11.3 -
R 27 25.71 16:11.1 I 27 43.3 16:19.0
1R ••41 I ••classifier combined 41 43.6 16:27.2
IR I 61 ! #41 and #6. ••6 45.7 16:29.0 <3sec. headway
R i 321 25.7 16:34.3 32 45.7 16:42.3
IR 25 1 22.5i 16:38.3 i 25 45.4 16:47.1
!R 51 I 25.9 1 16:44.0 ! i 51 44.3 16:52.2 --~--~--43 30.6 16:47.6 ' ••43 48.3 16:55.2 <3sec. headway IR ' '
IR 3: 24.8 16:56.3 I ! 3 43.3 17:05.2
IR : 52 29.6i 17:03.9 52 51.2 17:11.1 I
IR 501 30.1 17:12.0 I I 50 53.9 17:18.2 -
IR 351 26.1 17:19.2 35 48.6 17:27.1
I ' : ' I

McDonld 'DK -_-_-3_i2~9_?__~ -- ---::D:-::K-:--+--------------,-----------------'-----,------------1
DK ---- -------:D-K-------------+---------------+-, ----+-----------------1
:DK
---~----- ___ !D __ K _____________ +------'----------+--'-------'i'------''----------l :DK I i i
iDK ! I : : : --·--------~-- -------+------------+---------+-----+------+-----------1 'DK I I ! I I I !
__________ -ID_K _____ , ___ ---t-'---~'-----'----+'----+----· -+i----+'--------< :DK , ,
!DK IDK ! i
[DK , iDK 1
1 : , --- ----------'------i'-------1-----+----+----'-------,--+----------+-----+----f-------------1 iDK : I !
-------1-----ID_K---+--------+------'--'-+-------+-----+-----1, ___ __,1 _______ _,
McDonld 5.761S 3/24/97, 4.15 S
18m 5.421S 4.94 S
4.32 S
4.41 S 4.94 S
5.04 S
5.28 S 5.24 S 4.53 S 5.43 S 4.78 S
4.54 S 6.881S 4.271S
5.7iS
I i I l l
45 I 49i
37:
46
I Ii 34
I 271
41
: 6
32 ; 25
51 43 i
3 I
52' 501 35
27.41
29.3
23
29.3
25.6
30.1
27.5 27.2
23.3 24
27.8,
30.91
31.7 1
281 29.6 33.3
301
15:19.21 15:25.71
15:32.9
15:39.4
15:45.5 15:52.1'
15:59.7
16:07.5
16:15.8 16:28.3 16:35.1 16:43.3 16:50.3
16:57.0 17:07.81 17:14.21 17:21.8
I i
McDonld 1 45 48.3 15:24.2 3/24/97 ! 49 46.8 15:30.2
ilOOm 37 48.3 15:39.1
I 46 50.2 15:45.0
41.4 15:52.4
34 47.6 }5;57.7 I
i 27 44.7 16:06.2
I 41 40.2 16:14.1
I 6 43 16:22.2 32 44.3 16:34.7 25 45.9 16:41.51
i 51 51 16:48.4
i 43 50 16:55.4
I I 45.5 17:03.0 52 48.I 17:13.3: 50 54.1 17:18.2 35 50.2 17:27.3 : -------------+--------+----+--------------+-----+-----+---------f
: i McDonld 5.541S ' I
4/14/97, 6.03iS I
18m 5.89IS : i I
5.78IS ~-----------------+-----+----+------t-+-----;-----+-----+------------f
6.31S I
5.831S i , I I i ~-----+---+-------+-----+----+---+----+----+-------+------t-----+----------, 5.52 S ; : I 5.93 S i I I i
5.37\S 4.641S i 5.42[S I :
5.9_S I ! I
5.76 S ! I I
5.45 IS ,-------5.4lS 1 , i I : --- ------s·-.8-7-'--1s----'-----+-----+-----,-----+-+-------,-,-----+-----+--------r--------;
i
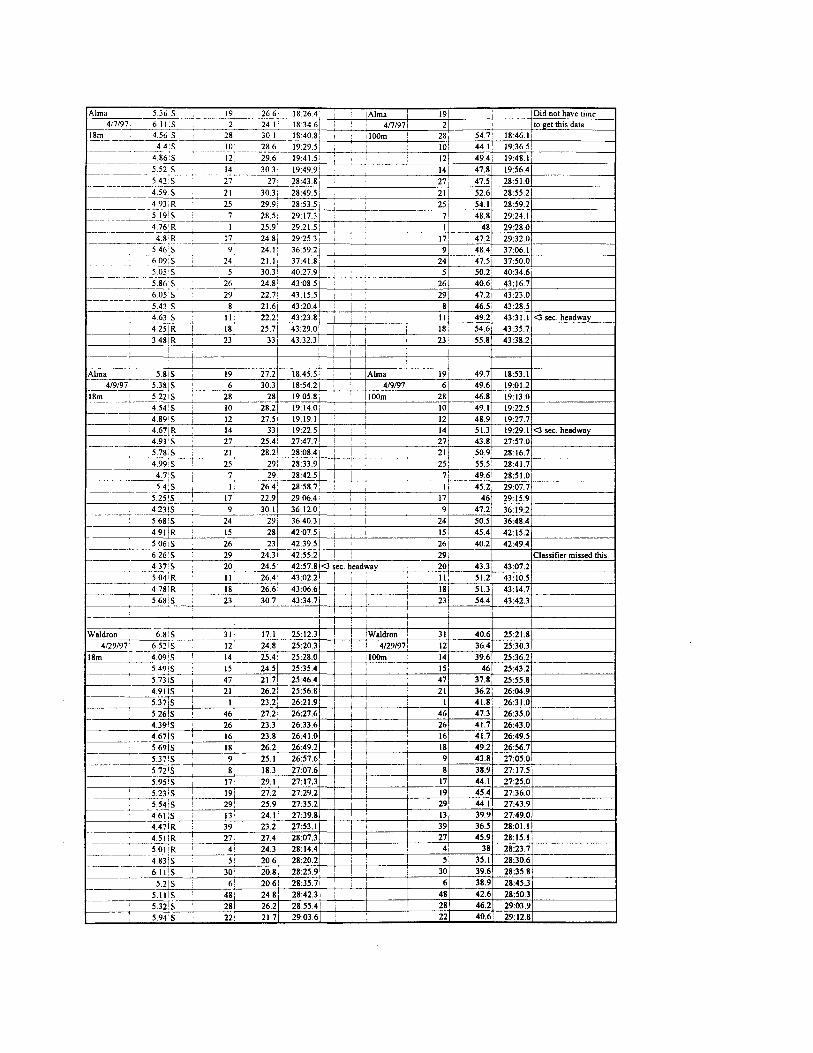
Alma 5.36 S 19 26.6· 18:26.4' !Alma i 191 Did not have time 4/7/97 6 11 :s 2 24 I: 18:34.6 , 4/7/971 2 to get this data
~ ______ 4_.--56---,.S ____ , __ 2_8 ___ 3_0_._1 ! __ 1_8:_40_._8,...1, _1_-i--+'' '-=00'-'m"'--+-I ---'2'-8+1 ___ 54_._7f--_18_:,...46_.71 f-----------l 4 4'S 10 28.6 19:29.5 1 IOI 44.1 19:36.5 ------ ---:-:-c--------~----+-----+--------,----,---,+---:---:---t--------j
~----- 4.86:S 12 29.6 19:41.51 12 49.4 19:48.1 --=5-=.5c-2-s-----,,...4----,-30.,.. . .,.3-. -,-9-,4-9.-9+-! ---,-+-----",---,4+---4-=1-=.8+--,-,-9.-=_5..,.6_-4+--------{
----- --- --,,-,---:---------,--+-----+--+----+-----j----+---c--+----:---+--------1 ·-----··---·-5 __ 4--2_:s-____ 21-+-___ 2_1.,...· _2_8_:4_3_.8-+'-----+----+'---2_1!--__ 4_7_.5+-_2_8_:5....,1_.o-+---------1 ______ 4 __ .5c9 ____ .s _ __,. ___ 2_1 ___ 3_0_.3+-i_2_8_:4_9._5,_;' --+'-+--+----+---2_1+-__ 5_2_.6+-_2_8_:5_5._2j---------t
4 93; R 25, 29.9, 28:53.5 i I I 25 i 54.1 28:59.2 5.J9!S 7 28.5: 29:17.3 1 I 1 71 48.8 29:24.1 ------~-----::-------------.,-----+-!---t--"----+----,------+---+--------1 4 76'.R I 25.9' 29:21.5 1 I ' I 48 29:28.0 ----· ----..,.---+--------,.,.--..,.----,----,-----,----,--+----,-----+----t----,---+----+--------1
4.8 1 R I 7 24.8 i 29:25.3 i i 17 47.2 29:32.0 5.46 'S 9, 24.1 i 36:59.2 j 9 48.4 37:06.1 ---- -•---------------+------+-+----..----+----+------+----+---------i 6 091S i 24 21.1, 37:41.8: , , j 24 47.5 37:50.0 ---- - ---·-~------,-----+---~f--+---+----+----=--t----+--'-'-"-'-'-+--------j 5.05 · s 5, 30.3 i 40:21_91 ! 5 50.2 40:34.6 ·
-- -----------------,.----+---+---+----+-----'-----t-----J--------j 5.86!S 26 24.8 1 43:08.5 : : 261 40.6 43:16.7
·-----•- ---6-.0-5+-1 s-----29-,---2-2--.7.,...1' _4_3_: ,-5-.5-+--i -+-; -,----+,---2-9+---4--1-.2+--4-3-,2-3-.0-+--------1
5.43,S 8 1 21.6 43:20.4 ' i I 1 8 46.5 43:28.5 4631S , lli 22.2' 43:23.8' I I II 49.2 43:3 I.I <3 sec. headway
4.25 IR 1 18 25.7 43:29.0 I I I 18 54.6 43:35.7 3.481R I 23 i 33 43:32.3 23 55.8 43:38.2
I ! ! I
Alma 5.81S , 191 27.2 18:45.51 i Alma ! 19 49.7 18:53.1 4/9/97 5.381S ' 6! 30.3 18:54.2 I : 4/9/97 6 49.6 19:01.2
18m 5.221S 281 28 19:05.8 llOOm 28 46.8 19:13.0
__ ._---; __ 4_.5_4~:_s_-+-___ ,_o,_· __ 2_8_.2~1 __ 19_:_14_.o-+---+--+--i_,.__ ___ ,_' ___ ,_o+--__ 4_9_.71 __ 19_:2_2_.5-+---------.
i 4.891S , 12i 27.51 19:19.1 ' 1 I i 12 48.9 19:27.7 4.67IR 14: 331 19:22.S 1 1 I 14 51.3 19:29.1 <3sec.headway
4.91 !S 271 25.4 27:47.71 I ! , 27 43.8 27:57.0
______ .~ __ s_.7-=8-'!s'----i-' ___ 2=-1'"1 __ -=2_8._2+-1 _2_8_:0_8_.4+--+1 -1--l-+! ___ -+i __ --=.2-'-1 f----'s_o_.9+--'2-=8'-': '-=6'-'.1+--------1 4.99:S I 25i 291 28:33.9 i i ! 25! 55.5 28:41.7 4.7:S i 7, 29, 28:42.SI I I ! 1 71 49.6 28:51.0 5.4/S I Ii 26.4 28:58.7' : / 1· 45.2 29:07.7
5.251S 1 17! 22.9 29:06.41 1 i , I 17 46 29:15.9 4.231S 9! 30.1 i 36:12.01 1 I 1 9 47.2 36:19.2 5.681S 241 29' 36:40.3 ! i 24 50.S 36:48.4 4.91 ;R 15' 281 42:07.51 1 I IS, 45.4 42:15.2 S 06: S 26' 23 42:39.S I 1 , 261 40.2 42:49.4 626'S 29: 24.31 42:55.21 I I ' 29, 4.37!S 201 24.5: 42:57.81<3 ~cc. head~ay I 20 43.3 43:07.2
Classifier missed this.
5 04 1 R ll i 26.4 i 43 :02.2 , I ll ! 51.2 43: 10.5 4.78IR 181 26.6 43:06.6 I ! 18' 51.3 43:14.7 5.681S 231 30.7i 43:34.7 I I I 23 54.4 43:42.3
I '. I
I I i
Waldron 6.81S 31 1 17.11 25:12.3 ! ! Waldron 31 40.6 25:21.8 4/29/97 6.521S 12 1 24.8: 25:20.3 ! I I 4/29/97, 12 36.4 25:30.3
40915 , _____ _ 5.49!S
18m 14 2s.4 1 25:28.0 : I 100m 14 39.6 25:36.2 15 24.5 25:35.4 i 15 46 25:43.2
5.731S 47! 21.7 25:46.4 i 47 37.8 25:55.8 4.91 IS 21 1 26.2! 25:56.8 I 21 36.2 26:04.9 5.371S II 23.2 26:21.9 i 1 1 I 41.8 26:31.0 5261S 461 27.2 26:27.6 I 1 46 47.3 26:35.0 4.39 1S 261 23.3 26:33.6 I 26 41.7 26:43.0 4.671S 161 23.8 26:41.0 I , 1 16 41.7 26:49.S 5.691S l81 26.2 26:49.2 1 i 18 49.2 26:56.7 5.371S 91 25.1- 26:57.6 ! ' [ 9 43.8 27:05.0
8 [ 18.3 27:07.6 I j 8 38.9 27:17.5 5.951S 17! 29.1 27:17.3 I I I 17 44.1 27:25.0 5.231S ' 191 27.2 27:29.2 ! ! 19 45.4 27:36.0
------5.-54:S i 29; 25.9 27:35.2 I I 29 44.1 27:43.9 : 4.61:S 13• 24.1 27:39.8 I 13 39.9 27:49.0
.. _____ ..c.4·:....4.:...7c.:.I R:___,_ __ ....c3:....9_,.: __ .cc23:....·.cc21--..c2:....7_:5_3_. l.,___-+---+l-+l ---+-----39=+-__ 3-=6-=.5+--2-8_:0_l._l+-------; 4.51 IR 1 27. 27.4 28:07.3' I I 27 45.9 28:15.1 5.01 IR I 41 24.3 28:14.4 I 1 4 38 28:23.7 4 83 IS 5 ! 20.6, 28:20.2 i 5 35.1 28:30.6
··---·----6-.1-1-i'! s=---,---30~--2-0-.8+--2cc8c-:2"5,..._9+--+-.--1-+----r---::3ccot---3=-=9--_6=+--2=-=8c-:3cc5cc.8+---------1
5.21S 6! 20.6 28:35.7 ' , 6 38.9 28:45.3 5.1 I IS ! 48' 24.8 28:42.3 i I i 48 42.6 28:50.3 5.32!S 281 26.2 28:55.4 i 28 46.2 29:03.9 5.941S 22; 21.7 29:03,6 1 1 22 40.6 29:12.8

\Valdron 31 1 Wald --4/J0/97-- - - -- - ------:4:-5------'-:...c_,----=-:c.:..:c..c_, _ _j_, --+----'-=4'-'13"''°:::o~'------1,---=--__..:.:=e-==-=+---------l ----- --- --------:-':-----='---------===--=-1----i-----~--===:+-----"'__:----=='--t----"=='----'-f--------l 18m 14 1 JOOm = ----~ ::_:_-_____::__ :--------15·----~---____;__="-----'-I _ _;___:_c.::_c::.:...__-+-------'--''-------='-'-----+-----"'==--r---------l
17 9 24:38 4 18.5' 25:03 o, 20.6 25:10.5 22 4 25:19.3:
3 I 1 40.71 2449 5 I
45 31.7, 25 16 4
14 36 41 25.22.3
15, 41.7 i 25:29.7
-------=2~8 ___ __:_::c.::___==:._______: ________ ______,:.'.'.;_ __ =::+-------=-==L--------~ 21 --------:4Q::--_---=c---'--:-----'==:.,..--_:__j__,__;___ ___ f-_ ______,"--l.. __ _:_:_:_::+--=-=~--------l
-------c2-o=-----------i------;---'-----'-, ------'----__..:.::...-----=:....:.._+-=-==+-------------l -~-----cc::----------=--=,-----=:.::.:.c_==,.---,--...)__--_;_-------=:+---___.::.:4__-'C:'..:.C..'..::'.-J---------l
46, , ;
18 8 25 31.9'
25 I 25:38.81
17.41 25:50 4 i 24.3 I 25.56.21 26.1, 26:03.0
28, 34.41 25:44.51
21: 47.21 25:48 4
40 34 8 26·02.6 1
20 38.5 26:07.0
461 44.6' 26:12.6
26 I i ------~,:-6---=-='-----=--=----=-:~--l.i-:._____~,----1--:---=-+--=+----=-==+-----------l -------~----+----+--------l----+---'---'------+---___:_:+---__ ___:_:+--____::o=~_:_-------l
18: , I ----------'-:-----==c.:.+------=.::.c..:..:"c-+---+-.L.--'-----'----------'--~--=➔--:::=+--------l
---~------c9 ___ ____;___+----L--l_:__L-:---,, ___ ~----=+----'-'-"+___:==+----------l __ ____;__ __ ---:-:;8+--------=--=-=t---='-c-'-:-'-'--'-L---+~---+------"+--=+---=-:.=:..'.-J-----------l
17 I -------~--~--+------+-----+--+-------+------'--'--+---=-=+---===+---------------l 19
21.4' 26 20.9'
24.8 i 26:27.6 i
22.7 i 26:40 61
23.2 26 44.7
21.2! 26:5l.4i
24 8 i 27:00.1 i
22 7, 27:07.9
26i 36.9 26:32.4
161 42 26:37.0
18! 45.4 26:50.0
91 41.8 26:55.1
8i 37.8 21:02.1 I 171 39.1 27:10.5
19• 42 27:18.2 29, 25 4 27:12.21 29• 41 27:22.2
13: 20.3 I 27:16.6 1 ! 131 40.6 27:28.0
IO 23.81 27 48.2 I IO! 42.3 27:59.6 39' 23 5, 27:52.0' 39' 36 28:02.2 ----27' 27.5 1 28:17.3 : 27 39.6 28:28.2
4' 20! 28:29.7 i I ! 4 34.4 28:41.9
t 5 · 19.3 28:34.8 5 37.5 28:46.8 30: 19.2 2844.3. I 30 34.8 28:56.5 6] ·18.2 28:52.5 I I 6 37 29:04.2
48, 22 7, 29.03.2 ! ! I 48 41.7 29:13.0 --------·
23.51 29:06.6: ; 44 42 29:16.2 ------22 23.3: 29:14.3 I i 22 45.2 29:24.3
: i ' I I ---~-Waldron 5 55IS 31: ! i
5/21/97 4 36IS 45: I 5 I iS ! 14, i : I
5.73 IS 15: : : i 5 26IS ! : ' '
5.631S I 21, I i 5.71R I 40 : I '
4.31S 20 ' I : I
4.841S I 46- ! ' I I
5.27 1S 26 I i 5.271S
' 16: : I '
4.41S 18 : 4.73·S : I I l
---4.831R 8' I ! 5.44'S I I i 5.681S 19 I
' I ----
5.1 :R I I I --··--·-
5.381R 13 i I i ------i5:"47!S 10 : I
5.25:s 39 :
5 45 :s ' 27 : : 4 8iS 41 ;
5.78 'S i : I 6.51 :s 30: I I
4.71,S I 11 1 I I ! 5.461 S : 481 I
!
4.25!S 44 I I 4.481S I I I I
i I i
Washburn 6 1,S 8, 16.91 17:26.4 i -Washburn 8 34.1 17:36.3
--~1~_7 ____ 6::.__::_3~iS'----------'-------'1--:1c>-_ ____:=:+-------'-==+-+--,--+---'::..:.:=+----'--'+------==+------'--'=~L---------l _I!'!'_ _______ 4 5'S 5
14.8 17:58.0 i I 5/16/97 111 38.3 18:08.S
29.6 18:10.4 ' I ,toom 5: 48.8 18:16.3
RRXING 4.2,S 2' --- - - ------'-'="-":.____---i----____.:::-------='7+------'-'~-'=+--+-+---+------+------'=-+--~=--=-+-__:_:::.=.::::.i----------l _______ 4.3:c.l-=S---'--___ 6__,1 __ ____:==+-------'--'----',,-t-'-----+--+---+----"-+---------=+---:===+---------1 _______ ----·-c4~0 :__::S:._____-'--__ --:1c:8_._
1 _ _:~=+-----'-=-'-=:-:'-'c+-+-1--+--------l-------'-=+-----'=+...:..:::==+--,------,-=--------l
4.51S 20, - . ----- --------'--=--+----'--'-----;----==+-----------+-----l-----1----+----+--=+----+---------,==='----'-=--------1
26.2 18:20.8 ; I 2 45.1 18:27.8
21.2 18:34.3 i I 6 40.5 18:43.1
26.5 18:44.7 18 46.2 18:51.2
27.2 18:56.2 : I 20 classifier error
! I ' I i -----------c------'-----'-----,--'--,-------'------:-:-,----'----,,-:-'----'-----'-----,-,---,---i----+----+---+-------l • Elkins School Bus Measurements taken at 18 m, 105.60 m, 200 m, 300 m, 400 m, 500 m
[ Bus # I slowed to make a ston, that is why data is missing at the 300m, 400m, and 500m points.
*Huntsville School Bus Measurements taken at 15 m, 96 m, 205 m, 300 m, 385 m, 500 m. i : Bus #30 second day data is missing at 300m, 400m, and 500m because bus stopped.
•Greenwood School Bus Measurements taken at 18 m, 100 m, 200 m. 1 i
•McDonald County School Bus Measurements taken at 18 m, J 00 m, 200 m, 300 m, 400 m, 500 m. I Bus #s 32, 25, 51, 43, 3, 52, SO, and 35 slowed down around 300 m to turn right
• Alma data for I OOm and 200m on 4n/97 and 4/10/97 will be thrown out because the grade may have an influence on the school bus oerformance
*WaJdron bus #4 slowed down to make a tum. T I I I : ! 1
'Washburn data is for school buses stoccina on the roadwav before crossing RR tracks, ie. straiaht line acceleration test!

200 m 1 300 m 1 ----- ------:c:.c.._"'---,----------'------+---------'---+-----,-----+::,=--:-~,-----+:---,----t----+---1 -~--- ____________ Sc,p,~e.c_ed=---=--1 _ _.c' •:.:::im:::e=---=--1 _____ _____,_, _____ _____,_: -----i------+=S,__pe'--'e-'-d_l_--+-ti_m_e_l _ __,_+-------+--t ___________________ (-'-k_m_./:::hr:::.)'------+-------'-------<----'---------,-"(k:::m:::._/hr_.~l-----, ___ _____,
1_+ 1' ----+-------, -- - --------- ----------'-----------'---4------+-----+'-----+-----+'-,-, ----+--f
: I -------------------------------'-,----+-----+----+i------+-----+-t-------,'-----1 -- ----------- ----·------4---------+-------+-----+-----+-------+------+-------,------i----l ----------------,----------t-------4---------,'--------j-------,-+----i-------+---t
!
Elkins 12 58.6i 17:25.2 I i i 2/18/97 53.81 17:32.21 ! i
200m II. 58.9: 17:55.01 ; ; I I I 48.9; 18:07.0! I
47: 18:25.0j••Bus slowed to make stop. ; ! I
-,--,-E-lk-in_s_-----,1 ____ 12-+----5-8-.6-+---,-6-: 1-9-.5-+-----+-----+-------<
! 2/25/97 8 60.7 16:27.1 -------1-i ----+,-----,------+3-0_0_m __ f----l-l+--------,-63-,-.-,-;7 16:30.7
-----', I 54.4 16:40.S
~-----------------+--------,--t---------,,---,--•• -,-4-,---+---3=-=3cc_3--+--l,-:7-,--:0:-:9-.3+-••c-:B~us-s-to_p_pe_d-,--. ----+-! --t
i i I I j
!
i I I
I I i ! I i
i I ', i i I
I
I i I
i i I i
I ----------------------------+------+------+-----+-----+-t-------+-----1 I
Elkins 12' 5341 15:53.5 I Elkins 12 60.4 16:00.8 I 3/4/97 8 50.4: 16: 12.41 . 3/4/97 8 , 58.J 16:19.0
200m II' 48.2! 16:20.2 300m II 56.8 16:28.0 I 4i 47.61 16:33.91 4 54.1 16:42.0
44.4i 16:49.3 .. Bus slowed to stop. 34.4 16:59.1 .. Bus slowed to stop. I
i I
Huntsville 15' 45.7 27:07_7, I I j
3/7/97 34 53.3! 29:47.0 ! I
205m 41.41 29:56.7' 441 56.6: 30:33.71 i !
31:16.01 I
30: 50.9' 32:09.31
Huntsville 15 52' 26:42.8 I
3/10/97 34' 54. I: 29:20.4 -20_5_m ________ 3_9+--: ---5J-+l--'-2-9-:2-9-.2+------J------+-, --+----1------t--------+----+--i, ---+----t-----1
441 58.11 30:12.9 51: 61.3! 30:56 5i ' i 30; 47.21 31:38.7 i
---------------------'----I---+-----+----+----+----~'---+'----+-~ ! Huntsville 15 63.4 27:01.8 !
! 3/11/97 34 59.7 29:49.7· 300m 39 47.5 30:27.0
I 44 70.5 30:39.6 57 68.2 31:29.5 I 30 54.4 33:01.9
i Huntsville ! 15 59.7 26:24.8
I i 3/12/97 34 65.8 28:45.9 300m
I 39 52.3 29:09. 9
----------------+'----t'------'---------+I ----+I -----=4=4t-----:-::-5::-0t---=-29::-:':-28=-.-=-8t-+-----+---I 57 67.3 30:40.3
.. 30 40.7 31 :33.3 ••Bus slowed to stop.
: I

Huntsville 15 47.5 24 17.9 I Huntsville 15: 55 8] 24:25.8 ---------· -3/31/97 "34 34.9 28.11.2: •• #34 drove slow I 3/31/97. ••34 : 46.31 28:2 LI' .. #34 drove slow ------ ----
205m .. 39 38.6 28: I 9.7 I for no reason and 1300m ••39 43.31 28:29.4 for no reason and --------44 46.3 28:54.1 lkept #39 from 44 1 48.4 1 29:03.5 kept #39 from ·-----· .. 57 61.8 29:25.2 I accelerating I 57: 68.9 29:31.8 laccelerating 30 48.3. 29 55 5 t I ••30 39.9' 30:04.7l**Slowed to stop. ~------
------- I I I
Huntsville 15 55.5 26.03.JI Huntsville •• 15 49.6 1 26:09.01 ••s1owed for no : --------4/2/97: 28:07.4 'apparent reason 412/97 34, 48 9: 28 00.81 I 34 55.2 --
205m 391 47.8, 28: 10.91 I 300m I 39 53.4 28:17.7
44: 56.8. 28:41.1: 44 57.8 28:48.0 57; 60 1: 29:39.5 I : I 57 67.1 29:45.0 ------30 1 49.71 30:33.0i . ! "30 I 43.5 30:41.5 .. Slowed to stop.
I I ~-
I I I i Greenwd 9: 49.2! 09:26.1 i I I :
t -------···----09:39.71 :
t 3/17/97 26! 57.5 I I I I ---200m 23: 59.7' 09.50.8 I !
I ~ 57.1: 10:00.1: I I
I I I i I
z! 59.21 10:04.1 : I ! i ; 111 53.4: 10:13.6: I I I
I I ..
22 48.81 10:58.8 i I
28: 55.4i 11:08.3 : I I I i
••29 56.6 I 11:10.7 <3sec. headway. : : i 17, 55.7 1 J J:27.8i I i : i ~---·-· 3' 501 11:32.6: I t : I
21; 53 91 11 :43.4 I I i : ! I I i : I '
Greenwd 91 soi 08:35,6i ' I
3/19/97 26! 54.4i 08:39.11 ! I I ! i I
200m n: 60.5: 09:09.5 I I ' I i I I
I 57.9: 09:2 LI i I I
2: 58.3 ! 09:25.8 I ! I
11, 46.3 1 09:36.2 i I -------22 50 09:50.1 1 I i !
28 54.6 1 09:54.8: : : i : I --29; 58.1 10:05.2' I I I
•• 17 57.3 1
10:08.0 i <3sec. headway. I : i I
3 47.6: 10 27.1 !
21. 53.4i 10:49.0, I ; : ----··
~--·-·- I : I
i i ! :
McDonld 451 62, 15:57.31 : I I I
3/20/97 49! 64.7: 16:01.S: I I I I
---200m 37 59.1, 16:06.71 : i I I :
46, 62.8i 16:13.0i I I I ! I I I I ; I, 59.2, 16:17.71 : !
27· 50.2' 16:27.1 i I I ! I :
41 55.Si 16:34.81 : I I i !
·•6 55 i 16:36.2 i<3scc. headway ! t
32 56.8! 16:48.81 I : : ! ! -------
53.81 16:53.7: I ' I 25 I
51' 544: 16:58.9: I ! ! I
••43 54 4: l7:0J.Si<3scc. headway I ! -
3, 56.2 17:11.7 1 I I I I -------~
52: 59.5 17:17.11 I ! 50' 67.61 17:24.21 ! I i I I
35 58.6 11:33.ol : : I

McDonld 45 ! 70.3! 15:55.7' ' ' ---~-I 3/211971 49 70.81 16:01.0i ' ----- ---·· ----
' i 1300m 37: 68.6 16· 12.3! ' ----- - -----··----46 72.1 16:16.6' ··---·------- -----
I I 1! 68.9 16:25.5 - ... -----341 67.4 16:31.4' •- -·--------27 63.2' 16:41.2; I --------------
' I 41 63.2 16:50.9' I --
! i 6 65.3 16:57.01 ' : -
i i ~
I 32 60.7 17:09.71
: I I : 25 61.3 17: 19.5i i i ............... ~--: I ' ' 51 61.8 17:25.5
! I 43 65,5 17:32.21
i ' 3 64.4 17:40.6 I 52 62.8 17:47.87 I
I I
i I 50 68.4 17:50.9i I
I : I 35 55.8 18:02.4 ' !
' i '
--r I : '
McDonld 45' 58.4\ 15:33.7 I ! ! i -3124197 491 6l.2i 15:39.3 I I I I
----200m 37' 56.6: 15:48.1 i ! ! I
46: 61.2 1 15:53.2 I I I i ! ' I
1· 45.71 16:03.0 I I i I : :
34, 58.1 I 16:06.4 ! ! I I ! 27' 521 16:15.7, : I
41 52\ 16:24.1 i ' ' !
61 55.2: 16:31.7 I i I
32: 53.41 16:44.1 I I f 25, 52.81 16:51.0 i ' 51' 62.lf 16:56.8_ i I i I
I
: 431 6I.6i 17:03.9 i ! ' : 3i 58.41 17:11.9 i I I
52: 58.3! 17:22.2 1, : I ' ' i 501 66.3: 17:26.9 I
I I I I i I
35: 61.6 1 17:35.6 ! ! I ' ! i ! ' ! : i : ---
! McDonld I 45 67.41 15:33.61 I
I I 4/14197, 49 70.2 15:4o.3T ! i 1300m I 37 69 15:47.4 i ! !
; I 46 71 15:53.6, I ! I I ; I I 61 16:05.1 · I
I
: I i I I 34 60 16:07.7 <3scc. headway I
' : I I I 27 63.6 16:17.4
! : : I 41 59.2 16:26.9 ' '
I I i I 6 67.9 16:30.S i
; I ! : 32 63.1 16:44.5 i i i 25 62 16:49.9 I
' : I I I I SI 64.S 16:SS.I
' i I I i 43 71 17:00.8
: ! ' I ' 3 64.1 17:08.7 ' ' I I 52 76.1 17:16.6 I
-----I ! I 35 67.1 17:26.S
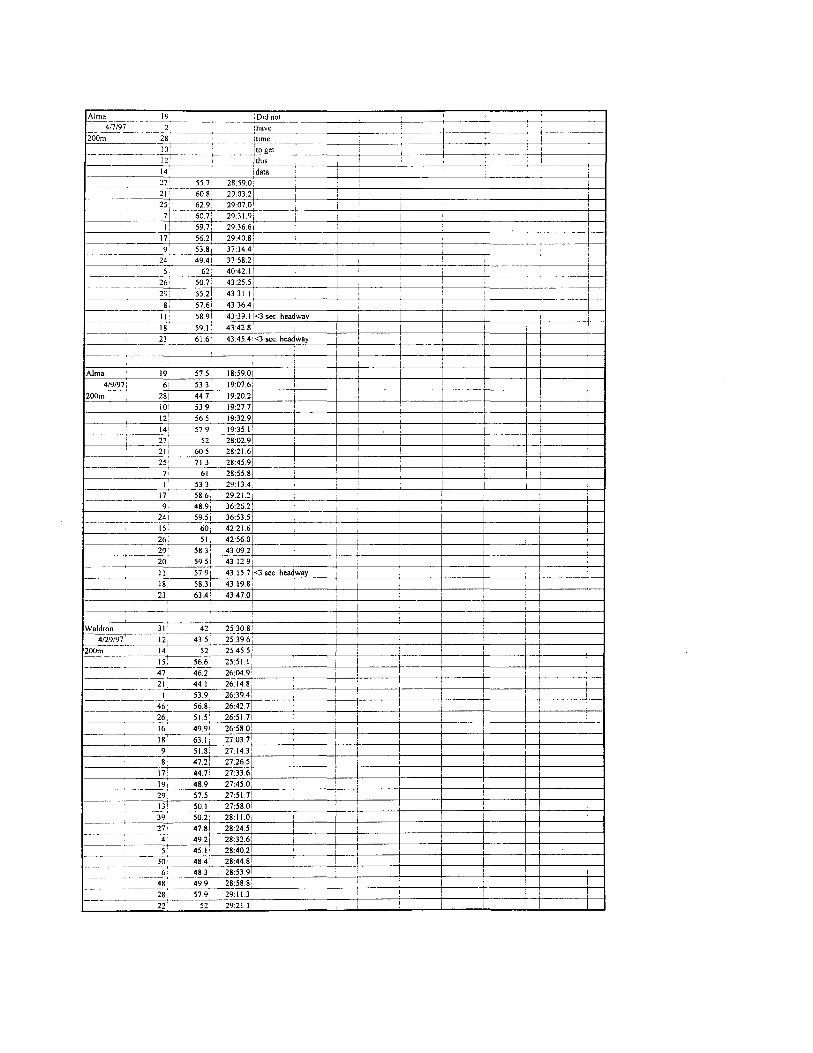
Alma 19 :oid not -~--~•-
4/7/97 I have 200~- ---· . ---2":8-----------1,-im-.----------------f----------+-i ---f--,---j
---------,-' 0-+'-----+----+-'o-cg=•-•-f------+---+----+------,'f-------,-----,--f------+-----t 12' , this , I
14 idata i i i I :
_________ 2 __ 7 ___ 5_5_7_,_: __ 2_8_:5_9._0i-i ----+----+---'-:----+----,---------+1-+-,' ------1
2 I 60 8: 29.03.2 ' i : ! i 25' 629' 29:07.0I I i I !
71 60.7, 29:31.9, i I Ii 59.7i 29:36.61 , ' i
11 56.21 29:40.8, , 1 l !
f--, ________ 9 ___ 5_3._8+--1_37_:_14_.4_,'-----,-----+' --+----+-----+-----+----+:, __,1 ____ -+-----t 24 4941 37·58.21 1 , I 1 5 62 40·42 I I I i j
26• 50.7 43:25.5 i : i - ----- ----------+----+----+-----+---+----+----+-----+----f---+-----+---1 29 55.21 43:31.11 ' ! --- ------------+----------------+-----------+------+-----+---I
Si 57.61 4336.4[ 1 11' 58 91 43:39.1 i<J sec. headway I i ! i ---------------------~--+---+----------+----+----+---+----+---+ 18: 59.11 43:42.8 1 I ! [ , ----------+----+-------------+--+----+-----+-----+------+------+--< 23 i 61.61 43:45.41<3 sec. headway
I
! i Alma 19! 57.5 i 18 59.0 I
4/9/971 6i 53 3 I 19:01.6 200m 28 I 44. 71 19:20.2 i
IOI 53 9 1 19:27 7 12: 565, 19:32.9 I 14! 579: 1935.I, i i 27 52! 28:02.9[ 21, 60.5! 28:21.61 I I
----~ __ 2_5+: ___ 1_1._3+-: __ 28_,4_5_.9__,I ____ __,_ ___ -+--+-----+-' ----+----+----+''__,-----+---1 7, 61: 28:55.8[ ! ! i i
I 53.3! 2913.4 1 I I
17 58.6, 29.21.21 i I 9. 48.9i 36:262, i
_______________ 2_4_! __ 5_9.5 ! 36:53.5 15: 60 42:21.61
: I l
I
26: 51, 42:56 0 i 291 58.3' 43:09.2 i 20, 59.5, 43:12.9, i I
II 57 91 43:15.7 <3 sec. headway i i 18, 58.31 43:19.81 I
23 63.41 43:47.0 ! : ! I i
: ! I Waldron 31' 42 25:30.8!
4/29/97 12: 43.5 25:39,61 ! ! I
200m 14 52' 25455: 15 56.6 25:51.1, • 1 I -·----------------------+--------+---+-----+----+----+------,f--+-----+---1 47 46.2 26:0491 f I ! ' j
________ -~ lc_ ___ 4_:4_:l+' _ _cc2-'-6'-': 1 __ 4.-'-8+-, -----'--+---+---+----+ 1· ----+----+----+--+------1.---l
I 53.91 26:39.4! i 1 ' : ------ 46-,---5-6-.8+,--2-6-,4-2.-7+-----f-----t---+!----+-i---t------,i----t-+-----~,r--l
26, 51.5' 26:51 7i I
,__ ________ , 6_, ____ 49_:,9:_1 __ 2::c6:.:.:5:..C8-'-0'+!----+----+' --+-'---.----+----+ !, ----+' --t----+-----t 18 1 63.1' 27:03.7 1 i ! 9i 51.8: 27:14.3 1 i
I
8; 47.2 i 27:26.5 : 17 1 44 7i 27:33.61 !
19, 48.9! 27:45.0i i
29 57.5 ! 27:51.7 :
13 ! 50.1 ! 27:58.0 I
39' 50.2! 28:11.0, ! 271 47.81 28:24.5! i -------- :,c_;___--'=i-----=-==----1----+--+----+-----+-----+----+--+-----1---1
4 49 21 28:32.6 i 5, 45. 1 I 28:40.2 I
30 48 4 l 28:44,8 I I ... - -------'-'-----":_:_; _ _::_c__--+----+----+---+-----+----+----t-----f--+-----+--J
-~-~- _-_-_-__ - __ .. _4~:~=====:~!~!::==~~~:-~!:.:!'-'•=::, ======:,=======1====,=======:'=======:======~,=======1==:=======~,==~ 28 57.9! 29:llJi 1 1
22 52 29:21.l i i
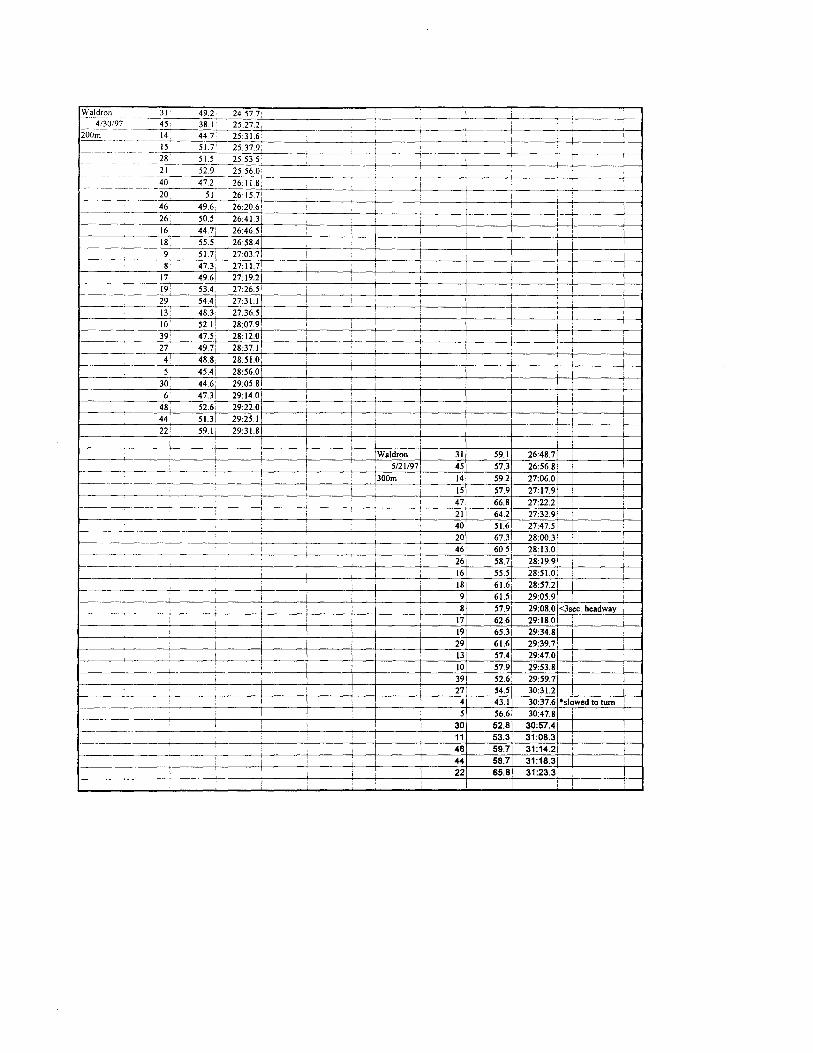
Waldron 31 49.2- 24:57.7• i ~- 4130/97 - 45 38.1 25:27.2, j
200m 14. 44 7, 25:31.6 ' i I --·------ -·
----- -------- 15 51.7: 25:379, I i I i i 28 51.5 25:53.5: I i I
-- - --- - -----21 52.9 25:56.0 --·---------40 47.2 26:11.8: I i --·--··----- ----20 51 26: 15.7 1 i I -----46• 49.6: 26:20.6! I ,, I
26 50.51 26:41.3 i I I i I I i 16: 44.71 26:46.5 I I ! ' I l 18: 55.51 26:58.4 ! i i i i 9, 51.7! 27:03.7, I : I I ' I 8· 4731 27:11.7 : I I ' i !
17- 49.6i 27:19.2 i I I ' ', i
191 53.41 27:26.5 i i I ! I 291 54.4, 27:31.1 I i ' + I i 13; 48.3• 27:36.51 i I i ' I I
10 52.1 I 28:07.9 I I ! ', : : 39i 47.51 28:12.0 ' i i i I
27, 49 71 28:37.1 l ' ' ' I
4' 488! 28:51.0 i ' i ' i 5 45.4 i 28:56.0 : ,,
30, 44.6 1 29:05.8 i I I
6j 47.31 29:14.0 I \ I j I 48; 52.6, 29 22 0 i i i 44: 51.3( 29:25.1 i ', ' ' I 221 59.l ! 29:31.8 i i ' i
I I : i I I i I Waldron I 31 59.1 26:48.7 I
\ ', 5nl/97\ 451 57.3 26:56.8 I : : 300m I 14• 59.2 27:06.0 I : : I I I
I 151 57.9 27:17.9 ! j i 47 66.8 27:22.2.
i 21 I 64.2 27:32.9 I : i 40 51.6 27:47.5
20 67.3. 28:00.3 1 : ' --: I 46 60.5. 28:13.0I --
I 26 58.7 28:19.9 1
-i 16 55.5 28:51.0 :
l 18 61.6 28:57.2 i i ! i : 9 61.5 I 29:05.9 i
i : i 8 57.9 29:08.0 <3sec. headway i : i I I 17 62.6 29:18.0 I i i 19 65.3 29:34.8 i
I I I 29 61.6 29:39.7 i I ', ', i 13 57.4 29:47.0 i : i I i 10 57.9 29:53.8 i : I i I i 39 52.6 29:59.7 I i
I i 27 54.5 30:31.2 I
' I ·, 4 43.l 30:37.6 •slowed to tum I
I 5 56.6 30:47.8 i i ~-
30 52.8 30:57.4 I I i i I : ------: i I 11 53.3 31:08.3 ' ---I : I 48 59.7 31:14.2 I I
' ' I 44 58.7 31:18.3 I
-------; i ! 22 65.8 31:23.3 :
I i ! i

400 m i ------ -- -- ----------------------'-----------___:_::__:__:___:_:_:__ _____ _;_ __ _ _ ________ Speed I .11me I
_____________ ,c__(k_m_.---'/h"-r"-.)-c ___ ___, _____ ,I ---+------'-'==~----'-------+------___ ------------'---------,-~--IL----+l ___ ___;_! ___ __;_ ___ __;_ ___ --i-------
i
1500 m I I Speed I ltime J
l(km./hr.) I i ! i
'1
! i I
i I ' ' : 1 i
: I
I I i I ! I I
i i
I ' I
---- -------I
I ! :
•
i : ' !
-------Elkins •• 12 52.5 I 6:26.0 1 .. Bus slowed down,no apparent reason. I
2/25/97: 8 68.l 1 16:32.21 1 1 i !
------400m II: 70.7 l6:36.2i ; i I
I· 59.2 1 1647.2 1 ! i I I '
••4 I 37_3; 17:40.0 ••Bus leaving stop.
I I I i ! I i I I I :
! i I I ! :
I
' : Elkins 12, 65.5, 16:12.2 i Elkins 12 71 16:16.3
3/3/97i 81 66.ll 16:19.1 1 3/3/97 8 73.2 16:23.3
400m Iii 62.8! 16:28.8 500m II 66.8 16:32.3 4' 58. Ii 16:37.2' i 4 61.6 16:42.0
•• I 36.7' 17:19.2 ••Bus leaving stop. I .. ,
' 47.5 17:26.0 ••Bus leaving stop.
!
i ! 1Elkins 12 69.8 16:10.6 i 3/4/97 8 68.4 16:30.0
i ' 500m II 65.7 16:38.5
4 64.91 16:53.0 I •• I I 46.5 17:36.0 .. Bus leaving stop.
i i i i I I I T i I
I I I I
I I ! I
I I ! I !
I ;
:
i I i i
: i i
' ! i i i 1 ! i ----~
! I ! --
: i I I
Huntsville 15' 65, 27:06.2 i I Huntsville 15 67.6 27:12.8
3/11/97 34 65.7[ 29:54.2 I 3/11/97 34 70.3 30:00.7
385m 39, 51.81 30:32.2 T 5oom 39 56.3 30:41.0
441 75.3! 30:43.6 44 77.2 30:49.3
571 73.7: 31:33.71 i 57 77.7 31:39.4
30: 55.81 33:07.0 30 58.3 33:14.8 ·1
i I I
Huntsville 15 ! 65.3; 26:29.2 i I 15 70.5 26:34.1 i 3/12/97' 341 66.9, 28:52.0 I , 34 70.7 28:57.1
385m 39i 56.21 29:14.9 39 59.5 29:18.9 l 44' 50.5 1 29:35.2 [ ! i I 44 56.2 29:41.1 '
57' 72.4: 30:44.21 I 57. 76 30:48.7 !
••30 23.7: 32: 16.0 ••Bus slowed to stop. 30 I ------
I

McDonld 45 76.6 16:00.0 • McDonld 45' 78.2: 16:04.3i 3/21/97 49 74,4 16:05,6, I 3/21/97• ••49 I 63.7: 16:10.2 Bus slowed to avoid car
400m 371 74.7 16: 16.0i , 500m 37! 76.8 1 16:21.1 turning left in front ofhi 46 79.3' 16:21.0: 461 82.2 16:24.9 i
____________ I_' __ 7_4 ___ .4-4· __ 1_6.cc:2_9.c::c2_;_! ----'--+-', ---:+------'-' +----7-=8-=.2:+-----=l-=-6·'---.3_4._3+----~-----I 34 73.9, 16:35.2 1 i 34 76: 16:40.41
27 70 5; 16:46.0; i 27 73.4i 16:50.71
41: 69 16:55.li , , 41 69.8 17:00.6
6' 73.1: 17:01.1! ' , i 6 76i 17:06.2 ••32 55.51 17:15.3 ••Buses32-35slowed ••32 i 30.9i 17:22.7 ••Buses 32-35 slowed
••2_5_-+-___ 6_0._5 ... ' __ 17_:_24_._I __ d_o_w_n_to_tu~m_n..,·gs,h_t. ___ -i-'--•-•2_5--+---3_7._2+-i __ 1_7:__,3,...I.__,3+-d_o_wn_to_turn-,--n_·g~h_t_. ---l ••51 57.I: 17:31.2: 1 , , ••51 34.8' 17:37.9
••43 61.3, 17:37.4 i i i ••43 28.3 17:44.3 -----·----.-.3~---6-5-.8➔:--,-7-:4-5-.7+1--, -+! -~: ----+---.-.-3--i,---3-9-.14,--,-7-,5-1-.6-+----➔,-----i ~-----.-•-52 ____ 5_9 __ 971' --,-7-,5-3-.0+-I --+--.,.-, -~lr-------'1-------,•-:-•-=-52,,....._:----=3-:-5--,_7-+,--l-7-:5:-::9-::.7+----+----l
McDonld 4/14/97
400m
Waldron 5/21/97'
400m
:
••50 57, 17:55.0 1 : I 1 ••so 21.s t8:03.6 ••35 56.2 ! 18:08.2 1 I i ••35 I 29.8 18: 15.9
45\ 71.81 72.71
37! 74 46: 77.6
11 66.5' 66.6"
68.2 41 i 62.6
61 70.5 57.9
••25 i 63.9 ••51 : 57_9: ••43 68.1' ••3
••50 :
65.5:
31: 63.61 451 58.1 · 14: 15 54.1
64.41
21. 64.5 40, 54.1
67.6i 52.3i
26, 6151 16: 44,41 18! 57.11
9: 61.61 81 59.51
171 61.9 67.9
291 65.21 13! 59.21
56.51 39: 55.3 27, 52.6
4! 5; 60.3
30; 56.2i 11i 55.8! 48,
44' 22i 65.21
I ' I
15:38.01 I
I McDonld \
15:45.3 I ! i 4/14/97 15:52.4 i 500m
15:58.4 16:i0.01 i I 16:13.2 I 16:22.0 i I 16:32.9 16:35.9 <3sec. headway t6:so.1 I 16:55.5 17:0I.O, I I
17:05.2. : I 17:14.21 i 17:21.41 I
17:31.0
26:55.9 27:04 3! 21:13.1 I I
27:25.6 1 i 27:28.9 i 27:39.7 I 27:55.5 i 28:06.7 i
28:20.6 I 28:27.1 i 28:59.1 29:04.6 i 29:13.1 I 29: 15.3 <3sec. headway
29:25.o : I I
29:41.4 I I 29:46.6 ! ! 29:54.4 : 30:01.4
30:07.6 I
30:39.0 i ! I
, •stowed to turn
30:55.2 ! 31:05.3 I i I 31:16.1 ! i 31:21.7 i I 31:25.4 31:30.1
45 76.1 49 73.4 371 77.2
46 81.8-67.4
34 69.5
27 71.61
41 63.1 6 72.4
••32 ••25 ••51
I ••3
••so **35 I i
i
I
I
!
!
!
I I
i
I i I
!
i
i i
I
i

71
APPENDIXD Most Complete Data Including the Information Provided by School Districts
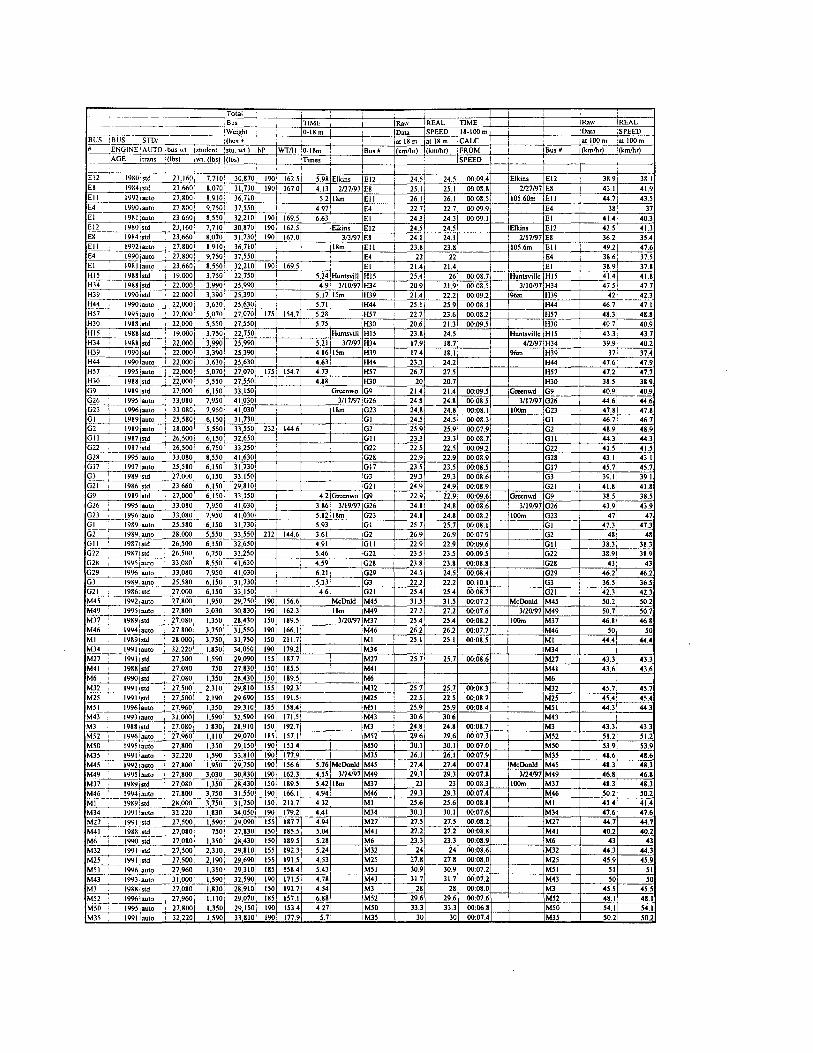
--- Total : ' I ' !Bus TIME --------- I Ra" IREAL TIME I i IRaw !REAL
IWeight 10-l!lm ' Data SPEED 18-IOOm Data ;SPEED BUS !BUS sm1 ;(bus+ ' atl8m at 18 m CALC at IOOm at IOOm • ____ ENGINE 'AUTO -bUS\\1 !student !stu. \\1.) hP WT/H 0-l8m !Bus# (km/hr) (km/hr) FROM Bus# (kmlhr) (km/hr)
AGE 1trans •(lbs) 1M.(lbs) !(lbs) !Times ! SPEED ! ' ! I i I
Ell 1980·std 23,160 7,710 1 30,870• 190' 162.51 5.98 Elkins !Ell 24.5 24.5 00:09.4 Elkins Ell 38.9 38.1 E8 l9K4:std 23,660' 8,070 31,730 1901 1670 4.13 2127/97 E8 ' 25.1 25.1 00:08.8 I 2/27/97 E8 43.1 41.9 Ell 1992 iauto 27,800 8.910 36,710• 5.2 18m Ell 26.1 I 26.1 00:08.5 105.60m Ell 44.7' 43.5 E4 1990:auto 27.800 I 9,750' 37,550i ' 4.97 E4 I 22.71 22.7 00:09.9 E4 ' 38 37 El 1981 iauto 23.660, s.5so: 32,210• 190 169.5 6.63 IE! 24.J 24.3 00:09.1 El 41.4 40.3 Ell l9801std 23,160' 7,710· 30,870 190 162.5 Elkins Ell 24.5 24.5 Elkins Ell 42.5 41.3 ES 19841std 23,660· 8,070i 31,730 190 167.0 l/3/97 E8 24.I 24.1 ]117/97 ES 36.2 35.4 Ell 199llauto 27,800 I 8,910. 36,710 ' 18m Ell 23.8 23.8 105.6m Ell 49.2 47.6 E4 1990iauto 27,S0o: 9,750 1 37,550 ' E4 22 22 E4 38.6' 37.5 El 19&1 !auto 23.660' 8,550, 32,210 1901 169.5 El 21.4 21.4 ' El 38.9! 37.8 Hl5 1988lstd 19.oool 3,750' 22,750 I 5.24 Huntsvill Hl5 25.4, 26 00:08.7 Huntsville H15 41.4 41.8 Hl4 1988lstd 22.000, 3,990' 25,990' 4,9 l/10/97 Hl4 20.9 21.9 00:08.5 3/10/97 Hl4 47.51 47.7 Hl9 1990Istd 22.0001 3,390' 25,390 : 5.17 15m Hl9 21.4 22.2 00:09.2 96m H39 42 42.l H44 l990lauto 22,000' 3,630, 25,630 I 5.71 H44 25.1 25.9 00:08.1 H44 46.7 47.1 H57 1995 iauto ' 22,000' S,0701 27,070 175 154.7 5.28 H57 22.7 23.6 00:08.2 H57 48.ll 48.8 HJO 19881std ' 22.0001 5,5501 27,550 5.15 HJO 20.6 21.l 00:09.5 HJO 40.7: 40.9 H15 l988lstd 19,0001 3,750, 22,750 ! Huntsvill HIS 23.8' 24.5 Huntsville HIS 43Ji 43.7 Hl4 l988istd 22,0001 3,9901 25,990 5.21 Jn/97 Hl4 17.9 18.7 4fl/97 Hl4 39.91 40.2 H39 19901std 22.0001 3,390, 25,390 4.86 15m Hl9 17.4 18.1 96m H39 37 37.4 H44 1990lauto I 22.000i 3,6301 25,630 4.63 H44 23.l 24.2 H44 47.6 47,9 H57 1995lauto i 22,000, 5,0701 27,070 175 154.7 4,73 H57 26.7 27.5 H57 47.2 47.7 HJO 1988lstd 22,000, 5,5501 27,550 i 4.88 HJO 20 20.7 HJO 38.5 38.9 G9 l9891std 27,000! 6,1501 33,150 Grecnwo G9 21.4 21.4 00:09.5 Greenwd G9 40.9 40.9 G26 1995 lauto ' 33,0801 7,950 41,0301 i 3/17/97 G26 24.8 24.8 00:08.5 3/17/97 G26 44.6 44.6 Gll ' 1996\auto 33.080, 7,950 41,030 ' ! 18m G2l 24.8 24.8 00:08.1 IOOrn G23 47.8 47.8 GI ! 1989lauto 25,580' 6,150' 31,730 ,GI 24.5 24.S 00:08.J GI 46.7 46.7 G2 1989iauto ! 28.000 1 5,5501 33,550 232• 144.6 G2 25.9 25.9 00:07.9 G2 48.9 48.9 Gil t987lstd 26,5001 6,150i 32,650 Gil 23.3 23.3 00:08.7 Gil 44.J 44.l G22 1987lstd 26,5001 6,7501 33,250 G22 22.5 22.5 00:09.2 G22 41.5' 41.5 G28 1995!auto ll.080' 8,5501 41,630 G28 22.9 22.9 00:08.9 G28 43.1, 43.1 Gl7 1997iauto 25,580 6,1501 31,730 ' Gl7 23.5 23.5 00:08.5 017 45.7, 45.7 Gl l989!std 27.0001 6,150• 33.150 IGJ 29.3 29.3 00:08.6 GJ 39.1' 39.1 Gll 19861std I 23.6601 6.150: 29,8101 ' Gll I 24.9 24.9 00:08.9 021 41.8! 41.8 G9 l9K9lstd I 27,000, 6.1501 33,150 4.21Grecnwo !G9 22.9 22.9 00:09.6 Gn:cnwd IG9 38,5, 38.5 G26 1995 iauto 33.080• 7,950i 41,030 i 386 1 3/ 19/97 'G26 24.8! 24.8 00:08.6 3/19/97 026 43.9 43.9 G2l 19961auto JJ,080 7.950: 41,030 ' 5.82 18m 023 24.8 24.8 00:08.2 IOOrn G2l 47! 47 GI 1989,auto 25,580' 6,150, 31,730 I 5,93 GI 25.7 25.1 00:08.1 GI 47.J 47.3 G2 1989 auto 28,0001 5,550 JJ,550 232 144.61 3.61 G2 26.9 26.9 00:07.9 Gl 48i 48 Gil 1987:std : 26,5001 6,150: 32,650 4.91 Gil 22.91 22.9 00:09.6 I Gil 38.J, 38.l GlZ 1987istd 26.500 6,7501 33,250 5.46 022 23.5 1 23.5 00:09.5 I 022 38.91 38.9 G2H 1995 iauto 33,0KOi 8,5501 41,630, 4.59 1028 23.81 23.8 00:08.8 028 43: 43 G29 1996 lauto 33,080', 7,9501 41,0301 6.21 029 24.5 24.5 00:08.4 029 46.2 46.2 GJ 19891auto I 25,580 6,1501 31,730 I 5.33 Gl 22.2 22.2 00:10.1 Gl 36.5 36.5 G21 19861std 27,000 1 6,150: 33,150, 4.6 G21 25.4 25.4 00:08,7 G21 42.l 42.l M45 l9921auto 27.KOO• 1,950 29,750, 190' 156.6! McDnld M45 31.5 31.5 00:07.2 McDonld M45 50.2 50.2 M49 1995 I auto 27,800' l,OJO, 30,830 190 162.3 18m M49 27.2 27.2 00:07.6 3/20/97 M49 50.7' S0.1 M37 1989'istd 27.080 1,3501 28,430 150 189.51 3/20/97 Ml7 25.4 25.4 00:08.2 IOOrn M37 46.81 46.8 M46 l9941auto 27,800: 3,7501 31,550 190 166.1 M46 26.2 26.2 00:07.7 M46 50 50 Ml I 989 I std 28.0001 3,750' 31,750 150 211.7 Ml 25.1 25.I 00:08.5 Ml 44.41 44.4 Ml4 1991 iauto 32,220 1,8301 34,050 190 179.2 M34 Ml4 I M27 1991 ,std I 27,5001 1,590, 29,090 155 187.7 M27 25.1• 25.7 00:08.6 M27 43.l 43.J M41 ' 198Klstd 27.0801 7501 27,830 150 185.5 M41 M41 43.6 43.6 M6 19901std 27.0801 1,3501 28,430 150 189.5 M6 M6 Ml2 19911std 27.5001 2.310, 29,810 155 192.3 Ml2 25.7 25.7 00:08.l Ml2 45.7 45.7 M25 ' 1991 i5td 27,500- 2,190• 29,690 155 191.5 M25 22.S 22.5 00:08.7 M2S 45.4 45.4 M51 l9%iauto 27.960 1,350· 29,310 185, 158.4 M51 25.9 25.9 00:08.4 M51 44.J 44.J M43 1993 iauto 31.0001 1,5901 32,590 190· 171.5 M43 30.6 30.6 M43
Ml 19K81Std 27.080, l,830i 28,910 150 192.7 Ml 24.81 24.8 00:08.7 I Ml 43.l 43.l M52 ' l9%1auto 27.960'1 1,110, 29,070 185 157.1 M52 29.6 29.6 00:07.3 M52 Sl.2 51.2
M50 19951:iuto 27,800! 1.350 29,150 190 1534- M50 30.1 30.1 00:07.0 M50 53.9 53.9 M35 1991 1auto 32.2201 1,5901 33,810 190 177.9 M35 26.1 26.1 00:07.9 M35 48.6 48.6 M45 1992:auto 27,800 I 1,9501 29,750 190 156.6 5.16 McDonld M45 27.4 27.4 00:07.8 McDonld M4S 48.J 48.3 M49 1995 lauto 27,8001 3,0301 30,8301 190i 162.3 ◄ .IS 3/24/97 M49 29.3 29.3 00:07.8 3/24/97 M49 46.8 46.8
~~_j!!.d 27,0801 1,350, 28,430 1.so: 189.5 5.42 18m Ml7 23 23 00:08.3 IOOrn Ml7 48.3 48.l
M46 1
19941:wto 27,800: 3,750 31,550. 190 166.1 4.94 M46 29.3 29.3 00:07.4 M46 50.2 50.2 - ------ -::-::-r--:--Ml 19&9:std 28,000 1 3,7501 31,750 150 211.7. 4.32' iMI 25.6 25.6 00:08.8 Ml 41.4 41.4
M34 1991 !auto 32,220' 1,830, 34,050: 190 179.21 4.41 M34 30.1 JO.I 00:07,6 Ml4 47.6 47.6
M27 1991 lstd 27,500[ 1,5901 29,090 155 187.7 4.94 IM27 27.S 27.S 00:08.2 M27 44.7 44.7
M41 19KKistd 27,0KOI 750 1 27,830 150 185.5 5.04 IM41 27.2 27.2 00:08.8 M41 40.2 40.2 M6 19901std 27.0801 1,350: 28,430 150 189,5 5.28 IM6 23.3 23.l 00:08.9 M6 43 43
Mll 1991 istd 27,5001 2,310 29,810 155 192.3 5.24 Ml2 24 24 00:08.6 Ml2 44.l 44.3
M25 1991 !std 27.5001 2,1901 29,690 155 191.5• 4.53 M25 27.8 27.8 00:08,0 M25 45.9 45.9
MS! 1996Jauto 27,9601 1,350! 29.310 185 158.4! 5.43 M51 30,9 30.9 00:07.2 M51 51 SI
M43 1993 iauto 31,0001 1,5901 32,590 190 171.5 4.78 M43 31.7 31.7 00:07.2 M4l so, 50
Ml 198Kistd 27,080 • l.830i 28,910 150 192.7 4.54 Ml 28 28 00:08.0 Ml 45.5 45.S M52 19961:wto : 27,960\ 1,110 1 29,070 185 157.1 6.88 IM52 29.6 29.6 00:07.6 M52 48.1 48.1
M50 i 19951auto ' 27.8001 1,3501 29,150 190 153.4 4.27 M50 33.3 33.l 00:06.8 M50 54.1 54.1
MJ5 1991 lauto 32.2201 I 5901 33810 190 177.9 5.7 IM35 30 JO 00:07.4 M35 50.2 50.2

Al9 1992 auto 36,(J{)(} 2.550 38,550 250: 154.2 5.8'Alma iAl9 21.2, 21.2, Alma Al9 A6 1992rauto 36,(J{)(} 2,550 38,550; 250 154.2 lJ8 4/9/91iA6 JO J ! ]OJ 4/9/91 A6 ------
· ·--l99tauto A28 36,()()() 3,030 39,030 250• 156.1 5.22: 18m IA28 28, 28' JOOm 'A28 -~--AIO 19114,auto 34,(J{)(}, 2,550 36,550• 210, 174,0 4.54• IAJO 28.2I 282i ,AID Al2 19881auto 36,000! 6,150 42,150! 210 1 200.1 4.89' !A12 27.l' 27.l I ! Al2 ' Al4 1992 :auto ]6,(J{)(} 1,950, 37,950; 250' 151.8' 4.67' 1Al4 ' lli ]] ' 1A14 A27 19X I 1auto 34,0001 l,JlO 35,350' 2101 168.J 4.91 ,A27 2l 4i 25.4 ,A27 A21 19921auto 36,(J{)(} 1,590 37,590 I 2501 150.4 1 5.781 ,A21 28.2' 28,2 A21 A25 1992 iauto 36,(J{)(}: 1,590' 37,590 250 150 4i 4.99' IA25 29 29 ! A2l Al 19K81auto 34_(){)(}, 1,9501 35,950i 210: 111.2: 4.7: IA7 29I 29I Al
' Al 19R6iauto 34,0001 3,150 37,150 2101 176.91 5.4 1AI I 26.41 26.4I IA! All 1986iauto 34,(J{)(}i 2,550· 36,550 210 174.0 5.25 All ' 22.9 22,9 All A9 1992lauto 36,(J{)(}j 1,1 JO' 37,110 250 148.4: 4.23 IA9 JO.I JO.I 1 A9 A24 1992 iauto 36,(J{)(}i 1,950' 37,950, 250 151.8 5.68, iA24 29 29 A24 All 1980l std 24,(J{)(}, 4.91 'All 28' 28 ! All A26 1979istd 24.0001 870I 24,870 225 110.l 5,06 A26 23 23 IA26 A29 19921auto 36.0001 1,950! 37,9501 250, 151.8 6.26 A29 24.J 24.J! I I A29 A2().
1979istd 24,ooo: I ' ' 4.371 iA20 24.51 24.l A2D All 1992 iauto 36,000! 2,JJOi 38,310 250 lll.2• 5.04 IA!! I 26.41 26.4 I All I AJ8 1992iauto 36,(){)(}1 1,9501 37,950' 250j 151.8• 4,78, IA18 I 26.6 26.6 Al8 A23 1992 iauto 36,(J{)(}: 1,950 37,950, 250 151.81 l.68 A23 30,7 30,7 i A23 I
i ' I ' ·-Al9 1992:auto ' 36,(J{)(}' 2,550( 38,550 250 154,21 5J6 Alma A19 I 26.6 26,6 Alma Al9 I
A2 1984 I auto 34,(J{)(}, 6.1 I 4n/97 A2 24.1 24.1 4n/97 A2 i ; A28 1992 iauto I 36,(J{)(}I J.030I 39,030 250 156.1 4.56 18m A28 30.1 30.1 100m A28 AIO 19K4Iauto ' 34,(J{)(}i 2,llOI 36,550 210 174.0, 4,4 AID 28.6 28.6 ' AID Al2 l98Rlauto 36,(J{)(}I 6,150 1 42,150 210 200.7 4.86 Al2 29.6 29,6 I Al2 Al4 19921:iuto 36,(J{)(}I 1,950I 37,950 250 151.8 5.52 Al4 ]OJ ]OJ I Al4 A27 1981 [auto 34,(J{)(}j l,350j 35,350 210 168.3 5.42 A27 27 27 A27 A21 1992 iauto 36.(J{)(}' 1,5901 37,590 250 150.4 4,59 A21 ]OJ 30.3 ! A21 ' A2l l992!auto 36,(J{)(}i l,l90i 37,590 250 150,4 4.93 A25 29.9 29.9 A25 Al I 19881auto 34,(J{)(}I 1,9501 35,950 210 171.2' 5.19 Al 28.5 28.5 i Al Al l986lauto 34,(J{)(}I 3,150I 37,150 1 210 176.9· 4,76 Al 25,9 25.9 Al I All l986 Iauto I 34,(J{)(}i 2,550! 36,550 210 174.0 4,8 All 24,8 24.8 All A9 1992 iauto 36.ooo: 1,1101 37,110 250 148,4 5.46' A9 24.1 24.1 A9 ' A24 1992 iauto 36,(J{)(}I 1,950I 37,950 250 151.8 6.09 A24 21.1 21.1 A24 Al I9K41auto I 34,0001 2,910I 36,910 210 175.8 5,05 Al 30.3 30.3 AS A26 19791std 24,(J{)(}I 8701 24,870 225 110.l, 5.86 A26 24.8 24.8 A26 A29 1992lauto 36,(){)(}1 1,9501 37,950! 250i 151.8 6,05 1A29 22,7 22,7 A29 A8 1984lauto 34,(J{)(}; ! 5.43 AS 21.6 21.6 AS All 1992 iauto 36,(J{)(}I 2,310 38,310: 250 153.2 4,63 1All 22.2 22.2 All AIM 1992 lauto 36,000 1,950 37,950 25Di 151.8' 4.25, :AI8 25,7• 25,7 ' Al8 I
AZ) 1992 iauto 36,(J{)(} 1,950 37,950: 250 151.8! 3.48 A23 33: 33 A23 i '
' i
WJI 1990istd 23,960' 6,150' 30.1 IO: I 6.8 Waldron !W31 17.1 17.1 00: 10.2 Waldron Wll 40.61 40.6 Wl2 l9M6•std 25,160' 6.52· 4/29l97,WJ2 I 24,8. 24,8 00:09,6 4129/97 Wl2 36.4 36.4 Wl4 19M71std 23,960, 6,150; 30,110 I 4,09 18m Wl4 ' 25.4' 25.4 00:09.l 100m Wl4 39,6, 39.6 WIS 19951auto 28,(J{)(}' 3,510, 31,510 190· 165.8 5.49 IW!l I 24.l 24.l 00:08.4 Wl5 46• 46 W47 l992!auto 26,500! '3,990, 30,490 190 160,51 l.73 W47 21.7 21.71 00:09,9 W47 37.8 37,8 W21 I 1993 iauto 26,5001 3,990! 30,490, 190I 160.51 4.91 IW21 I 26.2 26.2 00:09.l W21 36.2 1 36.2 WI 1983istd 23.1601 I 5.37 IWI i 23.2 23.2 00:09.l WI 41.8! 41.8 W46 19921auto 26,lOOj 2,670! 29,170 190 153.l 5.26 W46 27,2 27.2 00:07.9 W46 47,3! 47.J W26 1989l std 23,960' 4,830] 28,7901 I 4,391 IW26 i 23.3 23.3 00:09.1 W26 41.7 41.7 Wl6 19951auto 28,(J{)(}i 5,790' 33,790i 190 177.8 4,671 IW16 I 23.8 23.8 00:09,0 Wl6 41.7 41.7 Wl8 1993 ,auto 26,500• 4,710• 31,210 190 164.3 l.69! Wl8 I 26.2 26,2 00:07.8 WIS I 49.21 49.2 W9 19851std 25,160' 4.950! 30,I JO i 5.37 W9 25.1 25.1 00:08,ti W9 43.81 43,8 WR 19X5•std 25,1601 l,070i 30,230 ; 5.72 W8 18,3 18.J 00:10,3 W8 38,91 38.9 WJ7 1995:auto 28,960, 7,230' 36,190, 190 190.5I 5.95 Wl7 29.1 29.1 00:08.l Wl7 44.I: 44.1
~~~Cl 26.500 1 6,270• 32,770 1 190 172.l 5.23 Wl9 27.2 27,2 00:08.1 Wl9 45.41 45,4 W29 l990istd 23,960I 6,750: 30,710 I 5.54 W29 25.9 25,9 00:08,4 W29 44.l I 44.l WIJ 19871std 23.960, 4,950, 28,910' 4.61 Wl3 24.1 24.1 00:09,2 Wll I 39,91 39.9 \1/39 1981 :scd 27,060: 4,830' 31,890 1651 193.JI 4.47 WJ9 23.2 23.2 00:09,9 W39 I 36,51 36.l W27 l98915td 23,961); 3,270 27,230 : 4.51 W27 ' 27.4 27.4 00:08.l W27 I 45,9 45,9
W4 l9M4!std 25,160 S.SSO' 30,710 5.01 W4 24.3 24.3 00:09.l W4 38 38 ------~------~ 4.83 Wl 20,6 20.6 00:10,6 Wl ' 35.1 35.1 W5 19M41std 25.1601 6.8701 32,0301
' WJO 199<)1std 23,9601 6,510' 30.470 I I 6,11 WJO 20,8 20.8 00:09,8 W30 39,6 39,6
W6 l9901std 25,1601 ' 5,2 W6 20.6 20,6 00:09.9 W6 38,9 38,9 W48 1992iauto 26.soo: 6,150, 32,650 190 171.8 5.11 IW48 24,8 24,8 00:08,8 W48 42,6 42.6 w28 1989•std 23,960· 5.32 W28 26,2 26,2 00:08.2 W28 46.2 46,2
W22 1993,auto 30,(J{)(}: 6,150' 36.150 190 190.3 5.94 ,W22 21.7 21.7 00:09.l W22 40,6 40,6
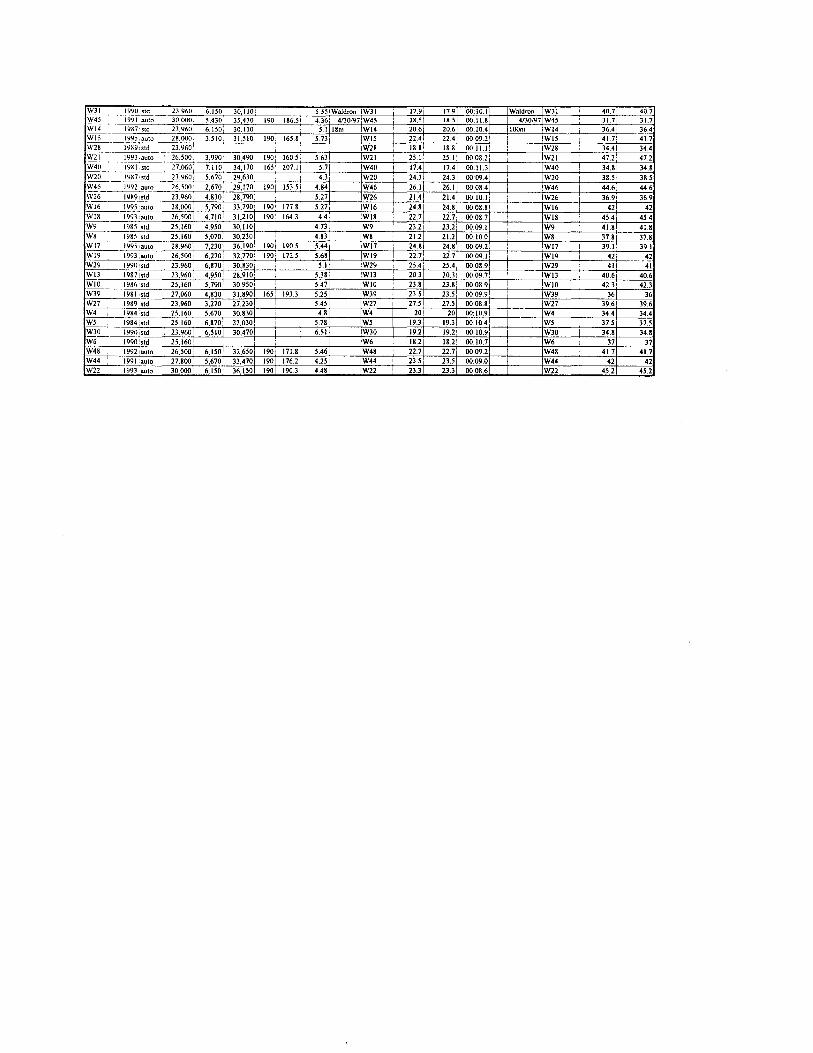
W31 1990,std 23.960· 6.150 30,1 IOi 5.55IWaldron IW31 17.91 17.9 1 00:IO.I i Waldron W31 I 40.7 1 40.7 W45 1991 ';lUtO 30,000. 5,430 35,430• 1901 186.51 4.36I 4/30/97 1W45 18.5! 18.5 00.11.8 4f30/97 W45 31.7' 31.7 WJ4 1987·std 23,960 6,JSO: 30.l JO 5.1 18m Wl4 20.6 20.6 00:10 4 JOOm IW14 36.4 36.4 Wl5 1995.auto 28.000 3,510 31.510; 190: 165.8 5.73· IW15 22.4 22.4 00:09.21 ' IW15 41.71 41.7 11'28 - 1989,std 23.960 ; IW28 18.8 18.8 00:IU! : W28 I 34.41 34.4 11'2I 1993 auto 26.500 3,990· 30,490 1 190 1 160_5: 5.631 IW2I I 25.1, 25.1 00:08.2 I W2I 47.2' 47.2 W411 1981 std 27,060" 7,110 34,170 1 1651 207.11 5.7 !W40 I 17.4 17.4 00.11.J I W40 34.81 34.8 W20 1987•std 23.960 5.670 29,6301 4.3 1w20 24.3 24.31 00:09.4 W20 I 38.51 38.5 W46 1992 auto 26,500' 2,670 29,170" 190' Ill.Si 4.84 IW46 26.1 26.1 00:08.4 W46 44.6· 44.6 W26 l9K9rstd 23.960 4.830, 28,7901 5.27 IW26 I 21.4 21.4 00:IO.I W26 36.91 36.9 Wl6 1995 ·auto 28,000; 5,790, JJ,790• 190 1 177.8' 5.27 IW16 : 24.8 24.8 00:08.81 Wl6 42, 42 WIK 1993:auto 26,500: 4,7I0 1 31,2IO 190: 164.J' 4.4 IW18 : 22.7 22.7 00:08.7 Wl8 I 45 4· 45.4 W9 l985'std 25.160' 4.950' 30,110 4.73 W9 23.21 23.2 1 00:09.1 W9 41.8 41.8 W8 1985 !std 25.1601 5,010, 30,230 I 4.83 W8 21.2 21.2 00:10.0 W8 37.8 37.8 11'l7 1995 iauto 28.960, 7,2301 36.190· 1901 190.51 5.44 iWl7 24.8 24.8 00.09.2 Wl7 39.I 39.1 Wl9 1993 ,auto 26,500, 6,2701 32,7701 190 1 172.5 5.68 IW19 I 22.7 22.7 00:091 I Wl9 42 42 W29 19901std 23.960' 6,870: J0,830i 5.1 IW29 I 25.4" 25.4 00:08.9 W29 I 41 I 41 Wl3 19871std 23,960: 4,9501 28,9IO• i 5.38 IWIJ 20.J 20.J 00:09.7, I IWIJ I 40.61 40.6 WIO 1986:std 25,1601 5,790 1 30,950• I
' 5.47 WIO 23 8 23.8 00:08.91 I WIO 42.JI 42.J WJ9 1981 IStd 27,060 4,8JOi 31,890 1651 193.J• 5.25 W39 I 23.5 23.5 00:09.9 W39 36 36 W27 1989,std 23.9601 3.2701 27.230 I I 5.45 W27 27.5 27.5 00:08.8 W27 39.61 39.6 W4 l9841std 25,160• 5,6701 30.830 i I 4.8 W4 20 20 00:I0.9 W4 34.4 34.4 W5 1984l std : 25.160 1
6,870: 32,030 i 5.78 W5 19.J 19.J 00:10.4 W5 37.5 37.5 WJO l9901std 23.960, 6.5101 30,470 I 6.51 WJO 19.2 19.2 00:10.9 WJO 34.8 34.8 W6 1990lstd 25.1601 I
i W6 18.2 18.2 00:10.7 W6 37 37 W48 19921auto 26,5001 6,150· 32,650 1901 171.8 5.46 W48 22.7 22.7 00:09.2 W48 41.7 41.7 W44 1991 :auto 27.800' 5,6701 33,470 1901 176.2 4.25 W44 23.5 23.5 00:09.0 W44 42 42 W22 1993 Iauto JO.DOOi 6 1501 36.150 1901 190.J 4.48 W22 23.J 23.J 00:08.6 W22 45.2 45.2
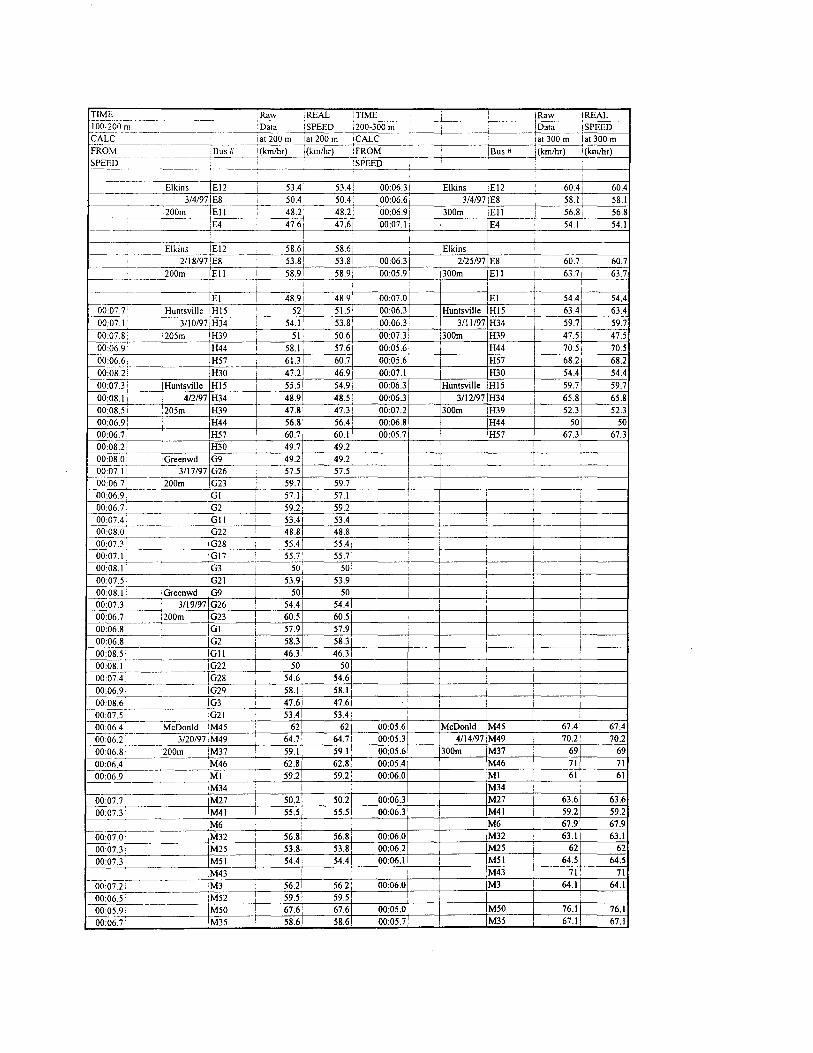
TIME Raw ,REAL TIME : 1Raw IREAL --- ----100-200 Ill Data !SPEED 200-300 m 1Data !SPEED ---- --------CALC at 200 m lat 200 m CALC iat300m lat 300 m FROM I Bus# (km/hr) (km/hr) FROM I Bus# i(km/hr) 1(km/hr) -- ----·-- ·--------SPEED 'SPEED
' ---· -----------
Elkins EI2 i 53.41 53.4 ! 00:06.3 i Elkins El2 ' 60.41 60.4 3/4/97IE8 50.4i 50.4' 00:06.61 ' 3/4/97 E8 58.1 i 58.1
200m Ell 48.2, 48.2' 00:06.9i 300m Ell ' 56.8i 56.8 E4 ' 47.61 47.6i 00:07.11 E4 54.1 54.1
I I
:Elkins El2 I 58.6i 58.61 Elkins i I
2/18/97!E8 I 53.81 53.8! 00:06.3 2/25/97 E8 I 60.7 60.7
:200111 Ell 58.91 58.9/ 00:05.91 300m IEII I 63.7 / 63.7
i ! : I ! i ' -El i 48.9i 48.9, 00:07.01 El 54.4 54.4
00:07.7' ;Huntsville Hl5 I 52 51.5 I 00:06.3 Huntsville Hl5 I 63.4 63.4
00:07.1 3/10/97 1 H34 ! 54.1 i 53.81 00:06.3: 3/11/97 H34 59.7 59.7
00:07.8 1205m H39 : 51 I 50.6 00:07.3 300m H39 47.5 i 47.5
00:06.9 H44 I 58.1 57.6j 00:05.6 H44 70.5 I 70.5
00:06.6: H57 61.31 60.7 00:05.6 i H57 68.2i 68.2
00:08.2 1 H30 47.2 46.9' 00:07.11 I H30 54.4 54.4
00:07.3: I Huntsville Hl5 55.5 54.9 00:06.3 Huntsville H15 i 59.7 59.7
00:08.11 4/2/97 H34 48.9 48.5 00:06.31 3/12/97 H34 I 65.8 65.8 00:08.51 1205m H39 47.8 47.3 00:07.2 300m H39 I 52.3 52.3 00:06.9! H44 56.8 56.4, 00:06.8 H44 50 50 00:06.7: H57 60.7 60.1 00:05.7[ H57 67.3 67.3
00:08.2: H30 49.7 49.2! i I 00:08.0 'Greenwd G9 I 49.2 49.2 i : 00:07.1 ! 3/17/97 026 57.5 57.5' 1
00:06.7 200m IG23 59.7 59.71 i : 00:06.9 IGI 57.1 57.1; i i 1
00:06.7 102 I 59.2! 59.2i I ; 00:07.4. Gil I 53.41 53.4 ! ,
I I
00:08.0 1022 48.8 48.8 : I
00:07.3 028 i 55.4 55.4/ i ' I i
00:07.1 017 i 55.7' 55.7 ! I I
00:08.1. iG3 50 50 1 . : i : 00:07.5 021 I 53.9' 53.9 ' : ! I
00:08.1' IGreenwd G9 50 50 I I i
00:07.3: 3/19/97 026 I 54.4 54.4 ' : I 00:06.7 :200111 023 60.5 60.5 ! I
00:06.8 GI 57.9 57.9 1
00:06.8 IG2 i 58.3 58.3 : I i 00:08.5 IGII I 46.3 46.31 i I 00:08.1 1022 50 50 !
00:07.4. IG28 54.6 54.6 : i
00:06.9, IG29 58.l 58.I I i i i
00:08.6 IG3 I 47.6 47.6 ' i i ' 00:07.5 1021 i 53.4 53.4 i ' I '
00:06.4 McDonld !M45 I 62 62 00:05.6 McDonld M45 i 67.4 67.4
00:06.2 3/20/97 M49 64.7' 64.7! 00:05.3 4/14/97 M49 70.2 70.2 --------
00:06.8 :2oom !M37 I 59.l 59.1: 00:05.6 300m M37 : 69 69
00:06.4 M46 I 62.8 62.8 00:05.4 M46 71 71
00:06.9 Ml 59.21 59.21 00:06.0 Ml ! 61 61 --
M34 ! M34 ---~
00:07.7 M27 50.2 50.2 00:06.3 M27 63.6 63.6
00:07.3 M41 55.5 55.5 00:06.3 M41 59.2 59.2
M6 I : ' : M6 i 67.9 67.9 ---
00:07.0 M32 ! 56.8 56.8 00:06.0 M32 63.I 63.1
00:07.3 M25 I 53.8 53.81 00:06.2 M25 62 62
00:07.3 M51 I 54.4 54.4 00:06.1 M51 ! 64.5 64.5
M43 I : M43 ! 71 71
00:07.2. ' M3 56.2 56.21 00:06.0 ' M3 64.1 64.1 -
00:06.5' M52 59.5 59.5
00:05.9 M50 I 67.6 1 67.6 00:05.0 M50 76.1 76.1
00:06.7' M35 ! 58.6. 58.6 00:05.7 M35 67.1 67.1

00 06 7 McDonld !M45 58 4 58 4 i 0005.6i :McDonld 'M45 i 70.3 i 70.3 --00 06 7 3/24197 1
, M49 61.2' 61.21 00 05.51 3/21/97 M49 70 8: 70.8 _ 00 06 9 ___ 200m IM37 56.6· 56.6 00:05.8: •300m M37 : 68.6i 68.6
0006.5 ',M46 61T 61.2', 0005.4 M46 72.1 72.1 00:08.3 'Ml 45 7 i 45.71 00.06.31 ! Ml 68.91 68.9 00 06.8 ;M34 58.1 58.1: 00:05,7 i M34 67.4 67.4 00 07.4, :M27 s2: 521 00:06,2 M27 63,2 63.2 0007.8 iM4I 52 52 I 00:06.2 ! M41 63,2 63.2 00.07.3 1M6 55,2: 55,2 1 00:06.0 M6 65.3 65.3 00:07.4 IM32 ' 53.4! 53.4 00:06.3 M32 60.7 60.7 0007.3 M25 52 8i 52,8 00:06.3 M25 61.3 61.3 00064 !M51 I 62.1 i 62.l I 00:05.8 M51 61.8 61.8 00:06.5 M43 ', 61.6: 61.61 00:05,7 IM43 i 65.5 65,5 00:06 9: 'MJ 58.4' 58.41 00:05.91 !Ml 64.4 64.4 00 06.8 1, IM52 58.3 58.3 00:05,9 IM52 62.8 62,8 00,06.0 IM50
' 66.3' 66.3 00:05.3 : IM50 68.4 68.4
00·06.4 IM35 61.6; 61.6 00:06 I, ! IM35 I 55,8 55.8
' I
00:08.71 1Wa1dron !WJI 42 42 0007.1 Waldron IW3I I 59.1 59,I oo,09.o: 4/29/97 Wl2 I 43.5: 43.5 I 5/21197' 00:07.91 !200m Wl4 ! 52 52 00:06.5 300m Wl4 59.2 59.2 00:07.0 1 WIS 56.6 56.6 00:06.3 WIS 57,9 57.9 00:08.61 W47 46,2 46,2 00:06.4 W47 66,8 66,8 00:09.ol W2I i 44.1 44.1 00:06,6 W2I 64,2 64,2 00:07,5 I ! IWI 53.9 53.9 00:06.9i W46 i 56.8 56,8 00:06,J W46 60.5 60.5 00,01.17 W26 51.5 51.5 00:06,5 W26 58,7 58.7 0007.9' IWJ6 49.9! 49.9 00:06 8 Wl6 55,5 55,5
00:06.41 'Wl8 : 63.1 63.1 00,05.8 W18 61.6 61.6 00:07.51 W9 i 51.8 51.8 00:06.4 W9 61.5 61.5 00,08.41 :W8 I 47.2; 47,2' 00:06.9 W8 57,9 57.9 00:08.1: \WI? 44 7: 44.7 00:06.7 Wl7 62,6 62,6 0007 6 IW19 48.9 1 48.9 00:06,3 Wl9 I 65,3 65,3 0007.1 1 1W29 57.5 ·, 57.5 00:06,0 W29 61.6 61.6 00.08.0 IWIJ 50 I. 50,J, 00:06,7 i W13 57.4 57.4 00·08 3 i iW39 50.2' 50.2 1, 00·07 Oi W39 52,6 52,6 00:07 71 1w21 47 8! 478+-- 00:07.0 I IW27 54,5 54,5 00:08,3 i W4
I 4921 00:07.8 I W4 43.1 43.1 49.2
00,09,0i IW5 45.1 45.1 00:07,I W5 56,6 56.6 00:08,2 I i IWJO 48.4! 48.4 00:07.I WJO 52,8 52,8 00:08.3, IW6 48.3 48.3 I 00:07.8 1 :W48 I 49 9[ 49.9 00:06,6 i W48 59,7 59.7 00:0691 IW28 i 57.9i 57.9! 00:07.8 [ 1W22 52 52 00:06.1 W22 65,8 65.8
I !
I
00:08.0 !Waldron IWJI I 49,2 49,2 ! I ~
00:IO.J' 4/30/97 IW45 38.1 38.1 00:07.5 W45 57,3 57,3 0008.9, 1200m IWJ4 44.7 44 7 I I
00:07 1: IW15 51.7, 51.7, I ~084 IW28 51.5 51.5 I
0007.2 i 'W21 52.9; 52.9 I
00:08 8, W40 I 47.2 47,2 00:07.3 I W40 51.6 51.6 0008 0! IW20 : 51 i 5) I 00:06.I W20 67.3 67,3
00:07 6 IW46 i 49,6 49.6i I 00:08.2' !W26 50,5 50,5;
00.08.3, ~
IWI6 44 71 44,7 1
0007.1 !WIS 55,5 55,5 I
0007 7 W9 I 51.71 51.7 I 00085, IW8 I 47,3 I 47.3! I
00:08.1 · IW17 I 49.6• 49,6 I
00:07 5, :WI9 53.4 534
00:07.5 W29 54.4 54.4 : 00:08 I 1 WIJ 48.3: 48.J I 00:07,6• WIO I 52.1 I 52 I. 00:06.5 WIO 57,9 57.9
0008 6, :W39 47,5 47.5
00:08 I 1W27 49.7 49.7
00:08.7! IW4 48 8; 48.8 ---00:087' IW5 : 45.4: 45.4 --------0009 I ,WJO 44.61 44.6 I -----~ ............... -·--00·08.5 IW6 I 47,3 i 47.3, !
0007.6'. W48 52,6 52.6 I
00:07.7 1 1W44 51.31 51.3 00:06,5 W44 58,7 58,7
00:06 9 !W22 59.ll 59, I.

'Raw :REAL TIME 1 !Raw ,REAL -----·--· --- ----------------------+------'----~--------! 300-400 m I Data I SPEED 1400-500 m !Data !SPEED TIME
CALC :at 400 m 1at 400 m iCALC iat 500 m lat 500 m l(km/hr) l(km/hr) IFROM , !Bus# l(km/hr) 1(km/hr)
-·-------------------------+----+-------------+----+-------; iSPEED I I
FROM iBus # SPEED
1---------------c------+'-----,-----~-----"-' --------'----+-------+'-----I Elkins !El2 65.5 ! 65.5' 00:05.3 1 I Elkins E12 1 71 ! 00:05.7 71
00:05.8 3/3/97,E8 ! 66.1 1 66.1 i 00:05.21 3/3/97 E8 73.21 73.2 00:06.0 400m iEII 62.8: 62.8! 00:05.6 ;500m Ell i 66.8 1 66.8
iE4 : 58.11 58.ll 00:06.01 ! E4 ' 61.6 ------- -----+---+-----+-----+--------,'----t-----,----+----+------1
61.6
-------------.-E-lk-in-s --------+----+--------'------+1---I-El-k-in-s--+-E-l2----1---6-9-.8+---6-9.---t8
- 00:os:7;___ 2/25/97 E8 68.1: 68.1 i 00:05.3 3/4/97 E8 68.41 68.4 -OO~os.",t ___ ___ 4._0_0_m·----'-, E-1-1---, --7-0-.7-'-, ---70-.7--0-0:-05-.3-+-----15-00-m--+E-l-1---+,---6-5.-7 +--! --6-5---t.7
E4 64.9 ! 64.9 ---00-:06~3-· ·-------!E_l _____ 5_9_-2-, ---5-9-.2~1 -----+-------,'-----+,, ---+------t
·-o-o 05~6 _____ : H-u-n-ts-v,-·11-e-+i-H-l 5---,-,. ___ 6_5_: ___ 65-_--i31--+0-,-0-,-:0-,-5.-,-4+-----:-IH_u_n_ts...,vi.,,.lle-+H,..,..,-15c------,,--...,6-,-7...,._6.,...I --6-7---l.6
00:05.7' 3/11/97 H34 65.71 66.31 00:05.3 3/11/97 H34 70.3 70.3 00:07 .2: 385m H39 • 51.8: 52.41 00:06.6 I 500m H39 56.3 56.3 00:04.9 1 H44 i 75.3j 75.51 00:04.7 i H44 77.21 77.2 -------------+---------,-----+-----+---+----+-----+----+-----+----< 00:05.1 '. H57 73.7! 74.2 1 00:04.7 H57 77.7 77.7 00:06.5, H30 j 55.8: 56.1 1 00:06.3 I H30 58.3 58.3 00:05.7; 'Huntsville H15 65.Ji 66' 00:05.3 !Huntsville H15 70.5 70.5 00:05.4' 3/12/97 H34 : 66.91 67.41 00:05.2 1 3/12/97 H34 70.7j 70.7 00:06.6 i385m H39 : 56.21 56.61 00:06.2 [500m H39 59.51 59.5 00:07.1; H44 I 50.51 51.21 00:06.7 H44 ! 56.2 56.2 00:05.11 H57 I 72.41 72.91 00:04.8 I H57 i 761 76 00:05.21 ,McDonld M45 I 71.81 71.8: 00:04.9 iMcDonld M45 76.1 76.l 00:05.01 4/14/97 M49 I 72.71 72.71 00:04.9 ! 4/14/97 M49 73.4 73.4 00:05.0: ,400m M37 1 741 741 00:04.8 1500m M37 77.2 77.2 00:04.8 IM46 77.61 77.61 00:04.5 M46 81.8: 81.8 00:05.6' 'Ml I 66.51 66.5 00:05.4 : Ml 1 67.4' 67.4
------------,-IM-34--~--6-6-.6-,----6-6-.6-1-00-:0_5_.3-+, i-------,----+M-3,--4,-----------,-69,--.5--,1 ___ 6_9-l.5
00:05.5 11\127 I 68,21 68.2! 00:05.2 i 1\127 1 7J.6i 7J.6 00:05.9, /M41 62.6i 62.61 00:05.7 M41 1 63.l i 63.1
! ' : , M6 72.4; 72.4 00:04.9' McDonld 1\145 , _7_6_.6-+1 ___ 76_._6..,.i _0_0_:0_4._7,_j _ ___j_McDonld 1\145 1 78.2i 78.2 00:05.0 3/21/97 1\149 -----r-- 74.4 i 74.4 ' I 3/21/97 1\149 ; 1 00:05.0 400m 1\137 1 74.71 74.7, 00:04.81 1500m 1\137 I 76.81 76.8 00:04 8 IM46 ! 79.3 I 79.3' 00:04.5 1\146 82.2 82.2 00:05.0 IMI 74.41 74.4, 00:04.7 1 1Ml I 78.2 78.2 00:0_5_. l _______ --il_M_3_4_-+: ___ 73_.9_: ___ 7_3._9 ..... i _0_0_:0_4_.8~ 1, ___ : ___ -+--M_3_4 __ +--__ 7_6+-___ 76_. 00:05.4 11\127 ! 70.5 i 70.5 I 00:05.0 M27 ! 73.4 73.4 -- -·. -~----------~---r----+----+----+------1----+---+------j----1
IM41 i 69: 69; 00:05.2 ! M41 69.8 69.8 00:05.4 00:05.2 M6 73.1 i 73.1 ! 00:04.8/ M6 : 761 76
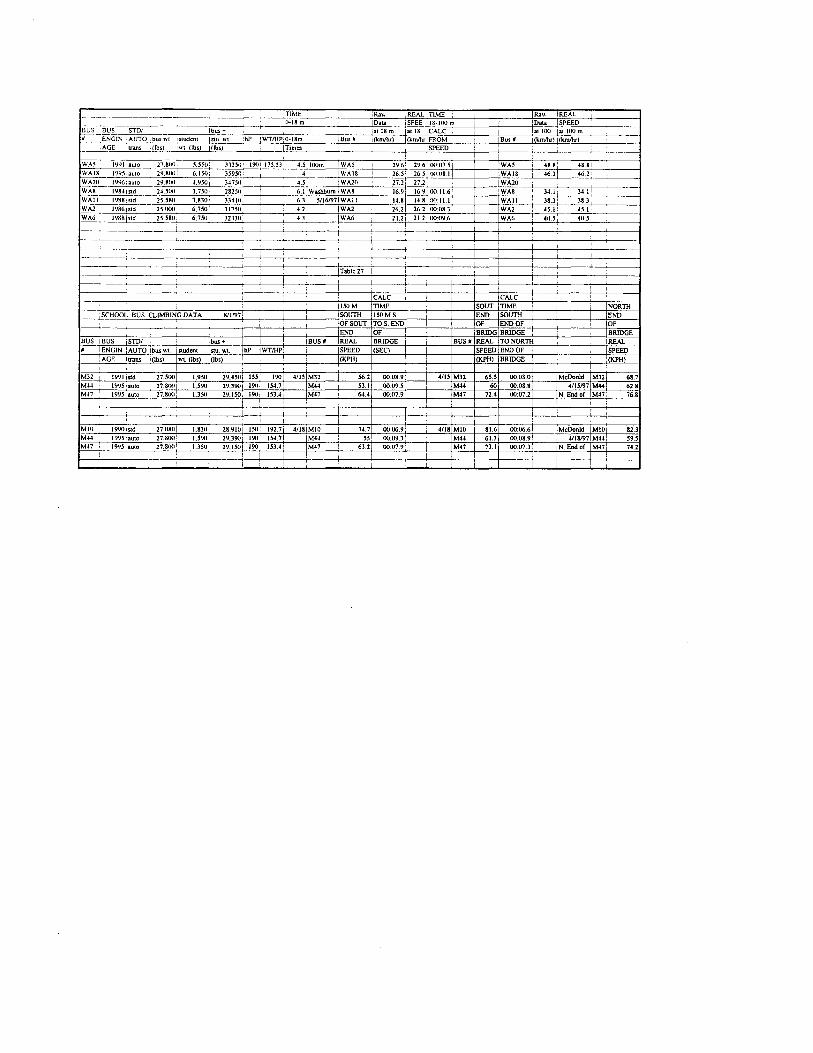
- ~--- :TJME :Ra"" !REAL TIME : IR.a,, IREAL
----•-· --- 0-18m Dao, jSPEE 18-100 m I 1Data ,SPEED BUS BUS .STOi I bus+ iat 18m at18 CALC
' lat 100 lat IOU m I ~--
# ENGIN ,AUTO bus ,,1 1student lstu "t ihP IWT/HP10-J8m , iBus # (km/h,-) i<km/lu" FROM Bus# I (km/tu") I (km/tu") ___ ,_AGE '"""' (lbs) '\\1 (lbs) iflbs> !Times ,SPEED I
I
I I I WA~ l9'Jl 1au10 D'.8(Xl' :U50'. JJHO' 190: 175.53 1 4.5[100m IWA.5 I 29.6: 29.6' 00:07.5 WA' 48.8 1 48.81 WAIS l 1J951au10 29,800' 6.150: 35950: ; 4, 1WA18 I 26.5 26 5 1 lkl:08 Ii WAIS ' 4621 46.2: WA20 19%1.auto 29.8()(/ 4.950 J..l750 4.5 IWA20 21,2: 27.2! I WA20 WAS l98 .. 1std 2-LSOO 3.750 28250, 6.11Washbum IWA8 16.'J: 16 91 ()(J:I 1.6 WA8 I 34.1, 34.1! WAil' 1988:std 25.580 1.8]0• JJ.HO: 6.1 ,116197IWAII 14.8 148' (){1:11.1 I WAIi 38.3 1 38.31 ~----
IWA2 WA2 l9861std 25.UOO 6,750, ]1750 ,1.2, 26.2 26.2 00:08 ]. WA2 45.1 i 45.1: WA6 l98B1std 25.580: 6.750' 32330' <JI WA6 21.21 21.2 00:09.61 WA6 40.5 ◄II.Si
' ---- I ' ; ! I I I I
' I I I !
' I : Table 27 !
I I I I
: I I I I i I ; CALC i : CALC I I
150M !TIME SOUT TIME I I NORTH ,SCHOOL BUS CLIMBING DATA
' 811/97! i I i SOlITH ISOMS I END SOUTH IEND
OFSOUT TOS.END Of END Of I IOF i END OF BRIDG BRIDGE i !BRIDGE
BUS IBUS 1STDI ' bus+ i I ! !BUS# REAL BRIDGE BUS# REAL TO NORTH IREAL
• IENGIN 'AUTO ibus wt istudent stu. ~1. lhP IWTIHP' i SPEED (SEC) SPEED END OF I !SPEED ,AGE ltrans 1(1bs) 1~1. (lbs) (lbs) I (KPH) (KPH) BRIDGE I ! '(KPH) I I i I
M32 1991 istd 21,,ml 1.9501 29,4,i,1 m! 1901 4/IS IM32 I '6.2 00:08.9 4/IS M32 6'-' 00:08.0I IMcDonld M321 68.7
M" 199Siauto 27.800i 1,5901 29.390" 19()1 154.1! IM44 SJ.I 00:09.5 M44 60 00:08.Hi -4/15/97 M4-4! 62.8 M47 l9951auto 27.800 1.350. 29,150; 1901 153,4' iM47 I 64.4 00:07.9 M47 72.4 00:07.21 IN,Endof M47, 76.8
I I I I I ' I ;
! i I ; I I i I '
MIO 19tJ01std 27.080! 1.830: 28,91<ll 150; 192.7i 4/ISIM!O I 74.7 00:06.9: 4118 MIO 81.6 00:06 61 IMcDonld MIOI 82,3 M" JIJI-JS/auto 27.8001 1,590 29,390! 1901 1'4.71 IM44 I '5 00:09.3 M44 6L3 00:08.91 4/18/97 M,., ,9.5 M47 1'>95 iau10 27.800 1.350 29.1501 190' JSJ.41 IM47 ! 63.2 00:07.9 M47 73,I 00:07,31 IN.Endo[ M'7i 74.2
! ' i ! I I I I I '

79
APPENDIXE Washburn Straight-line Acceleration Data

Washburn Data Time Data Speed Data Std vs. Auto data
SCHOOL BUS STUDY rev 7/17/97 0 18 100 0 18 100 0 18 100
average 0 00:04.8 00:09.3 average 0 23.2 42.5 auto avg so 0 27.7667 47.5 120 lbs per student maxim 0 00:06.3 00:11.6 minimu 0 14.8 34.1 std avg spe 0 19.775 39.5 150 lbs for bus driver
number of data p 7 5
TIME Raw REAL TIME Raw REAL 0-18m Data SPEED 18-I00m Data SPEED
BUS BUS SID/ bus+ at 18m atl8m CALC at I00m at 100m # ENGINE AUTO bus wt. student stu. wt. hP WT/HP 0-18m Bus# (km/hr) (km/hr) FROM Bus# (km/hr) (km/hr)
AGE trans (lbs) wt. (lbs) (lbs) Times SPEED
7 number of data points 5 number of data points 4.84286 average time from O to 18 m 00:09.3 average time from 18 m to I 00 m
23.2 averru,e speed km/hr (£iJ, 18 m 42.5 average speed km/hr (£iJ, I 00 m 6.3 maximwn time from O to 18 m 00:11.6 maximum time from I 8 m to I 00 m
14.8 minimum speed (£iJ, 18m 34.1 minimum speed (£iJ, I 00 m
WAS 1991 auto 27,800 5,550 33350 190 175.5 4.5 I00m WAS 29.6 29.6 00:07.5 WAS 48.8 48.8 WAIS 1995 auto 29,800 6,150 35950 4 WAIS 26.5 26.5 00:08.1 WAIS 46.2 46.2 WA20 1996 auto 29,800 4,950 34750 4.5 WA20 27.2 27.2 WA20 WA8 1984 std 24,500 3,750 28250 6.1 Washburn WA8 16.9 16.9 00:11.6 WA8 34.1 34.1 WAIi 1988 std 25,580 7,830 33410 6.3 5/16/97 WAil 14.8 14.8 00:11.1 WAIi 38.3 38.3 WA2 1986 std 25,000 6,750 31750 4.2 WA2 26.2 26.2 00:08.3 WA2 45.1 45.1 WA6 1988 std 25 580 6750 32330 4.3 WA6 21.2 21.2 00:09.6 WA6 40.5 40.5

81
APPENDIXF McDonald County Upgrade Acceleration Data
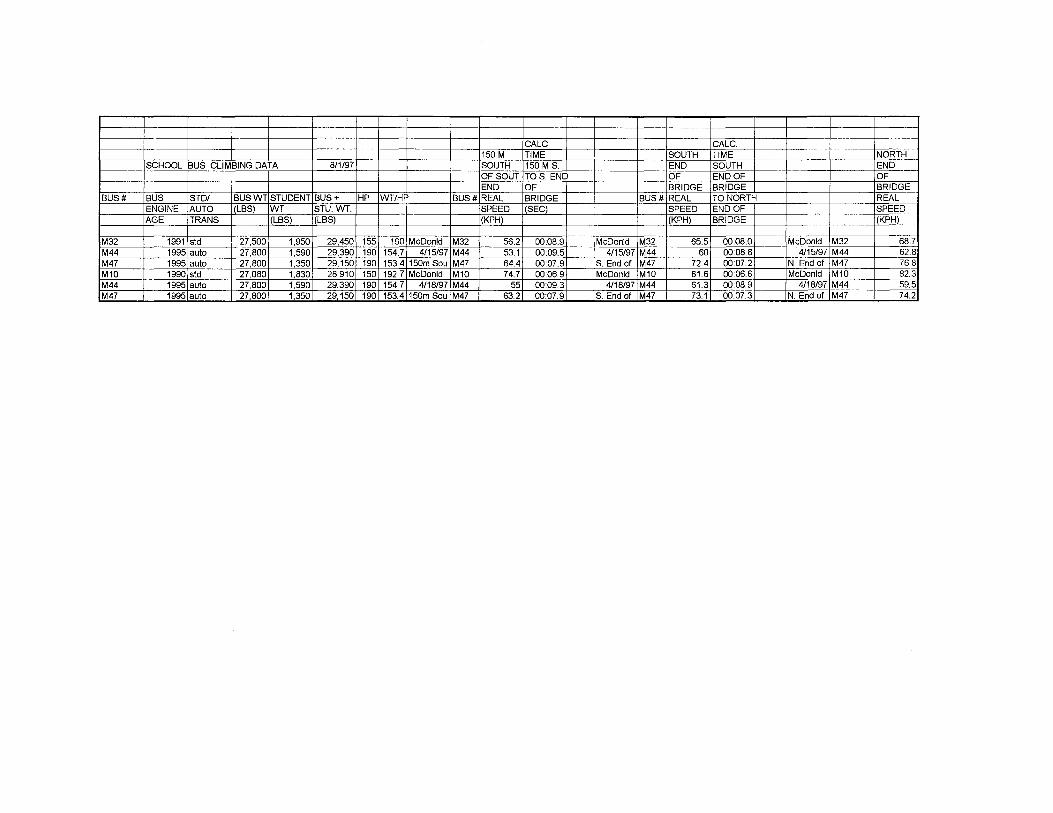
CALC. CALC. 150 M TIME SOUTH TIME NORTH
SCHOOL BUS CLIMBING DATA 8/1/97 SOUTH 150 MS. END SOUTH END OF SOUT TOS. END OF END OF OF END OF BRIDGE BRIDGE BRIDGE
BUS# BUS STD/ BUSWT STUDENT BUS+ HP WT/HP BUS# REAL BRIDGE BUS# REAL TO NORTH REAL ENGINE AUTO (LBS) WT STU. WT. SPEED (SEC) SPEED END OF SPEED AGE TRANS (LBS) (LBS) (KPH) (KPH) BRIDGE (KPH)
M32 1991 std 27,500 1,950 29,450 155 190 McDonld M32 56.2 00:08.9 McDonld M32 65.5 00:08.0 McDonld M32 68.7 M44 1995 auto 27,800 1,590 29,390 190 154.7 4/15/97 M44 53.1 00:09.5 4/15/97 M44 60 00:08.8 4/15/97 M44 62.8 M47 1995 auto 27,800 1,350 29,150 190 153.4 150m Sou M47 64.4 00:07.9 S. End of M47 72.4 00:07.2 N. End of M47 76.8 M10 1990 std 27,080 1,830 28,910 150 192.7 McDonld M10 74.7 00:06.9 McDonld M10 81.6 00:06.6 McDonld M10 82.3 M44 1995 auto 27,800 1,590 29,390 190 154.7 4/18/97 M44 55 00:09.3 4/18/97 M44 61.3 00:08.9 4/18/97 M44 59.5 M47 1995 auto 27 800 1 350 29150 190 153.4 150m Sou M47 63.2 00:07.9 S. End of M47 73.1 00:07.3 N. End of M47 74.2