Structural Polarity of Kinetochore Microtubules in PtK, Cells

Interpolar Spindle Microtubules in PTK Cells David N. Mas t ronarde , Kent L. McDona ld , Rubai Ding, and J. R ichard McIn tosh
Laboratory for Three-dimensional Fine Structure, Department of Molecular, Cellular, and Developmental Biology, University of Colorado, Boulder, Colorado 80309-0347
Abstract, Spindle microtubules (MTs) in PtK~ cells, fixed at stages from metaphase to telophase, have been reconstructed using serial sections, electron micros- copy, and computer image processing. We have stud- ied the class of MTs that form an interdigitating sys- tem connecting the two spindle poles (interpolar MTs or ipMTs) and their relationship to the spindle MTs that attach to kinetochores (kMTs). Viewed in cross section, the ipMTs cluster with antiparallel near neigh- bors throughout mitosis; this bundling becomes much more pronounced as anaphase proceeds. While the mi- nus ends of most kMTs are near the poles, those of the ipMTs are spread over half of the spindle length, with at least 50% lying >1.5 #m from the poles. Lon- gitudinal views of the ipMT bundles demonstrate a
major rearrangement of their plus ends between mid- and late anaphase B. However, the minus ends of these MTs do not move appreciably farther from the spindle midplane, suggesting that sliding of these MTs contrib- utes little to anaphase B. The minus ends of ipMTs are markedly clustered in the bundles of kMTs throughout anaphase A. These ends lie close to kMTs much more frequently than would be expected by chance, suggesting a specific interaction. As sister kinetochores separate and kMTs shorten, the minus ends of the kMTs remain associated with the spindle poles, but the minus ends of many ipMTs are released from the kMT bundles, allowing the spindle pole and the kMTs to move away from the ipMTs as the spindle elongates.
M ICROTtrBULES (MTs) I contribute to many of the movements of mitosis. Some MTs attach to kineto- chores (kMTs) and these are probably instrumen-
tal in moving the chromosomes both to the spindle midplane during prometaphase and to the poles during anaphase A. MTs that do not end on kinetochores (nonkMTs) are of at least two kinds: astral MTs that grow from each centrosome into the region outside the spindle, and other MTs that grow into the body of the spindle proper. The latter are usually of diverse lengths, but in at least some cells they interact with their counterparts from the opposite pole to form a frame- work that connects the poles with one another. NonkMTs are thought to be involved in spindle stability and elongation (anaphase B).
Structural work in spindles of lower eukaryotes has eluci- dated some important features of spindle design. For exam- ple, cross sections of several algal and fungal spindles have shown that the nonkMTs, particularly those that are an- tiparalld to one another, are regularly spaced, and that the order of this packing increases during mitosis (e.g., McDonald et al., 1979; Tippit et al., 1983; Mclntosh et al.,
Address all correspondence to David N. Mastronarde, Dept. of MCD Biol- ogy, Campus Box 347, University of Colorado, Boulder, CO 80309-034Z
1. Abbreviations used in this paper: ipMT, interpolar MT; kMT, kineto- chore MT; MT, microtubule; nonkMT, nonkinetochore MT; 3-D, three dimensional.
1985; Ding et al., 1993). Time-dependent changes in the zone of MT overlap near the spindle equator have also been observed. These rearrangements are consistent with a mech- anism for spindle elongation that invokes both MT sliding and MT polymerization (Tippit et al., 1978; Mclntosh et al., 1979, 1985; Ding et al., 1993). Experimental work (Masuda et al., 1988, 1990; Saxton and Mclntosh, 1987), together with the localization of plus end-directed motor enzymes to the zone of MT interdigitation (Cande et al., 1989; Nislow et al., 1992), have provided convincing support for this pro- posal (reviewed in Hogan and Cande, 1990). There is, how- ever, evidence that in some cells the astral MTs pull the poles apart while the framework of nonkMTs acts as a regulator or brake on pole separation (Aist and Berns, 1981; Kronebusch and Borisy, 1982; Aist et al., 1993; Waters et al., 1993). Finally, work on small spindles has suggested that there is little or no association between kMTs and nonkMTs (Heath, 1974; Tippit et al., 1983). This is particularly in- teresting because the anastral spindles of higher plants do ap- pear to contain such linkages (Smirnova and Bajer, 1992).
In this paper we describe three-dimensional (3-D) recon- structions of the trajectories of MTs in spindles of the mam- malian cell line PtK1. Our initial premise was that quantita- tive structural information was likely to help exclude some ideas about the mechanisms for spindle action. Further, we wanted to learn whether the mammalian spindle is similar to the spindles that have already been described in lower eu- karyotes. However, there are technical problems inherent in
© The Rockefeller University Press, 0021-9525/93/12/1475/15 $2.00 The Journal of Cell Biology, Volume 123, Number 6, Part 1, December 1993 1475-1489 1475
on March 21, 2018
jcb.rupress.orgD
ownloaded from

such an investigation. Mammalian spindles are many micrometers in each dimension and contain thousands of MTs. To deal with these problems, we have used computers to help with MT tracking and model analysis, and we have identified ways to sample spindles reliably without recon- structing their entirety. Our results reveal some similarities with the spindles of the lower eukaryotes but also several striking differences that are likely to be important in under- standing mitotic mechanisms.
Materials and Methods
Electron Microscopy and Mitotic Stages Studied PtKl cells were grown, fixed, embedded, selected for sectioning, re- mounted, and cut in 75-nm serial cross sections as described by McDonald et al. (1992). Initially we studied one telopbase, one late an_apbase, and one mid-anaphase cell photographed at 15,000x on a JEOL 100S electron mi- croscope (JEOL USA Inc., Peabody, MA) operating at 80 kV. For pole-to- pole reconstructions, one metaphase, one early anaphase, and one mid- anaphase cell were photographed at a magnification of 11,500x on a Philips CM10 electron microscope (Philips Technologies, Cheshire, CT) operating at 80 kV. We also examined MT bundles in two other metaphase cells. All of these cells were selected from the same wafer of plastic-embedded cells.
The mitotic stage of each cell was characterized by its pole-to-pole length and the separations between its sister kinetochores (Table 1). The telopbase cell was early, with distinct chromosomes, a partially constricted cleavage furrow, and MTs in numerous moderate-sized bundles rather than a single midbody. Our terminology refers to stages of anaphase B, which are not equivalent to the stages of anaphase A described in McDonald et al. (1992). In that study, the median lengths of the kMTs in each bundle averaged 3.7 /~m in metaphase, 2,9 ttm in mid-anapbase A, and 1.1 #m in late anapbase A. Comparison of these values with those in Table I indicates that the early anaphase B cell here was at a somewhat earlier stage than the mid-anaphase A cells in McDonald et al. (1992), and that the mid-anaphase B cell recon- structed pole-to-pole was only slightly earlier than the late anaphase A cells in McDonald et al. 0992).
For a detailed analysis of spindle structure, it is essential to know the polarities of the MTs. MTs viewed in thin sections do not reveal their polar- ity, but this feature can be inferred for any spindle MT by determining which end is nearer to a pole. Our initial strategy for data collection was to recon- struct the minimum length of spindle required to assign polarities to the MTs. FOr the latest stages of mitosis, only 20-25 sections to either side of the midplane were sufficient to make this assignment. FOr a mid-anaphase cell, however, even 95 sections were not enough, because so many MTs ex- tended through the entire length of this reconstruction. We therefore under- took pole-to-pole reconstructions of cells from metaphase through mid- anaphase. For this study, we tracked a total of 2,400 MTs, which required 109000 connections between images of MT cross sections.
Strategies for Digitizing and Tracking Negatives were placed on a light box facing a Dage MTI-80 video camera whose output was digitized by a Parallax 1280 videographics device in a MicroVAX HI computer. The pixel size was 2.5-2.8 nm (8 to 10 pixels per MT diameter). To capture an image area larger than the video frame size (640 by 480 pixels), the computer used stepping motors to move the table and digitize a rectangular array of overlapping video frames. The operator designated the desired area on the first section being digitized, and the com- puter automatically captured the same area on later sections. A separate computer program blended the image information in the overlapping areas to remove the discontinuities that arose from small camera distortions.
An initial registration of the MTs on successive sections was achieved during digitization. The alignment between the last digitized section and the next one to be digitized was assessed either by displaying one in magenta and the other in green (so that superimposed structures became white), or by rapidly alternating between gray-scale images of the two. Because regis- tration proceeded from one section to the next without the aid of persistent fiduciai markers, it was difficult to avoid gradual drifts and rotations of the image area. To ameliorate this problem, the negative just digitized was over- laid with the next negative, whose position was adjusted to give the best alignment of large features like organelles and chromosomes, then the previ-
Table L Features of Reconstructed Cells
Interpolar Interkinetochore Kinctochore Stage in mitosis distance distance fiber length
/~m /xm /.vn
Metaphase 10.4 2.4 4.0 Early anaphase 11.1 4.2 3.2 Mid-anaphase 13.9 11.2 1.3
13.7 >8 NA Late anaphase 21.0 ,'~19 <1 Telophase 24.8 NA NA
Interkinetochore distances are based on the positions of 5-11 kinetochores in each half spindle. Kinetoehore fiber length is the average of the median kMT length in each reconstructed kMT bundle. NA, not available.
ous negative was removed. Alignment was then refined, based on the MTs visible in the video frame.
For telopbase, where MTs near the spindle midplane were organized into obvious bundles, we digitized a small area (0.8 by 0.8/~m) around each bun- dle chosen for analysis, then reconstructed every MT associated with the bundle. About 45 sections were digitized. For late anaphase, we followed the same strategy or digitized larger areas containing several small bundles. For metapbase through mid-anaphase, we chose an area large enough to give ,~21 × l0 s pixels of image data from one pole to the other. This quantity approached the limits of what could be handled conveniently on our computer system and corresponded to 100-125/zm 3. The area was 2.2 by 4.3/~m for metaphase, 2.8 by 31/~m for early anaphase, and 2.2 by 3.3 pm for mid-anaphase. At the spindle midplane, this area was 31, 31, and 26%, respectively, of the area occupied by the MTs visible in a low- magnification print. Each area was chosen to include as many MTs as possi- ble. For all digitizations, we started at the midplane, where bundles were most evident, and entered successive sections first toward one pole, then toward the other. These tv~ poles will be called the -Z and the +Z pole, respectively.
The digitized images were transformed into alignment as described in McDonald et al. (1992). For a given pair of sections, ,x,10 MT linkages were tracked between the sections and used as fiducial points to derive the best linear transformation relating the two sections.
Rather than reconstructing all of the MTs in 125 pm 3, we chose a strategy of initially tracking only the M'Is passing through the spindle mid- plane. Such MTs were tracked as far as possible in both directions by estab- lishing a model point at the position of the MT in each section. Tracking ended when the end of the MT was observed, when the MT left the available image area, or, very rarely, when its fate could not to be determined. The MT was then placed in one of four classes: both ends seen (i.e., complete), neither end seen, only -Z end seen, or only +Z end seen. After finishing the MTs passing through the midplane, we closely examined the images be- tween the midplane and 30-35 sections from each pole (halfway to the poles for metaphase and early anapbase, more than halfway for mid-anaphase). Any MTs appearing within the area occupied by the already tracked MTs were then tracked. We also tracked the MTs in the central kMT bundles and in 1-7 peripheral kMT bundles. Finally, to obtain less biased distribu- tions of length and position, we extended the reconstruction at one end of the early anaphase spindle by tracking all additional MTs that appeared within the area occupied by tracked MTs in the 30 sections closest to the pole. In general, however, data presented here are based on the subset of MTs that extended at least 30 sections from a pole.
For the purposes of analysis, the pole was defined to be a single point. Its position was initially taken to be at the intersection of the axes of the two centrioles. In some cells, however, the pericentriolar material extended farther into the spindle from one pair of centrioles than from the other, and the minus ends of kMTs were consistently farther from that centriole pair by a similar amount. In these cases, the position of one pole was moved by 1-3 sections in Z to compensate for these disparities.
Image Alignment For Structural Analysis For the pole-to-pole reconstructions, each completed model was trans- formed before analysis in ways designed to approximate as well as possible the shape of the original structure. In general, the positions of all MTs in the model were used to obtain new linear transformations relating each pair
The Journal of Cell Biology, Volume 123, 1993 1476
on March 21, 2018
jcb.rupress.orgD
ownloaded from

of sections. These transformations were combined in various ways so as to reduce section-to-section irregularities in MT trajectories and to eliminate some of the waviness in trajectories that appeared over distances on the or- der of 10 sections and that most likely arose from gradual shifts and rota- tions during digitization. For the metaphase and early anaphase models, model points were translated so as to straighten out the central kMT bundles and to center the two bundles on the same line perpendicular to the sections, reflecting the appearance of these fibers in living cells. These realignments caused only negligible changes in the features described in this paper, e.g., the distances between MTs within a section. To obtain smoother models for presentation, each MT was independently smoothed by fitting a parabola to each set of seven successive points along the MT; each point was then replaced with the fitted value in the center of its respective parabola.
Identi~ng MTs in Bundles In anaphase and telophase spindles viewed in cross section, many MTs oc- curred in clusters with center-to-center spacings of 30-50 nm. These bun- dies were used as a unit of analysis and it was thus necessary to identify which MTs belonged to a bundle. Such MTs were identified by first examin- ing the model near the spindle midplane and drawing a polygon around a set of points that formed a reasonably well-defined cluster (e.g., Fig. 3 A). The model was then examined section by section, and a new polygon was drawn around the bundle every 6-10 sections to encompass any additional MTs that joined the bundle from the outside or that appeared in the middle of the bundle. Members of the bundle that wandered far from the rest were ignored in drawing new boundaries. This procedure was followed in both directions from the midplane until the bundle appeared to disperse, which usually happened within 20-30 sections. This method of identifying bun- dles was difficult to apply objectively in early and mid-anaphase, but it was at least applied consistently so as to provide a uniform basis for comparing bundles at different mitotic stages.
Assigning MT Polarities MT polarities were initially assigned based on which half-spindle contained the MT midpoint. One advantage of this method is that it can be applied to some incompletely tracked MTs (24-37% of the nonkMTs studied here). If the point beyond which an incomplete MT could be tracked is already farther from the midplane than the observed end, then the midpoint must be in the half-spindle with the incomplete end, regardless of how much far- ther the MT extends in that half-spindle. The polarity can thus be assigned, with the observed end being a plus end. However, an incomplete MT with the incomplete end closer to the midplane could have its midpoint in either half-spindle, depending on how much farther it extends, and thus it cannot be assigned a polarity.
MTs in bundles required a refinement of the initial polarity assignments. With assignments made as described above, some bundles had a great im- balance between the numbers of MTs from the two poles, which was proba- bly a result of the fact that most bundles were not centered between the poles. For the early and mid-anaphase models, we therefore assigned polari- ties to MTs in bundles based upon the positions of their midpoints relative to the middle of the bundle rather than the spindle midplane. Several ways of defining the middle of the bundle were explored and evaluated by comput- ing the strength of close association between MTs of opposite or of like polarity. Even the initial polarity assignment showed a stronger association between MTs of opposite polarity throughout metaphase and anaphase, just as we have shown for telophase (McDonald et ai., 1991, 1992). Because polarity-specific association is thus a feature of all mitotic stages, we as- sumed that polarity assignments that gave the greatest difference between the strengths of association for antiparallel and parallel MTs were mostly likely to be correct. An iterative method based on minus end positions max- imized this difference for both early and mid-anaphase models. Starting with the initial polarity assignments for a given bundle, the average posi- tions of the minus ends on each side were computed, the center was redefined as the mean of the two average minus end positions, and polarities were reassigned. This process was repeated until convergence (1-3 cycles). Only complete MTs were included in this process, but once the final center of the bundle was determined, polarities could be assigned to some incom- plete MTs as described above.
Extent and Effect of Tracking Errors Because of the quality of our fixations (McDonald et al., 1992), the care taken in alignment of serial images, and the availability of a large image
memory that permitted rapid viewing of successive serial sections, the inci- dence of errors in our reconstructions is low. A pdncipai concern is whether tracking errors bias the distances that we report between MT minus ends and the poles. Three kinds of errors could have degraded the quality of our spindle models: connections between the middle of one MT and the middle or end of another; failures to connect a MT across several sections with am- biguous images, resulting in two short MTs instead of one long MT; and connections between two different MTs whose ends abut, resulting in inap- propriately long MTs. Errors of the first kind will not affect our analysis of end distributions, whereas errors of the second and third kind will bias minus end positions away from and toward the pole, respectively. When modeling, we took special care to avoid the second error by continuing to track a MT whenever possible. Moreover, after we obtained final aligned models, we used a computer program to search for pairs of MTs with nearby ends that could plausibly be connected. We examined the trajectories of these MTs (6-8 pairs for each model) and judged that about two connections were needed in each model. In this way, the second kind of error has effec- tively been eliminated, although perhaps at the expense of the third error, connecting two different MTs. Our minus end positions are thus biased, if at all, toward the pole. In any event, our various assessments of the inci- dence of tracking errors have indicated that it is not high enough to have an appreciable effect on our conclusions.
Other Limitations of the Data Our assignments of MT polarity are only an approximation, based on the assumption that most of a MT is located in the half-spindle containing its minus end. Since the growth of the plus end of a long MT should be inde- pendent of the location of its minus end, this assumption is not necessarily correct. Uncertainties in polarity assignment limit our ability to determine whether apparent associations between nominally parallel MTs represent weak associations between truly parallel MTs or contamination from as- sociations between antiparallel MTs that have been misassigned as parallel. However, these uncertainties cannot account for the large spread that we found in the distances of minus ends from the pole. When polarities were assigned by an alternative method that minimized these distances (i.e., the MT end closest to a pole is assigned as the minus end), the distributions of these distances appeared essentially the same as those presented here. With perfectly correct MT polarities, the dispersion of pole distances would probably be even greater than that which we report.
Only a limited number of cells were reconstructed. However, all cells were taken from the same preparation, many of the phenomena described below are present in more than one mitotic stage, and our quantitative mea- sures generally show a smooth progression across stages. These features of the data suggest that replication at each stage would provide little new infor- marion.
Results
Projections of the 3-D reconstructions, such as the early anaphase model in Fig. 1, give a sense that the ends of MTs are spread throughout the spindle and that MTs from the two half-spindles interdigitate considerably at early stages of mi- tosis. The undifferentiated collection of MTs in Fig. 1 A be- comes more informative when it is dissected into its specific components, the kMT bundles and the nonkMTs associated with each pole (Fig. 1, B-D). Although these projections do convey the large extent of interdigitation, they are of limited use. In the sections that follow, we use a variety of methods to display and quantify the relative positions of the nonkMTs and thereby to characterize the rearrangements that accom- pany spindle action. To assist the reader in following the main points, supporting details are described in small-print paragraphs.
MT Classification and Terminology We have chosen to refer to all of the nonkMTs that lie be- tween the centrosomes as interpolar MTs (ipMTs). The zone of interdigitation in metaphase or early anaphase is not
Mastronarde et al. lnterpolar Microtubules in PTK Cells 1477
on March 21, 2018
jcb.rupress.orgD
ownloaded from

Figure 1. Projections of sub- sets of MTs reconstructed from the early anaphase cell. (A) All MTs tracked in this cell. (B) MTs associated with nine kinetochores. (C and D) MTs whose minus ends were associated with the pole on the left or the right, respectively. There are more short MTs near the pole on the left be- cause such MTs were com- pletely tracked on that side but not on the other side of the cell. Vertical lines are the projections of boundaries around the centrioles. Bar, 1 /xm.
confined to the region between sister kinetochores (e.g., Fig. 1), nor have we found a clear distinction between MTs that reach the latter region and those that do not. For these rea- sons, we do not use the term "interzonal MTs" which has of- ten been used for MTs visible between the separating kinetochores. Previous studies have classified nonkMTs as polar (closely associated with one pole), continuous between the two poles, and free of polar association (for review see McDonald, 1989). However, we have also found no distinct populations of MTs that might correspond to such classes. We have therefore abandoned these categories,
The absence of distinct populations of ipMTs was determined with dis- plays such as Fig. 2, which shows the distances between the ends of ipMTs and the poles for the early anaphase model. For each completely tracked
MT, the distance of its +Z end from the +Z pole is plotted versus the dis- tanee of its -Z end from the -Z pole. MTs that were much closer to one pole than another are represented by points in the upper left and lower right comers of the graph; MTs whose ends were nearly equidistant from the two poles are represented near the diagonal line. Longer MTs appear closer to the origin. There are no concentrations of points that would correspond to free, continuous, or polar MTs. Furthermore, although there are clearly numerous short MTs near each pole, they do not form a population separate from the longer MTs. Our data thus contain no basis for a rigorous distinc- tion between interpolar MTs and short, polar MTs.
The distribution of ends shows no distinct gap between points above and below the diagonal line, even though the points must arise from two separate populations, i.e., the MTs that emanated from each of the two centrosomes. The lack of a gap suggests that the two populations of MTs on this graph overlap, implying that some MTs are located farther from the centrosome that initiated their growth than from the opposite centrosome. Thus, polarity
The Journal of Cell Biology, Volume 123, 1993 1478
on March 21, 2018
jcb.rupress.orgD
ownloaded from

~ x 0 0 0
10 o
7 o oo°o o° @ 0
N × o o
3
® ooi. o ° ° g o , ,o
• •
"~ : o° ~ o
0 2 4 6 8 10
Pole distance of -Z end of tdT (/zm)
Figure 2. Scatterplot showing location of MT ends relative to the poles for every completely tracked MT in the early anaphase cell. For each MT, the distance from the pole at high Z (the +Z pole) to the MT end closest to that pole (the +Z end) is plotted versus the distance from the - Z pole to the - Z end of the MT. The dashed line shows the locus of points equidistant from the two poles. The asymmetry between upper left and lower right corners arose be- cause, in this cell, short MTs near the - Z pole were tracked whereas those near the +Z pole were not.
0
• 0 0 0
0 0
OQ
O0
o
• 0 0 • o 0 0 O 0 e
• 0 0
0 0 0 • • 0
0 0 O0 0 0 • 0 •
0 0 •
o o
assignments based on the positions of MTs between the poles are likely to be erroneous for some of the MTs that lie nearly equidistant from the two poles.
MT Bundling from Metaphase through Telophase Associations between MTs from opposite poles are likely to be important for mitosis because they allow comparatively short ipMTs to form an interpolar framework that may pro- vide structural integrity for the spindle and mechanical sup- port for the forces exerted on the chromosomes. Interpolar MTs form obvious clusters in the midplane of mitotic cells, not just at telophase (Paweletz, 1967), but throughout anaphase. Fig. 3 A is a representation of a cross section near the midplane of a bundle from early anaphase. In such clusters, many MTs are separated by 30-50 nm center-to- center, the spacing characteristic of interdigitating MTs in the mammalian interzone (McDonald et al., 1991, 1992). Moreover, the MTs remain clustered over a considerable dis- tance in Z (over 20 sections in early or mid-anaphase, less thereafter). In our analysis, a bundle was defined as a set of MTs that had the characteristic close spacings, plus any other MTs that fell inside the envelope of the closely spaced MTs within about 2 #m of the midplane. Closely spaced MTs will be referred to as "associated; without suggesting any mecha- nism for the association.
Metaphase spindles did not contain sizable ipMT bundles comparable to those present in anaphase. As illustrated in Fig. 3 B, the central region reconstructed in the metaphase cell contained none of the bundles of 10-30 MTs seen in
Figure 3. Representations of MTs in cross section. (A) A portion of the reconstructed area in the early anaphase cell, three sections from the spindle midplane. The polygon was drawn to specify which MTs were in a bundle. Although the enclosed points appear to comprise two or three separate clusters, these groups merged within a few sections. (e) MTs that are within the polygon on this section; (x) other members of the bundle that fell within analogous polygons on other sections; (o) MTs that were not members of the bundle. (B) A portion of the reconstruction in the metaphas¢ cell, illustrating the lack of obvious bundles. (e) MTs that were paired with (separated by <55 tun from) at least one other MT over a dis- tance of at least 0.6 tom. The symbols are about the same size as MTs (25 nm). Bar, 250 rim.
early or mid-anaphase. Nevertheless, three points indicate that some forerunners of the anaphase bundles were already present in metaphase. First, there were numerous sets of 2-6 MTs with center-to-center spacings of ,~40 nm (e.g., Fig. 3 B). Second, an analysis of neighbor densities over the entire reconstructed region, averaged over several sections, re- vealed a sharp peak in density extending to 55 nm (Fig. 4 A), similar to but weaker than the peaks found at later stages (McDonald et al., 1991, 1992). The peak in neighbor density shows that the spacings of ~40 nm were much more frequent than would be expected by chance and that some MTs in metaphase had the close spacings characteristic of the bun- dles in anaphase. Third, these associations extended over considerable distance in Z.
To assess the extent of MT associations in Z and to develop objective 3-D criteria for MT association, we computed the
Mastronarde et al. Interpolar Microtubules in PTK Cells 1479
on March 21, 2018
jcb.rupress.orgD
ownloaded from

A All MTs B Parallel
120 3
"~ 90 ,
60 ] _ 60 C Anfiparal lel tn g
30 3
O ~ , , , O 50 1(30 150 200 O 50 100
Distance f rom each MT (nm)
Figure 4. Graphs of the average density of neighboring MTs as a function of distance from a MT center for a metaphase cell. Densi- ties were computed over the entire reconstructed area and were averaged over a set of 13 sections consisting of every other section out of the 25 sections centered on the spindle midplane. (A) Density of neighboring MTs regardless of their polarity. The peak indicates that MTs lay within 55 nm of each other more often than ifMT posi- tions were random (see McDonald et al., 1992). (B and C) Density of parallel and antiparallel MTs, respectively. The close associa- tions were predominantly between antiparallel rather than parallel MTs. The dashed lines indicate the densities at 60-100 urn; this density was subtracted off in measuring the strength of each peak.
length over which each pair of MTs was within 55 nm of each other. These computations revealed a small subset (~o8%) of metaphase MTs that were associated in sets of 2--4 over long distances (2-6/zm). The distributions of lengths of associa- tion for metaphase and early anaphase suggested that 0.6 #m (eight sections) was a reasonable criterion for distinguishing between MTs traveling in parallel and the more numerous pairs of nonparallel MTs that make only tangential close ap- proaches. In Fig. 3 B, MTs that were paired with another MT for at least 0.6 #m are represented by filled circles. These paired MTs are members of most of the groups of 2-6 closely spaced MTs in Fig. 3 R The few unmarked MTs that appear close to other MTs in this section made only tangential close approaches. The metaphase MTs that were longitudinally associated thus corresponded largely to those seen in cross section as small groups with close inter-MT spacings. We conclude, therefore, that metaphase spindles contain the ru- diments of ipMT bundling.
We have considered whether the region chosen for reconstruction con- talned a representative sample of metaphase bundles. Peripheral to the main reconstructed area, there was a collection of nearly 100 MTs that appeared much denser than the display in Fig. 3 R This area was reconstructed from pole to pole. In spite of the high MT density in this region, the overall as- sociation between MTs, as measured by the strength of the peak in a neigh- bar density analysis, was even weaker than in the central area, so this collec- tion was not a proper bundle. In other metaphase cells that were examined, we found slightly larger and more obvious bundles. For example, one bun- die of 11 MTs was tracked through 71 sections. Nonetheless, even the more obvious bundles in metaphase spindles were smaller than those seen in anaphase.
We have assessed the development of order among the ipMTs by quantifying their close spacings and the degree to which these associations were specific to MTs of opposite polarity. Neighbor density was analyzed either in the entire reconstructed cross-sectional area or in the MT bundles. Results were summed over bundles and over as many sec- tions as were appropriate for each stage (see Fig. 5 legend
v
0
E
0.8-
0.4
0
De Al l MTs
W h o l e m o d e l
I 1 I
®
o / °
i u I .< .< .< ~-- z z t.i .< .<
z~, A n f i p a r a l l e l []m P a r a l l e l
B u n d l e s o n l y
2.0-1 ' J J J
0.8 . /
0.4-t * / * .. m~m_~-m ~m
0 j i i i i
"~ ~ "~ 0 Z z z _1
I I I h ud ~: .J
Figure 5. Strength of association between MTs generally, between parallel MTs, and between antiparallel MTs, as a function of stage in mitosis. The ordinate is the number of MTs counted in the peak of a neighbor density graph, minus the number expected from the appropriate baseline density of MTs (see McDonald et al., 1992, for details). (A) Integrals based on densities computed over the en- tire cross-sectional area in the pole-to-pole reconstructions. Densi- ties were averaged over a set of 12-13 sections consisting of every other section out of the 23-25 sections centered on the spindle mid- plane. The average density at 60-100 um was used as a base line. (B) Integrals based on densities within bundles only. Densities were averaged over three consecutive sections for late anaphase (DANA), three sections for mid-anaphase (M-ANA, every other section out of the five centered on the bundle midplane), and five sections for early anaphase (DANA, every other section out of the central nine). The average density at 100-200 nm was used as a base line.
for details). The number of MTs counted in the peak of the density graph, in excess of those expected by chance (the area above the dashed line in Fig. 4), is plotted for all stages of mitosis in Fig. 5. This number increased from metaphase through late anaphase, with the sharpest rise occurring be- tween mid- and late anaphase.
The association between antiparallel MTs was always stronger than that between parallel MTs (see Fig. 4, B and C for a specific example, Fig. 5 for integrals at all stages). Indeed, most of the increase in overall strength of association can be attributed to an increase in the number of antiparallel near neighbors; the number of parallel neighbors was roughly constant.
The difference in number of antiparallel vs. parallel neighbors has been examined in more detail for metaphase, where MT bundling is sparse. The difference was clear for the central reconstruction (Fig. 4, B and C). The more peripheral MTs in this cell did not show such a difference. However, their overall association, with an integral of only 0.1 MTs, was probably too weak to give an accurate measure of the phenomenon. The small bundle reconstructed in another metaphase cell did show a difference, with in- tegrals of 0,8 MTs overall, and 0.34 MTs for antiparallel or 0.03 M'ls for parallel neighbors. Thus, to the extent that groups of metaphase MTs had appreciable associations, they were preferentially between antiparallel MTs, just as later in mitosis.
The packing order of MTs in bundles increased along with the sharpening in the distribution of MT spacings. Fig. 6 shows MT density as a function of angle between vectors that connect the center of each MT with the centers of its near
The Journal of Cell Biology, Volume 123, 1993 1480
on March 21, 2018
jcb.rupress.orgD
ownloaded from

.-. 800 t
"E 0 ~1600
c 800 @
I I I I I
I , 1 i ! I
0 0 0
I I I I I
C L-ANA
60 120 180
D
I I I I
B M-ANA
F I I 1 I
I I I
TELO
- - t i i / I
60 120 180 Angle from neighboring MT (degrees)
Figure 6. Angular neighbor density graphs showing the develop- ment of hexagonal packing during anaphase. The graphs show the average density of near-neighboring MTs (ones within 50 nm of a central MT) as a function of angle between near neighbors. Densi- ties were averaged over bundles and sections just as described for Fig. 5 B. (A) Early anaphase, (B) mid-anaphase, (C) late anaphase, and (D) telophase.
neighbors (ones within 50 nm). No packing order is evident in early anaphase (Fig. 6 A) or metaphase (not shown), ex- cept for the dip at small angles, which is a necessary result of neighbors being separated by at least one MT diameter. The other graphs show hexagonal packing, i.e., enhanced
density of neighbors at 60, 120, and even 180 °, with the effect increasing most strongly from mid- to late anaphase and be- coming somewhat stronger by telophase.
Longitudinal Structure of the Region of lpMT Overlap
Anaphase B in some spindles is accompanied by changes in the extent of overlap between ipMTs associated with the two spindle poles. Such changes may be related to the sliding of these two sets of MTs (Hogan and Cande, 1990). We have therefore examined the longitudinal structure of the overlap zone in PtK cells over the course of mitosis. Rather than a steady progression of change, we have found a significant narrowing of the overlap zone only between mid- and late anaphase.
Fig. 7 displays the positions of MT plus ends and the over- lap of spindle MTs at various mitotic stages (see legend for details). Single bundles from early anaphase and telophase are presented in Fig. 7, A and B; data combined from all available bundles in mid- and late anaphase appear in Fig. 7, C and D. The extent of overlap clearly narrowed between early and later mitotic stages. One measure of this overlap, the mean distance of the MT plus ends past the bundle centers, is shown in Fig. 8 A. To pro~,ide a link between metaphase and the later stages, this mean is shown for all ipMTs in the model for metaphase through mid-anaphase, and for ipMTs that were closely paired with another ipMT for at least 0.6 #m in the metaphase and early anaphase models. The MTs in bundles extended much farther past the spindle midplane than did the rest of the MTs (Fig. 8 A). An
Figure 7. Representations of the overlap between ipMTs from the two half-spindles. MTs associated with the - Z pole are shown as lines or- dered by the increasing Z value of their plus ends; MTs associated with the +Z pole are ordered by the decreasing Z value of their plus ends. The two sets interdigitate. Each MT's position in Z is ex- pressed relative to the center of its respective bundle, which was computed by finding the mean of the plus end positions of MTs from each side, then averaging these two means. These relative Z values allow data from the various bundles in a cell to be combined, generating a view of average overlap. (A and B) Single bun- dles from early anaphase and telophase, respectively. (C and D) Combined results from five bundles from a mid- anaphase cell and eight bun-
dles from a late anaphase cell, respectively. The slopes of lines fit to the plus ends may be compared directly between C and D because the average of the vertical extents of the two sets of interdigitating MTs is the same for the two graphs; the same is true for A and B. The ends on the left and fight edges of the displays represent both true minus ends and spurious ends of incompletely tracked MTs; the latter is the case for some of the MTs in A and C and for nearly all MTs in B and D.
Mastronarde et al. lnterpolar Microtubules in PTK Cells 1481
on March 21, 2018
jcb.rupress.orgD
ownloaded from

~ 2.5- E :~ -
"~ 2.0- -
1.5-
~. -
1.O- E O
"~ 0.5 i - o
0
oWhole model
i I I I I
i i i i i
' < " < "< ' < 0 I - - : Z Z Z . - I
ba ,-~ _I
•Bundles
3.0 E
~ 2.o E
° 1.4
o a_ 1.0
E
-,~ 0.6
0.4 o
t~ 0.2
A Paired MTs
I I I l I
®
i i , , i
' < ' < ' < ' < 0 Z Z Z
I I
Figure 8. Changes in the extent and dispersion of the overlap be- tween MTs from the two poles over the course of mitosis. For MTs in bundles, the distance of each MT's plus end past the midplane of the bundle was measured (e). For cells with pole-to-pole recon- structions, the distance of every MT's plus end past the spindle mid- plane was also measured (o). For metaphase and early anaphase, this distance was measured for each ipMT that was paired with an- other ipMT (separated by <55 nm) over a length of at least 0.6/~m (A). Error bars are 74% confidence limits; means with nonover- lapping error bars are significantly different with P < 0.05. (A) Mean MT distance past center; error bars are based on the standard deviation of these distances. (B) Standard deviation of distance past center; error bars for bundled MTs are based on the variation in standard deviation among bundles in each cell. META, metaphase; E-ANA, M-ANA, L-ANA, early, mid-, and late anaphase; TELO, telophase. For metaphase, the value for the peripheral concentra- tion of MTs is plotted to the left of the ~al~e for the central recon- struction.
average length of overlap may be estimated by doubling the mean distance past center; for bundled MTs, this value was over 2.6 #m through mid-anaphase, but it dropped to 0.4 s m by late anaphase.
A marked narrowing of the distribution of plus ends ac- companied this decrease in mean overlap. Note that most of the plus ends of MTs from one half-spindle fall near a straight line in each display of Fig. 7; such lines become much steeper between mid- and late anaphase. This change in the distribution can be characterized by the standard devi- ation of the distance of the MT plus ends past the bundle centers. This parameter is plotted on a logarithmic scale in Fig. 8 B to show all of its significant changes: the distribu- tion of end positions apparently broadened slightly from metaphase through mid-anaphase, narrowed fourfold by late anaphase, and became even tighter by telophase. A high value for this standard deviation was also found in our in- complete mid-anaphase reconstruction. In sum, these results show that the arrangement of plus ends of ipMTs changes lit- tle from metaphase to mid-anaphase B, and then the extent of MT interdigitation decreases while the plus ends become more tightly registered near the spindle midplane.
Positions of M T Minus Ends Relative to the Poles and the Midplane
The locations of the ipMT minus ends were also examined;
20-
10
0 0
~8 20
..Q
E 10- 7
0 t
q•11•
Id[TA ®
2 3 4 5
E-ANA
T 2 3 4 5
30.
20.
10-
0
10-
0 0
1 2 3 4 5 6 7
Id- ANA
®
i
L-ANA ® i i , i i
1 2 3 4 5 6 7 8 9 10
Pole distance of minus end of MT (/~m)
60-
40- .
20-
0 0
E-ANA ktdTs
2O ©
10
2 3 4 5 0
Pole distance of kMT (/~m)
-, _ , , r _ i 2 4 6 8 10
MT length (/~m)
Figure 9. (A, B, D, and E) Distributions of distances between the pole and the minus ends of interpolar MTs. (A) Metaphase. (B) Early anaphase, including only the distances available before com- pletely tracking MTs near the - Z pole, so as to be comparable to the distributions in A and D. (D) Mid-anaphase. (E) Pole distances for MTs that reached within 20 sections of the midplane in a small area of the late anaphase cell. The crosses show estimated positions for two MTs that were tracked to within 2.5 #m of the pole. (C) Distances from the pole to minus ends of MTs of nine bundles of kMTs in the early anaphase cell. (F) Distribution of lengths for ipMTs associated with the - Z pole of the early anaphase cell.
they were located at a broad range of distances from the nearest centrioles, as shown by the distributions in Fig. 9. The vast majority of ipMTs ended outside the region oc- cupied by visible pericentriolar material, which extended "~0.5 t~m from the point that we have called the pole. Kinetochore MTs ended much closer to the pole (compare Fig. 9, B and C from early anaphase). About 75 % of kMTs, but only ,v25% of ipMTs, ended within 1 t~m of the pole.
A comparison of ipMT minus end positions at different stages of mitosis shows that the distribution of these ends be- comes broader from metaphase through anaphase. The dis- tributions consist of a main peak, whose position was fairly constant over time (1.3 txm from the pole in metaphase, 1.6 /~m in early and mid-anaphase), and a growing tail, representing minus ends that lay farther than 2.5 ~m from the pole (see especially Fig. 9 D). By late anaphase, however, nearly all of the MTs tracked toward the pole ended before the chromosomes were reached, >3 t~m from the pole (Fig. 9 E). This result is consistent with immunofluorescence ira-
The Journal of Cell Biology, Volume 123, 1993 1482
on March 21, 2018
jcb.rupress.orgD
ownloaded from

E _
v 1 2 -
_~ IO- " O -
"~ 8-
E
o 4 - (..-
"~ 2-
t I t I t
® / / x
/ x
/ x -''- x ~ l l
! t i t i
< < .< < o v-- z 7 z ._2 t.d < .< < ~.~ =2; t t t v-.-
ha 2[ ._J
x Sp ind le po le
n , , M i n u s end m e a n
• Minus end 24fh %ile
o eMT leng th
8 I I I I
._.1 2 i i i i
< .< < .< ~- z z "7
. J
Figure 10. (A) Comparison of changes in spindle length and minus end positions from metaphase through telophase. The graph shows distances from the spindle midplane to the spindle pole (x), to the mean position of interpolar MT minus ends 03, all MTs; m, bun- died MTs), and to the position by which minus ends were reached for 24% of bundled ipMTs (A). (B) Mean lengths of all ipMTs (o) and bundled ipMTs (o). Error bars are 74% confidence limits. For the mean positions in A (squares), error bars before late anaphase were smaller than the points and were omitted for clarity. For metaphase, the value for the peripheral concentration of MTs is plotted to the left of the value for the central reconstruction.
ages that show most interzonal MTs ending far from the poles by late anaphase (e.g., Saxton and Mclntosh, 1987). The change from mid- to late anaphase represents a marked departure from the mild trends visible up to mid-anaphase; it is as if the tail of the earlier distribution continued to grow and the main peak essentially vanished.
To estimate the distribution for late anaphase (Fig. 9 E), we selected three of the bundles previously reconstructed over only 45 sections through the interzonc and tracked the MTs on one side to,ward the pole. This limited tracking leaves open the possibility that late anaphase too contained numer- ous ipMTs with ends 1-2 #m from the pole. However, if such MTs did exist, they were too short to reach the overlap zone and did not participate in bun- dling with antiparallel MTs.
The extent to which minus ends of ipMTs on the two sides of the cell move apart along with the poles during anaphase B may be assessed by comparing the half-spindle length to the distance of minus ends from the spindle midplane (Fig. 10 A). From metaphase to mid-anaphase, half-spindle length increased by 1.8/~m, while the distance of all minus ends from the midplane increased by nearly as much. After mid- anaphase, however, the minus ends of the bundled ipMTs did not move outward from the midplane, despite considerable spindle elongation.
To assess whether minus ends of ipMTs were farther from the cell mid- plane in telophase than at earlier stages, we extended the telophase models toward one pole as far as was possible with the negatives available. We found minus ends for 28 of the 116 MTs (24%) that had been identified as as- sociated with that pole. For each anaphase model, we then considered all of the bundled MTs with identified polarity and counted minus ends while moving outward from the spindle midplane to determine the distance by which the minus ends for 24% of those MTs had been reached (a "24th per- centile" distance, plotted as crosses in Fig. 10 A). Although the precise loca- tion of the other 76% of minus ends in telophase is unknown, it appears highly unlikely that minus ends moved away from the midplane by nearly as much as the poles separated from late anaphase to telophase.
In fact, the bundled ipMTs failed to keep up with the extent of pole separation even before mid-anaphase; mean dis- tances of minus ends from the midplane for bundled and un-
Table 11. Distances of Kinetochore Microtubule Minus Ends from the Centrioles
Number Number of kMT
Stage in mitosis of cells bundles Distance from centrioles
/am
Metaphase 2 4 0.74 + 0.07 (100) Mid-anaphase A 1 3 0.77 + 0.06 (82) Late anaphase A 2 3 0.79 + 0.06 (61)
Metaphase 1 3 0.47 + 0.14 (78) Early anaphase B 1 9 0.57 + 0.03 (240) Mid-anaphase B 1 5 0.48 + 0.04 (106)
Distances are given as mean + SE (number of kMTs) and are based on the num- ber of sections between the end of each kMT and the first section containing a centriole. The first three lines are from kMT reconstructions in McDonald et al. (1992).
bundled MTs were 4.1 and 4.0/~m in early anaphase (not a significant difference) and 4.9 and 5.4/zm in mid-anaphase (P < 0.01 on a two-tailed t-test). In other words, from early to mid-anaphase, the minus ends of bundled ipMTs moved away from the spindle midplane by only 0.8/~m, while the unbundled minus ends and the poles both moved 1.4 #m.
During this same period, the minus ends of the kMTs stayed at an essentially constant distance from the poles. We measured the distance in Z from the minus end of each kMT to the first section containing a centriole, because this value couM be obtained easily from our previous reconstructions (McDonald et al., 1992) as well as from the current ones. This distance did not increase significantly during anaphase for either set of reconstructions (Table II). Unlike the bun- died ipMTs, the kMTs stayed close to the poles during anaphase.
To describe anaphase changes in spindle structure, we must also consider MT length. Mean MT length increased somewhat as the spindle lengthened through mid-anaphase, but it fell by 0.9 #m thereafter (Fig. 10 B), again suggest- ing a difference between the processes of early and late ana- phase.
The mean lengths of all MTs shown in Fig. 10 B are based on biased (but consistently collected) distributions, because short MTs that did not extend >2.5/~m from the pole wero not tracked. We have a relatively unbiased esti- mate of the overall MT length distribution only for one half-spindle of the early anaphase cell (see Materials and Methods). The resulting distribution for complete ipMTs (Fig. 9 F) shows a peak at short lengths and a progres- sive decay, in accord with expectations from the dynamic instability model for MT behavior in cells (Hill, 1987).
M T Ends and Kinetochore Bundles
Studying the projections of whole models (Fig. 1) revealed little about the relationships between ipMTs and kMTs; even displays of all kMTs and just the endpoints of the ipMTs were relatively unilluminating. However, when we examined kNITs and the ends of ipMTs in thick (,,o0.5 #m) slices of our models, it was apparent that the ipMT ends were con- centrated in the kMT bundles. Fig. 11 A shows a cross- sectional slice derived from eight sections of the early anaphase model. The MT ends appear clustered in the kMT bundles. A longitudinal slice including about half of the kMTs from two bundles shows the same phenomenon (Fig. 11 B). To quantify the tendencies seen in Fig. 11, we deter- mined the frequency at which ipMT ends occurred per unit
Mastronarde et al. lnterpolar Microtubules in PTK Cells 1483
on March 21, 2018
jcb.rupress.orgD
ownloaded from

/1 o Plus end , . ~ ]1 ~ / • MTnus end
o
• o o o e
@ ~t~ '~ t /~ ~ o
o
o • o
o o o o
Figure 11. Projections from the early anaphase cell illus- trating that ends of ipMTs, represented by symbols, were concentrated among the kMTs, represented by lines. (A) Projection of eight sec- tions (0.6 #m) along an axis passing between the five kMT bundles. (B) Projection of a 0.38-t~m-thick longitudinal slice containing about half of the kMTs in two bundles. The vertical line at the left is a projection of a centriole boundary. Bar, 0.5 #m.
length of MT in small regions inside or at various distances from kMT bundles.
The frequency of ipMT ends per unit length of MT, as a function of dis- tance from a kMT bundle, was computed as follows. On a given section, the position of a kMT bundle was characterized by the centroid of those kMTs and by a boundary 50 nm outside the smallest convex polygon that contained all of the kMTs. The position of an ipMT relative to a kMT bun- de was computed by forming the line between that MT and the centroid of the bundle, and dividing the distance from the MT to the eentroid by the distance from the boundary to the centroid along that line. This ratio ranges from 0 for a MT at the center of the bundle, to 1 at the boundary, to >1 outside the bundle. When more than one kMT bundle was present, the dis- tanee to the nearest bundle (i.e., the one that gave the smallest relative dis- tance) was used for each ipMT. For each ipMT, a distance was computed in each section in which the MT appeared, over the range of sections being considered. To obtain the frequency of MT ending, the number of ipMT ends at a particular range of distances from the centroid of the nearest kMT bundle was divided by the total number of ipMTs at those distances. For a particular graph of frequency versus distance, distances were allocated into bins so that the divisors for these frequency calculations would be ap- proximately equal. This allocation kept the sigoai-to-noise ratio nearly con- stant within each graph.
The top row of Fig. 12 shows the frequencies at which ipMT minus ends occurred at a series of distances from the pole in the early anaphase cell. At each distance from the pole, the graph rises sharply below a relative distance of 1-1.1 (Fig. 12, A-D), which means that MT ends occurred at a much higher frequency, per unit length, in or very near a kMT bundle than outside it. The frequency graphs also in- crease as a whole with decreasing distance from the pole, as one might expect for minus ends. The graphs for MTs farther than 1/~m from the pole (Fig. 12, A-C) were similar, so we combined data acquired beyond 1 t~m from the pole for each mitot ic stage to allow comparison between the different data sets (bottom row of Fig. 12; see legend for details). The fre- quency of ipMT ends was roughly five times higher inside k M T bundles than outside them during all stages examined (metaphase through mid-anaphase B or late anaphase A), both in the current reconstructions and in those of McDonald et al. (1992). Because frequencies expressed per length of MT remove the effects of any inhomogeneities in the distri- bution of ipMTs, the clustering of ipMT ends in kMT bun- dies cannot be explained simply by a general concentration of ipMTs there but must reflect a specific relationship be- tween the ends of ipMTs and the kMT bundles.
The early anaphase spindle, shown in Fig. 1, provided sufficient data to allow more detailed analyses, which yielded the following results. (a) In that spindle, most ipMT minus ends were located within kMT bundles. For example,
70% of ipMT minus ends beyond 1 #m from the pole were inside or very near (within ,v l00 nm of) a kMT bundle, whereas the kMT bundles occupied an average of only 35 % of the volume available to those ipMTs. (b) The plus ends of ipMTs also occurred at a higher frequency inside than out-
3 . 0 i I 1 J 1 i • = i = J i t i i i J i i t t i J i i
3 . 8 - 2 . 6 . J 2 .5 -1 .8 ! 1 .7-1.0 0 . 9 - 0 . 3
® ®l © ® - -I
2 ,0 - 1
~" 1.5- ]
0 . 5 -
~ . o ,~ . r AA M
~ 2.5 . . . . . . . . . . . . . . I . . . . . META E- ANA ~ -~ M- ANA
''O
0.5
0 i , i i i , ,
0 1 2 3 1 2 3 0 1 2 3
Position relative fo kinelochore MT bundle
Figure 12. Frequencies at which iEMT ends occurred, per unit length of iEMT, as a function of distance to the nearest kMT bun- dle. Distances are on a relative scale with 0 at the center, 1 at the edge, and values >l outside of a kMT bundle. See text for details. (A-D) Frequencies of ending for the early anaphase cell at different ranges of distances from the pole, as given in each graph in micrometers. (E, F, and G) Frequencies for ends greater than 1 #m from the pole in metaphase, early anaphase, and mid-anaphase, respectively. Values are for minus ends except in E, where data are from four kinetochore fiber reconstructions from McDonald et al. 0992). Values in E arc for pole-proximal ends regardless of polarity because ipMT polarity was not determined in those reconstruc- tions. Nevertheless, most of the ends counted in E were probably minus ends. Also, the locations of adjacent kMT bundles were not determined, so that some of the ends far from the reconstructed kMT bundle were probably in an adjacent bundle, which probably accounts for the frequency being higher at distances beyond 2 than from 1.4 to 2 in E.
The Journal of Cell Biology, Volume 123, 1993 1484
on March 21, 2018
jcb.rupress.orgD
ownloaded from

side a kMT bundle. (c) Both members and nonmembers of interzone bundles had enhanced frequencies of ending among kMTs. (d) The ipMTs of each interzone bundle were examined to see whether their ends were concentrated in only one kMT bundle on each side of the spindle. Bundles were fairly dispersed in the regions where the ipMTs entered kMT bundles; consequently ipMTs from a single bundle had their ends spread among two or three kMT bundles. There was thus no specific relationship between an interzone bun- dle and an individual kMT bundle.
Minus Ends and Points of Close Approach between KMTs and lpMTs
We have previously reported that ipMTs approached within 50 nm of kMTs significantly more'frequently than could be accounted for by the geometrical constraints imposed on ipMTs entering a bundle of kMTs (McDonald et al., 1992). The same arrangement was found in the current reconstruc- tions. Both bundled and unhundled ipMTs frequently came close to kMTs. Since many ipMTs ended among the kMTs, we examined how often the ipMT ends were near kMTs and whether associations between the ipMT ~nds alone and kMTs could account for the frequent close approaches be- tween ipMTs and kMTs.
Most of the ipMT minus ends found inside the boundaries of a kMT bundle were located close to a kMT. Specifically, the number of ipMT minus ends within 75 nm of a point of close approach to a kMT was 1.5-2 times higher than ex- pected from the frequency of close approaches, suggesting a specific association between ipMT ends and kMTs. These approaches accounted for a substantial portion of all close approaches between ipMTs and kMTs; nevertheless, the re- maining close approaches between kMTs and points not at the ends of ipMTs still occurred significantly more often than expected by chance.
To evaluate these frequencies, we first calculated the distance from each ipMT minus end inside a kMT bundle to the nearest point of closest ap- proach to within 50 nm of a kMT. This distance was less than 75 ran (one section) for 54, 69, and 58% of MT minus ends in the metaphase, early anaphase and mid-anaphase kMT bundles, respectively. To see how many of these ends might be near points of close approach simply because there are so many such close approaches, the calculations were repeated after removing 225 nm (three model points) from the minus end of each MT. The fraction of these spurious ends near points of close approach was only 26, 46, and 38% for the three data sets, respectively. Similar results were ob- tained from our old kinetochore reconstructions. In fact, our previous illus- tration of close approaches between ipMTs and kMTs (Fig. 10 of McDonald et al., 1992) shows a high incidence of ends near points of close approach.
To determine whether the previously reported close approaches between ipMTs and kMTs could derive exclusively from associations between kMTs and the ends of ipMTs, we analyzed the frequency of points of closest ap- proach after removing 225 nm (three model points) from the pole-proximal end of each ipMT. This analysis revealed that the close associations between true ipMT ends and kMTs accounted for roughly half of the frequent close approaches between ipMTs and kMTs. Nevertheless, by randomly shifting the positions of the ipMTs as described in McDonald et al. (1992), we found that the remaining close approaches, ones between kMTs and points not at the ends of ipMTs, still occurred more often than expected by chance.
Clustering of lpMT Ends One possible interpretation of the spread in distances of mi- nus ends from the pole is that MT nucleating material occurs not just in the region of the visible pericentriolar material but also in small clumps beyond this region. When we tracked an ipMT to its end, we often noticed that one or more addi- tional MTs ended in the vicinity. This impression has been
evaluated by computing the density of nearby MT ends as a function of distance from each MT end in 3-D space. The resulting density graphs (for example see Fig. 13) were strongly peaked at short distances (,,o100 nm), confirming that MT ends were clustered together.
These density graphs had a complex appearance and their complete in- terpretation requires some care. The graphs typically showed an initial se- ries of sharp peaks followed by a gradual decay; this pattern is illustrated most clearly by the density of plus ends or of minus ends as a function of distance from a plus end (Fig. 13, A and C). The series of peaks in these displays arose because the Z coordinate was quantized by the section thick- ness; the individual peaks correspond to ends on the same section or sepa- rated by one, two, or three sections (75, 150, or 225 nm). The decay for distances beyond 300 tun arose from large-scale nonuniformities in end density and from the lack of ends beyond the edges of the reconstructed vol- ume. The density of minus ends around minus ends showed the same pat- tern, but the distinction between initial peaks and decay was not as clear, because of the confounding effects of minus ends being concentrated near the poles and within kMT bundles. The distributions suggest that MT ends were clustered. To control for the effects of large-scale nonuniformities in density, each end was shifted in the X-Y plane (the plane of section) by a random amount between 200 and 400 nm. The graphs in Fig. 13, B and D, are the average of 50 independent random controls. Comparison with the actual density graphs shows that ends had an above-chance tendency to be separated by <250 nm, although the clustering was strongest within 100 nm.
The clustering of ends is not an artifact of tracking errors or MT break- age. If the clustering occurred exclusively for the ends of pairs of MTs com- ing from opposite directions in Z, then one might suspect that such pairs arose either from a failure to track a single MT through a difficult spot, or from breakage of a MT into two. However, graphs showing the density of ends for MTs coming from the same direction in Z showed the same peaks as in Fig. 13, thus ruling out this potential explanation for the peaks.
Discussion
Our 3-D reconstructions of MTs in the spindles of PtK cells have revealed some new aspects of mammalian spindle struc- ture and its changes during mitosis. We have traced the de- velopment of bundling among ipMTs and demonstrated an increasing order in the zone of MT overlap from metaphase through telophase. We have examined the positions of ipMT
4O', . . . . . . . . . '~ . . . . . . . . . .
Plus en t Minus ends
O ~ i J i i i r i i i i
0 200 400 600 800 1000 0 200 400 600 800 1000 Distance from each MT plus end (nm)
Figure 13. Clustering of ends of interpolar MTs. (A and C) Aver- aged density of MT plus and minus ends, respectively, as a function of distance in three dimensions from a MT plus end. The peaks reflect clustering of ends. (B and D) Corresponding control density graphs obtained by shifting each MT end in a random direction within the plane of section by a random amount between 200 and 400 nm.
Mastronarde et al. Interpolar Microtubules in PTK Cells 1485
on March 21, 2018
jcb.rupress.orgD
ownloaded from

7 ¢
• - - - - .
Figure 14. Summary of the arrangement of ipMTs in metaphase and mid- and late anaphase B, based on the MTs reconstructed in this study. Circles mark the minus ends of all ipMTs but not of kMTs. The positions of plus and minus ends are based on a representative sample of bundled and unbundled MTs at each mitotic stage. In metaphase, a few ipMTs form small but long bundles; the minus ends of ipMTs spread farther from the pole than those of kMTs and most are in or near kMT bundles. In mid-anaphase, many ipMTs are in bundles with extensive interdigitation; ipMT minus ends spread farther from the pole and some are still in the remaining por- tions of kMT bundles. By late anaphase, nearly all ipMTs are in bundles with interdigitation over a much shorter distance; minus ends of bundled ipMTs are no farther from the spindle midplane than in mid-anaphase. Bar, 1 pro.
ends and shown that plus ends are initially widely distributed but cluster during anaphase near the spindle midplane. Mi- nus ends of ipMTs are often located farther from the spindle pole than in lower eukaryotes and are clustered in the kMT bundles. Their distance from the poles increases while the kMTs retain their pole association in late anaphase. Many of these changes are summarized in Fig. 14. Below, we con- sider the origins of some of the time-dependent changes in spindle structure and some implications of our findings.
Structure of the MT Overlap Zone, MT Sliding, and MT Dynamics
The ipMTs of PtK cells appear to form a framework that connects the spindle poles from metaphase through mid- anaphase B. Some ipMTs were regularly spaced from one another at all mitotic stages from metaphase through telophase, as first reported for PtK cells by Brinldey and Cartwright (1971). Such associations were preferentially be- tween antiparallel MTs, and the degree of packing order in- creased throughout anaphase, as seen in the overall regular- ity of spacing, the strength of antiparallel associations, and the appearance of an hexagonal packing pattern. These fea- tures are similar to what has been observed in organisms with central spindles (McDonald et al., 1979; Tippit et al., 1983, 1984; Mclntosh et al., 1985; Ding et al., 1993). In these other studies, however, square packing was observed, either exclusively (Ding et al., 1993), shifting into hexagonal packing in late telophase (Mclntosh et al., 1985), shifting into mixed square and hexagonal packing by late prophase (Tippit et al., 1978), or shifting temporarily into hexagonal
packing during anaphase only (McDonald et al., 1979). Here we saw no suggestion of square packing at any stage. Because square packing is sufficient to maximize close ap- proaches between antiparallel neighbors, the denser hex- agonal packing suggests the existence of some force promot- ing MT bundling beyond that provided by interactions between antiparallel MTs. Such a force could occur if the molecules mediating antiparallel interactions were embed- ded in a matrix of material that exerted a general compres- sion on a bundle of MTs. Neither MT bundling nor the hex- agonal packing are likely to be due to the action of the cleavage furrow, because these phenomena precede furrow formation and are found in cells that accomplish cytokinesis without cleavage (Hepler and Jackson, 1968); also, MT bun- dling occurs when cleavage is blocked by cytochalasin (Schroeder, 1970).
Throughout mitosis, ipMTs from the two half-spindles overlap, but the geometry of overlap changes with time. From metaphase to mid-anaphase, the changes in MT end positions and lengths can be in~rpreted as resulting from sliding matched by polymerization at plus ends. Between mid- and late anaphase, however, two independent measures of the overlap fell dramatically: the average and the variabil- ity of the distance that MTs extend past the middle of the cell or bundle. The large decrease in the spread of plus ends has not been seen in reconstructions of simpler spindles (i.e., studies cited above). This change was accompanied by a drop in MT lengths and by only a mild increase in the dispersion of minus end positions. Because of these three contem- poraneous changes, the 2-pro decrease in the average length of overlap from mid- to late anaphase cannot be simply related to sliding and polymerization. Sliding confined to those MTs that extend past the midplane may occur, and it would help both to tighten the plus end distribution and to broaden the minus end distribution. However, because of the fall in MT lengths, such differential sliding could not be the sole source of the changes in end positions. More- over, the fact that the decrease in the spread of plus end posi- tions considerably exceeds the increase in the spread of minus ends suggests that differential sliding makes a minor contribution to the narrowing of the plus end distribution.
Although the changes in MT lengths and MT overlap from mid- to late anaphase are difficult to relate to MT sliding, they are probably correlated with changes in the stability and turnover of ipMTs. NonkMTs in PtK cells rapidly incor- porate new tubulin until mid-anaphase; thereafter, rapid tubulin turnover occurs only near the poles and at the tips of MTs in the interzone (Saxton and McIntosh, 1987; Shel- don and Wadsworth, 1990, whose late anaphase appears to correspond more closely to the mid-anaphase B described here). The rapid turnover occurs because MTs are in a state of dynamic instability (Mitchison and Kirsclmer, 1984; Horio and Hotanl, 1986). The change after mid-anaphase appears to represent a shift to generally depolymerizing con- ditions, in which MTs within the spindle that are not stabi- lized by antiparallel interactions tend to disappear. This fea- ture of anaphase has been found in a variety of organisms with simpler spindles and is discussed in McIntosh et al. (1985). The changes in the MT plus end distribution after mid-anaphase in PtK cells can be explained by changes in MT stability, if one assumes that the region in which MTs are stabilized is relatively narrow. In the transition from mid-
The Journal of Cell Biology, Volume 123, 1993 1486
on March 21, 2018
jcb.rupress.orgD
ownloaded from

to late anaphase, MTs that do not reach the narrow region of strong interactions would tend to disappear, while the por- tions of MTs that extend beyond this region would also tend to depolymerize. Thus, simple postulates about MT poly- merization and stability are sufficient to explain the rear- rangement of MT overlap after mid-anaphase.
Minus Ends of lnterpolar NITs Are Far from Poles as Early as Metaphase The minus ends of many ipMTs were located relatively far from the poles, well outside the region occupied by visible pericentriolar material. This finding is consistent with the decrease in total MT number near the pole reported for mammalian cells (Brinkley and Cartwright, 1971; McIntosh and Landis, 1971; McIntosh et al., 1975). There are at least two possible explanations for the distribution of minus ends. MTS nucleated near the centrioles might migrate away from them. Such migrations have been seen in Xenopus egg ex- tracts, where MTs appear to detach and then translocate away from the pole; these events are much more frequent in mitotic than in interphase extracts (Belmont et al., 1990). Alternatively, the MTs might be nucleated at the places where they are found in metaphase, in which case the polar region would be a rather ill-defined structure. Our finding that MT ends were clustered and often occurred on darkly staining material suggests the existence of small nucleating and/or anchoring structures distributed throughout the spin- die. However, the fact that clustering was not specific to mi- nus ends makes this interpretation suspect.
Julian et al. (1993) have proposed that the telophase mid- body in PtK~ cells is formed from newly nucleated MTs rather than from pre-existing interpolar bundles. They exam- ined the distribution of-t-tubulin, which has been suggested to be located at the minus end nucleating sites of MTs (Oak- ley et al., 1990). However, our data on early telophase (be- fore midbody formation) show that the minus ends of many bundled ipMTs are already closer to the midplane than to the poles. The MT rearrangements required to form the mid- body are thus less extensive than Julian et al. (1993) assume in making their proposal.
Relationships between KMT Bundles and IpMTs We have previously shown that ipMTs enter bundles of kMTs at a wide range of angles and make frequent close ap- proaches to within 50 nm of kMTs (McDonald et al., 1992). The more extensive reconstructions presented here have shown that most of the ipMTs entering the kMT bundle end there, and that these ipMT ends are at many, but not all, of the points of close approach to kMTs. These ipMTs include some MTS that are part of interzone bundles and some that are not. The reason for the concentration of ipMT minus ends in kMT bundles is an open question. This clustering could arise by an active process involving ipMT migration and/or capture, or may simply result from selective stabiliza- tion of the ipMTs that interact with kMTS.
The basic motif of nonklVlTs entering kMT bundles at high angles, particularly near the pole, has been seen in a variety of other cells: the alga Oedegonium (Schibler and Pickett- Heaps, 1987) and spermatocytes from a crane fly (Fuge, 1974, 1984) and from a flatworm (Fuge and Falke, 1991). This arrangement has been called a MT fir tree organization.
In higher plant cells (Haemanthus endosperm, Bajer and Mol~-Bajer, 1986; onion root, Palevitz, 1988) this organiza- tion appears at the light microscopic level as "branches" (bundles of nonkMTs) entering the "trunk ~ of a kinetochore fiber. Our reconstructions show that MTs from an interzone bundle in PtK cells generally disperse before they enter kMT bundles, so their ends are found in two or more kMT bundles as well as outside of the bundles. Because of this dispersion, PtK cells do not show fir tree structures at the light micro- scopic level, even though the mingling of ipMTs and kNITs is quite similar. There is, however, a difference between the kMT organiTation of PtK cells and others studied. The general impression from other reconstructions is that many kMTs end among nonklVlTs that extend closer to the pole (Fuge, 1974, 1984; Schibler and Pickett-Heaps, 1987; Fuge and Falke, 1991); whereas, in PIK cells, many nonkMTs end among kNITs that extend closer to the pole.
Several lines of evidence suggest that interactions between kMTs and nonkMTs oriented at high angles to kMT bundles (skew MTs) are an important aspect of spindle organization. In crane fly spermatocytes, the number of skew MTs that mix with a kMT bundle is correlated with the velocity of the chromosome or the amount of force presumed to be acting on it. These features decline together for bivalent autosomes during prometaphase then rise again in anaphase (Steffen and Fuge, 1982). Similar correlations exist for sex chromosomes (Fuge, 1985) and abnormal univalent autosomes (Steifen, 1986). Apparent cross-bridges between kMTs and nonklVITs have been observed, some of them between nonparallel MTs (Bastmeyer and Fuge, 1986; Fuge and Falke, 1991). We have previously suggested that the interactions at the points of close approach between kMTs and nonkMTs were weak in comparison to the interactions that bundle antiparallel MTs in the interzone (McDonald et al., 1992), because one would expect that molecules mediating a strong interaction between two MTS would tend to pull the MTs into alignment. How- ever, it is now clear that many of the points of close approach are between kMTs and the ends of nonkMTs; such interac- tions could be strong without inducing bundling. Further- more, although the interaction between any given pair of MTs might be relatively weak, the matrix of interactions be- tween the kMTS in a bundle and the collection of skew nonkMTs could be physiologically significant.
Implications of Linkage between IpMTs and KMT Bundles
The relative positions of ipMTs and kMTs during anaphase in PtK cells do not correspond with those seen in the spindles of lower organisms that possess well-structured poles. In such spindles, it is only at the pole that the two MT classes are close enough to be mechanically linked. The mammalian spindle may more closely resemble anastral spindles, such as those of higher plant cells, where direct linkage between kMTs and ipMTs must occur. Structural linkage between these two sets of MTs raises some interesting possibilities. For example, if there are sliding forces generated between antiparallel ipMTs from metaphase onward, then the cou- pling of ipMTs to kMTs would exert poleward forces on the kMTs, which could contribute to the poleward flux of kMTs (Mitchison, 1989; Mitchison and Salmon, 1992) and, in- directly, to the poleward motion of chromosomes. It is also
Mastronarde et al. Interpolar Microtubules in PTK Cells 1487
on March 21, 2018
jcb.rupress.orgD
ownloaded from
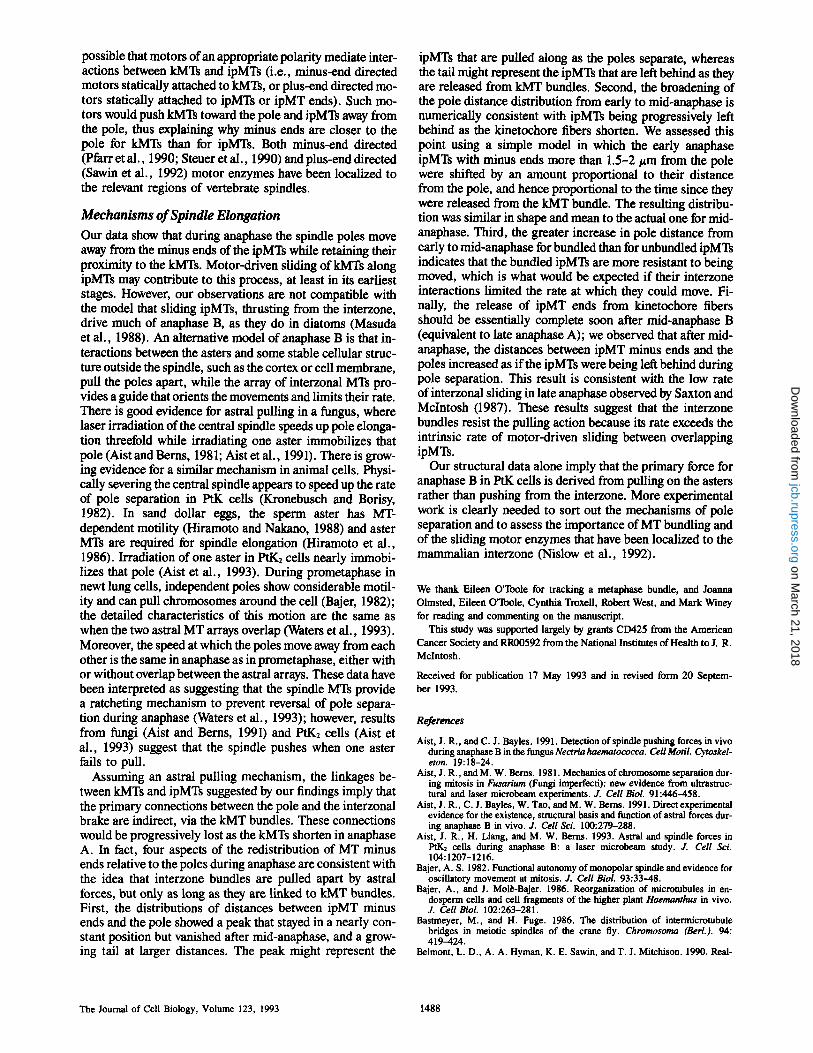
possible that motors of an appropriate polarity mediate inter- actions between kMTs and ipMTs (i.e., minus-end directed motors statically attached to kMTs, or plus-end directed mo- tors statically attached to ipMTs or ipMT ends). Such mo- tors would push kMTs toward the pole and ipMTs away from the pole, thus explaining why minus ends are closer to the pole for kMTs than for ipMTs. Both minus-end directed (Pfarr et al., 1990; Steuer et al., 1990) and plus-end directed (Sawin et al., 1992) motor enzymes have been localized to the relevant regions of vertebrate spindles.
Mechanisms of Spindle Elongation Our data show that during anaphase the spindle poles move away from the minus ends of the ipMTs while retaining their proximity to the kMTs. Motor-driven sliding of kMTs along ipMTs may contribute to this process, at least in its earliest stages. However, our observations are not compatible with the model that sliding ipMTs, thrusting from the interzone, drive much of anaphase B, as they do in diatoms (Masuda et al., 1988). An alternative model of anaphase B is that in- teractions between the asters and some stable cellular struc- ture outside the spindle, such as the cortex or cell membrane, pull the poles apart, while the array of interzonal MTs pro- vides a guide that orients the movements and limits their rate. There is good evidence for astral pulling in a fungus, where laser irradiation of the central spindle speeds up pole elonga- tion threefold while irradiating one aster immobilizes that pole (Aist and Berns, 1981; Aist et al., 1991). There is grow- ing evidence for a similar mechanism in animal cells. Physi- cally severing the central spindle appears to speed up the rate of pole separation in PtK cells (Kronebusch and Borisy, 1982). In sand dollar eggs, the sperm aster has MT- dependent motility (Hiramoto and Nakano, 1988) and aster MTs are required for spindle elongation (Hiramoto et al., 1986). Irradiation of one aster in PtK2 cells nearly immobi- lizes that pole (Aist et al., 1993). During prometaphase in newt lung cells, independent poles show considerable motil- ity and can pull chromosomes around the cell (Bajer, 1982); the detailed characteristics of this motion are the same as when the two astral MT arrays overlap (Waters et al., 1993). Moreover, the speed at which the poles move away from each other is the same in anaphase as in prometaphase, either with or without overlap between the astral arrays. These data have been interpreted as suggesting that the spindle MTs provide a ratcheting mechanism to prevent reversal of pole separa- tion during anaphase (Waters et al., 1993); however, results from fungi (Aist and Berns, 1991) and PtK2 cells (Aist et al., 1993) suggest that the spindle pushes when one aster fails to pull.
Assuming an astral pulling mechanism, the linkages be- tween kMTs and ipMTs suggested by our findings imply that the primary connections between the pole and the interzonal brake are indirect, via the kMT bundles. These connections would be progressively lost as the kMTs shorten in anaphase A. In fact, four aspects of the redistribution of MT minus ends relative to the poles during anaphase are consistent with the idea that interzone bundles are pulled apart by astral forces, but only as long as they are linked to kMT bundles. First, the distributions of distances between ipMT minus ends and the pole showed a peak that stayed in a nearly con- stant position but vanished after mid-anaphase, and a grow- ing tail at larger distances. The peak might represent the
ipMTs that are pulled along as the poles separate, whereas the tail might represent the ipMTs that are left behind as they are released from kMT bundles. Second, the broadening of the pole distance distribution from early to mid-anaphase is numerically consistent with ipMTs being progressively left behind as the kinetochore fibers shorten. We assessed this point using a simple model in which the early anaphase ipMTs with minus ends more than 1.5-2 #m from the pole were shifted by an amount proportional to their distance from the pole, and hence proportional to the time since they were released from the kMT bundle. The resulting distribu- tion was similar in shape and mean to the actual one for mid- anaphase. Third, the greater increase in pole distance from early to mid-anaphase for bundled than for unbundled ipMTs indicates that the bundled ipMTs are more resistant to being moved, which is what would be expected if their interzone interactions limited the rate at which they could move. Fi- nally, the release of ipMT ends from kinetoehore fibers should be essentially complete soon after mid-anaphase B (equivalent to late anaphase A); we observed that after mid- anaphase, the distances between ipMT minus ends and the poles increased as if the ipMTs were being left behind during pole separation. This result is consistent with the low rate of interzonal sliding in late anaphase observed by Saxton and Mclntosh (1987). These results suggest that the interzone bundles resist the pulling action because its rate exceeds the intrinsic rate of motor-driven sliding between overlapping ipMTs.
Our structural data alone imply that the primary force for anaphase B in PtK cells is derived from pulling on the asters rather than pushing from the interzone. More experimental work is clearly needed to sort out the mechanisms of pole separation and to assess the importance of MT bundling and of the sliding motor enzymes that have been localized to the mammalian interzone (Nislow et al., 1992).
We thank Eileen O'Toole for tracking a metaphase bundle, and Joanna Olmsted, Eileen O'Toole, Cynthia Troxell, Robert West, and Mark Winey for reading and commenting on the manuscript.
This study was supported largely by grants CD425 from the American Cancer Society and RR00592 from the National Institutes of Health to J. R. Mclntosh.
Received for publication 17 May 1993 and in revised form 20 Septem- ber 1993.
References
Aist, J. R., and C. J. Bayles. 1991. Detection of spindle pushing forces in vivo during anaphase B in the fungus Nectria haematococca. Cell Motil. Cytoskel- eton. 19:18-24.
Aist, J. R., and M. W. Berns. 1981. Mechanics of chromosome separation dur- ing mitosis in Fuaarium (Fungi imperfecti): new evidence from ultrastruc- rural and laser microbeam experiments. J. Cell Biol. 91:446-458.
Aist, J. R., C. J. Bayles, W. Tao, and M. W. Berns. 1991. Direct experimental evidence for the existence, structural basis and function of astral forces dur- ing anaphase B in vivo. J. Cell Sci. 100:279-288.
Aist, J. R., H. Liang, and M. W. Bcrns. 1993. Astral and spindle forces in PtK2 cells during anaphase B: a laser microbeam study. J. Cell Sci. 104:1207-1216.
Bajer, A. S. 1982. Functional autonomy of monopolar spindle and evidence for oscillatory movement at mitosis. J. Cell Biol. 93:33--48.
Bajer, A., and J. Mol~-Bajer. 1986. Reorganization of microtubules in en- dosperm cells and cell fragments of the higher plant Haemanthus in vivo. J. Cell Biol. 102:263-281.
Bastmeyer, M., and H. Fuge. 1986. The distribution of intermicrotubule bridges in meiotic spindles of the crane fly. Chromosoma (Berl.). 94: 419-424.
Belmont, L. D., A. A. Hyman, K. E. Sawin, andT. J. Mitchison. 1990. Real-
The Journal of Cell Biology, Volume 123, 1993 1488
on March 21, 2018
jcb.rupress.orgD
ownloaded from

time visualization of cell cycle-dependent changes in microtubule dynamics in cytoplasmic extracts. Cell. 62:579-589.
Brinldey, B. R., and J. Cartwright. 1971. Ultrastruetural analysis of mitotic spindle elongation in mammalian cells in vitro. J. Cell Biol. 50:416-431.
Cande, W. Z., T. Baskin, C. Hogan, K. L. McDonald, and H. Masuda. 1989. In vitro analysis of anapbase spindle elongation. In Cell Movement. Vol. 2. Kinesin, Dynein, and Micrombule Dynamics. F. D. Warner and J. R. Mcin- tosh, editors. A. R. Liss, New York. 441--452.
Ding, R., K. L. McDonald, and J. R. McIntosh. 1993. Three-dinaensional reconstruction and analysis of mitotic spindles from the yeast Schizosac- charomyces pombe. J. Cell Biol. 120:141-152.
Fuge, H. 1974. The arrangement of microtubules and the attachment of chromo- somes to the spindle during anaphase in tipulid spermatocytes. Chromosoma (Bed.). 45:245-260.
Fuge, H. 1984. The throe-dimensional architecture of chromosome fibres in the crane fly I. Syntelic autosomes in meiotic metaphase and anaphase I. Chro- mosoma (Bed.). 90:323-331.
Fuge, H. 1985. The three-dimensional architecture of chromosome fibers in the crane fly H. Amphitelic sex univalents in meiotic anaphase I. Chromosoma (Bed.). 91:322-328.
Fuge, H., and D. Falke. 1991. Morphological aspects of chromosome spindle fibres in Mesostoma: ~ticrotubular fir-tree" structures and microtubule as- sociation with kinetocbores and chromatin. Protoplasma. 160:39-48.
Heath, I. B. 1974. Mitosis in the fungus Thraustotheca clavata. J. Cell Biol. 60:204-220.
Hepler, P. K., and W. T. Jackson. 1968. Microtubules and early stages of cell- plate formation in the endosperm of Haemanthus katherinae Baker. J. Cell Biol. 38:437-446.
Hill, T. L. 1987. Linear Aggregation Theory in Cell Biology. Springer-Verlag, New York. 305 pp.
Hiramoto, Y., and Y. Nakano. 1988. Micromanipulation studies of the mitotic apparatus in sand dollar eggs. Cell Motil. Cytoskeleton. 10:172-184.
Hiramoto, Y., Y. Hamaguchi, M. S. Hamaguchi, and Y. Nakano. 1986. Roles of microtubules in pronuclear migration and spindle elongation in sand dollar eggs. In Cell Motility: Mechanism and Regulation. H. Ishikawa, S. Hatano, and H. Sato, editors. A. R. Liss, New York. 349-356.
Hogan, C. J., and W. Z. Cande. 1990. Antiparallel microtubule interactions: spindle formation and anaphase B. Cell Motil. Cytoskeleton. 16:99-103.
Horio, T., and H. Hotani. 1986. Visualization of the dynamic instability of in- dividual microtubules by dark-field microscopy. Nature (Lond.). 321: 605-607.
Julian, M., Y. Tollon, I. Lajoie-Mazenc, A. Moisand, H. Mazarguil, A. Puget, and M. Wright. 1993.3,-tubulin participates in the formation of the midbody during cytokinesis in mammalian cells. J. Cell Sci. 105:145-156.
Kronebusch, P. J., and G. G. Borisy. 1982. Mechanics of anaphase B move- ment. In Biological Functions of Microtubules and Related Structures. H. Sakai, H. Mohri, and G. G. Borisy, editors. Academic Press, New York. 233-245.
Masuda, H., K. L. McDonald, and W. Z. Cande. 1988. The mechanism of anaphase spindle elongation: uncoupling of tubulin incorporation and microtubule sliding during in vitro spindle reactivation. J. Cell Biol. 107: 623--633.
Masuda, H., T. Hirano, M. Yanagida, and W. Z. Cande. 1990. In vitro reacti- vation of spindle elongation in fission yeast nuc2 mutant cells. J. Cell Biol. 110:417-425.
McDonald, K. L. 1989. Mitotic spindle ultrastructure and design. In Mitosis: Molecules and Mechanisms. J. S. Hyams and B. R. Brinldey, editors. Aca- demic Press, New York. 1-38.
McDonald, K, L., M. K. Edwards, and J. R. McIntosh. 1979. The cross- sectional structure of the central mitotic spindle of Diatoma vulgare: evi- dence for specific interactions between antiparallel microtubules. J. Cell Biol. 83:443-460.
McDonald, K., D. N. Mastronarde, E. T. O~l'cole, R. Ding, andJ. R. MeIn- tosh. 1991. Computer-based tools for morphometric analysis of mitotic spin- dies and other microtubule systems. EMSA Bull. 21:47-53.
McDonald, K. L., E. T. O'roole, D. N. Mastronarde, and J. R. McIntush. 1992. Kinetochore microtubules in PTK cells. J. Cell Biol. 118:369-383.
McIntosh, J. R., and S. C. Landis. 1971. The distribution of spindle microtu-
bules during mitosis in cultured human cells. J. Cell Biol. 49:468--497. Mclntosh, J. R., W. Z, Cande, and J. A. Snyder. 1975. Structure and physiol-
ogy of the mammalian mitotic spindle. In Molecules and Cell Movement. S. Inone and R. E. Stephens, editors. Raven Press, New York. 31-76.
Mcintosh, J. R., K. L. McDonald, M. K. Edwards, and B. M. Ross. 1979. Three-dimensional structure of the central mitotic spindle in Diatoma vul- gare. J. Cell Biol. 83:428--442.
Mcintosh, J. R., U.-P. RCOs, B. Neighbors, and K. L. McDonald. 1985. Ar- chitecture of the microtubule components of mitotic spindles from Dic- tyosteliura discoideum. J. Cell Sci. 75:93-129.
Mitchison, T. J. 1989. pulewards mierotubule flux in the mitotic spindle: evi- dence from photoactivation of fluorescence. J. Cell Biol. 109:637-652.
Mitehison, T., and M. Kirsehner. 1984. Dynamic instability of microtubule growth. Nature (Lond.). 312:237-242.
Mitchison, T. J., and E. D. Salmon. 1992. Poleward kinetochore fiber move- merit occurs during both metaphase and anaphase-A in newt lung cell mito- sis. J. Cell Biol. 119:569-582.
Nislow, C., V. A. Lombillo, R. Kuriyama, and J. R. Mcintosh. 1992. A plus- end-directed motor enzyme that moves antiparallel microtubules in vitro localizes to the inter'zone of mitotic spindles. Nature (Lond.). 359:543-547.
Oakley, B. R., C. E. Oakley, Y. Yoon, and M. K. Jung. 1990. 7-tabulin is a component of the spindle pole body that is essential for microtubule func- tion in Aspergillus nidulans. Cell. 61:1289-1301.
Palevitz, B. A. 1988. Microtubular fir-trees in mitotic spindles of onion roots. Protoplasma. 142:74-78.
Paweletz, N. 1967. Zur Funktion des "Fleming-Korpers" bei der Teilung tierseher Zellen. Naturwissenschaflen. 54:533-535.
Pfarr, C. M., M. Coue, P. M. Grissom, T. S. Hays, M. E. Porter, and J. R. Mclntosh. 1990. Cytoplasmic dynein is localized to kinetochores during mi- tosis. Nature (Lond.). 345:263-265.
Sawin, K. E., K. LeGuellec, M. Philippe, and T. J. Mitchison. 1992. Mitotic spindle organization by a plus-end-directed microtubule motor. Nature (Lond.). 359:540-543.
Saxton, W. M., and J. R. Mclntosh. 1987. Interzone microtubule behavior in lal~ anaphase and telophase spindles. J. Cell Biol. 105:875-886.
Schibler, M. J., and J. D. Pickett-Heaps. 1987. The kinetochore fiber structure in the acentric spindles of the green alga Oedogonium. Protoplasma. 137: 29-44.
Schroeder, T. E. 1970. The contractile ring. I. Fine structure of dividing mam- malian CrleLa) cells and the effects of cytochalasin B. Z. Zellforsch. Mikrosk. Anat. 109:431--449.
Shelden, E., and P. Wadsworth. 1990. Interzone microtubules are dynamic dur- ing spindle elongation. J. Cell Sci. 97:273-282.
Smirnova, E. A., and A. S. Bajer. 1992. Spindle poles in higher plant mitosis. Cell Motil. Cytoskeleton. 23:1-7.
Steffen, W. 1986. Relationship between the arrangement of microtubules and chromosome behavior of syntelic autosomal univalents during prometaphase in crane fly spermatocytes. Chromosoma (Berl.). 94:412--418.
Steffen, W., and H. Fuge. 1982. Dynamic changes in autosemal spindle fibers during prometaphase in crane fly spermatocytes. Chromosoma (Bed.). 87:363-371.
Steuer, E. R., L. Wordeman, T. A. Schroer, andM. P. Sheetz. 1990. localiza- tion of cytoplasmic dynein to mitotic spindles and kinetochores. Nature (Lond.). 345:266-268.
Tippit, D. H., D. Schulz, and J. D. Pickett-Heaps. 1978. Analysis of the distri- bution of spindle microtubules in the diatom Fragilaria. J. Cell Biol. 79: 737-763.
Tippit, D. H., L. Pillus, and J. Pickett-Heaps. 1980. Organization of spindle microtubules in Ochromonas danica. J. Cell Biol. 87:531-545.
Tippit, D. H., L. Pillus, and J. D. Pickett-Heaps. 1983. Near neighbor analysis of spindle microtubules in the alga Ochromonas. Eur. Z Cell Biol. 30:9-17.
Tippit, D. H., C. T. Fields, K. L. O'Donneil, J. D. Pickett-Heaps, and D. J. McLaughlin. 1984. The organization of mierotubules during anaphase and telophase spindle elongation in the rust fungus Puccinia. Eur. J. Cell Biol. 34:34--44.
Waters, J. C., R. W. Cole, and C. L. Reider. 1993. The force-producing mech- anism for centrosome separation during spindle formation in vertebrates is intrinsic to each aster. J. Cell Biol. 122:361-372.
Mastronarde et al. lnterpolar Microtubules in PTK Cells 1489
on March 21, 2018
jcb.rupress.orgD
ownloaded from