International Trade and Labor Markets: Evidence from Egypt
27
International Trade and Labor Markets: Evidence from Egypt Raymond Robertson (Texas A&M University) Mexico Vergara (World Bank) Deeksha Kokas (World Bank) Gladys Lopez-Acevedo (World Bank) Abstract: Since the early 1990s, some developing countries have experienced a coincidence of rising exports – especially those related to global value chains – and improved labor market outcomes. During the 2000-2010 decade in particular, rising trade was associated with falling poverty and inequality in many developing countries. Egypt, however, was not one of these countries, even though it signed several trade agreements. The lack of trade-related improvements in labor market outcomes – including poverty, inequality, average wage levels, informality, and female labor force participation – could be explained by at least two possibilities. First, it is possible that trade agreements do not produce the same increase in trade for Egypt as for other countries. Second, it is possible that exports do not generate the same kinds of changes in labor market outcomes as experienced in other countries. After presenting the key trends in key labor market outcomes over the 2000-2019 period, this paper evaluates both hypotheses. Using a gravity model approach, the results suggest that the changes in Egypt’s exports following trade agreements are above internationally estimated averages. Second, results from a Bartik approach find no significant relationship between rising exports and wages, informality, or female labor force participation. Additional analysis shows that Egypt’s average wage levels are among the highest among countries that export the same goods exported by Egypt, possibly suggesting that Egypt has a relatively weak comparative advantage in currently exported goods, and thus might need to rethink its export basket. April 2021 Keywords: Labor market outcomes, trade agreements, Egypt JEL Codes: J31, F16 This paper is a product of the Poverty Global Practices of the World Bank Group. It is part of a larger effort by the World Bank to provide open access to its research and contribute to development policy discussions around the world. Policy Research Working Papers are also posted on the Web at http://www.worldbank.org/prwp. The authors may be contacted at [email protected]. The authors are grateful to Nistha Sinha for helpful comments and valuable suggestions. All remaining errors are the responsibility of the authors.
Transcript of International Trade and Labor Markets: Evidence from Egypt
International Trade and Labor Markets:
Evidence from Egypt
Raymond Robertson (Texas A&M University) Mexico Vergara (World Bank) Deeksha Kokas (World Bank)
Gladys Lopez-Acevedo (World Bank)
Abstract: Since the early 1990s, some developing countries have experienced a coincidence of rising exports – especially those related to global value chains – and improved labor market outcomes. During the 2000-2010 decade in particular, rising trade was associated with falling poverty and inequality in many developing countries. Egypt, however, was not one of these countries, even though it signed several trade agreements. The lack of trade-related improvements in labor market outcomes – including poverty, inequality, average wage levels, informality, and female labor force participation – could be explained by at least two possibilities. First, it is possible that trade agreements do not produce the same increase in trade for Egypt as for other countries. Second, it is possible that exports do not generate the same kinds of changes in labor market outcomes as experienced in other countries. After presenting the key trends in key labor market outcomes over the 2000-2019 period, this paper evaluates both hypotheses. Using a gravity model approach, the results suggest that the changes in Egypt’s exports following trade agreements are above internationally estimated averages. Second, results from a Bartik approach find no significant relationship between rising exports and wages, informality, or female labor force participation. Additional analysis shows that Egypt’s average wage levels are among the highest among countries that export the same goods exported by Egypt, possibly suggesting that Egypt has a relatively weak comparative advantage in currently exported goods, and thus might need to rethink its export basket. April 2021 Keywords: Labor market outcomes, trade agreements, Egypt JEL Codes: J31, F16 This paper is a product of the Poverty Global Practices of the World Bank Group. It is part of a larger effort by the World Bank to provide open access to its research and contribute to development policy discussions around the world. Policy Research Working Papers are also posted on the Web at http://www.worldbank.org/prwp. The authors may be contacted at [email protected]. The authors are grateful to Nistha Sinha for helpful comments and valuable suggestions. All remaining errors are the responsibility of the authors.

Page 1 of 27
1. Introduction The past two decades have been marked by an increasing integration of the developing world into global trade and global value chains (GVCs). This trend has renewed the interest of policymakers and academics in understanding the labor market impacts of global integration, and it has led to a burgeoning literature that analyzes the relationship between trade and local labor market outcomes (Topalova 2010 and others1). The results vary significantly across countries, suggesting that individual country studies are necessary. This study provides a first assessment of the link between Egyptian exports and labor market outcomes. Egypt provides an excellent opportunity to contribute to a broader understanding of trade and labor markets for several reasons. First, it is an important country within the Middle East North Africa (MENA) region, whose countries tend to experience high economic volatility relative to industrial ones, whether measured by aggregate output, private consumption, or investment (World Bank, 2012). In addition, most MENA countries remain relatively undiversified and dependent on a few commodities that often experience strong fluctuations in relative prices. And security issues continue to affect them not only due to impacts in the tourism industry – a key economic sector in Egypt – but also prospects for foreign investment and labor markets.
Second, within this difficult environment, Egypt has tried to encourage trade by signing trade agreements. In the first decade of 2000s, it concluded free trade agreements (FTAs) with the European Union (EU); Turkey, Jordan, Morocco, and Tunisia (the Agadir Agreement); and members of the European Free Trade Association (EFTA), which include Iceland, Liechtenstein, Norway, and Switzerland. It also has joined 11 preferential or regional trade agreements (RTAs)2 since becoming a World Trade Organization (WTO) member in 1995. And the volume of exports after the FTAs were signed has dramatically increased, providing a good context to assess the impacts of trade.
Third, despite Egypt’s recent success in undertaking bold economic reforms, its labor market is rife with challenges, including lagging private-sector employment growth, rising informal employment, and increasing wage inequality. There is also a widespread and persistent regional divide in employment growth and job quality between Upper and Lower Egypt, according to the latest round of the Labor Market Panel Survey (ELMPS). In addition, while employment shares of labor-intensive manufacturing sectors (like garments and furniture) have steeply declined, those in low-end non-traded services (like construction, storage, and communication) have expanded. One potential solution to these challenges could be greater trade because of the observed robust positive relationship between trade and development (Dollar and Kraay, 2004; Bhagwati and Srinivasan, 2002). More specifically, trade has been linked to falling poverty by generating new employment opportunities (Lopez-Acevedo 2012) and falling prices of goods and services for poor consumers (Bartley Johns et al., 2015). Since some of these results vary across countries, an obvious question is whether Egypt has been able to reap the benefits of the trade-enhancing effects of trade agreements (Baier and Bergstrand 2007). A related question is how different groups of workers might benefit from rising exports.
1 Autor, Dorn and Hanson 2013 McCaig and Pavcnik, 2018; Erten and Leight, 2017; Dix-Carneiro and Kovak, 2017a 2 See http://rtais.wto.org/UI/PublicSearchByMemberResult.aspx?MemberCode=818&lang=1&redirect=1 for the WTO’s list of Egypt’s regional trade agreements that are in force.
Page 2 of 27
Answering these questions requires an understanding of both trade performance and labor market conditions. In the past two decades, non-oil exports have failed to take off in Egypt and similar countries have surpassed Egypt in participation in GVCs. Egypt has yet to reach the stage of a medium-technology manufacturing exporter. Not encouragingly, exports remain concentrated in products that are weakly traded in global markets and remain limited to traditional markets. Export activity also continues to remain heavily concentrated in a small number of governorates of the country, with the poorest ones appearing to have no linkages to overseas markets. The barriers – such as a high level of trade and non-trade barriers, low export competitiveness, low domestic competition, and low labor mobility – are indicative of the potential opportunities foregone in generating income earnings for the poor and vulnerable groups, such as women.
Our papers ask two key questions:
• First, do trade agreements produce the same increase in exports in Egypt as has occurred in other countries? To answer this, we present gravity-model3 estimates of Egypt’s trade and trade agreements. The results suggest that although trade agreements tend to enhance trade, Egypt has gotten more “bang for its buck” with its trade agreements – that is, exports following these agreements have been above internationally estimated averages.
• Second, do higher exports generate better local labor market outcomes as has occurred in other countries? To answer this, we present Bartik (1991)-like estimates for Egypt. The results suggest that trade impacts labor market outcomes in the short run, but the effects quickly dissipate throughout the country and remain statistically insignificant for most types of workers.
The reason for the broken link between trade and labor markets, we argue, is: (i) the composition of Egypt’s export basket; and (ii) the fact that wage levels are among the highest in countries that export the same goods as Egypt. Further, in the past two decades, non-oil exports have failed to take off in Egypt, and similar countries have surpassed Egypt in participation in GVCs. Our paper proceeds as follows. Section 2 provides a comprehensive description of Egypt’s labor markets challenges and its trade situation. Section 3 describes the data and the empirical methodology to assess the impact of trade agreements and shocks on its labor markets. Section 4 presents our results. And section 5 concludes and provides policy implications of our results.
2. Labor Market Outcomes and Trade in Egypt The concern about Egypt’s lack of improvement in labor market outcomes following trade agreements comes from a lack of improvement in several key labor market outcomes, which other countries have experienced.
3 Some previous work has been done to assess the impact of such trade agreements on trade flows using gravity models for the MENA region and specifically Egypt. Helmy et al (2018) examine the impact of the Egypt‐EU trade agreement on bilateral trade. They also introduce other trade policy variables – such as the Grain and Free Trade Association (GAFTA), Agadir, EU-Egypt Association, and the Common Market for Eastern and Southern Africa (COMESA) agreements – and find that the three agreements are positive and significant, with GAFTA showing the highest coefficient, followed by Agadir and the EU-Egypt Association. More recently, Youssef and Zaki (2019) use a gravity model analysis to show that Egypt continues to trade less than expected with many countries compared to its potential.
Page 3 of 27
Labor Market Outcomes When most people think about labor market outcomes that matter for workers, they usually think of unemployment, FLFP, informality (often conflated with job quality), and real wages – all of which help boost welfare, including poverty and inequality. Our study takes a look at changes in each of these four key measures for Egypt – and compares them to those in neighboring countries in the region – to provide context and motivation for our subsequent empirical work.
Unemployment. Egypt has experienced significant swings in unemployment rates at different points in time over the past 15 years, similar to Tunisia and Algeria, but in contrast to Libya and Saudi Arabia, which have experienced stable unemployment rates (Figure 1, Panel A). Although Egypt’s long-run average unemployment levels are about in the middle of the MENA distribution – about 10 percent – the average for the second half of the time period shown is clearly higher (reaching close to 13 percent) than in the first half. And youth in particular face the problem of long-term unemployment, with rates reaching almost 30 percent in 2020. Such persistent unemployment is a major challenge for Egypt, along with the rest of the region, compared to Latin American countries, for example, where youth unemployment rate is about 18 percent (ILO, 2020).
FLFP. In Egypt, FLFP rates are oscillating at about 22 percent, with a decline in recent years (Figure 1, panel B). This trend is similar to that of MENA, where, on average, one out of five women are outside the labor force – a rate that has shown no significant change over the past 15 years, except for Yemen, which has seen a steady drop. As for FLFP among youth, similar to its neighboring country, Jordan, the rate is low, increasing during prime age (peaking around ages 40-45) and decreasing again as retirement approaches (World Bank, 2020).
[Insert Figure 1 (Panel a and Panel b) here] Informality. In Egypt, informality rates have increased from 58 percent in 2008 to 66.7 percent in 2017, similar to the estimates for a typical MENA country 4 . But there remains significant heterogeneity with respect to gender. Our estimates using the ELMPS show that while the informality rate for males has oscillated around 63 percent, it has risen from 58 percent in 2009 to almost 65 percent in 2017 for females (figure 2). There is also considerable variation in informality rates across Egypt’s four regions (Nile Valley and Delta, Eastern Desert, Western Desert, and Sinai Peninsula) – and within them, the 27 governorates5 In 2008, the lowest informality rate was 8 percent in the New Valley governorate, with the highest in the Beni-Suefa and Menia governorates, at 80 and 79 percent, respectively. But by 2017, after more people had entered the informal market, the informality rate in New Valley was up to 31 percent, the governorate with the lowest rate was the Red Sea at 21 percent, and at least two out of every three governorates in Egypt had an informality rate above 50 percent.
4 Comparing informality rates within MENA countries can be problematic, given that many of them have either lagged in their capacity to generate data or have prevented access to their data (Amatanov, et al. 2020). The World Bank (2012) estimates that a typical MENA country employs 67 percent of its labor informally – and that informal production might be as high as a third of GDP. In some MENA countries, informality spreads across more income groups than in others in the region. In Yemen, Morocco, Syria, and Lebanon informality rates range from higher than 95 percent for the poorest quintiles to 30 percent in the fifth quintile (World Bank, 2012). In Yemen, in particular, informality is higher than 80 percent for the richest quintile. 5 1 Alexandria; 2 Asyout; 3 Aswan; 4 Behira; 5 Beni-Suef; 6 Cairo; 7 Dakahlia; 8 Damietta; 9 Fayoum; 10 Gharbia; 11 Giza; 12 Ismaelia; 13 Kafr-El-sheik; 14 Kalyoubia; 15 Luxor; 16 Matrouh; 17 Menia; 18 Menoufia; 19 New Valley (El-wadi El-Gidid); 20 North Sinai; 21 Port Said; 22 Qena; 23 Red Sea; 24 Sharkia; 25 South Sinai (no data available); 26 Suez; 27 Suhag.
Page 4 of 27
[Insert Figure 2 here]
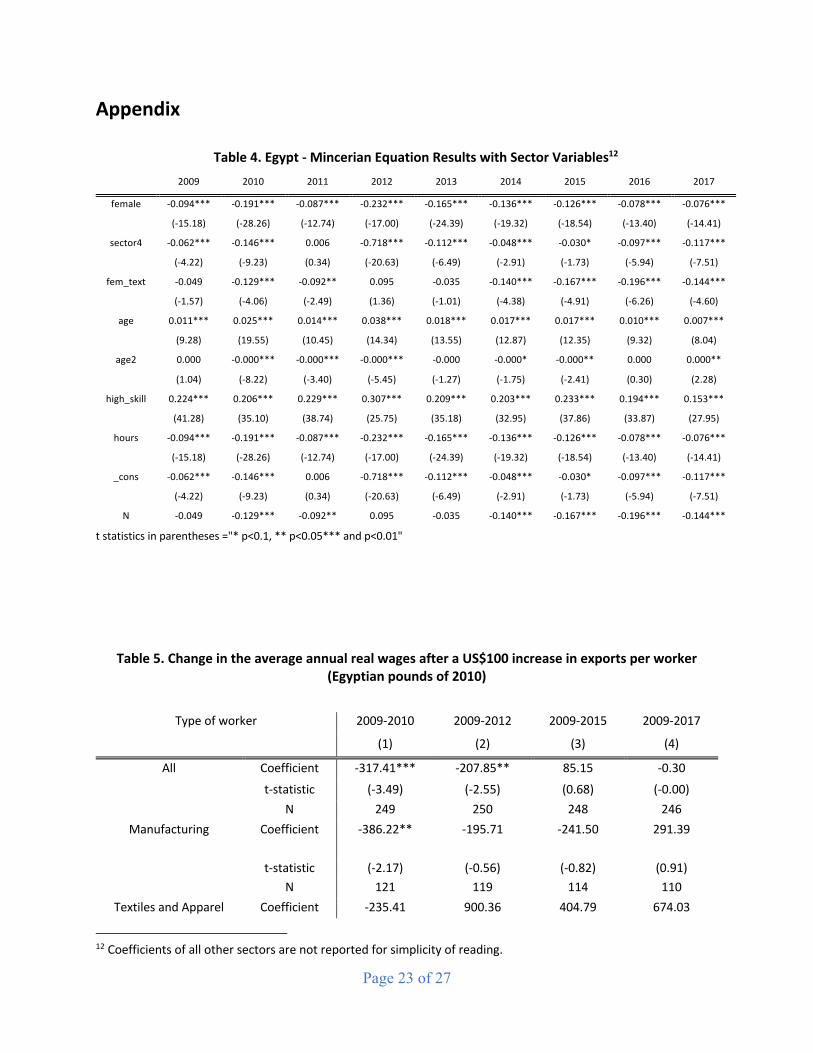
Wages. In Egypt, there has been a steady increase in average wages since 2009, although wages fell in 2017. However, wages for female workers have been consistently lower than those for males, and the gender wage gap has not fallen significantly (figure 3). Comparing average monthly wages, male wages were 8 percent higher than female’s in 2008, but this difference increased to 20 per cent in 2017. Estimating a Mincerian wage equation and controlling for educational attainment, hours worked, and industry of employment, we find the wage differential peaked in 2012, when women earned 23 percentage points less than males (Table 4). For the following years, the wage gap followed a downward trend that reached 7.6 percentage points in 2017, only 2 percentage points lower than in 2008. Thus, there has been no big improvement in the evolution of the gender wage differential6. We also observe that the returns for higher education have decreased over time. In Egypt, as well as in most MENA economies, the public sector employs a significant share of workers with higher education. Given the generous conditions that public employment provides (such as job security and non-monetary benefits), more than half of young job seekers prefer to work in the public sector (World Bank, 2012). In fact, for women in Upper Egypt, government jobs are the only “acceptable” form of employment, due to flexible working hours, leave, and job security, which are valued the most for their compatibility with family life7 (World Bank, 2011). The significant role of the public sector in Egyptian labor markets might help explain the decreasing explanatory potential of human capital in wage differentials. Regional differences between Upper and Lower Egypt are stark. For example, Cairo is the governorate with the most employees (about 10 percent of total workers), followed by Behira (at about 8 percent) over the 2008-2015 period. But bigger employment numbers do not imply higher wages. We observe that monthly average wages vary widely across governorates. New Valley and Suez show the highest average weekly real wages in 2008 (at 670 and 610 Egyptian pounds, respectively), but later in 2015, North Sinai surpasses both with a higher average real wage of 730 Egyptian pounds. In general, governorates with the highest average real wages are almost double that of those with the lowest ones. The large wage gap among them reflects limited geographical mobility, a problem that is also highlighted by other studies. For example, Herra and Badr (2012) show a declining trend in Egypt’s internal migration rates between the 1970s and 2010 – rates that remain low by international standards. This issue is exacerbated by the concentration of better paid jobs in certain geographical areas (mostly metropolitan areas) and the low mobility between informal and formal occupations. Between 2008 and 2009, an informal worker in Egypt had only a 4 percent chance of moving to a private sector formal job and a 5 percent chance of moving to a public sector job (Gatti, et al. 2012). In addition, few young people find can transition from the end of schooling to a stable formal job (Barsoum, Ramadan and Mostafa, 2014).
6 Based on Mincerian wage equations. For results, see table 4 in the Appendix. 7 Among all regions of the world, women in MENA are more likely to prefer the role of full-time domestic work than working for pay (World Bank 2013).

Page 5 of 27
There is also a tendency for production to be geographically concentrated, which results in trends being geographically localized. Estimates based on the recent round of ELMPS highlight a steep decline in employment shares of labor-intensive manufacturing sub-sectors (like garments and furniture), while employment in low-end services (like construction, storage, and communication) has been expanding. If workers avoid moving between governorates or relocation costs are significant, any effect of demand shocks such as trade would be highly localized in export-concentrated production areas.
[Insert Figure 3 here] Trade Patterns Like many developing countries, Egypt has implemented several policies designed to foster trade growth. In the late 1990s, it reduced the maximum tariff rate to 40 percent from 110 percent in the late 1980s (Zaki, 2010). Then in 2003-2004, it again reduced tariffs, simplified the tariff structure and red tape costs, and implemented reforms to improve the business environment. As a result, after 2004, both imports and exports accelerated – almost tripling in the following years (Figure 4, panel A). And Egypt’s economic growth rate rose to 7.2 percent in 2008, before the world financial crisis. The escalation in trade was fostered by the signature of multiple FTAs in the early 2000s with: (i) the EU; Turkey; members of EFTA; and with Tunisia, Jordan, and Morocco (the Agadir Agreement). However, Egyptian exports of goods and services per capita, remain low in comparison to other countries in MENA (like Morocco and Tunisia), and outside MENA (like Turkey and Thailand).
Egypt’s trade basket is also moderately diversified in terms of goods and partners. Its exports have historically been dominated by oil exports, although their weight has gradually declined from half to less than a third of total exports in favor of non‐oil exports.8 But non-oil exports have failed to take off (Figure 4, panel B), and exports continue to be concentrated in traditional or low value-added products. The products that Egypt exports most are not necessarily the ones that might be expected from the perspective of comparative advantage. Egypt seems to have a comparative advantage in carpets, fabrics, fertilizers, textiles, salt, sulphur, and stones, but exports of these products remain relatively low (Zaki 2016).
[Insert Figure 4 (Panel a and Panel b) here]
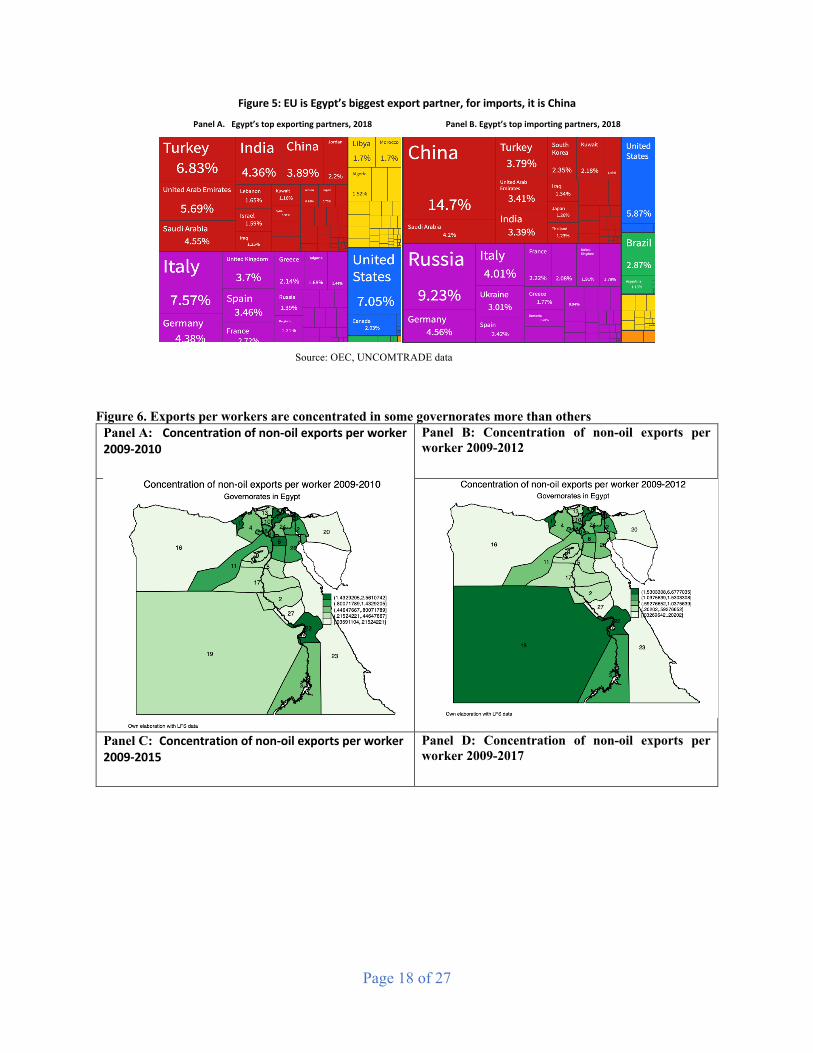
Exports in which Egypt specializes and expands are not necessarily those with a growing global demand. For example, although Egypt’s global trade share has been growing in cotton, fertilizers, tobacco, and oil seeds in the past few years, global demand has been declining. And although Egypt’s global trade share has been falling in textiles, cement, aluminum, ceramic, and chemical, global demand has been growing. Exports also remain limited to the traditional market. Egypt’s top export market is the EU (notably Italy and Germany), followed by the United States, Turkey, and the United Arab Emirates, with a
8 Fuel and oil products do not represent more than 10 percent of imports.
Page 6 of 27
similar share as Italy (Figure 5, panel A). As for imports, they primarily come from China, Russia, the EU, and the United States. Chinese imported goods are more than double the share from the second and third importing markets (Figure 5, panel B).
[Insert Figure 5 (Panel a and Panel b) here]
Export activity also continues to remain heavily concentrated in a small number of governorates, with the poorest ones appearing to have no linkages to overseas markets through exports. Further, local and regional turmoil, along with an economic slowdown in its main trading partners, have had an adverse effect on Egypt’s economic activity and external balances. The severe shortages of foreign currency, for example, led in 2014 to an over-appreciation of the exchange rate, which undermined its competitiveness. For the following two years, exports declined, reaching their lowest level as percent of GDP since the early 2000s (Figure 4, panel C). In response, Egypt abandoned its currency peg and liberalized its exchange rate, which resulted in a 100 percent depreciation of the pound that boosted exports, although non‐oil exports rose by only 16 percent in about a year (Youssef and Zaki, 2019). While currency depreciation was expected to boost exports in the short term, sustained export growth requires more than a price effect. In 2018, both imports and exports peaked, and with the pandemic altering global economic activity, Egypt now needs to reinvent the way it achieves sustained progress in export performance.
3. The Gravity Approach This paper uses a gravity model to predict bilateral trade flows based on economic size, geographic distance, and other relevant characteristics that should typically contribute to facilitating trade and identify specific sectors and markets for which Egypt seems to have an untapped potential. The gravity model of international trade is the most common empirical tool used by economists to estimate the contribution of various factors to bilateral international trade flows. Tinbergen (1962) proposed the gravity model to illustrate the asymmetry of global trade flows. Trade flows between two countries are modeled as functions of the size (GDP or GDP per capita) of each country, the distance between them, and trade costs. Trade costs might include a wide range of variables, including bilateral, multilateral, and regional trade agreements. Comparing the change in trade of a particular trade agreement, while controlling for other variables often found in gravity models, is one heuristic way to estimate either the effectiveness of trade agreements that a country signs, or, alternatively, the relative importance of policies and trade costs that are not included in an agreement.
Formally, trade costs can be roughly categorized into (i) transport costs, (ii) information costs, and (iii) trade barriers. Anderson and van Wincoop (2003) propose the following now widely adopted form for the gravity function:
x!" =#!#"### $!"%!&"
$'()
,
in which xij is imports by country j from country i; yi and yj are GDP per capita in each country; yw is nominal world income; tij is the cost in j of importing a good from i; σ is the elasticity of

Page 7 of 27
substitution across countries for a given good; and Πi and Pj represent exporter and importer ease of market access (Anderson 2011). Trade costs can contain several variables. Shepherd (2016) defines trade costs as a function of distance (log 𝜏𝑖𝑗 = log (𝑑𝑖𝑠𝑡𝑎𝑛𝑐𝑒𝑖𝑗)). Other authors include additional variables, such as sharing a common currency, being members of the General Agreement on Tariffs and Trade (GATT) – which became the WTO in 1995 – and whether there is a signed trade agreement. For many years the most common method in gravity model estimation was using applying Ordinary Least Squares (OLS) to a log-linearized form of the gravity model. Recently, however, several scholars have argued that in the presence of heteroskedasticity, estimated OLS parameters may be biased. In addition, many country pairs do not trade at all, causing a prevalence of zero values in the dependent variable. To address these concerns, gravity models are increasingly estimated with a Poisson Pseudo Maximum Likelihood (PPML) estimator, which is able to overcome heteroskedasticity in the presence of many zeros in the dependent variable. Silva and Tenreyro (2011) compare the Poisson Pseudo Maximum-Likelihood (PPML) and Gamma Pseudo Maximum Likelihood (GPML) methods and conclude that the PPML estimator is generally well-behaved, even if the dependent variable has many zeros. Gravity Data Our analysis employs a combination of data that measure (i) bilateral trade flows, (ii) various trade costs, (iii) membership in RTAs, and (iv) country characteristics. Annual bilateral trade flows from 1996 to 2018 come from the COMTRADE database. Bilateral information on transport costs, information costs, and tariff barriers come from the Centre d'Études Prospectives et d'Informations Internationales (CEPII) gravity dataset.9 We replace missing bilateral data with zeros, hence basically assuming that missing values are actually zeros rather than positive unreported values.
Data on trade agreements, which come from the WTO, cover several types of agreements10 that cover goods, services, or both. Although there is some debate in the literature about the difference between RTAs, reciprocal trade agreements, and preferential trade agreements, we simply employ the WTO definition of trade agreements. For annual GDP, we draw upon the World Bank’s World Development Indicators. All monetary variables are in constant (2010) US dollars. Table 1 contains the summary statistics for our final data set. We end up with a panel data set with country pairs being the unit of observation. There are 177 importers and 189 exporters for a total of 733,786 observations. Each pair contains information on the volume of trade during the year, whether or not a trade agreement was in force, the GDP of each country – and an indicator if the countries in the pair share a border, are members of the GATT, share a common currency, and the distance between them.
[Insert Table 1 here]
9 http://www.cepii.fr/ 10 WTO trade agreements include (i) free trade agreement (FTA); (ii) customs union (CU); (iii) partial scope agreement (PSA); (iv) economic integration agreement (EIA); and combinations of each group.

Page 8 of 27
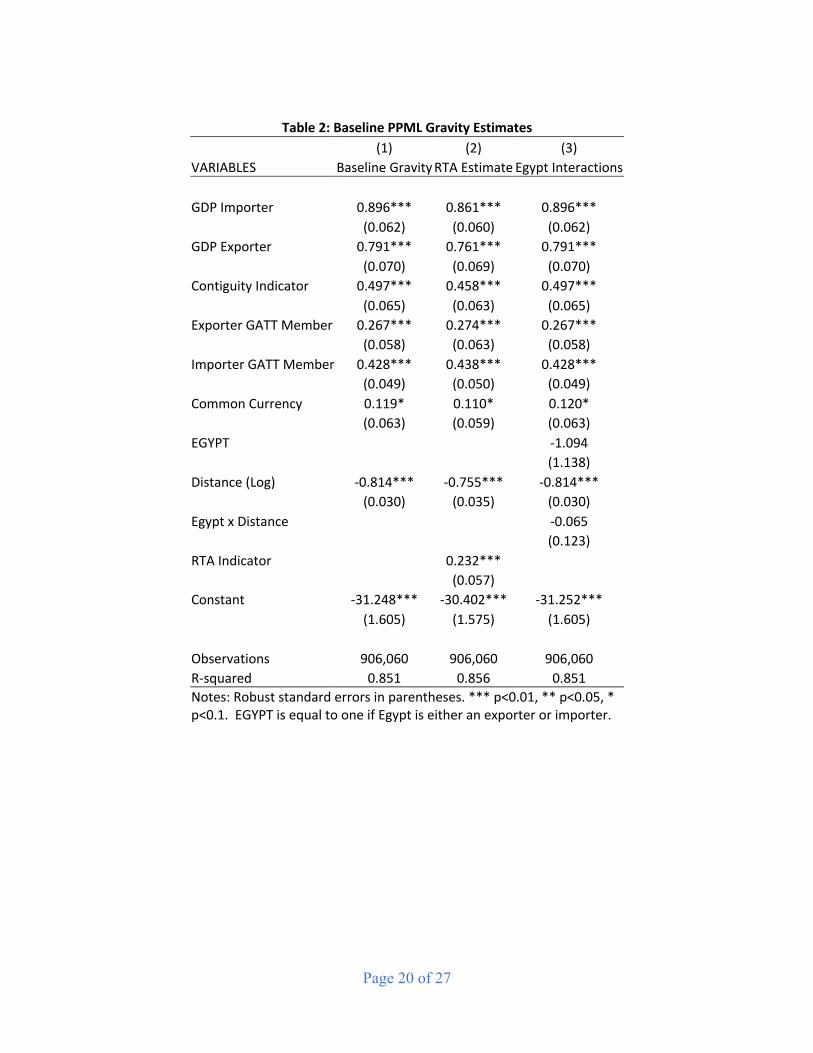
Gravity Results Table 2 contains the baseline PPML gravity model results, which reflect the “normal” gravity results. GDP per capita of each country positively affects trade, and the estimates are fairly close to the theoretically implied values of one. Contiguous countries trade more, and being a member of GATT increases trade when either country is a member. Having a common currency weakly increases trade. The normal gravity estimates match those in previous studies, at least qualitatively if not quantitatively, and are very stable across all specifications. And all equations include country and year fixed effects (although these are not shown to save space). In column 2, we add the RTA indicator. The estimated coefficient is positive, relatively large, statistically significant, and roughly consistent with studies that use a similar variable and estimation approach. The results suggest that, on average, having an RTA increases trade by about 26 percent (=exp(0.232)-1). Since our focus is on Egypt, in column 3, we include the Egypt indicator – which is equal to one if Egypt is either an importer or an exporter. The estimate of the Egypt coefficient indicates how much Egypt trades relative to all other countries. The negative and relatively large coefficient suggests that, holding other determinants of trade constant, Egypt trades much less than other countries. However, this value is not statistically significant, so firm conclusions should not be drawn at this point. As for the role of distance, the estimated coefficient on this interaction term is small, negative, and not statistically significant, suggesting that distance (as a proxy for transportation costs), is not especially driving Egypt’s lack of trade.
[Insert Table 2 here]
So, does Egypt trade more after joining an agreement than other countries? Picking up on the RTA result, we examine whether Egypt gets this “typical” increase in trade from its agreements. Table 3 shows the results from the PPML gravity model, using three different measures of Egypt’s trade relationships: Egypt as either exporter or importer, Egypt as an importer, and Egypt as an exporter. In column 1 of table 3, Egypt is modeled as either an exporter or importer. There are two main results to consider. First, the “main” effect (“Egypt Total”) is negative, but statistically significant at conventional levels. This suggests that Egypt trades less than other countries, holding the other gravity variables constant. Second, the interaction between Egypt and the RTA (”Egypt x RTA”) is small, positive, and not statistically significant. This suggests that Egypt’s total trade increases by about the “normal” amount from trade agreements. These results, however, might differ depending on whether Egypt is an importer or exporter. Trade agreements might increase imports and exports different amounts. In column 2, the estimate of the coefficient on the “Egypt as importer” is small, positive, and not statistically significant. This suggests that Egypt imports slightly more than other countries, holding all other gravity variables constant, but this amount is not statistically significant. When considering the interaction term (“Egypt x RTA” in column 2), the estimate is small, negative, and statistically insignificant. This
Page 9 of 27
suggests that, relative to the effects of trade agreements on average, Egypt’s imports increase less than average, but once again, this estimate is not statistically significant. Finally, in column 3, we consider levels and changes of Egypt’s exports. The results show that the estimated coefficient on “Egypt as Exporter” is large, negative, and statistically significant. This supports what others have mentioned in the literature: that Egypt exports less than might be expected. In our case, Egypt does not trade less due to the “normal” gravity factors—rather, lower exports are due to some other Egypt-specific factor. When considering the changes in trade, however, the estimated coefficient on the “Egypt x RTA” variable – which measures how Egypt’s exports change following a regional trade agreement – is large, positive, and statistically significant. This suggests that Egypt’s trade increases much more than the “average” increase due to a trade agreement. Why might this occur? One possibility is that the lack of a link between trade agreements and improved labor market outcomes is not due to the fact that Egypt gets less from trade agreements than expected. Instead, it might be possible that trade does not connect to labor markets in the same way it does in other countries.
[Insert Table 3 here]
4. Trade to Egyptian Labor Markets: A Bartik Analysis
Overview of the Bartik Approach How does trade connect or not connect with labor markets in Egypt? To answer this question, we employ a geography based Bartik (1991) approach to quantify exogenous import demand shocks from the US and EU countries for Egyptian exports. Under this approach, we can compute the change in exports per worker driven by an exogenous demand shock originating from outside. We use a two-stage econometric analysis. The change in industry i exports of Egypt to the US and EU countries (or imports of the US and EU from Egypt) between time t and t + n can be expressed as 𝑄*+,- − 𝑄*-. Then the change in exports per worker for industry i is equal to (𝑄*+,- − 𝑄*-)/(∑ 𝐿*
-,/)/ . Thus, we can calculate the effective change in exports to US and EU weighted by the labor shares for each region as
𝑥*,*+,/ =7𝐿*-,/8𝑄*+,- − 𝑄*-9
(∑ 𝐿*0,/)(∑ 𝐿*
-,1)10-
Alternatively, we can express the exposure formula as in ADH
𝑥*,*+,/ =7𝐿*-,/8𝑄*+,- − 𝑄*-9𝐿*/𝐿*
-,2345*-
Page 10 of 27
where 𝐿*/ is the total number of workers assigned to any industry in district r and 𝐿*-,2345* is the
total size of industry i. The trade exposure variable 𝑥*,*+,/ can be interpreted as the change in exports per worker in district r measured in real U.S. dollars. First stage: We estimate the contribution of the US and EU import demand to the increase in Egypt’s exports. To ensure true exogeneity of our instrument, we need a variable that predicts imports from Egypt based solely on the US and EU internal demand growth, rather than supply-side determinants like changes in production volumes for garments from other export-competing countries. Hence, we construct our instrument using time-series regressions of Egypt’s exports to the US and EU on the US and EU GDP by industry at the four-digit level, from 1991 to 2018 annually. Predicted values from these regressions would serve as a proxy for Egypt’s exports to the US and EU explained exclusively by the latter's domestic aggregate demand. This variable is, by construction, orthogonal to every supply-side factor in the international garments market, and to every Egypt local market condition Second stage: We estimate the effect of an increase in exports on local economic outcomes. These economic outcomes would include informality rates, real wages for different worker types (male, female, rural, urban, skilled, unskilled, young, and old), and FLFP rates. And we define four periods according to the LFS data available: 2009 to 2010, 2009 to 2012, 2009 to 2015, and 2009 to 2017. The regressions are run at the (municipal) kizm and markaz level (Egypt has 259 kizms and markaz). Figure 6 plots trade openness, defined as exports (excluding petroleum oil) per worker, for 26 governorates11 in Egypt. It shows large spatial differences among the governorates, which can stem from intranational trade costs and regional comparative advantages. The biggest concentration of exports per worker is in Luxor, Cairo, Alexandria, Port Said, and Dakahlia, while New Valley (also called El-Wadi El-Gidid) has experienced a big increase in its share in recent years.
[Insert Figure 6 here] Bartik Results on Trade and Labor Market Outcomes How did an increase in exports affect wages in Egypt? The results show that kizm and markaz that are more exposed to trade experience a decrease in average real wages relative to less exposed sub-districts in the short run, but this outcome dissipates over time (table 5 in Appendix). This holds for both males and females, although for women it is not statistically significant. Specifically, between 2009 and 2010, a $100 increase in exports per worker leads to a statistically significant decline in average wages by 317 Egyptian pounds, which declines to a zero by 2017 (figure 7). This dissipating and negative wage trend in average wages is observed economy-wide, except for textile and apparel workers.
11 No data is available for South Sinai.

Page 11 of 27
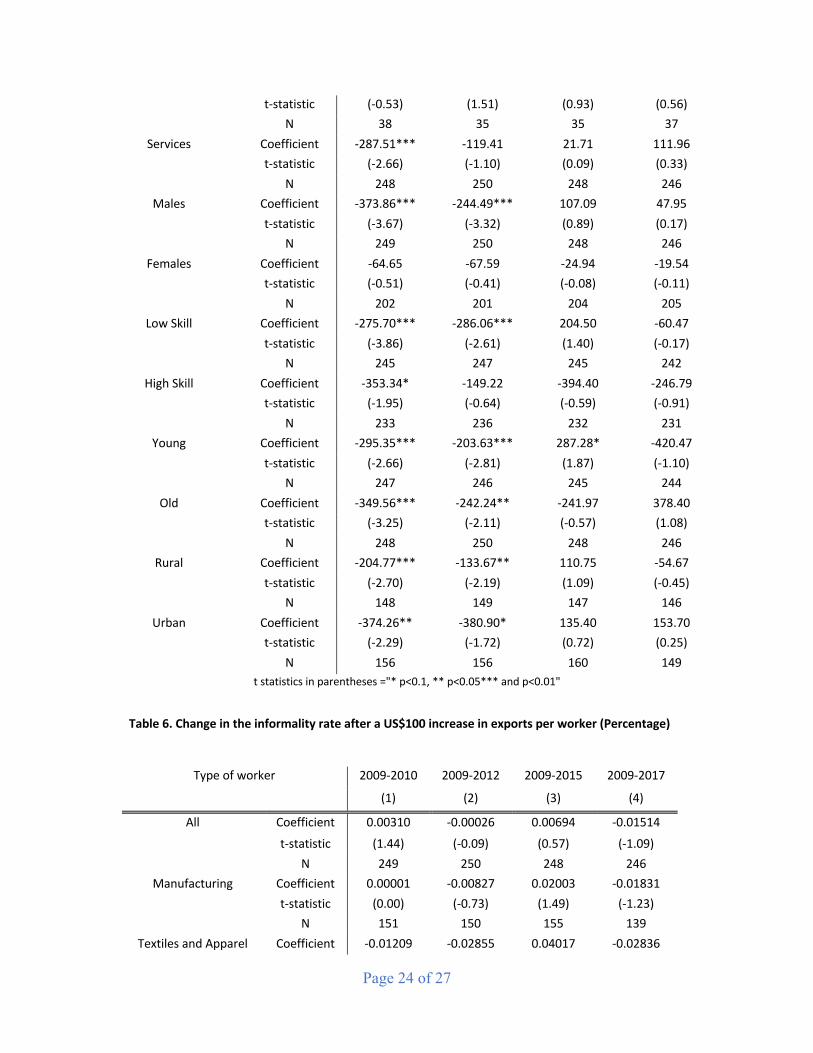
A focus on trade exposure on textiles and apparel, which makes up 7 percent of Egypt’s export basket, reveals a sustained increase in average wages after the first period, although not statistically significant. Average wages of these workers fall 235 Egyptian pounds between 2009 and 2010 – which is more than compensated by a 900-pound increase between 2009 and 2012, a 400-pound increase between 2009 and 2015, and a 674-pound increase between 2009 and 2017. The more vulnerable groups in Egypt are the most affected from trade in terms of wages. Average wage decreases in sub-districts that are more exposed to the trade shock are substantially higher for high-skilled workers relative to low-skilled ones, older relative to less-experienced workers, and urban workers relative to rural workers.
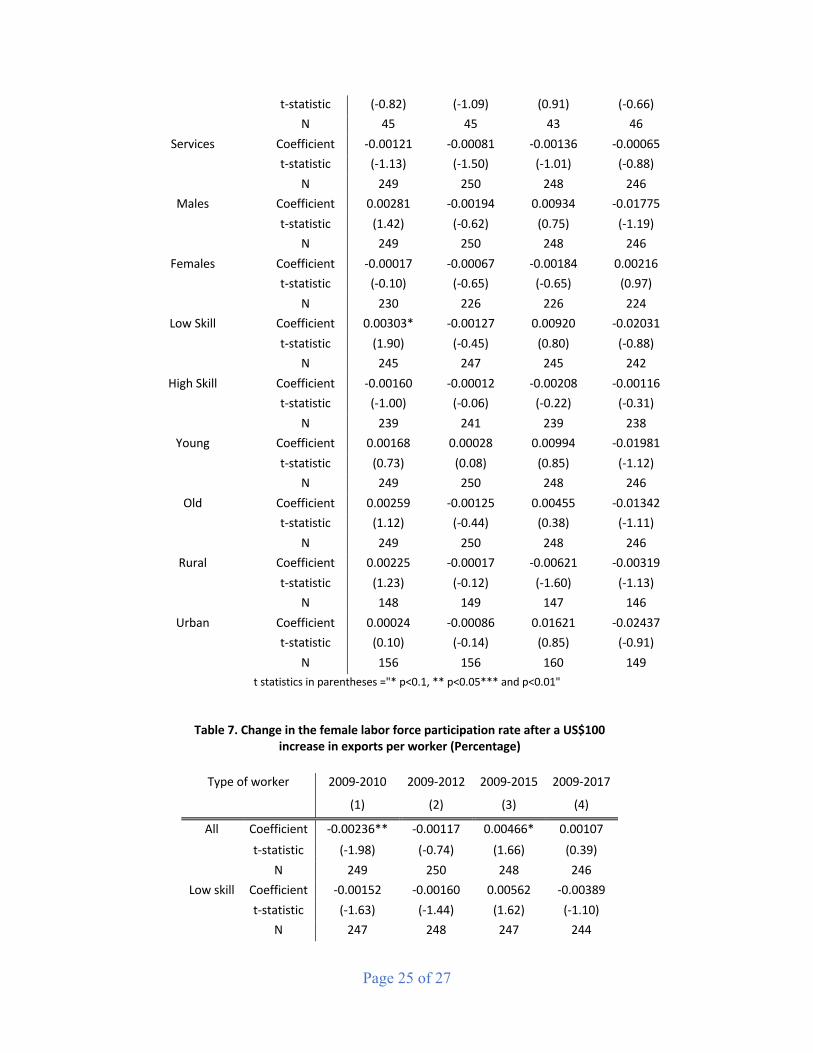
[Insert Figure 7 here] How did an increase in exports affect informality in Egypt? Informality rates in Egypt have been relatively stubborn, with an upward trend since 2009 (Table 6 in Appendix ). Consistent with this, we do not find any improvement in informality rates after a trade shock in the EU and US’s exports demand. On the contrary, between 2009 and 2010, there is a small and statistically insignificant positive effect on the informality rate of all workers – which shifts to a negative between 2009 and 2012, a positive between 2009 and 2015, and a negative between 2009 and 2017, although all of these are statistically insignificant. As for women, there is a small and constant negative effect for the first three periods, which later on reverses sign and is consistent with the upward trend of informality rates in 2017. Old, low-skilled, and male workers are also among the workers that experience a higher informality rate after a $100 increase in exports in the period 2009 to 2010 – although in the following periods, their informality rate decreases (figure 8).
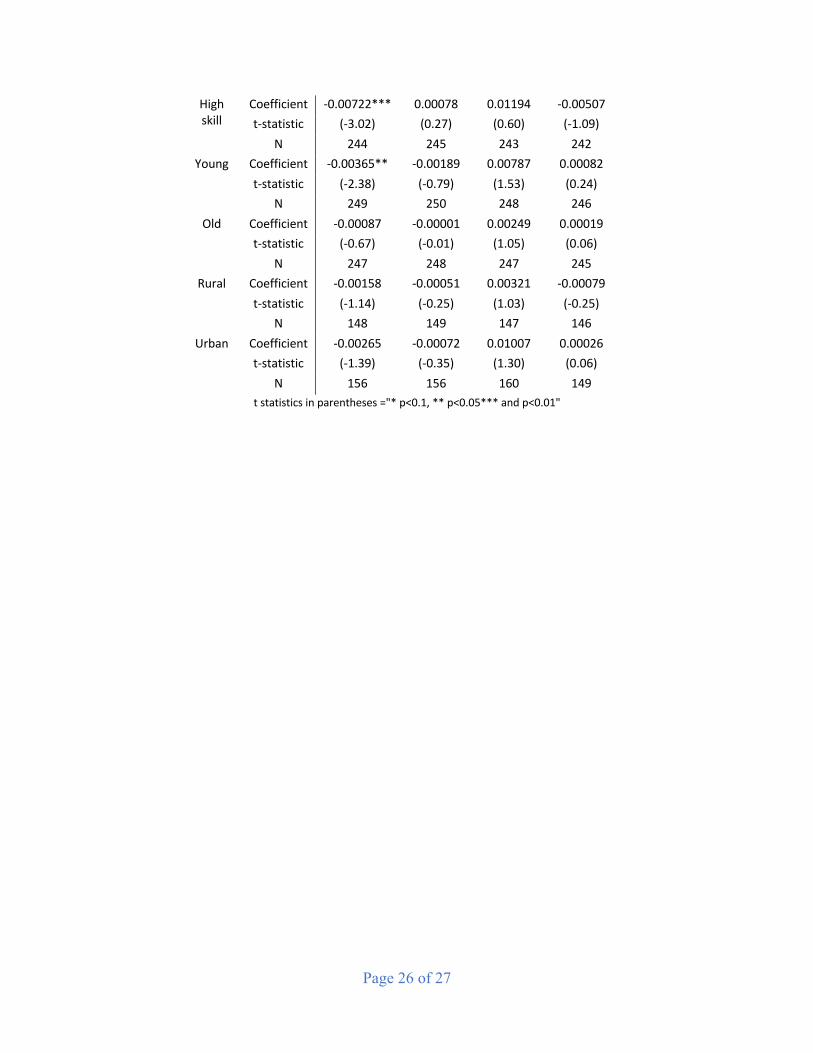
[Insert Figure 8 here] How did an increase in exports affect Egypt’s FLFP rate? The evolution of FLFP in Egypt is not encouraging. For the past decade, it has not surpassed the 32 percent threshold and has shown an upward trend in recent years. Nevertheless, exports seem to be helping more women enter the labor market. Although in the periods 2009-2010 and 2009-2012, a $100 increase in exports per worker had a negative effect on FLFP (table 7 in Appendix), the following period (2009-2015) saw a positive and statistically significant effect, which has continued. Thus, overall, exports seem to be helping contain the downward trend. In addition, young and high-skilled workers, compared to older and low-skilled ones, show a starker and statistically significant decrease in FLFP in districts that are more exposed to exports.
5. Conclusions and Future Work Against a backdrop of greater integration of developing countries into GVCs over the past 20 years, there has been heightened interest in the links between trade and labor market outcomes. Many studies have shown that rising exports to industrial countries, for instance, reduced poverty and spurred reallocation of labor from informal to formal jobs in several developing countries like India, Vietnam, and China. In this paper, we extend the existing literature by estimating the effects of a positive demand shock and labor market outcomes for Egypt, which provides an excellent

Page 12 of 27
case study. The problem for Egypt has been that despite its success in undertaking bold economic reforms – as well as signing several free-trade agreements that accelerated its imports and exports – its labor market is still rife with challenges—notably, rising informal employment and increasing wage inequality. This situation indicates that either Egypt’s benefits from trade are rather modest, or that trade does not connect to domestic local labor markets in the same way it does in other countries. To shed light on this issue, we take a two-pronged approach:
• The first approach is using gravity model estimates to understand if trade agreements produce the same increase in exports in Egypt as has occurred in other countries. The results suggest that although trade agreements tend to enhance trade, Egypt has gotten more “bang for its buck” with its trade agreements – that is, exports following these agreements have been above internationally estimated averages.
• The second approach is using Bartik (1991) estimates to analyze if higher exports generate better local labor market outcomes as has occurred in other countries. The results suggest that trade does impact labor market outcomes in the short run, but the effects quickly dissipate throughout the country and remain statistically insignificant for most types of workers.
The reason for the broken link between trade and labor markets, we argue is: (i) the composition of Egypt’s low diversified export basket in goods, with eroding global demand -a good reason for Egypt to rethink its export basket; and (ii) the fact that wage levels are among the highest in countries that export the same goods as Egypt. Also, in the past two decades, non-oil exports have failed to take off in Egypt, and similar countries have surpassed Egypt in participation in GVCs. Looking ahead, future research is needed in three important areas to gain more insight into the relationship between greater exports and local labor market outcomes in Egypt. First, more work is needed to provide a theoretical framework to separately identify firm-level effects and short-run industry-specific effects. It is likely that Egypt is exporting more to countries with the same income than to wealthier ones. This matters because the most technologically demanding goods come from wealthier countries, who would push firms to upgrade. Second, the paper currently uses the rise in exports of final goods but given that Egypt’s imports are more than double the value of its exports, future work should distinguish between imports of parts and imports of final goods. Third, firm- and industry-specific effects might not spill over to otherwise identical workers in different regions—even in the same industry, region, or country. Similarly, workers with the same age and education and occupation might earn different amounts based on their gender or industry-specific or firm-specific experience. Thus, it is important to sort out not only the different kinds of trade links to wages but also which dimensions of earnings would be affected in each case. References
Anderson, James. (2011). The Gravity Model. Annual Review of Economics. 3. 10.1146/annurev-economics-111809-125114.

Page 13 of 27
Anderson, James & Wincoop, Eric. (2003). Gravity With Gravitas: A Solution to the Border Puzzle. American Economic Review. 93. 170-192. 10.1257/000282803321455214.
Artuç, Erhan, Gladys Lopez-Acevedo, Raymond Robertson, and Daniel Samaan. 2019. “Exports to Jobs: Boosting the Gains from Trade in South Asia (English).” South Asia Development Forum. Washington, D.C.: World Bank Group.
Atamanov, Aziz, Sharad Alan Tandon, Gladys Lopez-Acevedo and Mexico Alberto Vergara Bahena (2020) ‘Measuring Monetary Poverty in the Middle East and North Africa (MENA) Region: Data Gaps and Different Options to Address Them’, Policy Research working paper no. WPS 9259, World Bank Group. Al Azzawi, Shireen and Mona Said. 2009. "Trade liberalization, inter-industry wage differentials and job quality in Egyptian manufacturing [Arabic]," Gender and Work in the MENA Region Working Paper no. 6. Cairo: Population Council. Baier, S. L. and J. H. Bergstrand. (2007) “Do Free Trade Agreements Actually Increase Members’ International Trade?” Journal of International Economics. 71(1): 72–95. Barsoum, G., Ramadan, M., and Mostafa M. (2014) “Labor market transitions from young women and men in Egypt”. International Labor Office. https://www.ilo.org/wcmsp5/groups/public/---dgreports/---dcomm/documents/publication/wcms_247596.pdf
Bartik, Timothy. 1991. Who Benefits from State and Local Economic Development Policies? W.E. Upjohn Institute.
Brenton,Paul; Piermartini, Roberta; Cali,Massimiliano; Hoppe,Mombert; Bartley Johns, Marcus. 2015. The role of trade in ending poverty (English). Washington, D.C. : World Bank Group. http://documents.worldbank.org/curated/en/726971467989468997/The-role-of-trade-in-ending-poverty
Dix-Carneiro, Rafael, and Brian K. Kovak 2017. “Trade Liberalization and Regional Dynamics.” American Economic Review 107(10): 2908–46.
Dollar, D. and Kraay, A. (2004), Trade, Growth, and Poverty*. The Economic Journal, 114: F22-F49. https://doi.org/10.1111/j.0013-0133.2004.00186.x
Erten, Bilge and Jessica Leight. 2017. “Exporting out of Agriculture: The Impact of WTO Accession on Structural Transformation in China. The Review of Economics and Statistics, 1-46.
Frankel, Jeffrey, A., and David H. Romer. (1999). "Does Trade Cause Growth?" American Economic Review, 89 (3): 379-399.
Gatti, Roberta; Angel-Urdinola, Diego F.; Silva, Joana; Bodor, Andras. (2011.) “Striving for Better Jobs: The Challenge of Informality in the Middle East and North Africa Region”. MENA

Page 14 of 27
Knowledge and Learning Quick Notes Series; No. 49. World Bank, Washington, DC. World Bank. https://openknowledge.worldbank.org/handle/10986/10857 License: CC BY 3.0 IGO.”
Gladys Lopez-Acevedo & Raymond Robertson, (2012). “Sewing Success? Employment, Wages, and Poverty following the End of the Multi-Fibre Arrangement”," World Bank Publications, The World Bank, number 13137, November. https://openknowledge.worldbank.org/bitstream/handle/10986/13137/675240PUB0EPI0067882B09780821387788.pdf?sequence=1
ILO. (2020). “Youth unemployment rates: a challenge for the future of work in Latin America and the Caribbean” International Labor Organization. https://www.ilo.org/caribbean/newsroom/WCMS_715152/lang--en/index.htm
McCaig, Brian. (2011). Exporting out of poverty: Provincial poverty in Vietnam and U.S. market access, Journal of International Economics, 85, (1), 102-113
McCaig, Brian, and Nina Pavcnik. 2018. "Export Markets and Labor Allocation in a Low- Income Country." American Economic Review, 108 (7): 1899-1941.
Noguer, Marta & Siscart, Marc. (2005). Trade Raises Income: A Precise and Robust Result. Journal of International Economics. 65. 447-460. 10.1016/j.jinteco.2003.11.006.
Robertson R., Kokas D., Cardozo D., and Lopez-Acevedo G. (2020). “Short and Long-Run Labor Market Effects of Developing Country Exports: Evidence from Bangladesh”. IZA DP No. 13041. http://ftp.iza.org/dp13041.pdf
Santos Silva, João and Tenreyro, Silvana, (2011), Further simulation evidence on the performance of the Poisson pseudo-maximum likelihood estimator, Economics Letters, 112, issue 2, p. 220-222, Srinivasan, T. N. & Bhagwati, Jagdish. (2002). Trade and Poverty in the Poor Countries By. American Economic Review. 92. 180-183. DOI: 10.1257/000282802320189212.
Topalova, Petia. (2010). “Factor Immobility and Regional Impacts of Trade Liberalization: Evidence on Poverty from India.” American Economic Journal of Applied Economics 2(4): 1– 41.
World Bank. (2004). “Unlocking the Employment Potential in the Middle East and North Africa Toward a New Social Contract”. The World Bank Group. http://documents1.worldbank.org/curated/en/343121468753030506/pdf/288150PAPER0Unlocking0employment.pdf
World Bank. 2012. “Reclaiming their voice: new perspectives from young women and men in Upper Egypt (English)”. Washington, D.C.: World Bank Group. http://documents.worldbank.org/curated/en/514301468233333500/Reclaiming-their-voice-new-perspectives-from-young-women-and-men-in-Upper-Egypt

Page 15 of 27
World Bank. 2013. “Jobs for Shared Prosperity Time for Action in the Middle East and North Africa”. The World Bank Group. http://documents1.worldbank.org/curated/en/540401468051871415/pdf/724690v40Full00Prosperity0full0book.pdf
World Bank. 2020. “How Transparency Can Help the Middle East and North Africa”. The World Bank Group. https://openknowledge.worldbank.org/bitstream/handle/10986/33475/9781464815614.pdf?sequence=9&isAllowed=y
Zaki, Chahir. (2016). Employment, Gender and International Trade : A Micro-Macro Evidence for Egypt. Review of Economics and Political Science. 1. 38-64. 10.12816/0031033. Zaki, Chahir and Hendy, Rana. (2013). Assessing The Effects of Trade Liberalization on Wage Inequalities in Egypt: A Microsimulation Analysis. The International Trade Journal. 27. DOI: 10.1080/08853908.2012.702538.
Zaki C and Hoda Y. (2019). “From Currency Depreciation to Trade Reform How to Take Egyptian Exports to New Levels?”. Policy Research Working Paper 8809. The World Bank Group. http://documents1.worldbank.org/curated/en/539431554812683933/pdf/From-Currency-Depreciation-to-Trade-Reform-How-to-Take-Egyptian-Exports-to-New-Levels.pdf

Page 16 of 27
Figures and Results
Figure 1: Unemployment and FLFP rates for Egypt and other MENA countries
Panel A. Problem of Unemployment is persistent Panel B. Female labor force participation rates remain low
Source: World Bank Databank, ILO’s estimations.
Figure 2: Still high levels of informality for both males and females in Egypt
Source: Authors’ elaboration using ELMPS.
4
9
14
19
2004
2005
2006
2007
2008
2009
2010
2011
2012
2013
2014
2015
2016
2017
2018
2019
2020U
nem
ploy
men
t rat
e (%
)
Algeria Egypt Lebanon
Libya Morocco MENA
Saudi Arabia Tunisia Yemen
0
10
20
30
40
2005
2006
2007
2008
2009
2010
2011
2012
2013
2014
2015
2016
2017
2018
2019
2020
FLFP
rate
(%)
Algeria Egypt Lebanon
Libya Morocco MENA
Saudi Arabia Tunisia Yemen

Page 17 of 27
Figure 3. Rising wages until recently but no narrowing of the gender gap
Source: Authors’ elaboration using ELMPS.
Figure 4: Importing and Exporting Activity
Panel A. Imports and exports of goods and services, constant 2010 $US Panel B. Top non-oil exports are apparel and fertilizers
Panel C. Imports and Exports of goods and services, as % of GDP
Source: Authors’ elaboration, UNCOMTRADE data
$0
$20
$40
$60
$80
$100
$120
1980
1983
1986
1989
1992
1995
1998
2001
2004
2007
2010
2013
2016
2019
Billi
ons
Imports
Exports
0
10
20
30
40
50
1960
1964
1968
1972
1976
1980
1984
1988
1992
1996
2000
2004
2008
2012
2016
% o
f GD
P
Imports Exports
Page 18 of 27
Figure 5: EU is Egypt’s biggest export partner, for imports, it is China
Panel A. Egypt’s top exporting partners, 2018 Panel B. Egypt’s top importing partners, 2018
Source: OEC, UNCOMTRADE data Figure 6. Exports per workers are concentrated in some governorates more than others
Panel A: Concentration of non-oil exports per worker 2009-2010
Panel B: Concentration of non-oil exports per worker 2009-2012
Panel C: Concentration of non-oil exports per worker 2009-2015
Panel D: Concentration of non-oil exports per worker 2009-2017

Page 19 of 27
Note: There are 259 (municipal) kizm and markaz within the 27 governorates: 1 Alexandria; 2 Asyout; 3 Aswan; 4 Behira; 5 Beni-Suef; 6 Cairo; 7 Dakahlia; 8 Damietta; 9 Fayoum; 10 Gharbia; 11 Giza; 12 Ismaelia; 13 Kafr-El-sheik; 14 Kalyoubia; 15 Luxor; 16 Matrouh; 17 Menia; 18 Menoufia; 19 New Valley (El-wadi El-Gidid); 20 North Sinai; 21 Port Said; 22 Qena; 23 Red Sea; 24 Sharkia; 25 South Sinai (no data); 26 Suez; 27 Suhag. Source: Authors’ elaboration using ELMPS.
Table 1: Gravity Data Summary Statistics
Variable Mean Std. Dev. Min Max Imports 348.22 4346.49 0.00 489073.70 GDP Importer 24.04 2.39 16.97 30.51 GDP Exporter 23.95 2.43 16.97 30.51 Contiguous Indicator 0.02 0.12 0.00 1.00 GATT Member Exporter 0.77 0.42 0.00 1.00 GATT Member Importer 0.78 0.41 0.00 1.00 Common Currency Indicator 0.01 0.11 0.00 1.00 Distance 8.78 0.76 4.11 9.89 RTA Indicator 0.17 0.37 0.00 1.00 Notes: The data consist of 733,786 observations for all variables with 189 exporters and 177 importers. The data span 1996 to 2018.
Page 20 of 27
Table 2: Baseline PPML Gravity Estimates
(1) (2) (3) VARIABLES Baseline Gravity RTA Estimate Egypt Interactions GDP Importer 0.896*** 0.861*** 0.896***
(0.062) (0.060) (0.062) GDP Exporter 0.791*** 0.761*** 0.791***
(0.070) (0.069) (0.070) Contiguity Indicator 0.497*** 0.458*** 0.497***
(0.065) (0.063) (0.065) Exporter GATT Member 0.267*** 0.274*** 0.267***
(0.058) (0.063) (0.058) Importer GATT Member 0.428*** 0.438*** 0.428***
(0.049) (0.050) (0.049) Common Currency 0.119* 0.110* 0.120*
(0.063) (0.059) (0.063) EGYPT -1.094
(1.138) Distance (Log) -0.814*** -0.755*** -0.814***
(0.030) (0.035) (0.030) Egypt x Distance -0.065
(0.123) RTA Indicator 0.232***
(0.057) Constant -31.248*** -30.402*** -31.252***
(1.605) (1.575) (1.605)
Observations 906,060 906,060 906,060 R-squared 0.851 0.856 0.851 Notes: Robust standard errors in parentheses. *** p<0.01, ** p<0.05, * p<0.1. EGYPT is equal to one if Egypt is either an exporter or importer.

Page 21 of 27
Table 3: Egypt’s Trade following Trade Agreements (1) (2) (3) VARIABLES Egypt Total Egypt as Importer Egypt as Exporter GDP Importer 0.697*** 0.697*** 0.697***
(0.056) (0.056) (0.056) GDP Exporter 0.568*** 0.568*** 0.568***
(0.066) (0.066) (0.066) Contiguity Indicator 0.440*** 0.440*** 0.441***
(0.064) (0.064) (0.064) Exporter GATT Member 0.243*** 0.243*** 0.244***
(0.055) (0.055) (0.055) Importer GATT Member 0.351*** 0.351*** 0.351***
(0.043) (0.043) (0.043) Common Currency 0.029 0.029 0.030
(0.064) (0.064) (0.064) Distance (Log) -0.763*** -0.763*** -0.763***
(0.035) (0.035) (0.035) Egypt Total -0.794*
(0.457) Egypt as Importer 0.120
(0.435) Egypt as Exporter -1.077**
(0.445) Regional Trade Agreement 0.249*** 0.250*** 0.248***
(0.058) (0.058) (0.058) Egypt x RTA 0.052 -0.152 0.480***
(0.130) (0.151) (0.137) Constant -22.321*** -22.318*** -22.325***
(1.780) (1.781) (1.779)
Observations 733,786 733,786 733,786 R-squared 0.873 0.873 0.873 Notes: Robust standard errors in parentheses *** p<0.01, ** p<0.05, * p<0.1. RTA stands for Regional Trade Agreement. Egypt Total is a dummy variable equal to one if Egypt is either an importer or exporter.

Page 22 of 27
Figure 7: Higher exports do not translate into higher wages Change in the average annual real wages after a $100 increase in exports per worker (2010 Egyptian pounds)
Figure 8: Higher exports do not translate into lower informality Change in the average annual informality rate after a $100 increase in exports per worker (percentage)
-1,500
-1,000
-500
0
500
1,000
2009
-10
2009
-12
2009
-15
2009
-10
2009
-12
2009
-15
2009
-10
2009
-12
2009
-15
2009
-10
2009
-12
2009
-15
2009
-10
2009
-12
2009
-15
All workers Males Females Low-skilled High-skilled
Effe
ct o
n re
al w
ages
(Egy
ptia
n po
unds
)
Coefficient Lower bound Confidence interval (90%)
-3%
-2%
-1%
0%
1%
2%
3%
2009
-10
2009
-12
2009
-15
2009
-10
2009
-12
2009
-15
2009
-10
2009
-12
2009
-15
2009
-10
2009
-12
2009
-15
2009
-10
2009
-12
2009
-15
All workers Males Females Low-skilled High-skilled
Effe
ct o
n in
form
ality
rate
s (%
)
Coefficient Lower bound Confidence interval (90%)
Page 23 of 27
Appendix
Table 4. Egypt - Mincerian Equation Results with Sector Variables12
2009 2010 2011 2012 2013 2014 2015 2016 2017
female -0.094*** -0.191*** -0.087*** -0.232*** -0.165*** -0.136*** -0.126*** -0.078*** -0.076***
(-15.18) (-28.26) (-12.74) (-17.00) (-24.39) (-19.32) (-18.54) (-13.40) (-14.41)
sector4 -0.062*** -0.146*** 0.006 -0.718*** -0.112*** -0.048*** -0.030* -0.097*** -0.117***
(-4.22) (-9.23) (0.34) (-20.63) (-6.49) (-2.91) (-1.73) (-5.94) (-7.51)
fem_text -0.049 -0.129*** -0.092** 0.095 -0.035 -0.140*** -0.167*** -0.196*** -0.144***
(-1.57) (-4.06) (-2.49) (1.36) (-1.01) (-4.38) (-4.91) (-6.26) (-4.60)
age 0.011*** 0.025*** 0.014*** 0.038*** 0.018*** 0.017*** 0.017*** 0.010*** 0.007***
(9.28) (19.55) (10.45) (14.34) (13.55) (12.87) (12.35) (9.32) (8.04)
age2 0.000 -0.000*** -0.000*** -0.000*** -0.000 -0.000* -0.000** 0.000 0.000**
(1.04) (-8.22) (-3.40) (-5.45) (-1.27) (-1.75) (-2.41) (0.30) (2.28)
high_skill 0.224*** 0.206*** 0.229*** 0.307*** 0.209*** 0.203*** 0.233*** 0.194*** 0.153***
(41.28) (35.10) (38.74) (25.75) (35.18) (32.95) (37.86) (33.87) (27.95)
hours -0.094*** -0.191*** -0.087*** -0.232*** -0.165*** -0.136*** -0.126*** -0.078*** -0.076***
(-15.18) (-28.26) (-12.74) (-17.00) (-24.39) (-19.32) (-18.54) (-13.40) (-14.41)
_cons -0.062*** -0.146*** 0.006 -0.718*** -0.112*** -0.048*** -0.030* -0.097*** -0.117***
(-4.22) (-9.23) (0.34) (-20.63) (-6.49) (-2.91) (-1.73) (-5.94) (-7.51)
N -0.049 -0.129*** -0.092** 0.095 -0.035 -0.140*** -0.167*** -0.196*** -0.144***
t statistics in parentheses ="* p<0.1, ** p<0.05*** and p<0.01"
Table 5. Change in the average annual real wages after a US$100 increase in exports per worker (Egyptian pounds of 2010)
Type of worker 2009-2010 2009-2012 2009-2015 2009-2017
(1) (2) (3) (4)
All Coefficient -317.41*** -207.85** 85.15 -0.30
t-statistic (-3.49) (-2.55) (0.68) (-0.00) N 249 250 248 246
Manufacturing Coefficient -386.22** -195.71 -241.50 291.39
t-statistic (-2.17) (-0.56) (-0.82) (0.91) N 121 119 114 110
Textiles and Apparel Coefficient -235.41 900.36 404.79 674.03
12 Coefficients of all other sectors are not reported for simplicity of reading.
Page 24 of 27
t-statistic (-0.53) (1.51) (0.93) (0.56) N 38 35 35 37
Services Coefficient -287.51*** -119.41 21.71 111.96 t-statistic (-2.66) (-1.10) (0.09) (0.33)
N 248 250 248 246 Males Coefficient -373.86*** -244.49*** 107.09 47.95
t-statistic (-3.67) (-3.32) (0.89) (0.17) N 249 250 248 246
Females Coefficient -64.65 -67.59 -24.94 -19.54 t-statistic (-0.51) (-0.41) (-0.08) (-0.11)
N 202 201 204 205 Low Skill Coefficient -275.70*** -286.06*** 204.50 -60.47
t-statistic (-3.86) (-2.61) (1.40) (-0.17) N 245 247 245 242
High Skill Coefficient -353.34* -149.22 -394.40 -246.79 t-statistic (-1.95) (-0.64) (-0.59) (-0.91)
N 233 236 232 231 Young Coefficient -295.35*** -203.63*** 287.28* -420.47
t-statistic (-2.66) (-2.81) (1.87) (-1.10) N 247 246 245 244
Old Coefficient -349.56*** -242.24** -241.97 378.40 t-statistic (-3.25) (-2.11) (-0.57) (1.08)
N 248 250 248 246 Rural Coefficient -204.77*** -133.67** 110.75 -54.67
t-statistic (-2.70) (-2.19) (1.09) (-0.45) N 148 149 147 146
Urban Coefficient -374.26** -380.90* 135.40 153.70 t-statistic (-2.29) (-1.72) (0.72) (0.25)
N 156 156 160 149 t statistics in parentheses ="* p<0.1, ** p<0.05*** and p<0.01"
Table 6. Change in the informality rate after a US$100 increase in exports per worker (Percentage)
Type of worker 2009-2010 2009-2012 2009-2015 2009-2017
(1) (2) (3) (4)
All Coefficient 0.00310 -0.00026 0.00694 -0.01514
t-statistic (1.44) (-0.09) (0.57) (-1.09)
N 249 250 248 246
Manufacturing Coefficient 0.00001 -0.00827 0.02003 -0.01831
t-statistic (0.00) (-0.73) (1.49) (-1.23)
N 151 150 155 139
Textiles and Apparel Coefficient -0.01209 -0.02855 0.04017 -0.02836
Page 25 of 27
t-statistic (-0.82) (-1.09) (0.91) (-0.66)
N 45 45 43 46
Services Coefficient -0.00121 -0.00081 -0.00136 -0.00065
t-statistic (-1.13) (-1.50) (-1.01) (-0.88)
N 249 250 248 246
Males Coefficient 0.00281 -0.00194 0.00934 -0.01775
t-statistic (1.42) (-0.62) (0.75) (-1.19)
N 249 250 248 246
Females Coefficient -0.00017 -0.00067 -0.00184 0.00216
t-statistic (-0.10) (-0.65) (-0.65) (0.97)
N 230 226 226 224
Low Skill Coefficient 0.00303* -0.00127 0.00920 -0.02031
t-statistic (1.90) (-0.45) (0.80) (-0.88)
N 245 247 245 242
High Skill Coefficient -0.00160 -0.00012 -0.00208 -0.00116
t-statistic (-1.00) (-0.06) (-0.22) (-0.31)
N 239 241 239 238
Young Coefficient 0.00168 0.00028 0.00994 -0.01981
t-statistic (0.73) (0.08) (0.85) (-1.12)
N 249 250 248 246
Old Coefficient 0.00259 -0.00125 0.00455 -0.01342
t-statistic (1.12) (-0.44) (0.38) (-1.11)
N 249 250 248 246
Rural Coefficient 0.00225 -0.00017 -0.00621 -0.00319
t-statistic (1.23) (-0.12) (-1.60) (-1.13)
N 148 149 147 146
Urban Coefficient 0.00024 -0.00086 0.01621 -0.02437
t-statistic (0.10) (-0.14) (0.85) (-0.91)
N 156 156 160 149
t statistics in parentheses ="* p<0.1, ** p<0.05*** and p<0.01"
Table 7. Change in the female labor force participation rate after a US$100
increase in exports per worker (Percentage)
Type of worker 2009-2010 2009-2012 2009-2015 2009-2017
(1) (2) (3) (4)
All Coefficient -0.00236** -0.00117 0.00466* 0.00107
t-statistic (-1.98) (-0.74) (1.66) (0.39)
N 249 250 248 246
Low skill Coefficient -0.00152 -0.00160 0.00562 -0.00389
t-statistic (-1.63) (-1.44) (1.62) (-1.10)
N 247 248 247 244
Page 26 of 27
High skill
Coefficient -0.00722*** 0.00078 0.01194 -0.00507
t-statistic (-3.02) (0.27) (0.60) (-1.09)
N 244 245 243 242
Young Coefficient -0.00365** -0.00189 0.00787 0.00082
t-statistic (-2.38) (-0.79) (1.53) (0.24)
N 249 250 248 246
Old Coefficient -0.00087 -0.00001 0.00249 0.00019
t-statistic (-0.67) (-0.01) (1.05) (0.06)
N 247 248 247 245
Rural Coefficient -0.00158 -0.00051 0.00321 -0.00079
t-statistic (-1.14) (-0.25) (1.03) (-0.25)
N 148 149 147 146
Urban Coefficient -0.00265 -0.00072 0.01007 0.00026
t-statistic (-1.39) (-0.35) (1.30) (0.06)
N 156 156 160 149
t statistics in parentheses ="* p<0.1, ** p<0.05*** and p<0.01"