International risk sharing and European monetary ...
28
Journal of International Economics 45 (1998) 211–238 International risk sharing and European monetary unification a b, * Bent E. Sørensen , Oved Yosha a Economics Department, Brown University, Providence, RI 02912, USA b Berglas School of Economics, Tel Aviv University, Tel Aviv 69978, Israel Received 13 February 1997; received in revised form 21 May 1997; accepted 30 November 1997 Abstract We explore income and consumption smoothing patterns among European Community (EC) countries and among OECD countries during the period 1966–90. We find that, for OECD as well as for EC countries, about 40 percent of shocks to GDP are smoothed at the one year frequency, with about half the smoothing achieved through national government budget deficits and half by corporate saving. At the three year differencing frequency only 25 percent of shocks to GDP are smoothed, mainly via government lending and borrowing. In the absence of alternative income and consumption smoothing mechanisms, the restrictions on budget deficits imposed by the Maastricht Treaty should be relaxed to allow governments to run large temporary deficits in response to output shocks. 1998 Elsevier Science B.V. Keywords: Government Deficits; Income Insurance; International Capital Markets; Interna- tional Integration; Risk Sharing JEL classification: E2; E6; F15; G15 1. Introduction Mechanisms for achieving income insurance and consumption smoothing are essential for the stability of a monetary union. Without such mechanisms, countries in recession will have an incentive to leave the union. Central fiscal institutions * Corresponding author: Tel.: 1972 3 6407242; fax: 1972 3 6409908; e-mail: [email protected] 0022-1996 / 98 / $19.00 1998 Elsevier Science B.V. All rights reserved. PII: S0022-1996(98)00033-6
Transcript of International risk sharing and European monetary ...
Journal of International Economics 45 (1998) 211–238
International risk sharing and European monetaryunification
a b ,*Bent E. Sørensen , Oved YoshaaEconomics Department, Brown University, Providence, RI 02912, USA
bBerglas School of Economics, Tel Aviv University, Tel Aviv 69978, Israel
Received 13 February 1997; received in revised form 21 May 1997; accepted 30 November 1997
Abstract
We explore income and consumption smoothing patterns among European Community(EC) countries and among OECD countries during the period 1966–90. We find that, forOECD as well as for EC countries, about 40 percent of shocks to GDP are smoothed at theone year frequency, with about half the smoothing achieved through national governmentbudget deficits and half by corporate saving. At the three year differencing frequency only25 percent of shocks to GDP are smoothed, mainly via government lending and borrowing.In the absence of alternative income and consumption smoothing mechanisms, therestrictions on budget deficits imposed by the Maastricht Treaty should be relaxed to allowgovernments to run large temporary deficits in response to output shocks. 1998 ElsevierScience B.V.
Keywords: Government Deficits; Income Insurance; International Capital Markets; Interna-tional Integration; Risk Sharing
JEL classification: E2; E6; F15; G15
1. Introduction
Mechanisms for achieving income insurance and consumption smoothing areessential for the stability of a monetary union. Without such mechanisms, countriesin recession will have an incentive to leave the union. Central fiscal institutions
*Corresponding author: Tel.: 1972 3 6407242; fax: 1972 3 6409908; e-mail: [email protected]
0022-1996/98/$19.00 1998 Elsevier Science B.V. All rights reserved.PI I : S0022-1996( 98 )00033-6
212 B.E. Sørensen, O. Yosha / Journal of International Economics 45 (1998) 211 –238
can provide cross-country income isurance via a tax-transfer system and byallocating grants to the governments of specific countries; Eichengreen (1993) and
1Obstfeld and Rogoff (1996) provide useful surveys. Market institutions can alsoprovide risk sharing. The members of a union can share risk via cross-ownershipof productive assets, facilitated by a developed capital market, and may smooththeir consumption by adjusting the composition and size of their asset portfolio inresponse to shocks, for example through lending and borrowing on internationalcredit markets. This is a central theme in recent work on international risk sharing,e.g., Backus et al. (1992); Obstfeld (1994b); Baxter and Crucini (1995); Stockmanand Tesar (1995), and Lewis (1996).
Asdrubali et al. (1996) found that in the United States, a successful monetaryunion, 62 percent of shocks to the per capita gross product of individual states aresmoothed on average through transactions on markets, 13 percent are smoothed bythe federal tax-transfer and grant system, and 25 percent of shocks are notsmoothed. Therefore, although perfect insurance is not achieved, there is consider-
2able risk sharing among U.S. states. In this paper, we explore risk sharing patternsamong European Community (EC) countries and among OECD countries duringthe period 1966–90. Our results indicate that factor income flows do not smoothincome across countries. This is true for the entire OECD group as well as for ECmembers, for the entire period as well as for two subperiods. Since factor incomeflows are an important component of income smoothing via capital markets, thissuggests that European capital markets are less integrated than US capital markets.
The finding of much interstate income insurance among U.S. states is consistentwith the fact, reported in this paper, that U.S. state income correlations are higherthan U.S. state output correlations. The finding of no international incomeinsurance among OECD countries is consistent with the fact, also reported here,that OECD country income correlations are roughly equal to OECD country output
3correlations.Robert A. Mundell (1961), pp. 661–2, defines an optimum currency area as one
where internal factor mobility is high. Interestingly, he points out that whether ornot Western Europe can be considered a single region is essentially an empirical
1Among the first to stress this point were Sala-i-Martin and Sachs (1992); von Hagen (1992);Atkeson and Bayoumi (1993); Goodhart and Smith (1993), and Bayoumi and Masson (1995).
2Asdrubali et al. (1996) measure, e.g., consumption as smoother than income if the elasticity ofconsumption with respect to output is lower than the elasticity of income with respect to output, whenworldwide shocks are controlled for. The method for estimating these elasticities is based on a variancedecomposition of shocks to output which is described in detail in Section 2.
3Consumption correlations, however, are low both for U.S. states and OECD countries, in line withthe well known international consumption correlation puzzle. We endorse the explanation suggested byStockman and Tesar (1995) who argue that low consumption correlations are due to country specifictaste shocks, and are consistent with considerable, even full, risk sharing. We claim, though, that ourmethod for decomposing the cross-sectional variance in shocks to output can measure the amount ofconsumption smoothing achieved despite the presence of taste shocks.
B.E. Sørensen, O. Yosha / Journal of International Economics 45 (1998) 211 –238 213
issue. The findings in Asdrubali et al. (1996) of considerable income insuranceamong U.S. states suggest that the United States is close to being an optimumcurrency area, whereas our findings regarding negligible capital income flowsamong EC and OECD countries suggest that, at least for the time being, these arenot optimal currency areas. Our work does not provide an overall evaluation of thecosts and benefits of European Monetary Unification (EMU); rather, we point outthat further integration of European capital markets should be of high priority, inparticular in light of monetary unification.
We further find, for the period 1981–90, that the fraction of shocks to GDPsmoothed via international transfers, including EC structural funds, is on the orderof 3 to 7 percent, considerably less than the 13 percent fraction of shocks to theper capita gross state product smoothed by the federal government in the UnitedStates.
The bulk of the income and consumption smoothing among OECD and ECcountries is achieved via savings: countries save less in bad years. For the period1966–90, we find that about 40 percent of shocks to the GDP of OECD countriesare smoothed at the one year frequency via this channel, while 60 percent ofshocks are not smoothed. About half of the smoothing is achieved throughcorporate saving patterns and half through national government budget deficits.There is no cross-country consumption smoothing through personal saving. At thethree year differencing frequency only about 25 percent of shocks to GDP aresmoothed, with all the smoothing achieved via government lending and
4borrowing.An important implication is that, in the absence of alternative income and
consumption smoothing mechanisms, the restrictions on budget deficits imposedby the Maastricht Treaty should be relaxed to allow governments to run large
5temporary deficits in response to output shocks. The large amount of consumptionsmoothing achieved in the EC via government borrowing may not be sustainablein an EMU where fiscal coordination must be maintained. Until intercountry creditmarkets develop to allow substantial consumption smoothing through personalsaving, the potential reduction in consumption smoothing via the budget deficits ofnational governments may call for a yet greater insurance role of EC institutions,imposing a further burden on the EC budget.
Of course, the creation of a common currency may in itself enhance capital
4If Ricardian considerations are important then such a decomposition is less meaningful. We addressthis issue in the empirical analysis, finding no evidence for or against the hypothesis that differentforms of savings are substitutes. Although it is not possible to reject the claim that less consumptionsmoothing via government saving will be fully offset by increased smoothing through private sectorconsumption smoothing, we regard full and immediate Ricardian equivalence as unlikely.
5Most countries in the EC are close to or above the maximum public debt to GDP ratio allowedunder the Maastricht Treaty. Eichengreen and von Hagen (1995) discuss the desirability of fiscalrestraints in a future EMU, but do not raise the issue of consumption smoothing via nationalgovernment borrowing and lending.
214 B.E. Sørensen, O. Yosha / Journal of International Economics 45 (1998) 211 –238
market integration among EC members. The question is how fast this will happen.To the extent that informational barriers to cross-country ownership of productiveassets are the main cause of little international capital flows (Gordon andBovenberg, 1996; Coval, 1996), capital market integration may take time sinceinformational barriers may be slow to disappear. If capital controls and cost oftransacting in many currencies have been the main cause of little cross-countryownership, their removal may induce a swift process of capital market integration.To the extent that monetary unification progresses according to schedule whilecapital market integration occurs slowly, the EC may have to provide greaterinter-regional insurance through its budget, until capital markets are sufficientlyintegrated to carry out this role, as they do in the United States. For an early study
6of these issues, see the MacDougall Report, European Commission (1977).Since saving is related to net exports through the identity S 5 I 1 (X 2 M), the
7physical cross-country flows of goods generated by saving is worth examining.We, therefore, decompose smoothing through saving into smoothing via I andX 2 M, finding that all the smoothing is achieved through domestic net physicalinvestment with virtually no smoothing via net exports, in line with the wellknown Feldstein and Horioka (1980) puzzle. This complements the fact that thereis no smoothing through factor income flows, giving further indication of thelimited cross-country risk sharing achieved via capital and credit markets among
8EC and OECD countries. Of related interest is Bayoumi and Rose (1993) whofind that saving and investment are not correlated across regions within the UnitedKingdom indicating that, unlike international capital markets, national markets arerelatively well integrated.
In our empirical analysis we deflate all the magnitudes (GDP, GNP, S, etc.) bythe country consumption deflator. That is, we measure the National Accountsfigures of each country in terms of real consumption in that country. Of course,exchange rate fluctuations may affect consumption decisions and risk sharingpatterns. If, for example, the currency of a country appreciates in real (inflationadjusted) terms, the citizens and the government of that country can, in principle,purchase more goods at international prices with a given amount of the country’scurrency. We find, using our data, that this effect is relatively small, namely,changes in the real exchange rate have a small effect on the cross-sectionalconsumption patterns that we consider.
We do not examine the effects of labor mobility on smoothing of GDP shocks.
6See also Inman and Rubinfeld (1994) who emphasize the desirability of EC-wide fiscal policies thatprovide aid to countries in need.
7Backus et al. (1992) have analyzed, in the framework of a simulated stochastic two country generalequilibrium model, the behavior of consumption, investment, and net exports. See also Mendoza(1991); Baxter and Crucini (1993); von Hagen and Hammond (1994); Ghosh (1995); Stockman andTesar (1995); Phillips (1996), and Bayoumi and Klein (1996).
8The introduction to Leiderman and Razin (1994) and the papers therein provide an overview ofrelated issues.
B.E. Sørensen, O. Yosha / Journal of International Economics 45 (1998) 211 –238 215
Asdrubali et al. (1996) found that labor mobility among U.S. states smoothesaround 2.7 percent of an income shock at the annual frequency (see also Barro andSala-i-Martin, 1991). Eichengreen (1994) documents that labor mobility is loweramong European countries and regions than among U.S. states. It is, therefore,unlikely that labor mobility among EC and OECD countries substantially affectsrisk sharing patterns at the annual frequency.
In the next section we address conceptual issues related to risk sharing amongcountries. We characterize the full risk sharing allocation and derive empiricalimplications of the theory, relating them to the approach taken by, e.g., Backus etal. (1992), to that of Cochrane (1991); Mace (1991), and Townsend (1994), to thatof Obstfeld (1994b), and to the method developed in Asdrubali et al. (1996) fordecomposing shocks to GDP into various channels of smoothing and measuringthe fraction of shocks that is not smoothed. In Section 3 we describe the estimatedequations. Section 4 is devoted to a presentation of the data and the empiricalfindings, and Section 5 concludes.
2. International risk sharing and consumption smoothing
We start by characterizing the full risk sharing allocation, and its relation toperfect consumption smoothing. We draw empirical implications of the theory,comparing various approaches in the risk sharing literature, including InternationalReal Business Cycle methodology, as well as our method for decomposing thevariance in shocks to GDP.
2.1. Full risk sharing and perfect consumption smoothing: theory
We think of GDP as a homogeneous tradable good. The period t per capitaoutput of country i is an exogenous random variable with a commonly knownprobability distribution. Let the representative consumer of each country be a risk
9averse expected utility maximizer who derives utility from consumption. Consum-ers within each country are assumed to be identical ex-ante (all have the sameutility function and the same stochastic endowment), as well as ex-post (all aresubject to the same realization of uncertainty). Thus, the derivation focuses on risksharing between countries, ignoring risk sharing within countries.
Suppose that asset markets are complete. Then country i faces a single budgetconstraint in period 0, and chooses a consumption plan by solving the problem:
9As in Cochrane (1991); Mace (1991); Townsend (1994); Obstfeld (1994b), and Asdrubali et al.(1996), we do not consider non-separabilities in the utility function between consumption and leisure,or non-tradability of output. See Canova and Ravn (1996) and Lewis (1996) for a treatment of theseissues in the context of international risk sharing.
216 B.E. Sørensen, O. Yosha / Journal of International Economics 45 (1998) 211 –238
`
t imax O d O p u(c ) (1)ihc j v vv t tt vt50 t
` `
i is.t. O O p c #O O p GDPv v v vt t t tv vt50 t50t t
i iwhere GDP and c are the per capita output and consumption in state of naturev vt t
v that occurs with probability p , and p is the price in period 0 of a (period t)t v vt t
state v contingent unit of consumption. d ,1 is the intertemporal subjectivet
discount factor, common to all consumers. The first order condition with respect toic isvt
t i id p u9(c ) 2 l p 5 0 (2)v v vt t t
iwhere l is a Lagrange multiplier. Market clearing implies that for all vt
i i i iO n c 5On GDP (3)v vt ti i
iwhere n is the population of country i. We normalize prices as follows:`O O p 5 1 (4)vtvt50 t
Assuming that endowments are bounded, Eq. (4) implies that the sums in thebudget constraint in Eq. (1) are well defined.
Letting u(c)5log c, we derive an expression for the price of a state contingent10 i isecurity as follows. Solve for c in Eq. (2), multiply both sides by n , sum overvt i ii, solve for p , sum over v , sum both sides over t, solve for o (n /l ) using (4)v t it
and substitute the result into the expression for p , obtainingvt
pvtt ]]]p 5 constant 3 d (5)v i it O n ci vt
` t i i 21where the constant is o d o p [1 /o n c ] . Eliminating p using (2) andh jt50 v v i v vt t t t
(5), using the market clearing condition Eq. (3), and denoting world consumptionw i i iby c 5 o n GDP / o n , where for simplicity the index v is replaced by t, wes d s dt i t i t
get
i i wc 5 k c (6)t t
That is, risk is fully shared among countries if the consumption of a country
10A similar, but slightly longer derivation can be performed for general CRRA utility.
B.E. Sørensen, O. Yosha / Journal of International Economics 45 (1998) 211 –238 217
comoves with world consumption, but does not comove with country specificshocks.
iThe constant k is country specific, and is independent of time and of the state ofnature, reflecting country i’s ‘power’ in the risk sharing arrangement. With
ilogarithmic utility, we can derive a closed form solution for k which is quiteinstructive. Multiply and divide by p inside the summation operator on bothvt
sides of the budget constraint in Eq. (1) (which binds at an optimum), use Eq. (2)i w i i `to substitute for p /p , substitute k c for c , and solve for k 5(12d )ov v t v t50t t tt i w
d E(GDP /c ) where E denotes the expectation in period 0. Thus, the share oft t
country i’s consumption in world consumption is the discounted expected share ofits future output in world consumption.
We now demonstrate that full risk sharing implies perfect consumptionsmoothing in the sense that intertemporal Euler equations are satisfied. Sum over
t i iv in Eq. (2), to obtain d o p u9(c ) 5 l o p where o p is the period 0t v v v v v v vt t t t t t t
price of a sure unit of consumption in period t. Doing the same for period t11,iand using the fact that l is independent of time, we obtain
i t11 iE u9(c ) 5 d(1 1 r )E u9(c ) , (7)t v t t11 vt t11
t11where 1 1 r 5 o p / o p is the (gross) riskless interest rate froms d s dt v v v vt t t11 t11
period t to period t11, reflecting the relative price of a sure unit of consumptionin period t and a sure unit of consumption in period t11. At t50, suppressing the
i 1 iindex v , Eq. (7) becomes u9(c ) 5 d(1 1 r )Eu9(c ).t 0 0 1
Thus, if asset markets are complete, there is full risk sharing (Eq. (6)) andperfect consumption smoothing (Eq. (7)). If asset markets are not complete fullrisk sharing will typically not be satisfied, but perfect consumption smoothing maystill hold. Baxter and Crucini (1995) observe that in an incomplete marketseconomy where the only financial instrument is a riskless bond, Eq. (7) is satisfiedwhile Eq. (6) is not. They show, however, that if shocks to output are highlypersistent, the deviation from the full risk sharing consumption allocation will besubstantial, whereas if shocks are transitory the deviation from the full risk sharingallocation will be small despite the incompleteness of markets.
2.2. Taste shocks
i iLet the period t utility function of country i be u u(?) where u is ant tiidiosyncratic taste shock, and normalize so that o (1 /u )51 in all periods. Ani t
analogous derivation yields that under full risk sharingi i i wc 5u k c (8)t t t
in any state of nature, where the state of nature fully describes the distribution oftaste shocks across countries. Thus, although consumption in country i is not afixed fraction of world consumption, as is the case when there are no idiosyncratic
218 B.E. Sørensen, O. Yosha / Journal of International Economics 45 (1998) 211 –238
taste shocks, the central property of Eq. (6) is preserved–the consumption ofcountry i is affected by aggregate shocks and by idiosyncratic taste shocks, but notby other idiosyncratic shocks (including income shocks).
2.3. Empirical implications of full risk sharing
The empirical literature has tackled consumption smoothing and risk sharing astwo distinct propositions. Euler equation tests of perfect consumption smoothingabound and are outside the scope of this paper. A central empirical implication offull risk sharing, Eq. (6), is that the correlation of consumption across economicagents should be equal to unity. The International Real Business Cycle literature,most notably Backus et al. (1992), and more recently Baxter and Crucini (1995)and Stockman and Tesar (1995), among others, have taken this prediction tointernational macroeconomic data, finding that inter-country consumption correla-tions are nowhere close to unity. In fact, these consumption correlations are nothigher than country output correlations as we would expect if there were onlypartial international risk sharing. It is now a stylized fact that country consumptioncorrelations are no higher than country output correlations, a phenomenon that has
11become known as the international consumption correlation puzzle.A second, related, empirical implication of Eq. (6) is that under full risk sharing,
the consumption of an economic agent does not respond to idiosyncratic shocks, inparticular income shocks. This proposition has been tested on micro-data by, e.g.,
12Cochrane (1991); Mace (1991), and Townsend (1994). These studies performcross-sectional or panel regressions of individual consumption on sources ofidiosyncratic risk (mainly on income but also on variables such as sickness orlayoffs). In many of these studies full risk sharing is rejected (Cochrane, 1991;
13Townsend, 1994; Hayashi et al., 1996).Obstfeld (1994b) tests for full risk sharing among nine large OECD countries by
i wrunning, for each country, the time series regression D log c on D log c . In thet t
absence of worldwide taste shocks, the coefficients in these regressions are14estimated consistently, and if there is full risk sharing, they should be unity. The
coefficients in many of Obstfeld’s regressions are positive but smaller than unity,which suggests that there is partial risk sharing but not full risk sharing.
11Stockman and Tesar (1995) suggest country specific taste shocks as an explanation of the puzzle.We return to this issue shortly.
12See also Altug and Miller (1990) and Hayashi et al. (1996).13For extensions of the basic framework, see, e.g., Canova and Ravn (1996) and Lewis (1996). A
comprehensive survey of research on international diversification is provided in Lewis (1995). For anestimation of welfare gains from risk sharing, see van Wincoop (1994) for OECD countries, andSørensen and Yosha (1997) for U.S. states; see also Obstfeld (1994a) and Tesar (1995).
14Obstfeld presents the results of regressions where world consumption includes and does not includecountry i’s consumption, and of regressions with and without regressors controlling for country specificshocks.

B.E. Sørensen, O. Yosha / Journal of International Economics 45 (1998) 211 –238 219
Even if full risk sharing is rejected it is important to quantify the extent to whichrisk is shared within a group of economic agents, countries in our case. It is alsointeresting to identify the exact channels through which risk is shared, and toquantify the amount of risk sharing obtained via each channel. Asdrubali et al.(1996) developed a method for answering these questions. The method takes Eq.(6) as a benchmark, and quantifies the deviation from this benchmark, interpretingthe deviation as the amount of risk that is not shared. We turn to a presentation ofthe conceptual framework and the method of measuring deviations from the fullrisk sharing allocation.
2.4. Channels of income insurance and consumption smoothing
There are several mechanisms for sharing risk among countries. The citizens orthe government of a country can own claims to output produced in other countries.For example, if mutual funds or pension funds in one country invest international-ly, the income of the citizens in that country will comove with the output in othercountries. If financial intermediaries in one country lend to firms in othercountries, the flow of interest payments smoothes the income of citizens in thelending country. This form of international risk sharing, namely, income insurancethrough cross-border ownership of productive assets, is reflected in the NationalAccounts data as the difference between GDP and GNP. The difference betweenthe GNP and GDP of a country is precisely the net flow of factor income to that
15country.If risk is fully shared at this level then GNP will satisfy Eq. (6):
i i wGNP 5 k c (9)t t
and, therefore, also Eq. (7), namely, the consumers in each country will want toconsume their GNP.
If risk is not fully shared through factor income flows, GNP does not satisfy Eq.(6) and there may be scope for further consumption smoothing through savingbehavior. Such consumption smoothing through saving is governed entirely byintertemporal considerations. If the shocks to GDP that are not smoothed throughinternational factor income flows are highly persistent, individuals will optimallychoose to engage in very little consumption smoothing through saving. In otherwords, although GNP does not satisfy Eq. (6), it may closely satisfy Eq. (7). If theshocks to GDP that are not smoothed through international factor income flows aretransitory, individuals will optimally choose to engage in much consumptionsmoothing through saving.
Baxter and Crucini’s (1995) insight is relevant here. If, for some reason, there is
15See, e.g., Atkeson and Bayoumi (1993).
220 B.E. Sørensen, O. Yosha / Journal of International Economics 45 (1998) 211 –238
no income insurance through factor income flows, and if there is a riskless assetthat can be traded then, if shocks to GDP are transitory, Eq. (6) will be closelyapproximated. That is, when shocks to GDP are transitory, a riskless bond (thecredit market) is a close substitute for income insurance (i.e. for capital markets).In contrast, if shocks to GDP are highly persistent, consumption smoothingthrough trade in a riskless bond will not approximate the allocation in Eq. (6),namely, the credit market will not closely mimic the role of capital markets–shocks that were not insured ex-ante on capital markets will not be smoothedex-post on credit markets.
The variance decomposition described below allows us to measure the fractionof shocks to GDP that are smoothed through international factor income flows,through saving, and the fraction of shocks that are not smoothed, namely, theresidual deviation of the international consumption allocation from Eq. (6), the fullrisk sharing benchmark.
2.5. Decomposing the cross-sectional variance of shocks to GDP
In the empirical implementation, we measure the fraction of shocks to GDPabsorbed at two additional levels which, for conciseness, were not describedabove. If risk is not fully shared through factor income flows, reflected in theNational Accounts data as the difference between GDP and GNP, then furtherincome insurance (or income smoothing–we use these terms interchangeably) canbe achieved through international transfers if the net transfers to a country arelarger during (country specific) recessions. The EC structural funds are an exampleof an international tax-transfer system that may contribute to risk sharing, althoughit is worth emphasizing that the motivation for having a tax-transfer system mayhave nothing to do with risk sharing. In the National Accounts, the differencebetween National Income (NI) and Disposable National Income (DNI) measures
16international net transfers.Patterns of capital depreciation may also contribute to cross-country income
smoothing. In the National Accounts data, depreciation is responsible for thediscrepancy between GNP and NI. Depreciation is calculated according to fixedaccounting rules. Therefore, since the capital-output ratio is typically countercycli-cal, the officially calculated depreciation will constitute a larger fraction of outputin recessions and a smaller fraction in booms, resulting in cross-sectional dis-
16We adopt the National Accounting concepts used in the OECD National Accounts publications thatdiffer slightly from those used in the United States Statistical Abstract. For example, the Abstractdefines Net National Income as Net National Product minus indirect taxes plus subsidies, whereasaccording to OECD conventions, Disposable National Income is obtained from National Income byadding and subtracting only international taxes and transfers.
B.E. Sørensen, O. Yosha / Journal of International Economics 45 (1998) 211 –238 221
17smoothing. Finally, consumption smoothing through saving is manifested in theNational Accounts data as the difference between DNI and total (private plusgovernment) consumption, C1G.
We turn to the cross-sectional variance decomposition of shocks to GDP.Consider the identity, holding for any period t,
i i i iGDP GNP NI DNIi i i]]]]]]]]]GDP 5 (C 1 G ) , (10)i i i i iGNP NI DNI C 1 G
where all the magnitudes are in per capita terms, and i is an index of countries. Tostress the cross-sectional nature of our derivation, we suppress the time index. Thenational accounting identities that are relevant here are: GNP5GDP1net factorincome, NI5GNP2capital depreciation, DNI5NI1international transfers, C1
G5DNI2net saving.Now take logs and differences on both sides of Eq. (10), multiply both sides by
iD log GDP (minus its mean), and take the cross-sectional average, obtaining thevariance decomposition
i i i ivarhD log GDP j 5 covhD log GDP 2 D log GNP , D log GDP j
i i i1 covhD log GNP 2 D log NI , D log GDP j
i i i1 covhD log NI 2 log DNI , D log GDP j
i i i i1 covhD log DNI 2 D log (C 1 G ), D log GDP j
i i i1 covhD log(C 1 G ), D log GDP j
N i 2¯In this equation ‘varhXj’ and ‘covhX,Yj’ denote the statistics 1 /N o (X 2 X )i51N i i¯ ¯and 1/N o (X 2 X )(Y 2 Y ), respectively, where N is the number of countriesi51
iin the sample. Dividing by varhD log GDP j we get
1 5 b 1 b 1 b 1 b 1 b (11)f d t s u
where, for example,
i i icovhD log GDP 2 D log GNP , D log GDP j]]]]]]]]]]]]b 5 (12)f ivarhD log GDP j
17Real capital depreciation may be affected by economic conditions. For example, capital maydepreciate faster during booms because it is utilized more intensely. Such effects are typically notreflected in the National Accounts data. Conceptually, the budget constraint in Eq. (1) is betterformulated in terms of Net Domestic Product. We decompose shocks to Gross Domestic Product sincethe literature (e.g., Backus et al. (1992)) uses GDP as the variable measuring ‘output’.
222 B.E. Sørensen, O. Yosha / Journal of International Economics 45 (1998) 211 –238
is the ordinary least squares estimate of the slope in the cross-sectional regressioni i iof D log GDP 2D log GNP on D log GDP , and similarly for b , b , and b . Thed t s
last coefficient in the decomposition is given by:
i i icovhD log(C 1 G ), D log GDP j]]]]]]]]]b 5 (13)u ivarhD log GDP j
which is the ordinary least squares estimate of the slope in the cross-sectionali i iregression D log (C 1G ) on D log GDP .
We turn to the predictions of the theory regarding the signs and magnitudes ofthese coefficients. If there is full risk sharing, that is, if Eq. (6) holds, then covhD
i i ilog (C 1G ), D log GDP j50, and hence b 50. If full risk sharing is notu
achieved, then consumption in country i varies positively with idiosyncratic shocksto country i’s output, and b .0. A cross-sectional regression of consumption onu
output, controlling for fluctuations in world consumption is, therefore, a test of full18risk sharing.
If full risk sharing is achieved through income insurance via factor incomei iflows, GNP will satisfy Eq. (6). Then covhD log GNP , D log GDP j50 and
i i i ihence, covhD log GDP 2D log GNP , D log GDP j5varhD log GDP j, implying19
b 51.f
Suppose that full risk sharing is not achieved through income insurance viafactor income flows and capital depreciation, but is achieved through thecombination of factor income flows, depreciation, and international transfers. ThenDNI will satisfy Eq. (6) and, by analogous reasoning, b 1b 1b 51, and sincef d t
consumers in each country will consume their DNI, b 50. Similarly, if the fullu
risk sharing allocation is achieved through factor income flows, depreciation,international transfers, and saving, C1G will satisfy Eq. (6). Then, by analogousreasoning, b 1b 1b 1b 51 and b 50.f d t s u
We interpret b as the fraction of shocks to GDP that is not smoothed. Theu
coefficients b , b , b , and b are interpreted as the fraction of shocks absorbedf d t s
through factor income flows, depreciation, international transfers, and saving,respectively. If consumption satisfies Eq. (6), they sum to unity and b 50. If not,u
they sum to less than unity. In either case, they reflect the incremental amount ofsmoothing achieved through the various channels discussed above.
We stress that b does not measure the extent to which countries smooths
consumption optimally via saving. It measures the incremental fraction of shocks
18This is precisely the test suggested by Mace (1991) and Townsend (1994). They test for full risksharing by running cross-sectional (or panel) regressions of consumption on income, controlling foraggregate movements in income and consumption. Cochrane’s (1991) test is very similar.
19If full risk sharing is not achieved through income insurance via factor income flows, then covhDi i i i i ilog GNP , D log GDP j.0 and hence, covhD log GDP 2D log GNP , D log GDP j,varhD log GDP j,
implying b ,1.f

B.E. Sørensen, O. Yosha / Journal of International Economics 45 (1998) 211 –238 223
to GDP smoothed via savings. Nor does b .0 indicate that, given the uninsuredu
shocks to income, consumption is not intertemporally smoothed optimally. Rather,it measures the deviation of international consumption patterns from the full risksharing allocation.
We conclude this subsection with two remarks. First, it should be stressed thatthe cross-sectional smoothing of shocks to GDP may involve cross-border flows offunds as in the case of factor income flows and international transfers, or it maynot, as in the case of domestic investment or capital depreciation. Our method ofmeasuring the amount of smoothing achieved at various levels allows us to do soin a consistent manner for income smoothing as well as consumption smoothingregardless of whether there is actual cross-border flow of funds. The effectivenessof both income smoothing and consumption smoothing are measured against thefull risk sharing allocation in Eq. (6). This is the relevant benchmark in terms ofwelfare, an issue we do not directly address in this paper but which constitutes theunderlying motivation for studying patterns of international risk sharing in the firstplace.
Second, notice that our method does not impose any restrictions on the sign ofthe b-coefficients. If a country that is hit by a positive shock has a smaller share ofGDP allocated to, e.g., capital consumption, then depreciation provides cross-sectional dis-smoothing. Similarly, if (international) taxes increase or decrease lessthan proportionately with output, they provide dis-smoothing.
2.6. Consumption smoothing via saving: a closer look
Once National Income is decomposed into consumption and saving, totalsmoothing via saving can be further decomposed into smoothing via each of threecomponents, personal, corporate, and government saving. This decomposition canshed light on institutional barriers to consumption smoothing. For example, theability of national governments to smooth consumption by running budget deficitsmay be limited by law, as is the case for state governments in the United States(Poterba, 1994; Bohn and Inman, 1996). The 1992 Maastricht requirementsregarding government debt suggest that similar restrictions are likely to beimposed in a future EMU. This will shift the burden of smoothing consumptionfrom the national governments to the private sector (capital and credit markets) or
20to the EC budget.The corporate sector may contribute to income insurance if it adjusts patterns of
earnings retention so that a larger share of profits is distributed to shareholders21during recessions. Of course, if shareholders can ‘see through the corporate veil,’
20See however footnote 4.21This is consistent with the standard textbook view that corporations smooth dividend payout ratios,
adjusting them only in response to shifts in long-run sustainable earnings; see, e.g., Brealey and Myers(1991), Chapter 16.
224 B.E. Sørensen, O. Yosha / Journal of International Economics 45 (1998) 211 –238
then changes in corporate saving may be offset by corresponding changes in thesaving of shareholders (Poterba, 1991).
Individuals can smooth consumption through personal saving by borrowing andlending internationally or within their own country (provided, of course, that theywant to smooth uninsured output shocks). The ability of individuals to smooththeir consumption through cross-country borrowing and lending depends onwhether the banking system, and credit markets in general, are sufficientlyintegrated internationally. For given international borrowing and lending, theaggregate amount of saving in a country must be reflected in the country’sinvestment level.
The extent to which such consumption smoothing is possible in a closedeconomy is limited. If many individuals attempt to increase their saving, theinterest rate will fall reducing the incentive to save (Christiano, 1987). By contrast,if international credit markets are integrated, then, when individuals in one countryincrease savings, funds will be channeled to other countries.
The amount of consumption smoothing achieved through saving can also bedecomposed according to the final uses of the amount saved, namely, domesticinvestment and net exports: S5I1(X2M). If higher saving in a country in aparticular year is mainly reflected in higher investment in that country in the sameyear, this would indicate that international trade patterns do not respond stronglyto shocks and, therefore, do not contribute to cross-country consumption smooth-ing.
3. Estimation
At the practical level, the following (panel) equations are estimated:
i i i iD log GDP 2 D log GNP 5 n 1 b D log GDP 1 et t f,t f t f,t
i i i iD log GNP 2 D log NI 5 n 1 b D log GDP 1 et t d,t d t d,t
i i i iD log NI 2 D log DNI 5 n 1 b D log GDP 1 e , (14)t t t,t t t t,t
i i i i iD log DNI 2 D log(C 1 G ) 5 n 1 b D log GDP 1 et t t s,t s t s,t
i i i iD log(C 1 G ) 5 n 1 b D log GDP 1 et t u,t u t u,t
where n are time fixed effects. The inclusion of time fixed effects is crucial, since?,t
they capture year specific impacts on growth rates, most notably the impact of thegrowth in aggregate EC (or OECD) output. Furthermore, with time fixed effectsthe b-coefficients are weighted averages of the year by year cross-sectional
B.E. Sørensen, O. Yosha / Journal of International Economics 45 (1998) 211 –238 225
22regressions. To take into account autocorrelation in the residuals we assume thatthe error terms in each equation and in each country follow an AR(1) process.Since the samples are short, we assume that the autocorrelation parameter isidentical across countries and equations. We further allow for state specificvariances of the error terms. In practice, we estimate the system in Eq. (14) by atwo step Generalized Least Squares (GLS) procedure. Unless we explicitly say
23otherwise, we use differenced data at the yearly frequency. Notice that since ourmethod is based on panel estimation with time fixed effects, it yields fullyconsistent estimates even if there are worldwide taste shocks.
4. Results
The data are from OECD National Accounts, Main Aggregates (Volume I) andDetailed Tables (Volume II), various issues, covering the period 1966–96.Although the data through at least 1992 are reliable (do not incorporateprojections), we focus on the period 1966–90 to avoid complications arising from
24the unification of Germany. The OECD countries in our sample consist of all1996 members except Luxembourg and Mexico. Due to data availability, we usetwo subsets of the EC members and two subsets of the OECD members in thevarious regressions. EC8 denotes the EC members with the exception of Greece,Portugal, Spain, Sweden, Finland, and Austria that have only recently joined the
25EC, and Luxembourg which is very small and atypical. EC6 denotes thecountries in EC8 less the Netherlands and Ireland. OECD denotes all 1996members of the OECD except Luxembourg and Mexico, while OECD* denotes a
26more restricted set of 13 countries.We begin by presenting our estimates of the fraction of shocks to GDP absorbed
at the various levels of smoothing for EC and OECD countries. We then comparethe results to those of Asdrubali et al. (1996) who estimated the amount of incomeand consumption smoothing achieved among U.S. states. Next, we contrast ourresults with those obtained through comparison of country correlations of output,income, and consumption along the lines of, e.g., Backus et al. (1992). We briefly
22See Asdrubali et al. (1996), footnote 5, for an explicit formula.23To ensure that our results are robust, we estimate the main regressions using Hodrick-Prescott
filtered data, obtaining very similar results.24It would, of course, be interesting to study the patterns of income and consumption smoothing in
the 90s with unified Germany replacing Germany in the sample, but for the moment the 90s sample istoo short for such a study.
25EC8 includes Belgium, Denmark, France, Germany, Ireland, Italy, the Netherlands, and UnitedKingdom. Greece joined the EC in 1981, Portugal and Spain in 1985, whereas Sweden, Finland, andAustria joined in 1995.
26OECD* includes Austria, Belgium, Denmark, Finland, France, Germany, Italy, Sweden, UnitedKingdom, United States, Japan, Australia, and Canada.
226 B.E. Sørensen, O. Yosha / Journal of International Economics 45 (1998) 211 –238
discuss methodological differences between these two approaches to measuringrisk sharing, stressing the similarities and providing potential explanations for thediscrepancies. We conclude Section 4 by presenting estimates of consumptionsmoothing via subcomponents of saving.
4.1. Income insurance and consumption smoothing among EC and OECDcountries
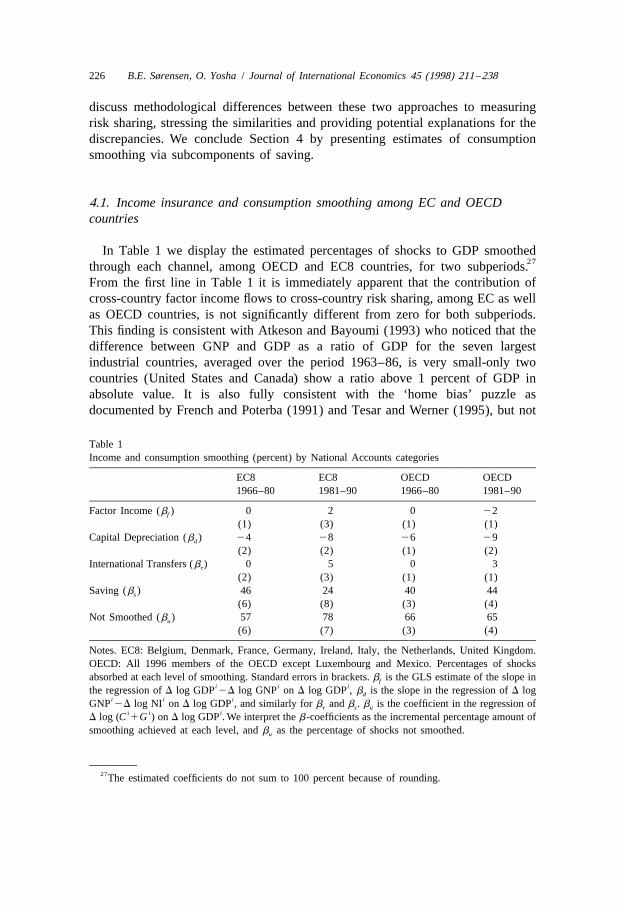
In Table 1 we display the estimated percentages of shocks to GDP smoothed27through each channel, among OECD and EC8 countries, for two subperiods.
From the first line in Table 1 it is immediately apparent that the contribution ofcross-country factor income flows to cross-country risk sharing, among EC as wellas OECD countries, is not significantly different from zero for both subperiods.This finding is consistent with Atkeson and Bayoumi (1993) who noticed that thedifference between GNP and GDP as a ratio of GDP for the seven largestindustrial countries, averaged over the period 1963–86, is very small-only twocountries (United States and Canada) show a ratio above 1 percent of GDP inabsolute value. It is also fully consistent with the ‘home bias’ puzzle asdocumented by French and Poterba (1991) and Tesar and Werner (1995), but not
Table 1Income and consumption smoothing (percent) by National Accounts categories
EC8 EC8 OECD OECD1966–80 1981–90 1966–80 1981–90
Factor Income (b ) 0 2 0 22f
(1) (3) (1) (1)Capital Depreciation (b ) 24 28 26 29d
(2) (2) (1) (2)International Transfers (b ) 0 5 0 3t
(2) (3) (1) (1)Saving (b ) 46 24 40 44s
(6) (8) (3) (4)Not Smoothed (b ) 57 78 66 65u
(6) (7) (3) (4)
Notes. EC8: Belgium, Denmark, France, Germany, Ireland, Italy, the Netherlands, United Kingdom.OECD: All 1996 members of the OECD except Luxembourg and Mexico. Percentages of shocksabsorbed at each level of smoothing. Standard errors in brackets. b is the GLS estimate of the slope inf
i i ithe regression of D log GDP 2D log GNP on D log GDP , b is the slope in the regression of D logdi i iGNP 2D log NI on D log GDP , and similarly for b and b . b is the coefficient in the regression oft s u
i i iD log (C 1G ) on D log GDP . We interpret the b-coefficients as the incremental percentage amount ofsmoothing achieved at each level, and b as the percentage of shocks not smoothed.u
27The estimated coefficients do not sum to 100 percent because of rounding.
B.E. Sørensen, O. Yosha / Journal of International Economics 45 (1998) 211 –238 227
with Obstfeld’s (1994b) conclusion of increased international capital marketintegration during the 70s and 80s in comparison to previous decades.
The fourth line in Table 1 indicates that the bulk of the consumption smoothingof EC as well as of OECD countries is achieved via saving. Such smoothing neednot involve actual cross-border flows of funds. Suppose that saving in eachcountry simply responds to country specific shocks, with higher saving in boomsand lower saving in recessions and no international lending and borrowing. Thecross-sectional variance decomposition would then measure the contribution ofwithin country saving patterns to the reduction of the cross-sectional variance ofconsumption with respect to the cross-sectional variance of Disposable NationalIncome. Further, our methodology allows us to express this reduction in thecross-sectional variance in a way that is consistent with the measurement ofincome smoothing via actual factor income flows, namely, as a fraction of shocksto GDP smoothed. For example, the number in the first column, fourth line ofTable 1 means that, on average, 46 percent of shocks to the GDP of the EC8countries during the period 1966–80 were smoothed via saving.
Although consumption smoothing through this channel need not involve actualcross-border flows of funds, it very well may involve such flows, since aggregateconsumption smoothing via saving is more difficult in a closed economy. If manyindividuals or corporations within a country attempt to increase saving in aparticular year, bond prices will rise (i.e. the real interest rate will fall) reducingthe incentive to save. By contrast, if international credit markets are integratedinternationally, savings will be channeled to countries where the supply of fundshas fallen. This, of course, is a reflection of the fact that aggregate saving is equalto net investment plus net exports. We investigate the relative importance of thesechannels later.
For OECD countries, consumption smoothing via saving amounted to about 40percent of shocks to GDP in both subperiods. The point estimates are 40 percentfor 1966–80 and 44 percent for 1981–90. For the EC8 group, the point estimates
28for these subperiods are 46 and 24 percent. The decline in the amount smoothedvia saving among the EC8 countries during the 80s may have to do with the worldwide increase in real interest rates, although this interpretation is not entirelyconvincing in light of the stability across subperiods of the fraction of shockssmoothed via saving among the OECD group. As can be seen in the last line ofTable 1, the decline in consumption smoothing via saving among the EC8countries is fully reflected in the increase in the fraction of shocks not smoothed inthe later time period.
The third line of Table 1 indicates that international transfers, which include
28For each row in Table 1 we tested if the coefficients were similar across sub-periods using anF-test. For the OECD we found no significant differences across subperiods, while for the EC thedifference in saving is significant at the 5 percent level, and depreciation and the overall amount notsmoothed are significantly different at the 10 percent level.
228 B.E. Sørensen, O. Yosha / Journal of International Economics 45 (1998) 211 –238
contributions to international institutions and foreign aid, provide very littleincome smoothing for OECD countries suggesting that, on average, such transfersconstitute a fixed fraction of GDP. We return to this issue later when we discuss theresults in Table 2.
The results for EC and OECD countries displayed in Table 1 are not directlycomparable with those in Asdrubali et al. (1996) for U.S. states. Country level dataare richer than U.S. state level data; for example, there are no GNP estimates forU.S. states, so Asdrubali et al. could not estimate interstate income smoothing viafactor income flows. The level of smoothing denoted ‘capital market smoothing’ intheir work on U.S. states includes the fraction of shocks to GDP smoothed throughfactor income flows, depreciation of capital, and corporate saving (retainedearnings); income smoothing through the US federal tax-transfer and grant systemis directly comparable with income smoothing via international transfers; andconsumption smoothing on asset and credit markets among U.S. states correspondsto smoothing via personal and government saving.
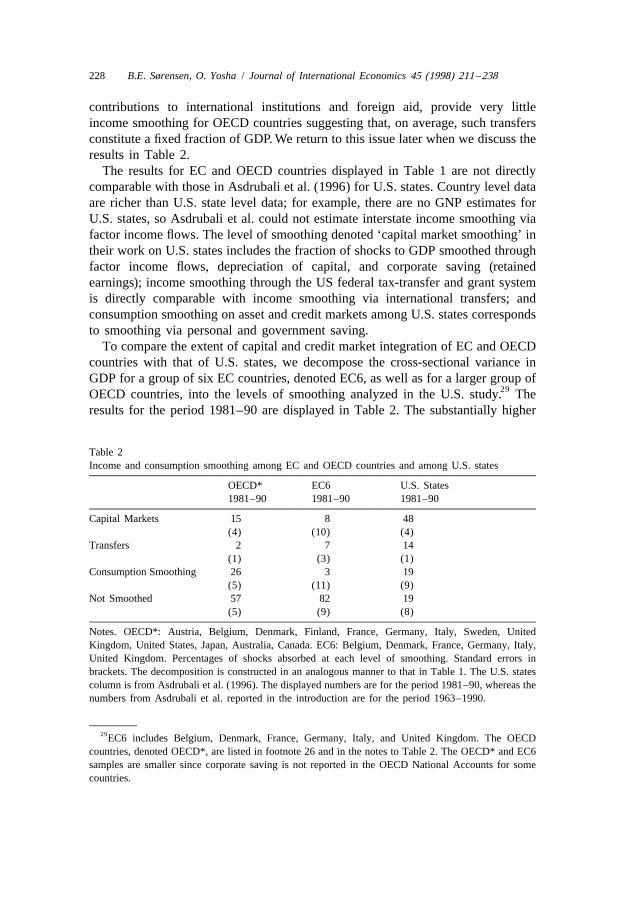
To compare the extent of capital and credit market integration of EC and OECDcountries with that of U.S. states, we decompose the cross-sectional variance inGDP for a group of six EC countries, denoted EC6, as well as for a larger group of
29OECD countries, into the levels of smoothing analyzed in the U.S. study. Theresults for the period 1981–90 are displayed in Table 2. The substantially higher
Table 2Income and consumption smoothing among EC and OECD countries and among U.S. states
OECD* EC6 U.S. States1981–90 1981–90 1981–90
Capital Markets 15 8 48(4) (10) (4)
Transfers 2 7 14(1) (3) (1)
Consumption Smoothing 26 3 19(5) (11) (9)
Not Smoothed 57 82 19(5) (9) (8)
Notes. OECD*: Austria, Belgium, Denmark, Finland, France, Germany, Italy, Sweden, UnitedKingdom, United States, Japan, Australia, Canada. EC6: Belgium, Denmark, France, Germany, Italy,United Kingdom. Percentages of shocks absorbed at each level of smoothing. Standard errors inbrackets. The decomposition is constructed in an analogous manner to that in Table 1. The U.S. statescolumn is from Asdrubali et al. (1996). The displayed numbers are for the period 1981–90, whereas thenumbers from Asdrubali et al. reported in the introduction are for the period 1963–1990.
29EC6 includes Belgium, Denmark, France, Germany, Italy, and United Kingdom. The OECDcountries, denoted OECD*, are listed in footnote 26 and in the notes to Table 2. The OECD* and EC6samples are smaller since corporate saving is not reported in the OECD National Accounts for somecountries.
B.E. Sørensen, O. Yosha / Journal of International Economics 45 (1998) 211 –238 229
fraction of shocks to GDP smoothed via capital markets in the US is immediatelyapparent. The amount of consumption smoothing through saving is similar forOECD countries and U.S. states. The total amount left not smoothed among theOECD, and especially the EC6 countries, is considerably larger than the amountnot smoothed among U.S. states.
We performed the analysis for the 70s obtaining similar estimates, in particularfor the total amount of smoothing via saving as well as through the various
30sub-components of saving. We have no evidence for or against the hypothesisthat various forms of saving are perfect substitutes. In particular, we cannot tell ifa potential decrease in consumption smoothing through government saving as aresult of the Maastricht deficit requirements will be offset by a correspondingincrease in smoothing via private saving.
The fraction of shocks to GDP smoothed via international transfers for the EC6countries during the period 1981–90 is 7 percent. Together with the 5 and 3percent smoothing estimated in the regressions in Table 1 for this time period, weobtain an order of magnitude for the amount of smoothing achieved through thischannel: 3 to 7 percent of shocks. This income smoothing incorporates theinsurance provided by transfers via the EC budget, e.g. the structural funds. Evenif we attribute all the smoothing to the EC budget, we see that the fraction ofshocks to per capita GDP smoothed through EC fiscal institutions is at most a halfof the fraction of shocks to the per capita gross state product smoothed by thefederal government in the United States. Further, actual EC budget data areavailable for 1976–86 from Eurostat Review, various issues (EC transfers toindividual countries are no longer disclosed since 1987). We estimated theequations using these data finding zero smoothing via the EC budget. Since thecoefficients are estimated quite imprecisely due to the shorter sample period, andsince the point estimates are overall very similar, we do not report the results.
The 15 percent capital market income smoothing for OECD countries in Table 2is not driven by factor income flows. We know this from the results displayed inthe first line of Table 1. Since we also know that depreciation of capitaldis-smoothes GDP, the 15 percent capital market smoothing must originate fromsmoothing via corporate saving.
4.2. OECD country versus U.S. state correlations of output, income, andconsumption
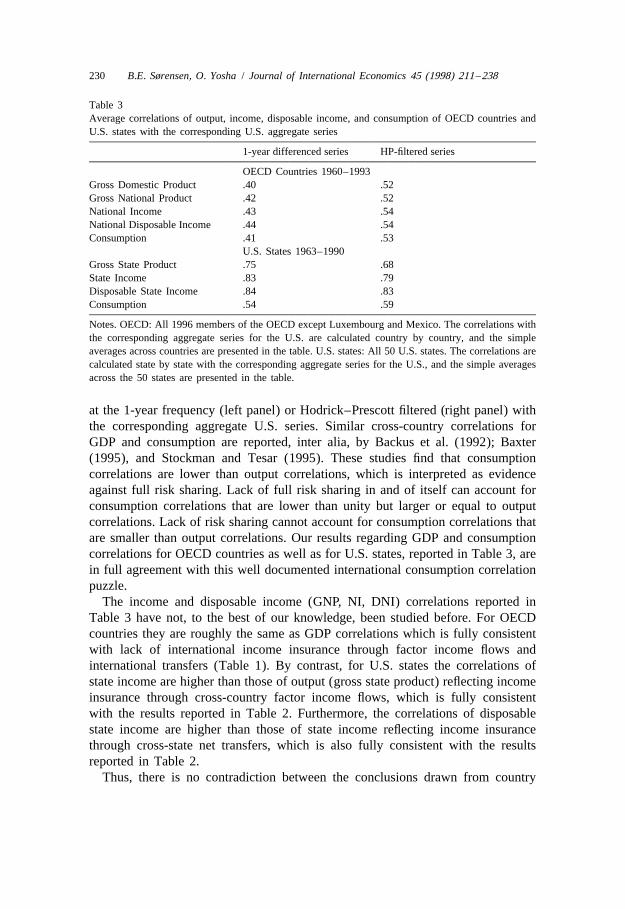
In Table 3 we compare average country correlations of output, income, andconsumption for OECD countries with the corresponding correlations for U.S.states. The correlations are calculated for the logarithm of each series, differenced
30Since the detailed OECD data for the 70s, on which these calculations are based, are not consistentwith those of the 80s and the sample of countries is different, we cannot directly compare the results,and do not report the estimates for the 70s.
230 B.E. Sørensen, O. Yosha / Journal of International Economics 45 (1998) 211 –238
Table 3Average correlations of output, income, disposable income, and consumption of OECD countries andU.S. states with the corresponding U.S. aggregate series
1-year differenced series HP-filtered series
OECD Countries 1960–1993Gross Domestic Product .40 .52Gross National Product .42 .52National Income .43 .54National Disposable Income .44 .54Consumption .41 .53
U.S. States 1963–1990Gross State Product .75 .68State Income .83 .79Disposable State Income .84 .83Consumption .54 .59
Notes. OECD: All 1996 members of the OECD except Luxembourg and Mexico. The correlations withthe corresponding aggregate series for the U.S. are calculated country by country, and the simpleaverages across countries are presented in the table. U.S. states: All 50 U.S. states. The correlations arecalculated state by state with the corresponding aggregate series for the U.S., and the simple averagesacross the 50 states are presented in the table.
at the 1-year frequency (left panel) or Hodrick–Prescott filtered (right panel) withthe corresponding aggregate U.S. series. Similar cross-country correlations forGDP and consumption are reported, inter alia, by Backus et al. (1992); Baxter(1995), and Stockman and Tesar (1995). These studies find that consumptioncorrelations are lower than output correlations, which is interpreted as evidenceagainst full risk sharing. Lack of full risk sharing in and of itself can account forconsumption correlations that are lower than unity but larger or equal to outputcorrelations. Lack of risk sharing cannot account for consumption correlations thatare smaller than output correlations. Our results regarding GDP and consumptioncorrelations for OECD countries as well as for U.S. states, reported in Table 3, arein full agreement with this well documented international consumption correlationpuzzle.
The income and disposable income (GNP, NI, DNI) correlations reported inTable 3 have not, to the best of our knowledge, been studied before. For OECDcountries they are roughly the same as GDP correlations which is fully consistentwith lack of international income insurance through factor income flows andinternational transfers (Table 1). By contrast, for U.S. states the correlations ofstate income are higher than those of output (gross state product) reflecting incomeinsurance through cross-country factor income flows, which is fully consistentwith the results reported in Table 2. Furthermore, the correlations of disposablestate income are higher than those of state income reflecting income insurancethrough cross-state net transfers, which is also fully consistent with the resultsreported in Table 2.
Thus, there is no contradiction between the conclusions drawn from country
B.E. Sørensen, O. Yosha / Journal of International Economics 45 (1998) 211 –238 231
correlations and from the cross-sectional variance decomposition regarding incomeinsurance via factor income flows and via international transfers (although thecross-sectional method enables us to estimate the fraction of shocks to GDPabsorbed through each channel).
What needs to be explained is the discrepancy between the methods regardingthe amount of consumption smoothing. Although country consumption correla-tions are lower than output correlations, which is not consistent with risk sharingin the absence of taste shocks, the cross-sectional variance decomposition yieldsestimates of considerable consumption smoothing via saving (as well as consider-able overall income insurance and consumption smoothing) both for OECDcountries and U.S. states. We endorse the explanation suggested by Stockman andTesar (1995) who show that low country consumption correlations can berationalized by a model with substantial risk sharing, even with full risk sharing,
iwhen countries are subject to idiosyncratic taste shocks. If Eq. (8) holds and the u t
shocks are sufficiently large and independent, country consumption correlationscan be very small even though there is full risk sharing.
The cross-sectional variance decomposition is immune to such idiosyncratictaste shocks since it involves regressing changes in log-consumption on changes inlog-output. Since it is the left hand side variable that is subject to taste shocks, theregression coefficients, b or b according to the case, are not biased. Only theirs u
standard errors are larger due to the taste shocks, as can be seen in Tables 1 and 2.We therefore, believe that our findings regarding substantial consumption smooth-ing among EC and OECD countries, as well as among U.S. states, are sound, andthat our method for obtaining them is particularly useful since consumption isindeed likely to be subject to taste shocks.
4.3. Consumption smoothing via subcomponents of national saving
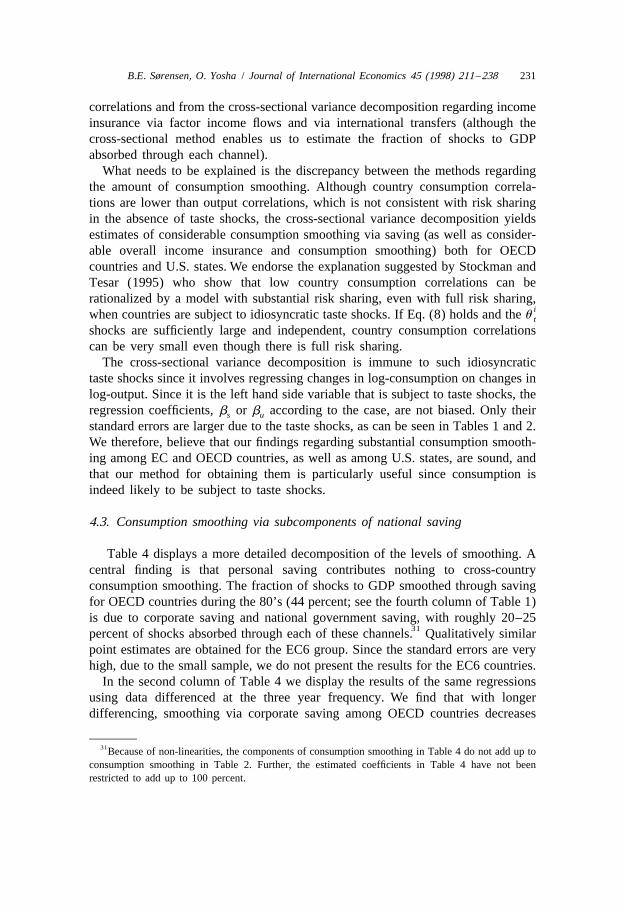
Table 4 displays a more detailed decomposition of the levels of smoothing. Acentral finding is that personal saving contributes nothing to cross-countryconsumption smoothing. The fraction of shocks to GDP smoothed through savingfor OECD countries during the 80’s (44 percent; see the fourth column of Table 1)is due to corporate saving and national government saving, with roughly 20–25
31percent of shocks absorbed through each of these channels. Qualitatively similarpoint estimates are obtained for the EC6 group. Since the standard errors are veryhigh, due to the small sample, we do not present the results for the EC6 countries.
In the second column of Table 4 we display the results of the same regressionsusing data differenced at the three year frequency. We find that with longerdifferencing, smoothing via corporate saving among OECD countries decreases
31Because of non-linearities, the components of consumption smoothing in Table 4 do not add up toconsumption smoothing in Table 2. Further, the estimated coefficients in Table 4 have not beenrestricted to add up to 100 percent.
232 B.E. Sørensen, O. Yosha / Journal of International Economics 45 (1998) 211 –238
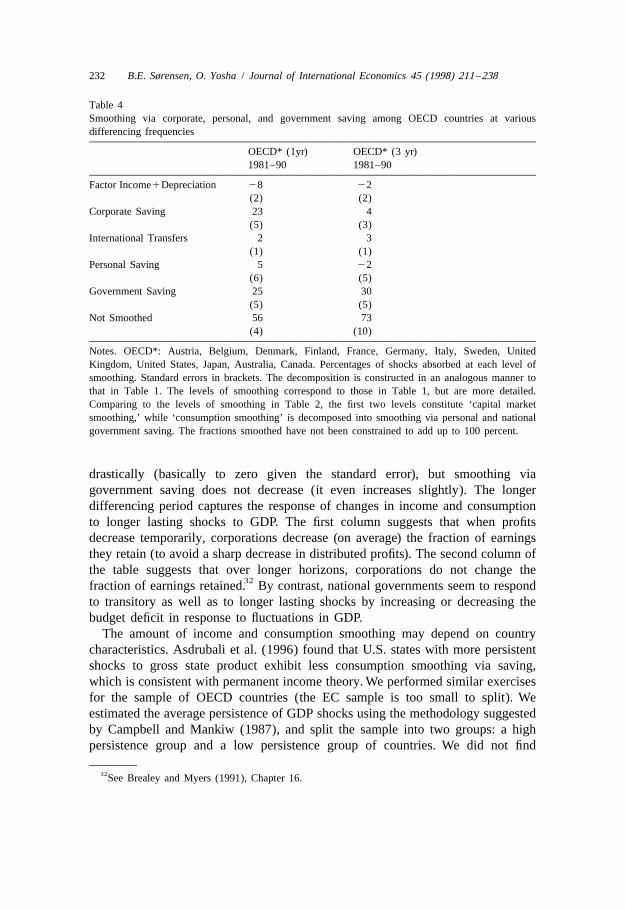
Table 4Smoothing via corporate, personal, and government saving among OECD countries at variousdifferencing frequencies
OECD* (1yr) OECD* (3 yr)1981–90 1981–90
Factor Income1Depreciation 28 22(2) (2)
Corporate Saving 23 4(5) (3)
International Transfers 2 3(1) (1)
Personal Saving 5 22(6) (5)
Government Saving 25 30(5) (5)
Not Smoothed 56 73(4) (10)
Notes. OECD*: Austria, Belgium, Denmark, Finland, France, Germany, Italy, Sweden, UnitedKingdom, United States, Japan, Australia, Canada. Percentages of shocks absorbed at each level ofsmoothing. Standard errors in brackets. The decomposition is constructed in an analogous manner tothat in Table 1. The levels of smoothing correspond to those in Table 1, but are more detailed.Comparing to the levels of smoothing in Table 2, the first two levels constitute ‘capital marketsmoothing,’ while ‘consumption smoothing’ is decomposed into smoothing via personal and nationalgovernment saving. The fractions smoothed have not been constrained to add up to 100 percent.
drastically (basically to zero given the standard error), but smoothing viagovernment saving does not decrease (it even increases slightly). The longerdifferencing period captures the response of changes in income and consumptionto longer lasting shocks to GDP. The first column suggests that when profitsdecrease temporarily, corporations decrease (on average) the fraction of earningsthey retain (to avoid a sharp decrease in distributed profits). The second column ofthe table suggests that over longer horizons, corporations do not change the
32fraction of earnings retained. By contrast, national governments seem to respondto transitory as well as to longer lasting shocks by increasing or decreasing thebudget deficit in response to fluctuations in GDP.
The amount of income and consumption smoothing may depend on countrycharacteristics. Asdrubali et al. (1996) found that U.S. states with more persistentshocks to gross state product exhibit less consumption smoothing via saving,which is consistent with permanent income theory. We performed similar exercisesfor the sample of OECD countries (the EC sample is too small to split). Weestimated the average persistence of GDP shocks using the methodology suggestedby Campbell and Mankiw (1987), and split the sample into two groups: a highpersistence group and a low persistence group of countries. We did not find
32See Brealey and Myers (1991), Chapter 16.
B.E. Sørensen, O. Yosha / Journal of International Economics 45 (1998) 211 –238 233
significant differences in income and consumption smoothing patterns between33these two groups. We examined, in the same manner, if more open states (states
with high exports plus imports to GDP ratios) exhibit different patterns of risksharing, but again found no significant differences.
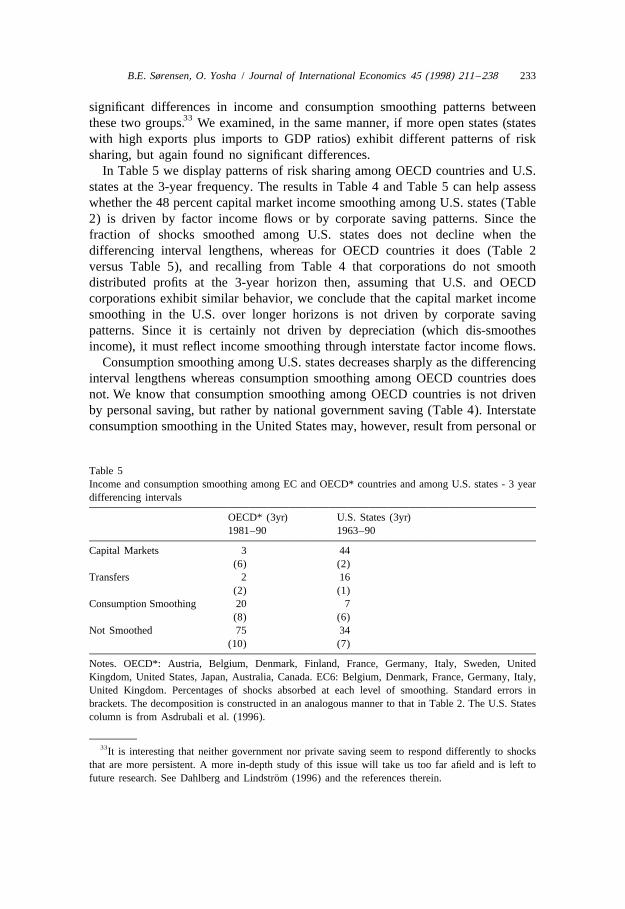
In Table 5 we display patterns of risk sharing among OECD countries and U.S.states at the 3-year frequency. The results in Table 4 and Table 5 can help assesswhether the 48 percent capital market income smoothing among U.S. states (Table2) is driven by factor income flows or by corporate saving patterns. Since thefraction of shocks smoothed among U.S. states does not decline when thedifferencing interval lengthens, whereas for OECD countries it does (Table 2versus Table 5), and recalling from Table 4 that corporations do not smoothdistributed profits at the 3-year horizon then, assuming that U.S. and OECDcorporations exhibit similar behavior, we conclude that the capital market incomesmoothing in the U.S. over longer horizons is not driven by corporate savingpatterns. Since it is certainly not driven by depreciation (which dis-smoothesincome), it must reflect income smoothing through interstate factor income flows.
Consumption smoothing among U.S. states decreases sharply as the differencinginterval lengthens whereas consumption smoothing among OECD countries doesnot. We know that consumption smoothing among OECD countries is not drivenby personal saving, but rather by national government saving (Table 4). Interstateconsumption smoothing in the United States may, however, result from personal or
Table 5Income and consumption smoothing among EC and OECD* countries and among U.S. states - 3 yeardifferencing intervals
OECD* (3yr) U.S. States (3yr)1981–90 1963–90
Capital Markets 3 44(6) (2)
Transfers 2 16(2) (1)
Consumption Smoothing 20 7(8) (6)
Not Smoothed 75 34(10) (7)
Notes. OECD*: Austria, Belgium, Denmark, Finland, France, Germany, Italy, Sweden, UnitedKingdom, United States, Japan, Australia, Canada. EC6: Belgium, Denmark, France, Germany, Italy,United Kingdom. Percentages of shocks absorbed at each level of smoothing. Standard errors inbrackets. The decomposition is constructed in an analogous manner to that in Table 2. The U.S. Statescolumn is from Asdrubali et al. (1996).
33It is interesting that neither government nor private saving seem to respond differently to shocksthat are more persistent. A more in-depth study of this issue will take us too far afield and is left to
¨future research. See Dahlberg and Lindstrom (1996) and the references therein.
234 B.E. Sørensen, O. Yosha / Journal of International Economics 45 (1998) 211 –238
state government saving. The results for 3-year differencing displayed in Table 5indicate that, unlike OECD national governments that, as we have seen, attempt tosmooth national consumption in response to transitory as well as longer lastingshocks, individuals and state governments in the United States do not, or cannot do
34so.As we stressed in the introduction, the large amount of consumption smoothing
achieved in the EC via government borrowing may not be sustainable in an EMUwhere fiscal coordination must be maintained. Until private capital and creditmarkets develop, there may be a need for a greater insurance role of ECinstitutions.
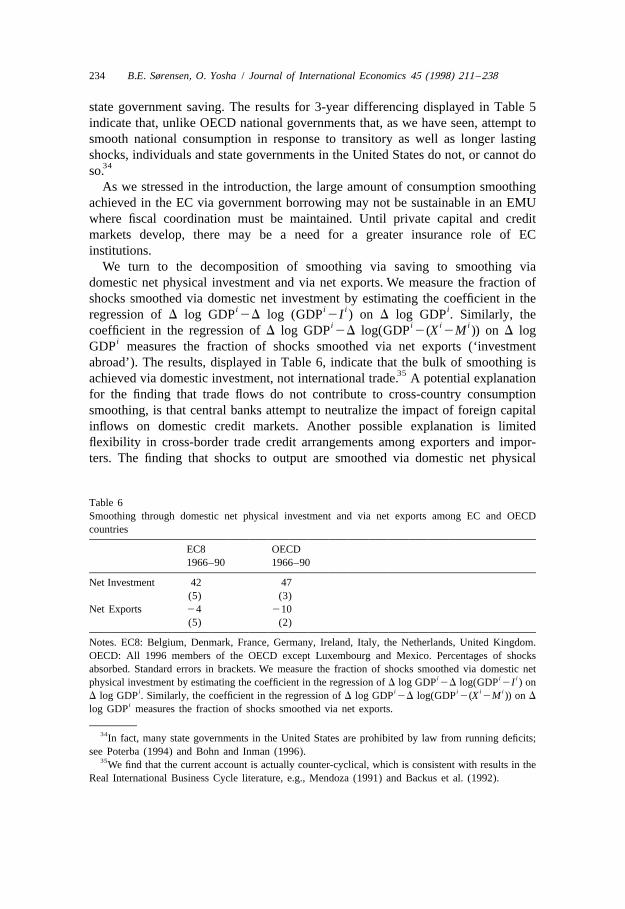
We turn to the decomposition of smoothing via saving to smoothing viadomestic net physical investment and via net exports. We measure the fraction ofshocks smoothed via domestic net investment by estimating the coefficient in the
i i i iregression of D log GDP 2D log (GDP 2I ) on D log GDP . Similarly, thei i i icoefficient in the regression of D log GDP 2D log(GDP 2(X 2M )) on D log
iGDP measures the fraction of shocks smoothed via net exports (‘investmentabroad’). The results, displayed in Table 6, indicate that the bulk of smoothing is
35achieved via domestic investment, not international trade. A potential explanationfor the finding that trade flows do not contribute to cross-country consumptionsmoothing, is that central banks attempt to neutralize the impact of foreign capitalinflows on domestic credit markets. Another possible explanation is limitedflexibility in cross-border trade credit arrangements among exporters and impor-ters. The finding that shocks to output are smoothed via domestic net physical
Table 6Smoothing through domestic net physical investment and via net exports among EC and OECDcountries
EC8 OECD1966–90 1966–90
Net Investment 42 47(5) (3)
Net Exports 24 210(5) (2)
Notes. EC8: Belgium, Denmark, France, Germany, Ireland, Italy, the Netherlands, United Kingdom.OECD: All 1996 members of the OECD except Luxembourg and Mexico. Percentages of shocksabsorbed. Standard errors in brackets. We measure the fraction of shocks smoothed via domestic net
i i iphysical investment by estimating the coefficient in the regression of D log GDP 2D log(GDP 2I ) oni i i i i
D log GDP . Similarly, the coefficient in the regression of D log GDP 2D log(GDP 2(X 2M )) on Dilog GDP measures the fraction of shocks smoothed via net exports.
34In fact, many state governments in the United States are prohibited by law from running deficits;see Poterba (1994) and Bohn and Inman (1996).
35We find that the current account is actually counter-cyclical, which is consistent with results in theReal International Business Cycle literature, e.g., Mendoza (1991) and Backus et al. (1992).
B.E. Sørensen, O. Yosha / Journal of International Economics 45 (1998) 211 –238 235
investment is consistent with the procyclical behavior of investment in aggregate36US data; see Blanchard and Fischer (1989), p.16.
5. Concluding remarks
We provided evidence that, for OECD as well as for EC countries, about 40percent of shocks to GDP are smoothed at the one year frequency, with about halfthe smoothing achieved through national government budget deficits and half bycorporate saving. At the three year differencing frequency only 25 percent ofshocks to GDP are smoothed, with all the smoothing achieved via governmentlending and borrowing. We further found that factor income flows do not smoothincome shocks among EC and OECD countries.
The general picture that emerges is that capital and credit markets in OECDcountries, unlike interstate markets in the United States, are not well integrated,since neither factor income flows nor cross-border flows of physical goodscontribute much to international risk sharing. An important implication is that therestrictions on budget deficits imposed by the Maastricht Treaty should be relaxed,allowing governments to run large deficits in response to output shocks, at leastuntil alternative risk sharing mechanisms develop.
International transfers, including EC structural funds, have in recent yearssmoothed about 5 percent of shocks to per capita GDP in the EC, compared to 13percent of shocks to the per capita gross state product smoothed by the federalgovernment in the United States. If the EC wishes to achieve, via its budget, adegree of intercountry insurance comparable to that of the United States, namely
36One important difference between U.S. states and OECD countries is, of course, that countries aresubject to real exchange rate fluctuations. In our empirical analysis we have deflated all the magnitudesby the country consumption deflator, measuring the output and consumption of each country in terms ofreal consumption in that country. Since Eichengreen (1994) reports that deviations from PPP amongEC countries can be quite large, we wanted to evaluate the potential effect of exchange rate fluctuations
i ion consumption. We regress, for the entire sample of OECD countries, D log c on D log GDP and Dt ti i i ilog PPP , where c and GDP are deflated using country i’s period t consumption deflator, and PPPt t t t
denotes the period t ratio of country i’s consumption deflator (measured in U.S. dollars) and the U.S.consumption deflator. The regression coefficients are interpreted as the elasticities of consumption withrespect to GDP and with respect to changes in the real exchange rate. The estimated elasticity ofconsumption with respect to changes in output is 0.62 and 0.73 at the one and three year differencingfrequencies. The estimated elasticity of consumption with respect to changes in the real exchange rate
2is 0.015 and 0.061 (all the elasticities are estimated very precisely). The partial R for the elasticitieswith respect to output are 0.80 and 0.89, and 0.01 and 0.04 for the elasticities with respect to theexchange rate. They represent the increment in the sum of squares explained by the variable, given thefraction of the sum of squares already explained by the other variable. We conclude that when thecurrency of a country appreciates in real (inflation adjusted) terms, although the citizens and thegovernment of that country can, in principle, purchase more goods at international prices with a givenamount of their country’s currency, they do so to a relatively small extent. Our measures of risk sharingare, therefore, not likely to be affected by deviations from PPP.
236 B.E. Sørensen, O. Yosha / Journal of International Economics 45 (1998) 211 –238
25 percent of shocks to GDP not smoothed, then the size of the budget has toincrease dramatically. The desirability and feasibility of greater insurance to ECmembers through an EC-wide tax-transfer system depends on the speed at whichprivate capital markets integrate, and on the ability of EC institutions to overcomepotential moral hazard problems such as misreporting on the part of membercountries. The design of risk sharing institutions is, however, beyond the scope ofthe present paper; see Persson and Tabellini (1996) for an analysis.
We have decomposed the smoothing via saving into smoothing via I and X2M,finding that all the smoothing is achieved through domestic net physical invest-ment with virtually no smoothing via net exports. Since international trade patternsdo not respond to shocks they do not contribute to cross-country risk sharing.Frankel and Rose (1996) argue that over longer horizons, trade among countriesincreases the correlation between their output. If EMU will indeed induce moretrade among EC countries, then shocks may gradually become less countryspecific. In light of the large amount of diversifiable regional risk in the UnitedStates (see Sørensen and Yosha (1997) for an empirical study) we should notexpect to see country specific risk in Europe totally disappear.
Acknowledgements
We thank Charles Goodhart for encouraging us to write this paper, LansBovenberg, Mario Crucini, Alex Cuikerman, Benjamin Eden, Philip Lane,Manfred Neumann, Hirofumi Uzawa, and seminar participants at Banca d’Italia,Boston, Brown, Cambridge, Dartmouth, Harvard, HEC, Mannheim, Oxford, andTel Aviv Universities, participants of a conference, held at Tel Aviv University, inhonor of Professor Robert Mundell, and participants of a conference held in Bonnand co-organized with NBER on Budgeting Institutions and Fiscal Performance-Perspectives for EMU, for helpful comments. We further thank four referees andAndy Rose for invaluable criticism and suggestions that greatly improved thequality and scope of the paper. Finally, we thank Assaf Razin for helpful advice.Sørensen acknowledges financial support from the Watson Institute, BrownUniversity and thanks Tel Aviv University for its hospitality. Both authorsgratefully acknowledge financial support through a Salomon Grant, BrownUniversity, a grant from the Armand Hammer Fund for Economic Cooperation inthe Middle East, and a United States National Science Foundation grant. Hyung-Kwon Chung and Sara Dawes provided excellent research assistance.
References
Altug, S., Miller, R.A., 1990. Household choices in equilibrium. Econometrica 58, 543–570.Asdrubali, P., Sørensen, B.E., Yosha, O., 1996. Channels of interstate risk sharing: United States
1963-90. Quarterly Journal of Economics 111, 1081–1110.
B.E. Sørensen, O. Yosha / Journal of International Economics 45 (1998) 211 –238 237
Atkeson, A., Bayoumi, T., 1993. Do private capital markets insure regional risk? Evidence from theUnited States and Europe. Open Economies Review 4, 303–324.
Backus, D., Kehoe, P., Kydland, F., 1992. International Real Business Cycles. Journal of PoliticalEconomy 100, 745–775.
Barro, R., Sala-i-Martin, X., 1991. Convergence across states and regions. Brookings Papers onEconomic Activity 1, 107–158.
Baxter, M., 1995. International trade and business cycles. In: Grossman, G., Rogoff, K. (Eds.),Handbook of International Economics. North Holland, Amsterdam.
Baxter, M., Crucini, M., 1993. Explaining saving-investment correlations, American Economic Review83, 416–436.
Baxter, M., Crucini, M., 1995. Business cycles and the asset structure of foreign trade. InternationalEconomic Review 36, 821–854.
Bayoumi, T., Klein, M., 1996. A provincial view of economic integration, mimeo, Tufts University.Bayoumi, T., Masson, P., 1995. Fiscal flows in the United States and Canada: Lessons for monetary
union in Europe. European Economic Review 39, 253–274.Bayoumi, T., Rose, A., 1993. Domestic savings and intra-national capital flows. European Economic
Review 37, 1197–1202.Blanchard, O., Fischer, S., 1989. Lectures on Macroeconomics. MIT Press, Cambridge.Bohn, H., Inman, R.P., 1996. Balanced-Budget Rules and Public Deficits: Evidence from the U.S.
States, Carnegie-Rochester Conference Series on Public Policy 45, 13–76.Brealey, R., Myers, S., 1991. Principles of Corporate Finance, fourth edition. McGraw-Hill, New York.Campbell, J., Mankiw, N.G., 1987. Are output fluctuations transitory?. Quarterly Journal of Economics
102, 857–880.Canova, F., Ravn, M., 1996. International consumption risk sharing. International Economic Review
37, 573–601.Christiano, L., 1987. Is consumption insufficiently sensitive to innovations in income?. American
Economic Review 77, 337–341.Cochrane, J.H., 1991. A simple test of consumption insurance. Journal of Political Economy 99,
957–976.Coval, J., 1996. International capital flows when investors have local information, mimeo, University of
Michigan.¨Dahlberg, M., Lindstrom, T., 1996. Are local governments governed by forward looking decision
makers? mimeo. Uppsala University, Sweden.Eichengreen, B., 1993. European monetary unification, Journal of Economic Literature 31, 1321–1357.Eichengreen, B., 1994. Is Europe an Optimum Currency Area? In: Borner, S., Grubel, H. (Eds.), The
European Community after 1992: Perspectives from the Outside. MacMillan, London.Eichengreen, B., von Hagen, J., 1995. Fiscal policy and monetary union: Federalism, fiscal restrictions,
and the no-bailout rule, CEPR Discussion Paper Series no. 1247.European Commission, 1977 Report of the Study Group on the Role of Public Finance in European
Integration, chaired by Sir Donald MacDougall.Feldstein, M., Horioka, C., 1980. Domestic savings and international capital flows. Economic Journal
90, 314–329.Frankel, J., Rose, A., 1996. The endogeneity of the Optimum Currency Area criteria, mimeo.
University of California, Berkeley.French, K., Poterba, J., 1991. International diversification and international equity markets. American
Economic Review 81, 222–226.Ghosh, A.R., 1995. International capital mobility amongst the major industrialised countries: Too little
or too much. Economic Journal 105, 107–128.Goodhart, C., Smith, S., 1993. Stabilization, European Economy, reports and studies 5, 419–455.Gordon, R., Bovenberg, L., 1996. Why is capital so immobile internationally? Possible explanations
and implications for capital income taxation. American Economic Review 86, 1057–1075.

238 B.E. Sørensen, O. Yosha / Journal of International Economics 45 (1998) 211 –238
Hayashi, F., Altonji, J., Kotlikoff, L., 1996. Risk sharing between and within families. Econometrica64, 261–294.
Inman, R., Rubinfeld, D., 1994. The EMU and fiscal policy in the new European Community: An issuefor economic federalism. International Review of Law and Economics 14, 147–161.
Leiderman, L., Razin, A. (Eds.), 1994. Capital Mobility: The Impact on Consumption, Investment, andGrowth. Cambridge University Press, New York.
Lewis, K., 1995. Puzzles in international financial markets. In: Grossman, G., Rogoff, K. (Eds.),Handbook of International Economics. North Holland, Amsterdam.
Lewis, K., 1996. What can explain the apparent lack of international consumption risk sharing?. Journalof Political Economy 104, 267–297.
Mace, B.J., 1991. Full insurance in the presence of aggregate uncertainty. Journal of Political Economy99, 928–956.
Mendoza, E., 1991. Real Business Cycles in a small open economy. American Economic Review 81,797–818.
Mundell, R., 1961. A theory of Optimum Currency Areas. American Economic Review 51, 657–665.Obstfeld, M., 1994. Evaluating risky consumption paths: The role of intertemporal substitutability.
European Economic Review 38, 1471–1486.Obstfeld, M., 1994. Are industrial-country consumption risks globally diversified? In: Leiderman, L.,
Razin, A. (Eds.), Capital Mobility: The Impact on Consumption, Investment, and Growth.Cambridge University Press, New York.
Obstfeld, M., Rogoff, K., 1996. Foundations of International Macroeconomics, MIT Press, Cambridge.Persson, T., Tabellini, G., 1996. Federal fiscal constitutions: Risk sharing and moral hazard.
Econometrica 64, 623–646.Phillips, K.L., 1996. The cyclical behavior of net exports: Temporary and persistent movements.
Review of International Economics 4, 79–89.Poterba, J., 1991. Dividends, capital gains, and the corporate veil: Evidence from Britain, Canada, and
the United States. In: Bernheim, D., Shoven, J.B. (Eds.), National Saving and EconomicPerformance. University of Chicago Press, Chicago.
Poterba, J., 1994. State responses to fiscal crises: The effects of budgetary institutions and politics.Journal of Political Economy 102, 798–821.
Sala-i-Martin, X., Sachs, J., 1992. Fiscal federalism and Optimum Currency Areas: Evidence forEurope from the United States. In: Canzoneri, M., Masson, P., Grilli, V., (Eds.), Establishing aCentral Bank: Issues in Europe and Lessons from the US. Cambridge University Press, London.
Sørensen, B.E., Yosha, O., 1997. Income and consumption smoothing among U.S. States: Regions orClubs?, Brown University Working Paper.
Stockman, A.C., Tesar, L., 1995. Tastes and technology in a two-country model of the business cycle:Explaining international comovements. American Economic Review 85, 168–185.
Tesar, L., 1995. Evaluating the gains from international risk sharing. Carnegie-Rochester ConferenceSeries on Public Policy 42, 95–143.
Tesar, L., Werner, I., 1995. Home bias and high turnover. Journal of International Money and Finance14, 467–492.
Townsend, R., 1994. Risk and insurance in village India. Econometrica 62, 539–591.van Wincoop, E., 1994. Welfare gains from international risk sharing. Journal of Monetary Economics
34, 175–200.von Hagen, J., 1992. Fiscal arrangements in a monetary union: Evidence from the US, in: Fair, D., de
Boissieu, C. (Eds.), Fiscal Policy, Taxation, and the Financial System in an Increasingly IntegratedEurope. Kluwer, Boston.
von Hagen, J., Hammond, G., 1994. Regional insurance against asymmetric shocks. An empirical studyfor the European Community, CEPR Working Paper.