International investors drive liquidity - Cushman & Wakefield · International investors drive...
17
Money into Property Global 2014 International investors drive liquidity DTZ Research 12 June 2014 Contents Introduction 2 Section 1 – Stock update 3 Section 2 – Market Sentiment 9 Section 3 – Volumes & Liquidity 12 Authors Kasia Sielewicz Manager Investor Research + 44 (0)20 3296 2322 [email protected] Nigel Almond Head of Strategy Research + 44 (0)20 3296 2328 [email protected] Hans Vrensen Global Head of Research + 44 (0)20 3296 2159 [email protected] Global invested stock set a new record level of USD12.9tn at year-end 2013, driven by improving sentiment and capital value recovery. This is up 4% from a year ago, with growth across all three regions. Globally, growth was led by 9% in Asia Pacific, followed by 3% in North America and 2% in Europe in USD terms. Stock growth was caused by equity growth of 9%, while debt posted a 3% increase. For the first time since the onset of the global financial crisis, growth was recorded across all four debt-equity and public-private quadrants. But, Europe continues to lag due to continued bank deleveraging. With debt up less than equity, gearing levels continue to come down in each region. Asia Pacific has replaced Europe as the region with the largest stock in 2013, driven by strong growth in China. Many have expressed concerns in relation to Chinese debt and therefore we took a closer look. Based on this, we estimate that Chinese debt is actually lower than thought before. But, we do remain concerned on leverage, especially with the strong pipeline of new development. This year’s investor and lender surveys show a dramatic improvement in sentiment, especially in the lending market. Lenders are much more optimistic, as they have become less risk averse with the work-out of most prime legacy loans nearing the end. This is consistent with investors’ increased risk appetites. Both also have more positive economic outlooks than before. Transaction volumes recovered to near-2006 levels in 2013, up 22% to reach USD518bn. Cross border investors have been the key force in driving volumes up globally. They now represent a post-crisis record 23% of volumes. Despite this positive trend on volumes, capital values remain mixed. This is evidenced by our newly launched European and Asian transaction-based indices showing declines in the most recent quarters. With volumes up, liquidity was pushed back at or above long run trend levels in all regions. American markets continue to provide best overall liquidity, while Europe shows the best liquidity for international investors (Figure 1). Figure 1 Total and inter-regional liquidity per region NA 2013 APAC 2003 EU 2003 NA 2003 APAC 2013 EU 2007 NA 2007 EU 2013 APAC 2007 0% 1% 2% 0% 3% 5% 8% 10% 13% Inter-regional liquidity Total liquidity $100bn Europe $500bn AsiaPacific $1,000bn N. America Size of circle= Stock Colour= Region Source: DTZ Research
-
Upload
vuongkhanh -
Category
Documents
-
view
215 -
download
0
Transcript of International investors drive liquidity - Cushman & Wakefield · International investors drive...

Money into Property Global 2014
International investors drive liquidity
DTZ Research
12 June 2014
Contents
Introduction 2
Section 1 – Stock update 3
Section 2 – Market Sentiment 9
Section 3 – Volumes & Liquidity 12
Authors
Kasia Sielewicz
Manager Investor Research
+ 44 (0)20 3296 2322
Nigel Almond
Head of Strategy Research
+ 44 (0)20 3296 2328
Hans Vrensen
Global Head of Research
+ 44 (0)20 3296 2159
Global invested stock set a new record level of USD12.9tn at year-end 2013, driven by improving sentiment and capital value recovery. This is up 4% from a year ago, with growth across all three regions. Globally, growth was led by 9% in Asia Pacific, followed by 3% in North America and 2% in Europe in USD terms.
Stock growth was caused by equity growth of 9%, while debt posted a 3% increase. For the first time since the onset of the global financial crisis, growth was recorded across all four debt-equity and public-private quadrants. But, Europe continues to lag due to continued bank deleveraging. With debt up less than equity, gearing levels continue to come down in each region.
Asia Pacific has replaced Europe as the region with the largest stock in 2013, driven by strong growth in China. Many have expressed concerns in relation to Chinese debt and therefore we took a closer look. Based on this, we estimate that Chinese debt is actually lower than thought before. But, we do remain concerned on leverage, especially with the strong pipeline of new development.
This year’s investor and lender surveys show a dramatic improvement in sentiment, especially in the lending market. Lenders are much more optimistic, as they have become less risk averse with the work-out of most prime legacy loans nearing the end. This is consistent with investors’ increased risk appetites. Both also have more positive economic outlooks than before.
Transaction volumes recovered to near-2006 levels in 2013, up 22% to reach USD518bn. Cross border investors have been the key force in driving volumes up globally. They now represent a post-crisis record 23% of volumes. Despite this positive trend on volumes, capital values remain mixed. This is evidenced by our newly launched European and Asian transaction-based indices showing declines in the most recent quarters. With volumes up, liquidity was pushed back at or above long run trend levels in all regions. American markets continue to provide best overall liquidity, while Europe shows the best liquidity for international investors (Figure 1). Figure 1
Total and inter-regional liquidity per region
NA 2013
APAC 2003
EU 2003
NA 2003
APAC 2013
EU 2007
NA 2007
EU 2013
APAC 2007
0%
1%
2%
0% 3% 5% 8% 10% 13%
Inte
r-re
gio
nal
liq
uid
ity
Total liquidity
$100bn Europe
$500bn AsiaPacific
$1,000bn N. America
Size of circle= Stock
Colour=Region
Source: DTZ Research

Money into Property
www.dtz.com Money into Property 2
Introduction It is with great pleasure that we present the 40
th edition of
Money into Property. The first report was released in 1975 and covered trends in the ownership of UK real estate. Today the report covers 36 markets globally. This report is divided into three main sections. The first section provides a detailed update of invested stock both globally and in each of the three main regions. We outline our definitions of stock in Box 1 below. The majority of stock globally (38%) is invested. A further 25% is considered investable, but is owner-occupied (Figure 2). Investable stock breakdown across top markets by region shows that the US has the largest investable universe in value terms at USD5.7tn (Figure 3). Of this, 64% is currently invested with the remaining 36% owner occupied. In contrast, at 88%, China has a large share of its investable universe (existing buildings) held by investors. This implies proportionally little opportunity for investors to buy investment graded property from corporate owners. In Europe, Germany has the largest investable stock and largest share of owner occupied property at 59%, offering the greatest potential for investors to buy from corporate holders or engage in sale and leaseback activity. The UK and France show similar trends, with close to one third of investable stock still held by occupiers. The second section is focused on the results of our investor and lender surveys, which were undertaken between March and April 2014. The survey results provide a useful insight into prevailing market sentiment. In the third and final section, we provide an update on investment transaction volumes and the latest results from our transaction-based index. Liquidity across markets is measured by considering both volumes and stock over a longer time period. We also present investment activity and liquidity on city level.
Figure 2
Breakdown of total stock, year-end 2013, USD tn
38%
25%
37%
11 10 13 34
Europe North America Asia Pacific Global
Non-investable
Investable(owner-occupied)
Invested
Source: DTZ Research
Figure 3
Top markets by investable stock, year-end 2013, USD tn
0%
20%
40%
60%
80%
100%
Asia Pacific Europe
Invested
Investable (owner occupied)
North America
2.3 1.5 1.21.70.5 1.2 5.7 0.5
DTZ Research
Box 1: Stock definition
Total stock is all commercial real estate, measured by either monetary value or space. Total stock comprises non-investable owner occupied stock, investable owner occupied stock and invested stock.
Non-investable owner occupied stock is commercial real estate that is not available to investors due to use or quality of the property.
Investable owner occupied stock is commercial real estate stock that is currently owned by occupiers but is attractive to investors in terms of use and quality. This represents potential for investors as occupiers sell their properties or undertake sale and leasebacks.
Invested stock is commercial real estate held by investors in the relevant country. As a consequence the invested stock should:- a) Rise as owner occupiers sell property to investors b) Rise as new developments are unveiled and added to the invested stock c) Rise with the general rise in capital values d) Be negatively impacted by depreciation and retirement of stock.

Money into Property
www.dtz.com Money into Property 3
Section 1 – Stock update
Growth returns to all three regions to set new record Improving market sentiment and increases in capital values in many markets have helped to push the value of global invested stock to a new record level of USD12.9tn, up 4% on a year ago (Figure 4). Growth was recorded across all three regions, led by 9% growth in Asia Pacific. Increases were more muted in North America (3%) and Europe (2%). At USD4.6tn Asia Pacific is now the largest region globally, moving ahead of Europe (USD4.4tn) for the first time. Following a 3% fall last year, Europe returned to growth with North America also rising, having shown no growth last year.
Global growth driven by Asia Pacific regardless of currency Currency movements continue to impact the value of stock, although even in local currency, growth was observed across all markets. A modest depreciation of the dollar against European economies led to marginally weaker growth (1.6%) across Europe in local currency terms. More notably, the reverse was true for Asia Pacific. Here stock grew 17% in local currency terms, nearly double the 9% change in dollar terms (Figure 5). This was driven by appreciation of the US Dollar against Yen and Australian Dollar.
Growth back in all quadrants, but private equity key driver Growth in stock was once again driven by rises in the equity portion. Overall equity grew by 9% globally, compared to a 3% increase in debt. This continues the trend seen in recent years. Over the past five years equity has shown growth of 26% in value compared to just 4% for debt (Figure 6). But, this masks variations across the regions, which will be discussed later. In Europe challenges remain for many European banks, many of which have yet to make significant write-downs. They have been able to avoid these so far by benefitting from central bank supports over recent years. However, we do anticipate that this will change in 2014. Asia continues to be driven by China, where we have heightened concerns over the sustainability of sharp growth. This is especially against the backdrop of a slowing economy and increases in non-bank lending. The outlook is generally tighter for 2014. Public markets globally recorded only muted growth. Public equity rose 1%, whilst on the debt side we saw 2% growth.
Figure 4
Global real estate invested stock USD tn
4.2 4.6
3.8 3.9
4.34.4
Global
Europe
North America
Asia Pacific
2013
4%
2%
3%
9%
12.412.9
Source: DTZ Research
Figure 5
Change in invested stock, 2013
0%
5%
10%
15%
20%
Europe North America Asia Pacific Global
USD Local Currency
Source: DTZ Research
Figure 6
Global invested stock by source of capital, USD tn
5.7 5.8
1.4 1.51.0 1.0
4.3 4.6
12.4 12.9
2009 2010 2011 2012 2013
Private equity
Public equityPublic debt
Private debt
9%
2%
1%
3%
2013
Global 4%
Source: DTZ Research

Money into Property
www.dtz.com Money into Property 4
Non- bank lending continues to grow Non-banks continued to increase exposure to real estate with outstanding debt up by USD164bn (18%) to USD1tn (Figure 7). This reflected double digit growth in the amount outstanding in Europe and Asia Pacific, with the latter being due to substantial changes in the Chinese lending market (see Box 2). In North America, non-bank debt was flat. In fact, non-bank lending was the main driver of growth in global debt. Banks continued to reduce exposure, but only marginally so compared to a year ago with real estate debt outstanding falling by just USD11bn to USD4.7tn. The reduction was driven by bank lenders in Europe, while in the US net lending was up for the first time since 2008. In Asia Pacific net lending was flat. In the public markets, there were continued reductions in CMBS outstanding in both Asia and Europe. However, in North America, there were signs of renewed activity. Outstanding CMBS bonds were flat over the year, following five years of falls. Bond issuance continues to grow with the outstanding amount up 18% to USD381bn, and increases observed across all regions. Continued low interest rates relative to the cost of alternative finance sources and ease of availability continue to drive this market.
Deleveraging continues across all markets As the value of equity continues to grow ahead of debt we have continued to see reductions in aggregate gearing. Globally gearing fell to 56%, down from 64% at its peak in 2009 (Figure 8). Reductions in gearing were observed across all regions, though the highest level of gearing remains in North America (65%).
Europe most diverse while Asia dominated by developers
As an indication of diversity, we show ownership of real estate by source of equity. Globally, developers and private companies are owners of close to half of real estate by equity value. Combined funds and institutions own more than a third, with the remaining 18% being owned by the listed sector. The Asia Pacific region has least diverse investor ownership with 56% of real estate held by private developers and companies. The ownership structure in Asia Pacific is more diverse when China is excluded, but still private developers and companies dominate, holding 38% of equity value. In contrast, both North America and Europe show a less concentrated distribution (Figure 9). In fact, fund managers and other institutions own nearly 55% of European stock.
Figure 7
Change in source of debt, USD bn
-100
-50
0
50
100
150
200
Non-banks
Bad Banks
Banks Corporate Bonds
Covered Bonds
CMBS
2012 2013
Private debt Public debt
Source: DTZ Research
Figure 8
Debt as a percentage of invested stock
56%
65%
50%
56%
40%
50%
60%
70%
80%
2004 2005 2006 2007 2008 2009 2010 2011 2012 2013
NorthAmerica
Global
Europe
Asia Pacific
Source: DTZ Research
Figure 9
Equity ownership by source, year-end 2013
0%
20%
40%
60%
80%
100%
Asia Pacific
Asia Pacific
(exc China)
North America
Europe Global
Developer/Private Company
REIT/Listed Company
Institutions
Fund
Source: DTZ Research

Money into Property
www.dtz.com Money into Property 5
Europe
Declines in UK and PIIGS offset by growth in other markets Invested stock in Europe remained flat in 2013 at EUR3.3tn (Figure 10). The growth however diverged widely across European countries and sub-regions. Germany, France and the Nordics posted the strongest growth between 4-5%. The UK recorded a 6% decline mostly driven by continued bank loan sales and deleveraging. The PIIGS sub-regions’ invested stock maintained its downward trend, with a 9% decline for the second consecutive year, reflecting the price adjustment and bank deleveraging observed in the market during 2013.
Only private equity posts growth across four quadrants In addition to geographic contrasts, there was also divergence across the source of capital (Figure 11). European lenders continue to delever, with private debt down by 4% to EUR1.4tn, driven by loan sales and write downs predominately in the UK, Spain, Ireland and Benelux. Private equity grew by 4% in 2013, driven by a moderate increase in equity holdings by private companies and investors as well as insurance companies. Public equity and debt saw limited falls compared to last year.
On-going changes to European lending landscape
If we look closer at the debt side, some structural changes of the lending landscape are now reflected in our invested stock figures (Figure 12). Despite still being dominant, debt provided by commercial banks has continued to reduce, with a further EUR60bn decline recorded in 2013. Deleveraging by banks has been recorded across Europe for the past few years. But, it is now contrasted by growth observed globally in 2013. The European lending landscape is changing as non-bank lending by institutions and debt funds kept its impressive growth rate (80% increase in 2012 and 46% in 2013) to account for a total amount outstanding of EUR50bn. On the public side, the decline in CMBS accelerated in 2013 (-29% in 2013 following -13% in 2012), whilst property company bonds have largely been used by REITs or large investment funds to reduce their overall costs of capital. These posted a 24% increase over the year to EUR71bn.
Figure 10
European invested stock, EUR tn
3.3 3.3
Rest of Europe
UK
Germany
France
3%
-6%
5%
4%
Europe 0%
2013
Nordics
PIIGS -9%
5%
Source: DTZ Research
Figure 11
European invested stock by source of capital, EUR tn
1.4 1.4
0.5 0.5
0.2 0.2
1.2 1.3
3.3 3.3
2009 2010 2011 2012 2013
Private equity
Public equity
Public debt
Private debt
4%
-2%
-1%
-4%
2013
Europe 0%
Source: DTZ Research
Figure 12
Change in components of European debt, 2013, EUR bn
-60
-40
-20
0
20
Banks Bad Banks
Non-bank
Lender
CMBS Covered Bonds
Property Company
Bonds
Private debt Public debt
Source: DTZ Research

Money into Property
www.dtz.com Money into Property 6
North America
First increase in North American stock since 2007 North America (the United States, Canada and Mexico) represents USD3.9tn (or 30%) of global invested stock of commercial real estate. In keeping with the expanding economies in the region, the amount of invested stock grew 3% year-on-year in 2013, the first rise since 2007. The US and Canada both experienced growth of 3% in USD dollar terms. In local currency, Canada experienced a more exciting 7% increase. Mexico’s invested stock decreased by 1% on the back of deleveraging of banks (Figure 13).
Both equity and debt return to growth for the first time since crisis For the first time since 2006 both debt and equity increased, indicating that North American markets have finally returned to normality. Until now, debt was lagging the general recovery in equity seen since 2010. Banks took time to deleverage and to solve issues related to legacy loans. Debt increased by 1% to USD2.5tn (Figure 14), driven by an increase in lending by banks in the US and Canada. Non-bank lending was flat in this more established market. This is in contrast to the growth seen in the other regions. CMBS market showed some signs of new activity but remains relatively subdued compared to the peak year in 2007. Investors continue to turn to bond market to secure alternative finance. Equity increased by 6% to USD 1.4tn compared to a year ago predominantly driven by capital value increases across the markets and surging investment activity. The value of equity holdings of private developers and companies, REITS and institutional investors all increased in 2013.
Canada remains the least geared Canada is the least geared market in North America with its LTV ratio remaining flat at 50% compared to last year (Figure 15). This is well below the global average of 56% and much less than the US. In the US the average LTV ratio continued to trend down to stand at 66% at year end 2013. Still, this is above the pre-crisis level of 63% in 2006. Mexico has the highest LTV ratio in North America at 67%, which is one percentage point lower than last year.
Figure 13
North American invested stock, USD tn
2013
Mexico -1%
Canada 3%
US 3%
N. America 3%
3.93.8
Source: DTZ Research
Figure 14
Change in North America invested stock by debt and equity
-20%
-10%
0%
10%
20%
2005 2006 2007 2008 2009 2010 2011 2012 2013
Debt Equity
Source: DTZ Research
Figure 15
Debt as percentage of invested stock
40%
50%
60%
70%
80%
Canada
Mexico
Global
US
50%
56%
66%67%
Source: DTZ Research

Money into Property
www.dtz.com Money into Property 7
Asia Pacific
Macroeconomics drive sub-regional growth trends
Asia Pacific replaced Europe as the largest region globally when measured by invested stock in 2013, with growth of 9%. However, growth across the region has been far from even. On the one hand, China and most South East Asian countries recorded strong annual growth. Indeed, Chinese stock was up 33% and was the global leader (Figure 16). This was offset by stock declines in both Japan and Australia. Both suffered from currency devaluation. This was triggered by Abenomics policies in Japan and the weakening resources sector in Australia.
Debt growing at same rate as stock across the region
In Figure 17 we show that private debt across Asia Pacific increased by 16% in 2013. This is a similar rise as the increase in stock, leaving the overall LTV ratio for the region at 50%, virtually unchanged on last year. In China the growth in debt was close to 30%, the same as invested stock. With capital values for standing investments up 9%, the remaining growth came from net new additions to stock. We share the markets’ concerns on non-bank lending in China. However, at 54% the Chinese average gearing level is still well below North America (65%) and Europe (56%) Thailand and Malaysia also witnessed considerably higher invested stock growth over capital value growth. Consequently, many Asia Pacific markets are currently at risk of over-supply. In light of greater restrictions in the Chinese banking system, developers are increasingly turning to alternative non-bank funding sources and corporate bonds. This is more carefully considered in Box 2 on the next page.
Future leverage dependent on policy effectiveness
This issue of new supply of space driving increased debt levels could be with us for some time to come. This is especially true in China. In Figure 18 we show the pipeline of new supply of office space. As in the past three years, we expect that the planned pipeline will not fully materialise. This is a result of normal delays, downscaling and cancellations. Despite this adjustment, we do forecast new supply to be a higher percentage of stock than in the last three years.
It will be crucial for the Chinese government to put in place effective policies to more effectively channel the use of debt by developers and to limit the overall leverage in the system. However, the problem might not be as bad as it seems, as the year-end LTV for China stood at 54%. This is well below the average for the US and many European countries.
Figure 16
Asia Pacific invested stock, USD tn
4.24.6
Rest of Asia Pacific
Australia
Japan
China
Asia Pacific
10%
-3%
-15%
33%
9%
2013
Source: DTZ Research
Figure 17
Change in invested stock and private debt 2013, local currency
0%
10%
20%
30%
0%
10%
20%
30%
Change in invested stock Change in private debt (RHS)
Source: DTZ Research
Figure 18
China historical & forecast supply with pipeline m sqm
0%
10%
20%
30%
0
4
8
12
2011 2012 2013 2014F 2015F 2016F
Actual (2011-13) & forecast(2014-16) supply
Plannedpipeline
Supply as % of current stock (RHS)
Vacancyratio (RHS)
Source: DTZ Research
Money into Property
www.dtz.com Money into Property 8
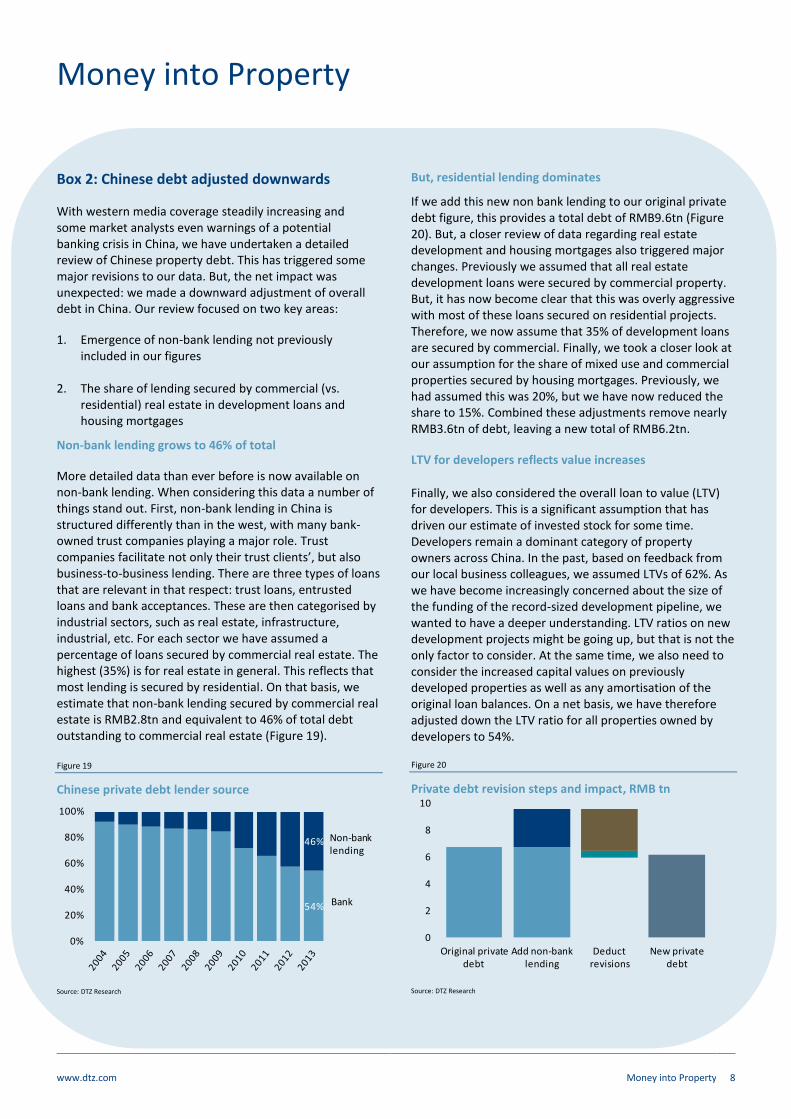
Box 2: Chinese debt adjusted downwards
With western media coverage steadily increasing and some market analysts even warnings of a potential banking crisis in China, we have undertaken a detailed review of Chinese property debt. This has triggered some major revisions to our data. But, the net impact was unexpected: we made a downward adjustment of overall debt in China. Our review focused on two key areas:
1. Emergence of non-bank lending not previously included in our figures
2. The share of lending secured by commercial (vs.
residential) real estate in development loans and housing mortgages
Non-bank lending grows to 46% of total
More detailed data than ever before is now available on non-bank lending. When considering this data a number of things stand out. First, non-bank lending in China is structured differently than in the west, with many bank-owned trust companies playing a major role. Trust companies facilitate not only their trust clients’, but also business-to-business lending. There are three types of loans that are relevant in that respect: trust loans, entrusted loans and bank acceptances. These are then categorised by industrial sectors, such as real estate, infrastructure, industrial, etc. For each sector we have assumed a percentage of loans secured by commercial real estate. The highest (35%) is for real estate in general. This reflects that most lending is secured by residential. On that basis, we estimate that non-bank lending secured by commercial real estate is RMB2.8tn and equivalent to 46% of total debt outstanding to commercial real estate (Figure 19). Figure 19
Chinese private debt lender source
54%
46%
0%
20%
40%
60%
80%
100%
Non-bank lending
Bank
Source: DTZ Research
But, residential lending dominates
If we add this new non bank lending to our original private debt figure, this provides a total debt of RMB9.6tn (Figure 20). But, a closer review of data regarding real estate development and housing mortgages also triggered major changes. Previously we assumed that all real estate development loans were secured by commercial property. But, it has now become clear that this was overly aggressive with most of these loans secured on residential projects. Therefore, we now assume that 35% of development loans are secured by commercial. Finally, we took a closer look at our assumption for the share of mixed use and commercial properties secured by housing mortgages. Previously, we had assumed this was 20%, but we have now reduced the share to 15%. Combined these adjustments remove nearly RMB3.6tn of debt, leaving a new total of RMB6.2tn.
LTV for developers reflects value increases
Finally, we also considered the overall loan to value (LTV) for developers. This is a significant assumption that has driven our estimate of invested stock for some time. Developers remain a dominant category of property owners across China. In the past, based on feedback from our local business colleagues, we assumed LTVs of 62%. As we have become increasingly concerned about the size of the funding of the record-sized development pipeline, we wanted to have a deeper understanding. LTV ratios on new development projects might be going up, but that is not the only factor to consider. At the same time, we also need to consider the increased capital values on previously developed properties as well as any amortisation of the original loan balances. On a net basis, we have therefore adjusted down the LTV ratio for all properties owned by developers to 54%.
Figure 20
Private debt revision steps and impact, RMB tn
0
2
4
6
8
10
Original private debt
Add non-bank lending
Deduct revisions
New private debt
Source: DTZ Research

Money into Property
www.dtz.com Money into Property 9
Section 2 – Market Sentiment Our lender and investor surveys were undertaken in March and April 2014 canvassing the opinions of close to 200 individuals. These views reflect the most up-to-date market sentiment, giving a preview for the future performance of commercial real estate markets.
Lenders’ survey
Lenders expect loan book expansion In 2013 over half of the respondents to our survey expected an increase in their loan books (Figure 21). However, the actual results were less positive. More lenders saw their loan books come down or stay the same in 2013. Expectations for 2014 are marginally more optimistic than in 2013, so how do we know that the actual result will not again fall short of expectations? In the end, we can of course not guarantee anything, but there are some additional differences in the results that imply lenders’ change in expectations might become reality.
Less restrictions on new lending to drive growth The increase in lenders’ loan books has mostly been driven by a decrease in restrictions on new lending and an increase in repayments (Figure 22). This is consistent with our own market observations. Restrictions on new lending are being removed by banks that have sold off their non-performing loan books and that are already meeting the new capital reserve requirements. The number of these banks has increased. Repayments are also up, as borrowers can switch into new low-cost loans from new non-bank and alternative lenders. In addition, new lending itself is also expected to increase.
Remarkable improvement in lenders outlook on recovery However the biggest change in the survey results is lenders’ expectation on the outlook for lending conditions. In a sharp contrast to the results for the last three years, 40% of lenders do now expect a substantial recovery in lending conditions in 2014 itself (Figure 23). Throughout each of our past three surveys, more lenders were expecting a recovery to come later each year. This year’s results suggest that most lenders think that the recovery is already here now or will come in 2015. This is a remarkable improvement in lenders’ sentiment.
Figure 21
Change in loan book value, actual and expected
0%
20%
40%
60%
80%
100%
2012 2013 2013 2014
Down
Same
Up
Actual ActualExpected Expected Source: DTZ Research
Figure 22
Reason for change in loan book
0%
20%
40%
60%
80%
100%
2012 2013
Growth in new lending
Limited newlending
Repayments
WritedownsLoan sales
Source: DTZ Research
Figure 23
Expectations for a substantial recovery in lending markets
0%
20%
40%
60%
80%
2011 Survey 2012 Survey 2013 Survey 2014 Survey Source: DTZ Research

Money into Property
www.dtz.com Money into Property 10
Prime workout near end as further progress is being made on non-prime workout While progress in working out non-prime problem loans was already well underway over the previous years, further progress is expected to be made in 2014. Figure 24 shows that the percentage in the survey this year has increased to 80%. Just 16% are left reporting that there has been no start in the non-prime workout compared to over half, three years ago. However, the biggest change is with the prime work-outs. Progress on prime assets seems to have accelerated and close to half of respondents now report their prime workouts completed. Surprisingly, 7% of respondents still highlight that the workout of prime has yet to start.
More lenders willing to lend on secondary assets Over 70% of lenders have indicated that they are now ready to lend against secondary assets. This is a significant step up from last year’s survey. Around 60% of lenders are able to lend on assets in Tier 2 and 3 cities (Figure 25). But, there has not been an increase from last year’s survey. There is some remaining reluctance to go into these more peripheral markets. However, we do expect this reluctance to disappear, especially as new alternative lenders are trying to increase their market share. This brings us to other results in the survey also.
Lenders risk appetite starting to return for tier 2/3 cities and speculative development The increased risk appetite amongst lenders is further confirmed by other results in the survey. When we asked lenders about their expectation for lending by type of investment in Tier 1 and Tier 2 and 3 cities the focus towards prime standing investments is becoming less dominant (Figure 26). Fewer lenders are expecting their prime, Tier 1 lending to go up when compared to last year’s survey. Lenders are also becoming less cautious towards speculative development. This is especially true in Tier 1 cities, but also in Tier 2 and 3 cities, when compared to last year’s survey results. Overall, these results confirm the marked improvement in lenders sentiment and a return of their appetite to take increased risks.
Figure 24
Trends in work out of prime and non-prime loans
0%
20%
40%
60%
80%
100%
2011 2012 2013 2014 2011 2012 2013 2014
AlreadyFinished
WellUnder-
way
Not Yet Started
Prime Non- prime
Source: DTZ Research
Figure 25
Lending to secondary assets and locations
0%
20%
40%
60%
80%
100%
2013
Survey
2014
Survey
2013
Survey
2014
Survey
No
Yes
Secondary Assets Tier 2/3 Cities
Source: DTZ Research
Figure 26
Willingness to lend in Tier 1 and Tier 2&3 cities
0%
20%
40%
60%
80%
100%
Tier 1 city Tier 2/3city
Tier 2/3city
Tier 1 city
Prime Standing Investments Speculative Development
Down
Same
Up
Source: DTZ Research
Money into Property
www.dtz.com Money into Property 11
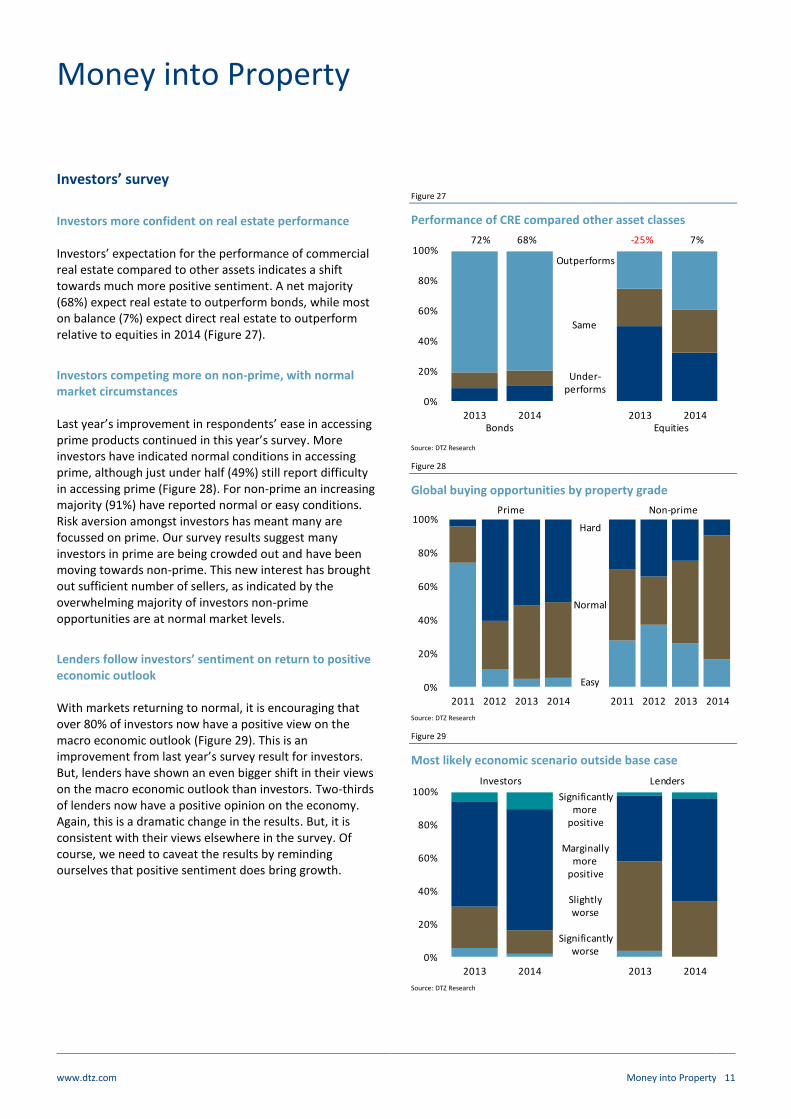
Investors’ survey
Investors more confident on real estate performance Investors’ expectation for the performance of commercial real estate compared to other assets indicates a shift towards much more positive sentiment. A net majority (68%) expect real estate to outperform bonds, while most on balance (7%) expect direct real estate to outperform relative to equities in 2014 (Figure 27).
Investors competing more on non-prime, with normal market circumstances Last year’s improvement in respondents’ ease in accessing prime products continued in this year’s survey. More investors have indicated normal conditions in accessing prime, although just under half (49%) still report difficulty in accessing prime (Figure 28). For non-prime an increasing majority (91%) have reported normal or easy conditions. Risk aversion amongst investors has meant many are focussed on prime. Our survey results suggest many investors in prime are being crowded out and have been moving towards non-prime. This new interest has brought out sufficient number of sellers, as indicated by the overwhelming majority of investors non-prime opportunities are at normal market levels.
Lenders follow investors’ sentiment on return to positive economic outlook With markets returning to normal, it is encouraging that over 80% of investors now have a positive view on the macro economic outlook (Figure 29). This is an improvement from last year’s survey result for investors. But, lenders have shown an even bigger shift in their views on the macro economic outlook than investors. Two-thirds of lenders now have a positive opinion on the economy. Again, this is a dramatic change in the results. But, it is consistent with their views elsewhere in the survey. Of course, we need to caveat the results by reminding ourselves that positive sentiment does bring growth.
Figure 27
Performance of CRE compared other asset classes
0%
20%
40%
60%
80%
100%
2013 2014 2013 2014
Outperforms
Same
Under-performs
Bonds Equities
72% 68% -25% 7%
Source: DTZ Research
Figure 28
Global buying opportunities by property grade
0%
20%
40%
60%
80%
100%
2011 2012 2013 2014 2011 2012 2013 2014
Prime Non-prime
Hard
Normal
Easy
Source: DTZ Research
Figure 29
Most likely economic scenario outside base case
0%
20%
40%
60%
80%
100%
2013 2014 2013 2014
Significantlymore
positive
Marginallymore
positive
Slightlyworse
Significantlyworse
Investors Lenders
Source: DTZ Research

Money into Property
www.dtz.com Money into Property 12
Section 3 – Volumes & Liquidity
Transaction volumes
Global investment volumes rose 22% in 2013 Global commercial real estate investment, excluding land transactions reached USD518bn in 2013, a 22% increase on 2012. This is still a shadow of the USD800bn in 2007. The continued growth in activity since the low in 2009 underlines the strength in the markets’ recovery, with volumes now close to levels in 2006 (Figure 30). All regions posted double digit growth, led by a 26% increase in Europe. Asian volumes posted a new record of USD98bn a 22% increase on 2012. North America remains the largest region by activity with volumes of USD235bn, a new post-crisis record.
Inter-regional flows largest in Europe Growth in Europe has in part been driven by increased cross border flows. Flows from outside the region (inter-regional investors) represented a record 27% of investment in 2013. This is above the global average of 15% and higher than Asia Pacific (8%) and the US (7%). Globally cross border investment represented a post crisis record 23% share of total volumes (Figure 31). Despite having the lowest regional share, we do see variations across US cities. In Chicago, Manhattan, San Francisco and Washington the share is between 25-30%. This reflects the trend for global investors to focus on key gateway cities (Figure 32). High levels of investment are also evident in cities such as Madrid (51%) and Milan (67%). Overall volumes in these markets are relatively low.
London remains global cross border capital Investment activity by inter-regional investors in Central London was close to USD18bn in 2013, three times their level in Manhattan (USD6bn). This underscores the dominance of the London in attracting overseas capital which represented 54% of total volumes in 2013. The high volume of overseas capital into London and indeed other US cities is supports higher levels of liquidity, which we discuss later in the report.
Figure 30
Global investment volumes, excluding land, USD bn
0
300
600
900
Europe Asia Pacific North America
19%
22%
26%
2013 growth
22%424
518
Source: DTZ Research, Propertydata, Real Capital Analytics,
Figure 31
Global and regional volumes by source of capital 2013
50%
60%
70%
80%
90%
100%
Europe Asia Pacific US Global
Domestic
Intra-regional
Inter-regional
Source: DTZ Research, Propertydata, Real Capital Analystics,
Figure 32
Inter-regional investment USD bn and share of market total, 2013
0%
10%
20%
30%
40%
50%
60%
0
5
10
15
20 Volume % Total
Source: DTZ Research, Propertydata, Real Capital Analytics

Money into Property
www.dtz.com Money into Property 13
Transaction-based indices in global comparison
Upward trend across all regions over the long term
To assist both domestic and international investors across markets, DTZ Research has launched a European transaction-based index (TBI)
1. At this point, we are adding
our new Asia Pacific TBI. This allows us to compare our European and Asian indices with the US index from RCA Moodys. Over recent years, there has been an upward trend in pricing across all three regions (Figure 33). This disregards the recent pause in upward movement across the European markets. We also saw a decline in the last two quarters in our new Asian index. But, we feel less confident in this trend continuing due to below-average sample size over the period. This will resolve itself, as we expect the number of observations to improve through time.
Sub-index analysis shows that in contrast to Europe, UK transacted prices continued their rise in Q1 2014 As part of our European TBI launch, we are able to present results for a number of different sub-indices. The availability of the sub-indices on a geographic and property type level is dependent on the depth of the underlying data. Non-UK commercial real estate prices had a significant decline in Q1 2014 (Figure 34). In contrast to the slowdown in Europe, the UK All Property index continues to grow, registering a 12% increase year-on-year in Q1 2014, compared to 0% growth this time a year ago.
TBI is leading indicator versus valuation indices and puts property in line with other assets In order to track the performance of real estate, valuation- based indices have traditionally been used. However, valuation-based indices tend to lag actual transaction prices, as current valuations are often anchored on past valuations. Another criticism of valuation based indices is that they are inherently conservative. Market evidence might be treated as “noise”, and hence they often underestimate actual price movements. This can be on the upside as well as on the downside. As a result, valuation-based indices tend to be smoothed over time, when compared to transaction-based indices. The main advantage of a TBI is that it reflects actual price changes in a much more timely and direct manner than a valuation-based index. Valuation-based indices tend to smooth price volatility and lag behind transaction based indices in price movements. This is clearly illustrated by Figure 35 where we compare the DTZ TBI quarterly year-on-year capital growth rates to the IPD Europe ex-UK annual growth rate.
Figure 33
Regional transaction-based indices, 2002-2014
60
80
100
120
140
160
180
Asia Pacific US Europe
Source: DTZ Research, Real Capital Analytics, Moody’s
Figure 34
Europe ex-UK & UK transaction-based indices, 1Q02 = 100
60
100
140
180
Europe ex-UK
UK
Source: DTZ Research
Figure 35
DTZ TBI vs IPD capital growth: Europe ex-UK, %y/y
-40%
-20%
0%
20%
40%
DTZ
IPD
Source: DTZ Research, IPD
1 See DTZ Insight European Transaction-Based Index Q1 2014, 29 May 2014

Money into Property
www.dtz.com Money into Property 14
Market liquidity
Liquidity ratio up across all regions Liquidity
2 continues to return to global real estate markets.
The global average rose to 4.0% in 2013, up from 3.4% in 2012, and a low of 1.6% in 2009. This takes liquidity back above 2003 levels. North America has seen the strongest recovery and has the highest liquidity ratio of all regions at 6%, with Europe lagging at 4.2%, though still above the global average. Asia Pacific continues to lag with relatively low levels of liquidity at just around 2% (Figure 36). At a country level we do see variations. In 2013 the UK was the most liquid market globally at 9.2%, followed by Singapore at 7.6%. Australia also saw relatively strong liquidity at 4.2%, though at 0.6% China continues to drag the regional average down, reflecting the low volume of standing investments.
Inter-regional liquidity drives growth in Europe Liquidity is paramount for cross border investors. We can compare trends through time for both total and inter-regional liquidity (Figure 37). In all regions liquidity has not moved back to peak 2007 levels, but in both Europe and North America we see a positive trend, with the growth in Europe clearly driven by the rise in inter-regional investment.
London and Singapore leading liquid global cities We have extended our country level analysis to consider liquidity at the city level for offices and compare this with the size of the stock. We show this as an average over the last ten years as this provides a better view for entering and exiting markets through the cycle (Figure 38). The analysis does provide some expected, but equally unexpected results. London stands out with above average liquidity levels and underscores its position as the leading global city for investment. A number of US gateway cities lie around the global average including New York and Washington DC. San Francisco shows above average levels. Across Asia Pacific, Singapore stands out as showing above average liquidity. Both Tokyo and Hong Kong lag. In China, the Tier 1 cities of Beijing and Shanghai show average levels of liquidity at a city level, despite much lower levels in China as a whole where land sales continue to dominate.
2 Liquidity is defined as investment turnover as a percentage of invested stock.
Figure 36
Global and regional liquidity ratios, 2003-13
0%
2%
4%
6%
8%
10%
Global
Asia Pacific
N. America
Europe
Source: DTZ Research
Figure 37
Total and inter-regional liquidity per region
NA 2013
APAC 2003
EU 2003
NA 2003
APAC 2013
EU 2007
NA 2007
EU 2013
APAC 2007
0%
1%
2%
0% 3% 5% 8% 10% 13%
Inte
r-re
gio
nal
liq
uid
ity
Total liquidity
$100bn Europe
$500bn AsiaPacific
$1,000bn N. America
Size of circle= Stock
Colour=Region
Source: DTZ Research
Figure 38
Country and city level liquidity (10 year average) and city office stock
SYD
BEJ SHA
PARHKG
TKO
SIN
STO
LON
CHI
LANYC
SFRWDC
FRA
Colour=Region
Size circle= Stock
$10bn Europe
$50bn Asia Pacific
$100bn USACity Liquidity
Co
un
try
Liq
uid
ity
HighLow
Hig
hLo
w
Source: DTZ Research

Money into Property
www.dtz.com Money into Property 15
Definitions
Invested stock The value of investment grade commercial real estate held by different investor groups. The total value of the real estate capital market is defined as the total volume of commercial real estate debt outstanding plus the total value of equity in commercial real estate holdings.
Private debt Total value of outstanding loans to the real estate sector that are not held in the form of listed financial securities. Loans granted and subsequently securitised prior to maturity are not included in this data. Private debt relates to the activity of all participants involved in the provision of commercial real estate loans including institutional lenders, commercial bank lending and insurance companies.
Public debt Total value of outstanding loans to the real estate sector held in the form of listed financial securities, i.e. property company corporate bonds, covered bonds with commercial property as collateral and commercial mortgage backed securities (CMBS).
Private equity The equity proportion of the commercial real estate holdings of insurance companies, pension funds, private property companies, high net worth individuals and unlisted property vehicles. The debt proportion has been stripped out by applying a different gearing ratio for each investor group.
Public equity The equity proportion of the commercial real estate holdings of listed property companies, REITs and other listed property vehicles. The debt proportion has been stripped out by applying a different gearing ratio for each investor group.
Gearing (or LTV) ratio Debt/(debt+equity). The various investor groups have different gearing levels based on their risk profile, investment strategy, and their capital sources.
Money into Property methodology
Private debt allocation
In order to capture the value of commercial real estate loans issued by domestic banks to fund cross-border investment and likewise by foreign banks to fund domestic property investment, private debt is allocated based on the pattern of cross-border investment transactions.
Cross-border allocation in invested stock
The value of commercial real estate held by different investor groups is allocated based on the location of the property rather than the origin of the investor.
Currency conversions Invested stock and its components are converted by using the average quarterly exchange rate for each year under review.
Transaction volumes
Transaction volumes
The buying and selling of property and are independent of stock. For example there can be a lot of transactions, but if price does not change and the property is already in the invested stock figures then there will be no change in invested stock. The only change is the owner of the property, which could trigger a change in quadrant (say public to private). Higher transaction volumes do indicate interest in the market, and tend to imply more development activity or that capital values are rising.

www.dtz.com Money into Property 16
Other DTZ Research Reports Other research reports can be downloaded from www.dtz.com/research. These include:
Occupier Perspective Updates on occupational markets from an occupier perspective, with commentary, analysis, charts and data. Global Occupancy Costs Offices Global Occupancy Costs Logistics Occupier Perspective - User Guide to The Americas Occupier Perspective - User Guide to Asia Pacific Occupier Perspective - User Guide to EMEA Occupier Perspective - Global User Guide India Office Demand and Trends Survey 2013-14 Sweden Computer Games Developers November 2013
Property Times Regular updates on occupational markets from a landlord perspective, with commentary, charts, data and forecasts. Coverage includes Asia Pacific, Baltics, Bangkok, Barcelona, Bengaluru, Berlin, Brisbane, Brussels, Budapest, Central London, Chennai, Chicago, Delhi, East China, Europe, Frankfurt, Geneva, Guangzhou & Central China, Hamburg, Helsinki, Ho Chi Minh City, Hong Kong, Hyderabad, Jakarta, Japan, Kolkata, Kuala Lumpur, Los Angeles, Luxembourg, Lyon, Madrid, Manhattan, Melbourne, Milan, Mumbai, North China, Paris, Poland, Prague, Pune, Rome, San Francisco, Seoul, Singapore, South & West China, Stockholm, Sydney, Taipei, Toronto, Ukraine, UK, Warsaw, Washington.
Investment Market Update Regular updates on investment market activity, with commentary, significant deals, charts, data and forecasts. Coverage includes Asia Pacific, Australia, Belgium, Czech Republic, Europe, France, Germany, Italy, Japan, Mainland China, South East Asia, Spain, Sweden, UK.
Money into Property For 40 years, this has been DTZ's flagship research report, analysing invested stock and capital flows into real estate markets across the world. It measures the development and structure of the global investment market. Available for Global, Asia Pacific, Europe, North America and UK.
Foresight Quarterly commentary, analysis and insight into our in-house data forecasts, including the DTZ Fair Value Index™. Available for Global, Asia Pacific, Europe, UK and China. In addition we publish an annual outlook report.
Insight Thematic, ad hoc, topical and thought leading reports on areas and issues of specific interest and relevance to real estate markets. Net Debt Funding Gap - May 2014 China Insight Office Pipeline and Dynamics May 2014 Deflation and Commercial Property - March 2014 Tokyo Retail Market 2014 Great Wall of Money – March 2014 German Open Ended Funds – March 2014 China Investment Market Sentiment Survey - January 2014 China The Technology Sector - January 2014 Czech Republic Green buildings - December 2013 UK secondary market pricing - October 2013 Quantitative Easing - UK Regions – September 2013 Singapore Government Land Sales - September 2013 Property Investment Guide Asia Pacific 2013-2014
DTZ Research Data Services
For more detailed data and information, the following are available for subscription. Please contact [email protected] for more information.
Property Market Indicators Time series of commercial and industrial market data in Asia Pacific and Europe.
Real Estate Forecasts, including the DTZ Fair Value Index
TM
Five-year rolling forecasts of commercial and industrial markets in Asia Pacific, Europe and the USA.
Investment Transaction Database Aggregated overview of investment activity in Asia Pacific and Europe.
Money into Property DTZ’s flagship research product for over 35 years providing capital markets data covering capital flows, size, structure, ownership, developments and trends, and findings of annual investor and lender intention surveys.

www.dtz.com Money into Property 17
DTZ Research
DTZ Research Contacts
Global Head of Research
Hans Vrensen
Phone: +44 (0)20 3296 2159
Email: [email protected]
Global Head of Forecasting
Fergus Hicks
Phone: +44 (0)20 3296 2307
Email: [email protected]
Head of Strategy Research
Nigel Almond
Phone: +44 (0)20 3296 2328
Email: [email protected]
Head of Americas Research
John Wickes
Phone: +1 312 424 8087
Email: [email protected]
Head of CEMEA Research
Magali Marton
Phone: +33 1 49 64 49 54
Email: [email protected]
Head of North Asia Research
Andrew Ness
Phone: +852 2507 0779
Email: [email protected]
Head of South East Asia and Australia New Zealand Research
Dominic Brown
Phone: +61 (0)2 8243 9999
Email: [email protected]
DTZ Business Contacts
Head of International Capital Markets EMEA
Paul Boursican
Phone: +44 (0)20 3296 2019
Email: [email protected] Head of Capital Markets Americas
Ed Wlodarczyk
Phone: +1 312 424 8015
Email: [email protected]
Head of International Capital Markets Asia Pacific
Gary Hollis
Phone: + 65 6393 2328
Email: [email protected]
DISCLAIMER
This report should not be relied upon as a basis for entering into transactions without seeking specific, qualified, professional advice. Whilst facts have been rigorously checked, DTZ can take no responsibility for any damage or loss suffered as a result of any inadvertent inaccuracy within this report. Information contained herein should not, in whole or part, be published, reproduced or referred to without prior approval. Any such reproduction should be credited to DTZ.
© DTZ June 2014