INTERNATIONAL DETERMINANTS OF SOFTWARE PIRACY Jacob Aaron
67
INTERNATIONAL DETERMINANTS OF SOFTWARE PIRACY Jacob Aaron Boyce B.A., California State University, Sacramento, 2008 THESIS Submitted in partial satisfaction of the requirements for the degree of MASTER OF ARTS in ECONOMICS at CALIFORNIA STATE UNIVERSITY, SACRAMENTO SPRING 2011
Transcript of INTERNATIONAL DETERMINANTS OF SOFTWARE PIRACY Jacob Aaron

INTERNATIONAL DETERMINANTS OF SOFTWARE PIRACY
Jacob Aaron Boyce B.A., California State University, Sacramento, 2008
THESIS
Submitted in partial satisfaction of the requirements for the degree of
MASTER OF ARTS
in
ECONOMICS
at
CALIFORNIA STATE UNIVERSITY, SACRAMENTO
SPRING 2011

ii
© 2011
Jacob Aaron Boyce ALL RIGHTS RESERVED

iii
INTERNATIONAL DETERMINANTS OF SOFTWARE PIRACY
A Thesis
by
Jacob Aaron Boyce
Approved by: ____________________________, Committee Chair Jonathan Kaplan ____________________________, Second Reader Craig Gallet Date:________________________

iv
Student: Jacob Aaron Boyce I certify that this student has met the requirements for format contained in the University
format manual, and that this thesis is suitable for shelving in the Library and credit is to
be awarded for the thesis.
____________________________, Department Chair _______________ Mark Siegler Date Department of Economics
v
Abstract
of
INTERNATIONAL DETERMINANTS OF SOFTWARE PIRACY
by
Jacob Aaron Boyce
As life becomes increasingly more digital, copying and distributing lossless copies of
copyrighted material is quicker and simpler than ever. For the owners and producers of
copyrighted material, there are very real implications for easier reproduction of their
works. With the rise of the Internet and broadband Internet worldwide, does this
increased connectivity lead to increased rates of software piracy? I approach this
question with unbalanced panel data consisting of 105 nations during the time period of
2006-2009, allowing for control of unknown and immeasurable characteristics among
nations. The results find that increased broadband Internet penetration rates lead to
increased piracy rates.
____________________________, Committee Chair Jonathan Kaplan ____________________________ Date
vi
TABLE OF CONTENTS
Page
List of Tables .................................................................................................................... vii
List of Figures .................................................................................................................. viii
Chapter 1. INTRODUCTION ..........................................................................................................1
2. LITERATURE REVIEW ...............................................................................................5
2.1. Theoretical Analysis ................................................................................................. 5
2.2. Cross-sectional Regression Analysis ....................................................................... 9
2.3. Panel Data Analysis ............................................................................................... 18
2.4. Conclusion .............................................................................................................. 20
3. DATA SUMMARY ......................................................................................................22
3.1. Summary Statistics ................................................................................................. 22
3.2. Proposed Regression Analysis and Expected Results ............................................ 35
4. EMPIRICAL ANALYSIS ............................................................................................37
4.1 Ordinary Least Squares Regression ........................................................................ 37
4.2 OLS Results Interpretation ...................................................................................... 40
4.3 Panel Regression ..................................................................................................... 42
4.4 Panel Regression Interpretation .............................................................................. 48
5. CONCLUSION .............................................................................................................51
Appendix. Data Sources ...................................................................................................55
References ..........................................................................................................................56
vii
LIST OF TABLES
Page
3.1. Descriptive Statistics ..................................................................................................22
3.2. Correlogram ................................................................................................................29
4.1. Ordinary Least Squares Regression Results ...............................................................38
4.2. Fixed Effects and Random Effects Regression Results ..............................................44
4.3. Fixed Effects Regression Results (Continued) ...........................................................47
viii
LIST OF FIGURES
Page
3.1. Scatter Plot with Fitted Line for Piracy Rate and Broadband Penetration Rate ........ 30
3.2. Scatter Plot with Fitted Line for Piracy Rate and Internet Penetration Rate ..............31
3.3. Scatter Plot with Fitted Line for Piracy Rate and ln(rGDP) .......................................31
3.4. Scatter Plot with Fitted Line for Piracy Rate and IPR ................................................32
3.5. Scatter Plot with Fitted Line for Piracy Rate and HDI ...............................................33
3.6. Scatter Plot with Fitted Line for Piracy Rate and Gini ...............................................33
3.7. Scatter Plot with Fitted Line for Piracy Rate and ROL ..............................................34
1
Chapter 1
INTRODUCTION
Each year, our world becomes increasingly more advanced and digital
technologies permit faster distribution and more exact copies of original works to be
distributed with ease. Piracy of copyrighted works has been a longstanding issue, even
before the advances of modern computers. Prior to computers, piracy was done through
analog means such as making a recording of a cassette tape, making a copy of a VHS
video, or recording a live concert using a hidden tape recorder. Today, people access
many forms of media with computers. Computers can now display electronic books, play
music, movies, and run games and software applications as well. Within the last two
decades not only have these media forms become ever more present on computers but the
Internet has also experienced a surge in growth. Initially, the Internet surge was just dial-
up connections but in the past ten years, broadband Internet access and usage has seen
huge growth worldwide as well, growing from 394 million users or six percent of the
world’s population in 2000 to nearly 2.1 billion or 30 percent of the world’s population in
2010 according to the International Telecommunications Union.1
Though there are many types of piracy that may occur today, the focus of this
thesis is on business software application piracy. The Business Software Alliance (BSA)
publishes a yearly worldwide report of business software piracy rates. This thesis uses
the data published in the BSA report to study the causes of piracy.
1 A listing of data sources and the Internet address to locate the data are included in the appendix at the end of this thesis.

2
The rate of software piracy may have a large variety of determinants. Among the
determinants may be social, political, economic, and technological variables.
Specifically, this thesis seeks to examine the relationship between expanded use and
availability of the Internet and broadband Internet to the rate of piracy.
Previous literature has primarily employed cross-sectional data sets and chosen an
assortment of social, political, economic and technological variables to find determinants
of piracy rates. Departing from the prior literature, this thesis employs panel data
analysis to control for unique characteristics across countries and time rather than cross-
sectional data chosen for just a single year.
Secondly, the objective is to determine the relationship between Internet and
broadband Internet penetration rates and the rates of piracy, whereas earlier research has
not had as narrow a focus but instead attempted to identify broad structural models for
determining piracy rates. The breadth of the variables chosen in this prior research is
critical to the decision of other researchers to choose cross-sectional data instead of panel
data. Many of the political and social variables do not change much over time and thus
are included in the fixed effects in a panel regression.
As previously mentioned, a panel of data is used to create a model using fixed
effects. The use of country fixed effects allows for control of immeasurable and
unknown variables which are fixed in time but vary across countries. By also allowing
for fixed effects across time, differences from year to year that occur across all countries
can be controlled. The fixed effects model allows for fewer variables to be chosen as
explanatory variables because the fixed effects account for factors that change very
3
slowly, or not at all, over time or from country to country.
The results of pooled OLS regressions find that Internet and broadband Internet
penetration rates affect piracy rates differently. Prior to controlling for fixed effects,
Internet rates have an inverse relationship with piracy rates, suggesting that increasing
access to the Internet leads to decreasing rates of software piracy. However, in the
pooled OLS regressions, piracy rates increase with broadband Internet rates, suggesting
that increasing access to broadband Internet leads to higher rates of software piracy.
The results of the fixed effects regression find that Internet and broadband
Internet penetration rates have a negative relationship with software piracy rates when
both are specified as linear in relation to piracy. The relationship is surprising, as the
availability of broadband Internet connections seems likely to increase the rates of piracy
rather than decrease piracy due to broadband connections allowing for easier and less
costly transmission of digital content worldwide and at great speeds. The
counterintuitive results may be due to changing anti-piracy measures that are most
effective when Internet access is more widely available. These measures could be in the
form of changes in the way that both governments and software publishers fight piracy
such as requiring software applications to be validated via the publisher’s website each
time the application is launched.
When broadband is specified as non-linear then the results suggest that increased
broadband Internet access leads to increased rates of piracy at an increasing rate. The
inclusion of a non-linear specification for broadband renders Internet penetration rates as
insignificant but provides the expected results for how broadband Internet penetration

4
rates affect piracy rates. The aforementioned anti-piracy measures by either governments
or businesses become included within the time effects in this model. The non-linear
specification of broadband leads to similar conclusions to that of the pooled OLS model.
The remainder of this thesis is structured as the following. Chapter 2 consists of a
literature review, comparison, and contrast with the scope of this thesis. Chapter 3
describes the data used including sources, definitions and descriptive statistics. Chapter 4
discusses the regression results and explores detailed analysis of the regression results
and what the implications of the results may be. Lastly, Chapter 5 concludes.

5
Chapter 2
LITERATURE REVIEW
The study of software piracy has a relatively young but growing body of
literature. The vast majority of research has been conducted within the past two decades
and has been most intensely scrutinized within the past ten years. Research has covered
nearly every type of digital content piracy but the most reliable and consistent sources of
data focus upon computer application software. Even within just this category, research
includes theoretical and empirical studies. Many times the theoretical studies help guide
the empirical research. Furthermore, empirical research includes micro level data and
macro level data. As mentioned, past empirical research has utilized cross-sectional data
to discover determinants of piracy or measure the effect of software piracy on other
economic variables. An even smaller but growing subset of literature employs panel data
techniques to provide empirical analysis of software piracy. Theoretical studies and both
types of empirical studies will be reviewed in depth to guide the research that follows.
2.1. Theoretical Analysis
Though the literature focusing upon the theoretical analysis of software piracy is
more limited than empirical studies, this literature still remains important in guiding the
empirical research. The theories assist in selecting relevant variables to include in an
empirical regression analysis and which variables need not be included. Additionally,
theoretical research may provide some insight into choosing the correct model
specification.

6
Poddar (2005) develops two primary theoretical models to explain variation in
levels of piracy across nations in the global software market. The models are distinct
from each other in that one focuses upon commercial piracy whereas the other one
focuses upon piracy by the end-user. The key findings of these two models are that high
income gaps, less strict enforcement, and more reliable copies of pirated software lead to
increased piracy rates.
The development of this theoretical model by Poddar (2005) helps to highlight
two different types of piracy that may occur in international markets as well as potential
reasons and costs associated with that piracy. While the analysis that follows later in this
thesis does not differentiate between commercial piracy and end-user piracy, these
models guide the research to include variables that measure income levels, income
inequality, and either direct or indirect levels of enforcement.
Chang et al. (2008) focus on developing a theoretical model that features end-user
piracy exclusively. This model has different assumptions than the model found in Poddar
(2005). Whereas Chang et al. rely on enforcement of intellectual property rights as
deterrents to piracy, Poddar uses research and development expenditures as a piracy
deterrent. Specifically research and development is undertaken to raise the cost of
reproducing the software for pirates. A common example of research and development
raising the costs of piracy is the development of new digital rights management systems.
Despite these different approaches, some of the findings are similar between the two
studies. Key assumptions and features of this model include a monopolized software
industry with network effects and limited liability for the pirates. Chang et al. (2008)

7
state the following: “One key feature of this paper is the assumption of ‘limited liability’
which states that each pirate’s residual income, if detected and having paid the penalty,
should not fall below a minimum level” (p. 26). Unlike other piracy related research this
model assumes that the pirate copy of the software is an exact duplicate and does not
suffer from loss of quality in any manner. Each consumer also values the software
identically to other consumers and this value is determined by the network effect. As
more consumers choose to use the software then the network effect causes a rise in
valuation. The inclusion of limited liability paired with heterogeneous income is also
important as this creates a probable empirical scenario where the potential pirate’s
opportunity costs of software piracy increase with income and earnings.
Chang et al. (2008) find that the single biggest determinant of piracy in the model
is the price set by the monopoly. As expected, as prices increase so does the rate of
piracy. The other exogenous variables such as levels of enforcement lead to decreased
rates of piracy though only weakly. However, the important determination of the model
is that increasing prices to wealthy customers can lead to an increase in profitability for
the monopolist. Even though the piracy rate will increase with the price, as more low
income consumers determine that the cost to pirate is less than the cost of obtaining a
legal copy, firm profits increase due to the network effect increasing the valuation of the
software and thus increasing the quantity demanded at all income levels. Additionally,
spillover of piracy to the high-income groups must be avoided in order to maintain
profitability. Providing severe enough protection of intellectual properties provides the
necessary solution to prevent spillover of piracy to high-income groups. Without such
8
protections the wealthy consumers also receive higher benefits for piracy than obtaining
legal copies. Of all the findings in Chang et al. (2008), the one that will help to shape this
thesis will be the theoretical approach of the market for piracy being one of limited
liability for the end-user. Defining the market for piracy as one of limited liability means
that the occurrence of piracy is inversely related to income levels and thus income
variables are important in determining rates of piracy.
Alternatively, Cremer and Pestieau (2009) provide a theoretical approach to
studying piracy by solving for the optimal copyright enforcement. They focus more
heavily upon how social welfare will be affected by the firm’s copyright enforcement
decision. Their goal is to determine the socially optimal level of enforcement. The
conclusion the authors arrive at is that even with piracy, profits can be maintained at
acceptable levels. Furthermore, piracy may be welfare-enhancing by allowing consumers
with very low willingness-to-pay to utilize the content through piracy while maintaining
price setting schemes for the higher value consumers who must have the superior product
(i.e., highly inelastic demand). This may suggest an inverted u-shaped relationship
between piracy rates and income. The relationship between piracy rates and income will
be further explored in this thesis using both linear and non-linear specifications for gross
domestic product per capita and also the human development index that includes gross
national income as a component. This topic will be covered in more detail in the data
summary chapter and again in the empirical analysis chapter to follow.

9
2.2. Cross-sectional Regression Analysis
Holm (2003) seeks to test economic theories based upon a simple model of piracy
developed by Besen and Kirby (1989) using the results of a survey. The survey consists
of five subject areas; covering piracy behavior, net willingness to pay for an original copy
(of music, games, or software), computer skills, ethical concerns, and income. Piracy
behavior and ethical concerns both used only multiple choice questions whereas the other
subject areas allowed for open-ended answers. This survey serves to guide additional
research in this thesis in regards to persons with low net willingness to pay being more
likely to pirate and also those persons with higher computer skills are more likely to
pirate. The former helps to support the notion that those persons with high willingness to
pay acquire the best quality copy of the software, game, or music in question due to either
liability reasons or productivity reasons. The latter supports the inclusion of computer
related variables in regression analysis of international piracy rates. Nations with high
rates of computer usage should, in theory, be more skilled at using a computer compared
to those with low computer usage. If the evidence from Holm (2003) stands, then
computer use may increase piracy rates.
Holm (2003) also included a brief macro level analysis of piracy rates. Much less
work appears to have been put into this section of the analysis as the model includes only
two variables in a cross-sectional regression of 75 countries in 2000. These two variables
are gross national income (GNI) per capita and the rule of law, an index obtained from
10
Kaufmann et al. (1999).2 The results of this macro level analysis are similar to the micro
level analysis in that income has a negative relationship with piracy, as income increases
piracy rates decrease. Both of the variables used in this second model will be included in
the thesis research as they both influence piracy rates in theory and empirical results. An
updated rule of law index from Kaufmann et al. (2009) will be used in this thesis to allow
for more years of data and also for current data.
More recently, Fischer and Andrés (2005) further investigated the relationship
between income and piracy rates. Fischer and Andrés (2005) include a cross-section of
71 countries and variables that include income, cultural influences, inequality of income,
and enforcement of property rights. The models use either the Gini coefficient or income
quintiles as the measure of income inequality in different specifications of the regression.
The inclusion of so many more variables provides a more complete analysis of the
influences of piracy rates when compared to Holm (2003), which was simple by
comparison. Additionally, including results for multiple regressions in this research
allows for evaluation of the robustness of the regression results.
The key findings of Fischer and Andrés (2005) are how piracy relates to income,
income inequality, and individualism (i.e., a measure of social-connectedness within a
society). The empirical results show that income inequality is inversely related with
piracy. However, the effects of income inequality differ across regional subsamples.
Results on income inequality using the Gini coefficient differ from those using quintile
2 The Kaufmann et al. research originally used by Holm (2003) was published in 1999 but has since been updated many times. The version used in this thesis was published in 2009. The updates simply add additional observations for each new year.

11
measures. The results provide evidence that GDP per capita has a non-linear relationship
with piracy rates. In each model, the natural logarithm of real GDP per capita (lnGDP)
had a positive and significant coefficient while the lnGDP squared had a negative and
significant coefficient. The coefficients then indicate that GDP per capita has an inverted
u-shaped relationship with piracy rates. As suggested by Cremer and Pertieau (2009),
increasing levels of income will lead to increased rates of piracy until a maximum is
reached and then piracy rates begin to fall with increasing income. This relationship adds
empirical support to the theory of limited liability presented in Chang et al. (2008).
Individualism is found to lead to lower rates of piracy and is robust and significant in
each of their specifications. Fischer and Andrés (2005) note that piracy is an activity that
typically is conducted in groups and the theory is that more individualistic societies will
have fewer group connections with which to participate in piracy.
As Fischer and Andrés (2005) grouped some of the observations by region,
Piquero and Piquero (2006) instead employ trajectory analysis by grouping countries
with similar rates of piracy. Trajectory analysis is a technique that groups observations
by defined differences and compares the results against the other groups. Employing
trajectory analysis allows for identifying characteristics in addition to rates of piracy that
the countries all share in common. The analysis consists of piracy data from 82 countries
between the years of 1995 and 2000. Unfortunately, all other variables are only observed
in a single year, leaving the authors with a cross-sectional data set instead of panel data,
which forces them to use the average rate of piracy over the six annual observations of
piracy rates. These 82 countries are divided into six groups based upon piracy rates. The

12
first group consists of the countries with the lowest average rates of piracy and the sixth
group has the highest average piracy rates. Unlike other regressions, Piquero and Piquero
(2006) used a censored model since the values of piracy rates are continuous but limited
to values between 0 and 100.
While the model in Piquero and Piquero (2006) is still subject to the limitations of
cross-sectional data, the use of trajectory analysis allows for additional analysis and
insight into determinants of piracy. With this model, GDP was included without scaling
for the population size and also without using a polynomial specification. Despite this
shortcoming, once again high levels of GDP are found to lead to decreased rates of
piracy. This finding is consistent with other available literature. The number of Internet
users and computer users have a negative relationship with piracy rate, though not
statistically significant. These effects, as well of the effect of GDP on piracy rates, will
be examined in greater detail in this thesis. Finally, Piquero and Piquero (2006) include
variables to measure democratic institutions and civil liberties. In both cases, these
variables are found to share a negative relationship with piracy rates.
The study by Piquero and Piquero (2006) presents a model not seen in any of the
available literature. While Piquero and Piquero provide justification for the use of a
censored model in their research as opposed to a standard OLS regression, the argument
is not very strong or well-constructed. Censored models are designed for use when
behavior is observed but limited to an upper or lower bound, or possibly both when the
data is recorded. In the case of software piracy, observable values are between zero and
100. Rates of piracy below zero or above 100 are not valid since the Business Software

13
Association defines piracy as the number of licensed software applications installed
divided by the total software applications installed. A more in depth discussion of piracy
definitions is presented in the next chapter.
Yang and Sonmez (2007) examine social and economic influences on intellectual
property violations. They use data that summarize cultural differences from 76 countries,
including educational expenditures, individualism, religion, and language. The fifth
independent variable used in their study is per capita gross domestic product, which is
used as an economic control variable. One of the shortcomings of their work is that the
data they collected were averages across time, to allow for a cross-sectional analysis
rather than panel analysis since they only consider the final average of each variable.
Furthermore, the data used in the analysis have varying time frames within the 1994 to
2003 time period. As an example, piracy rate is the average piracy rate within each
country between 1994 and 2002 whereas education expenditures are averaged from 1998
to 2003. Significant changes may occur during the years that do not match, causing some
concerns regarding internal validity.
Yang and Sonmez (2007) find that culture, as measured by four variables
including education expenditures, individualism, religion, and language, is important in
determining piracy rates. The regression models they generated are capable of explaining
as much as 76 percent of the variations in piracy by including just four of the five
variables (per capita GDP, educational expenditures, individualism, and religion).
Furthermore, a model with just individualism and per capita GDP is capable of
explaining 73 percent of the variation in piracy rates. The study by Yang and Sonmez
14
(2007) helps to direct the focus of this thesis towards greater internal validity by using
panel data analysis with unbalanced data.
Goel and Nelson (2009) use a similar approach to determining software piracy, as
do Yang and Sonmez (2007). However, Goel and Nelson (2009) use more independent
variables to explain piracy rates using cross-sectional data of 57 countries. The authors
here use data from a single year, 2004, rather than averages across mismatched time
periods, as did Yang and Sonmez (2007). The data set includes as many as 21
independent variables to explain piracy rates such as indices of economic freedom, civil
liberties, property rights, and corruption perceptions. Other variables include
technological controls such as Internet penetration, computer usage, networked readiness,
and price baskets for telecom and Internet access. The variables are chosen to fit four
specific categories: economic factors, institutional factors, technological factors, and
other factors.
The key findings of Goel and Nelson (2009) are that both economic and non-
economic factors are important in determining piracy rates. Interestingly, the findings
imply that greater literacy, market size, economic freedom, and corruption lead to
increased rates of piracy. While corruption and economic freedom seem likely to lead to
increased rates of piracy due to a surrounding culture that is accepting of corruption and
likely other unethical practices and economic freedom affords persons the choices to act
in their own best economic interest, which may include piracy when income is low.
Increased piracy rates linked with the literacy rate may be due to a basic education being
necessary to effectively operate a personal computer. The influence of market size on

15
piracy rates is unclear as to why this would lead to increased piracy rather than decreased
piracy. With a larger market, the expectation would be that the software is more readily
available and possibly attainable at lower prices. In opposition, greater economic
prosperity, political freedom, Internet and phone charges, and diffusion of computer
technologies reduce the rate of piracy. The influence of economic prosperity on
decreasing piracy rates is likely tied to limited liability, which has been presented in
much of the reviewed literature. The influence of political freedom on piracy rates is
unclear. Increased Internet and phone charges may lead to decreased rates of piracy as
they increase costs for distributing or obtaining pirated content through the Internet.
While many of these findings are expected, it appears surprising that diffusion of
computer technology reduces piracy rates as a greater diffusion of computer technology
means that there are a greater number of persons with the opportunity to participate in
piracy. However, a greater diffusion of technology may also bring with it a greater
emphasis on enforcement of copyright law. Anecdotally, if the computer market is small,
there is not much to be lost or gained from high levels of anti-piracy efforts.
Depken and Simmons (2004) also explore the social and economic influences of
software piracy. Their data are cross-sectional and span 65 countries. Variables unique
to this research are the inclusion of a polynomial term for the literacy rate as well as a
variable to measure a person’s accessibility to his or her superiors in society. The authors
explain this as a measure of the vertical distance of relationships in society as opposed to
the horizontal relationships as measured by the individualism index. The key findings are
the direction and significance of economic variables that influence piracy such as GDP
16
per capita (negative), dependence on trade with the United States (negative), the squared
literacy rate (negative), and inflation rate (negative). However, the social factors of
individualism (negative), power-distance (varies) and interaction of the two (positive) are
found to be significant in some models but not others. These findings will help to guide
which variables will be used in this thesis and the expected signs of those variables.
Particular attention is paid to GDP per capita and the inflation rate as these are common
economic control variables that can help to explain the conditions in a country that may
lead to higher rates of piracy. While the social factors will likely not be relevant in panel
data analysis later in this thesis due to the factors remaining relatively constant over time,
however, the economic factors present more possibilities in panel data analysis given
they change over time and across countries.
Additional research by Kovačić (2007) focused on economic and cultural
variables but also included legal variables. A total of 69 countries are included in a
cross-sectional analysis. Similar to Depken and Simmons (2004) an individualism index
is used to measure social relationships within each country. Another variable, power-
distance, is a way to measure the vertical relationships within society. The vertical
relationships are those relationships with persons above or below you in social or
political standing. An example of power-distance is how much direct communication is
present between government officials and the people they serve. Also present is the rule
of law measurement as seen in many of the earlier studies of piracy. The new variables
presented in Kovačić (2007) are the ones that measure masculinity in the society and the
uncertainty avoidance index. The results are much the same as the results from the

17
previous research: increased income, individualism, and rule of law lead to decreased
piracy rates while power-distance leads to an increase in piracy rates. The uncertainty
avoidance index is found to be insignificant and the coefficient on masculinity is not
robust across all specifications though is significant and negative in three of four models.
Based upon these results, masculinity and the uncertainty avoidance index are not used
but the case builds further for the inclusion of individualism, power-distance, and the rule
of law in the empirical analysis to follow.
Marron and Steel (2000) use a cross-sectional dataset consisting of 77 countries
worldwide to examine how intellectual property protection varies. The dependent
variable in their study is piracy rate and the variable is calculated by using the average
piracy rate between 1994 and 1997 for the 77 countries. The other variables that are used
are GDP per capita, an index of individualism, a composite of five measures used to rate
law, security, and corruption; research and development expenditures; and educational
attainment. The selections of the individual variables are not unique among the literature,
as many of them or similar variables have been used in other studies.
The importance of Marron and Steel (2000) is that it is among the first studies that
seek to find determinants of piracy in international data. Much of the available research
on determinants of software piracy is based upon the work done in this paper by Marron
and Steel. The work done by Marron and Steel (2000) consist initially of a series of
univariate regressions with each independent variable by itself to explain the dependent
variable, piracy rate. Each of the univariate regressions finds negative relationships
between each independent variable and piracy. Following the univariate regressions are

18
five multivariate regressions. The multivariate regressions indicate that the negative
relationships of each variable are robust across all specifications though in some
specifications the variables are not statistically significant. Additional findings of Marron
and Steel (2000) are that the inclusion of regional dummy variables is statistically
significant for Europe and the Middle East in two of the specifications. The significance
of these regional variables may be representative of an omitted variable that these regions
share in common and which contributes to higher rates of software piracy such as social
or economic factors that are unique to the area and that contribute to piracy rates. The
key finding from this work is that countries with higher levels of intellectual property
protection and higher levels of income have lower levels of piracy. Additionally, cultural
influences play an important role in piracy rates as countries with more individualistic
tendencies have lower rates of piracy than those with collectivist tendencies.
2.3. Panel Data Analysis
Andrés (2006) is among the first studies to use panel data to determine software
piracy rates. His research focuses upon 23 nations in Europe and seeks to determine the
role that copyright software protection plays in reducing piracy rates. He includes data
from three different years, 1994, 1997 and 2000. Given the slow changing nature of
some of the variables used, such as the property rights index and secondary school
enrollment, his choice of years allows for greater change to take place between each
observation. He includes just five explanatory variables, a stark contrast to the 21 used in
the cross-sectional study conducted by Goel and Nelson (2009). The other included

19
variables are: GDP, research and development expenditures, and the percentage of a
nation’s exports to the United States. Although some explanatory power is lost due to the
decreased number of variables in comparison, the model used by Andrés (2006) still
produces reliable and meaningful results because of the ability to control for country
fixed effects across European nations. He also employs a model that differs from the
others as he includes the natural logarithm of piracy rate as the dependent variable as
opposed to just the piracy rate. He also includes a squared term of the natural logarithm
of GDP, another indication of the non-linear relationship of ln(GDP) with piracy rates.
Bezmen and Depken (2005) also utilize panel data regression analysis. The
purpose of their research is to use piracy rates as an independent variable in determining
economic development. The theory behind this connection is that software piracy is a
sign of weak enforcement of intellectual property rights and better enforcement of
intellectual property rights encourages individuals and business to create and innovate
more. This additional creation and innovation then leads to economic development. An
important distinction between this study and the many others in the body of literature is
the use of the human development index (HDI), a composite index of many factors that
lead to improving life in each country. Among the components of HDI are gross national
income per capita, life expectancy, mean years of schooling, and expected years of
schooling. The argument in using the HDI is that income levels alone do not give a full
picture of economic development within a country since economic well-being
encompasses more than a single measure of income. In response to potential endogeneity
issues, Bezmen and Depken (2005) use instrumental variables to explain piracy rates and

20
then use piracy rates as one of three variables to explain the HDI. The data consists of an
unbalanced panel for 77 countries in 1995, 2000 and 2002 totaling 198 observations. The
results of the two stage least squares regression is a statistically significant and negative
relationship between the instrumented piracy and HDI.
A separate study by Bezmen and Depken (2006) focuses on socio-economic
influences of piracy rates in a panel data regression. Similar to their work in 2005 for the
first stage of the two stage least squares regression, variables such as income and freedom
are used. However, the panel data for this study are for the fifty US states and not
country-level. The panel data spans three years - 1999-2001. Also included in the panel
analysis are unemployment, tax burdens, and year fixed effects. As with other studies,
income has a negative relationship with piracy in the regression and the sign remains the
same across six specifications though not always statistically significant. Interestingly,
higher tax burdens influence piracy in a negative way across all specifications and are
statistically significant in OLS and random effects models. Only in the fixed effects
models is tax burden insignificant.
2.4. Conclusion
This thesis follows in a similar manner to the cross-sectional and panel data
literature in an attempt to find determinants of piracy using international data. However,
the strengths and weaknesses of the current body of literature influence the decisions of
model-selection for this research. Many of the studies done using cross-sectional data
have failed to use consistent data. For example, the data set may contain variables from a

21
different year or averaged using mismatched years from the other included variables.
While in some cases this may not prove to bias the results, some of the potential variables
may change enough from year to year that this practice can provide less clear results.
Instead, data will have matching time periods and panel data techniques will be used in
an effort to provide more explanatory power to the model versus cross-sectional data.
Additionally, the independent variables chosen will incorporate the ideas from each of
these past studies in an attempt to have a sounder theoretical basis for the choices made in
the model.

22
Chapter 3
DATA SUMMARY
3.1. Summary Statistics
Table 3.1 presents the descriptive statistics of the variables collected. The data
used in this analysis spans 105 countries from the years 2006 through 2009 and includes
variables for piracy rate, Internet use, broadband use, real per capita GDP (rGDP), an
index of intellectual property rights (IPR), an index for human development (HDI), a
measure of income inequality (Gini), and an index for rule of law (ROL). Additionally,
country and time fixed effects will be included in the analysis to control for unobserved
country and time effects. A discussion of quantitative variables appearing in the
regression follows.
Table 3.1. Descriptive Statistics Variable Observations Mean Std. Dev. Min Max
piracy 361 0.5886 0.2144 0.20 0.95rGDP 346 10,932.61 12,456.46 374.98 56,624.73
IPR 361 5.2828 1.8829 1.8 8.8broadband 349 0.1124 0.1111 0.0001 0.4119
Internet 361 0.3889 0.2643 0.0029 0.9346HDI 352 0.7270 0.1424 0 0.937Gini 293 0.3942 0.0982 0.247 0.630ROL 259 0.3222 1.0211 -1.81 2.04
The dependent variable, piracy, is the measured rate of business software piracy
for each country in each year between 2006 and 2009. Additional years are available but
not included here due to large numbers of missing observations among the independent
variables prior to 2006. The survey includes more than 100 countries ranging from
developed to developing economies. However, due to missing data in select years the
23
number of country observations in a given year range from 67 in 2006 to 102 in 2009.
The unbalanced data provide for up to 361 observations dependent on which of the
independent variables are included in each regression model. These data are collected as
part of an annual survey conducted by the Business Software Alliance (BSA), a trade
group organization that is largely responsible for international software piracy research.
The calculation used by the BSA is the number of unlicensed software packages installed
divided by the total number of software packages installed. This variable can be between
zero (when no piracy is present, 0%) and one (when all software is pirated, 100%),
although in the sample used in the analysis the minimum observed value is 0.2 (The
United States in 2007-2009) and the maximum is 0.95 (Georgia in 2009). The mean is
0.5886 with a standard deviation of 0.2144. Following is an excerpt from the most recent
report by the BSA covering 2009 data, released in May of 2010, explaining the
methodology used by International Data Corporation (IDC) in gathering data for
calculating the piracy rate (Business Software Alliance 2010):
“For the study, IDC used proprietary statistics for software and hardware shipments gathered through surveys of vendors, users and the channel, and enlisted IDC analysts in 60+ countries to review local market conditions. With ongoing coverage of hardware and software markets in 100+ countries, and with sixty percent of its analyst force outside the United States, IDC has a deep and broad information base from which to assess the market and estimate the rate of PC software piracy around the world.”
As referenced in the excerpt, IDC is the business that has conducted the survey on behalf
of the BSA since 2003. During the years 1994 to 2002, the International Planning and
Research Corporation conducted similar research for the Business Software Association.

24
Much of the earlier literature on piracy use this data but because of the change in
businesses directly involved in collecting and processing the data, results may vary from
the currently available piracy rate time series.
The independent variables are: Internet use, broadband use, real per capita GDP,
the index of intellectual property rights, the human development index, the Gini
coefficient, and the rule of law index. Internet use is the number of persons within each
country that have access to the Internet divided by the total population. These data are
available from the International Telecommunications Union (ITU), an organization
associated with the United Nations, from 1999 until 2009 though as mentioned only
2006-2009 data are used. This variable can take on values between zero and one,
representing the ratio of persons with Internet access to the population. Similarly,
broadband use data are collected from the ITU, available from 1999 until 2009 but again
only 2006-2009 data are used, and can take on values between zero and one and
represents the ratio of persons with broadband Internet access to total population. The
minimum values of Internet and broadband are 0.0029 and 0.0001 respectively. The
maximums are 0.9346 and 0.4119 and the means are 0.3889 and 0.1124. The standard
deviations of 0.2643 and 0.1111 suggest that there exist large variances in the availability
and use of the Internet and broadband access. Many of the nations that have the highest
rates of Internet and broadband penetration are the advanced economies in Europe, Asia
and North America. Alternatively, many of the nations that continually have the lowest
rates of Internet and broadband penetration are the under-developed or developing
nations found in South America, Africa and Asia.

25
Real per capita GDP (rGDP) measures the gross domestic product per capita for
each country converted to U.S. dollars using purchasing price parity and adjusted for
inflation to 2000 dollars. rGDP data are taken from the World Bank for nearly all of the
countries included in the BSA’s survey of software piracy. Those countries present in the
BSA data but do not have rGDP available from the World Bank have been excluded. The
rGDP data are available from 1960 through 2009 even though data used for this analysis
only spans 2006 through 2009. For the regression analysis GDP is transformed into
natural logarithms. This transformation allows for analysis of the effect of percentage
changes in GDP on piracy rates.
The index of intellectual property rights (IPR) is designed to quantify the level of
intellectual property rights and their enforcement within each country. The index is
calculated by the Property Rights Alliance. This alliance is an American advocacy group
founded on the intent to protect physical and intellectual property rights domestically and
internationally. IPR is a component of the larger property rights index compiled each
year and published in the “International Property Rights Index” report.
The IPR index combines three indices into a final index. The three input indices
are intellectual property protection, patent protection, and copyright piracy level. The
intellectual property protection index is a survey asking participants to rank intellectual
property protection and anti-counterfeiting measures within their own country in terms of
the laws and enforcement of those laws on a scale of one (worst) to seven (best). The
Property Rights Alliance then rescales this index to be between one and ten for the
computation of the IPR. Patent protection is a ranking based upon many elements of

26
patents on a scale of one (worst) to five (best). This index is also rescaled to be between
one and ten before being included in the IPR. Finally, copyright piracy level is part of
the Special 301 annual review process by the International Intellectual Property Alliance
and is measured as a percentage.
The IPR index ranges in values between zero and ten. Ten represents very
complete and well-enforced intellectual property rights while zero represents incomplete
and ill-enforced intellectual property rights. In the sample used from 2006 to 2009, the
minimum value of 1.8 is calculated for Armenia in 2007 and 2008 and also for Georgia in
2009. The maximum value of 8.8 is calculated for Germany in 2006. In general, the
lower values of the index are seen in developing nations in South America, Africa and
Asia while most of the higher values of the index are observed in advanced economies in
North America, Europe and Asia. The mean value of IPR is 5.2828 and suggests that the
average country in the sample has neither fully complete nor incomplete property rights.
The human development index (HDI), a multi-dimensional composite index, uses
components to capture human development in each country and is compiled and
published by the United Nations each year. The index consists of three dimensions of
human development: health, education, and living standards. Life expectancy is used to
approximate health standards. Mean years of schooling and expected years of schooling
are used to approximate education standards. Gross national income per capita is used to
approximate living standards. Although these measures are not perfect for measuring
human development, as realistically human development encompasses more than four
components, they are relatively easily accessible information that can be used to get a

27
clearer outlook of conditions within each country. The HDI values are between zero and
one, zero being associated with very low levels of human development and one being
associated with very high levels of human development. The minimum value of zero is
from Zimbabwe in 2008 with the next lowest value of 0.118 also in Zimbabwe in 2009.
The maximum value of the HDI is 0.937 from Norway in 2007, 2008, and 2009. Much
like the Internet and broadband variables, most of the highest values of HDI are found in
advanced economies in Europe, North America, and Asia while many of the lowest
values of HDI are observed in under-developed economies.
The Gini coefficient is a statistical measure of income inequality originally
created by Corrado Gini (Gini 1921). The Gini coefficient is compiled and published by
the United Nations each year. The coefficient measures the difference in the income
levels of the five-quintile shares from a perfectly equitable distribution. The equitable
distribution is that which has the poorest quintile earning 20% of total income while the
wealthiest quintile also has a 20% share of total income and likewise for the remaining
quintiles. In this perfect case of equality there is no difference in income and the Gini
coefficient would measure zero while a completely inequitable distribution would mean
that the wealthiest quintile earns all of the income and would be associated with a Gini
coefficient of one. All other values of the coefficient would fall between zero and one.
Lower values of the coefficient means more equitable distributions of income are present.
Denmark in 2007-09 has the lowest Gini coefficient of 0.247. The highest coefficient of
0.630 is observed in Botswana in 2007. Once again, the Gini coefficients are generally
grouped similarly to the Internet, broadband and HDI variables. The lowest variables are

28
generally in advanced economies while the higher values are found in under-developed
and developing nations.
Rule of law (ROL) is the final independent variable and it is an index that has
been commonly used in other research studies concerning software piracy. The index is
compiled and published by the World Bank each year in an ongoing series of working
papers, most recently updated in 2009 by Kaufmann et al. (2009). From the latest update
from this paper, the authors state that the rule of law is:
“capturing perceptions of the extent to which agents have confidence in and abide by the rules of society, and in particular the quality of contract enforcement, property rights, the police, and the courts, as well as the likelihood of crime and violence.”
The index can range from -2.5 to 2.5 with larger numbers indicative of better conditions.
The minimum value of rule of law is -1.81 and is observed in Zimbabwe in 2008. The
maximum value is 2.04 and is observed in Denmark in 2007. The rule of law index
currently is only available through 2008 as the most recent report was released in 2009.
As a result of this, use of the index will limit the available observations for panel
regression analysis; especially considering that piracy rates are most abundantly available
in 2009. Once again, as with earlier measures of economic and human development,
many of the highest values of rule of law are found in advanced economies while under-
developed and developing economies typically have the lowest observed values of rule of
law.
29
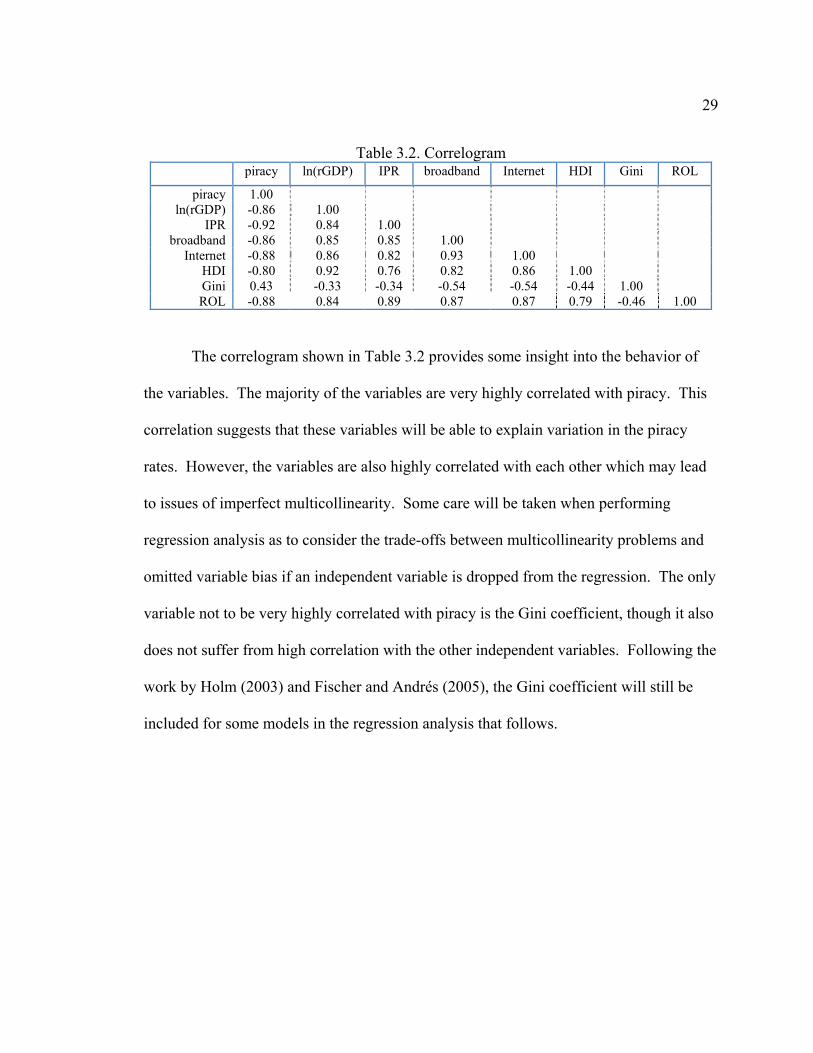
Table 3.2. Correlogram piracy ln(rGDP) IPR broadband Internet HDI Gini ROL
piracy 1.00 ln(rGDP) -0.86 1.00
IPR -0.92 0.84 1.00 broadband -0.86 0.85 0.85 1.00
Internet -0.88 0.86 0.82 0.93 1.00 HDI -0.80 0.92 0.76 0.82 0.86 1.00 Gini 0.43 -0.33 -0.34 -0.54 -0.54 -0.44 1.00 ROL -0.88 0.84 0.89 0.87 0.87 0.79 -0.46 1.00
The correlogram shown in Table 3.2 provides some insight into the behavior of
the variables. The majority of the variables are very highly correlated with piracy. This
correlation suggests that these variables will be able to explain variation in the piracy
rates. However, the variables are also highly correlated with each other which may lead
to issues of imperfect multicollinearity. Some care will be taken when performing
regression analysis as to consider the trade-offs between multicollinearity problems and
omitted variable bias if an independent variable is dropped from the regression. The only
variable not to be very highly correlated with piracy is the Gini coefficient, though it also
does not suffer from high correlation with the other independent variables. Following the
work by Holm (2003) and Fischer and Andrés (2005), the Gini coefficient will still be
included for some models in the regression analysis that follows.
30
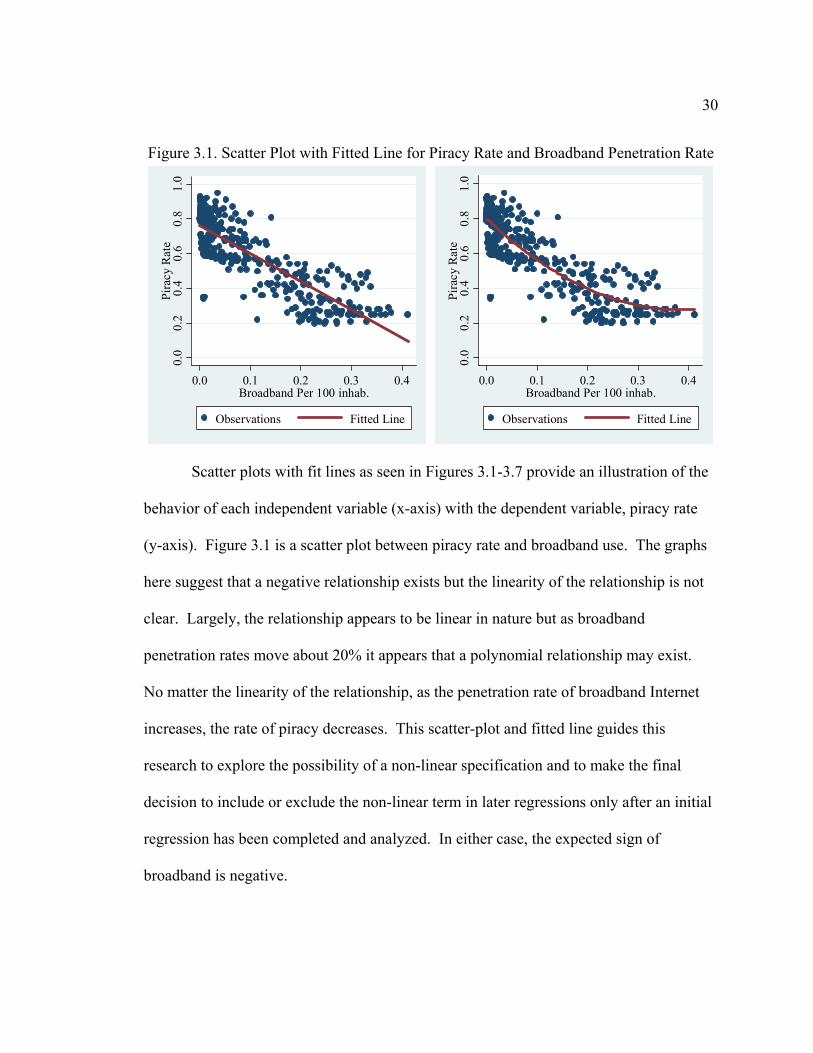
Figure 3.1. Scatter Plot with Fitted Line for Piracy Rate and Broadband Penetration Rate
0.0
0.2
0.4
0.6
0.8
1.0
Pir
acy
Rat
e
0.0 0.1 0.2 0.3 0.4Broadband Per 100 inhab.
Observations Fitted Line
0.0
0.2
0.4
0.6
0.8
1.0
Pir
acy
Rat
e
0.0 0.1 0.2 0.3 0.4Broadband Per 100 inhab.
Observations Fitted Line
Scatter plots with fit lines as seen in Figures 3.1-3.7 provide an illustration of the
behavior of each independent variable (x-axis) with the dependent variable, piracy rate
(y-axis). Figure 3.1 is a scatter plot between piracy rate and broadband use. The graphs
here suggest that a negative relationship exists but the linearity of the relationship is not
clear. Largely, the relationship appears to be linear in nature but as broadband
penetration rates move about 20% it appears that a polynomial relationship may exist.
No matter the linearity of the relationship, as the penetration rate of broadband Internet
increases, the rate of piracy decreases. This scatter-plot and fitted line guides this
research to explore the possibility of a non-linear specification and to make the final
decision to include or exclude the non-linear term in later regressions only after an initial
regression has been completed and analyzed. In either case, the expected sign of
broadband is negative.

31
Figure 3.2. Scatter Plot with Fitted Line for Piracy Rate and Internet Penetration Rate
0.0
0.2
0.4
0.6
0.8
1.0
Pir
acy
Rat
e
0.0 0.2 0.4 0.6 0.8 1.0Internet Per 100 inhab.
Observations Fitted Line
Figure 3.2 shows the relationship of piracy rate with Internet. As with broadband, there
is a negative relationship between the two variables. However, there does not appear to
be the possibility of a polynomial relationship. The scatter plot is much more clearly
defined by a linear relationship.
Figure 3.3. Scatter Plot with Fitted Line for Piracy Rate and ln(rGDP)
0.0
0.2
0.4
0.6
0.8
1.0
Pir
acy
Rat
e
6 7 8 9 10 11Natural Log of rGDP Per Capita
Observations Fitted Line
0.0
0.2
0.4
0.6
0.8
1.0
Pir
acy
Rat
e
6 7 8 9 10 11Natural Log of rGDP Per Capita
Observations Fitted Line
32
Figure 3.3 illustrates the relationship between piracy rate and ln(rGDP). Once again, the
data seem to show a negative relationship. As with broadband the linearity of the
relationship is not clear. The scatter plot suggests that either a linear relationship or a
polynomial relationship may be present between piracy and the natural log of GDP per
capita. This relationship will be explored further when considering models as the
available literature supports both possibilities.
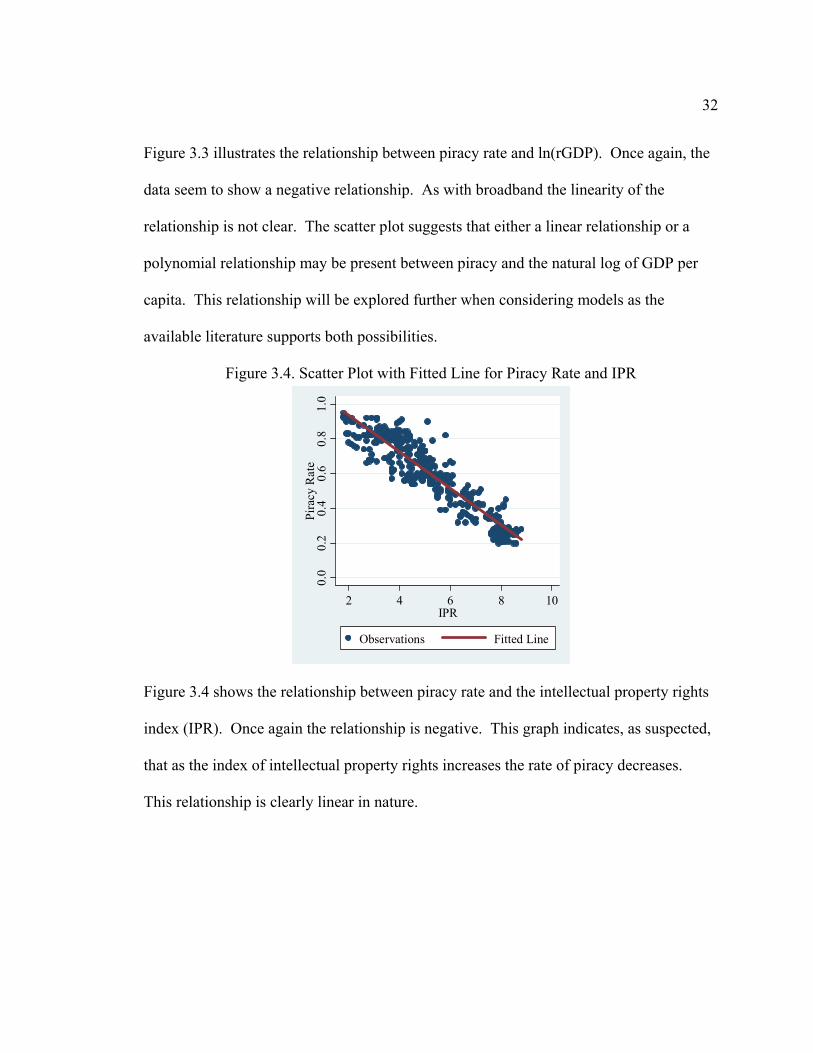
Figure 3.4. Scatter Plot with Fitted Line for Piracy Rate and IPR
0.0
0.2
0.4
0.6
0.8
1.0
Pir
acy
Rat
e
2 4 6 8 10IPR
Observations Fitted Line
Figure 3.4 shows the relationship between piracy rate and the intellectual property rights
index (IPR). Once again the relationship is negative. This graph indicates, as suspected,
that as the index of intellectual property rights increases the rate of piracy decreases.
This relationship is clearly linear in nature.

33
Figure 3.5. Scatter Plot with Fitted Line for Piracy Rate and HDI
0.0
0.2
0.4
0.6
0.8
1.0
Pir
acy
Rat
e
0.0 0.2 0.4 0.6 0.8 1.0HDI
Observations Fitted Line
0.0
0.2
0.4
0.6
0.8
1.0
Pir
acy
Rat
e
0.0 0.2 0.4 0.6 0.8 1.0HDI
Observations Fitted Line
Figure 3.5 illustrates the relationship between piracy and the Human
Development Index. As with the other variables the correlation is negative. Lower rates
of piracy, under 60%, seem to be linear but higher rates of piracy are not as clearly linear
even after adjusting for the three outliers with very low values of HDI.
Figure 3.6. Scatter Plot with Fitted Line for Piracy Rate and Gini
0.0
0.2
0.4
0.6
0.8
1.0
Pir
acy
Rat
e
0.2 0.3 0.4 0.5 0.6Gini
Observations Fitted Line
0.0
0.2
0.4
0.6
0.8
1.0
Pir
acy
Rat
e
0.2 0.3 0.4 0.5 0.6Gini
Observations Fitted Line

34
Figure 3.6 illustrates the relationship between the piracy rate and the Gini
coefficient. The Gini coefficient graphs are unique from the other independent variables
in that the relationship is positive instead of negative. This suggests that as the income
inequality grows that piracy should increase. The work by Fischer and Andrés (2005)
suggests that the Gini coefficient could influence piracy rates either negatively or
positively. Their work found that the choice of subsamples of countries chosen by region
would lead to differing results with regard to the relationship between piracy rates and the
Gini coefficient. Another difference between this graph and the previous graphs is that
the scatter plot is less concentrated and as such makes the determination between a linear
and a polynomial relationship more difficult to isolate. This is expected though because
of the lower correlation with piracy rates. Both cases will be investigated further.
Figure 3.7. Scatter Plot with Fitted Line for Piracy Rate and ROL
0.0
0.2
0.4
0.6
0.8
1.0
Pir
acy
Rat
e
-2 -1 0 1 2Rule of Law
Observations Fitted Line
Figure 3.7 is a scatter plot of piracy rates and the rule of law index. The
relationship between the two is negative and looks to be primarily linear in nature. The

35
negative relationship makes sense as piracy rates are expected to decline when the legal
systems are better established and more far reaching. This presents to the citizens of the
country that crimes of piracy can and will be punished, a strong deterrent from
participating in the activity.
3.2. Proposed Regression Analysis and Expected Results
The collected data allows the analysis to consider panel data techniques. The
estimation procedure is able to control for fixed effects across countries, time (years), or
both together. Theory suggests that fixed effects will provide a better model because of
the varying social, political and economic characteristics that are observable and
unobservable within each nation and time period. Regressions will include Internet,
broadband, IPR, ln(rGDP), HDI, Gini coefficient, rule of law, time fixed effects, country
fixed effects, and two-way fixed effects.
Following estimation of an ordinary least squares specification, additional models
are estimated including a time fixed effects model, a country fixed effects model, a time
and country fixed effects model, a random effects model, and models excluding selected
independent variables. A random effects model is estimated to test whether the fixed
effects are systematically different or just randomly different from country to country. F-
tests will be conducted on the time and country coefficients to determine if they explain
variation in piracy rates. A Hausman test is also conducted to determine if the fixed
effects model is preferred to the random effects model.
36
The signs on the coefficients for Internet, broadband, the natural log of GDP,
HDI, and rule of law should all be negative after regression analysis. The previous
correlogram and scatter plots indicate that this is the relationship that all the independent
variables share with the dependent variable. Earlier research from Goel and Nelson
(2009) suggest that the broadband penetration rates and Internet penetration rates are
negatively correlated with the piracy rate. However, it seems possible that if the proper
controls are in place that increased Internet availability and increased broadband
availability would lead to increased rates of piracy due to the decreasing cost and
difficulty of transferring pirated software great distances. For this reason, there may be
an omitted variable that is correlated with Internet and broadband penetration rates that
would be significant enough to change the signs on these coefficients. The expected sign
of the Gini coefficient is the only one that should be positive.

37
Chapter 4
EMPIRICAL ANALYSIS
The empirical model is shown in equation (4.1). Where piracyit is the rate of
piracy in country i during year t, αit represents the constant for country i and year t,
Internetit is the Internet penetration rate of country i in year t, broadbandit is the
broadband penetration rate of country i in year t, ln(rGDPit) is the natural log of real GDP
for country i in year t, IPRit is the intellectual property rights index for country i in year t,
HDIit is the human development index in country i in year t, Giniit is the Gini coefficient
of country i in year t, ROLit is the rule of law index of country i in year t, and εit is the
standard error term in regression analysis.3
(4.1) piracyit = αit + β1Internetit + β2broadbandit + β3broadbandit2 + β4ln(rGDPit) +
β5ln(rGDPit)2 + β6IPRit + β7HDIit + β8HDIit
2 + β9Giniit + β10Giniit2 + β11ROLit + εit
4.1 Ordinary Least Squares Regression
The results of the preliminary ordinary least squares regressions can be seen in
Table 4.1. The ordinary least squares regressions represent pooled OLS regressions since
the variables are part of a panel data set. By starting with OLS prior to panel regression
techniques, a better understanding of the independent variables relationship with the
dependent variable can be understood beyond the presentation in the data summary
chapter. Using this information influences the models used in the next section, which
3 A model using ln(HDIit) and ln(HDIit)
2 in place of HDIit and HDIit2 was also initially run to compare the
results of a logarithmic specification of this variable but the standard polynomial specification was found to provide a model with more explanatory power and is therefore presented here.

38
employs panel data regression techniques.
Table 4.1. Ordinary Least Squares Regression Results Variable 1 2 3 4
Internet -0.2496*** (0.6780)
-0.2536*** (0.0676)
-0.2143*** (0.0497)
-0.1964*** (0.0484)
broadband 0.2745 (0.2915)
0.3953*** (0.1288)
0.3606*** (0.1020)
0.2795*** (0.1048)
broadband2 0.2784 (0.5597)
-
-
-
ln(rGDP) -0.1200 (0.0863)
-0.1296 (0.0866)
-0.1848** (0.0762)
-
ln(rGDP)2 0.0052 (0.0048)
0.0057 (0.0048)
0.0089** (0.0042)
-
IPR -0.0705*** (0.0085)
-0.0707*** (0.0084)
-0.0737*** (0.0060)
-0.0822*** (0.0053)
HDI 1.5868*** (0.5349)
1.6512*** (0.5506)
1.8000*** (0.4565)
0.1551 (0.1334)
HDI2 -1.1550*** (0.3876)
-1.2167*** (0.3989)
-1.3085*** (0.3298)
-0.3033** (0.1347)
Gini 1.2486** (0.4981)
1.2050** (0.4897)
1.2052*** (0.4045)
1.0560*** (0.3937)
Gini2 -1.2782** (0.5933)
-1.2217** (0.5792)
-1.2214** (0.2180)
-1.1212** (0.4555)
ROL 0.0029 (0.0149)
0.0030 (0.0148)
-
-
Constant 0.8572*** (0.2557)
0.8889*** (0.2504)
1.0723*** (0.2180)
0.8952*** (0.0880)
Observations 181 181 267 278 Adjusted R2 0.9029 0.9033 0.9107 0.9046
Robust standard errors are in parentheses. Level of significance: * is 10%, ** is 5%, and *** is 1%.
Regression number one in Table 4.1 includes each of the variables in the dataset
and each of the relevant polynomial terms as decided in Chapter 3. As can be seen in the
table, the results of this pooled OLS regression show that six of the 11 independent
variables are significant at either the five percent or one percent level of significance.
The questionable terms here are broadband and its polynomial term, ln(rGDP),
ln(rGDP)2, and ROL. An F-test for broadband and broadband2 produces an F-value of
5.12 and a p-value of 0.0070. This test suggests that the coefficient for one of these terms

39
is not equal to zero though the current specification results is not statistically significant
coefficients. This suggests broadband has a linear relationship with piracy rates. Using
these facts in conjunction with the doubt presented in Chapter 3 regarding the linearity of
broadband, broadband2 is removed from further specifications.
The next OLS regression includes all of the previous variables except for the non-
linear term for broadband. The adjusted R2 increases slightly from 0.9029 to 0.9033.
Despite decreasing the number of independent terms, the number of significant
coefficients increases to a total of eight from the previous seven, as in regression one.
Again each of these coefficients is significant at either the five percent or the one percent
level. The remaining variables that continue to be insignificant are ln(rGDP), ln(rGDP)2,
and ROL. Given the nature of the IPR and ROL, it is possible that these two variables
suffer from imperfect multicollinearity. Additionally, the availability of data for ROL is
more limited than the remaining variables and has restricted the number of observations
to only 181, which limits the reliability of the model due to a relatively small number of
observations. Due to the limited availability, potential multicollinearity, and seemingly
empirical evidence of that multicollinearity ROL will be excluded from subsequent
regressions.
The third OLS model results in another improvement in terms of adjusted R2 and
statistical significance of the included variables. The adjusted R2 has increased to 0.9107
and now each remaining coefficient is statistically significant at the five percent level.
Additionally, the number of observations included in the regression has increased to 267
allowing for more information to be included in regression analysis. Though each

40
coefficient is statistically significant, the signs for ln(rGDP) and ln(rGDP)2 term
contradict available literature and theory. The results here suggest that as real GDP per
capita increases, piracy will decrease. However, as real GDP per capita grows larger,
piracy rates will decrease at a decreasing rate. These results contradict the micro theory
of limited liability in the pirate software markets of Chang et al. (2008) and the empirical
results found in Fischer and Andrés (2005). Instead, these studies suggest the opposite
relationship exists, where increasing GDP per capita initially increases but begins to
decrease as GDP per capita becomes increasingly large. These results, though
statistically significant, are likely the results of multicollinearity with HDI as seen in
chapter 3. The human development index uses gross national income per capita as one of
the included components.
Excluding GDP per capita from regression four leads to mixed results. The
number of included observations increases to 278, providing more information for
regression analysis. All the coefficients are statistically significant at the five percent
level except for HDI and each coefficient has the expected sign. However, a decreased
adjusted R2 does suggest a small amount of explanatory power has been lost in the model
by removing GDP per capita though the adjusted R2 of 0.9046 is higher than all
regressions thus far except for regression three.
4.2 OLS Results Interpretation
The results of the four OLS regressions provide robust results for most of the
included variable coefficients. In each regression Internet is negative and statistically
41
significant at the one percent level. Increased Internet access within a country leads to
decreased piracy. In contrast to Internet, increased broadband usage leads to higher rates
of piracy and is also robust across all specifications though it was not significant in the
first regression, which included a non-linear specification for broadband. The difference
between the two can be reconciled by understanding the nature of the types of Internet
access. The empirical results show that increased Internet access, inclusive of all types,
leads to lower piracy rates. Increasing Internet access rates are likely a sign of an
economy that is growing and a society that is developing. It is not hard to imagine that
the connectivity provided by the Internet also leads to more open communication and
new avenues of commerce in which to obtain software legally. However, the increased
bandwidth that comes with broadband Internet access greatly expands the ease of trading
files and lowers the costs of transferring those large files from one computer to another,
even across vast distances.
As mentioned previously in the results, the coefficients on ln(rGDP) and
ln(rGDP)2 are contrary to theory and prior empirical results though here they are robust
across all specifications and even statistically significant in one of the specifications,
regression three. Due to the contrary results of GDP per capita and the likely
multicollinearity with HDI, ln(rGDP) nor ln(rGDP)2 will not be used in the upcoming
panel regression analysis.
The coefficients for IPR are robust and significant across all specifications. The
sign for IPR is negative as expected. Since IPR is the variable for intellectual property
rights enforcement, it is expected that increased enforcement of property rights will lead

42
to lower rates of piracy. In each successive regression, the coefficient on IPR only
becomes more significant. This is a sign that some of the variables removed are
imperfectly multicollinear with IPR such as ROL and ln(rGDP).
Gini and HDI in each regression are also robust across all specifications.
Additionally, only HDI is not statistically significant in one regression but the HDI2 term
is still significant in that same regression (regression four). The sign of the coefficients
also match expected results as piracy is expected to initially rise with HDI as computer
ownership would be expected to be very low with low values of HDI thus not allowing
people in that country to pirate software at all. As HDI rises, if limited liability is present
then, people would be deterred from engaging in piracy as potential costs grow. Similar
theories can apply for the signs on the Gini. Rising levels of income inequality would
initially increase piracy but eventually piracy rates begin to fall with very high levels of
inequality. Once again, with these high levels of inequality we would expect that many
persons in that country would be unable to own a computer and thus not be able to
engage in piracy.
4.3 Panel Regression
The results of six panel regressions can be seen in Table 4.2. The results from the
OLS regressions in the previous section lead to the initial specifications of panel
regressions. The following variables are included in the first panel regression: Internet,
broadband, IPR, HDI, HDI2, Gini, and Gini2. Additionally, Table 4.2 indicates the type
of panel regression technique used. These panel regressions include fixed effects for

43
time, fixed effects for countries, two-way fixed effects, and random effects.
The first panel regression (overall regression number five) includes only time
fixed effects. In this regression, each coefficient is statistically significant except for
HDI. The sign of each coefficient matches previous results from the OLS regressions
and the adjusted R2 increases from the final OLS regression of 0.9046 to 0.9048.
However, an F-test of the time fixed effects variables results in a p-value of 0.2985, so
the null hypothesis of at least one of the time dummy variables not being equal to zero
cannot be rejected and results in the conclusion that time fixed effects are not present in
the panel data.
The next panel regression includes country fixed effects instead of time fixed
effects. Including the country fixed effects increases the adjusted R2 to 0.9983.
However, the statistical significance of the coefficients suffers from the inclusion of
country fixed effects though conducting an F-test for the validity of country effects
returns an F-value of 2,885.05 and a p-value of 0.0000. The results of the F-test indicate
that country effects are valid and should be included in the model specification. Only
two variables are now statistically significant, broadband and HDI2. Compared to the
final pooled OLS regression, this is a decrease of four variables that are statistically
significant. After controlling for country effects, broadband has changed signs but is still
significant and the coefficients on HDI and HDI2 have also changed signs though HDI2 is
still significant.
Regression seven includes both time and country effects. Much of the results
appear similar to the country effects model in regression six. The magnitudes of the

44
coefficients has changed and broadband is no longer statistically significant. The
adjusted R2 value does not change from 0.9983. Testing the fixed effects coefficients
using an F-test again results in failure to reject that the time effects are different from
zero with a p-value of 0.5123. The country effects test again allows for rejecting that the
country effects coefficients are equal to zero with a p-value of 0.0000. The results of
these two tests suggest that time effects are not present but that country effects are
present in the data.
Table 4.2. Fixed Effects and Random Effects Regression Results Variable 5 6 7 8 9 10
Internet -0.2075*** (0.0489)
-0.0250 (0.0205)
-0.0183 (0.0222)
-0.0092 (0.0224)
-0.0349* (0.0199)
-0.0350* (0.0197)
Broadband 0.2773*** (0.1064)
-0.1050** (0.0491)
-0.0689 (0.0593)
-0.1516** (0.0647)
-0.1246*** (0.0353)
-0.1244*** (0.0350)
IPR -0.0826*** (0.0054)
-0.0009 (0.0027)
-0.0016 (0.0029)
-0.0122*** (0.0030)
-0.0001 (0.0021)
-
HDI 0.1480 (0.1334)
0.0491 (0.0412)
0.0585 (0.0527)
0.2086* (0.1126)
0.0721** (0.0320)
0.0722** (0.0315)
HDI2 -0.2796** (0.1342)
-0.7129*** (0.1562)
-0.7081*** (0.2117)
-0.8978*** (0.1077)
-0.8163*** (0.1632)
-0.8180*** (0.1572)
Gini 1.0554*** (0.3958)
-0.4338 (0.2945)
-0.3740 (0.3073)
-0.2389 (0.2637)
-
-
Gini2 -1.1015** (0.4555)
0.4390 (0.3144)
0.3622 (0.3310)
0.2691 (0.3024)
-
-
Constant 0.8575*** (0.0918)
1.1940*** (0.0888)
1.1714*** (0.1165)
1.0647*** (0.0770)
1.1416*** (0.0640)
1.1422*** (0.0625)
Observations 278 278 278 278 340 340 Adjusted R2 0.9048 0.9983 0.9983 0.7672 0.9974 0.9974 Robust Error Yes Yes Yes No Yes Yes Time effects Yes No Yes No No No P-value 0.2985 0.5123 Country effects No Yes Yes No Yes Yes P-value 0.0000 0.0000 0.0000 0.0000 Random effects No No No Yes No No
Robust standard errors are in parentheses, except for regression 8, which lists standard non-robust errors. Level of significance: * is 10%, ** is 5%, and *** is 1%. Regression eight uses a random effects model instead of fixed effects as seen in
the previous three regressions. The result of the random effects model is similar to the

45
country effects model only in the sign of the coefficients but the magnitudes have
changed dramatically. Additionally, the random effects model has four statistically
significant coefficients now, compared to only two in the country effects model. The
significant coefficients are broadband, IPR, HDI and HDI2. While the adjusted R2 listed
in Table 4.2 is only 0.7672.
A comparison to the country effects model (regression six) is needed since the
results of the random effects regression (regression eight) appear to be relevant,. The test
available for this comparison is the Hausman test. Conducting a Hausman test on these
two regressions, the null hypothesis of the difference in coefficients not being systematic
can be rejected. The p-value of this test is 0.0000. This indicates that the random effects
model is not the correct specification but rather that including country effects is the
proper model to use.
The introduction of country effects improves the overall explanatory power of the
model but affects the results on the coefficients for Gini and for IPR. Gini is no longer
significant and the sign has changed. The coefficient for Gini is likely no longer
significant as income inequality is relatively constant over time within each country. As
a result, Gini is controlled by the inclusion of country fixed effects. Based on this
finding, regression nine will exclude Gini.
Also, in the earlier pooled OLS regressions the coefficient for IPR was negative
and significant. However, the fixed effects model decreases the magnitude of the
coefficient on IPR and renders it statistically insignificant. Regression ten will exclude
both Gini and IPR. For much the same reason that Gini is excluded, IPR can be excluded

46
when controlling for country fixed effects, as IPR does not vary much from year to year
within a single country, especially when the time period is only four years. Changing
intellectual property rights protection is likely a lengthy process that would require
additional years of data to observe the slow-changing effects.
By removing Gini from the fixed effects regressions, results appear to be more
reliable. Even though the adjusted R2 has dropped slightly from 0.9983 to 0.9974, each
variable is now statistically significant except for IPR. The number of observations has
also increased to 340, as Gini is not available for as many countries as the remaining
variables are. The signs of the coefficients for each variable also match the previous
results of the fixed effects regressions and, except for broadband, the results of the pooled
OLS regressions. An F-test for the time fixed effects once again returns a p-value of
0.0000, reaffirming that fixed effects are appropriately present in the regression.
The final panel regression results in Table 4.2 are largely similar to regression
nine. Since IPR has been removed, all variables are now statistically significant and the
magnitudes and signs match that of previous fixed effects regressions and pooled OLS
regressions, again with the exception of broadband. The adjusted R2 is also unchanged
from regression nine at 0.9974, further suggesting that IPR is accounted for in the fixed
effects of the model and not needed as a separate control variable. Another F-test for the
country fixed effects supports that country fixed effects are correctly accounted for in the
model.
The results of two additional fixed effects regressions are presented in Table 4.3.
Potential omitted variable bias in the pooled OLS regressions presented in the previous

47
section of this thesis may lead to incorrectly rejecting the non-linear specification of
broadband. Additional panel regression analysis is conducted to confirm this. Following
from the results of regression ten in Table 4.2, regression 11 includes Internet,
broadband, broadband2, HDI, HDI2, and two-way fixed effects.
Table 4.3. Fixed Effects Regression Results (Continued) Variable 11 12
Internet -0.0053 (0.0219)
-
Broadband -0.2397** (0.0972)
-0.2514** (0.1001)
broadband2 0.4045** (0.1651)
0.4211** (0.1721)
HDI 0.0223 (0.0536)
0.0225 (0.0540)
HDI2 -0.4376** (0.1903)
-0.4402** (0.1906)
Constant 0.9871*** (0.0740)
0.9871*** (0.0740)
Observations 340 340 Adjusted R2 0.9975 0.9975 Robust Error Yes Yes Time effects Yes Yes P-value 0.0628 0.0389 Country effects Yes Yes P-value 0.0000 0.0000
Robust standard errors are in parentheses. Level of significance: * is 10%, ** is 5%, and *** is 1%.
The results of regression 11 leads to different conclusions than the prior panel
regressions. The inclusion of a non-linear broadband specification leads to Internet
becoming statistically insignificant. Both broadband and broadband2 are statistically
significant at the five percent level. The significance of both terms is a strong indication
that broadband is non-linear in its true relationship to piracy. HDI has lost statistical
significance while HDI2 remains significant at the five percent level. For this reason,
HDI will continue to be specified as non-linear. This specification is the first to reject
48
that the time effects are not statistically different from zero, and it does so at the ten
percent level with a p-value 0.0628. An F-test on country effects gives a p-value of
0.0000 and confirms that the country effects are correctly specified. An improvement in
adjusted R2 values from 0.9974 to 0.9975 is seen from regression ten to 11.
Regression 12 removes Internet from the specification as this variable was not
statistically significant after including a non-linear specification for broadband with fixed
effects. Removal of this insignificant variable leads to little change from regression 11.
The signs and significance of all remaining independent variables remains the same with
only minor changes in magnitude. An F-test for the time fixed effects results in a p-value
of 0.389 while the country effects again have a p-value of 0.0000.
4.4 Panel Regression Interpretation
The signs and magnitudes of the coefficients of the independent variables are
robust across nearly all the panel regression specifications. Internet is negative in each of
the panel regressions with linear specifications of broadband and statistically significant,
as well, once Gini has been removed from the specification. Given the robustness of
Internet access in relation to piracy rates, it appears that increasing access to the Internet
within a country will lead to lower rates of software piracy. Similar results are found for
linear specifications of broadband Internet access once country effects are controlled.
HDI is also robust in its results across all specifications and is statistically significant in
later regressions as well. The results here suggest that increases to HDI lead to
decreasing piracy and it does so at an increasing rate. This relationship is consistent with
49
the theoretical literature as well as the empirical literature when considering that the gross
national income is one of the four components of the index and is very closely related to
gross domestic product, the variable most commonly used in piracy studies to measure
income.
When comparing the fixed effects regressions to the pooled data regressions, the
results are very similar. The addition of fixed effects incorporates the variation in Gini
and IPR and thus explains these variables no longer being statistically significant in the
fixed effects models. The most prominent change in direction from OLS to fixed effects
is broadband. Not only does broadband change signs once country effects are controlled
but it remains statistically significant which suggests that omitted variable bias may be
present in the pooled data regressions but that the omitted variable is incorporated in the
country effects. Based upon these empirical results, increases in Internet and broadband
rates both lead to decreased rates of software piracy despite the faster and less costly
exchange of unlicensed software. The change in the sign and significance of broadband
may be due to omitted variable bias. Of particular interest to piracy rates but not
controlled for in pooled regressions but possibly controlled for in panel regressions is the
availability of software publishers to sell a digital only version of their product directly to
consumers. This direct marketing of digital content may allow for the publisher to reach
a market not easily accessible with a physical product or may simply allow the consumer
to gain easier and quicker access to software products.
The final regressions present broadband as non-linear to correct the omitted
variable bias introduced in both the pooled OLS regressions and the earlier panel

50
regressions. In the pooled OLS, many contributing variables are omitted which are
controlled by including time and country fixed effects in regressions 11 and 12. In the
first set of panel regressions, omitted variable bias is due to the linear specification of
broadband. Once, these biases are corrected for in the final regressions, increased
broadband penetration rates lead to increased rates of piracy at an increasing rate. The
time fixed effects are able to control for international anti-piracy efforts which are
implemented in a given year. These efforts may include fighting piracy by use of legal
systems or by introduction of a licensed version of the software into markets previously
served only by pirates.
51
Chapter 5
CONCLUSION
The emergence of the Internet has been a boon for advancements in
communications and productivity. Along with the positive influences of the Internet is
the ability to trade copyrighted data more freely without a loss of quality. This research
examines the piracy rate of business software applications based on a yearly study
conducted by the Business Software Alliance. The concern is that increased availability
of broadband Internet connections will lead to greater rates of piracy.
A panel data analysis of international rates of piracy helps to determine the effect of
broadband and Internet penetration rates on piracy. The panel data allows for control of
unknown or immeasurable variables present within each country and year. Other control
variables are included to separate the effects of broadband and Internet penetration from
all other influences.
Earlier literature focuses largely on cross-sectional data and large datasets using
many explanatory variables to determine rates of piracy. This thesis instead makes use of
panel data analysis and opts for fewer explanatory variables, as the fixed effects will
control for many variables, which do not change much over time. The focus here is also
much sharper, focusing specifically on the effect of broadband and Internet penetration
rates on software piracy rates, rather than attempting to identify a structural model with
many more explanatory variables as is seen in the literature.
The findings of the regression analysis vary by specification. The findings of the
pooled OLS regressions find that Internet and broadband penetration rates are opposite of

52
each other. As the availability of Internet within a country increases, the rate of piracy
decreases. However, as the availability of broadband Internet connections increases,
piracy also increases. This finding seems plausible as the expansion of broadband
connections worldwide allow for less costly, faster, and easier transfer of pirated software
whereas increased access to dial-up Internet will not dramatically improve the transfer of
pirated software but may be an indicator of a society that is developing. Along with
these developments are likely to be a host of improvements to property rights protections
through both legal means but also changing cultural attitudes.
However, controlling for country effects changes the signs of broadband Internet
penetration rates when specified linearly. In opposition to the pooled OLS regressions,
the fixed effects regressions suggest that as broadband penetration rates increase, the rate
of software piracy decreases. Internet penetration rates still share an inverse relationship
with piracy rates as seen in the pooled OLS regressions. This point is counterintuitive in
that broadband Internet allows for easier distribution of pirated software. The reversal of
the sign on broadband penetration rates from pooled regressions to panel regressions may
result from fundamental differences in the developed countries and their developing
counterparts. These differences are controlled in the panel regressions but not in the
pooled regressions, resulting in differing signs due to the presence of omitted variable
bias in the pooled OLS regressions.
When controlling for time effects, country effects, and specifying broadband as
non-linear a different story emerges. In these models Internet penetration rates become
insignificant but both broadband terms are significant. The coefficients on broadband

53
mean that increases in broadband rates lead to increased piracy and does so at an
increasing rate. This follows the theory that broadband Internet provides a cheap and
easy distribution of pirated digital goods.
The other results of the regression are not surprising. The negative coefficient on
variables such as HDI make theoretical sense as growth in HDI suggests an economy is
developing and often times along with the development is a shedding of past social
values, which may have viewed piracy as an acceptable behavior or a society may have
lacked the means to punish those who engage in the activity.
The negative relationship broadband penetration rates share with the software
piracy rate is seen only in linear specifications of broadband. The linear specification
shows that omitted variable bias is present due to a non-linear relationship being the
correct specification. Omitted variable bias occurs when an important causal variable is
omitted from regression analysis and can affect the signs and significance of the
remaining variables, particularly those that are highly correlated with the omitted
variable.
Further research should focus primarily on the potential problems with this
research such as differences in developed and developing countries. This research failed
to separate the observations into those countries that are developed and those that are
developing. The differences between the two types of countries are likely significant and
may affect the outcomes of the regressions. In order to control for this, use of a slope-
shifting specification can be employed by creating a dummy variable for developed
nations and interacting that variable with the remaining independent variables. This
54
allows for a change in intercept for each country and time by incorporating fixed effects
but also a change in how the independent variables relate to piracy in each of the two
country types.
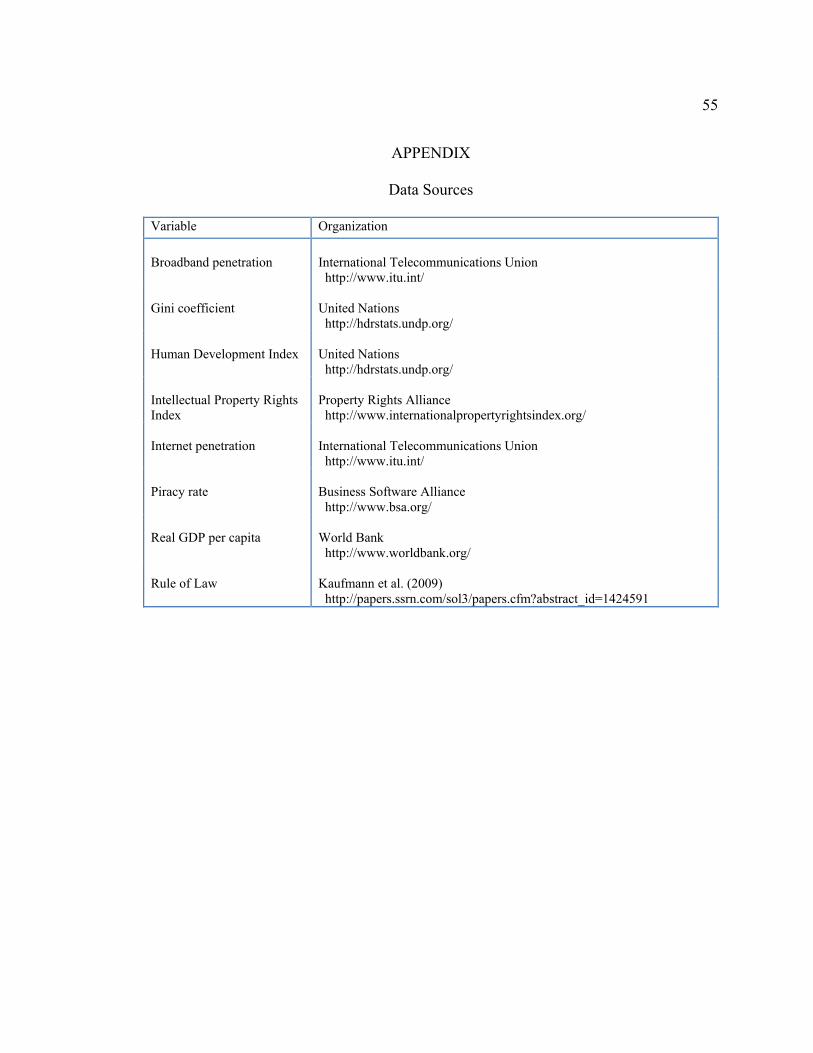
55
APPENDIX
Data Sources
Variable Organization
Broadband penetration International Telecommunications Union http://www.itu.int/
Gini coefficient
United Nations http://hdrstats.undp.org/
Human Development Index
United Nations http://hdrstats.undp.org/
Intellectual Property Rights Index
Property Rights Alliance http://www.internationalpropertyrightsindex.org/
Internet penetration
International Telecommunications Union http://www.itu.int/
Piracy rate
Business Software Alliance http://www.bsa.org/
Real GDP per capita
World Bank http://www.worldbank.org/
Rule of Law
Kaufmann et al. (2009) http://papers.ssrn.com/sol3/papers.cfm?abstract_id=1424591

56
REFERENCES
Andrés, A.R. (2006). The relationship between copyright software protection and piracy:
evidence from Europe. European Journal of Law and Economics, 21, 29-51.
Becker, G.S. (1968). Crime and punishment: An economic approach. Journal of
Political Economy, 76, 169-217.
Becker, G.S., & Stigler, G.J. (1974). Law enforcement, malfeasance, and the
compensation of enforcers. Journal of Legal Studies, 3, 1-19.
Besen, S.M., & Kirby, S.N. (1989). Private copying, appropriability, and optimal
copying royalties. Journal of Law and Economics, 32(2), 255-280.
Bezman, T.L., & Depken II, C.A. (2005). The impact of software piracy on economic
development. Conference paper, Academy of Economics and Finance. Retrieved
February 19, 2011, from
http://citeseerx.ist.psu.edu/viewdoc/download?doi=10.1.1.101.3489&rep=rep1&t
ype=pdf
Bezman, T.L., & Depken II, C.A. (2006). Influences on software piracy: Evidence from
the various United States. Economics Letters, 95, 356-361.
Business Software Alliance (2003). Eighth annual BSA global software piracy study:
Trends in software piracy 1994-2002. Retrieved February 7, 2011 from
http://www.bsa.org/country/Research%20and%20Statistics/Research%20Papers.a
spx.
57
Business Software Alliance (2010). Seventh annual BSA/IDC global software: 09 piracy
study. Retrieved September 8, 2010 from
http://www.bsa.org/country/Research%20and%20Statistics.aspx.
Chang, M.C., Lin, C.F., & Wu, D. (2008). Piracy and limited liability. Journal of
Economics, 95, 25-53.
Cremer, H., & Pestieau, P. (2009). Piracy prevention and the pricing of information
goods. Information Economics and Policy, 21, 34-42.
De Vany, A.S., & Walls, W.D. (2007). Estimating the effects of movie piracy on box-
office revenue. Review of Industrial Organization, 30(4), 291-301.
Depken, C.A., & Simmons, L.C. (2004). Social construct and the propensity for software
piracy. Applied Economic Letters, 11, 97-100.
Fischer, J.A.V., Andrés, A.R. (2005). Is software piracy a middle class crime?
Investigating the inequality-piracy channel. (USG Discussion Paper 2005-18).
Retrieved February 19, 2011, from
http://papers.ssrn.com/sol3/papers.cfm?abstract_id=803244.
Gini, C. (1921). Measurement of Inequality of Incomes. The Economic Journal,
31(121), 124-126.
Goel, R.K., & Nelson, M.A. (2009). Determinants of software piracy: economics,
institutions and technology. The Journal of Technology Transfer, 34(6), 637-658.
Harbaugh, R., & Khemka, R. (2010). Does copyright enforcement encourage piracy?
The Journal of Industrial Economics, 58(2), 306-323.

58
Holm, H.J. (2003). Can economic theory explain piracy behavior? Topics in Economic
Analysis & Policy, 3(1), Article 5, 1-15.
Kaufmann, D., Kraay, A. and Mastruzzi, M. (2009). Governance Matters VIII:
Aggregate and Individual Governance Indicators (World Bank Policy Research
Working Paper 4978). Retrieved February 19, 2011, from
http://papers.ssrn.com/sol3/papers.cfm?abstract_id=1424591.
Kovačić, Z.J. (2007). Determinants of worldwide software piracy. Paper presented at the
InSITE conference Ljubljana, Slovenia. Retrieved February 19, 2011, from
http://proceedings.informingscience.org/InSITE2007/InSITE07p127-
150Kova406.pdf.
Marron, D.B., & Steel, D.G. (2000). Which countries protect intellectual property? The
case of software piracy. Economic Inquiry, 38(2), 159-174.
Piquero, N.L., & Piquero, A.R. (2006). Democracy and intellectual property: Examining
trajectories of software piracy. The ANNALS of the American Academy of
Political and Social Science, 605, 104-127.
Poddar, S. (2005). Why software piracy rates differ – a theoretical analysis (NUS
Working Paper 0515). Retrieved February 19, 2011, from
http://nt2.fas.nus.edu.sg/ecs/pub/wp/wp0515.pdf.
Weng, Y., Yang, C., & Huang, Y. (2009). Intellectual property rights and U.S.
information goods exports: the role of imitation threat. Journal of Cultural
Economics, 33, 109-134.

59
Yang, D., & Sonmez, M. (2007). Economic and cultural impact on intellectual property
violations: A study of software piracy. The Journal of World Trade, 41(4), 731-
750.