International banking statistics, fourth quarter 2010
146
BIS Quarterly Review, June 2011 A1 Statistical Annex The international banking market Introduction to the BIS locational and consolidated international banking statistics ........................................................................................... page A4 1 BIS reporting banks: Summary of international positions ................................................... A7 2 External positions of banks in individual reporting countries .............................................. A8 3 External loans and deposits of banks in individual reporting countries ............................. A16 4 Local positions in foreign currency of banks in individual reporting countries ................... A20 5 Currency breakdown of reporting banks’ international positions ....................................... A24 6 External positions of reporting banks vis-à-vis individual countries .................................. A28 7 External loans and deposits of reporting banks vis-à-vis individual countries ................... A44 8 International positions by nationality of ownership of reporting banks .............................. A60 9 Consolidated claims of reporting banks on individual countries ........................................ A64 10 Signed international syndicated credit facilities by nationality of borrower ..................... A110 Securities markets 11 International debt securities by residence of issuer ........................................................ A113 12 International debt securities by nationality of issuer ....................................................... A114 13 International debt securities by type, sector and currency .............................................. A118 14 International debt securities by residence of issuer ........................................................ A120 15 International debt securities by nationality of issuer ....................................................... A122 16 Domestic debt securities by sector and residence of issuer ........................................... A124 17 Debt securities with remaining maturity up to one year .................................................. A126 18 Announced international equity issues by nationality of issuer ....................................... A128 Derivatives markets 19 Amounts outstanding of over-the-counter (OTC) derivatives by risk category and instrument ..................................................................................... A131 20 Amounts outstanding of OTC foreign exchange derivatives ........................................... A131 21 Amounts outstanding of OTC single-currency interest rate derivatives ........................... A133 22 Amounts outstanding of OTC equity-linked and commodity derivatives .......................... A134 23 Derivative financial instruments traded on organised exchanges by instrument and location ............................................................................................. A136 Notes to tables ........................................................................................................................ A138
-
Upload
raffaeleliguori -
Category
Documents
-
view
130 -
download
0
description
Gli ultimi dati della Banca dei Regolamenti internazionali (giugno 2011) riferiti a dicembre 2010. A pagina 131 ci sono i dati sul mercato dei derivati: è in crescita nel corso degli ultimi due anni!
Transcript of International banking statistics, fourth quarter 2010

BIS Quarterly Review, June 2011 A1
Statistical Annex
The international banking market
Introduction to the BIS locational and consolidated
international banking statistics ........................................................................................... page A4
1 BIS reporting banks: Summary of international positions ................................................... A7
2 External positions of banks in individual reporting countries .............................................. A8
3 External loans and deposits of banks in individual reporting countries ............................. A16
4 Local positions in foreign currency of banks in individual reporting countries ................... A20
5 Currency breakdown of reporting banks’ international positions....................................... A24
6 External positions of reporting banks vis-à-vis individual countries .................................. A28
7 External loans and deposits of reporting banks vis-à-vis individual countries................... A44
8 International positions by nationality of ownership of reporting banks .............................. A60
9 Consolidated claims of reporting banks on individual countries........................................ A64
10 Signed international syndicated credit facilities by nationality of borrower ..................... A110
Securities markets
11 International debt securities by residence of issuer........................................................ A113
12 International debt securities by nationality of issuer ....................................................... A114
13 International debt securities by type, sector and currency.............................................. A118
14 International debt securities by residence of issuer........................................................ A120
15 International debt securities by nationality of issuer ....................................................... A122
16 Domestic debt securities by sector and residence of issuer ........................................... A124
17 Debt securities with remaining maturity up to one year .................................................. A126
18 Announced international equity issues by nationality of issuer ....................................... A128
Derivatives markets
19 Amounts outstanding of over-the-counter (OTC) derivatives
by risk category and instrument ..................................................................................... A131
20 Amounts outstanding of OTC foreign exchange derivatives ........................................... A131
21 Amounts outstanding of OTC single-currency interest rate derivatives........................... A133
22 Amounts outstanding of OTC equity-linked and commodity derivatives.......................... A134
23 Derivative financial instruments traded on organised exchanges
by instrument and location ............................................................................................. A136
Notes to tables ........................................................................................................................ A138

BIS Quarterly Review, June 2011 A3
The international banking market1
Introduction to the BIS locational and consolidated
international banking statistics ........................................................................................... page A4
1 BIS reporting banks: Summary of international positions ............................................ A7
2 External positions of banks in individual reporting countries A In all currencies vis-à-vis all sectors .................................................................................. A8
B In all currencies vis-à-vis the non-bank sector ................................................................. A10
C In foreign currencies vis-à-vis all sectors ......................................................................... A12
D In foreign currencies vis-à-vis the non-bank sector .......................................................... A14
3 External loans and deposits of banks in individual reporting countries A In all currencies vis-à-vis all sectors ................................................................................ A16
B In all currencies vis-à-vis the non-bank sector ................................................................. A18
4 Local positions in foreign currency of banks in individual reporting countries A Vis-à-vis all sectors.......................................................................................................... A20
B Vis-à-vis the non-bank sector........................................................................................... A22
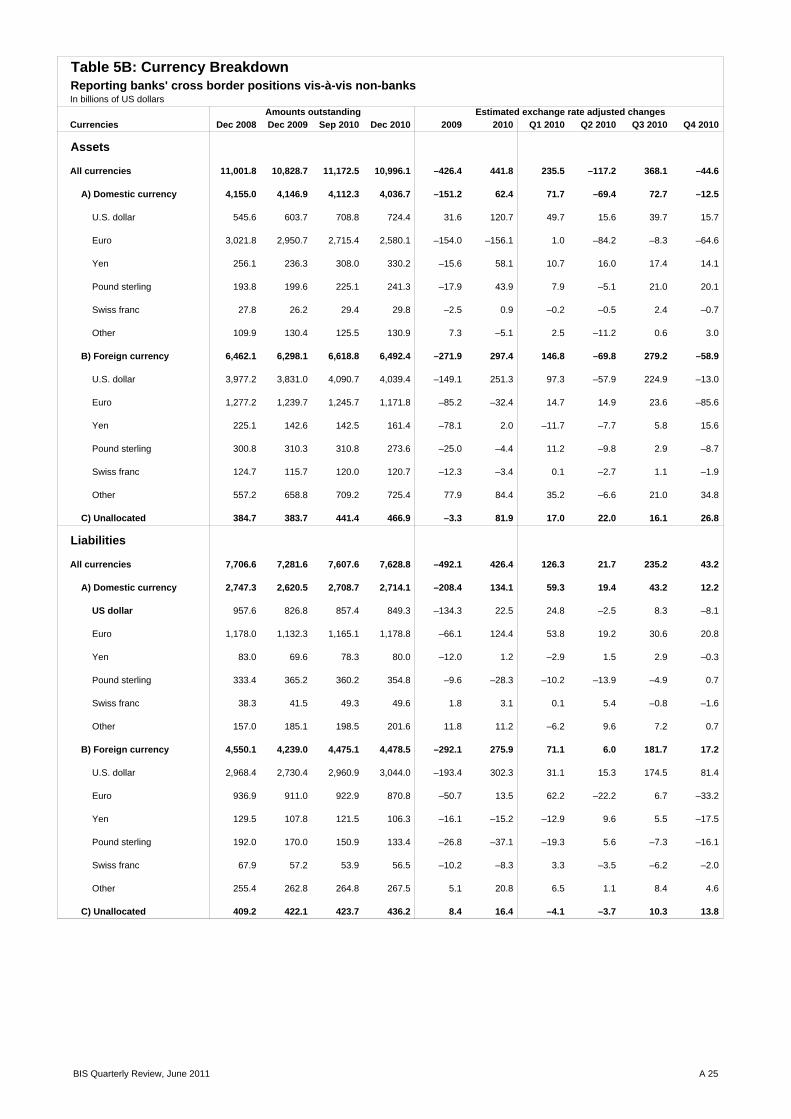
5 Currency breakdown of reporting banks’ international positions A Cross border positions vis-à-vis all sectors ...................................................................... A24
B Cross border positions vis-à-vis the non-bank sector ....................................................... A25
C Cross border positions vis-à-vis official monetary institutions........................................... A26
D Local positions in foreign currency vis-à-vis all sectors and vis-à-vis
the non-bank sector ......................................................................................................... A27
6 External positions of reporting banks vis-à-vis individual countries A Vis-à-vis all sectors.......................................................................................................... A28
B Vis-à-vis the non-bank sector........................................................................................... A36
7 External loans and deposits of reporting banks vis-à-vis individual countries A Vis-à-vis all sectors.......................................................................................................... A44
B Vis-à-vis the non-bank sector........................................................................................... A52
8 International positions by nationality of ownership of reporting banks A Amounts outstanding ....................................................................................................... A60
B Estimated exchange rate adjusted changes ..................................................................... A62
9 Consolidated claims of reporting banks on individual countries A International and foreign claims by maturity and sector.................................................... A64
B Foreign claims by nationality of reporting banks, immediate borrower basis .................... A72
C Foreign claims by sector and type, ultimate risk basis ..................................................... A84
D Foreign claims by nationality of reporting banks, ultimate risk basis ................................ A88
E Foreign exposures on selected individual countries, ultimate risk basis ........................ A100
10 Signed international syndicated credit facilities by nationality of borrower ........... A110
1 More detailed data and a full set of historical time series are available on the BIS website under
http://www.bis.org/statistics/bankstats.htm.

A4 BIS Quarterly Review, June 2011
Introduction to the BIS locational and consolidated international banking statistics
The BIS collects and disseminates two different sets of international banking data, both based on information provided by banks. The first set of data is known as the locational statistics and is presented in Annex Tables 1–8B. These statistics were originally introduced in 1964 to monitor the development of eurocurrency markets, although in practice comprehensive locational data are only available from 1977. The second set, known as the consolidated statistics, is shown in Annex Tables 9A–9E. They were launched in a comprehensive form in 1983 following the onset of the Mexican debt crisis, with the main purpose of monitoring industrial country banks’ exposure to developing countries. Once differences in reporting regimes are taken into account, the two sets of data may be used to complement one another in economic analysis. The basic characteristics of the two data sets are summarised in the table below.
The locational reporting system collects quarterly data on the gross international financial claims and liabilities of banks resident in a given country. The main purpose of the statistics is to provide information on the role of banks and financial centres in the intermediation of international capital flows. The reporting system is currently comprised of 43 countries (see the table overleaf). The key organisational criteria are the country of residence of the reporting banks and their counterparties as well as the recording of all positions on a gross basis, including those vis-à-vis own affiliates. This methodology is consistent with the principles underlying the compilation of national accounts, balances of payments and external debt statistics. The currency detail supplied by the reporting countries allows the approximation of capital flows, adjusted for exchange rate fluctuations.
The consolidated banking statistics report banks’ on-balance sheet financial claims (ie contractual lending) vis-à-vis the rest of the world and provide a measure of the risk exposures of lenders’ national banking systems. The data cover contractual (immediate borrower) and ultimate risk lending by the head office and all its branches and subsidiaries on a worldwide consolidated basis, net of inter-office accounts. Reporting of lending in this way allows the allocation of claims to the bank entity that would bear the losses as a result of default by borrowers. The consolidated statistics also provide information on the maturity (ie liquidity) and sector risk distribution of banks’ contractual lending. Furthermore, to reflect the fact that banks’ country risk exposure can differ substantially from that of contractual lending due to the use of risk mitigants such as guarantees and collateral, reporting countries provide information on claims on an ultimate risk basis (ie
Data characteristics Locational (Tables 1–8 B)
Consolidated (Tables 9 A–9 E)
Creditor reporting basis Residence (host country) Nationality (home country)
Number of reporting countries 43 30
Frequency Quarterly since 1977 Quarterly since March 20001
Reported data External claims and liabilities Worldwide consolidated claims
Inter-office netting-out No Yes
Type of counterparty Immediate borrower Immediate (contractual) and ultimate borrower
Composition of claims by:
Country of borrower Yes Yes Currency Yes No Type of instrument Yes (loans, deposits, securities) No Maturity No Yes Sector Yes (bank, non-banks) Yes (banks, non-banks, public)
1 Semiannual available since 1983.

BIS Quarterly Review, June 2011 A5
contractual claims net of guarantees and collateral) since June 1999. A finer breakdown of BIS reporting banks’ foreign claims on an ultimate risk basis, and information about derivatives, credit commitments and guarantees are provided as of 2005 Q1. The consolidated statistics became available on a quarterly basis in March 2000; previously, the statistics were collected semiannually. There are currently 30 countries reporting these data (see the table below).
Because more countries contribute to the locational bank lending data, one would expect the measure of outstanding debt as reported by the locational data to exceed that of the consolidated data. However, the reporting of worldwide positions in the consolidated data tends to compensate for this. While the locational statistics are appropriate for measuring lending flows in a given period, the consolidated statistics are more suited to gauging the size of banks’ country and liquidity risk exposures. The detailed maturity and sector breakdowns of the consolidated statistics can be used to supplement the locational data.
Reporting countries providing locational banking data
First year of joining followed by first period of data availability in brackets
Australia (1997, Q4 1997) France (1977, Q4 1977) Mexico (2003, Q4 2003)
Austria (1977, Q4 1977) Germany (1977, Q4 1977) Netherlands (1977, Q4 1977)
Bahamas (1983, Q4 1983) 1 Greece (2003, Q4 2003) Netherlands Antilles (1983, Q4 1983) 2
Bahrain (1983, Q4 1983) Guernsey (2001, Q4 2001) Norway (1983, Q4 1983)
Belgium (1977, Q4 1977) Hong Kong SAR (1983, Q4 1983) Panama (2002, Q4 2002)
Bermuda (2002, Q4 2002) India (2001, Q4 2001) Portugal (1997, Q4 1997)
Brazil (2002, Q4 2002) Ireland (1977, Q4 1977) Singapore (1983, Q4 1983)
Canada (1977, Q4 1977) Isle of Man (2001, Q4 2001) South Africa (2009, Q3 2009)
Cayman Islands (1983, Q4 1983) Italy (1977, Q4 1977) Spain (1983, Q4 1983)
Chile (2002, Q4 2002) Japan (1977, Q4 1977) Sweden (1977, Q4 1977)
Chinese Taipei(2000, Q4 2000) Jersey (2001, Q4 2001) Switzerland (1977, Q4 1977)
Curacao (2010, Q4 2010) Korea (2005, Q1 2005) Turkey (2000, Q4 2000)
Cyprus (2008, Q4 2008) Luxembourg (1977, Q4 1977) United Kingdom (1977, Q4 1977)
Denmark (1977, Q4 1977) Macao SAR (2006, Q4 2003) United States (1977, Q4 1977)
Finland (1983, Q4 1983) Malaysia (2008, Q4 2007)
Reporting countries providing consolidated banking data
First year of joining followed by first period of data availability in brackets
Australia (2003, Q4 2003) Germany (1983, Q4 1983) Norway (1994, Q2 1994)
Austria (1983, Q4 1983) Greece (2003, Q4 2003) Panama (2002, Q4 2002) 3
Belgium (1983, Q4 1983) Hong Kong SAR (1997, Q4 1997) 3 Portugal (1999, Q4 1999)
Brazil (2002, Q4 2002)3 India (2001, Q4 2000) Singapore (2000, Q4 2000)
Canada (1983, Q4 1983) Ireland (1983, Q4 1983) Spain (1985, Q4 1985)
Chile (2002, Q4 2002) Italy (1983, Q4 1983) Sweden (1983, Q4 1983)
Chinese Taipei (2000, Q4 2000) Japan (1983, Q4 1983) Switzerland (1983, Q4 1983)
Denmark (1983, Q4 1983) 3 Luxembourg (1983, Q4 1983) 3 Turkey (2000, Q4 2000)
Finland (1985, Q4 1985) Mexico (2003, Q4 2003) 3 United Kingdom (1983, Q4 1983)
France (1983, Q4 1983) Netherlands (1983, Q4 1983) United States (1983, Q4 1983) 1 Semi-annual reporting. 2 No longer exits from Q4 2010. 3 Provides only consolidated banking statistics on an immediate borrower basis.
______________________________________________________
For a more detailed analysis, see the special feature “The BIS consolidated banking statistics: structure, uses and improvements” in September 2005 BIS Quarterly Review.


Positions Dec 2008 Dec 2009 Sep 2010 Dec 2010 2009 2010 Q1 2010 Q2 2010 Q3 2010 Q4 2010
A. Total assets 35,363.1 33,832.4 34,897.6 33,938.1 –2,348.7 974.2 666.3 –15.2 776.7 –453.6
claims on banks 22,275.6 21,078.7 21,709.1 20,963.7 –1,732.4 470.5 376.7 125.2 345.8 –377.3
claims on non-banks 13,087.4 12,753.7 13,188.5 12,974.5 –616.4 503.7 289.6 –140.5 430.9 –76.3
B. External assets 31,288.1 30,073.7 31,016.4 30,117.1 –1,957.6 860.5 614.7 16.9 651.6 –422.6
claims on banks 20,286.3 19,244.9 19,843.9 19,121.0 –1,531.2 418.7 379.2 134.1 283.5 –378.0
claims on non-banks 11,001.8 10,828.7 11,172.5 10,996.1 –426.4 441.8 235.5 –117.2 368.1 –44.6
1. Loans and deposits 22,902.5 21,656.1 22,360.3 22,004.3 –1,721.1 931.7 447.9 179.8 391.1 –87.0
claims on banks 16,589.7 15,654.7 16,058.9 15,634.0 –1,262.9 532.0 321.1 155.6 188.4 –133.1
claims on non-banks 6,312.7 6,001.4 6,301.4 6,370.3 –458.2 399.7 126.7 24.2 202.7 46.0
2. Holdings of securities and other assets 8,385.7 8,417.5 8,656.0 8,112.8 –236.5 –71.1 166.8 –162.8 260.4 –335.5
claims on banks 3,696.6 3,590.2 3,785.0 3,487.1 –268.3 –113.3 58.0 –21.5 95.1 –244.9
claims on non-banks 4,689.1 4,827.3 4,871.0 4,625.7 31.8 42.2 108.8 –141.4 165.3 –90.6
C. Local assets in
foreign currency 4,074.9 3,758.7 3,881.3 3,821.1 –391.2 113.6 51.6 –32.2 125.1 –31.0
claims on banks 1,989.3 1,833.7 1,865.2 1,842.7 –201.2 51.7 –2.5 –8.9 62.3 0.8
claims on non-banks 2,085.6 1,925.0 2,016.1 1,978.4 –190.0 61.9 54.1 –23.3 62.8 –31.7
D. Total liabilities 33,981.3 32,335.6 33,444.3 32,738.6 –2,486.7 1,078.5 474.0 42.0 853.4 –290.9
liabilities to banks 24,337.8 23,173.9 23,881.2 23,132.6 –1,903.3 502.1 323.2 12.5 538.8 –372.4
liabilities to non-banks 9,643.6 9,161.7 9,563.1 9,606.0 –583.4 576.4 150.7 29.5 314.6 81.5
E. External liabilities 29,170.7 28,127.5 29,100.5 28,461.5 –1,797.3 928.1 505.1 34.6 654.7 –266.3
liabilities to banks 21,464.1 20,845.9 21,492.9 20,832.7 –1,305.2 501.7 378.8 12.9 419.5 –309.4
liabilities to non-banks 7,706.6 7,281.6 7,607.6 7,628.8 –492.1 426.4 126.3 21.7 235.2 43.2
1. Loans and deposits 24,442.5 23,113.5 23,566.3 23,228.3 –1,859.5 772.1 374.1 22.5 370.4 5.1
liabilities to banks 17,442.6 16,523.6 16,663.3 16,239.1 –1,358.0 293.8 246.9 –8.4 160.7 –105.5
liabilities to non-banks 6,999.9 6,589.9 6,903.0 6,989.2 –501.6 478.3 127.2 30.9 209.7 110.5
2. Own issues of securitiesand other liabilities 4,728.2 5,014.0 5,534.1 5,233.1 62.2 156.0 131.0 12.1 284.3 –271.4
liabilities to banks 4,021.5 4,322.3 4,829.6 4,593.5 52.7 207.9 131.8 21.3 258.8 –204.0
liabilities to non-banks 706.7 691.7 704.6 639.6 9.5 –51.9 –0.8 –9.2 25.5 –67.4
F. Local liabilities in
foreign currency 4,810.7 4,208.1 4,343.8 4,277.1 –689.4 150.4 –31.1 7.4 198.7 –24.6
liabilities to banks 2,873.7 2,328.0 2,388.3 2,299.9 –598.1 0.3 –55.5 –0.4 119.3 –63.0
liabilities to non-banks 1,937.0 1,880.1 1,955.5 1,977.2 –91.3 150.0 24.4 7.8 79.4 38.4
Table 1: BIS reporting banksSummary of international positionsIn billions of US dollars
Amounts outstanding Estimated exchange rate adjusted changes
BIS Quarterly Review, June 2011 A 7

Table 2A: External positions of banks in all currencies vis-à-vis all sectorsIn individual reporting countriesin billions of US dollars
Reporting countries Dec 2008 Dec 2009 Sep 2010 Dec 2010 2009 2010 Q1 2010 Q2 2010 Q3 2010 Q4 2010
AssetsAll countries 31,288.1 30,073.7 31,016.4 30,117.1 –1,957.6 860.5 614.7 16.9 651.6 –422.6
Australia 260.1 230.9 252.5 255.3 –58.9 16.4 –15.3 27.0 7.4 –2.7 Austria 497.9 459.9 434.8 407.2 –53.6 –30.2 9.4 –7.9 –9.5 –22.3 Bahamas 514.4 436.2 500.1 487.9 –81.0 52.3 59.1 21.3 –16.1 –12.0 Bahrain 203.9 179.6 171.2 176.4 –25.8 –1.4 3.0 –10.6 0.5 5.7 Belgium 969.0 841.9 766.5 744.0 –150.5 –55.4 –25.3 16.9 –36.1 –10.9 Bermuda 9.7 8.9 9.9 11.0 –1.0 2.2 0.6 0.5 –0.0 1.1
Brazil 60.7 51.8 63.2 69.9 –9.9 17.2 6.2 4.2 0.1 6.7 Canada 342.5 411.7 439.4 445.4 57.6 30.8 23.8 –11.8 15.4 3.3 Cayman Islands 1,799.2 1,755.9 1,725.8 1,761.7 –46.1 10.7 –32.6 1.1 5.0 37.1 Chile 6.5 7.3 5.2 7.7 0.6 0.4 –1.2 –0.8 –0.1 2.5 Chinese Taipei 169.5 187.8 198.1 204.1 17.5 16.6 6.7 –4.1 7.9 6.1 Curacao ... ... ... 19.9 ... – ... ... ... – Cyprus 89.2 112.1 92.1 89.2 18.4 –17.0 2.3 8.9 –26.4 –1.8 Denmark 225.4 193.6 197.8 176.8 –36.2 –8.6 9.7 –14.1 14.2 –18.4
Finland 113.0 137.4 326.3 319.5 22.1 15.1 –12.7 5.5 25.2 –2.9 France 2,599.9 2,576.0 2,574.6 2,491.9 –99.4 47.6 79.0 –104.4 118.9 –45.9 Germany 3,389.9 3,130.1 2,888.5 2,687.8 –328.7 –169.2 –37.8 –12.6 –73.3 –45.6 Greece 184.8 239.7 195.7 171.6 46.4 –44.2 4.4 –9.0 –18.4 –21.3 Guernsey 245.9 202.3 200.9 192.1 –46.7 –6.3 –3.7 –1.4 6.3 –7.4
Hong Kong SAR 788.5 747.8 791.7 830.2 –44.4 80.8 8.4 –21.4 54.8 39.1 India 24.7 23.7 31.5 29.6 –1.3 6.0 3.8 –1.0 5.0 –1.8 Ireland 968.3 914.9 879.9 696.2 –94.7 –41.6 11.1 –15.5 –4.6 –32.6 Isle of Man 81.7 81.2 76.5 74.7 –6.5 –4.0 –1.8 –1.3 0.1 –0.9 Italy 665.0 598.3 631.2 579.0 –88.2 17.7 27.4 17.6 13.8 –41.1 Japan 2,575.8 2,465.1 2,807.6 2,820.5 –124.7 303.8 69.5 82.9 147.3 4.0 (JOM) 629.1 522.1 575.6 590.0 –102.8 41.5 –1.3 3.3 30.9 8.7 (Others) 1,946.7 1,943.0 2,232.0 2,230.5 –21.8 262.3 70.9 79.7 116.4 –4.7
Jersey 387.7 329.4 311.7 298.1 –73.5 –22.8 1.2 –14.1 1.1 –10.9 Luxembourg 981.8 903.3 792.2 761.4 –102.0 –20.7 –19.4 11.0 8.1 –20.4 Macao SAR 27.6 35.4 44.0 45.1 7.1 10.8 2.5 3.2 3.5 1.6 Malaysia 26.2 30.4 39.7 38.8 3.8 8.2 4.5 –2.1 6.7 –0.8 Mexico 34.2 25.5 34.8 34.5 –9.1 8.5 –0.1 8.6 0.4 –0.4 Netherlands 1,175.3 1,056.6 1,221.6 1,113.4 –150.9 52.0 72.6 –22.5 94.9 –93.1 Netherlands Antilles 20.7 20.8 19.8 – –0.1 –0.3 –0.3 –0.8 0.5 0.4 Norway 109.8 108.8 103.3 101.2 –5.5 –5.2 0.4 16.6 –20.8 –1.5 Panama 33.5 34.9 37.5 39.2 1.4 4.4 –0.6 0.8 2.5 1.7
Portugal 139.4 161.1 162.4 152.5 16.9 1.9 13.2 –2.3 –2.0 –7.1 Singapore 794.2 746.8 828.3 825.2 –54.8 62.7 24.7 44.3 –1.2 –5.1 South Africa ... 51.8 54.4 57.3 –1.2 8.5 1.1 –2.0 7.5 1.8 South Korea 106.8 98.1 115.5 104.9 –9.2 7.0 3.8 –11.3 25.0 –10.4 Spain 575.3 597.4 514.8 499.5 2.3 –66.2 –21.0 –21.9 –15.7 –7.5 Sweden 365.7 349.3 387.6 365.9 –37.5 23.9 25.9 14.2 0.4 –16.6
Switzerland 1,115.7 908.2 817.8 804.6 –232.8 –91.9 –29.7 –49.8 –1.2 –11.2 Turkey 51.6 46.0 38.0 32.4 –6.2 –12.4 –2.6 –4.3 –0.3 –5.1 United Kingdom 5,639.2 5,435.8 5,690.0 5,511.6 –367.3 210.2 175.2 –6.9 161.6 –119.7 United States 2,917.7 3,140.3 3,542.0 3,582.1 196.3 442.3 169.0 86.3 143.5 43.5 (IBFs) 514.2 669.7 655.9 669.1 155.1 –0.7 37.8 –118.8 67.0 13.4 (Others) 2,403.5 2,470.6 2,886.1 2,913.0 41.2 443.0 131.2 205.2 76.5 30.1
Amounts outstanding Estimated exchange rate adjusted changes
A 8 BIS Quarterly Review, June 2011

Table 2A: External positions of banks in all currencies vis-à-vis all sectorsIn individual reporting countriesin billions of US dollars
Reporting countries Dec 2008 Dec 2009 Sep 2010 Dec 2010 2009 2010 Q1 2010 Q2 2010 Q3 2010 Q4 2010
LiabilitiesAll countries 29,170.7 28,127.5 29,100.5 28,461.5 –1,797.3 928.1 505.1 34.6 654.7 –266.3
Australia 514.1 592.0 624.4 636.9 29.8 45.4 8.4 –1.4 30.9 7.5 Austria 306.4 276.2 277.8 253.6 –40.6 –11.1 1.7 –6.1 14.4 –21.2 Bahamas 518.3 442.4 503.3 484.3 –77.7 43.3 61.9 25.1 –25.2 –18.4 Bahrain 197.8 174.1 168.0 171.3 –25.4 –0.6 2.8 –9.0 1.8 3.9 Belgium 731.5 657.4 621.2 617.7 –90.2 –13.2 –39.1 36.7 –14.4 3.6 Bermuda 3.5 3.1 2.3 3.2 –0.3 0.1 0.1 0.0 –0.9 0.9
Brazil 85.2 71.4 102.1 108.3 –14.8 36.8 5.0 12.0 13.5 6.3 Canada 274.1 321.8 321.3 346.7 33.0 23.1 13.1 –25.3 12.4 23.0 Cayman Islands 1,803.3 1,771.1 1,754.4 1,795.9 –35.6 29.2 –23.1 –0.6 10.6 42.4 Chile 12.3 14.4 10.8 13.4 2.1 –1.1 –1.2 –1.4 –1.0 2.5 Chinese Taipei 91.7 81.9 98.3 100.3 –10.3 17.6 2.5 5.7 7.9 1.5 Curacao ... ... ... 17.6 ... – ... ... ... – Cyprus 81.1 101.1 81.1 77.4 16.1 –18.3 4.3 7.5 –27.3 –2.8 Denmark 323.6 328.2 329.1 306.8 –4.4 –7.9 17.3 –17.2 10.7 –18.7
Finland 135.4 177.9 377.3 382.7 38.6 7.6 –15.4 15.7 –2.7 10.1 France 2,501.9 2,397.3 2,481.8 2,422.0 –166.7 126.4 87.6 –83.5 149.5 –27.2 Germany 1,824.9 1,721.4 1,879.9 1,803.6 –149.2 149.2 86.1 95.4 15.2 –47.4 Greece 153.4 161.2 120.6 110.1 3.3 –41.2 –2.5 –26.8 –3.1 –8.9 Guernsey 207.7 155.5 147.8 145.8 –53.9 –12.5 –3.3 –0.8 –1.2 –7.2
Hong Kong SAR 504.4 498.0 566.2 604.8 –9.3 107.5 11.8 11.9 43.7 40.1 India 75.2 89.3 106.6 106.2 11.6 14.2 3.0 3.3 8.4 –0.4 Ireland 1,023.0 905.9 834.6 582.4 –153.4 –119.6 31.8 –25.0 –47.7 –78.7 Isle of Man 59.8 61.7 56.5 55.2 –2.2 –4.6 –1.7 –1.5 –0.8 –0.6 Italy 920.7 858.9 921.8 845.2 –95.5 37.1 25.9 14.3 57.2 –60.3 Japan 942.1 979.9 1,177.3 1,179.0 37.3 160.6 –14.8 64.9 117.1 –6.5 (JOM) 235.4 220.3 232.7 234.5 –13.7 4.9 –20.2 –5.2 30.4 –0.1 (Others) 706.7 759.6 944.6 944.5 50.9 155.6 5.3 70.0 86.7 –6.4
Jersey 352.9 293.3 272.9 258.1 –72.2 –27.4 0.1 –15.7 0.8 –12.7 Luxembourg 682.8 625.9 529.4 528.3 –71.1 –18.5 –24.2 6.0 –6.6 6.3 Macao SAR 15.9 20.8 26.5 28.5 4.6 8.2 1.9 1.7 2.3 2.3 Malaysia 46.6 49.3 55.9 55.2 2.3 3.3 –0.1 0.0 4.0 –0.6 Mexico 23.4 23.2 40.3 43.0 –0.7 18.7 2.9 6.2 7.1 2.4 Netherlands 1,265.8 1,233.5 1,387.5 1,299.8 –65.9 114.3 68.5 26.9 92.8 –73.9 Netherlands Antilles 20.9 19.2 17.0 – –1.9 –1.2 –2.1 2.4 –2.3 0.8 Norway 201.3 211.7 189.0 187.8 –3.3 –19.6 –5.0 5.7 –20.0 –0.4 Panama 27.0 26.3 29.3 30.3 –0.6 4.0 –1.1 1.1 3.0 1.0
Portugal 203.6 203.2 177.7 173.5 –6.1 –15.7 10.7 –15.1 –10.2 –1.1 Singapore 795.4 740.4 827.6 838.7 –63.5 103.4 39.8 54.2 –3.5 12.9 South Africa ... 43.8 45.7 47.8 –1.1 6.4 0.8 –1.4 6.3 0.8 South Korea 195.1 207.8 214.6 197.7 12.1 –12.1 5.2 –3.8 3.8 –17.2 Spain 755.1 792.0 759.1 754.1 10.0 1.7 1.3 –52.6 45.2 7.7 Sweden 421.3 474.0 506.7 467.0 –11.3 –1.7 11.5 27.1 –5.0 –35.2
Switzerland 1,030.8 892.1 845.1 826.7 –165.6 –54.0 –12.7 –1.4 –24.0 –15.9 Turkey 57.9 54.8 73.8 82.0 –3.7 29.1 5.2 8.2 5.4 10.2 United Kingdom 6,121.1 5,990.9 6,009.2 5,895.7 –320.5 27.9 83.3 –109.2 100.3 –46.5 United States 3,662.5 3,383.3 3,528.4 3,577.0 –281.3 193.4 57.1 0.2 86.6 49.6 (IBFs) 670.9 613.0 594.1 605.4 –58.2 –7.3 17.6 –47.6 11.3 11.5 (Others) 2,991.6 2,770.4 2,934.4 2,971.6 –223.1 200.7 39.5 47.8 75.3 38.1
Amounts outstanding Estimated exchange rate adjusted changes
BIS Quarterly Review, June 2011 A 9

Reporting countries Dec 2008 Dec 2009 Sep 2010 Dec 2010 2009 2010 Q1 2010 Q2 2010 Q3 2010 Q4 2010
AssetsAll countries 11,001.8 10,828.7 11,172.5 10,996.1 –426.4 441.8 235.5 –117.2 368.1 –44.6
Australia 85.0 64.6 62.5 66.8 –20.0 3.2 –3.1 –0.5 3.4 3.4 Austria 212.5 204.5 206.0 197.7 –14.5 3.2 1.3 –5.7 13.2 –5.6 Bahamas 30.4 21.5 27.2 24.1 –9.1 2.7 4.4 26.2 –24.9 –3.0 Bahrain 124.1 109.3 99.6 98.3 –15.2 –10.2 –2.8 –4.2 –2.0 –1.1 Belgium 421.9 367.8 318.4 306.1 –65.1 –41.4 –10.8 6.9 –30.2 –7.3 Bermuda 2.3 2.3 2.7 3.1 0.0 0.8 0.2 0.1 0.1 0.4
Brazil 8.6 2.8 4.7 3.8 –6.4 0.9 3.8 –0.8 –1.0 –1.0 Canada 142.0 163.5 160.7 177.0 14.7 11.9 10.9 –12.5 –1.5 15.1 Cayman Islands 502.7 452.4 455.6 433.0 –50.9 –18.8 –31.2 2.2 32.6 –22.5 Chile 1.6 2.4 2.7 3.4 0.8 1.0 0.9 –1.5 0.9 0.7 Chinese Taipei 97.8 116.7 130.8 137.4 18.7 20.9 4.6 1.2 8.4 6.7 Curacao ... ... ... 10.1 ... – ... ... ... – Cyprus 36.1 56.9 47.5 48.2 18.7 –5.4 3.6 –5.6 –4.8 1.4 Denmark 57.1 60.9 62.0 60.5 2.2 2.0 –2.5 –4.9 10.1 –0.7
Finland 24.4 18.6 31.9 37.1 –5.8 1.8 2.1 –6.3 0.4 5.6 France 929.1 853.4 849.2 809.6 –101.9 –3.1 10.5 –31.3 46.4 –28.7 Germany 1,267.9 1,177.2 1,087.2 1,034.2 –99.6 –82.6 –13.6 –19.4 –16.5 –33.1 Greece 61.5 76.8 49.1 48.5 12.4 –13.8 –1.8 –8.9 –3.4 0.2 Guernsey 58.8 56.9 53.9 54.9 –3.3 –1.2 0.5 –5.5 2.4 1.2
Hong Kong SAR 166.6 161.8 185.2 197.6 –5.6 36.7 4.1 2.8 17.0 12.9 India 10.9 11.7 15.0 15.8 0.7 4.1 1.7 0.1 1.5 0.8 Ireland 488.8 456.6 441.3 337.1 –49.3 –14.8 20.7 –21.0 –1.7 –12.9 Isle of Man 6.9 7.5 6.6 6.2 –0.2 –0.9 0.2 –0.9 0.0 –0.2 Italy 150.7 152.6 155.7 151.2 –3.0 8.3 6.6 –1.7 5.1 –1.7 Japan 1,487.8 1,603.7 1,854.2 1,848.6 100.2 234.3 80.0 49.3 111.4 –6.3 (JOM) ... ... ... ... ... ... ... ... ... ... (Others) 1,487.8 1,603.7 1,854.2 1,848.6 100.2 234.3 80.0 49.3 111.4 –6.3
Jersey 13.6 13.7 14.1 12.6 –1.0 –0.8 0.3 0.5 –0.3 –1.3 Luxembourg 354.7 334.2 296.6 279.2 –29.9 –21.6 –4.8 2.3 –5.1 –14.0 Macao SAR 8.0 11.4 15.2 15.0 3.3 3.8 2.8 0.9 0.2 –0.1 Malaysia 3.9 6.7 6.8 6.8 2.7 –0.1 0.4 –1.7 1.1 0.0 Mexico 3.6 4.1 4.1 3.9 0.5 –0.3 –0.1 0.8 –0.7 –0.3 Netherlands 357.1 395.3 419.2 414.2 27.6 2.3 20.2 –31.2 12.8 0.4 Netherlands Antilles 13.0 10.5 10.1 – –2.4 –0.5 –0.4 –1.6 1.5 0.0 Norway 33.7 41.8 44.1 43.2 7.1 2.1 –2.4 –0.4 5.6 –0.7 Panama 16.1 15.8 17.8 18.2 –0.3 2.3 0.2 –0.4 2.2 0.3
Portugal 63.8 79.9 77.5 73.5 13.3 –0.6 6.7 –3.1 –1.6 –2.6 Singapore 214.9 219.6 254.3 268.5 3.3 46.6 11.3 20.7 –0.4 14.9 South Africa ... 6.6 6.4 6.4 0.9 0.0 0.3 0.8 –1.0 –0.1 South Korea 43.2 45.5 49.7 46.1 2.1 0.8 2.4 –14.0 15.9 –3.6 Spain 240.2 274.1 237.8 219.0 24.6 –41.1 –9.4 –18.0 1.8 –15.4 Sweden 106.7 98.8 98.6 99.5 –11.6 3.8 3.2 –1.7 –0.3 2.5
Switzerland 162.4 152.5 170.3 172.1 –12.9 19.2 5.5 6.0 6.2 1.6 Turkey 1.9 1.9 2.4 2.5 –0.0 0.7 0.1 0.4 0.0 0.2 United Kingdom 2,336.0 2,190.4 2,319.3 2,367.7 –199.5 170.2 70.9 –56.7 126.3 29.7 United States 653.7 723.2 818.2 837.6 27.3 115.6 37.9 21.2 36.8 19.8 (IBFs) 36.4 35.9 38.3 39.8 –0.8 4.0 0.6 0.5 1.4 1.5 (Others) 617.4 687.4 779.9 797.8 28.1 111.6 37.2 20.7 35.3 18.3
Table 2B: External positions of banks in all currencies vis-à-vis the non-bank sectorIndividual reporting countriesin billions of US dollars
Amounts outstanding Estimated exchange rate adjusted changes
A 10 BIS Quarterly Review, June 2011

Reporting countries Dec 2008 Dec 2009 Sep 2010 Dec 2010 2009 2010 Q1 2010 Q2 2010 Q3 2010 Q4 2010
LiabilitiesAll countries 7,706.6 7,281.6 7,607.6 7,628.8 –492.1 426.4 126.3 21.7 235.2 43.2
Australia 134.2 76.8 46.9 47.3 –7.4 –25.9 –20.9 –5.1 0.8 –0.7 Austria 64.6 66.6 64.3 62.6 0.3 –0.4 –0.7 –1.2 2.3 –0.7 Bahamas 181.1 144.7 127.4 141.9 –37.9 –0.8 –4.7 24.3 –35.5 15.2 Bahrain 61.6 58.2 62.9 64.2 –3.9 6.5 7.3 –4.5 2.2 1.4 Belgium 354.9 319.1 300.5 289.3 –49.5 –13.2 –8.2 27.4 –25.9 –6.5 Bermuda 1.6 1.8 1.9 1.9 0.1 0.1 0.0 0.2 –0.1 0.1
Brazil 4.4 2.3 1.7 2.3 –2.1 0.0 –0.5 – –0.1 0.6 Canada 66.1 71.8 78.9 100.1 1.1 28.0 1.4 3.4 2.7 20.6 Cayman Islands 933.5 835.1 874.2 903.5 –99.0 69.6 33.3 –14.2 20.9 29.5 Chile 5.3 8.9 7.7 6.5 3.6 –2.4 –2.8 0.6 1.0 –1.2 Chinese Taipei 39.8 49.6 53.7 57.6 9.6 7.4 0.6 0.5 2.9 3.4 Curacao ... ... ... 8.7 ... – ... ... ... – Cyprus 23.4 24.8 31.3 33.0 1.0 9.0 2.5 1.6 2.9 2.0 Denmark 32.2 32.3 43.0 41.6 –0.8 9.9 1.9 0.5 8.3 –0.9
Finland 9.8 16.8 26.3 28.2 6.8 4.0 –1.7 0.6 2.9 2.2 France 147.3 139.1 148.3 140.7 –13.0 9.0 4.5 –5.5 15.4 –5.5 Germany 397.4 310.8 346.6 301.9 –48.5 7.5 23.7 15.7 7.9 –39.8 Greece 61.6 48.1 31.2 30.9 –14.3 –14.2 –1.0 –10.1 –3.3 0.2 Guernsey 63.0 55.3 56.7 62.4 –10.0 1.8 0.7 2.3 –1.2 –0.0
Hong Kong SAR 163.1 174.5 181.7 189.8 10.4 16.7 –1.6 2.1 7.7 8.7 India 52.0 68.1 81.0 80.3 13.9 10.0 1.6 1.5 7.6 –0.7 Ireland 180.0 150.3 149.9 157.9 –37.0 –2.7 25.3 –9.6 –11.2 –7.2 Isle of Man 49.4 46.5 43.4 41.6 –6.3 –3.5 0.4 –1.9 –0.7 –1.3 Italy 57.4 64.0 65.8 58.2 4.4 –1.7 0.9 –0.8 4.6 –6.4 Japan 260.4 230.6 313.7 307.6 –30.1 69.7 7.7 16.7 52.8 –7.5 (JOM) ... ... ... ... ... ... ... ... ... ... (Others) 260.4 230.6 313.7 307.6 –30.1 69.7 7.7 16.7 52.8 –7.5
Jersey 135.8 106.9 86.7 86.2 –34.6 –17.1 –1.7 –13.1 –2.6 0.3 Luxembourg 170.9 173.5 144.5 143.4 –2.5 –2.3 –10.8 1.6 5.9 0.9 Macao SAR 9.8 10.5 9.2 10.0 0.6 –0.3 –1.0 0.0 –0.1 0.8 Malaysia 10.4 13.9 15.7 15.7 3.3 0.7 –0.6 0.1 1.1 0.0 Mexico 0.7 0.9 1.6 1.4 0.2 0.4 –0.1 –0.0 0.7 –0.2 Netherlands 249.0 266.3 301.0 300.0 11.5 37.5 0.8 3.1 31.6 2.0 Netherlands Antilles 11.6 11.7 7.7 – 0.2 –2.9 –3.5 0.1 –0.5 1.0 Norway 19.1 19.5 20.0 21.1 –0.8 2.0 –1.4 0.9 1.2 1.2 Panama 12.1 15.8 16.3 16.7 3.7 0.9 –0.4 0.2 0.8 0.4
Portugal 29.1 33.7 27.2 26.3 3.4 –4.9 4.6 –7.2 –2.0 –0.4 Singapore 262.2 269.4 272.3 274.0 3.8 5.2 0.1 –5.0 7.7 2.4 South Africa ... 6.2 5.7 5.5 0.5 –0.5 –0.4 –0.5 0.7 –0.3 South Korea 4.4 6.9 5.0 4.2 2.5 –2.7 –1.4 –1.0 0.4 –0.8 Spain 101.4 97.6 134.3 192.9 –6.3 100.3 3.7 3.0 31.7 61.8 Sweden 34.1 28.4 33.1 32.8 –8.0 4.2 3.7 1.6 –1.2 0.1
Switzerland 509.7 483.0 467.6 457.9 –37.2 –16.8 –14.3 2.3 3.1 –7.9 Turkey 5.9 7.2 8.5 7.7 1.1 0.9 1.2 –0.7 1.1 –0.6 United Kingdom 1,792.2 1,874.8 2,026.0 1,997.5 23.7 120.5 57.6 –8.6 84.3 –12.7 United States 1,004.1 859.4 886.3 875.8 –148.7 16.7 20.2 0.3 6.6 –10.4 (IBFs) 45.8 26.6 22.3 20.5 –19.2 –6.1 1.5 –2.0 –3.7 –1.8 (Others) 958.2 832.8 863.9 855.3 –129.5 22.8 18.7 2.3 10.3 –8.5
Table 2B: External positions of banks in all currencies vis-à-vis the non-bank sectorIndividual reporting countriesin billions of US dollars
Amounts outstanding Estimated exchange rate adjusted changes
BIS Quarterly Review, June 2011 A 11

Reporting countries Dec 2008 Dec 2009 Sep 2010 Dec 2010 2009 2010 Q1 2010 Q2 2010 Q3 2010 Q4 2010
AssetsAll countries 18,261.8 17,307.1 17,885.8 17,619.2 –1,284.2 583.8 271.9 –37.5 433.5 –84.0
Australia 171.6 134.6 134.0 140.6 –43.7 11.6 –13.3 25.1 –7.2 7.0 Austria 155.7 127.2 125.9 122.2 –30.7 –7.0 3.1 –7.7 2.1 –4.5 Bahamas 514.4 436.2 500.1 487.9 –81.0 52.3 59.1 21.3 –16.1 –12.0 Bahrain 203.9 179.6 171.2 176.4 –25.8 –1.4 3.0 –10.6 0.5 5.7 Belgium 313.0 239.6 229.2 215.3 –77.4 –25.0 –7.2 4.0 –8.3 –13.5 Bermuda 9.7 8.8 9.9 10.9 –1.0 2.2 0.7 0.5 –0.1 1.1
Brazil 56.2 48.5 58.9 67.1 –7.7 17.9 4.9 4.8 –0.1 8.3 Canada 280.6 332.5 345.3 351.2 50.9 20.1 21.3 –6.9 –0.6 6.3 Cayman Islands 1,799.1 1,755.8 1,725.7 1,761.6 –46.1 10.7 –32.6 1.1 5.1 37.1 Chile 6.4 6.2 5.2 5.9 –0.2 –0.3 –0.1 –0.7 –0.1 0.7 Chinese Taipei 168.8 186.9 197.3 203.2 17.3 16.7 7.0 –4.3 7.9 6.2 Curacao ... ... ... 19.9 ... – ... ... ... – Cyprus 38.7 37.0 33.4 35.2 –2.3 –1.9 –2.2 1.7 –3.1 1.7 Denmark 200.4 172.4 179.3 154.5 –32.0 –11.2 12.3 –14.2 13.4 –22.6
Finland 63.3 80.7 126.0 146.8 17.0 23.3 –14.5 –2.7 19.7 20.9 France 799.6 755.2 825.4 801.2 –59.6 42.0 26.8 –23.2 62.1 –23.7 Germany 959.9 872.6 775.0 745.7 –99.8 –105.4 –41.4 –63.3 5.4 –6.1 Greece 51.5 51.2 40.1 39.2 –1.3 –2.6 –0.6 –1.2 0.1 –1.0 Guernsey 199.6 160.0 160.1 149.9 –37.9 –8.1 –4.0 –1.8 7.6 –9.8
Hong Kong SAR 713.1 675.2 719.5 761.0 –41.6 84.0 13.5 –21.5 50.0 42.0 India 23.0 22.0 29.7 27.6 –1.2 5.8 3.7 –0.9 4.9 –1.9 Ireland 469.5 495.2 476.4 365.7 –1.8 –29.6 5.0 –11.3 –8.8 –14.6 Isle of Man 29.0 29.3 27.1 27.3 0.1 –1.4 –1.5 0.3 –0.5 0.4 Italy 87.8 70.5 72.6 71.4 –18.3 0.6 0.9 3.8 –2.8 –1.2 Japan 1,860.2 1,877.9 2,105.9 2,091.8 –6.8 244.7 58.2 68.4 122.9 –4.7 (JOM) 339.1 321.9 356.2 362.0 –17.2 40.1 –8.4 10.1 32.6 5.8 (Others) 1,521.1 1,556.0 1,749.7 1,729.9 10.4 204.6 66.6 58.3 90.3 –10.5
Jersey 277.1 222.2 193.3 218.8 –58.4 1.7 –1.5 –12.7 –10.7 26.6 Luxembourg 311.5 255.9 231.6 224.8 –59.9 –29.3 –18.4 –11.3 8.2 –7.9 Macao SAR 27.4 35.1 43.8 44.9 7.1 10.9 2.5 3.2 3.5 1.6 Malaysia 23.1 26.8 34.2 33.1 3.3 6.5 4.4 –1.2 4.3 –1.0 Mexico 21.3 16.7 19.0 20.0 –4.6 3.3 –0.9 0.8 2.3 1.0 Netherlands 487.5 414.8 461.3 469.8 –80.7 46.8 26.0 –19.8 31.4 9.2 Netherlands Antilles 20.7 20.8 19.8 – –0.1 –0.3 –0.3 –0.8 0.5 0.4 Norway 92.0 91.1 87.3 87.8 –2.1 –1.4 –1.5 17.6 –18.5 1.0 Panama 33.5 34.9 37.5 39.2 1.4 4.4 –0.6 0.8 2.5 1.7
Portugal 24.7 23.8 25.8 22.8 –1.3 –0.8 3.3 0.7 –1.9 –2.9 Singapore 794.2 746.8 828.3 825.2 –54.8 62.7 24.7 44.3 –1.2 –5.1 South Africa ... 33.0 29.2 33.8 1.8 5.9 1.1 –2.6 2.8 4.7 South Korea 106.8 98.1 115.5 104.9 –9.2 7.0 3.8 –11.3 25.0 –10.4 Spain 196.2 195.1 190.8 179.5 –7.6 –13.4 4.9 –7.7 –0.4 –10.2 Sweden 295.4 292.6 311.0 306.0 –15.7 25.1 19.9 8.5 –2.8 –0.5
Switzerland 1,000.5 808.8 723.6 707.5 –213.9 –81.5 –28.7 –39.5 –3.0 –10.4 Turkey 47.8 42.6 34.9 29.5 –5.7 –12.0 –2.5 –3.8 –0.6 –5.2 United Kingdom 5,002.9 4,859.4 5,101.3 4,954.3 –227.9 197.3 153.9 6.4 151.9 –114.8 United States 324.2 333.6 324.7 337.9 –24.9 12.8 –19.9 30.2 –14.0 16.6 (IBFs) 45.3 42.2 55.8 53.8 –3.4 11.5 –4.3 8.9 8.6 –1.8 (Others) 279.0 291.4 268.9 284.1 –21.5 1.3 –15.7 21.3 –22.6 18.4
Table 2C: External positions of banks in foreign currencies vis-à-vis all sectorsIn individual reporting countriesin billions of US dollars
Amounts outstanding Estimated exchange rate adjusted changes
A 12 BIS Quarterly Review, June 2011
Reporting countries Dec 2008 Dec 2009 Sep 2010 Dec 2010 2009 2010 Q1 2010 Q2 2010 Q3 2010 Q4 2010
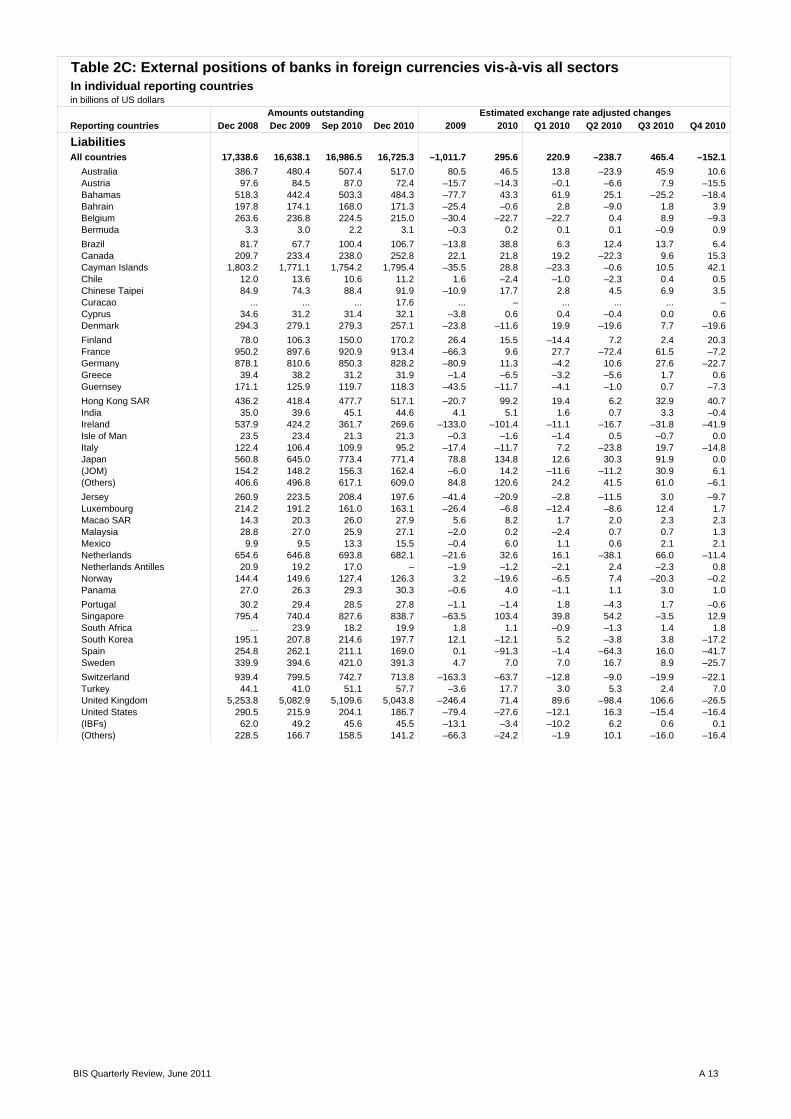
LiabilitiesAll countries 17,338.6 16,638.1 16,986.5 16,725.3 –1,011.7 295.6 220.9 –238.7 465.4 –152.1
Australia 386.7 480.4 507.4 517.0 80.5 46.5 13.8 –23.9 45.9 10.6 Austria 97.6 84.5 87.0 72.4 –15.7 –14.3 –0.1 –6.6 7.9 –15.5 Bahamas 518.3 442.4 503.3 484.3 –77.7 43.3 61.9 25.1 –25.2 –18.4 Bahrain 197.8 174.1 168.0 171.3 –25.4 –0.6 2.8 –9.0 1.8 3.9 Belgium 263.6 236.8 224.5 215.0 –30.4 –22.7 –22.7 0.4 8.9 –9.3 Bermuda 3.3 3.0 2.2 3.1 –0.3 0.2 0.1 0.1 –0.9 0.9
Brazil 81.7 67.7 100.4 106.7 –13.8 38.8 6.3 12.4 13.7 6.4 Canada 209.7 233.4 238.0 252.8 22.1 21.8 19.2 –22.3 9.6 15.3 Cayman Islands 1,803.2 1,771.1 1,754.2 1,795.4 –35.5 28.8 –23.3 –0.6 10.5 42.1 Chile 12.0 13.6 10.6 11.2 1.6 –2.4 –1.0 –2.3 0.4 0.5 Chinese Taipei 84.9 74.3 88.4 91.9 –10.9 17.7 2.8 4.5 6.9 3.5 Curacao ... ... ... 17.6 ... – ... ... ... – Cyprus 34.6 31.2 31.4 32.1 –3.8 0.6 0.4 –0.4 0.0 0.6 Denmark 294.3 279.1 279.3 257.1 –23.8 –11.6 19.9 –19.6 7.7 –19.6
Finland 78.0 106.3 150.0 170.2 26.4 15.5 –14.4 7.2 2.4 20.3 France 950.2 897.6 920.9 913.4 –66.3 9.6 27.7 –72.4 61.5 –7.2 Germany 878.1 810.6 850.3 828.2 –80.9 11.3 –4.2 10.6 27.6 –22.7 Greece 39.4 38.2 31.2 31.9 –1.4 –6.5 –3.2 –5.6 1.7 0.6 Guernsey 171.1 125.9 119.7 118.3 –43.5 –11.7 –4.1 –1.0 0.7 –7.3
Hong Kong SAR 436.2 418.4 477.7 517.1 –20.7 99.2 19.4 6.2 32.9 40.7 India 35.0 39.6 45.1 44.6 4.1 5.1 1.6 0.7 3.3 –0.4 Ireland 537.9 424.2 361.7 269.6 –133.0 –101.4 –11.1 –16.7 –31.8 –41.9 Isle of Man 23.5 23.4 21.3 21.3 –0.3 –1.6 –1.4 0.5 –0.7 0.0 Italy 122.4 106.4 109.9 95.2 –17.4 –11.7 7.2 –23.8 19.7 –14.8 Japan 560.8 645.0 773.4 771.4 78.8 134.8 12.6 30.3 91.9 0.0 (JOM) 154.2 148.2 156.3 162.4 –6.0 14.2 –11.6 –11.2 30.9 6.1 (Others) 406.6 496.8 617.1 609.0 84.8 120.6 24.2 41.5 61.0 –6.1
Jersey 260.9 223.5 208.4 197.6 –41.4 –20.9 –2.8 –11.5 3.0 –9.7 Luxembourg 214.2 191.2 161.0 163.1 –26.4 –6.8 –12.4 –8.6 12.4 1.7 Macao SAR 14.3 20.3 26.0 27.9 5.6 8.2 1.7 2.0 2.3 2.3 Malaysia 28.8 27.0 25.9 27.1 –2.0 0.2 –2.4 0.7 0.7 1.3 Mexico 9.9 9.5 13.3 15.5 –0.4 6.0 1.1 0.6 2.1 2.1 Netherlands 654.6 646.8 693.8 682.1 –21.6 32.6 16.1 –38.1 66.0 –11.4 Netherlands Antilles 20.9 19.2 17.0 – –1.9 –1.2 –2.1 2.4 –2.3 0.8 Norway 144.4 149.6 127.4 126.3 3.2 –19.6 –6.5 7.4 –20.3 –0.2 Panama 27.0 26.3 29.3 30.3 –0.6 4.0 –1.1 1.1 3.0 1.0
Portugal 30.2 29.4 28.5 27.8 –1.1 –1.4 1.8 –4.3 1.7 –0.6 Singapore 795.4 740.4 827.6 838.7 –63.5 103.4 39.8 54.2 –3.5 12.9 South Africa ... 23.9 18.2 19.9 1.8 1.1 –0.9 –1.3 1.4 1.8 South Korea 195.1 207.8 214.6 197.7 12.1 –12.1 5.2 –3.8 3.8 –17.2 Spain 254.8 262.1 211.1 169.0 0.1 –91.3 –1.4 –64.3 16.0 –41.7 Sweden 339.9 394.6 421.0 391.3 4.7 7.0 7.0 16.7 8.9 –25.7
Switzerland 939.4 799.5 742.7 713.8 –163.3 –63.7 –12.8 –9.0 –19.9 –22.1 Turkey 44.1 41.0 51.1 57.7 –3.6 17.7 3.0 5.3 2.4 7.0 United Kingdom 5,253.8 5,082.9 5,109.6 5,043.8 –246.4 71.4 89.6 –98.4 106.6 –26.5 United States 290.5 215.9 204.1 186.7 –79.4 –27.6 –12.1 16.3 –15.4 –16.4 (IBFs) 62.0 49.2 45.6 45.5 –13.1 –3.4 –10.2 6.2 0.6 0.1 (Others) 228.5 166.7 158.5 141.2 –66.3 –24.2 –1.9 10.1 –16.0 –16.4
Table 2C: External positions of banks in foreign currencies vis-à-vis all sectorsIn individual reporting countriesin billions of US dollars
Amounts outstanding Estimated exchange rate adjusted changes
BIS Quarterly Review, June 2011 A 13
Reporting countries Dec 2008 Dec 2009 Sep 2010 Dec 2010 2009 2010 Q1 2010 Q2 2010 Q3 2010 Q4 2010
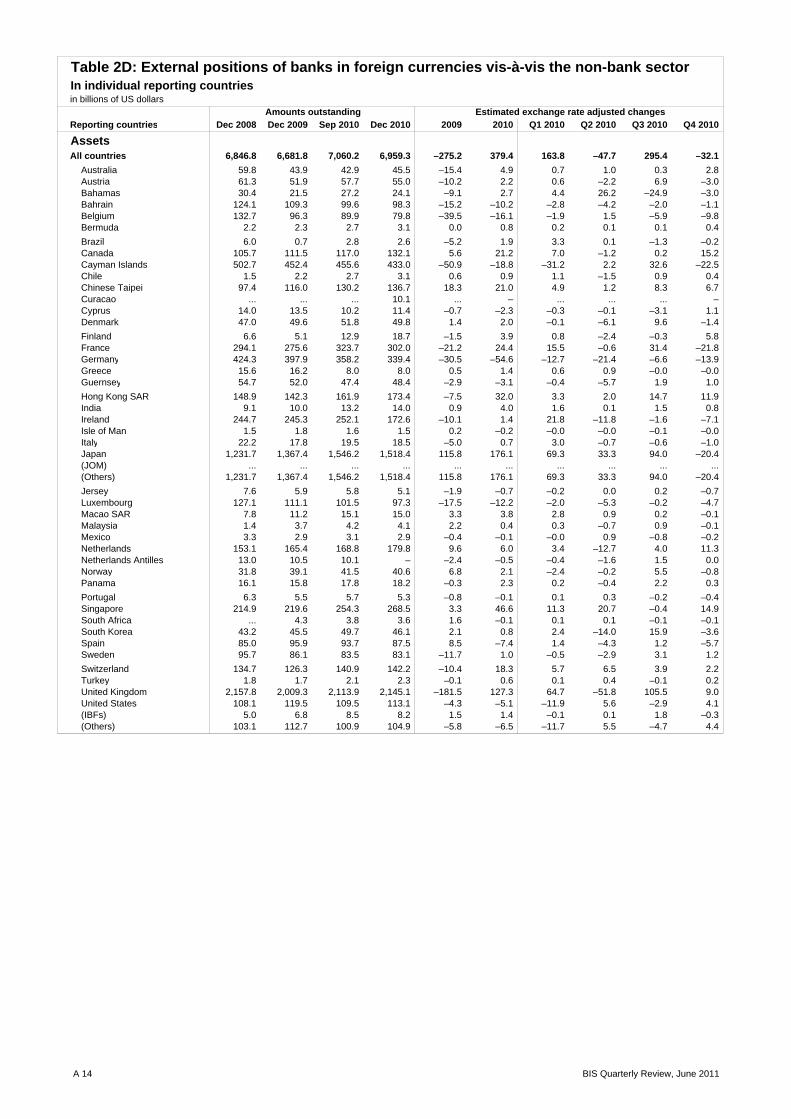
AssetsAll countries 6,846.8 6,681.8 7,060.2 6,959.3 –275.2 379.4 163.8 –47.7 295.4 –32.1
Australia 59.8 43.9 42.9 45.5 –15.4 4.9 0.7 1.0 0.3 2.8 Austria 61.3 51.9 57.7 55.0 –10.2 2.2 0.6 –2.2 6.9 –3.0 Bahamas 30.4 21.5 27.2 24.1 –9.1 2.7 4.4 26.2 –24.9 –3.0 Bahrain 124.1 109.3 99.6 98.3 –15.2 –10.2 –2.8 –4.2 –2.0 –1.1 Belgium 132.7 96.3 89.9 79.8 –39.5 –16.1 –1.9 1.5 –5.9 –9.8 Bermuda 2.2 2.3 2.7 3.1 0.0 0.8 0.2 0.1 0.1 0.4
Brazil 6.0 0.7 2.8 2.6 –5.2 1.9 3.3 0.1 –1.3 –0.2 Canada 105.7 111.5 117.0 132.1 5.6 21.2 7.0 –1.2 0.2 15.2 Cayman Islands 502.7 452.4 455.6 433.0 –50.9 –18.8 –31.2 2.2 32.6 –22.5 Chile 1.5 2.2 2.7 3.1 0.6 0.9 1.1 –1.5 0.9 0.4 Chinese Taipei 97.4 116.0 130.2 136.7 18.3 21.0 4.9 1.2 8.3 6.7 Curacao ... ... ... 10.1 ... – ... ... ... – Cyprus 14.0 13.5 10.2 11.4 –0.7 –2.3 –0.3 –0.1 –3.1 1.1 Denmark 47.0 49.6 51.8 49.8 1.4 2.0 –0.1 –6.1 9.6 –1.4
Finland 6.6 5.1 12.9 18.7 –1.5 3.9 0.8 –2.4 –0.3 5.8 France 294.1 275.6 323.7 302.0 –21.2 24.4 15.5 –0.6 31.4 –21.8 Germany 424.3 397.9 358.2 339.4 –30.5 –54.6 –12.7 –21.4 –6.6 –13.9 Greece 15.6 16.2 8.0 8.0 0.5 1.4 0.6 0.9 –0.0 –0.0 Guernsey 54.7 52.0 47.4 48.4 –2.9 –3.1 –0.4 –5.7 1.9 1.0
Hong Kong SAR 148.9 142.3 161.9 173.4 –7.5 32.0 3.3 2.0 14.7 11.9 India 9.1 10.0 13.2 14.0 0.9 4.0 1.6 0.1 1.5 0.8 Ireland 244.7 245.3 252.1 172.6 –10.1 1.4 21.8 –11.8 –1.6 –7.1 Isle of Man 1.5 1.8 1.6 1.5 0.2 –0.2 –0.0 –0.0 –0.1 –0.0 Italy 22.2 17.8 19.5 18.5 –5.0 0.7 3.0 –0.7 –0.6 –1.0 Japan 1,231.7 1,367.4 1,546.2 1,518.4 115.8 176.1 69.3 33.3 94.0 –20.4 (JOM) ... ... ... ... ... ... ... ... ... ... (Others) 1,231.7 1,367.4 1,546.2 1,518.4 115.8 176.1 69.3 33.3 94.0 –20.4
Jersey 7.6 5.9 5.8 5.1 –1.9 –0.7 –0.2 0.0 0.2 –0.7 Luxembourg 127.1 111.1 101.5 97.3 –17.5 –12.2 –2.0 –5.3 –0.2 –4.7 Macao SAR 7.8 11.2 15.1 15.0 3.3 3.8 2.8 0.9 0.2 –0.1 Malaysia 1.4 3.7 4.2 4.1 2.2 0.4 0.3 –0.7 0.9 –0.1 Mexico 3.3 2.9 3.1 2.9 –0.4 –0.1 –0.0 0.9 –0.8 –0.2 Netherlands 153.1 165.4 168.8 179.8 9.6 6.0 3.4 –12.7 4.0 11.3 Netherlands Antilles 13.0 10.5 10.1 – –2.4 –0.5 –0.4 –1.6 1.5 0.0 Norway 31.8 39.1 41.5 40.6 6.8 2.1 –2.4 –0.2 5.5 –0.8 Panama 16.1 15.8 17.8 18.2 –0.3 2.3 0.2 –0.4 2.2 0.3
Portugal 6.3 5.5 5.7 5.3 –0.8 –0.1 0.1 0.3 –0.2 –0.4 Singapore 214.9 219.6 254.3 268.5 3.3 46.6 11.3 20.7 –0.4 14.9 South Africa ... 4.3 3.8 3.6 1.6 –0.1 0.1 0.1 –0.1 –0.1 South Korea 43.2 45.5 49.7 46.1 2.1 0.8 2.4 –14.0 15.9 –3.6 Spain 85.0 95.9 93.7 87.5 8.5 –7.4 1.4 –4.3 1.2 –5.7 Sweden 95.7 86.1 83.5 83.1 –11.7 1.0 –0.5 –2.9 3.1 1.2
Switzerland 134.7 126.3 140.9 142.2 –10.4 18.3 5.7 6.5 3.9 2.2 Turkey 1.8 1.7 2.1 2.3 –0.1 0.6 0.1 0.4 –0.1 0.2 United Kingdom 2,157.8 2,009.3 2,113.9 2,145.1 –181.5 127.3 64.7 –51.8 105.5 9.0 United States 108.1 119.5 109.5 113.1 –4.3 –5.1 –11.9 5.6 –2.9 4.1 (IBFs) 5.0 6.8 8.5 8.2 1.5 1.4 –0.1 0.1 1.8 –0.3 (Others) 103.1 112.7 100.9 104.9 –5.8 –6.5 –11.7 5.5 –4.7 4.4
Table 2D: External positions of banks in foreign currencies vis-à-vis the non-bank sectorIn individual reporting countriesin billions of US dollars
Amounts outstanding Estimated exchange rate adjusted changes
A 14 BIS Quarterly Review, June 2011

Reporting countries Dec 2008 Dec 2009 Sep 2010 Dec 2010 2009 2010 Q1 2010 Q2 2010 Q3 2010 Q4 2010
LiabilitiesAll countries 4,959.3 4,661.1 4,898.8 4,914.7 –283.7 292.3 67.0 2.3 192.0 31.0
Australia 103.7 51.0 25.6 25.0 1.2 –23.4 –17.0 –6.5 0.8 –0.6 Austria 12.9 13.5 14.7 12.1 0.5 –1.6 0.4 –0.3 1.0 –2.7 Bahamas 181.1 144.7 127.4 141.9 –37.9 –0.8 –4.7 24.3 –35.5 15.2 Bahrain 61.6 58.2 62.9 64.2 –3.9 6.5 7.3 –4.5 2.2 1.4 Belgium 108.5 77.7 80.2 73.5 –36.3 –4.6 –1.5 7.0 –3.6 –6.6 Bermuda 1.5 1.7 1.8 1.8 0.1 0.2 0.0 0.2 –0.1 0.1
Brazil 4.4 2.0 1.6 2.2 –2.3 0.2 –0.3 –0.0 –0.0 0.6 Canada 48.5 47.5 56.6 75.9 –1.8 29.2 4.1 2.7 2.9 19.4 Cayman Islands 933.4 835.1 874.1 903.4 –99.0 69.6 33.3 –14.2 20.9 29.5 Chile 5.2 8.6 7.6 6.0 3.5 –2.6 –2.7 –0.4 2.1 –1.6 Chinese Taipei 33.7 42.7 44.7 50.2 8.9 7.7 0.8 –0.7 2.0 5.6 Curacao ... ... ... 8.7 ... – ... ... ... – Cyprus 15.0 13.8 17.0 18.3 –1.3 4.6 0.9 –0.2 2.5 1.3 Denmark 27.5 27.3 38.5 35.4 –0.9 8.2 1.4 0.7 8.9 –2.8
Finland 2.7 4.1 11.6 15.7 1.4 8.7 0.2 2.7 1.8 4.1 France 50.9 44.4 52.6 45.1 –7.2 0.9 –2.7 –2.8 13.7 –7.3 Germany 125.6 76.8 87.6 72.9 –21.5 –4.2 1.3 8.8 0.5 –14.8 Greece 15.4 13.6 7.3 7.2 –1.9 –6.4 –2.8 –3.1 –0.3 –0.1 Guernsey 45.4 38.2 40.3 46.5 –7.3 2.2 0.3 2.2 –0.3 0.1
Hong Kong SAR 126.0 130.9 134.9 143.9 3.8 14.4 0.4 1.3 3.1 9.6 India 17.7 24.3 27.0 27.1 6.2 3.0 0.2 0.4 2.3 0.2 Ireland 104.2 87.7 74.8 79.2 –20.5 –6.8 –1.5 –4.1 –6.7 5.6 Isle of Man 18.1 13.8 12.8 12.3 –4.3 –1.2 –0.3 0.1 –0.5 –0.5 Italy 5.5 4.6 5.6 5.0 –1.0 0.5 0.9 0.5 –0.3 –0.6 Japan 177.4 161.1 235.5 227.6 –18.1 68.5 10.6 15.2 49.9 –7.2 (JOM) ... ... ... ... ... ... ... ... ... ... (Others) 177.4 161.1 235.5 227.6 –18.1 68.5 10.6 15.2 49.9 –7.2
Jersey 84.5 58.5 47.2 47.6 –26.5 –9.5 –1.9 –7.3 –0.9 0.7 Luxembourg 54.3 53.1 50.8 51.4 –2.2 –4.1 –4.9 –2.3 2.5 0.6 Macao SAR 9.4 10.2 8.9 9.6 0.6 –0.3 –1.0 –0.1 –0.1 0.8 Malaysia 2.9 4.0 3.2 3.4 1.0 –0.6 –0.7 –0.2 0.1 0.1 Mexico 0.5 0.7 1.4 1.2 0.2 0.5 0.0 0.0 0.6 –0.2 Netherlands 135.7 152.0 165.5 168.0 14.2 15.2 –0.7 –3.7 16.9 2.7 Netherlands Antilles 11.6 11.7 7.7 – 0.2 –2.9 –3.5 0.1 –0.5 1.0 Norway 13.3 12.4 13.5 14.0 –1.1 2.0 –0.4 1.1 0.6 0.7 Panama 12.1 15.8 16.3 16.7 3.7 0.9 –0.4 0.2 0.8 0.4
Portugal 4.6 5.5 4.0 4.0 0.8 –1.5 1.3 –3.0 0.3 –0.0 Singapore 262.2 269.4 272.3 274.0 3.8 5.2 0.1 –5.0 7.7 2.4 South Africa ... 2.9 1.5 1.5 1.0 –0.9 –1.0 –0.1 0.2 –0.0 South Korea 4.4 6.9 5.0 4.2 2.5 –2.7 –1.4 –1.0 0.4 –0.8 Spain 33.5 31.6 34.5 34.1 –2.4 2.6 –0.9 –0.2 4.2 –0.4 Sweden 23.0 15.8 18.5 17.3 –7.8 2.3 2.9 –2.8 3.0 –0.8
Switzerland 471.4 441.5 418.2 408.3 –39.0 –19.9 –14.4 –3.1 3.9 –6.3 Turkey 4.7 5.6 6.6 5.7 0.8 0.4 0.8 –0.1 0.5 –0.8 United Kingdom 1,559.2 1,607.7 1,752.3 1,726.4 20.6 138.4 69.2 –2.4 86.3 –14.7 United States 46.4 32.6 28.9 26.5 –14.4 –5.8 –4.7 2.8 –1.7 –2.3 (IBFs) 8.2 4.9 5.6 5.2 –3.3 0.3 –0.6 0.9 0.3 –0.4 (Others) 38.2 27.7 23.3 21.3 –11.1 –6.1 –4.1 1.9 –1.9 –1.9
Table 2D: External positions of banks in foreign currencies vis-à-vis the non-bank sectorIn individual reporting countriesin billions of US dollars
Amounts outstanding Estimated exchange rate adjusted changes
BIS Quarterly Review, June 2011 A 15

Reporting countries Dec 2008 Dec 2009 Sep 2010 Dec 2010 2009 2010 Q1 2010 Q2 2010 Q3 2010 Q4 2010
LoansAll countries 22,902.5 21,656.1 22,360.3 22,004.3 –1,721.1 931.7 447.9 179.8 391.1 –87.0
Australia 88.9 100.9 98.6 106.0 –1.0 5.5 –5.6 2.6 3.2 5.3 Austria 339.8 316.3 298.0 270.9 –34.8 –31.0 11.8 –1.2 –17.6 –24.0 Bahamas 497.1 424.5 486.3 474.1 –75.3 50.2 58.0 20.2 –16.0 –12.0 Bahrain 203.9 179.6 171.2 176.4 –25.8 –1.4 3.0 –10.6 0.5 5.7 Belgium 636.2 563.5 520.6 511.8 –87.5 –26.6 –22.0 20.2 –23.4 –1.4 Bermuda 3.6 3.8 4.2 5.3 0.2 1.5 0.5 0.4 –0.4 1.1
Brazil 34.8 32.9 31.1 35.5 –2.1 1.8 –4.9 3.4 –1.1 4.5 Canada 301.4 365.9 383.6 380.8 54.0 12.4 19.8 –18.3 16.0 –5.1 Cayman Islands 1,561.3 1,587.7 1,589.7 1,620.2 23.5 36.9 –28.0 29.9 3.5 31.5 Chile 3.4 5.2 4.9 5.0 1.8 –0.3 0.4 –0.7 –0.1 0.1 Chinese Taipei 86.6 84.0 85.9 88.2 –3.0 3.9 1.4 –1.9 2.1 2.3 Curacao ... ... ... 19.9 ... – ... ... ... – Cyprus 53.6 57.7 52.3 49.3 1.9 –6.2 2.0 –0.0 –5.5 –2.6 Denmark 192.2 164.1 177.4 159.9 –31.7 2.1 7.4 –10.7 20.8 –15.2
Finland 104.8 112.6 93.1 115.1 6.0 14.0 –13.9 4.0 1.2 22.7 France 1,472.3 1,425.8 1,508.1 1,496.5 –83.7 138.2 78.2 –57.5 108.1 9.5 Germany 2,310.6 2,096.9 1,965.0 1,809.0 –250.5 –82.7 –34.3 24.9 –52.6 –20.6 Greece 122.5 161.0 138.5 115.3 32.9 –27.0 7.2 1.9 –14.8 –21.3 Guernsey 190.1 148.5 147.6 147.4 –43.6 1.7 –6.3 1.6 5.6 0.8
Hong Kong SAR 547.8 501.3 536.6 572.4 –48.7 69.8 0.6 –9.5 42.5 36.2 India 22.9 21.9 29.7 27.7 –1.3 5.9 3.7 –0.8 4.8 –1.9 Ireland 492.3 467.5 494.1 459.8 –49.3 20.4 19.3 11.8 5.1 –15.7 Isle of Man 81.7 81.2 75.9 74.0 –6.5 –4.7 –1.8 –1.9 0.0 –0.9 Italy 300.1 251.0 249.2 250.1 –56.3 14.1 2.5 6.8 –0.6 5.4 Japan 1,133.7 871.6 995.1 1,030.8 –262.0 117.1 6.1 55.8 27.2 28.0 (JOM) 629.1 522.1 575.6 590.0 –102.8 41.5 –1.3 3.3 30.9 8.7 (Others) 504.6 349.5 419.5 440.8 –159.2 75.6 7.4 52.5 –3.7 19.4
Jersey 377.1 296.6 258.1 245.2 –94.3 –43.1 0.9 –18.0 –15.5 –10.6 Luxembourg 690.2 619.1 545.5 530.8 –86.5 –5.8 –21.5 6.2 17.6 –8.0 Macao SAR 24.6 31.9 40.5 42.0 6.7 11.1 2.7 3.3 3.2 2.0 Malaysia 19.0 21.7 29.6 29.2 2.4 7.3 4.5 –2.2 5.4 –0.4 Mexico 20.7 15.4 13.6 13.1 –5.5 –2.4 –3.7 0.5 1.2 –0.5 Netherlands 794.8 699.8 741.3 707.3 –115.9 10.6 23.4 –43.1 56.4 –26.1 Netherlands Antilles 20.7 20.8 19.8 – –0.1 –0.3 –0.3 –0.8 0.5 0.4 Norway 75.7 65.6 64.3 64.2 –12.2 –0.2 0.6 22.2 –23.4 0.4 Panama 25.3 25.8 27.3 29.2 0.6 3.4 –1.1 0.6 2.0 1.9
Portugal 83.9 88.9 90.7 85.1 2.6 1.5 4.7 1.3 –0.4 –4.1 Singapore 701.1 688.6 759.1 763.8 –19.9 61.0 25.5 31.3 1.3 2.9 South Africa ... 26.0 27.7 30.9 0.2 4.2 0.7 –1.4 2.1 2.9 South Korea 80.1 74.3 85.2 81.4 –6.1 7.4 2.4 –12.2 20.9 –3.6 Spain 347.0 335.8 295.9 300.8 –20.6 –16.2 –9.1 –2.6 –14.2 9.8 Sweden 204.9 211.3 236.1 228.9 –3.4 22.8 21.7 9.7 –4.7 –3.8
Switzerland 1,030.2 826.0 748.3 736.2 –226.4 –78.4 –20.2 –46.8 –1.7 –9.6 Turkey 48.0 42.7 34.2 28.7 –5.8 –13.0 –2.7 –4.7 –0.4 –5.2 United Kingdom 4,674.4 4,417.2 4,682.1 4,523.8 –387.9 206.4 146.2 79.1 89.5 –108.5 United States 2,903.0 3,123.3 3,524.6 3,562.3 194.0 439.5 168.4 87.1 142.8 41.1 (IBFs) 514.2 668.8 654.7 667.9 154.3 –1.0 38.0 –119.0 66.6 13.4 (Others) 2,388.8 2,454.5 2,869.8 2,894.4 39.7 440.5 130.4 206.1 76.2 27.7
Table 3A: External loans and deposits of banks in all currencies vis-à-vis all sectorsIn individual reporting countriesin billions of US dollars
Amounts outstanding Estimated exchange rate adjusted changes
A 16 BIS Quarterly Review, June 2011
Reporting countries Dec 2008 Dec 2009 Sep 2010 Dec 2010 2009 2010 Q1 2010 Q2 2010 Q3 2010 Q4 2010
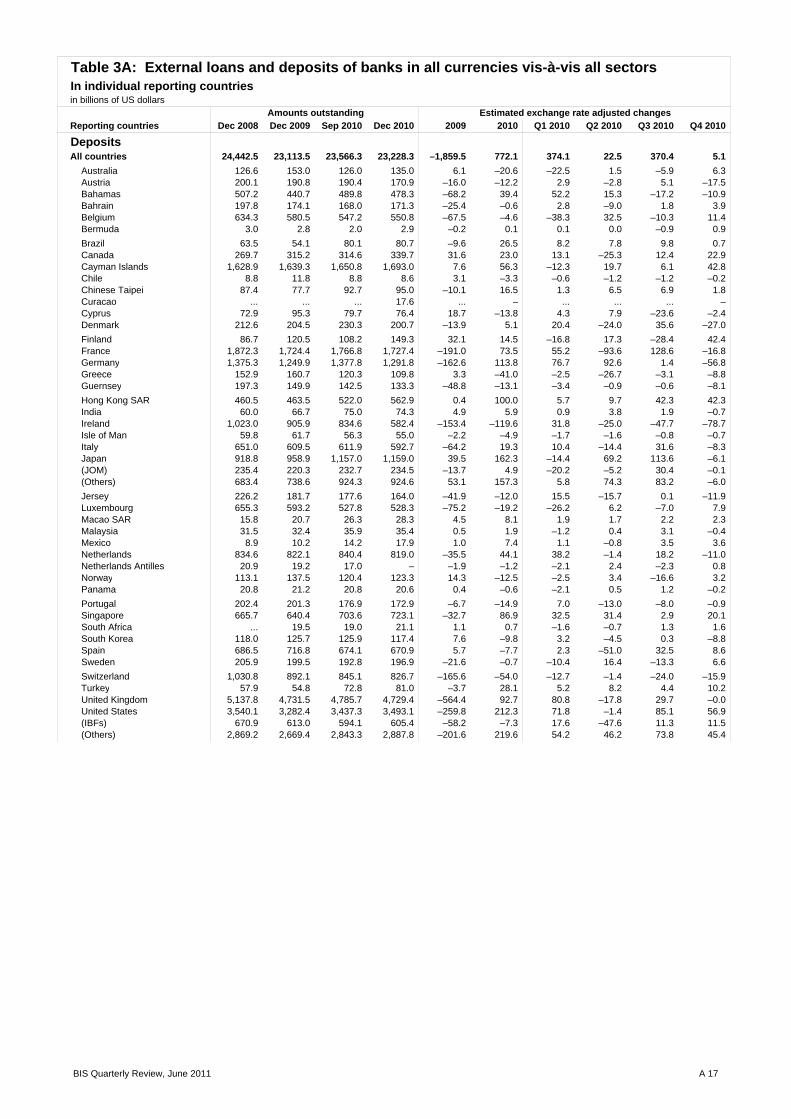
DepositsAll countries 24,442.5 23,113.5 23,566.3 23,228.3 –1,859.5 772.1 374.1 22.5 370.4 5.1
Australia 126.6 153.0 126.0 135.0 6.1 –20.6 –22.5 1.5 –5.9 6.3 Austria 200.1 190.8 190.4 170.9 –16.0 –12.2 2.9 –2.8 5.1 –17.5 Bahamas 507.2 440.7 489.8 478.3 –68.2 39.4 52.2 15.3 –17.2 –10.9 Bahrain 197.8 174.1 168.0 171.3 –25.4 –0.6 2.8 –9.0 1.8 3.9 Belgium 634.3 580.5 547.2 550.8 –67.5 –4.6 –38.3 32.5 –10.3 11.4 Bermuda 3.0 2.8 2.0 2.9 –0.2 0.1 0.1 0.0 –0.9 0.9
Brazil 63.5 54.1 80.1 80.7 –9.6 26.5 8.2 7.8 9.8 0.7 Canada 269.7 315.2 314.6 339.7 31.6 23.0 13.1 –25.3 12.4 22.9 Cayman Islands 1,628.9 1,639.3 1,650.8 1,693.0 7.6 56.3 –12.3 19.7 6.1 42.8 Chile 8.8 11.8 8.8 8.6 3.1 –3.3 –0.6 –1.2 –1.2 –0.2 Chinese Taipei 87.4 77.7 92.7 95.0 –10.1 16.5 1.3 6.5 6.9 1.8 Curacao ... ... ... 17.6 ... – ... ... ... – Cyprus 72.9 95.3 79.7 76.4 18.7 –13.8 4.3 7.9 –23.6 –2.4 Denmark 212.6 204.5 230.3 200.7 –13.9 5.1 20.4 –24.0 35.6 –27.0
Finland 86.7 120.5 108.2 149.3 32.1 14.5 –16.8 17.3 –28.4 42.4 France 1,872.3 1,724.4 1,766.8 1,727.4 –191.0 73.5 55.2 –93.6 128.6 –16.8 Germany 1,375.3 1,249.9 1,377.8 1,291.8 –162.6 113.8 76.7 92.6 1.4 –56.8 Greece 152.9 160.7 120.3 109.8 3.3 –41.0 –2.5 –26.7 –3.1 –8.8 Guernsey 197.3 149.9 142.5 133.3 –48.8 –13.1 –3.4 –0.9 –0.6 –8.1
Hong Kong SAR 460.5 463.5 522.0 562.9 0.4 100.0 5.7 9.7 42.3 42.3 India 60.0 66.7 75.0 74.3 4.9 5.9 0.9 3.8 1.9 –0.7 Ireland 1,023.0 905.9 834.6 582.4 –153.4 –119.6 31.8 –25.0 –47.7 –78.7 Isle of Man 59.8 61.7 56.3 55.0 –2.2 –4.9 –1.7 –1.6 –0.8 –0.7 Italy 651.0 609.5 611.9 592.7 –64.2 19.3 10.4 –14.4 31.6 –8.3 Japan 918.8 958.9 1,157.0 1,159.0 39.5 162.3 –14.4 69.2 113.6 –6.1 (JOM) 235.4 220.3 232.7 234.5 –13.7 4.9 –20.2 –5.2 30.4 –0.1 (Others) 683.4 738.6 924.3 924.6 53.1 157.3 5.8 74.3 83.2 –6.0
Jersey 226.2 181.7 177.6 164.0 –41.9 –12.0 15.5 –15.7 0.1 –11.9 Luxembourg 655.3 593.2 527.8 528.3 –75.2 –19.2 –26.2 6.2 –7.0 7.9 Macao SAR 15.8 20.7 26.3 28.3 4.5 8.1 1.9 1.7 2.2 2.3 Malaysia 31.5 32.4 35.9 35.4 0.5 1.9 –1.2 0.4 3.1 –0.4 Mexico 8.9 10.2 14.2 17.9 1.0 7.4 1.1 –0.8 3.5 3.6 Netherlands 834.6 822.1 840.4 819.0 –35.5 44.1 38.2 –1.4 18.2 –11.0 Netherlands Antilles 20.9 19.2 17.0 – –1.9 –1.2 –2.1 2.4 –2.3 0.8 Norway 113.1 137.5 120.4 123.3 14.3 –12.5 –2.5 3.4 –16.6 3.2 Panama 20.8 21.2 20.8 20.6 0.4 –0.6 –2.1 0.5 1.2 –0.2
Portugal 202.4 201.3 176.9 172.9 –6.7 –14.9 7.0 –13.0 –8.0 –0.9 Singapore 665.7 640.4 703.6 723.1 –32.7 86.9 32.5 31.4 2.9 20.1 South Africa ... 19.5 19.0 21.1 1.1 0.7 –1.6 –0.7 1.3 1.6 South Korea 118.0 125.7 125.9 117.4 7.6 –9.8 3.2 –4.5 0.3 –8.8 Spain 686.5 716.8 674.1 670.9 5.7 –7.7 2.3 –51.0 32.5 8.6 Sweden 205.9 199.5 192.8 196.9 –21.6 –0.7 –10.4 16.4 –13.3 6.6
Switzerland 1,030.8 892.1 845.1 826.7 –165.6 –54.0 –12.7 –1.4 –24.0 –15.9 Turkey 57.9 54.8 72.8 81.0 –3.7 28.1 5.2 8.2 4.4 10.2 United Kingdom 5,137.8 4,731.5 4,785.7 4,729.4 –564.4 92.7 80.8 –17.8 29.7 –0.0 United States 3,540.1 3,282.4 3,437.3 3,493.1 –259.8 212.3 71.8 –1.4 85.1 56.9 (IBFs) 670.9 613.0 594.1 605.4 –58.2 –7.3 17.6 –47.6 11.3 11.5 (Others) 2,869.2 2,669.4 2,843.3 2,887.8 –201.6 219.6 54.2 46.2 73.8 45.4
Table 3A: External loans and deposits of banks in all currencies vis-à-vis all sectorsIn individual reporting countriesin billions of US dollars
Amounts outstanding Estimated exchange rate adjusted changes
BIS Quarterly Review, June 2011 A 17
Reporting countries Dec 2008 Dec 2009 Sep 2010 Dec 2010 2009 2010 Q1 2010 Q2 2010 Q3 2010 Q4 2010
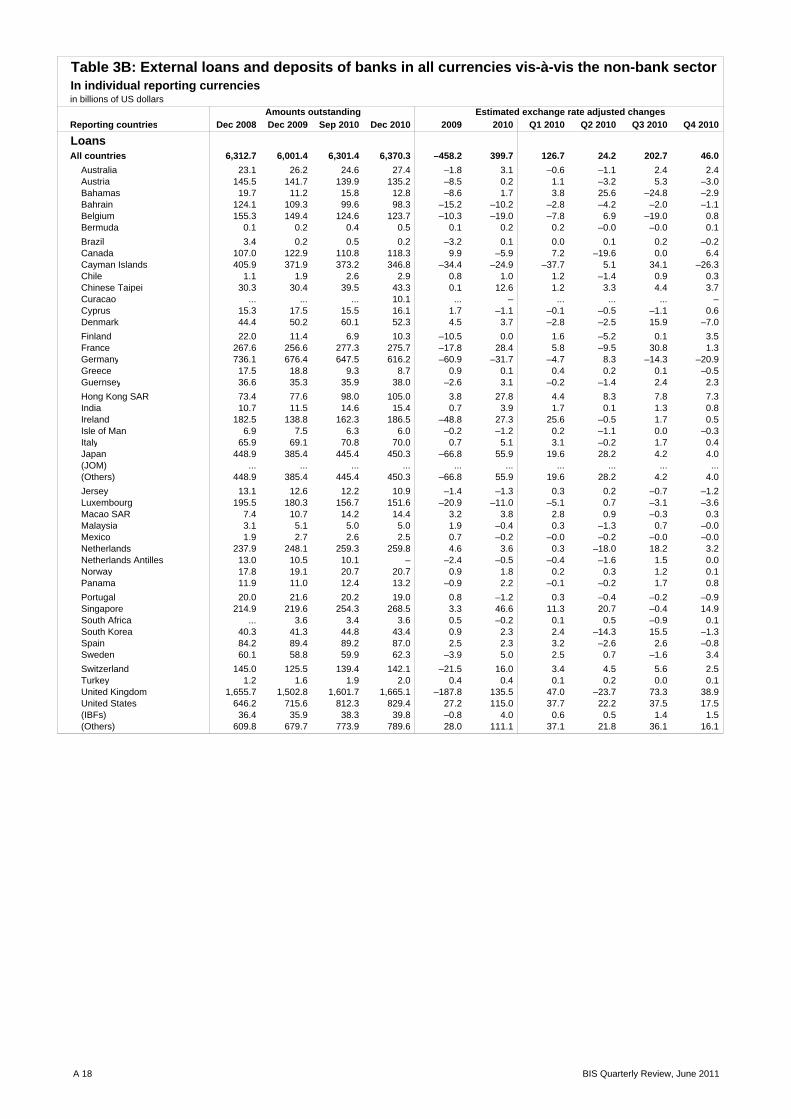
LoansAll countries 6,312.7 6,001.4 6,301.4 6,370.3 –458.2 399.7 126.7 24.2 202.7 46.0
Australia 23.1 26.2 24.6 27.4 –1.8 3.1 –0.6 –1.1 2.4 2.4 Austria 145.5 141.7 139.9 135.2 –8.5 0.2 1.1 –3.2 5.3 –3.0 Bahamas 19.7 11.2 15.8 12.8 –8.6 1.7 3.8 25.6 –24.8 –2.9 Bahrain 124.1 109.3 99.6 98.3 –15.2 –10.2 –2.8 –4.2 –2.0 –1.1 Belgium 155.3 149.4 124.6 123.7 –10.3 –19.0 –7.8 6.9 –19.0 0.8 Bermuda 0.1 0.2 0.4 0.5 0.1 0.2 0.2 –0.0 –0.0 0.1
Brazil 3.4 0.2 0.5 0.2 –3.2 0.1 0.0 0.1 0.2 –0.2 Canada 107.0 122.9 110.8 118.3 9.9 –5.9 7.2 –19.6 0.0 6.4 Cayman Islands 405.9 371.9 373.2 346.8 –34.4 –24.9 –37.7 5.1 34.1 –26.3 Chile 1.1 1.9 2.6 2.9 0.8 1.0 1.2 –1.4 0.9 0.3 Chinese Taipei 30.3 30.4 39.5 43.3 0.1 12.6 1.2 3.3 4.4 3.7 Curacao ... ... ... 10.1 ... – ... ... ... – Cyprus 15.3 17.5 15.5 16.1 1.7 –1.1 –0.1 –0.5 –1.1 0.6 Denmark 44.4 50.2 60.1 52.3 4.5 3.7 –2.8 –2.5 15.9 –7.0
Finland 22.0 11.4 6.9 10.3 –10.5 0.0 1.6 –5.2 0.1 3.5 France 267.6 256.6 277.3 275.7 –17.8 28.4 5.8 –9.5 30.8 1.3 Germany 736.1 676.4 647.5 616.2 –60.9 –31.7 –4.7 8.3 –14.3 –20.9 Greece 17.5 18.8 9.3 8.7 0.9 0.1 0.4 0.2 0.1 –0.5 Guernsey 36.6 35.3 35.9 38.0 –2.6 3.1 –0.2 –1.4 2.4 2.3
Hong Kong SAR 73.4 77.6 98.0 105.0 3.8 27.8 4.4 8.3 7.8 7.3 India 10.7 11.5 14.6 15.4 0.7 3.9 1.7 0.1 1.3 0.8 Ireland 182.5 138.8 162.3 186.5 –48.8 27.3 25.6 –0.5 1.7 0.5 Isle of Man 6.9 7.5 6.3 6.0 –0.2 –1.2 0.2 –1.1 0.0 –0.3 Italy 65.9 69.1 70.8 70.0 0.7 5.1 3.1 –0.2 1.7 0.4 Japan 448.9 385.4 445.4 450.3 –66.8 55.9 19.6 28.2 4.2 4.0 (JOM) ... ... ... ... ... ... ... ... ... ... (Others) 448.9 385.4 445.4 450.3 –66.8 55.9 19.6 28.2 4.2 4.0
Jersey 13.1 12.6 12.2 10.9 –1.4 –1.3 0.3 0.2 –0.7 –1.2 Luxembourg 195.5 180.3 156.7 151.6 –20.9 –11.0 –5.1 0.7 –3.1 –3.6 Macao SAR 7.4 10.7 14.2 14.4 3.2 3.8 2.8 0.9 –0.3 0.3 Malaysia 3.1 5.1 5.0 5.0 1.9 –0.4 0.3 –1.3 0.7 –0.0 Mexico 1.9 2.7 2.6 2.5 0.7 –0.2 –0.0 –0.2 –0.0 –0.0 Netherlands 237.9 248.1 259.3 259.8 4.6 3.6 0.3 –18.0 18.2 3.2 Netherlands Antilles 13.0 10.5 10.1 – –2.4 –0.5 –0.4 –1.6 1.5 0.0 Norway 17.8 19.1 20.7 20.7 0.9 1.8 0.2 0.3 1.2 0.1 Panama 11.9 11.0 12.4 13.2 –0.9 2.2 –0.1 –0.2 1.7 0.8
Portugal 20.0 21.6 20.2 19.0 0.8 –1.2 0.3 –0.4 –0.2 –0.9 Singapore 214.9 219.6 254.3 268.5 3.3 46.6 11.3 20.7 –0.4 14.9 South Africa ... 3.6 3.4 3.6 0.5 –0.2 0.1 0.5 –0.9 0.1 South Korea 40.3 41.3 44.8 43.4 0.9 2.3 2.4 –14.3 15.5 –1.3 Spain 84.2 89.4 89.2 87.0 2.5 2.3 3.2 –2.6 2.6 –0.8 Sweden 60.1 58.8 59.9 62.3 –3.9 5.0 2.5 0.7 –1.6 3.4
Switzerland 145.0 125.5 139.4 142.1 –21.5 16.0 3.4 4.5 5.6 2.5 Turkey 1.2 1.6 1.9 2.0 0.4 0.4 0.1 0.2 0.0 0.1 United Kingdom 1,655.7 1,502.8 1,601.7 1,665.1 –187.8 135.5 47.0 –23.7 73.3 38.9 United States 646.2 715.6 812.3 829.4 27.2 115.0 37.7 22.2 37.5 17.5 (IBFs) 36.4 35.9 38.3 39.8 –0.8 4.0 0.6 0.5 1.4 1.5 (Others) 609.8 679.7 773.9 789.6 28.0 111.1 37.1 21.8 36.1 16.1
Table 3B: External loans and deposits of banks in all currencies vis-à-vis the non-bank sectorIn individual reporting currenciesin billions of US dollars
Amounts outstanding Estimated exchange rate adjusted changes
A 18 BIS Quarterly Review, June 2011
Reporting countries Dec 2008 Dec 2009 Sep 2010 Dec 2010 2009 2010 Q1 2010 Q2 2010 Q3 2010 Q4 2010
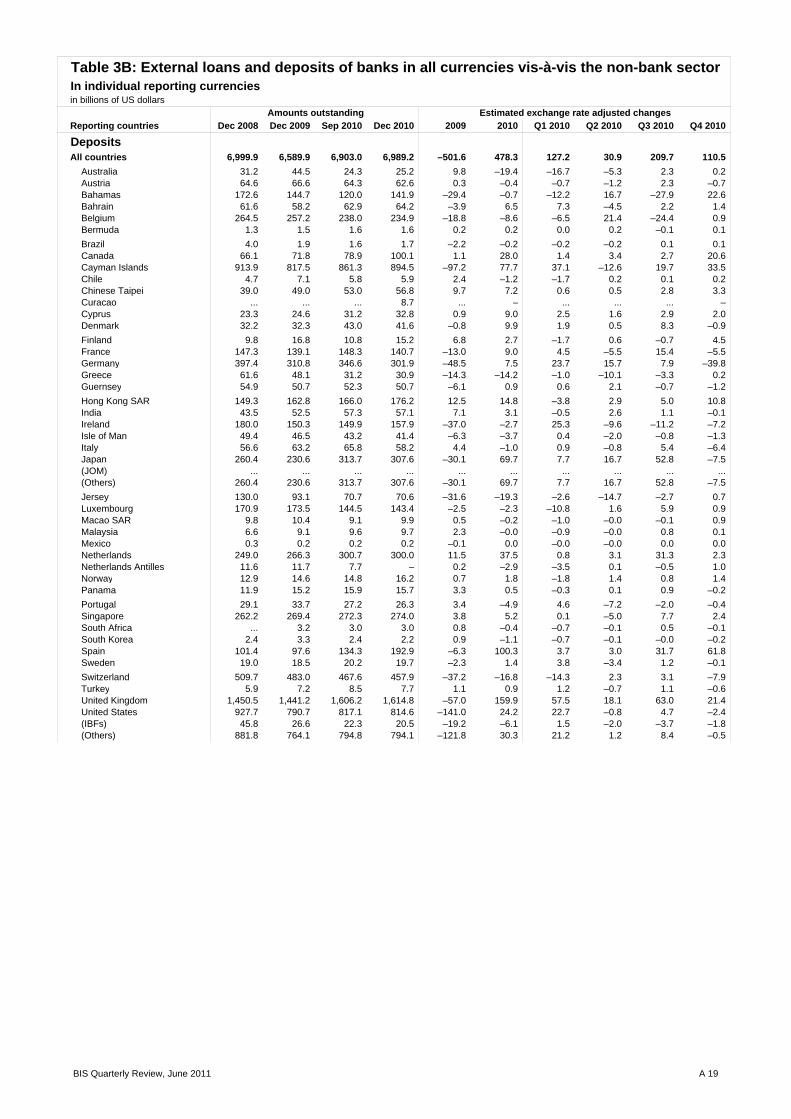
DepositsAll countries 6,999.9 6,589.9 6,903.0 6,989.2 –501.6 478.3 127.2 30.9 209.7 110.5
Australia 31.2 44.5 24.3 25.2 9.8 –19.4 –16.7 –5.3 2.3 0.2 Austria 64.6 66.6 64.3 62.6 0.3 –0.4 –0.7 –1.2 2.3 –0.7 Bahamas 172.6 144.7 120.0 141.9 –29.4 –0.7 –12.2 16.7 –27.9 22.6 Bahrain 61.6 58.2 62.9 64.2 –3.9 6.5 7.3 –4.5 2.2 1.4 Belgium 264.5 257.2 238.0 234.9 –18.8 –8.6 –6.5 21.4 –24.4 0.9 Bermuda 1.3 1.5 1.6 1.6 0.2 0.2 0.0 0.2 –0.1 0.1
Brazil 4.0 1.9 1.6 1.7 –2.2 –0.2 –0.2 –0.2 0.1 0.1 Canada 66.1 71.8 78.9 100.1 1.1 28.0 1.4 3.4 2.7 20.6 Cayman Islands 913.9 817.5 861.3 894.5 –97.2 77.7 37.1 –12.6 19.7 33.5 Chile 4.7 7.1 5.8 5.9 2.4 –1.2 –1.7 0.2 0.1 0.2 Chinese Taipei 39.0 49.0 53.0 56.8 9.7 7.2 0.6 0.5 2.8 3.3 Curacao ... ... ... 8.7 ... – ... ... ... – Cyprus 23.3 24.6 31.2 32.8 0.9 9.0 2.5 1.6 2.9 2.0 Denmark 32.2 32.3 43.0 41.6 –0.8 9.9 1.9 0.5 8.3 –0.9
Finland 9.8 16.8 10.8 15.2 6.8 2.7 –1.7 0.6 –0.7 4.5 France 147.3 139.1 148.3 140.7 –13.0 9.0 4.5 –5.5 15.4 –5.5 Germany 397.4 310.8 346.6 301.9 –48.5 7.5 23.7 15.7 7.9 –39.8 Greece 61.6 48.1 31.2 30.9 –14.3 –14.2 –1.0 –10.1 –3.3 0.2 Guernsey 54.9 50.7 52.3 50.7 –6.1 0.9 0.6 2.1 –0.7 –1.2
Hong Kong SAR 149.3 162.8 166.0 176.2 12.5 14.8 –3.8 2.9 5.0 10.8 India 43.5 52.5 57.3 57.1 7.1 3.1 –0.5 2.6 1.1 –0.1 Ireland 180.0 150.3 149.9 157.9 –37.0 –2.7 25.3 –9.6 –11.2 –7.2 Isle of Man 49.4 46.5 43.2 41.4 –6.3 –3.7 0.4 –2.0 –0.8 –1.3 Italy 56.6 63.2 65.8 58.2 4.4 –1.0 0.9 –0.8 5.4 –6.4 Japan 260.4 230.6 313.7 307.6 –30.1 69.7 7.7 16.7 52.8 –7.5 (JOM) ... ... ... ... ... ... ... ... ... ... (Others) 260.4 230.6 313.7 307.6 –30.1 69.7 7.7 16.7 52.8 –7.5
Jersey 130.0 93.1 70.7 70.6 –31.6 –19.3 –2.6 –14.7 –2.7 0.7 Luxembourg 170.9 173.5 144.5 143.4 –2.5 –2.3 –10.8 1.6 5.9 0.9 Macao SAR 9.8 10.4 9.1 9.9 0.5 –0.2 –1.0 –0.0 –0.1 0.9 Malaysia 6.6 9.1 9.6 9.7 2.3 –0.0 –0.9 –0.0 0.8 0.1 Mexico 0.3 0.2 0.2 0.2 –0.1 0.0 –0.0 –0.0 0.0 0.0 Netherlands 249.0 266.3 300.7 300.0 11.5 37.5 0.8 3.1 31.3 2.3 Netherlands Antilles 11.6 11.7 7.7 – 0.2 –2.9 –3.5 0.1 –0.5 1.0 Norway 12.9 14.6 14.8 16.2 0.7 1.8 –1.8 1.4 0.8 1.4 Panama 11.9 15.2 15.9 15.7 3.3 0.5 –0.3 0.1 0.9 –0.2
Portugal 29.1 33.7 27.2 26.3 3.4 –4.9 4.6 –7.2 –2.0 –0.4 Singapore 262.2 269.4 272.3 274.0 3.8 5.2 0.1 –5.0 7.7 2.4 South Africa ... 3.2 3.0 3.0 0.8 –0.4 –0.7 –0.1 0.5 –0.1 South Korea 2.4 3.3 2.4 2.2 0.9 –1.1 –0.7 –0.1 –0.0 –0.2 Spain 101.4 97.6 134.3 192.9 –6.3 100.3 3.7 3.0 31.7 61.8 Sweden 19.0 18.5 20.2 19.7 –2.3 1.4 3.8 –3.4 1.2 –0.1
Switzerland 509.7 483.0 467.6 457.9 –37.2 –16.8 –14.3 2.3 3.1 –7.9 Turkey 5.9 7.2 8.5 7.7 1.1 0.9 1.2 –0.7 1.1 –0.6 United Kingdom 1,450.5 1,441.2 1,606.2 1,614.8 –57.0 159.9 57.5 18.1 63.0 21.4 United States 927.7 790.7 817.1 814.6 –141.0 24.2 22.7 –0.8 4.7 –2.4 (IBFs) 45.8 26.6 22.3 20.5 –19.2 –6.1 1.5 –2.0 –3.7 –1.8 (Others) 881.8 764.1 794.8 794.1 –121.8 30.3 21.2 1.2 8.4 –0.5
Table 3B: External loans and deposits of banks in all currencies vis-à-vis the non-bank sectorIn individual reporting currenciesin billions of US dollars
Amounts outstanding Estimated exchange rate adjusted changes
BIS Quarterly Review, June 2011 A 19

Reporting countries Dec 2008 Dec 2009 Sep 2010 Dec 2010 2009 2010 Q1 2010 Q2 2010 Q3 2010 Q4 2010
AssetsAll countries 4,074.9 3,758.7 3,881.3 3,821.1 –391.2 113.6 51.6 –32.2 125.1 –31.0
Australia 72.8 57.3 62.2 62.0 –17.1 9.7 0.9 7.6 1.2 0.0 Austria 153.0 133.3 111.0 110.4 –22.8 –31.7 –18.0 –6.6 –2.9 –4.2 Bahamas 17.1 11.4 12.5 12.7 –5.8 1.8 0.8 0.9 –0.3 0.4 Bahrain 48.5 42.1 45.2 45.8 –7.0 4.1 2.9 1.4 –0.9 0.7 Belgium 37.0 48.3 50.4 47.6 –5.1 –0.9 –2.6 1.8 2.5 –2.6 Bermuda 1.7 1.7 1.5 1.5 – –0.1 –0.2 0.2 –0.2 0.1
Brazil 38.9 22.2 44.7 28.1 –16.7 6.0 7.4 3.2 11.9 –16.6 Canada 41.9 32.6 36.6 39.9 –9.3 7.3 3.5 –0.8 1.4 3.3 Cayman Islands 26.9 21.4 23.3 21.1 –5.6 –0.2 1.4 3.1 –2.5 –2.1 Chile 26.3 19.0 20.9 23.6 –7.3 4.6 –0.1 3.6 –1.5 2.6 Chinese Taipei 84.1 105.0 116.2 125.2 20.7 19.5 5.8 14.7 –9.9 8.9 Curacao ... ... ... 1.5 ... – ... ... ... – Cyprus 9.8 9.2 10.2 10.4 –0.8 0.9 –0.1 0.6 0.3 0.1 Denmark 88.3 93.5 91.0 88.7 1.6 –0.7 0.0 1.2 –0.7 –1.2
Finland 4.2 4.0 4.4 4.1 –0.2 –1.1 –0.3 –0.8 0.3 –0.3 France 171.1 165.1 238.4 212.9 –9.6 44.4 13.4 7.7 48.8 –25.5 Germany 183.2 196.8 210.0 219.8 11.5 17.5 5.4 8.3 –4.4 8.2 Greece 27.1 27.1 35.5 36.2 –0.4 –1.7 –0.2 –1.4 –0.3 0.2 Guernsey 5.3 11.3 10.4 8.6 6.0 –2.5 –1.1 1.1 –0.8 –1.7
Hong Kong SAR 167.0 128.9 180.9 210.4 –38.4 80.5 14.9 22.7 13.3 29.7 India 21.8 24.8 29.7 30.7 3.0 5.9 2.9 1.1 0.9 1.0 Ireland 101.0 100.2 88.2 68.1 –5.9 –14.7 –9.5 –1.5 –0.5 –3.2 Isle of Man 2.7 2.1 1.8 1.7 –0.6 –0.4 –0.1 –0.1 –0.1 –0.1 Italy 71.5 62.6 67.0 54.9 –9.7 –8.7 0.5 1.0 2.2 –12.4 Japan 192.7 167.2 171.5 174.3 –27.0 9.0 –5.0 2.2 8.3 3.5 (JOM) 26.0 11.9 11.0 9.4 –14.1 –2.5 –0.0 –1.5 0.6 –1.6 (Others) 166.7 155.3 160.5 164.9 –12.9 11.5 –5.0 3.6 7.8 5.2
Jersey 8.9 4.7 3.9 4.5 –4.2 –0.1 –0.0 –0.5 –0.2 0.6 Luxembourg 40.9 31.4 27.4 25.3 –10.1 –3.6 1.9 –1.6 –1.8 –2.1 Macao SAR 9.8 10.0 11.3 12.8 0.0 3.1 0.4 1.0 0.1 1.7 Malaysia 9.1 9.2 12.3 10.9 0.1 1.7 1.4 0.6 1.1 –1.3 Mexico 30.6 26.9 26.6 27.3 –3.8 0.4 –2.7 1.2 1.2 0.6 Netherlands 60.2 102.6 64.9 66.3 40.4 –36.6 –1.2 –30.7 –6.3 1.6 Netherlands Antilles 2.6 2.3 1.3 – –0.3 –0.7 –1.0 0.4 –0.3 0.2 Norway 36.1 30.5 28.8 29.1 –6.3 –1.0 0.3 –0.3 –1.3 0.4 Panama 0.1 0.3 0.3 0.2 0.2 –0.1 –0.1 –0.0 0.1 –0.1
Portugal 4.9 4.7 6.5 6.1 –0.3 1.4 0.3 1.1 0.4 –0.4 Singapore 118.8 122.6 145.6 146.5 2.5 21.2 17.1 0.8 2.8 0.6 South Africa ... 3.3 4.0 3.6 –0.5 0.4 0.7 0.0 0.1 –0.4 South Korea 136.7 115.2 170.4 132.9 –21.3 14.5 22.2 6.6 23.8 –38.2 Spain 41.7 33.1 38.5 37.3 –9.1 2.6 3.8 1.4 –1.2 –1.5 Sweden 51.2 51.9 53.3 53.5 –3.1 4.1 1.7 –1.2 2.5 1.0
Switzerland 50.6 70.2 64.9 61.0 18.7 –8.2 2.1 –8.4 1.7 –3.5 Turkey 66.8 71.9 91.3 101.8 4.1 31.5 5.9 9.5 4.9 11.3 United Kingdom 1,811.7 1,580.9 1,466.4 1,461.6 –251.6 –65.6 –23.7 –83.1 31.4 9.7 United States ... ... ... ... ... ... ... ... ... ... (IBFs) ... ... ... ... ... ... ... ... ... ... (Others) ... ... ... ... ... ... ... ... ... ...
Table 4A: Local positions in foreign currency of banks vis-à-vis all sectorsIn individual reporting countriesin billions of US dollars
Amounts outstanding Estimated exchange rate adjusted changes
A 20 BIS Quarterly Review, June 2011
Reporting countries Dec 2008 Dec 2009 Sep 2010 Dec 2010 2009 2010 Q1 2010 Q2 2010 Q3 2010 Q4 2010
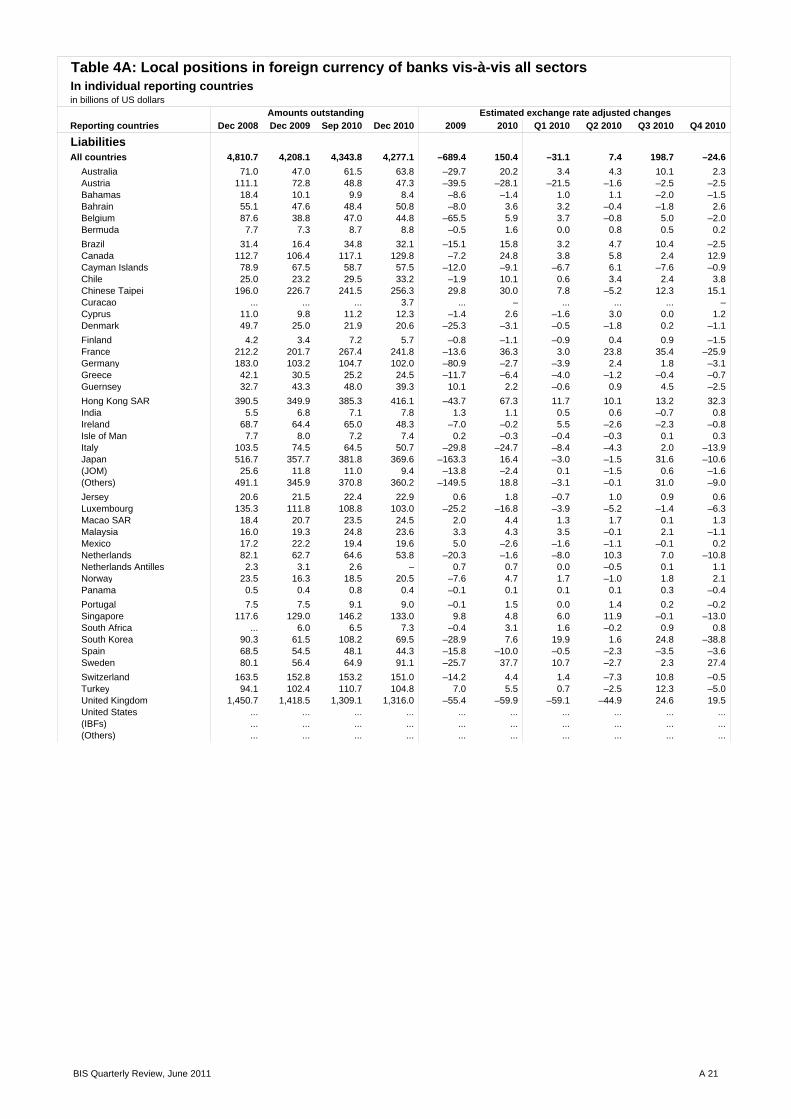
LiabilitiesAll countries 4,810.7 4,208.1 4,343.8 4,277.1 –689.4 150.4 –31.1 7.4 198.7 –24.6
Australia 71.0 47.0 61.5 63.8 –29.7 20.2 3.4 4.3 10.1 2.3 Austria 111.1 72.8 48.8 47.3 –39.5 –28.1 –21.5 –1.6 –2.5 –2.5 Bahamas 18.4 10.1 9.9 8.4 –8.6 –1.4 1.0 1.1 –2.0 –1.5 Bahrain 55.1 47.6 48.4 50.8 –8.0 3.6 3.2 –0.4 –1.8 2.6 Belgium 87.6 38.8 47.0 44.8 –65.5 5.9 3.7 –0.8 5.0 –2.0 Bermuda 7.7 7.3 8.7 8.8 –0.5 1.6 0.0 0.8 0.5 0.2
Brazil 31.4 16.4 34.8 32.1 –15.1 15.8 3.2 4.7 10.4 –2.5 Canada 112.7 106.4 117.1 129.8 –7.2 24.8 3.8 5.8 2.4 12.9 Cayman Islands 78.9 67.5 58.7 57.5 –12.0 –9.1 –6.7 6.1 –7.6 –0.9 Chile 25.0 23.2 29.5 33.2 –1.9 10.1 0.6 3.4 2.4 3.8 Chinese Taipei 196.0 226.7 241.5 256.3 29.8 30.0 7.8 –5.2 12.3 15.1 Curacao ... ... ... 3.7 ... – ... ... ... – Cyprus 11.0 9.8 11.2 12.3 –1.4 2.6 –1.6 3.0 0.0 1.2 Denmark 49.7 25.0 21.9 20.6 –25.3 –3.1 –0.5 –1.8 0.2 –1.1
Finland 4.2 3.4 7.2 5.7 –0.8 –1.1 –0.9 0.4 0.9 –1.5 France 212.2 201.7 267.4 241.8 –13.6 36.3 3.0 23.8 35.4 –25.9 Germany 183.0 103.2 104.7 102.0 –80.9 –2.7 –3.9 2.4 1.8 –3.1 Greece 42.1 30.5 25.2 24.5 –11.7 –6.4 –4.0 –1.2 –0.4 –0.7 Guernsey 32.7 43.3 48.0 39.3 10.1 2.2 –0.6 0.9 4.5 –2.5
Hong Kong SAR 390.5 349.9 385.3 416.1 –43.7 67.3 11.7 10.1 13.2 32.3 India 5.5 6.8 7.1 7.8 1.3 1.1 0.5 0.6 –0.7 0.8 Ireland 68.7 64.4 65.0 48.3 –7.0 –0.2 5.5 –2.6 –2.3 –0.8 Isle of Man 7.7 8.0 7.2 7.4 0.2 –0.3 –0.4 –0.3 0.1 0.3 Italy 103.5 74.5 64.5 50.7 –29.8 –24.7 –8.4 –4.3 2.0 –13.9 Japan 516.7 357.7 381.8 369.6 –163.3 16.4 –3.0 –1.5 31.6 –10.6 (JOM) 25.6 11.8 11.0 9.4 –13.8 –2.4 0.1 –1.5 0.6 –1.6 (Others) 491.1 345.9 370.8 360.2 –149.5 18.8 –3.1 –0.1 31.0 –9.0
Jersey 20.6 21.5 22.4 22.9 0.6 1.8 –0.7 1.0 0.9 0.6 Luxembourg 135.3 111.8 108.8 103.0 –25.2 –16.8 –3.9 –5.2 –1.4 –6.3 Macao SAR 18.4 20.7 23.5 24.5 2.0 4.4 1.3 1.7 0.1 1.3 Malaysia 16.0 19.3 24.8 23.6 3.3 4.3 3.5 –0.1 2.1 –1.1 Mexico 17.2 22.2 19.4 19.6 5.0 –2.6 –1.6 –1.1 –0.1 0.2 Netherlands 82.1 62.7 64.6 53.8 –20.3 –1.6 –8.0 10.3 7.0 –10.8 Netherlands Antilles 2.3 3.1 2.6 – 0.7 0.7 0.0 –0.5 0.1 1.1 Norway 23.5 16.3 18.5 20.5 –7.6 4.7 1.7 –1.0 1.8 2.1 Panama 0.5 0.4 0.8 0.4 –0.1 0.1 0.1 0.1 0.3 –0.4
Portugal 7.5 7.5 9.1 9.0 –0.1 1.5 0.0 1.4 0.2 –0.2 Singapore 117.6 129.0 146.2 133.0 9.8 4.8 6.0 11.9 –0.1 –13.0 South Africa ... 6.0 6.5 7.3 –0.4 3.1 1.6 –0.2 0.9 0.8 South Korea 90.3 61.5 108.2 69.5 –28.9 7.6 19.9 1.6 24.8 –38.8 Spain 68.5 54.5 48.1 44.3 –15.8 –10.0 –0.5 –2.3 –3.5 –3.6 Sweden 80.1 56.4 64.9 91.1 –25.7 37.7 10.7 –2.7 2.3 27.4
Switzerland 163.5 152.8 153.2 151.0 –14.2 4.4 1.4 –7.3 10.8 –0.5 Turkey 94.1 102.4 110.7 104.8 7.0 5.5 0.7 –2.5 12.3 –5.0 United Kingdom 1,450.7 1,418.5 1,309.1 1,316.0 –55.4 –59.9 –59.1 –44.9 24.6 19.5 United States ... ... ... ... ... ... ... ... ... ... (IBFs) ... ... ... ... ... ... ... ... ... ... (Others) ... ... ... ... ... ... ... ... ... ...
Table 4A: Local positions in foreign currency of banks vis-à-vis all sectorsIn individual reporting countriesin billions of US dollars
Amounts outstanding Estimated exchange rate adjusted changes
BIS Quarterly Review, June 2011 A 21

Reporting countries Dec 2008 Dec 2009 Sep 2010 Dec 2010 2009 2010 Q1 2010 Q2 2010 Q3 2010 Q4 2010
AssetsAll countries 2,085.6 1,925.0 2,016.1 1,978.4 –190.0 61.9 54.1 –23.3 62.8 –31.7
Australia 53.7 43.0 49.1 49.3 –11.7 10.5 3.2 2.5 4.4 0.4 Austria 75.1 72.9 74.0 74.8 –4.2 –4.4 0.2 –2.6 –0.3 –1.7 Bahamas 8.1 6.1 6.8 7.6 –2.2 1.8 0.2 0.2 0.5 0.9 Bahrain 28.8 27.5 28.1 28.3 –1.8 1.1 0.5 0.9 –0.7 0.3 Belgium 33.7 31.3 31.5 28.3 –2.9 –3.1 –4.5 2.7 1.7 –3.1 Bermuda 1.5 1.5 1.3 1.3 –0.0 –0.2 –0.2 0.2 –0.2 0.0
Brazil 27.1 19.0 29.5 20.4 –8.1 1.4 1.2 1.2 8.1 –9.1 Canada 38.2 26.4 27.4 29.6 –11.9 3.4 1.8 –1.6 0.9 2.2 Cayman Islands 13.8 11.6 12.0 11.1 –2.2 –0.5 1.0 –0.2 –0.5 –0.8 Chile 23.2 17.5 19.4 21.9 –5.7 4.4 –0.8 3.3 –0.7 2.5 Chinese Taipei 27.8 30.9 38.2 39.6 3.1 8.3 1.3 5.2 0.6 1.3 Curacao ... ... ... 1.3 ... – ... ... ... – Cyprus 9.6 8.9 9.8 10.0 –0.9 0.8 –0.2 0.7 0.2 0.0 Denmark 54.1 59.7 59.3 54.3 3.2 –3.7 –1.6 3.4 –1.0 –4.5
Finland 3.9 3.4 3.5 3.2 –0.5 –0.7 –0.3 –0.9 0.8 –0.3 France 55.7 57.8 66.0 58.3 0.5 –0.9 –1.0 –4.8 13.0 –8.2 Germany 108.2 108.6 117.9 119.8 –1.0 7.1 2.3 7.9 –3.7 0.6 Greece 25.6 26.0 35.0 35.9 0.1 –0.9 –0.1 –0.9 –0.3 0.4 Guernsey 3.9 3.3 3.1 2.5 –0.7 –0.7 –0.1 –0.1 0.1 –0.6
Hong Kong SAR ... ... ... ... ... ... ... ... ... ... India 18.4 21.2 26.0 25.9 2.8 4.7 1.8 2.1 0.9 –0.1 Ireland 61.6 58.8 45.7 43.5 –6.0 –12.7 –6.8 –3.0 –2.6 –0.3 Isle of Man 2.5 2.0 1.7 1.6 –0.5 –0.4 –0.1 –0.2 –0.0 –0.1 Italy 29.2 27.2 28.3 29.4 –2.3 1.5 0.2 0.6 –0.2 0.9 Japan 61.7 63.6 72.8 76.3 1.7 13.1 –0.0 3.5 6.0 3.6 (JOM) ... ... ... ... ... ... ... ... ... ... (Others) 61.7 63.6 72.8 76.3 1.7 13.1 –0.0 3.5 6.0 3.6
Jersey 4.6 1.8 1.9 2.0 –2.7 0.3 0.0 –0.1 0.1 0.2 Luxembourg 15.2 8.1 8.3 7.2 –7.1 –1.9 0.5 –0.4 –0.9 –1.1 Macao SAR 9.6 9.7 10.8 12.1 –0.0 2.5 0.2 0.7 0.3 1.3 Malaysia 4.2 4.1 2.2 2.1 0.0 –2.0 0.4 –2.3 –0.0 –0.0 Mexico 25.3 23.7 24.9 25.7 –1.7 2.0 –1.0 1.0 1.1 0.8 Netherlands 38.7 40.5 42.7 41.9 0.3 1.8 2.8 –1.9 1.6 –0.6 Netherlands Antilles 1.7 2.1 0.8 – 0.4 –0.8 –1.3 0.1 –0.1 0.5 Norway 33.5 28.5 26.9 26.9 –5.6 –1.3 –0.7 0.2 –0.7 –0.0 Panama 0.1 0.2 0.2 0.1 0.2 –0.1 –0.1 –0.0 0.1 –0.1
Portugal 2.7 2.8 3.0 2.9 0.1 0.1 0.2 –0.1 0.1 –0.0 Singapore ... ... ... ... ... ... ... ... ... ... South Africa ... 1.9 2.5 1.8 –0.4 –0.2 0.2 0.1 0.2 –0.7 South Korea 89.1 80.0 90.8 85.2 –8.9 2.4 6.5 0.1 2.0 –6.2 Spain 35.4 28.0 33.2 32.8 –7.7 3.3 3.3 0.7 –0.1 –0.7 Sweden 37.1 36.7 38.0 35.5 –1.3 0.3 1.2 0.2 0.7 –1.9
Switzerland 31.6 33.8 33.3 37.4 1.9 4.1 0.4 –1.2 0.5 4.3 Turkey 30.8 35.1 43.7 48.7 3.9 14.6 4.3 0.4 4.6 5.3 United Kingdom 960.7 859.9 866.4 841.7 –110.3 6.9 38.8 –40.9 26.1 –17.1 United States ... ... ... ... ... ... ... ... ... ... (IBFs) ... ... ... ... ... ... ... ... ... ... (Others) ... ... ... ... ... ... ... ... ... ...
Table 4B: Local positions in foreign currency of banks vis-à-vis the non-bank sectorIn individual reporting countriesin billions of US dollars
Amounts outstanding Estimated exchange rate adjusted changes
A 22 BIS Quarterly Review, June 2011

Reporting countries Dec 2008 Dec 2009 Sep 2010 Dec 2010 2009 2010 Q1 2010 Q2 2010 Q3 2010 Q4 2010
LiabilitiesAll countries 1,937.0 1,880.1 1,955.5 1,977.2 –91.3 150.0 24.4 7.8 79.4 38.4
Australia 33.1 30.4 38.0 43.5 –5.4 13.5 1.8 3.7 2.4 5.6 Austria 5.2 4.8 6.4 5.5 –0.4 0.7 –0.2 0.3 1.5 –0.9 Bahamas 7.6 5.7 5.4 4.4 –2.2 –1.2 0.5 0.5 –1.2 –0.9 Bahrain 35.1 32.3 33.3 34.1 –3.3 2.1 2.0 0.6 –1.4 0.9 Belgium 34.1 21.7 27.5 25.0 –13.1 3.2 1.5 0.1 4.0 –2.4 Bermuda 7.4 7.2 7.5 8.7 –0.4 1.6 0.1 0.8 –0.4 1.2
Brazil 9.7 12.6 20.7 24.3 2.8 11.7 –0.9 2.6 6.3 3.7 Canada 109.8 104.1 114.4 126.5 –6.5 23.8 3.1 6.0 2.5 12.3 Cayman Islands 46.9 49.1 43.0 41.6 1.6 –7.1 –5.6 2.0 –2.4 –1.2 Chile 21.9 21.9 28.6 31.3 0.0 9.3 –0.4 3.4 3.7 2.7 Chinese Taipei 134.2 145.8 153.8 166.4 11.0 21.2 4.5 –5.3 9.2 12.9 Cucacao ... ... ... 3.3 ... – ... ... ... – Cyprus 10.3 9.6 11.0 12.2 –0.9 2.6 –1.6 3.1 –0.0 1.2 Denmark 13.3 10.9 10.9 11.1 –2.6 0.5 –0.7 0.7 0.2 0.3
Finland 2.0 2.1 5.6 3.9 0.1 1.0 –0.2 0.4 2.5 –1.7 France 20.7 20.6 22.2 18.7 –0.6 –1.9 –1.3 –0.8 3.7 –3.5 Germany 30.9 34.6 33.7 35.1 3.2 0.3 –5.1 1.6 2.4 1.4 Greece 37.4 29.3 24.6 24.2 –8.1 –5.6 –3.9 –1.1 0.0 –0.5 Guernsey 29.0 29.7 33.3 25.2 0.4 1.6 0.7 –1.0 3.8 –1.9
Hong Kong SAR ... ... ... ... ... ... ... ... ... ... India 3.9 4.8 5.0 5.3 0.9 0.5 0.5 0.5 –0.8 0.3 Ireland 25.7 20.1 18.3 21.6 –6.6 2.2 2.1 –1.1 –2.7 3.8 Isle of Man 7.5 7.3 6.5 6.7 –0.2 –0.4 –0.6 –0.3 0.1 0.3 Italy 16.0 14.4 12.7 12.9 –1.7 –1.5 –1.0 –0.9 0.3 0.2 Japan 200.1 196.3 234.8 235.9 –5.8 41.8 9.4 11.4 19.1 2.0 (JOM) ... ... ... ... ... ... ... ... ... ... (Others) 200.1 196.3 234.8 235.9 –5.8 41.8 9.4 11.4 19.1 2.0
Jersey 16.2 17.3 18.1 16.9 0.9 –0.1 –0.3 0.3 1.0 –1.1 Luxembourg 55.3 53.5 41.8 42.5 –2.5 –4.7 –3.7 –2.3 0.7 0.6 Macao SAR 18.2 20.3 22.9 23.6 1.7 3.8 1.1 1.4 0.4 0.9 Malaysia 9.0 12.9 16.4 15.9 3.9 3.0 2.1 0.9 0.4 –0.4 Mexico 16.1 18.1 17.5 18.0 2.0 –0.0 1.4 –1.5 –0.5 0.5 Netherlands 35.4 33.0 29.9 30.3 –3.0 6.1 5.8 0.5 –0.5 0.4 Netherlands Antilles 1.9 2.6 2.1 – 0.7 0.7 0.0 –0.5 0.1 1.2 Norway 20.0 14.6 17.1 18.7 –5.7 4.4 0.5 0.5 1.7 1.7 Panama 0.3 0.3 0.4 0.2 0.0 –0.0 0.1 0.0 0.0 –0.2
Portugal 5.0 5.2 4.9 5.0 0.2 –0.2 –0.3 –0.4 0.3 0.1 Singapore ... ... ... ... ... ... ... ... ... ... South Africa ... 4.7 5.5 5.8 0.2 1.3 –0.2 0.1 1.0 0.4 South Korea 34.1 29.4 35.7 28.5 –4.7 –1.0 3.9 –4.0 6.2 –7.1 Spain 51.1 47.6 41.2 41.0 –5.2 –6.2 –1.1 –2.5 –2.6 0.0 Sweden 22.6 19.2 24.0 22.6 –4.3 4.2 4.3 –0.1 1.0 –1.1
Switzerland 139.7 128.3 126.9 126.3 –14.4 3.4 0.6 –5.4 7.3 0.9 Turkey 90.5 98.4 106.4 99.8 6.7 4.4 0.9 –2.7 11.9 –5.7 United Kingdom 579.7 559.2 547.4 554.7 –30.0 10.7 4.5 –3.6 –1.7 11.6 United States ... ... ... ... ... ... ... ... ... ... (IBFs) ... ... ... ... ... ... ... ... ... ... (Others) ... ... ... ... ... ... ... ... ... ...
Table 4B: Local positions in foreign currency of banks vis-à-vis the non-bank sectorIn individual reporting countriesin billions of US dollars
Amounts outstanding Estimated exchange rate adjusted changes
BIS Quarterly Review, June 2011 A 23

Currencies Dec 2008 Dec 2009 Sep 2010 Dec 2010 2009 2010 Q1 2010 Q2 2010 Q3 2010 Q4 2010
Assets
All Currencies 31,288.1 30,073.7 31,016.4 30,117.1 –1,957.6 860.5 614.7 16.9 651.6 –422.6
A) Domestic currency 13,026.4 12,766.5 13,130.6 12,497.9 –673.3 276.7 342.7 54.5 218.1 –338.6
U.S. dollar 2,593.5 2,806.7 3,217.3 3,244.2 221.2 429.5 188.9 56.2 157.5 26.8
Euro 8,389.9 8,109.9 7,867.2 7,273.5 –538.2 –207.9 117.9 1.7 –29.0 –298.5
Yen 715.5 587.2 701.7 728.6 –117.8 59.1 11.4 14.6 24.4 8.7
Pound sterling 846.0 777.7 797.4 726.3 –170.0 –12.3 24.1 –15.9 20.6 –41.2
Swiss franc 115.3 99.4 94.2 97.1 –18.9 –10.4 –1.0 –10.4 1.8 –0.8
Other 366.2 385.6 452.8 428.2 –49.6 18.7 1.5 8.3 42.7 –33.7
B) Foreign currency 16,706.5 15,829.2 16,274.5 15,968.1 –1,194.9 426.6 231.4 –62.7 380.7 –122.8
U.S. dollar 9,658.0 9,014.5 9,340.0 9,229.5 –668.9 288.2 60.2 –139.4 410.8 –43.4
Euro 3,763.0 3,577.1 3,561.1 3,313.0 –340.4 –41.1 72.8 168.2 –91.0 –191.2
Yen 659.3 455.1 501.3 532.1 –197.4 19.1 –2.7 –10.6 9.8 22.6
Pound sterling 921.0 930.8 899.3 820.3 –97.5 –45.1 –1.9 –16.3 2.6 –29.6
Swiss franc 368.8 329.2 353.0 369.0 –50.7 9.4 –1.8 4.5 1.6 5.1
Other 1,336.3 1,522.5 1,619.8 1,704.3 160.1 196.1 104.7 –69.2 46.8 113.7
C) Unallocated 1,555.3 1,477.9 1,611.3 1,651.0 –89.3 157.3 40.5 25.1 52.8 38.9
Liabilities
All Currencies 29,170.7 28,127.5 29,100.5 28,461.5 –1,797.3 928.1 505.1 34.6 654.7 –266.3
A) Domestic currency 11,832.0 11,489.4 12,113.9 11,736.2 –785.7 632.5 284.2 273.2 189.3 –114.2
US dollar 3,372.0 3,167.5 3,324.4 3,390.3 –201.9 221.1 69.2 –16.1 102.0 66.0
Euro 6,430.1 6,246.4 6,588.8 6,180.6 –399.1 385.2 252.9 216.1 68.2 –151.9
Yen 381.3 334.8 403.8 407.6 –41.5 25.7 –27.4 34.6 25.1 –6.5
Pound sterling 1,032.1 1,045.8 1,027.5 973.9 –117.2 –53.9 –3.0 –16.7 –10.5 –23.7
Swiss franc 91.4 92.6 102.4 112.9 –2.3 9.7 0.1 7.6 –4.1 6.2
Other 525.2 602.3 667.0 671.0 –23.7 44.6 –7.6 47.7 8.6 –4.2
B) Foreign currency 16,071.8 15,439.9 15,638.2 15,324.0 –931.1 86.0 162.2 –303.5 436.0 –208.8
U.S. dollar 9,262.0 9,075.3 9,319.9 9,307.6 –210.4 258.9 –47.8 –198.1 487.9 16.9
Euro 3,273.0 3,177.3 3,051.7 2,826.6 –230.6 –131.3 106.5 –10.3 –63.9 –163.6
Yen 834.6 587.3 614.1 599.1 –239.5 –53.8 7.1 –12.1 –26.4 –22.3
Pound sterling 1,009.9 858.4 825.9 755.9 –253.4 –66.8 –0.9 –12.4 –5.9 –47.5
Swiss franc 405.6 372.6 337.7 345.9 –49.7 –51.4 0.7 –28.6 –16.7 –6.8
Other 1,286.6 1,369.0 1,488.8 1,488.8 52.3 130.3 96.7 –42.0 61.1 14.5
C) Unallocated 1,266.8 1,198.3 1,348.4 1,401.3 –80.5 209.6 58.7 64.8 29.4 56.7
Table 5A: Currency Breakdown Reporting banks' cross-border positions vis-à-vis all sectorsin billions of US dollars
Amounts outstanding Estimated exchange rate adjusted changes
A 24 BIS Quarterly Review, June 2011
Currencies Dec 2008 Dec 2009 Sep 2010 Dec 2010 2009 2010 Q1 2010 Q2 2010 Q3 2010 Q4 2010
Assets
All currencies 11,001.8 10,828.7 11,172.5 10,996.1 –426.4 441.8 235.5 –117.2 368.1 –44.6
A) Domestic currency 4,155.0 4,146.9 4,112.3 4,036.7 –151.2 62.4 71.7 –69.4 72.7 –12.5
U.S. dollar 545.6 603.7 708.8 724.4 31.6 120.7 49.7 15.6 39.7 15.7
Euro 3,021.8 2,950.7 2,715.4 2,580.1 –154.0 –156.1 1.0 –84.2 –8.3 –64.6
Yen 256.1 236.3 308.0 330.2 –15.6 58.1 10.7 16.0 17.4 14.1
Pound sterling 193.8 199.6 225.1 241.3 –17.9 43.9 7.9 –5.1 21.0 20.1
Swiss franc 27.8 26.2 29.4 29.8 –2.5 0.9 –0.2 –0.5 2.4 –0.7
Other 109.9 130.4 125.5 130.9 7.3 –5.1 2.5 –11.2 0.6 3.0
B) Foreign currency 6,462.1 6,298.1 6,618.8 6,492.4 –271.9 297.4 146.8 –69.8 279.2 –58.9
U.S. dollar 3,977.2 3,831.0 4,090.7 4,039.4 –149.1 251.3 97.3 –57.9 224.9 –13.0
Euro 1,277.2 1,239.7 1,245.7 1,171.8 –85.2 –32.4 14.7 14.9 23.6 –85.6
Yen 225.1 142.6 142.5 161.4 –78.1 2.0 –11.7 –7.7 5.8 15.6
Pound sterling 300.8 310.3 310.8 273.6 –25.0 –4.4 11.2 –9.8 2.9 –8.7
Swiss franc 124.7 115.7 120.0 120.7 –12.3 –3.4 0.1 –2.7 1.1 –1.9
Other 557.2 658.8 709.2 725.4 77.9 84.4 35.2 –6.6 21.0 34.8
C) Unallocated 384.7 383.7 441.4 466.9 –3.3 81.9 17.0 22.0 16.1 26.8
Liabilities
All currencies 7,706.6 7,281.6 7,607.6 7,628.8 –492.1 426.4 126.3 21.7 235.2 43.2
A) Domestic currency 2,747.3 2,620.5 2,708.7 2,714.1 –208.4 134.1 59.3 19.4 43.2 12.2
US dollar 957.6 826.8 857.4 849.3 –134.3 22.5 24.8 –2.5 8.3 –8.1
Euro 1,178.0 1,132.3 1,165.1 1,178.8 –66.1 124.4 53.8 19.2 30.6 20.8
Yen 83.0 69.6 78.3 80.0 –12.0 1.2 –2.9 1.5 2.9 –0.3
Pound sterling 333.4 365.2 360.2 354.8 –9.6 –28.3 –10.2 –13.9 –4.9 0.7
Swiss franc 38.3 41.5 49.3 49.6 1.8 3.1 0.1 5.4 –0.8 –1.6
Other 157.0 185.1 198.5 201.6 11.8 11.2 –6.2 9.6 7.2 0.7
B) Foreign currency 4,550.1 4,239.0 4,475.1 4,478.5 –292.1 275.9 71.1 6.0 181.7 17.2
U.S. dollar 2,968.4 2,730.4 2,960.9 3,044.0 –193.4 302.3 31.1 15.3 174.5 81.4
Euro 936.9 911.0 922.9 870.8 –50.7 13.5 62.2 –22.2 6.7 –33.2
Yen 129.5 107.8 121.5 106.3 –16.1 –15.2 –12.9 9.6 5.5 –17.5
Pound sterling 192.0 170.0 150.9 133.4 –26.8 –37.1 –19.3 5.6 –7.3 –16.1
Swiss franc 67.9 57.2 53.9 56.5 –10.2 –8.3 3.3 –3.5 –6.2 –2.0
Other 255.4 262.8 264.8 267.5 5.1 20.8 6.5 1.1 8.4 4.6
C) Unallocated 409.2 422.1 423.7 436.2 8.4 16.4 –4.1 –3.7 10.3 13.8
Table 5B: Currency BreakdownReporting banks' cross border positions vis-à-vis non-banksIn billions of US dollars
Amounts outstanding Estimated exchange rate adjusted changes
BIS Quarterly Review, June 2011 A 25

Currencies Dec 2008 Dec 2009 Sep 2010 Dec 2010 2009 2010 Q1 2010 Q2 2010 Q3 2010 Q4 2010
Assets
All Currencies 195.4 151.1 171.0 187.7 –45.3 12.5 15.5 7.7 –28.8 18.2
A) Domestic currency 105.2 54.4 34.1 34.9 –50.1 –44.0 –1.7 2.1 –45.8 1.4
U.S. dollar ... ... ... ... ... ... ... ... ... ...
Euro 96.7 46.2 28.3 29.5 –48.9 –41.4 –2.3 2.7 –43.5 1.8
Yen 0.0 0.0 – 0.0 0.0 –0.0 –0.0 –0.0 – 0.0
Pound sterling 6.3 5.6 2.3 2.4 –1.4 –2.9 0.2 –2.0 –1.3 0.2
Swiss franc 0.1 0.1 0.2 0.0 –0.0 –0.1 –0.1 0.1 0.0 –0.1
Other 2.1 2.4 3.4 3.0 0.2 0.4 0.6 1.3 –1.0 –0.5
B) Foreign currency 77.6 77.0 98.9 95.0 –2.2 19.1 12.6 3.9 5.8 –3.2
U.S. dollar 29.2 40.6 40.2 34.9 11.3 –6.2 7.4 –9.5 1.2 –5.3
Euro 23.1 17.3 23.0 31.6 –7.1 16.0 7.5 3.5 –4.2 9.2
Yen 1.7 1.1 3.6 2.2 –0.6 0.9 0.1 –0.3 2.5 –1.4
Pound sterling 3.5 4.7 12.8 11.4 1.1 7.5 –2.6 10.2 1.0 –1.1
Swiss franc 2.4 0.9 5.7 2.8 –1.7 1.3 –0.1 1.8 2.7 –3.0
Other 17.7 12.4 13.6 12.0 –5.2 –0.4 0.3 –1.8 2.7 –1.5
C) Unallocated 12.5 19.7 37.9 57.8 7.0 37.4 4.5 1.7 11.2 20.0
Liabilities
All Currencies 1,140.9 858.8 850.9 849.7 –300.0 11.3 18.9 –3.7 –8.1 4.3
A) Domestic currency 441.5 355.2 348.5 349.2 –98.0 8.6 17.1 2.2 –14.6 3.9
U.S. dollar 194.2 163.9 161.2 158.5 –30.3 –5.4 –15.7 –0.4 13.5 –2.7
Euro 195.4 129.0 128.7 121.8 –72.6 6.3 29.2 2.4 –21.2 –4.2
Yen 3.2 2.3 1.4 1.2 –0.7 –1.3 –0.8 0.2 –0.6 –0.2
Pound sterling 42.3 49.2 43.2 48.4 2.2 1.0 2.8 –2.7 –5.1 6.0
Swiss franc 0.2 0.1 0.1 0.9 –0.1 0.8 0.0 0.2 –0.3 0.8
Other 6.3 10.6 13.9 18.2 3.4 7.3 1.5 2.5 –1.0 4.2
B) Foreign currency 668.0 440.0 409.7 425.2 –233.5 –9.0 –6.9 –13.4 –6.3 17.6
U.S. dollar 388.7 271.0 253.3 255.9 –118.4 –15.4 –6.4 –26.8 15.2 2.7
Euro 97.2 72.8 71.5 80.2 –25.4 12.6 1.1 15.3 –14.1 10.4
Yen 14.0 12.4 12.3 12.6 –1.3 –0.9 –1.4 –4.3 4.8 0.0
Pound sterling 59.3 23.6 12.3 12.2 –39.4 –10.5 –0.7 –1.8 –8.1 0.0
Swiss franc 33.0 21.1 3.4 3.7 –11.9 –16.8 –5.7 –8.5 –2.6 0.1
Other 75.9 39.1 56.7 60.6 –37.1 21.9 6.2 12.7 –1.4 4.5
C) Unallocated 31.4 63.5 92.7 75.3 31.5 11.7 8.7 7.5 12.8 –17.3
Table 5C: Currency breakdownReporting banks' cross border positions vis-à-vis official monetary authoritiesin billions of US dollars
Amounts outstanding Estimated exchange rate adjusted changes
A 26 BIS Quarterly Review, June 2011

Currencies Dec 2008 Dec 2009 Sep 2010 Dec 2010 2009 2010 Q1 2010 Q2 2010 Q3 2010 Q4 2010
Assets
All currencies 4,074.9 3,758.7 3,881.3 3,821.1 –391.2 113.6 51.6 –32.2 125.1 –31.0
US dollar 1,931.4 1,696.5 1,745.2 1,696.1 –247.1 –2.3 1.9 –62.5 102.1 –43.8
Euro 1,094.1 1,043.3 989.4 942.1 –81.2 –24.8 13.9 –6.6 –5.2 –26.9
Yen 156.8 145.3 173.0 163.3 –10.7 –0.1 4.0 8.3 –0.8 –11.6
Pound sterling 124.9 140.0 165.4 149.6 –3.5 20.9 3.8 17.9 5.5 –6.3
Swiss franc 251.7 252.5 237.9 240.4 –6.9 –34.5 –9.8 –13.7 –5.1 –5.9
Other 217.8 217.2 231.4 258.3 –5.4 50.2 6.4 –0.4 12.8 31.5
Unallocated 298.2 263.8 339.0 371.2 –36.2 104.2 31.4 24.9 15.8 32.1
Liabilities
All currencies 4,810.7 4,208.1 4,343.8 4,277.1 –689.4 150.4 –31.1 7.4 198.7 –24.6
US dollar 2,527.7 1,921.9 2,030.6 1,955.2 –627.9 50.0 –61.5 –0.4 178.6 –66.7
Euro 951.9 934.8 880.8 864.0 –46.6 –2.3 3.1 –10.8 3.8 1.7
Yen 161.1 126.4 136.5 131.0 –33.6 –11.0 1.4 –3.3 –2.4 –6.7
Pound sterling 145.6 153.4 161.5 149.5 –12.4 5.9 1.1 6.6 1.6 –3.4
Swiss franc 122.0 131.4 124.0 118.0 5.2 –23.9 –9.2 –2.7 –4.8 –7.3
Other 373.5 437.5 452.7 482.0 57.3 54.3 15.1 –5.3 8.5 36.0
Unallocated 528.8 502.6 557.6 577.3 –31.3 77.2 18.9 23.2 13.3 21.8
Assets
All currencies 2,085.6 1,925.0 2,016.1 1,978.4 –190.0 61.9 54.1 –23.3 62.8 –31.7
US dollar 1,015.2 945.3 1,004.5 995.0 –73.2 40.6 33.2 –35.6 52.2 –9.1
Euro 603.4 524.5 532.4 502.8 –92.2 16.0 19.5 17.4 –2.3 –18.6
Yen 99.3 97.2 115.3 108.4 –1.4 –2.2 1.1 4.4 1.9 –9.6
Pound sterling 60.3 65.1 62.0 58.7 –3.1 –2.6 0.8 –1.5 –1.0 –0.9
Swiss franc 166.1 168.1 161.2 165.6 –3.5 –18.5 –5.6 –8.4 –2.8 –1.7
Other 130.0 113.2 129.1 134.5 –17.0 26.9 6.3 –0.4 14.6 6.4
Unallocated 11.3 11.8 11.6 13.3 0.4 1.7 –1.1 0.8 0.2 1.8
Liabilities
All currencies 1,937.0 1,880.1 1,955.5 1,977.2 –91.3 150.0 24.4 7.8 79.4 38.4
US dollar 1,123.2 1,091.2 1,162.2 1,192.4 –42.0 118.6 –5.5 5.6 84.7 33.8
Euro 509.4 482.1 481.0 464.5 –44.2 18.0 21.8 8.1 –5.5 –6.5
Yen 64.3 52.2 55.0 56.8 –11.9 –2.5 5.4 –5.3 –3.1 0.5
Pound sterling 68.6 73.2 64.5 65.6 –3.8 –4.2 –2.9 –4.0 –0.1 2.7
Swiss franc 28.4 31.2 30.0 27.9 1.7 –2.6 –1.1 –1.3 0.3 –0.5
Other 123.0 127.3 137.8 143.1 6.5 18.3 5.6 3.8 2.6 6.3
Unallocated 20.1 22.9 25.0 26.9 2.4 4.5 1.1 0.9 0.5 2.0
Vis-à-vis the non-bank sector
Amounts outstanding Estimated exchange rate adjusted changes
Table 5D: Currency breakdownReporting banks' local positions in foreign currencyin billions of US dollars
Vis-à-vis all sectors
BIS Quarterly Review, June 2011 A 27

Vis-à-vis countries Dec 2008 Dec 2009 Sep 2010 Dec 2010 2009 2010 Q1 2010 Q2 2010 Q3 2010 Q4 2010
AssetsAll countries 31,288,128 30,073,656 31,016,377 30,117,091 –1,957,568 860,548 614,656 16,944 651,563 –422,615 Developed Countries 24,389,626 23,328,884 23,863,397 22,840,985 –1,696,743 91,438 361,716 –138,001 442,971 –575,248 i) Europe 17,687,057 16,812,532 16,940,195 15,995,575 –1,459,278 –238,968 222,994 –116,686 206,332 –551,608
Euro area 10,970,621 10,625,317 10,354,108 9,641,338 –708,617 –418,934 –18,483 –70,258 91,982 –422,175
(of which in EUR) 7,978,066 7,924,075 7,711,967 7,096,971 –334,947 –259,314 67,721 72,920 –40,155 –359,800
Austria 283,251 258,617 257,677 240,725 –33,737 –3,854 3,822 9,025 –4,921 –11,780 Belgium 502,259 490,162 502,637 468,282 –27,369 –14,320 –30,420 –1,452 44,026 –26,474 Cyprus 75,131 107,562 84,950 69,667 28,353 –32,426 1,732 –1,417 –18,376 –14,365
Finland 148,109 164,814 163,122 172,273 11,204 12,625 –11,482 11,823 568 11,716 France 1,818,205 1,748,957 1,851,856 1,770,617 –121,957 70,072 84,294 –44,864 81,854 –51,212 Germany 1,750,504 1,697,259 1,842,218 1,787,956 –114,317 102,845 24,596 119,044 18,332 –59,127 Greece 209,110 240,814 190,741 174,181 23,296 –44,904 7,515 –8,242 –35,109 –9,068
Ireland 1,250,100 1,171,400 1,046,891 832,657 –126,564 –198,779 –29,269 –41,343 –28,910 –99,257 Italy 1,154,619 1,147,053 1,001,289 914,117 –49,987 –123,384 –23,459 –62,766 1,596 –38,755 Luxembourg 982,234 884,533 886,084 922,786 –123,639 81,195 –3,882 9,370 24,174 51,533 Malta 44,677 39,489 36,109 35,669 –5,984 –2,156 1,174 –3,003 –339 12
Netherlands 1,306,953 1,238,998 1,253,240 1,121,349 –109,361 –58,423 –16,839 27,880 38,643 –108,107 Portugal 272,413 281,293 237,518 219,082 –458 –37,807 4,334 –18,535 –12,217 –11,389 Slovakia 27,286 18,014 20,130 20,314 –9,398 3,419 549 86 2,028 756 Slovenia 35,061 31,971 30,982 29,029 –4,136 –574 –204 5 604 –979 Spain 1,110,709 1,104,381 948,664 862,634 –44,563 –172,465 –30,944 –65,868 –19,974 –55,679
Andorra 2,178 3,739 2,394 2,573 1,449 –921 –759 –147 –237 222 Denmark 274,117 297,912 302,473 290,058 13,076 –13,146 9,844 –32,148 16,799 –7,641 Iceland 31,166 26,173 25,956 14,425 –5,535 –892 1,002 –1,043 950 –1,801 Liechtenstein 8,375 7,768 7,703 8,659 –754 1,113 –431 –127 700 971 Norway 281,486 239,720 234,568 235,557 –47,519 –5,243 –1,961 5,019 –11,242 2,941
Sweden 308,328 306,339 311,153 308,735 –8,950 1,645 6,210 –2,347 –3,122 904 Switzerland 743,936 611,792 602,985 606,183 –155,753 –14,190 –96 5,896 –21,130 1,140 (of which in CHF) 149,689 138,433 169,089 179,833 –16,287 24,878 –30 11,086 8,673 5,149 United Kingdom 5,064,985 4,691,733 5,096,813 4,886,344 –546,685 211,823 227,723 –22,074 132,039 –125,865 (of which in GBP) 716,292 758,085 731,678 657,588 –45,687 –46,857 –3,377 –18,892 7,024 –31,612
Vatican 1 – 1 1 –119 –3 34 –31 –6 – Other 1,864 2,039 2,041 1,702 125 –221 –89 572 –400 –304
LiabilitiesAll Countries 29,170,678 28,127,534 29,100,474 28,461,503 –1,797,348 928,098 505,097 34,570 654,704 –266,273 Developed Countries 18,976,588 18,039,883 19,285,273 18,680,101 –1,416,300 840,000 522,753 141,622 442,417 –266,792 i) Europe 13,710,249 12,813,297 13,598,582 12,885,412 –1,340,030 308,450 310,207 104,365 280,563 –386,685
Euro area 7,364,104 6,923,382 7,039,852 6,651,295 –670,133 –20,014 –15,916 56,491 130,032 –190,621
(of which in EUR) 4,768,206 4,627,557 4,729,765 4,399,713 –299,463 30,929 62,232 44,831 84,618 –160,752
Austria 127,244 123,472 113,728 97,626 –9,148 –20,713 11,778 4,777 –22,577 –14,691 Belgium 524,148 529,798 556,285 537,141 –15,501 –7,681 –16,770 –3,452 22,577 –10,036 Cyprus 48,786 59,923 57,884 47,306 9,257 –9,749 1,602 –5,697 4,029 –9,683
Finland 111,508 118,064 112,716 113,867 2,532 –2,782 –14,074 5,057 3,991 2,244 France 1,149,921 1,138,957 1,275,945 1,216,718 –48,194 94,180 43,894 7,449 81,964 –39,127 Germany 2,112,893 1,950,628 1,927,622 1,826,363 –225,958 2,486 –19,208 25,894 –5,552 1,352 Greece 99,198 124,566 121,781 107,111 20,251 –8,839 14,692 11,235 –21,781 –12,985
Ireland 621,636 590,558 636,761 556,991 –62,058 –8,776 9,042 7,574 24,608 –50,000 Italy 328,877 310,474 306,164 301,321 –26,428 –446 –13,335 7,539 5,094 256 Luxembourg 893,825 775,114 773,227 775,469 –128,940 23,639 –8,436 –10,244 30,688 11,631 Malta 17,842 18,443 20,582 20,854 96 2,988 1,641 1,510 –691 528
Netherlands 902,020 770,330 742,011 672,174 –160,378 –67,985 –17,961 –201 10,304 –60,127 Portugal 102,918 98,022 104,477 96,297 –7,265 4,971 6,154 2,721 2,610 –6,514 Slovakia 3,542 5,850 6,012 5,926 1,831 375 26 412 –87 24 Slovenia 5,043 4,686 3,797 3,119 –433 –1,516 –941 514 –463 –626 Spain 314,703 304,497 280,860 273,012 –19,797 –20,168 –14,020 1,402 –4,682 –2,868
Andorra 7,755 4,197 3,380 3,113 –3,736 –949 –843 547 –430 –223 Denmark 190,068 159,348 187,830 183,414 –39,267 8,569 3,577 –3,836 10,896 –2,068 Iceland 7,615 4,852 7,115 6,113 –3,208 1,227 408 827 916 –924 Liechtenstein 34,836 30,089 22,392 22,244 –5,500 –4,590 332 –4,284 –604 –34 Norway 120,594 86,012 105,949 103,143 –44,712 –11,880 2,286 15,762 –28,028 –1,900
Sweden 151,382 162,851 207,374 191,378 2,974 16,421 28,833 1,713 –192 –13,933 Switzerland 1,221,238 997,420 924,416 926,732 –245,957 –66,101 –5,887 –36,093 –33,367 9,246 (of which in CHF) 145,062 125,560 94,307 93,786 –22,966 –34,985 –8,415 –17,135 –5,451 –3,984 United Kingdom 4,606,426 4,441,245 5,096,532 4,794,178 –327,906 385,382 297,477 73,340 200,919 –186,354 (of which in GBP) 627,886 500,137 492,450 420,932 –187,857 –66,589 –2,828 –16,410 7,047 –54,398
Vatican 1,923 1,221 1,422 1,378 –778 235 –88 –89 437 –25 Other 4,308 2,680 2,320 2,424 –1,808 153 29 –12 –15 151
Amounts outstanding Estimated exchange rate adjusted changes
Table 6A: External positions of reporting banks vis-à-vis all sectorsVis-à-vis individual countriesin millions of US dollars
A 28 BIS Quarterly Review, June 2011
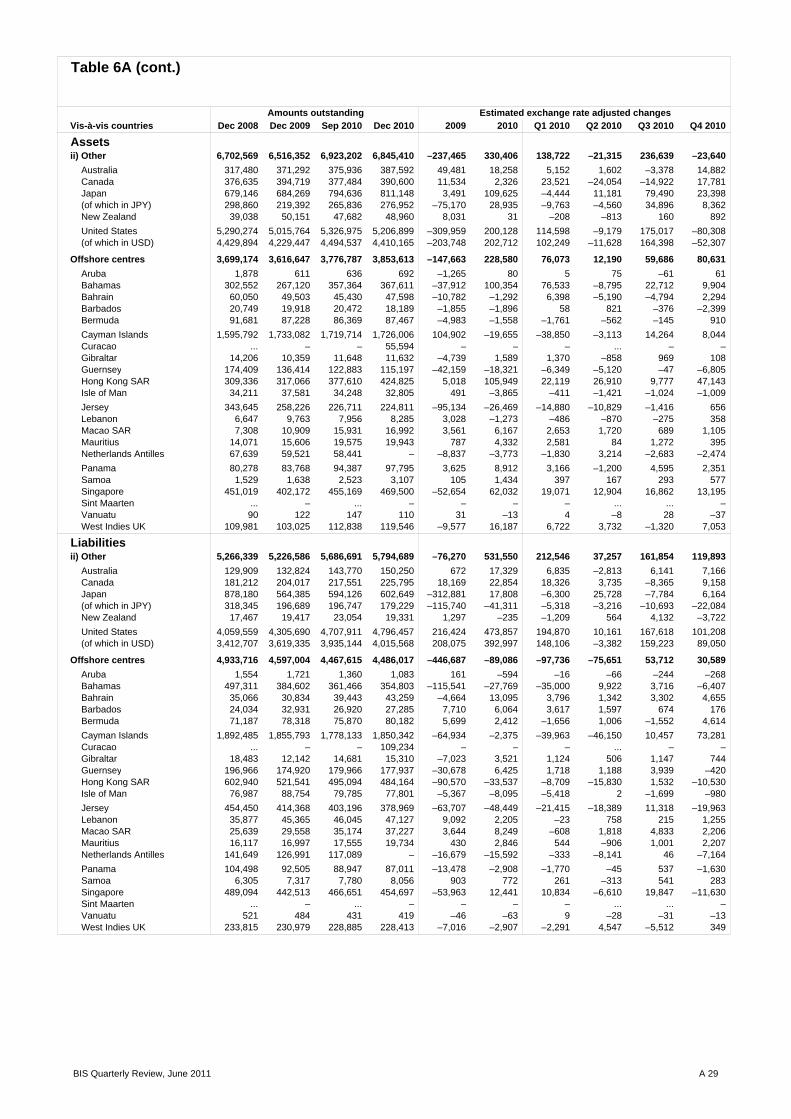
Vis-à-vis countries Dec 2008 Dec 2009 Sep 2010 Dec 2010 2009 2010 Q1 2010 Q2 2010 Q3 2010 Q4 2010
Assetsii) Other 6,702,569 6,516,352 6,923,202 6,845,410 –237,465 330,406 138,722 –21,315 236,639 –23,640
Australia 317,480 371,292 375,936 387,592 49,481 18,258 5,152 1,602 –3,378 14,882 Canada 376,635 394,719 377,484 390,600 11,534 2,326 23,521 –24,054 –14,922 17,781 Japan 679,146 684,269 794,636 811,148 3,491 109,625 –4,444 11,181 79,490 23,398 (of which in JPY) 298,860 219,392 265,836 276,952 –75,170 28,935 –9,763 –4,560 34,896 8,362 New Zealand 39,038 50,151 47,682 48,960 8,031 31 –208 –813 160 892
United States 5,290,274 5,015,764 5,326,975 5,206,899 –309,959 200,128 114,598 –9,179 175,017 –80,308 (of which in USD) 4,429,894 4,229,447 4,494,537 4,410,165 –203,748 202,712 102,249 –11,628 164,398 –52,307
Offshore centres 3,699,174 3,616,647 3,776,787 3,853,613 –147,663 228,580 76,073 12,190 59,686 80,631 Aruba 1,878 611 636 692 –1,265 80 5 75 –61 61 Bahamas 302,552 267,120 357,364 367,611 –37,912 100,354 76,533 –8,795 22,712 9,904 Bahrain 60,050 49,503 45,430 47,598 –10,782 –1,292 6,398 –5,190 –4,794 2,294 Barbados 20,749 19,918 20,472 18,189 –1,855 –1,896 58 821 –376 –2,399 Bermuda 91,681 87,228 86,369 87,467 –4,983 –1,558 –1,761 –562 –145 910
Cayman Islands 1,595,792 1,733,082 1,719,714 1,726,006 104,902 –19,655 –38,850 –3,113 14,264 8,044 Curacao ... – – 55,594 – – – ... – – Gibraltar 14,206 10,359 11,648 11,632 –4,739 1,589 1,370 –858 969 108 Guernsey 174,409 136,414 122,883 115,197 –42,159 –18,321 –6,349 –5,120 –47 –6,805 Hong Kong SAR 309,336 317,066 377,610 424,825 5,018 105,949 22,119 26,910 9,777 47,143 Isle of Man 34,211 37,581 34,248 32,805 491 –3,865 –411 –1,421 –1,024 –1,009
Jersey 343,645 258,226 226,711 224,811 –95,134 –26,469 –14,880 –10,829 –1,416 656 Lebanon 6,647 9,763 7,956 8,285 3,028 –1,273 –486 –870 –275 358 Macao SAR 7,308 10,909 15,931 16,992 3,561 6,167 2,653 1,720 689 1,105 Mauritius 14,071 15,606 19,575 19,943 787 4,332 2,581 84 1,272 395 Netherlands Antilles 67,639 59,521 58,441 – –8,837 –3,773 –1,830 3,214 –2,683 –2,474
Panama 80,278 83,768 94,387 97,795 3,625 8,912 3,166 –1,200 4,595 2,351 Samoa 1,529 1,638 2,523 3,107 105 1,434 397 167 293 577 Singapore 451,019 402,172 455,169 469,500 –52,654 62,032 19,071 12,904 16,862 13,195 Sint Maarten ... – ... – – – – ... ... – Vanuatu 90 122 147 110 31 –13 4 –8 28 –37 West Indies UK 109,981 103,025 112,838 119,546 –9,577 16,187 6,722 3,732 –1,320 7,053
Liabilitiesii) Other 5,266,339 5,226,586 5,686,691 5,794,689 –76,270 531,550 212,546 37,257 161,854 119,893
Australia 129,909 132,824 143,770 150,250 672 17,329 6,835 –2,813 6,141 7,166 Canada 181,212 204,017 217,551 225,795 18,169 22,854 18,326 3,735 –8,365 9,158 Japan 878,180 564,385 594,126 602,649 –312,881 17,808 –6,300 25,728 –7,784 6,164 (of which in JPY) 318,345 196,689 196,747 179,229 –115,740 –41,311 –5,318 –3,216 –10,693 –22,084 New Zealand 17,467 19,417 23,054 19,331 1,297 –235 –1,209 564 4,132 –3,722
United States 4,059,559 4,305,690 4,707,911 4,796,457 216,424 473,857 194,870 10,161 167,618 101,208 (of which in USD) 3,412,707 3,619,335 3,935,144 4,015,568 208,075 392,997 148,106 –3,382 159,223 89,050
Offshore centres 4,933,716 4,597,004 4,467,615 4,486,017 –446,687 –89,086 –97,736 –75,651 53,712 30,589 Aruba 1,554 1,721 1,360 1,083 161 –594 –16 –66 –244 –268 Bahamas 497,311 384,602 361,466 354,803 –115,541 –27,769 –35,000 9,922 3,716 –6,407 Bahrain 35,066 30,834 39,443 43,259 –4,664 13,095 3,796 1,342 3,302 4,655 Barbados 24,034 32,931 26,920 27,285 7,710 6,064 3,617 1,597 674 176 Bermuda 71,187 78,318 75,870 80,182 5,699 2,412 –1,656 1,006 –1,552 4,614
Cayman Islands 1,892,485 1,855,793 1,778,133 1,850,342 –64,934 –2,375 –39,963 –46,150 10,457 73,281 Curacao ... – – 109,234 – – – ... – – Gibraltar 18,483 12,142 14,681 15,310 –7,023 3,521 1,124 506 1,147 744 Guernsey 196,966 174,920 179,966 177,937 –30,678 6,425 1,718 1,188 3,939 –420 Hong Kong SAR 602,940 521,541 495,094 484,164 –90,570 –33,537 –8,709 –15,830 1,532 –10,530 Isle of Man 76,987 88,754 79,785 77,801 –5,367 –8,095 –5,418 2 –1,699 –980
Jersey 454,450 414,368 403,196 378,969 –63,707 –48,449 –21,415 –18,389 11,318 –19,963 Lebanon 35,877 45,365 46,045 47,127 9,092 2,205 –23 758 215 1,255 Macao SAR 25,639 29,558 35,174 37,227 3,644 8,249 –608 1,818 4,833 2,206 Mauritius 16,117 16,997 17,555 19,734 430 2,846 544 –906 1,001 2,207 Netherlands Antilles 141,649 126,991 117,089 – –16,679 –15,592 –333 –8,141 46 –7,164
Panama 104,498 92,505 88,947 87,011 –13,478 –2,908 –1,770 –45 537 –1,630 Samoa 6,305 7,317 7,780 8,056 903 772 261 –313 541 283 Singapore 489,094 442,513 466,651 454,697 –53,963 12,441 10,834 –6,610 19,847 –11,630 Sint Maarten ... – ... – – – – ... ... – Vanuatu 521 484 431 419 –46 –63 9 –28 –31 –13 West Indies UK 233,815 230,979 228,885 228,413 –7,016 –2,907 –2,291 4,547 –5,512 349
Table 6A (cont.)
Amounts outstanding Estimated exchange rate adjusted changes
BIS Quarterly Review, June 2011 A 29

Vis-à-vis countries Dec 2008 Dec 2009 Sep 2010 Dec 2010 2009 2010 Q1 2010 Q2 2010 Q3 2010 Q4 2010
AssetsDeveloping countries 2,492,732 2,454,648 2,776,132 2,845,213 –55,842 413,417 115,135 50,622 156,920 90,740
i) Africa & Middle East 474,450 478,644 485,023 498,967 466 27,313 2,972 –3,375 11,196 16,520 Algeria 2,259 2,533 2,563 2,717 265 276 212 –146 31 179 Angola 7,453 8,604 8,722 8,529 1,060 19 660 –502 –2 –137 Benin 111 105 102 67 –14 –33 48 –24 –22 –35 Botswana 129 209 291 387 1 220 59 –15 80 96 Burkina Faso 364 375 414 413 2 56 16 6 31 3
Burundi 61 28 30 30 –32 2 –3 8 –3 – Cameroon 1,437 1,218 1,464 1,250 –251 83 –3 7 273 –194 Cape Verde 742 700 784 722 –66 45 –14 91 23 –55 Central African Republic 450 13 6 7 –425 –5 1 –1 –6 1 Chad 97 90 100 65 –7 –22 – –6 18 –34
Comoros Islands 11 10 8 10 –2 1 1 –1 –1 2 Congo 309 294 368 353 –181 70 –13 2 93 –12 Congo Democratic Republic 515 522 605 668 115 166 58 33 8 67 Côte d’Ivoire 4,059 1,756 1,549 1,337 –2,252 –337 –19 18 –143 –193 Djibouti 204 249 231 226 43 –34 –8 6 –28 –4
Egypt 19,419 16,723 20,403 21,842 –136 5,156 1,536 400 1,726 1,494 Equatorial Guinea 89 129 72 53 38 –75 –78 –9 30 –18 Eritrea 12 8 10 10 –4 2 – –1 3 – Ethiopia 39 248 247 361 209 114 5 –1 –5 115 Gabon 796 750 840 879 –67 155 –9 20 89 55
Gambia 95 107 99 100 11 –18 3 –1 –22 2 Ghana 2,472 3,213 3,261 4,622 641 1,435 249 –290 92 1,384 Guinea 383 319 445 450 –67 145 –9 19 125 10 Guinea-Bissau 5 12 8 7 6 –4 1 –1 –3 –1 Iran 20,406 18,816 17,162 16,579 –2,034 –1,292 664 –638 –974 –344
Iraq 1,744 1,394 1,450 1,352 –406 –12 31 18 24 –85 Israel 11,897 14,901 18,748 20,159 3,475 5,430 1,318 3,222 –610 1,500 Jordan 3,499 4,319 4,022 4,763 878 474 –765 519 –34 754 Kenya 1,548 1,654 1,732 1,696 16 68 –74 74 92 –24 Kuwait 36,113 23,239 20,850 22,457 –13,036 –806 –347 1,167 –3,349 1,723
Lesotho 27 22 60 41 –17 17 – 9 28 –20 Liberia 21,254 24,169 25,969 26,838 2,891 2,346 277 276 972 821
LiabilitiesDeveloping countries 2,204,414 2,107,899 2,150,218 2,180,127 –133,506 86,675 18,743 –30,670 65,737 32,865
i) Africa & Middle East 793,155 753,651 721,256 739,620 –56,780 –12,643 –12,826 –12,363 –3,233 15,779 Algeria 6,427 6,204 6,211 6,255 –343 287 –129 218 78 120 Angola 18,412 12,376 16,122 16,287 –6,602 4,025 –1,116 1,754 3,156 231 Benin 321 420 283 276 94 –124 –82 –6 –33 –3 Botswana 1,639 1,615 1,274 1,638 –136 44 37 –316 –39 362 Burkina Faso 325 347 446 466 11 137 17 58 36 26
Burundi 203 236 229 242 26 8 14 –9 –12 15 Cameroon 1,460 1,870 1,887 1,731 341 –30 275 –433 261 –133 Cape Verde 1,218 1,346 1,537 1,606 94 315 299 –141 68 89 Central African Republic 93 83 88 89 –13 9 11 2 –6 2 Chad 203 238 229 156 29 –71 58 –97 39 –71
Comoros Islands 60 56 54 48 –4 –6 –3 –1 3 –5 Congo 893 812 977 1,111 –105 343 107 –5 92 149 Congo Democratic Republic 1,226 1,382 1,461 1,695 123 363 121 16 –19 245 Côte d’Ivoire 2,626 2,099 2,354 2,392 –556 394 132 410 –218 70 Djibouti 654 796 502 462 131 –311 –40 –39 –194 –38
Egypt 30,472 27,206 25,189 24,969 –3,712 –1,639 3,569 –5,034 –131 –43 Equatorial Guinea 838 1,125 5,423 5,073 259 3,987 1,005 3,139 183 –340 Eritrea 51 47 78 39 –10 –7 1 –7 38 –39 Ethiopia 603 643 731 975 –6 354 102 9 –8 251 Gabon 1,199 1,229 1,104 1,204 2 35 –42 –70 29 118
Gambia 181 179 225 197 –10 –10 –25 27 14 –26 Ghana 1,400 1,399 1,945 2,197 –30 635 492 48 –166 261 Guinea 531 618 415 409 78 –195 –9 –68 –116 –2 Guinea-Bissau 39 53 60 59 15 8 3 –2 7 – Iran 41,497 29,986 22,460 17,749 –13,021 –11,089 –1,691 –1,182 –3,759 –4,457
Iraq 3,071 4,441 4,665 4,638 1,195 350 –196 626 –106 26 Israel 35,385 32,015 26,730 25,994 –3,954 –5,541 –796 –990 –3,133 –622 Jordan 13,403 12,114 13,658 14,004 –1,462 2,027 –282 1,201 707 401 Kenya 8,626 8,713 9,151 8,967 –445 425 335 189 –12 –87 Kuwait 52,512 42,108 50,787 49,950 –11,542 7,393 1,291 6,566 233 –697
Lesotho 39 566 716 846 –135 174 –3 101 –31 107 Liberia 17,976 18,306 20,115 21,127 157 3,176 1,607 37 456 1,076
Table 6A (cont.)
Amounts outstanding Estimated exchange rate adjusted changes
A 30 BIS Quarterly Review, June 2011

Vis-à-vis countries Dec 2008 Dec 2009 Sep 2010 Dec 2010 2009 2010 Q1 2010 Q2 2010 Q3 2010 Q4 2010
AssetsLibya 1,261 1,657 1,525 1,840 375 -88 -144 734 -1,002 324Madagascar 503 654 699 717 139 71 11 –347 387 20 Malawi 115 213 222 225 –8 9 –107 68 45 3 Mali 264 254 276 262 –18 25 59 –13 –11 –10 Mauritania 298 244 286 292 –58 57 –2 16 35 8
Morocco 8,038 10,072 9,721 9,391 2,223 –284 –699 –119 723 –189 Mozambique 562 907 1,243 1,039 125 135 22 239 77 –203 Namibia 826 1,001 912 834 126 –138 –54 –30 20 –74 Niger 145 151 86 79 10 –69 –95 5 27 –6 Nigeria 10,575 8,993 7,785 7,540 –2,063 –1,381 –263 –97 –797 –224
Oman 10,555 9,653 9,900 9,538 –934 –157 246 –626 587 –364 Palestinian Territory 10 38 17 15 27 –20 32 –51 1 –2 Qatar 47,682 49,528 55,150 61,089 1,589 11,601 1,247 1,738 2,464 6,152 Rwanda 10 44 34 34 31 –10 –7 5 –8 – Sao Tomé and Principe 49 41 52 54 –8 16 12 2 –1 3
Saudi Arabia 78,102 82,091 82,327 86,102 2,610 9,751 8,785 –10,674 7,131 4,509 Senegal 933 1,081 1,183 894 121 –137 –10 –37 182 –272 Seychelles 1,103 1,392 1,456 1,789 263 443 58 20 23 342 Sierra Leone 58 67 78 199 6 138 13 – 1 124 Somalia 98 110 92 91 8 –11 –2 –3 –7 1
South Africa 36,421 36,189 37,113 38,238 –626 2,419 –477 –1,316 2,779 1,433 St. Helena 4 10 7 12 6 2 –5 – 2 5 Sudan 964 1,244 1,493 1,379 265 155 105 106 55 –111 Swaziland 58 72 155 170 –11 96 41 61 –20 14 Syria 903 943 821 814 66 –113 39 –159 12 –5
Tanzania 725 769 924 937 –71 231 25 99 91 16 Togo 265 342 325 295 70 –25 4 –7 2 –24 Tunisia 5,171 4,808 3,928 3,793 –238 –736 –385 –76 –272 –3 Uganda 357 426 563 538 25 118 –53 138 54 –21 United Arab Emirates 106,184 103,078 106,732 102,528 –4,195 –1,647 398 949 934 –3,928
Yemen 1,058 1,257 1,153 1,477 193 50 –19 –333 77 325 Zambia 879 1,006 1,095 1,054 13 49 134 –51 6 –40 Zimbabwe 815 377 404 299 –122 –87 –4 –41 62 –104 Residual 21,460 33,203 24,651 26,419 9,872 –6,797 –9,731 2,167 –1,003 1,770
LiabilitiesLibya 72,531 66,089 62,223 59,645 –7,093 –5,116 –1,647 2,861 –4,054 –2,276 Madagascar 1,008 1,482 1,205 1,045 437 –393 –240 101 –107 –147 Malawi 144 199 353 460 7 225 3 85 27 110 Mali 372 489 472 448 103 –26 60 –18 –49 –19 Mauritania 513 481 525 606 –43 139 – –16 69 86
Morocco 9,554 10,895 8,766 8,973 1,186 –1,319 –2,419 –416 1,187 329 Mozambique 1,184 1,836 1,899 2,330 396 420 –194 233 –56 437 Namibia 453 1,375 1,387 1,425 304 –41 285 –400 63 11 Niger 135 122 163 136 –16 18 82 162 –201 –25 Nigeria 21,999 23,164 23,015 23,409 593 99 1,324 –821 –960 556
Oman 7,784 6,392 8,415 7,321 –1,539 960 –8 561 1,468 –1,061 Palestinian Territory 1,063 1,052 983 1,025 –31 4 36 –68 –14 50 Qatar 17,336 19,008 20,422 31,910 1,428 6,871 –833 645 1,713 5,346 Rwanda 520 616 531 628 82 –5 –66 24 –64 101 Sao Tomé and Principe 104 83 59 38 –20 –43 –21 –9 8 –21
Saudi Arabia 181,276 169,169 156,192 167,741 –14,372 –362 –3,444 –6,398 –2,704 12,184 Senegal 1,709 1,666 1,636 1,336 –69 –219 78 1 –35 –263 Seychelles 4,562 5,589 5,912 6,094 924 618 –434 97 728 227 Sierra Leone 171 155 218 224 –20 20 –6 18 1 7 Somalia 47 47 46 46 –3 – – –2 2 –
South Africa 45,339 41,883 45,350 46,093 –4,392 4,816 1,780 –1,615 3,637 1,014 St. Helena 8 14 19 11 5 –6 –7 4 5 –8 Sudan 1,702 1,614 1,894 1,786 –139 213 120 66 116 –89 Swaziland 1,220 1,118 857 900 –649 –247 19 –251 –39 24 Syria 23,576 18,581 17,942 17,962 –5,334 –86 207 –1,215 707 215
Tanzania 2,022 2,070 2,018 2,027 –13 –22 –289 146 102 19 Togo 447 428 379 387 –33 –24 –20 8 –25 13 Tunisia 5,074 5,373 6,827 6,364 211 1,166 1,046 –5 512 –387 Uganda 1,732 1,789 2,022 1,988 –25 190 –82 329 –48 –9 United Arab Emirates 76,863 81,987 74,888 74,539 3,572 –7,801 –2,592 –6,471 1,300 –38
Yemen 7,870 6,053 4,744 4,969 –1,972 –995 –657 –609 –3 274 Zambia 878 1,109 1,575 1,535 152 429 121 105 239 –36 Zimbabwe 856 1,233 1,153 1,370 268 138 28 –12 –96 218 Residual 59,520 69,862 50,060 51,998 8,846 –17,737 –10,122 –5,482 –4,080 1,947
Table 6A (cont.)
Amounts outstanding Estimated exchange rate adjusted changes
BIS Quarterly Review, June 2011 A 31

Vis-à-vis countries Dec 2008 Dec 2009 Sep 2010 Dec 2010 2009 2010 Q1 2010 Q2 2010 Q3 2010 Q4 2010
Assetsii) Asia & Pacific 756,067 783,214 1,015,487 1,062,508 29,809 272,832 89,328 48,476 84,109 50,919
Afghanistan 75 128 113 96 52 –31 23 –29 –8 –17 Armenia 298 318 299 277 17 –35 –28 11 3 –21 Azerbaijan 3,302 2,939 4,759 3,450 –402 644 733 –111 1,268 –1,246 Bangladesh 2,078 1,779 2,077 2,491 –311 712 105 21 167 419 Bhutan 60 69 68 72 7 7 –2 2 2 5
British Overseas Territories 440 509 472 422 44 –583 –508 14 –33 –56 Brunei 832 943 1,133 1,266 99 316 57 174 –50 135 Cambodia 474 846 887 849 365 –6 –87 –6 128 –41 China 153,628 177,281 284,740 330,669 23,966 153,130 42,090 27,700 36,905 46,435 Chinese Taipei 51,866 53,854 81,051 82,173 1,729 26,896 6,286 8,099 11,329 1,182
Fiji 120 421 225 398 283 –31 10 –226 12 173 French Polynesia 2,253 2,552 2,447 2,541 229 124 –174 –73 235 136 Georgia 614 469 556 409 –135 –83 59 –34 36 –144 India 134,788 134,435 176,221 185,540 1,877 49,850 18,222 9,078 12,830 9,720 Indonesia 58,119 46,658 57,062 59,228 –10,464 11,957 4,773 –1,420 6,485 2,119
Kazakhstan 21,547 16,365 14,745 15,014 –5,308 –1,284 –116 –1,083 –408 323 Kiribati – 1 – 1 1 –1 –1 – –1 1 Kyrgyz Republic 54 76 29 19 21 –56 –52 1 5 –10 Laos 466 382 426 435 –85 51 31 –7 18 9 Malaysia 37,149 38,443 43,449 42,805 967 3,981 2,931 –684 2,334 –600
Maldives 729 647 623 628 –85 –18 –34 –19 29 6 Marshall Islands 23,597 26,092 26,869 27,773 2,466 1,458 319 –1,085 1,315 909 Micronesia 25 – – – –25 – – – – –
Liabilitiesii) Asia & Pacific 690,606 664,794 717,026 717,145 –34,237 53,217 –181 6,909 44,646 1,843
Afghanistan 1,525 2,100 2,091 2,433 506 391 –355 175 205 366 Armenia 283 346 350 333 56 –1 32 –45 26 –14 Azerbaijan 1,189 1,084 1,376 2,070 –95 978 161 1,002 –890 705 Bangladesh 3,517 4,750 4,803 4,893 1,164 176 –766 1,784 –953 111 Bhutan 393 355 394 393 –40 38 28 6 5 –1
British Overseas Territories 1,088 1,151 812 645 27 –524 –99 –243 –21 –161 Brunei 4,375 4,201 4,098 4,023 –266 –97 1,276 –1,315 –7 –51 Cambodia 460 540 735 694 72 157 68 –54 183 –40 China 236,299 201,506 229,471 243,585 –37,375 41,794 –5,826 –1,867 34,549 14,938 Chinese Taipei 121,663 115,036 106,559 112,581 –7,912 –2,572 –1,940 –3,927 –2,757 6,052
Fiji 206 213 296 269 –14 47 47 14 17 –31 French Polynesia 1,363 1,280 1,199 1,319 –114 89 –156 –16 122 139 Georgia 1,352 1,386 1,364 1,637 25 259 62 –280 204 273 India 44,394 45,518 40,658 36,853 607 –8,466 –5,448 –6,087 6,808 –3,739 Indonesia 14,013 19,537 18,023 16,321 5,378 –3,225 1,026 –688 –1,865 –1,698
Kazakhstan 13,109 12,239 13,089 15,355 –977 3,533 –1,408 791 1,827 2,323 Kiribati 108 72 86 78 –47 7 2 15 –3 –7 Kyrgyz Republic 261 496 537 642 228 168 82 –88 63 111 Laos 168 386 342 525 212 141 15 82 –139 183 Malaysia 19,526 20,960 25,241 25,375 948 4,520 3,907 723 –324 214
Maldives 120 149 176 197 25 47 – 13 12 22 Marshall Islands 7,399 8,386 10,756 10,981 893 2,749 1,930 51 511 257 Micronesia 36 26 24 24 –10 –4 –11 9 –2 –
Table 6A (cont.)
Amounts outstanding Estimated exchange rate adjusted changes
A 32 BIS Quarterly Review, June 2011

Vis-à-vis countries Dec 2008 Dec 2009 Sep 2010 Dec 2010 2009 2010 Q1 2010 Q2 2010 Q3 2010 Q4 2010 Assets
Mongolia 151 156 668 644 22 474 12 24 455 –17 Myanmar 1,353 278 243 241 –295 –24 –45 30 –11 2 Nauru 16 10 125 19 –6 4 1 8 100 –105 Nepal 65 75 80 85 9 9 –14 5 13 5 New Caledonia 3,597 3,829 3,493 3,473 118 –98 181 –109 –216 46
North Korea 74 72 67 97 –6 30 –4 22 –17 29 Pakistan 4,962 4,745 4,793 4,513 –151 –270 –274 –71 350 –275 Palau 36 31 32 30 –5 –1 1 – – –2 Papua New Guinea 469 524 759 783 39 293 100 170 1 22 Philippines 19,055 18,647 24,245 26,055 –258 7,635 1,603 –38 3,946 2,124
Solomon Islands 25 31 36 35 4 3 4 –3 4 –2 South Korea 186,251 201,902 220,113 198,248 14,386 –5,782 10,973 5,325 –2,469 –19,611 Sri Lanka 3,203 2,884 3,958 3,910 74 1,024 97 361 598 –32 Tajikistan 30 17 9 8 –13 –9 –7 1 –2 –1 Thailand 22,758 26,873 33,927 39,933 3,973 12,534 1,062 2,181 3,272 6,019
Timor Leste 9 5 6 10 –5 5 3 –3 1 4 Tonga 18 27 42 40 6 10 –2 19 –4 –3 Turkmenistan 254 252 184 137 –8 –102 –72 –6 20 –44 Tuvalu 1 11 10 31 10 12 – – –9 21 US Pacific Islands 647 173 839 825 –480 662 384 –252 537 –7
Uzbekistan 763 1,065 1,219 1,329 294 281 119 –135 184 113 Vietnam 16,081 12,382 14,183 15,990 –3,468 3,719 393 342 1,081 1,903 Wallis/Futuna 22 18 15 14 –5 –3 – – –2 –1 Residual 3,713 4,000 8,190 9,502 267 5,430 175 281 3,681 1,293
LiabilitiesMongolia 94 84 168 511 –13 428 –15 28 71 344 Myanmar 505 1,378 971 973 831 –357 –229 –181 38 15 Nauru 11 24 12 12 –3 –12 2 –10 –4 – Nepal 1,573 2,074 1,662 1,701 466 –349 –211 –221 35 48 New Caledonia 1,191 1,341 1,268 1,198 106 –103 –26 –58 39 –58
North Korea 142 106 79 111 –40 5 –36 –1 11 31 Pakistan 10,346 13,089 11,936 11,222 2,694 –1,697 –1,752 1,279 –532 –692 Palau 91 2 2 8 –89 6 – 2 –2 6 Papua New Guinea 1,177 3,180 3,223 3,244 1,894 60 –261 246 58 17 Philippines 18,734 17,817 17,518 17,364 –977 –433 –911 788 –166 –144
Solomon Islands 150 185 232 221 22 30 8 17 18 –13 South Korea 57,863 42,980 68,406 50,360 –15,429 5,739 6,788 13,046 3,859 –17,954 Sri Lanka 1,265 1,937 2,331 2,757 626 821 171 4 210 436 Tajikistan 101 112 213 161 11 49 –74 5 169 –51 Thailand 24,082 18,850 19,469 20,531 –5,447 1,795 855 1,395 –1,572 1,117
Timor Leste 13 22 63 125 8 102 3 –2 39 62 Tonga 31 29 49 54 –4 22 –1 22 –3 4 Turkmenistan 11,815 14,399 13,661 13,872 2,534 –467 –796 –430 532 227 Tuvalu 14 20 18 18 1 –5 –2 1 –3 –1 US Pacific Islands 182 86 181 274 –99 198 279 –225 51 93
Uzbekistan 8,239 10,846 12,042 12,442 2,235 2,111 264 369 987 491 Vietnam 3,438 4,086 4,047 4,847 625 864 –250 275 34 805 Wallis/Futuna 41 35 37 33 –6 1 –1 – 5 –3 Residual 76,661 90,395 96,958 93,880 12,528 4,199 3,384 506 3,199 –2,890
Table 6A (cont.)
Amounts outstanding Estimated exchange rate adjusted changes
BIS Quarterly Review, June 2011 A 33
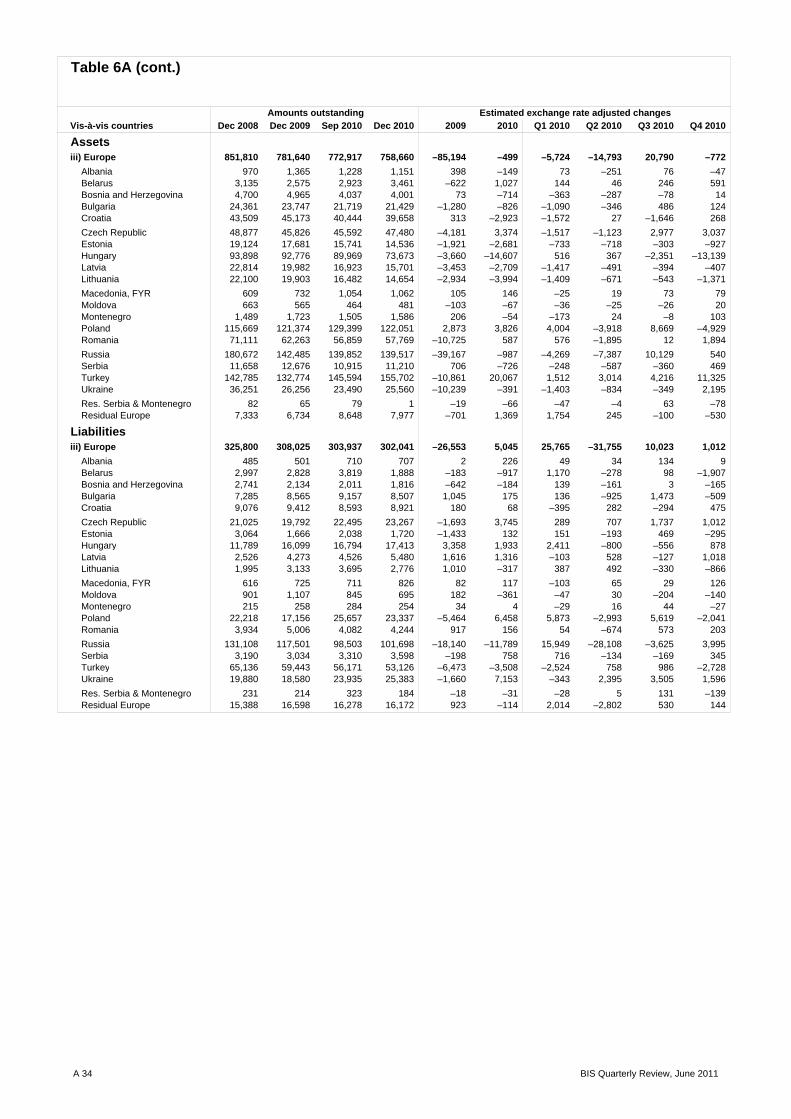
Vis-à-vis countries Dec 2008 Dec 2009 Sep 2010 Dec 2010 2009 2010 Q1 2010 Q2 2010 Q3 2010 Q4 2010
Assetsiii) Europe 851,810 781,640 772,917 758,660 –85,194 –499 –5,724 –14,793 20,790 –772
Albania 970 1,365 1,228 1,151 398 –149 73 –251 76 –47 Belarus 3,135 2,575 2,923 3,461 –622 1,027 144 46 246 591 Bosnia and Herzegovina 4,700 4,965 4,037 4,001 73 –714 –363 –287 –78 14 Bulgaria 24,361 23,747 21,719 21,429 –1,280 –826 –1,090 –346 486 124 Croatia 43,509 45,173 40,444 39,658 313 –2,923 –1,572 27 –1,646 268
Czech Republic 48,877 45,826 45,592 47,480 –4,181 3,374 –1,517 –1,123 2,977 3,037 Estonia 19,124 17,681 15,741 14,536 –1,921 –2,681 –733 –718 –303 –927 Hungary 93,898 92,776 89,969 73,673 –3,660 –14,607 516 367 –2,351 –13,139 Latvia 22,814 19,982 16,923 15,701 –3,453 –2,709 –1,417 –491 –394 –407 Lithuania 22,100 19,903 16,482 14,654 –2,934 –3,994 –1,409 –671 –543 –1,371
Macedonia, FYR 609 732 1,054 1,062 105 146 –25 19 73 79 Moldova 663 565 464 481 –103 –67 –36 –25 –26 20 Montenegro 1,489 1,723 1,505 1,586 206 –54 –173 24 –8 103 Poland 115,669 121,374 129,399 122,051 2,873 3,826 4,004 –3,918 8,669 –4,929 Romania 71,111 62,263 56,859 57,769 –10,725 587 576 –1,895 12 1,894
Russia 180,672 142,485 139,852 139,517 –39,167 –987 –4,269 –7,387 10,129 540 Serbia 11,658 12,676 10,915 11,210 706 –726 –248 –587 –360 469 Turkey 142,785 132,774 145,594 155,702 –10,861 20,067 1,512 3,014 4,216 11,325 Ukraine 36,251 26,256 23,490 25,560 –10,239 –391 –1,403 –834 –349 2,195
Res. Serbia & Montenegro 82 65 79 1 –19 –66 –47 –4 63 –78 Residual Europe 7,333 6,734 8,648 7,977 –701 1,369 1,754 245 –100 –530
Liabilitiesiii) Europe 325,800 308,025 303,937 302,041 –26,553 5,045 25,765 –31,755 10,023 1,012
Albania 485 501 710 707 2 226 49 34 134 9 Belarus 2,997 2,828 3,819 1,888 –183 –917 1,170 –278 98 –1,907 Bosnia and Herzegovina 2,741 2,134 2,011 1,816 –642 –184 139 –161 3 –165 Bulgaria 7,285 8,565 9,157 8,507 1,045 175 136 –925 1,473 –509 Croatia 9,076 9,412 8,593 8,921 180 68 –395 282 –294 475
Czech Republic 21,025 19,792 22,495 23,267 –1,693 3,745 289 707 1,737 1,012 Estonia 3,064 1,666 2,038 1,720 –1,433 132 151 –193 469 –295 Hungary 11,789 16,099 16,794 17,413 3,358 1,933 2,411 –800 –556 878 Latvia 2,526 4,273 4,526 5,480 1,616 1,316 –103 528 –127 1,018 Lithuania 1,995 3,133 3,695 2,776 1,010 –317 387 492 –330 –866
Macedonia, FYR 616 725 711 826 82 117 –103 65 29 126 Moldova 901 1,107 845 695 182 –361 –47 30 –204 –140 Montenegro 215 258 284 254 34 4 –29 16 44 –27 Poland 22,218 17,156 25,657 23,337 –5,464 6,458 5,873 –2,993 5,619 –2,041 Romania 3,934 5,006 4,082 4,244 917 156 54 –674 573 203
Russia 131,108 117,501 98,503 101,698 –18,140 –11,789 15,949 –28,108 –3,625 3,995 Serbia 3,190 3,034 3,310 3,598 –198 758 716 –134 –169 345 Turkey 65,136 59,443 56,171 53,126 –6,473 –3,508 –2,524 758 986 –2,728 Ukraine 19,880 18,580 23,935 25,383 –1,660 7,153 –343 2,395 3,505 1,596
Res. Serbia & Montenegro 231 214 323 184 –18 –31 –28 5 131 –139 Residual Europe 15,388 16,598 16,278 16,172 923 –114 2,014 –2,802 530 144
Table 6A (cont.)
Amounts outstanding Estimated exchange rate adjusted changes
A 34 BIS Quarterly Review, June 2011

Vis-à-vis countries Dec 2008 Dec 2009 Sep 2010 Dec 2010 2009 2010 Q1 2010 Q2 2010 Q3 2010 Q4 2010
Assetsiv) Latin America/Caribbean 410,405 411,150 502,705 525,078 –922 113,770 28,558 20,314 40,825 24,073
Argentina 17,898 14,303 14,692 14,302 –3,656 –31 218 –168 263 –344 Belize 2,415 2,926 2,965 2,828 468 43 75 –34 126 –124 Bolivia 366 709 541 521 339 –185 –112 –40 –14 –19 Bonaire, Saint Eustatius and Sa ... – ... 8 – – – ... ... – Brazil 157,156 165,672 234,547 241,581 7,517 75,992 20,857 22,052 25,497 7,586 Chile 38,565 46,153 48,876 49,039 7,525 2,989 –311 –334 3,306 328
Colombia 12,678 10,667 12,323 15,214 –1,978 4,454 156 881 459 2,958 Costa Rica 7,334 5,911 5,847 6,190 –1,411 281 –70 101 –95 345 Cuba 1,933 1,984 1,737 1,812 –13 –121 –151 –40 –18 88 Dominica 120 62 76 76 –58 13 2 15 –4 – Dominican Republic 3,777 3,613 3,975 4,025 –192 473 117 293 –18 81
Ecuador 2,454 2,134 2,305 2,542 –320 401 –29 37 156 237 El Salvador 3,590 2,913 2,711 3,001 –583 75 –223 –194 214 278 Falkland Islands 37 35 39 38 –5 5 –1 6 – – Grenada 60 52 103 152 –8 96 6 –3 44 49 Guatemala 4,556 3,764 3,886 4,478 –754 715 127 64 –68 592
Guyana 875 836 710 704 –39 –135 –68 –22 –39 –6 Haiti 252 196 190 155 –58 –38 8 –8 –3 –35 Honduras 1,535 1,285 1,082 1,235 –255 –46 –56 –20 –121 151 Jamaica 2,117 2,346 2,059 2,218 245 –95 175 –660 240 150 Mexico 102,685 95,608 107,800 114,682 –7,592 18,680 7,255 –406 4,123 7,708
Nicaragua 694 606 467 494 –89 –106 –16 –65 –52 27 Paraguay 1,136 830 1,042 1,377 –282 564 162 32 35 335 Peru 15,322 14,553 18,954 20,305 –597 5,807 386 –545 4,600 1,366 St. Lucia 605 428 433 431 –180 3 –46 62 –11 –2 St. Vincent 1,250 1,315 1,328 1,377 34 –5 6 –4 –28 21
Surinam 30 35 45 46 3 11 4 – 5 2 Trinidad and Tobago 5,844 6,364 6,258 6,491 456 176 147 –564 351 242 Turks and Caicos 512 978 542 584 455 –386 –193 –147 –89 43 Uruguay 3,685 4,080 3,187 5,393 383 1,236 –271 –278 –421 2,206 Venezuela 8,129 7,488 9,477 9,358 –722 1,878 73 –313 2,207 –89
Residual 12,795 13,304 14,508 14,421 438 1,024 333 616 177 –102 Int. organisations 78,069 117,073 142,670 133,955 35,091 22,181 16,831 10,873 1,465 –6,988 Unallocated 628,527 556,404 457,391 443,325 –92,412 104,933 44,901 81,261 –9,479 –11,750
Liabilitiesiv) Latin America/Caribbean 394,853 381,429 407,999 421,321 –15,936 41,055 5,985 6,539 14,301 14,230
Argentina 28,548 28,042 28,519 28,392 –652 602 568 –260 367 –73 Belize 9,561 9,587 9,964 9,976 –142 609 –312 66 789 66 Bolivia 3,308 2,814 2,728 2,743 –496 –47 9 –193 112 25 Bonaire, Saint Eustatius and Sa ... – ... – – – – ... ... – Brazil 64,620 63,955 75,039 82,914 –980 19,504 1,787 567 9,135 8,015 Chile 23,653 24,583 22,625 26,409 722 2,047 –1,115 –59 –639 3,860
Colombia 13,689 15,173 15,341 14,006 1,447 –1,385 –282 –181 402 –1,324 Costa Rica 6,092 4,656 4,519 4,300 –1,481 –296 23 –41 –69 –209 Cuba 2,849 4,288 5,284 5,402 1,325 1,314 481 509 113 211 Dominica 218 273 264 289 48 21 –1 –12 7 27 Dominican Republic 6,491 5,899 5,611 6,319 –605 454 191 147 –603 719
Ecuador 6,214 7,334 7,050 7,245 1,109 –74 –208 –529 464 199 El Salvador 2,370 2,860 2,354 2,384 485 –485 135 –346 –306 32 Falkland Islands 119 135 146 156 4 25 3 –2 12 12 Grenada 183 139 118 100 –49 –35 21 –20 –19 –17 Guatemala 3,780 4,194 4,040 4,504 407 325 –27 186 –301 467
Guyana 531 441 555 430 –97 –18 104 –54 56 –124 Haiti 678 789 1,340 1,387 109 593 299 146 101 47 Honduras 3,170 3,578 2,882 3,307 405 –265 –217 –199 –275 426 Jamaica 2,191 1,883 2,677 2,162 –334 254 500 –266 529 –509 Mexico 91,286 81,339 91,586 95,599 –10,486 12,950 1,637 6,734 452 4,127
Nicaragua 1,014 1,317 1,523 1,718 301 404 142 200 –134 196 Paraguay 1,777 1,834 1,891 2,172 38 356 4 95 –28 285 Peru 9,230 9,474 14,834 14,365 201 4,907 2,814 1,821 728 –456 St. Lucia 409 482 285 494 63 22 –45 –44 –102 213 St. Vincent 3,435 2,780 2,478 2,602 –724 –48 –85 –92 –11 140
Surinam 1,092 1,264 1,220 1,279 147 18 93 –66 –83 74 Trinidad and Tobago 9,083 7,728 6,958 7,190 –1,441 –516 –150 64 –682 252 Turks and Caicos 2,036 2,217 2,218 2,166 119 –13 –19 –7 55 –42 Uruguay 13,679 14,639 15,279 13,059 906 –1,367 668 120 42 –2,197 Venezuela 59,774 53,842 55,486 54,897 –6,161 1,659 –1,529 –1,407 5,029 –434
Residual 23,773 23,890 23,185 23,355 –127 –457 497 –337 –839 222 Int. organisations 215,167 210,685 223,479 214,128 –12,110 13,145 10,274 15,334 –6,116 –6,347 Unallocated 2,840,793 3,172,063 2,973,889 2,901,130 211,256 77,364 51,064 –16,066 98,955 –56,589
Table 6A (cont.)
Amounts outstanding Estimated exchange rate adjusted changes
BIS Quarterly Review, June 2011 A 35
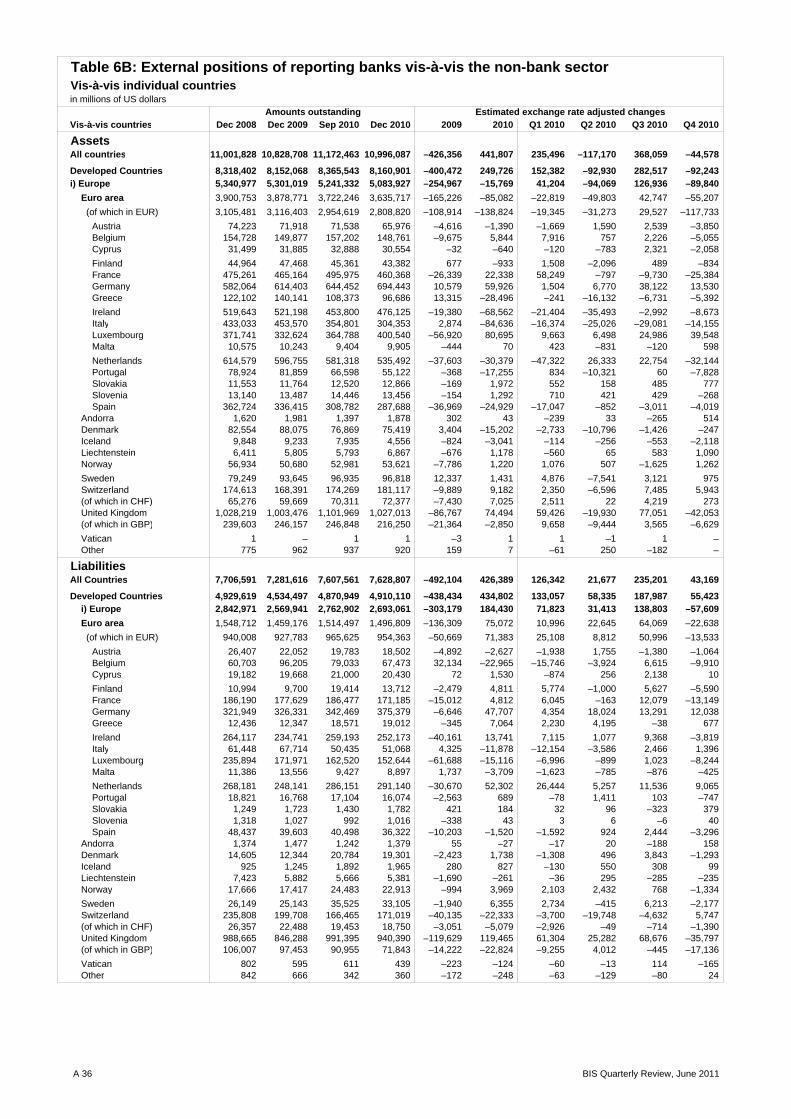
Vis-à-vis countries Dec 2008 Dec 2009 Sep 2010 Dec 2010 2009 2010 Q1 2010 Q2 2010 Q3 2010 Q4 2010
AssetsAll countries 11,001,828 10,828,708 11,172,463 10,996,087 –426,356 441,807 235,496 –117,170 368,059 –44,578
Developed Countries 8,318,402 8,152,068 8,365,543 8,160,901 –400,472 249,726 152,382 –92,930 282,517 –92,243 i) Europe 5,340,977 5,301,019 5,241,332 5,083,927 –254,967 –15,769 41,204 –94,069 126,936 –89,840
Euro area 3,900,753 3,878,771 3,722,246 3,635,717 –165,226 –85,082 –22,819 –49,803 42,747 –55,207
(of which in EUR) 3,105,481 3,116,403 2,954,619 2,808,820 –108,914 –138,824 –19,345 –31,273 29,527 –117,733
Austria 74,223 71,918 71,538 65,976 –4,616 –1,390 –1,669 1,590 2,539 –3,850 Belgium 154,728 149,877 157,202 148,761 –9,675 5,844 7,916 757 2,226 –5,055 Cyprus 31,499 31,885 32,888 30,554 –32 –640 –120 –783 2,321 –2,058
Finland 44,964 47,468 45,361 43,382 677 –933 1,508 –2,096 489 –834 France 475,261 465,164 495,975 460,368 –26,339 22,338 58,249 –797 –9,730 –25,384 Germany 582,064 614,403 644,452 694,443 10,579 59,926 1,504 6,770 38,122 13,530 Greece 122,102 140,141 108,373 96,686 13,315 –28,496 –241 –16,132 –6,731 –5,392
Ireland 519,643 521,198 453,800 476,125 –19,380 –68,562 –21,404 –35,493 –2,992 –8,673 Italy 433,033 453,570 354,801 304,353 2,874 –84,636 –16,374 –25,026 –29,081 –14,155 Luxembourg 371,741 332,624 364,788 400,540 –56,920 80,695 9,663 6,498 24,986 39,548 Malta 10,575 10,243 9,404 9,905 –444 70 423 –831 –120 598
Netherlands 614,579 596,755 581,318 535,492 –37,603 –30,379 –47,322 26,333 22,754 –32,144 Portugal 78,924 81,859 66,598 55,122 –368 –17,255 834 –10,321 60 –7,828 Slovakia 11,553 11,764 12,520 12,866 –169 1,972 552 158 485 777 Slovenia 13,140 13,487 14,446 13,456 –154 1,292 710 421 429 –268 Spain 362,724 336,415 308,782 287,688 –36,969 –24,929 –17,047 –852 –3,011 –4,019
Andorra 1,620 1,981 1,397 1,878 302 43 –239 33 –265 514 Denmark 82,554 88,075 76,869 75,419 3,404 –15,202 –2,733 –10,796 –1,426 –247 Iceland 9,848 9,233 7,935 4,556 –824 –3,041 –114 –256 –553 –2,118 Liechtenstein 6,411 5,805 5,793 6,867 –676 1,178 –560 65 583 1,090 Norway 56,934 50,680 52,981 53,621 –7,786 1,220 1,076 507 –1,625 1,262
Sweden 79,249 93,645 96,935 96,818 12,337 1,431 4,876 –7,541 3,121 975 Switzerland 174,613 168,391 174,269 181,117 –9,889 9,182 2,350 –6,596 7,485 5,943 (of which in CHF) 65,276 59,669 70,311 72,377 –7,430 7,025 2,511 22 4,219 273 United Kingdom 1,028,219 1,003,476 1,101,969 1,027,013 –86,767 74,494 59,426 –19,930 77,051 –42,053 (of which in GBP) 239,603 246,157 246,848 216,250 –21,364 –2,850 9,658 –9,444 3,565 –6,629
Vatican 1 – 1 1 –3 1 1 –1 1 – Other 775 962 937 920 159 7 –61 250 –182 –
LiabilitiesAll Countries 7,706,591 7,281,616 7,607,561 7,628,807 –492,104 426,389 126,342 21,677 235,201 43,169
Developed Countries 4,929,619 4,534,497 4,870,949 4,910,110 –438,434 434,802 133,057 58,335 187,987 55,423 i) Europe 2,842,971 2,569,941 2,762,902 2,693,061 –303,179 184,430 71,823 31,413 138,803 –57,609 Euro area 1,548,712 1,459,176 1,514,497 1,496,809 –136,309 75,072 10,996 22,645 64,069 –22,638
(of which in EUR) 940,008 927,783 965,625 954,363 –50,669 71,383 25,108 8,812 50,996 –13,533
Austria 26,407 22,052 19,783 18,502 –4,892 –2,627 –1,938 1,755 –1,380 –1,064 Belgium 60,703 96,205 79,033 67,473 32,134 –22,965 –15,746 –3,924 6,615 –9,910 Cyprus 19,182 19,668 21,000 20,430 72 1,530 –874 256 2,138 10
Finland 10,994 9,700 19,414 13,712 –2,479 4,811 5,774 –1,000 5,627 –5,590 France 186,190 177,629 186,477 171,185 –15,012 4,812 6,045 –163 12,079 –13,149 Germany 321,949 326,331 342,469 375,379 –6,646 47,707 4,354 18,024 13,291 12,038 Greece 12,436 12,347 18,571 19,012 –345 7,064 2,230 4,195 –38 677
Ireland 264,117 234,741 259,193 252,173 –40,161 13,741 7,115 1,077 9,368 –3,819 Italy 61,448 67,714 50,435 51,068 4,325 –11,878 –12,154 –3,586 2,466 1,396 Luxembourg 235,894 171,971 162,520 152,644 –61,688 –15,116 –6,996 –899 1,023 –8,244 Malta 11,386 13,556 9,427 8,897 1,737 –3,709 –1,623 –785 –876 –425
Netherlands 268,181 248,141 286,151 291,140 –30,670 52,302 26,444 5,257 11,536 9,065 Portugal 18,821 16,768 17,104 16,074 –2,563 689 –78 1,411 103 –747 Slovakia 1,249 1,723 1,430 1,782 421 184 32 96 –323 379 Slovenia 1,318 1,027 992 1,016 –338 43 3 6 –6 40 Spain 48,437 39,603 40,498 36,322 –10,203 –1,520 –1,592 924 2,444 –3,296
Andorra 1,374 1,477 1,242 1,379 55 –27 –17 20 –188 158 Denmark 14,605 12,344 20,784 19,301 –2,423 1,738 –1,308 496 3,843 –1,293 Iceland 925 1,245 1,892 1,965 280 827 –130 550 308 99 Liechtenstein 7,423 5,882 5,666 5,381 –1,690 –261 –36 295 –285 –235 Norway 17,666 17,417 24,483 22,913 –994 3,969 2,103 2,432 768 –1,334
Sweden 26,149 25,143 35,525 33,105 –1,940 6,355 2,734 –415 6,213 –2,177 Switzerland 235,808 199,708 166,465 171,019 –40,135 –22,333 –3,700 –19,748 –4,632 5,747 (of which in CHF) 26,357 22,488 19,453 18,750 –3,051 –5,079 –2,926 –49 –714 –1,390 United Kingdom 988,665 846,288 991,395 940,390 –119,629 119,465 61,304 25,282 68,676 –35,797 (of which in GBP) 106,007 97,453 90,955 71,843 –14,222 –22,824 –9,255 4,012 –445 –17,136
Vatican 802 595 611 439 –223 –124 –60 –13 114 –165 Other 842 666 342 360 –172 –248 –63 –129 –80 24
Amounts outstanding Estimated exchange rate adjusted changes
Table 6B: External positions of reporting banks vis-à-vis the non-bank sectorVis-à-vis individual countriesin millions of US dollars
A 36 BIS Quarterly Review, June 2011

Vis-à-vis countries Dec 2008 Dec 2009 Sep 2010 Dec 2010 2009 2010 Q1 2010 Q2 2010 Q3 2010 Q4 2010 Assetsii) Other 2,977,425 2,851,049 3,124,211 3,076,974 –145,505 265,495 111,178 1,139 155,581 –2,403
Australia 110,927 130,692 149,968 152,171 17,932 26,473 16,975 2,632 1,694 5,172 Canada 125,145 137,593 128,574 134,323 10,985 27 4,041 –1,515 –11,673 9,174 Japan 232,161 181,706 196,076 202,343 –49,825 19,073 –7,386 –4,002 18,289 12,172 (of which in JPY) 142,697 86,545 81,958 90,466 –53,902 –5,778 –12,368 –4,787 4,958 6,419 New Zealand 13,998 15,079 14,190 14,351 722 1,450 265 753 186 246
United States 2,495,189 2,385,910 2,635,338 2,573,677 –125,305 218,435 97,277 3,303 147,064 –29,209 (of which in USD) 2,143,522 2,036,271 2,263,233 2,208,300 –108,205 197,252 88,013 11,572 123,963 –26,296
Offshore centres 1,351,606 1,324,796 1,363,314 1,390,172 –46,996 62,369 28,923 –18,936 22,742 29,640 Aruba 1,801 570 584 620 –1,227 40 –23 92 –67 38 Bahamas 23,676 27,176 24,702 23,466 2,631 –3,552 700 –5,440 2,376 –1,188 Bahrain 3,986 3,833 4,746 4,915 –189 1,018 412 690 –262 178 Barbados 10,849 11,867 11,919 8,227 120 –3,851 153 74 –255 –3,823 Bermuda 79,232 77,537 76,803 78,321 –2,102 –875 –2,265 179 –121 1,332
Cayman Islands 686,473 673,628 697,820 709,198 –17,480 28,415 5,233 –288 11,011 12,459 Curacao ... – – 18,458 – – – ... – – Gibraltar 6,081 5,916 6,607 7,274 –638 1,525 1,169 –1,137 756 737 Guernsey 30,954 30,362 29,231 27,446 –2,000 –2,587 –260 222 –1,011 –1,538 Hong Kong SAR 69,256 73,344 89,337 97,413 3,321 23,848 6,850 5,213 3,465 8,320 Isle of Man 21,975 23,751 22,734 21,726 149 –1,453 332 –1,167 111 –729
Jersey 164,994 138,440 124,537 125,135 –32,227 –8,787 3,106 –13,816 –369 2,292 Lebanon 3,884 5,115 3,704 3,871 1,160 –1,136 –326 –816 –180 186 Macao SAR 3,496 3,737 3,304 3,288 232 –442 –244 –286 99 –11 Mauritius 9,269 10,483 14,388 14,389 653 3,855 2,807 –397 1,441 4 Netherlands Antilles 18,047 17,983 18,702 – –199 –435 –457 98 125 –201
Panama 68,075 72,072 84,581 87,606 4,357 10,544 6,673 –1,650 3,554 1,967 Samoa 1,398 1,507 2,277 2,799 109 1,263 373 160 215 515 Singapore 40,017 46,882 45,778 47,790 6,555 604 –1,171 –3,687 3,417 2,045 Sint Maarten ... – ... – – – – ... ... – Vanuatu 69 84 112 74 13 –10 –4 –4 36 –38 West Indies UK 96,422 88,416 95,751 102,468 –10,409 14,051 5,552 3,473 –2,050 7,076
Liabilitiesii) Other 2,086,648 1,964,556 2,108,047 2,217,049 –135,255 250,372 61,234 26,922 49,184 113,032
Australia 39,007 52,129 45,034 42,400 12,145 –9,172 –228 –1,881 –4,665 –2,398 Canada 57,072 71,499 73,617 81,445 13,801 10,610 –1,291 5,822 –2,157 8,236 Japan 128,558 106,853 112,312 105,955 –20,935 –5,189 –8,851 9,496 1,158 –6,992 (of which in JPY) 46,603 38,935 39,559 29,398 –5,777 –14,298 –7,326 7,250 –3,259 –10,963 New Zealand 7,269 8,361 10,103 9,006 1,094 621 –271 825 1,166 –1,099
United States 1,854,740 1,725,562 1,866,814 1,978,183 –141,355 253,598 71,847 12,781 53,575 115,395 (of which in USD) 1,549,522 1,403,435 1,556,606 1,639,266 –141,470 227,364 51,723 23,466 68,972 83,203
Offshore centres 1,423,530 1,339,265 1,281,262 1,290,900 –125,620 –52,293 –27,963 –33,985 –4,295 13,950 Aruba 1,123 1,131 1,012 777 4 –323 79 –104 –71 –227 Bahamas 48,319 48,148 49,904 45,985 –905 –1,173 7,090 –10,705 6,142 –3,700 Bahrain 5,670 5,195 5,174 5,258 –583 51 –393 603 –263 104 Barbados 12,617 19,904 11,804 10,706 6,232 2,520 2,821 726 230 –1,257 Bermuda 59,382 62,589 60,342 61,210 2,290 –1,142 –2,496 1,657 –1,318 1,015
Cayman Islands 573,374 525,263 466,563 497,057 –63,218 –28,830 –19,611 –23,564 –16,481 30,826 Curacao ... – – 15,288 – – – ... – – Gibraltar 6,461 5,841 8,574 8,967 –861 3,282 1,203 491 1,134 454 Guernsey 79,797 38,330 40,715 41,315 –41,880 3,118 1,644 565 –53 962 Hong Kong SAR 115,903 107,990 108,664 103,492 –9,176 –4,381 –4,205 6,565 –1,718 –5,023 Isle of Man 16,386 17,478 16,557 16,606 –2,280 –290 –651 –248 317 292
Jersey 96,675 110,472 126,584 113,949 2,987 –16,469 –7,099 –5,879 7,475 –10,966 Lebanon 12,116 9,905 8,894 9,246 –2,385 –376 –215 –346 –218 403 Macao SAR 3,932 4,371 3,882 4,491 395 135 –1,207 254 470 618 Mauritius 9,144 9,679 10,404 10,811 290 1,119 –220 204 720 415 Netherlands Antilles 17,578 17,801 15,398 – –22 –2,250 1,297 –2,457 –1,046 –44
Panama 93,158 81,409 78,941 76,596 –13,217 –2,428 –1,178 –1,414 2,213 –2,049 Samoa 5,539 6,394 6,811 7,095 761 729 144 –171 463 293 Singapore 56,162 59,640 62,898 64,394 2,528 4,436 –43 345 2,553 1,581 Sint Maarten ... – ... – – – – ... ... – Vanuatu 286 262 250 253 –31 –8 7 –18 – 3 West Indies UK 201,328 199,326 194,839 194,514 –5,837 –5,328 –2,574 1,335 –4,499 410
Table 6B (cont.)
Amounts outstanding Estimated exchange rate adjusted changes
BIS Quarterly Review, June 2011 A 37
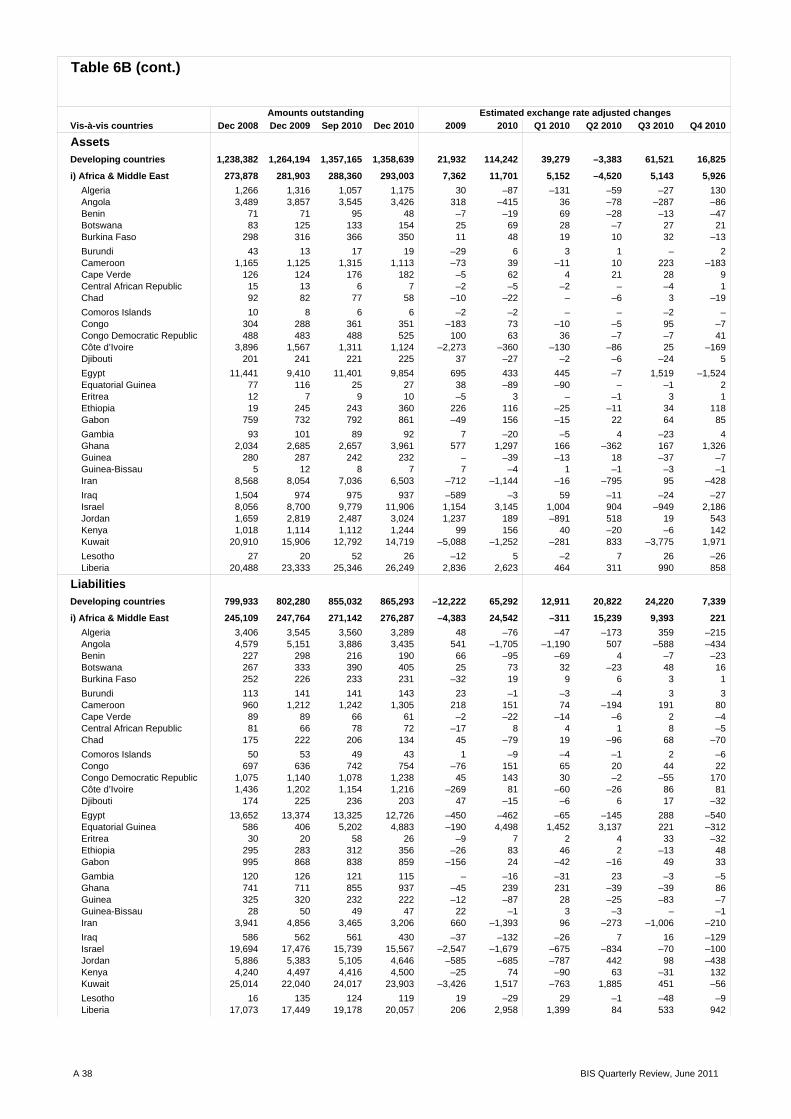
Vis-à-vis countries Dec 2008 Dec 2009 Sep 2010 Dec 2010 2009 2010 Q1 2010 Q2 2010 Q3 2010 Q4 2010
AssetsDeveloping countries 1,238,382 1,264,194 1,357,165 1,358,639 21,932 114,242 39,279 –3,383 61,521 16,825
i) Africa & Middle East 273,878 281,903 288,360 293,003 7,362 11,701 5,152 –4,520 5,143 5,926 Algeria 1,266 1,316 1,057 1,175 30 –87 –131 –59 –27 130 Angola 3,489 3,857 3,545 3,426 318 –415 36 –78 –287 –86 Benin 71 71 95 48 –7 –19 69 –28 –13 –47 Botswana 83 125 133 154 25 69 28 –7 27 21 Burkina Faso 298 316 366 350 11 48 19 10 32 –13
Burundi 43 13 17 19 –29 6 3 1 – 2 Cameroon 1,165 1,125 1,315 1,113 –73 39 –11 10 223 –183 Cape Verde 126 124 176 182 –5 62 4 21 28 9 Central African Republic 15 13 6 7 –2 –5 –2 – –4 1 Chad 92 82 77 58 –10 –22 – –6 3 –19
Comoros Islands 10 8 6 6 –2 –2 – – –2 – Congo 304 288 361 351 –183 73 –10 –5 95 –7 Congo Democratic Republic 488 483 488 525 100 63 36 –7 –7 41 Côte d’Ivoire 3,896 1,567 1,311 1,124 –2,273 –360 –130 –86 25 –169 Djibouti 201 241 221 225 37 –27 –2 –6 –24 5
Egypt 11,441 9,410 11,401 9,854 695 433 445 –7 1,519 –1,524 Equatorial Guinea 77 116 25 27 38 –89 –90 – –1 2 Eritrea 12 7 9 10 –5 3 – –1 3 1 Ethiopia 19 245 243 360 226 116 –25 –11 34 118 Gabon 759 732 792 861 –49 156 –15 22 64 85
Gambia 93 101 89 92 7 –20 –5 4 –23 4 Ghana 2,034 2,685 2,657 3,961 577 1,297 166 –362 167 1,326 Guinea 280 287 242 232 – –39 –13 18 –37 –7 Guinea-Bissau 5 12 8 7 7 –4 1 –1 –3 –1 Iran 8,568 8,054 7,036 6,503 –712 –1,144 –16 –795 95 –428
Iraq 1,504 974 975 937 –589 –3 59 –11 –24 –27 Israel 8,056 8,700 9,779 11,906 1,154 3,145 1,004 904 –949 2,186 Jordan 1,659 2,819 2,487 3,024 1,237 189 –891 518 19 543 Kenya 1,018 1,114 1,112 1,244 99 156 40 –20 –6 142 Kuwait 20,910 15,906 12,792 14,719 –5,088 –1,252 –281 833 –3,775 1,971
Lesotho 27 20 52 26 –12 5 –2 7 26 –26 Liberia 20,488 23,333 25,346 26,249 2,836 2,623 464 311 990 858
LiabilitiesDeveloping countries 799,933 802,280 855,032 865,293 –12,222 65,292 12,911 20,822 24,220 7,339
i) Africa & Middle East 245,109 247,764 271,142 276,287 –4,383 24,542 –311 15,239 9,393 221 Algeria 3,406 3,545 3,560 3,289 48 –76 –47 –173 359 –215 Angola 4,579 5,151 3,886 3,435 541 –1,705 –1,190 507 –588 –434 Benin 227 298 216 190 66 –95 –69 4 –7 –23 Botswana 267 333 390 405 25 73 32 –23 48 16 Burkina Faso 252 226 233 231 –32 19 9 6 3 1
Burundi 113 141 141 143 23 –1 –3 –4 3 3 Cameroon 960 1,212 1,242 1,305 218 151 74 –194 191 80 Cape Verde 89 89 66 61 –2 –22 –14 –6 2 –4 Central African Republic 81 66 78 72 –17 8 4 1 8 –5 Chad 175 222 206 134 45 –79 19 –96 68 –70
Comoros Islands 50 53 49 43 1 –9 –4 –1 2 –6 Congo 697 636 742 754 –76 151 65 20 44 22 Congo Democratic Republic 1,075 1,140 1,078 1,238 45 143 30 –2 –55 170 Côte d’Ivoire 1,436 1,202 1,154 1,216 –269 81 –60 –26 86 81 Djibouti 174 225 236 203 47 –15 –6 6 17 –32
Egypt 13,652 13,374 13,325 12,726 –450 –462 –65 –145 288 –540 Equatorial Guinea 586 406 5,202 4,883 –190 4,498 1,452 3,137 221 –312 Eritrea 30 20 58 26 –9 7 2 4 33 –32 Ethiopia 295 283 312 356 –26 83 46 2 –13 48 Gabon 995 868 838 859 –156 24 –42 –16 49 33
Gambia 120 126 121 115 – –16 –31 23 –3 –5 Ghana 741 711 855 937 –45 239 231 –39 –39 86 Guinea 325 320 232 222 –12 –87 28 –25 –83 –7 Guinea-Bissau 28 50 49 47 22 –1 3 –3 – –1 Iran 3,941 4,856 3,465 3,206 660 –1,393 96 –273 –1,006 –210
Iraq 586 562 561 430 –37 –132 –26 7 16 –129 Israel 19,694 17,476 15,739 15,567 –2,547 –1,679 –675 –834 –70 –100 Jordan 5,886 5,383 5,105 4,646 –585 –685 –787 442 98 –438 Kenya 4,240 4,497 4,416 4,500 –25 74 –90 63 –31 132 Kuwait 25,014 22,040 24,017 23,903 –3,426 1,517 –763 1,885 451 –56
Lesotho 16 135 124 119 19 –29 29 –1 –48 –9 Liberia 17,073 17,449 19,178 20,057 206 2,958 1,399 84 533 942
Table 6B (cont.)
Amounts outstanding Estimated exchange rate adjusted changes
A 38 BIS Quarterly Review, June 2011

Vis-à-vis countries Dec 2008 Dec 2009 Sep 2010 Dec 2010 2009 2010 Q1 2010 Q2 2010 Q3 2010 Q4 2010
AssetsLibya 727 1,358 1,026 923 605 –417 –278 388 –425 –102 Madagascar 450 607 636 659 144 59 6 –348 376 25 Malawi 89 161 117 109 49 –54 –64 29 –11 –8 Mali 220 218 195 184 –7 –20 –5 –11 4 –8 Mauritania 136 147 131 150 7 11 5 –10 –5 21
Morocco 4,674 5,383 5,323 5,330 881 230 150 –126 90 116 Mozambique 504 743 786 827 48 96 –6 –9 70 41 Namibia 779 920 863 769 111 –118 –19 –21 10 –88 Niger 115 147 49 43 34 –101 –107 9 3 –6 Nigeria 4,836 5,654 4,865 4,385 439 –1,234 –190 –7 –567 –470
Oman 7,991 7,908 8,064 7,697 –98 –251 123 –628 624 –370 Palestinian Territory 8 11 15 12 3 1 1 – 3 –3 Qatar 33,654 36,724 40,972 43,951 2,886 7,377 1,861 –939 3,273 3,182 Rwanda 10 40 33 34 27 –7 –4 –1 –3 1 Sao Tomé and Principe 48 41 51 52 –7 14 11 2 –1 2
Saudi Arabia 37,823 37,607 34,967 36,710 –543 –1,110 426 –3,897 516 1,845 Senegal 810 903 762 736 70 –110 –2 –21 –75 –12 Seychelles 985 1,279 1,366 1,725 271 490 69 50 3 368 Sierra Leone 57 60 62 190 – 135 10 –9 3 131 Somalia 98 110 92 91 8 –11 –2 –3 –7 1
South Africa 14,040 16,240 17,476 17,187 1,867 1,267 688 –458 1,157 –120 St. Helena 4 10 7 12 6 2 –5 – 2 5 Sudan 599 642 670 665 32 34 48 16 –23 –7 Swaziland 42 44 117 116 –6 71 57 12 3 –1 Syria 739 679 708 692 –38 17 48 –42 25 –14
Tanzania 427 600 719 751 107 156 32 38 51 35 Togo 78 99 99 73 19 –22 – – 3 –25 Tunisia 2,552 2,448 2,138 1,987 9 –233 53 –93 –163 –30 Uganda 203 269 366 364 26 99 –18 70 47 – United Arab Emirates 61,458 61,398 67,634 63,581 –834 1,590 3,247 1,044 1,182 –3,883
Yemen 930 1,142 1,024 1,362 206 50 –27 –341 79 339 Zambia 595 729 878 770 31 41 174 –12 –13 –108 Zimbabwe 795 354 389 283 –121 –79 –6 –31 63 –105 Residual 8,905 13,084 11,541 11,808 2,768 –1,278 –1,877 –345 678 266
LiabilitiesLibya 5,797 5,713 8,184 7,530 –141 1,901 682 704 1,121 –606 Madagascar 670 863 609 567 176 –262 –226 –2 – –34 Malawi 117 137 225 219 6 78 5 54 24 –5 Mali 285 263 249 205 –28 –46 11 –33 16 –40 Mauritania 382 311 367 456 –78 155 9 –15 69 92
Morocco 4,401 3,993 3,958 4,143 –512 412 –176 202 141 245 Mozambique 270 420 447 476 70 75 29 –6 22 30 Namibia 301 694 821 894 97 172 297 –178 –3 56 Niger 92 111 139 114 15 8 73 141 –183 –23 Nigeria 6,999 7,251 6,350 7,619 132 380 650 –549 –1,011 1,290
Oman 5,767 4,489 5,056 5,016 –1,432 551 –370 205 723 –7 Palestinian Territory 362 274 234 258 –91 –11 36 –64 –8 25 Qatar 8,801 9,084 13,395 19,723 204 4,438 211 1,941 2,133 153 Rwanda 163 226 197 148 53 –80 –3 –50 20 –47 Sao Tomé and Principe 15 12 16 9 –2 –3 –1 1 4 –7
Saudi Arabia 38,768 40,877 53,608 54,139 1,656 13,255 –1,368 9,065 4,865 693 Senegal 1,391 1,330 1,099 976 –97 –278 –180 18 –11 –105 Seychelles 4,118 5,146 5,399 5,538 936 497 –450 61 704 182 Sierra Leone 116 83 116 112 –37 23 2 3 21 –3 Somalia 16 16 15 16 –1 – –1 –1 1 1
South Africa 11,979 12,620 14,447 13,880 5 1,548 739 404 838 –433 St. Helena 8 14 19 11 5 –6 –7 4 5 –8 Sudan 496 538 742 466 21 –63 95 24 88 –270 Swaziland 601 306 316 262 –485 –63 –10 –10 17 –60 Syria 2,335 2,271 1,843 1,982 –108 –208 165 –243 –285 155
Tanzania 867 864 981 944 –37 92 –38 128 31 –29 Togo 293 308 290 276 4 –19 –8 –4 3 –10 Tunisia 1,561 1,700 1,603 1,583 93 –31 –99 10 54 4 Uganda 255 330 331 310 62 –23 –19 48 –33 –19 United Arab Emirates 30,078 31,809 33,421 32,026 969 –43 838 –1,321 1,740 –1,300
Yemen 886 1,009 1,053 1,781 93 729 322 –226 –112 745 Zambia 502 563 810 717 20 158 129 –23 140 –88 Zimbabwe 690 778 761 704 –1 –67 –75 94 –32 –54 Residual 8,924 10,266 7,167 7,869 –14 –2,267 –1,221 528 –2,286 712
Table 6B (cont.)
Amounts outstanding Estimated exchange rate adjusted changes
BIS Quarterly Review, June 2011 A 39

Vis-à-vis countries Dec 2008 Dec 2009 Sep 2010 Dec 2010 2009 2010 Q1 2010 Q2 2010 Q3 2010 Q4 2010
Assetsii) Asia & Pacific 278,613 300,630 374,589 386,332 26,649 86,004 21,629 11,606 38,842 13,927
Afghanistan 42 97 76 64 53 –32 2 –7 –15 –12 Armenia 91 170 151 160 77 –7 –31 27 –13 10 Azerbaijan 2,184 2,075 3,630 2,245 –143 273 583 –111 1,132 –1,331 Bangladesh 989 918 979 1,029 –74 107 35 –17 39 50 Bhutan 59 68 67 72 7 8 –2 2 2 6
British Overseas Territories 428 489 469 410 36 –574 –491 10 –28 –65 Brunei 389 492 590 722 94 229 8 134 –47 134 Cambodia 180 350 280 247 168 –100 –63 –32 27 –32 China 53,916 57,832 84,166 86,853 5,558 29,225 9,680 1,837 14,818 2,890 Chinese Taipei 12,391 17,839 19,638 21,093 5,301 2,958 433 –421 1,412 1,534
Fiji 25 51 36 33 24 –19 –7 3 –12 –3 French Polynesia 754 897 838 819 118 –32 –31 –22 27 –6 Georgia 303 283 355 229 –4 –53 67 –35 39 –124 India 56,378 58,241 78,326 80,960 4,028 22,410 5,011 7,568 6,838 2,993 Indonesia 21,018 22,772 27,450 29,636 2,618 6,837 1,814 –737 3,514 2,246
Kazakhstan 7,529 6,701 6,870 6,722 –925 –38 –80 226 –56 –128 Kiribati – – – – – – – – – – Kyrgyz Republic 41 76 23 16 35 –58 –51 –2 2 –7 Laos 347 271 274 278 –77 12 17 –11 2 4 Malaysia 15,461 17,349 18,935 19,169 1,767 1,858 1,833 –351 42 334
Maldives 299 269 241 271 –34 4 –46 –5 23 32 Marshall Islands 23,106 25,342 25,851 26,722 2,218 1,299 306 –1,074 1,188 879 Micronesia 25 – – – –25 – – – – –
Liabilitiesii) Asia & Pacific 233,848 233,711 255,400 258,865 –3,660 25,960 10,376 3,557 7,967 4,060
Afghanistan 117 131 147 145 10 16 5 –21 33 –1 Armenia 154 168 226 221 8 60 6 –14 71 –3 Azerbaijan 694 496 535 763 –195 239 28 749 –769 231 Bangladesh 497 835 997 984 323 147 107 13 37 –10 Bhutan 9 5 2 3 –4 –3 – –4 – 1
British Overseas Territories 1,087 1,150 793 629 27 –539 –123 –230 –28 –158 Brunei 2,119 2,530 2,340 2,630 372 131 594 –384 –384 305 Cambodia 122 129 239 156 3 30 49 –44 107 –82 China 83,259 70,082 80,775 86,165 –13,743 16,110 2,896 5,814 1,746 5,654 Chinese Taipei 50,340 48,861 50,180 51,149 –2,169 2,285 1,165 391 –261 990
Fiji 105 103 124 90 –9 –16 9 8 2 –35 French Polynesia 388 329 357 337 –65 17 –46 19 60 –16 Georgia 348 324 380 414 –36 103 25 –16 58 36 India 15,320 16,901 15,615 15,527 1,304 –1,258 –199 –1,021 12 –50 Indonesia 4,394 4,939 5,689 5,745 418 898 454 –159 547 56
Kazakhstan 3,893 4,097 5,330 5,112 152 1,068 37 284 946 –199 Kiribati 100 71 86 77 –39 7 2 16 –3 –8 Kyrgyz Republic 56 86 77 63 29 –22 –10 18 –16 –14 Laos 58 89 90 63 26 –29 3 18 –23 –27 Malaysia 6,878 7,932 8,315 8,736 788 806 311 293 –222 424
Maldives 84 67 83 82 –19 15 1 5 10 –1 Marshall Islands 7,188 8,114 10,168 10,421 837 2,487 1,652 –9 560 284 Micronesia 36 26 24 24 –10 –4 –11 9 –2 –
Table 6B (cont.)
Amounts outstanding Estimated exchange rate adjusted changes
A 40 BIS Quarterly Review, June 2011

Vis-à-vis countries Dec 2008 Dec 2009 Sep 2010 Dec 2010 2009 2010 Q1 2010 Q2 2010 Q3 2010 Q4 2010
AssetsMongolia 88 110 570 507 40 382 8 32 399 –57 Myanmar 70 40 36 35 –31 –5 –4 – – –1 Nauru 16 10 10 8 –6 –2 1 –3 2 –2 Nepal 26 41 38 42 14 – –9 1 4 4 New Caledonia 1,687 1,846 1,777 1,780 106 67 160 –46 –86 39
North Korea 44 47 50 45 1 –4 –2 22 –19 –5 Pakistan 3,552 3,289 3,699 3,466 –195 142 –136 121 385 –228 Palau 34 30 29 28 –4 –2 – –1 – –1 Papua New Guinea 204 209 304 307 –9 135 96 47 –10 2 Philippines 11,111 10,952 12,482 12,656 –2 2,280 300 511 919 550
Solomon Islands 21 21 26 25 – 4 6 –3 2 –1 South Korea 46,312 50,428 57,804 57,199 3,775 7,129 1,832 2,341 2,908 48 Sri Lanka 1,805 1,654 2,417 2,324 247 685 117 249 395 –76 Tajikistan 3 2 1 – –1 –2 –2 3 –2 –1 Thailand 8,651 10,038 11,657 13,267 1,463 3,180 –338 1,067 757 1,694
Timor Leste 5 5 6 7 – 2 3 –3 1 1 Tonga 3 – – – –3 – – – – – Turkmenistan 2 57 55 12 55 –45 –48 –3 49 –43 Tuvalu 1 11 10 31 10 20 – – –1 21 US Pacific Islands 647 171 837 823 –478 655 381 –333 618 –11
Uzbekistan 224 654 734 805 430 159 49 21 17 72 Vietnam 5,769 6,171 7,059 8,100 552 2,103 241 273 425 1,164 Wallis/Futuna 22 18 15 14 –5 –3 – – –2 –1 Residual 2,361 2,244 5,728 7,101 –128 4,819 –15 329 3,148 1,357
LiabilitiesMongolia 54 28 41 272 –28 245 6 7 1 231 Myanmar 310 1,079 603 602 740 –436 –302 –108 –35 9 Nauru 11 24 12 12 –3 –12 2 –10 –4 – Nepal 329 341 271 409 11 71 –75 32 –26 140 New Caledonia 713 741 772 730 5 2 21 –61 78 –36
North Korea 42 64 54 45 18 –18 –13 – 4 –9 Pakistan 2,903 2,779 3,041 3,070 –203 306 396 –106 –29 45 Palau 3 2 2 8 –1 6 – 1 –1 6 Papua New Guinea 629 2,015 1,999 2,088 1,343 70 –315 203 94 88 Philippines 6,008 5,923 5,954 5,448 –103 –485 302 –537 250 –500
Solomon Islands 68 78 74 61 4 –15 –2 –2 2 –13 South Korea 9,129 8,412 13,070 9,244 –951 832 1,759 –18 2,904 –3,813 Sri Lanka 678 860 1,115 1,334 151 466 35 41 166 224 Tajikistan 22 22 32 31 –1 8 –1 – 10 –1 Thailand 6,155 6,567 7,215 7,379 222 876 188 1,035 –540 193
Timor Leste 8 11 28 54 3 42 –1 3 14 26 Tonga 3 2 2 2 –1 – – – – – Turkmenistan 32 29 31 28 –5 – 5 –2 – –3 Tuvalu 5 7 4 18 – 11 –1 –2 – 14 US Pacific Islands 181 86 181 269 –97 190 278 –227 51 88
Uzbekistan 614 1,283 1,196 1,353 646 93 –79 –3 9 166 Vietnam 724 765 834 796 28 31 10 32 26 –37 Wallis/Futuna 39 34 37 33 –6 2 – – 5 –3 Residual 27,942 35,094 36,260 36,043 6,557 1,122 1,207 –2,458 2,507 –134
Table 6B (cont.)
Amounts outstanding Estimated exchange rate adjusted changes
BIS Quarterly Review, June 2011 A 41
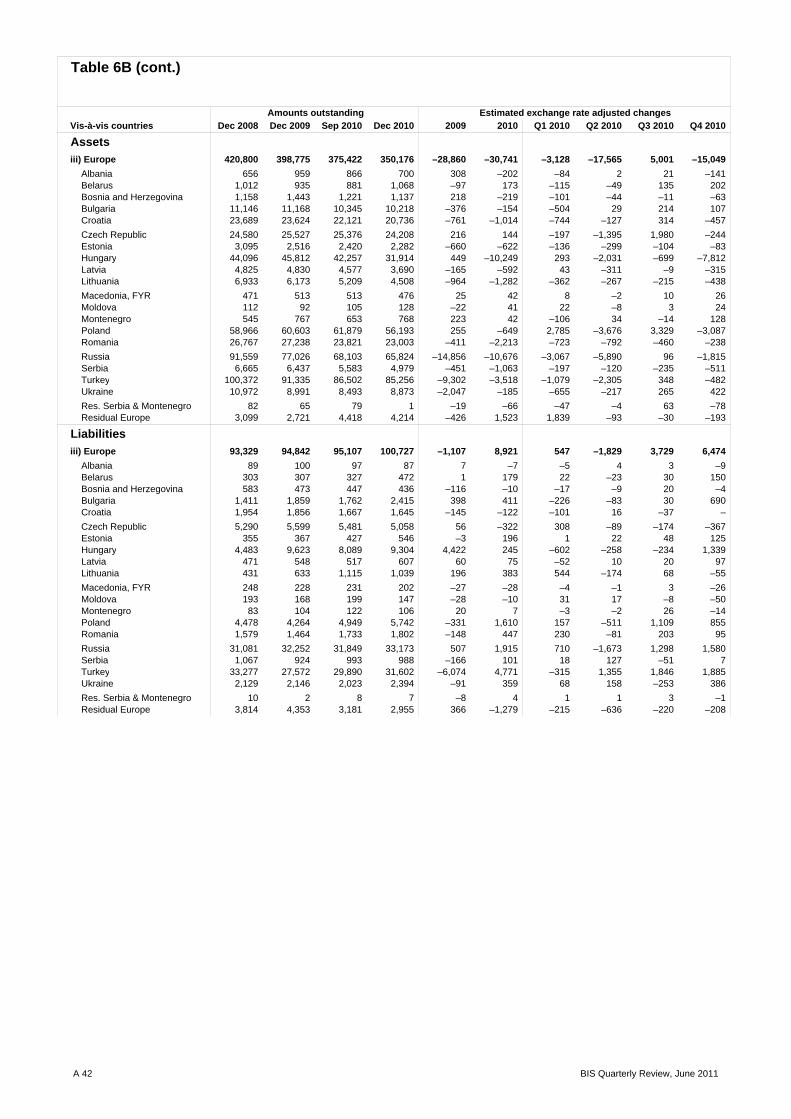
Vis-à-vis countries Dec 2008 Dec 2009 Sep 2010 Dec 2010 2009 2010 Q1 2010 Q2 2010 Q3 2010 Q4 2010
Assetsiii) Europe 420,800 398,775 375,422 350,176 –28,860 –30,741 –3,128 –17,565 5,001 –15,049
Albania 656 959 866 700 308 –202 –84 2 21 –141 Belarus 1,012 935 881 1,068 –97 173 –115 –49 135 202 Bosnia and Herzegovina 1,158 1,443 1,221 1,137 218 –219 –101 –44 –11 –63 Bulgaria 11,146 11,168 10,345 10,218 –376 –154 –504 29 214 107 Croatia 23,689 23,624 22,121 20,736 –761 –1,014 –744 –127 314 –457
Czech Republic 24,580 25,527 25,376 24,208 216 144 –197 –1,395 1,980 –244 Estonia 3,095 2,516 2,420 2,282 –660 –622 –136 –299 –104 –83 Hungary 44,096 45,812 42,257 31,914 449 –10,249 293 –2,031 –699 –7,812 Latvia 4,825 4,830 4,577 3,690 –165 –592 43 –311 –9 –315 Lithuania 6,933 6,173 5,209 4,508 –964 –1,282 –362 –267 –215 –438
Macedonia, FYR 471 513 513 476 25 42 8 –2 10 26 Moldova 112 92 105 128 –22 41 22 –8 3 24 Montenegro 545 767 653 768 223 42 –106 34 –14 128 Poland 58,966 60,603 61,879 56,193 255 –649 2,785 –3,676 3,329 –3,087 Romania 26,767 27,238 23,821 23,003 –411 –2,213 –723 –792 –460 –238
Russia 91,559 77,026 68,103 65,824 –14,856 –10,676 –3,067 –5,890 96 –1,815 Serbia 6,665 6,437 5,583 4,979 –451 –1,063 –197 –120 –235 –511 Turkey 100,372 91,335 86,502 85,256 –9,302 –3,518 –1,079 –2,305 348 –482 Ukraine 10,972 8,991 8,493 8,873 –2,047 –185 –655 –217 265 422
Res. Serbia & Montenegro 82 65 79 1 –19 –66 –47 –4 63 –78 Residual Europe 3,099 2,721 4,418 4,214 –426 1,523 1,839 –93 –30 –193
Liabilitiesiii) Europe 93,329 94,842 95,107 100,727 –1,107 8,921 547 –1,829 3,729 6,474
Albania 89 100 97 87 7 –7 –5 4 3 –9 Belarus 303 307 327 472 1 179 22 –23 30 150 Bosnia and Herzegovina 583 473 447 436 –116 –10 –17 –9 20 –4 Bulgaria 1,411 1,859 1,762 2,415 398 411 –226 –83 30 690 Croatia 1,954 1,856 1,667 1,645 –145 –122 –101 16 –37 –
Czech Republic 5,290 5,599 5,481 5,058 56 –322 308 –89 –174 –367 Estonia 355 367 427 546 –3 196 1 22 48 125 Hungary 4,483 9,623 8,089 9,304 4,422 245 –602 –258 –234 1,339 Latvia 471 548 517 607 60 75 –52 10 20 97 Lithuania 431 633 1,115 1,039 196 383 544 –174 68 –55
Macedonia, FYR 248 228 231 202 –27 –28 –4 –1 3 –26 Moldova 193 168 199 147 –28 –10 31 17 –8 –50 Montenegro 83 104 122 106 20 7 –3 –2 26 –14 Poland 4,478 4,264 4,949 5,742 –331 1,610 157 –511 1,109 855 Romania 1,579 1,464 1,733 1,802 –148 447 230 –81 203 95
Russia 31,081 32,252 31,849 33,173 507 1,915 710 –1,673 1,298 1,580 Serbia 1,067 924 993 988 –166 101 18 127 –51 7 Turkey 33,277 27,572 29,890 31,602 –6,074 4,771 –315 1,355 1,846 1,885 Ukraine 2,129 2,146 2,023 2,394 –91 359 68 158 –253 386
Res. Serbia & Montenegro 10 2 8 7 –8 4 1 1 3 –1 Residual Europe 3,814 4,353 3,181 2,955 366 –1,279 –215 –636 –220 –208
Table 6B (cont.)
Amounts outstanding Estimated exchange rate adjusted changes
A 42 BIS Quarterly Review, June 2011

Vis-à-vis countries Dec 2008 Dec 2009 Sep 2010 Dec 2010 2009 2010 Q1 2010 Q2 2010 Q3 2010 Q4 2010
Assetsiv) Latin America/Caribbean 265,091 282,886 318,794 329,128 16,780 47,279 15,627 7,097 12,535 12,020
Argentina 13,651 10,819 11,245 11,233 –2,777 373 540 –168 –16 17 Belize 2,388 2,893 2,915 2,805 464 53 61 –20 109 –97 Bolivia 254 631 485 485 375 –146 –107 –28 –11 – Bonaire, Saint Eustatius and Sa ... – ... 8 – – – ... ... – Brazil 79,912 103,707 135,075 137,685 22,900 33,952 9,252 13,255 8,386 3,059
Chile 21,993 24,624 24,348 24,093 2,603 –375 597 –471 –435 –66
Colombia 8,259 7,588 7,963 8,546 –625 913 –9 40 249 633 Costa Rica 4,277 3,195 3,265 3,338 –1,068 143 93 35 –60 75 Cuba 714 599 622 526 –125 –52 6 –35 68 –91 Dominica 94 43 70 68 –51 25 15 14 –2 –2 Dominican Republic 3,162 3,023 3,313 3,191 –163 228 157 147 16 –92
Ecuador 1,981 1,805 1,847 2,063 –177 253 –44 –7 88 216 El Salvador 1,208 780 578 662 –338 –118 –102 –30 –70 84 Falkland Islands 37 35 30 28 –5 –5 –1 –2 –1 –1 Grenada 34 24 38 41 –10 14 7 –3 7 3 Guatemala 3,089 2,929 2,955 3,119 –121 189 –12 –19 56 164
Guyana 667 813 684 681 146 –136 –72 –21 –40 –3 Haiti 96 95 92 62 –2 –31 14 –8 –7 –30 Honduras 892 683 611 606 –211 –69 –19 –11 –35 –4 Jamaica 1,469 1,596 1,115 1,278 163 –271 274 –636 –77 168 Mexico 83,907 80,403 83,081 87,773 –3,855 8,073 4,250 –4,053 2,340 5,536
Nicaragua 412 431 320 325 19 –101 –24 –44 –38 5 Paraguay 840 628 619 636 –185 10 141 –4 –144 17 Peru 8,504 7,943 9,286 9,937 –359 2,094 101 –369 1,654 708 St. Lucia 436 239 195 190 –200 –46 –51 18 –9 –4 St. Vincent 601 602 587 603 –8 – 27 21 –65 17
Surinam 30 35 44 46 3 11 4 – 4 3 Trinidad and Tobago 2,937 3,100 2,816 2,707 145 –369 264 –722 194 –105 Turks and Caicos 467 728 442 486 247 –238 –194 –108 20 44 Uruguay 2,794 3,265 2,253 4,123 463 769 –237 –249 –610 1,865 Venezuela 6,609 6,291 7,078 6,882 –353 622 328 –220 692 –178
Residual 13,377 13,339 14,822 14,902 –114 1,507 365 794 270 78 Int. organisations 32,171 43,556 42,690 42,462 18,204 4,409 3,604 245 –291 851 Unallocated 61,267 44,094 43,751 43,913 –19,026 11,062 11,308 –2,166 1,570 350
Liabilitiesiv) Latin America/Caribbean 227,647 225,963 233,383 229,414 –3,074 5,870 2,299 3,855 3,131 –3,415
Argentina 26,104 25,791 26,081 24,228 –440 –1,334 659 –328 140 –1,805 Belize 9,223 9,193 9,268 9,599 –193 699 –285 –32 633 383 Bolivia 2,172 2,051 1,773 1,701 –129 –335 –111 –52 –103 –69 Bonaire, Saint Eustatius and Sa ... – ... – – – – ... ... – Brazil 26,355 23,692 28,097 27,722 –2,826 4,744 –1,339 3,485 2,886 –288
Chile 7,863 6,937 7,028 8,375 –970 1,455 23 –155 224 1,363
Colombia 10,225 11,481 12,000 11,323 1,227 –301 162 –214 419 –668 Costa Rica 4,295 3,478 3,058 3,013 –855 –404 –110 –34 –224 –36 Cuba 206 220 258 243 8 35 10 9 29 –13 Dominica 213 268 262 285 49 20 – –13 8 25 Dominican Republic 4,706 4,503 4,031 3,928 –216 –556 –45 –267 –148 –96
Ecuador 4,628 4,965 4,698 4,647 329 –307 –74 –95 –89 –49 El Salvador 1,224 1,286 1,260 1,315 60 37 –34 44 –29 56 Falkland Islands 43 43 63 67 –3 25 8 1 11 5 Grenada 134 131 117 98 –9 –28 24 –24 –10 –18 Guatemala 3,186 3,181 3,302 3,342 –10 170 97 –4 35 42
Guyana 225 211 144 148 –20 –64 127 –203 7 5 Haiti 426 341 398 405 –87 58 14 –1 38 7 Honduras 1,177 1,113 1,055 1,082 –65 –29 –22 –65 31 27 Jamaica 1,111 956 981 942 –172 –8 70 –242 200 –36 Mexico 43,325 42,418 47,229 44,065 –960 1,737 3,410 2,410 –994 –3,089
Nicaragua 632 678 632 843 46 168 2 –27 –19 212 Paraguay 1,244 1,241 1,187 1,252 –11 27 –97 15 41 68 Peru 5,124 5,030 5,623 5,154 –114 148 166 315 130 –463 St. Lucia 375 445 233 285 61 –153 –61 –39 –107 54 St. Vincent 3,412 2,766 2,469 2,587 –716 –49 –78 –96 –9 134
Surinam 365 434 471 462 58 15 58 –33 –8 –2 Trinidad and Tobago 1,038 1,686 1,633 1,718 627 39 113 –282 119 89 Turks and Caicos 1,454 1,871 1,862 1,843 357 12 –27 20 28 –9 Uruguay 8,183 8,820 8,598 7,227 593 –1,476 371 –51 –439 –1,357 Venezuela 37,582 37,690 37,129 38,846 –72 1,731 –1,177 –9 1,094 1,823
Residual 21,397 23,043 22,443 22,669 1,377 –210 443 –180 –763 290 Int. organisations 99,276 55,990 62,625 61,614 3,392 6,922 4,403 6,288 –3,602 –167 Unallocated 454,233 549,584 537,693 500,890 80,780 –28,333 3,934 –29,782 30,891 –33,376
Amounts outstanding Estimated exchange rate adjusted changes
Table 6B (cont.)
BIS Quarterly Review, June 2011 A 43

Table 7A: External loans and deposits of reporting banks vis-à-vis all sectorsVis-à-vis individual countriesin millions of US dollars
Vis-à-vis countries Dec 2008 Dec 2009 Sep 2010 Dec 2010 2009 2010 Q1 2010 Q2 2010 Q3 2010 Q4 2010
LoansAll countries 22,902,466 21,656,104 22,360,343 22,004,295 –1,721,073 931,706 447,858 179,758 391,121 –87,031 Developed Countries 17,571,701 16,462,093 16,772,824 16,274,172 –1,504,171 349,149 281,190 63,623 245,870 –241,534 i) Europe 12,845,133 11,869,771 11,975,272 11,448,489 –1,340,259 116,110 202,380 64,565 132,703 –283,538
Euro area 7,310,503 6,853,313 6,767,750 6,360,011 –677,608 –108,315 –20,906 78,055 73,533 –238,997
(of which in EUR) 4,801,988 4,612,760 4,617,582 4,309,130 –346,184 65,417 59,956 215,175 –39,080 –170,634
Austria 122,296 102,991 113,087 103,921 –22,767 4,896 7,190 3,500 1,744 –7,538 Belgium 394,289 340,724 323,339 309,714 –63,748 –17,859 –32,030 5,998 17,429 –9,256 Cyprus 64,746 98,170 80,878 65,873 29,722 –27,325 2,416 135 –15,713 –14,163
Finland 93,550 110,052 112,126 123,285 13,682 16,710 –11,891 15,333 699 12,569 France 1,388,432 1,295,311 1,344,550 1,327,982 –128,231 90,233 51,645 –23,953 59,510 3,031 Germany 1,133,782 1,079,263 1,141,973 1,183,299 –86,195 125,745 –1,197 140,170 –32,934 19,706 Greece 108,116 120,620 111,483 104,089 8,520 –8,807 8,199 –474 –11,068 –5,464
Ireland 868,623 812,554 759,209 566,431 –91,234 –124,406 –22,621 –10,031 –9,260 –82,494 Italy 578,772 567,283 538,668 505,590 –32,286 –19,440 10,802 –31,853 24,486 –22,875 Luxembourg 748,235 643,821 611,115 634,855 –122,680 23,738 –20,176 –510 9,740 34,684 Malta 35,368 29,224 26,446 25,889 –6,586 –2,401 1,086 –2,619 –541 –327
Netherlands 896,848 781,079 825,399 698,706 –140,218 –55,710 –3,737 24,389 40,092 –116,454 Portugal 184,657 177,548 160,606 152,184 –12,432 –11,680 –749 –97 –6,193 –4,641 Slovakia 19,695 10,334 12,667 12,704 –9,192 2,843 221 456 1,845 321 Slovenia 31,143 26,744 24,539 22,756 –5,266 –1,942 –655 –648 303 –942 Spain 641,951 657,595 581,665 522,733 –8,696 –102,910 –9,409 –41,741 –6,607 –45,153
Andorra 1,817 2,278 1,708 2,230 376 98 –351 146 –254 557 Denmark 191,685 206,586 208,259 188,534 7,376 –9,352 17,867 –28,598 18,702 –17,323 Iceland 23,038 21,915 22,182 10,907 –1,621 –406 1,438 –1,041 1,075 –1,878 Liechtenstein 7,515 7,119 6,403 6,709 –540 –137 –475 –150 151 337 Norway 220,011 182,035 170,966 176,805 –42,519 –1,859 –2,975 5,606 –11,641 7,151
Sweden 235,335 218,026 222,597 210,789 –21,493 –2,278 –6,041 13,562 –28 –9,771 Switzerland 673,134 540,613 512,548 512,767 –151,804 –29,394 –2,180 –136 –26,877 –201 (of which in CHF) 125,427 106,925 120,638 126,328 –22,373 7,952 –1,602 7,119 373 2,062 United Kingdom 4,180,335 3,836,265 4,061,791 3,978,870 –452,252 268,370 216,048 –2,716 78,268 –23,230 (of which in GBP) 546,701 569,715 545,167 503,618 –42,704 –29,466 –7,097 –5,088 –1,970 –15,311
Vatican 1 – 1 1 –3 –3 34 –31 –6 – Other 1,759 1,621 1,067 866 –173 –613 –79 –132 –220 –182
DepositsAll Countries 24,442,490 23,113,451 23,566,283 23,228,317 –1,859,530 772,055 374,104 22,459 370,423 5,069 Developed Countries 17,094,138 16,196,793 16,756,111 16,388,350 –1,270,134 765,819 449,158 107,356 257,778 –48,473 i) Europe 12,258,678 11,435,503 11,603,685 11,109,134 –1,167,214 251,522 243,531 73,533 122,034 –187,576
Euro area 6,618,981 6,159,538 6,052,528 5,759,936 –652,196 –27,838 –34,762 48,561 65,203 –106,840
(of which in EUR) 4,317,568 4,143,152 4,060,260 3,806,839 –313,962 18,332 46,852 26,875 41,758 –97,153
Austria 114,246 108,733 97,435 82,271 –10,478 –20,550 11,190 4,487 –22,247 –13,980 Belgium 460,968 445,364 428,772 404,463 –31,692 –22,346 –14,449 1,943 7,538 –17,378 Cyprus 48,608 59,738 57,714 47,130 9,255 –9,680 1,602 –5,691 4,102 –9,693
Finland 89,972 99,732 95,265 98,338 6,868 1,627 –9,478 4,132 2,992 3,981 France 1,075,057 1,080,127 1,158,912 1,126,517 –28,254 99,078 41,869 2,608 68,186 –13,585 Germany 1,923,971 1,764,490 1,656,069 1,599,699 –209,780 7,705 –32,702 17,681 –20,462 43,188 Greece 98,936 124,178 121,212 106,690 20,138 –8,427 14,690 11,146 –21,418 –12,845
Ireland 532,272 494,080 535,756 467,958 –64,958 –2,656 9,955 9,895 16,396 –38,902 Italy 276,959 256,333 242,406 242,726 –27,131 –1,286 –11,140 6,777 –1,412 4,489 Luxembourg 780,375 658,075 637,500 640,995 –129,524 5,720 –25,116 –10,154 29,715 11,275 Malta 17,721 18,363 20,474 20,832 140 3,060 1,567 1,577 –698 614
Netherlands 827,085 693,374 664,787 597,852 –160,214 –67,086 –16,284 518 6,929 –58,249 Portugal 84,902 84,931 89,818 82,890 –2,271 4,252 4,531 2,755 2,434 –5,468 Slovakia 3,425 5,730 5,870 5,800 1,836 387 5 412 –67 37 Slovenia 5,035 4,666 3,608 2,912 –443 –1,629 –945 512 –548 –648 Spain 279,449 261,624 236,930 232,863 –25,687 –16,009 –10,058 –36 –6,237 322
Andorra 7,752 4,195 3,370 3,107 –3,735 –953 –845 544 –433 –219 Denmark 164,398 138,998 139,871 130,786 –33,543 –4,781 6,036 –7,398 3,985 –7,404 Iceland 7,485 4,749 6,904 5,916 –3,182 1,327 444 847 950 –914 Liechtenstein 34,734 30,024 22,295 22,166 –5,461 –4,574 338 –4,287 –610 –15 Norway 102,274 69,441 80,286 79,322 –42,490 –13,969 1,043 15,332 –30,025 –319
Sweden 138,540 149,340 180,047 164,181 3,078 15,558 28,736 3,857 –3,045 –13,990 Switzerland 1,160,337 942,359 837,563 846,252 –236,305 –86,911 –20,997 –42,653 –38,725 15,464 (of which in CHF) 134,475 116,659 79,914 81,009 –22,363 –36,505 –9,899 –18,699 –6,014 –1,893 United Kingdom 4,019,521 3,933,209 4,277,124 4,093,697 –192,158 373,287 263,600 58,844 124,320 –73,477 (of which in GBP) 582,545 461,990 441,458 374,376 –175,542 –64,433 –6,149 –14,409 7,245 –51,120
Vatican 1,923 1,221 1,422 1,378 –778 235 –88 –89 437 –25 Other 2,733 2,429 2,275 2,393 –444 143 27 –24 –24 164
Amounts outstanding Estimated exchange rate adjusted changes
A 44 BIS Quarterly Review, June 2011
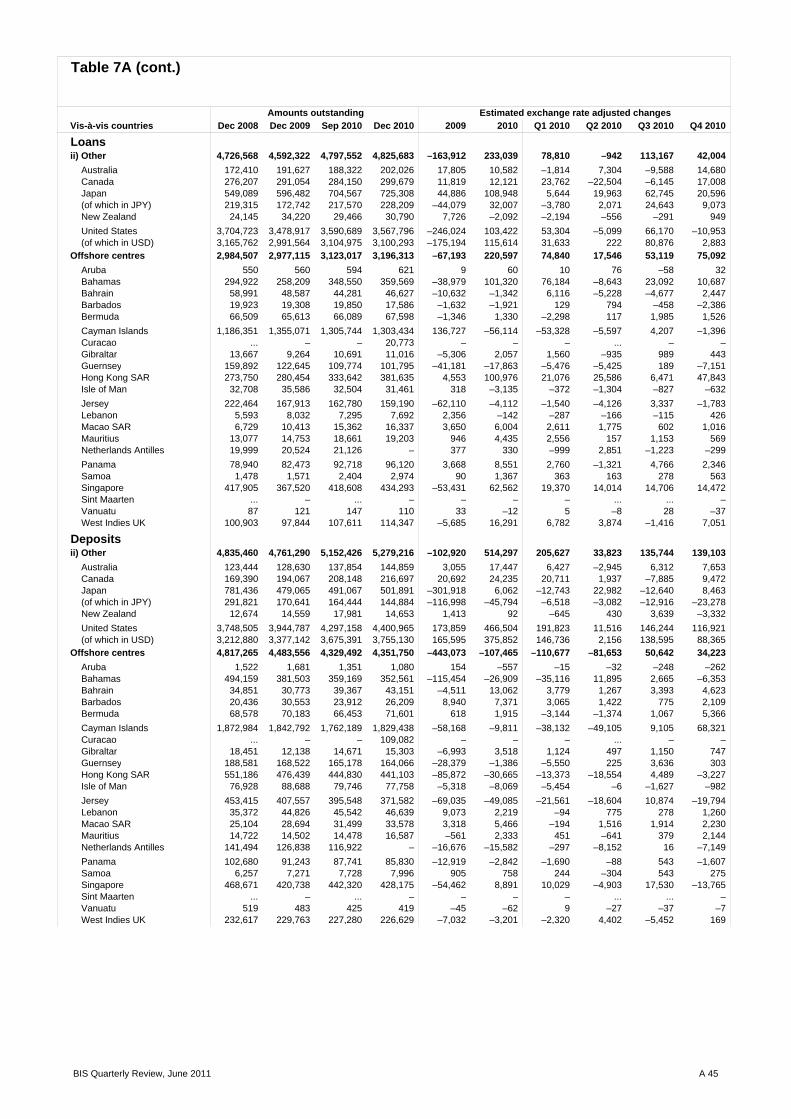
Vis-à-vis countries Dec 2008 Dec 2009 Sep 2010 Dec 2010 2009 2010 Q1 2010 Q2 2010 Q3 2010 Q4 2010
Loansii) Other 4,726,568 4,592,322 4,797,552 4,825,683 –163,912 233,039 78,810 –942 113,167 42,004
Australia 172,410 191,627 188,322 202,026 17,805 10,582 –1,814 7,304 –9,588 14,680 Canada 276,207 291,054 284,150 299,679 11,819 12,121 23,762 –22,504 –6,145 17,008 Japan 549,089 596,482 704,567 725,308 44,886 108,948 5,644 19,963 62,745 20,596 (of which in JPY) 219,315 172,742 217,570 228,209 –44,079 32,007 –3,780 2,071 24,643 9,073 New Zealand 24,145 34,220 29,466 30,790 7,726 –2,092 –2,194 –556 –291 949
United States 3,704,723 3,478,917 3,590,689 3,567,796 –246,024 103,422 53,304 –5,099 66,170 –10,953 (of which in USD) 3,165,762 2,991,564 3,104,975 3,100,293 –175,194 115,614 31,633 222 80,876 2,883
Offshore centres 2,984,507 2,977,115 3,123,017 3,196,313 –67,193 220,597 74,840 17,546 53,119 75,092 Aruba 550 560 594 621 9 60 10 76 –58 32 Bahamas 294,922 258,209 348,550 359,569 –38,979 101,320 76,184 –8,643 23,092 10,687 Bahrain 58,991 48,587 44,281 46,627 –10,632 –1,342 6,116 –5,228 –4,677 2,447 Barbados 19,923 19,308 19,850 17,586 –1,632 –1,921 129 794 –458 –2,386 Bermuda 66,509 65,613 66,089 67,598 –1,346 1,330 –2,298 117 1,985 1,526
Cayman Islands 1,186,351 1,355,071 1,305,744 1,303,434 136,727 –56,114 –53,328 –5,597 4,207 –1,396 Curacao ... – – 20,773 – – – ... – – Gibraltar 13,667 9,264 10,691 11,016 –5,306 2,057 1,560 –935 989 443 Guernsey 159,892 122,645 109,774 101,795 –41,181 –17,863 –5,476 –5,425 189 –7,151 Hong Kong SAR 273,750 280,454 333,642 381,635 4,553 100,976 21,076 25,586 6,471 47,843 Isle of Man 32,708 35,586 32,504 31,461 318 –3,135 –372 –1,304 –827 –632
Jersey 222,464 167,913 162,780 159,190 –62,110 –4,112 –1,540 –4,126 3,337 –1,783 Lebanon 5,593 8,032 7,295 7,692 2,356 –142 –287 –166 –115 426 Macao SAR 6,729 10,413 15,362 16,337 3,650 6,004 2,611 1,775 602 1,016 Mauritius 13,077 14,753 18,661 19,203 946 4,435 2,556 157 1,153 569 Netherlands Antilles 19,999 20,524 21,126 – 377 330 –999 2,851 –1,223 –299
Panama 78,940 82,473 92,718 96,120 3,668 8,551 2,760 –1,321 4,766 2,346 Samoa 1,478 1,571 2,404 2,974 90 1,367 363 163 278 563 Singapore 417,905 367,520 418,608 434,293 –53,431 62,562 19,370 14,014 14,706 14,472 Sint Maarten ... – ... – – – – ... ... – Vanuatu 87 121 147 110 33 –12 5 –8 28 –37 West Indies UK 100,903 97,844 107,611 114,347 –5,685 16,291 6,782 3,874 –1,416 7,051
Depositsii) Other 4,835,460 4,761,290 5,152,426 5,279,216 –102,920 514,297 205,627 33,823 135,744 139,103
Australia 123,444 128,630 137,854 144,859 3,055 17,447 6,427 –2,945 6,312 7,653 Canada 169,390 194,067 208,148 216,697 20,692 24,235 20,711 1,937 –7,885 9,472 Japan 781,436 479,065 491,067 501,891 –301,918 6,062 –12,743 22,982 –12,640 8,463 (of which in JPY) 291,821 170,641 164,444 144,884 –116,998 –45,794 –6,518 –3,082 –12,916 –23,278 New Zealand 12,674 14,559 17,981 14,653 1,413 92 –645 430 3,639 –3,332
United States 3,748,505 3,944,787 4,297,158 4,400,965 173,859 466,504 191,823 11,516 146,244 116,921 (of which in USD) 3,212,880 3,377,142 3,675,391 3,755,130 165,595 375,852 146,736 2,156 138,595 88,365
Offshore centres 4,817,265 4,483,556 4,329,492 4,351,750 –443,073 –107,465 –110,677 –81,653 50,642 34,223 Aruba 1,522 1,681 1,351 1,080 154 –557 –15 –32 –248 –262 Bahamas 494,159 381,503 359,169 352,561 –115,454 –26,909 –35,116 11,895 2,665 –6,353 Bahrain 34,851 30,773 39,367 43,151 –4,511 13,062 3,779 1,267 3,393 4,623 Barbados 20,436 30,553 23,912 26,209 8,940 7,371 3,065 1,422 775 2,109 Bermuda 68,578 70,183 66,453 71,601 618 1,915 –3,144 –1,374 1,067 5,366
Cayman Islands 1,872,984 1,842,792 1,762,189 1,829,438 –58,168 –9,811 –38,132 –49,105 9,105 68,321 Curacao ... – – 109,082 – – – ... – – Gibraltar 18,451 12,138 14,671 15,303 –6,993 3,518 1,124 497 1,150 747 Guernsey 188,581 168,522 165,178 164,066 –28,379 –1,386 –5,550 225 3,636 303 Hong Kong SAR 551,186 476,439 444,830 441,103 –85,872 –30,665 –13,373 –18,554 4,489 –3,227 Isle of Man 76,928 88,688 79,746 77,758 –5,318 –8,069 –5,454 –6 –1,627 –982
Jersey 453,415 407,557 395,548 371,582 –69,035 –49,085 –21,561 –18,604 10,874 –19,794 Lebanon 35,372 44,826 45,542 46,639 9,073 2,219 –94 775 278 1,260 Macao SAR 25,104 28,694 31,499 33,578 3,318 5,466 –194 1,516 1,914 2,230 Mauritius 14,722 14,502 14,478 16,587 –561 2,333 451 –641 379 2,144 Netherlands Antilles 141,494 126,838 116,922 – –16,676 –15,582 –297 –8,152 16 –7,149
Panama 102,680 91,243 87,741 85,830 –12,919 –2,842 –1,690 –88 543 –1,607 Samoa 6,257 7,271 7,728 7,996 905 758 244 –304 543 275 Singapore 468,671 420,738 442,320 428,175 –54,462 8,891 10,029 –4,903 17,530 –13,765 Sint Maarten ... – ... – – – – ... ... – Vanuatu 519 483 425 419 –45 –62 9 –27 –37 –7 West Indies UK 232,617 229,763 227,280 226,629 –7,032 –3,201 –2,320 4,402 –5,452 169
Table 7A (cont.)
Amounts outstanding Estimated exchange rate adjusted changes
BIS Quarterly Review, June 2011 A 45
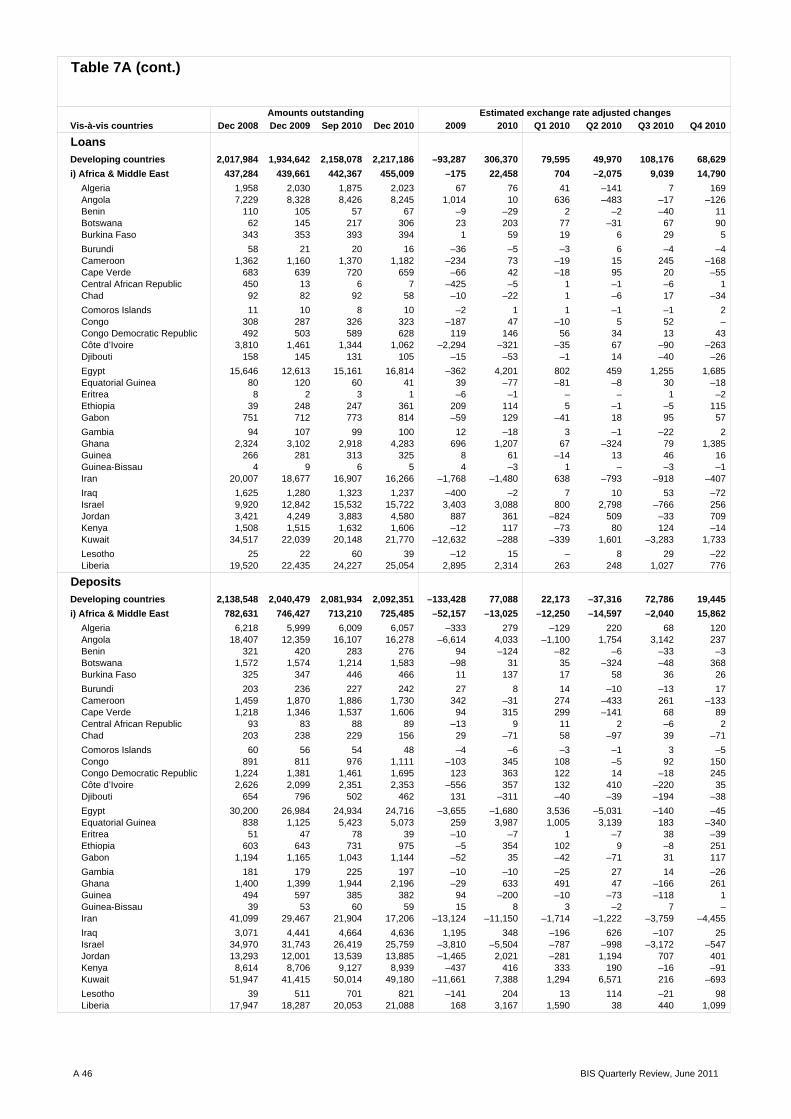
Vis-à-vis countries Dec 2008 Dec 2009 Sep 2010 Dec 2010 2009 2010 Q1 2010 Q2 2010 Q3 2010 Q4 2010
LoansDeveloping countries 2,017,984 1,934,642 2,158,078 2,217,186 –93,287 306,370 79,595 49,970 108,176 68,629 i) Africa & Middle East 437,284 439,661 442,367 455,009 –175 22,458 704 –2,075 9,039 14,790
Algeria 1,958 2,030 1,875 2,023 67 76 41 –141 7 169 Angola 7,229 8,328 8,426 8,245 1,014 10 636 –483 –17 –126 Benin 110 105 57 67 –9 –29 2 –2 –40 11 Botswana 62 145 217 306 23 203 77 –31 67 90 Burkina Faso 343 353 393 394 1 59 19 6 29 5
Burundi 58 21 20 16 –36 –5 –3 6 –4 –4 Cameroon 1,362 1,160 1,370 1,182 –234 73 –19 15 245 –168 Cape Verde 683 639 720 659 –66 42 –18 95 20 –55 Central African Republic 450 13 6 7 –425 –5 1 –1 –6 1 Chad 92 82 92 58 –10 –22 1 –6 17 –34
Comoros Islands 11 10 8 10 –2 1 1 –1 –1 2 Congo 308 287 326 323 –187 47 –10 5 52 – Congo Democratic Republic 492 503 589 628 119 146 56 34 13 43 Côte d’Ivoire 3,810 1,461 1,344 1,062 –2,294 –321 –35 67 –90 –263 Djibouti 158 145 131 105 –15 –53 –1 14 –40 –26
Egypt 15,646 12,613 15,161 16,814 –362 4,201 802 459 1,255 1,685 Equatorial Guinea 80 120 60 41 39 –77 –81 –8 30 –18 Eritrea 8 2 3 1 –6 –1 – – 1 –2 Ethiopia 39 248 247 361 209 114 5 –1 –5 115 Gabon 751 712 773 814 –59 129 –41 18 95 57
Gambia 94 107 99 100 12 –18 3 –1 –22 2 Ghana 2,324 3,102 2,918 4,283 696 1,207 67 –324 79 1,385 Guinea 266 281 313 325 8 61 –14 13 46 16 Guinea-Bissau 4 9 6 5 4 –3 1 – –3 –1 Iran 20,007 18,677 16,907 16,266 –1,768 –1,480 638 –793 –918 –407
Iraq 1,625 1,280 1,323 1,237 –400 –2 7 10 53 –72 Israel 9,920 12,842 15,532 15,722 3,403 3,088 800 2,798 –766 256 Jordan 3,421 4,249 3,883 4,580 887 361 –824 509 –33 709 Kenya 1,508 1,515 1,632 1,606 –12 117 –73 80 124 –14 Kuwait 34,517 22,039 20,148 21,770 –12,632 –288 –339 1,601 –3,283 1,733
Lesotho 25 22 60 39 –12 15 – 8 29 –22 Liberia 19,520 22,435 24,227 25,054 2,895 2,314 263 248 1,027 776
DepositsDeveloping countries 2,138,548 2,040,479 2,081,934 2,092,351 –133,428 77,088 22,173 –37,316 72,786 19,445 i) Africa & Middle East 782,631 746,427 713,210 725,485 –52,157 –13,025 –12,250 –14,597 –2,040 15,862
Algeria 6,218 5,999 6,009 6,057 –333 279 –129 220 68 120 Angola 18,407 12,359 16,107 16,278 –6,614 4,033 –1,100 1,754 3,142 237 Benin 321 420 283 276 94 –124 –82 –6 –33 –3 Botswana 1,572 1,574 1,214 1,583 –98 31 35 –324 –48 368 Burkina Faso 325 347 446 466 11 137 17 58 36 26
Burundi 203 236 227 242 27 8 14 –10 –13 17 Cameroon 1,459 1,870 1,886 1,730 342 –31 274 –433 261 –133 Cape Verde 1,218 1,346 1,537 1,606 94 315 299 –141 68 89 Central African Republic 93 83 88 89 –13 9 11 2 –6 2 Chad 203 238 229 156 29 –71 58 –97 39 –71
Comoros Islands 60 56 54 48 –4 –6 –3 –1 3 –5 Congo 891 811 976 1,111 –103 345 108 –5 92 150 Congo Democratic Republic 1,224 1,381 1,461 1,695 123 363 122 14 –18 245 Côte d’Ivoire 2,626 2,099 2,351 2,353 –556 357 132 410 –220 35 Djibouti 654 796 502 462 131 –311 –40 –39 –194 –38
Egypt 30,200 26,984 24,934 24,716 –3,655 –1,680 3,536 –5,031 –140 –45 Equatorial Guinea 838 1,125 5,423 5,073 259 3,987 1,005 3,139 183 –340 Eritrea 51 47 78 39 –10 –7 1 –7 38 –39 Ethiopia 603 643 731 975 –5 354 102 9 –8 251 Gabon 1,194 1,165 1,043 1,144 –52 35 –42 –71 31 117
Gambia 181 179 225 197 –10 –10 –25 27 14 –26 Ghana 1,400 1,399 1,944 2,196 –29 633 491 47 –166 261 Guinea 494 597 385 382 94 –200 –10 –73 –118 1 Guinea-Bissau 39 53 60 59 15 8 3 –2 7 – Iran 41,099 29,467 21,904 17,206 –13,124 –11,150 –1,714 –1,222 –3,759 –4,455
Iraq 3,071 4,441 4,664 4,636 1,195 348 –196 626 –107 25 Israel 34,970 31,743 26,419 25,759 –3,810 –5,504 –787 –998 –3,172 –547 Jordan 13,293 12,001 13,539 13,885 –1,465 2,021 –281 1,194 707 401 Kenya 8,614 8,706 9,127 8,939 –437 416 333 190 –16 –91 Kuwait 51,947 41,415 50,014 49,180 –11,661 7,388 1,294 6,571 216 –693
Lesotho 39 511 701 821 –141 204 13 114 –21 98 Liberia 17,947 18,287 20,053 21,088 168 3,167 1,590 38 440 1,099
Table 7A (cont.)
Amounts outstanding Estimated exchange rate adjusted changes
A 46 BIS Quarterly Review, June 2011

Vis-à-vis countries Dec 2008 Dec 2009 Sep 2010 Dec 2010 2009 2010 Q1 2010 Q2 2010 Q3 2010 Q4 2010
LoansLibya 1,057 1,597 1,368 1,688 511 –178 –180 684 –1,010 328 Madagascar 482 634 667 687 140 61 3 –346 382 22 Malawi 113 212 221 225 18 10 –107 69 44 4 Mali 249 238 257 243 –19 23 62 –12 –17 –10 Mauritania 286 237 278 285 –53 57 –2 16 34 9
Morocco 5,674 7,066 7,399 7,392 1,644 643 273 2 264 104 Mozambique 547 885 944 1,021 150 150 23 –13 62 78 Namibia 826 975 874 785 119 –157 –62 –22 11 –84 Niger 142 148 83 76 10 –70 –100 9 27 –6 Nigeria 10,270 8,259 7,500 7,166 –2,473 –1,043 92 –106 –714 –315
Oman 10,355 9,527 9,791 9,425 –859 –145 250 –632 605 –368 Palestinian Territory 10 38 17 15 27 –20 32 –51 1 –2 Qatar 45,728 47,398 52,631 58,381 1,423 11,101 1,062 1,878 2,208 5,953 Rwanda 9 44 34 34 32 –10 –7 5 –8 – Sao Tomé and Principe 41 41 52 53 – 15 11 2 – 2
Saudi Arabia 74,401 78,491 78,776 81,835 2,752 9,181 8,673 –10,409 7,146 3,771 Senegal 861 934 1,070 782 47 –106 22 –29 174 –273 Seychelles 1,070 1,358 1,424 1,500 262 183 53 30 19 81 Sierra Leone 58 67 64 185 6 123 –2 – 1 124 Somalia 98 110 92 91 8 –11 –2 –3 –7 1
South Africa 29,680 27,290 27,182 28,798 –2,619 1,850 –1,530 –434 1,994 1,820 St. Helena 4 10 7 12 6 2 –5 – 2 5 Sudan 964 1,243 1,491 1,377 264 153 104 106 54 –111 Swaziland 40 58 145 159 –2 99 46 67 –27 13 Syria 903 943 820 812 66 –115 39 –160 12 –6
Tanzania 454 564 632 655 3 154 25 68 35 26 Togo 253 330 313 284 70 –24 4 –7 2 –23 Tunisia 3,800 3,499 3,010 2,986 –157 –331 –102 –57 –193 21 Uganda 327 414 559 532 50 123 –48 137 57 –23 United Arab Emirates 97,738 95,949 98,870 94,996 –2,821 –1,888 –189 1,140 856 –3,695
Yemen 1,010 1,209 1,098 1,420 195 41 –22 –340 80 323 Zambia 841 977 1,056 1,013 36 37 131 –50 –2 –42 Zimbabwe 807 375 404 294 –110 –90 –2 –41 62 –109 Residual 21,305 33,006 24,372 25,699 10,251 –7,318 –9,804 2,230 –1,074 1,330
DepositsLibya 72,356 65,961 62,104 59,530 –7,040 –5,112 –1,643 2,860 –4,055 –2,274 Madagascar 1,006 1,481 1,204 1,044 438 –393 –240 101 –107 –147 Malawi 144 198 353 459 6 225 4 85 27 109 Mali 371 489 471 447 104 –27 58 –18 –48 –19 Mauritania 513 481 524 606 –42 139 –1 –15 68 87
Morocco 9,391 10,741 8,699 8,930 1,200 –1,213 –2,318 –411 1,164 352 Mozambique 1,184 1,826 1,897 2,327 390 426 –187 234 –57 436 Namibia 453 1,062 991 1,028 223 –82 134 –332 86 30 Niger 134 121 160 134 –16 17 81 161 –201 –24 Nigeria 21,858 23,010 22,859 23,246 579 91 1,316 –821 –953 549
Oman 7,730 6,380 8,391 7,293 –1,497 945 –53 597 1,466 –1,065 Palestinian Territory 1,063 1,052 983 1,025 –31 4 35 –67 –14 50 Qatar 17,074 18,626 20,040 25,283 1,329 6,795 –840 650 1,716 5,269 Rwanda 519 616 531 628 82 –5 –66 24 –64 101 Sao Tomé and Principe 104 83 59 38 –20 –43 –21 –9 8 –21
Saudi Arabia 180,346 168,620 155,706 167,207 –13,967 –252 –3,525 –6,347 –2,516 12,136 Senegal 1,699 1,655 1,626 1,326 –69 –218 79 – –34 –263 Seychelles 4,559 5,585 5,904 6,090 924 618 –433 95 725 231 Sierra Leone 171 155 218 224 –20 20 –6 17 2 7 Somalia 47 47 46 46 –3 – – –2 2 –
South Africa 45,222 41,708 45,004 45,801 –4,442 4,758 1,774 –1,739 3,658 1,065 St. Helena 8 14 19 11 5 –6 –7 4 5 –8 Sudan 1,702 1,614 1,893 1,785 –139 212 120 66 115 –89 Swaziland 1,220 1,028 738 812 –628 –235 –28 –205 –62 60 Syria 23,573 18,580 17,938 17,959 –5,333 –88 206 –1,215 705 216
Tanzania 1,801 1,944 1,805 1,835 90 –86 –293 90 76 41 Togo 447 428 379 387 –33 –24 –20 8 –25 13 Tunisia 5,039 5,338 6,793 6,328 212 1,163 1,043 –3 512 –389 Uganda 1,732 1,788 2,019 1,986 –26 190 –82 329 –49 –8 United Arab Emirates 76,334 81,162 73,663 73,336 3,300 –8,049 –2,593 –6,474 1,032 –14
Yemen 7,862 6,052 4,743 4,955 –1,964 –1,007 –656 –608 –5 262 Zambia 876 1,102 1,573 1,530 149 431 123 107 240 –39 Zimbabwe 856 1,233 1,151 1,369 270 140 28 –12 –95 219 Residual 53,783 67,869 48,112 50,033 13,353 –17,709 –9,273 –7,701 –2,666 1,931
Table 7A (cont.)
Amounts outstanding Estimated exchange rate adjusted changes
BIS Quarterly Review, June 2011 A 47
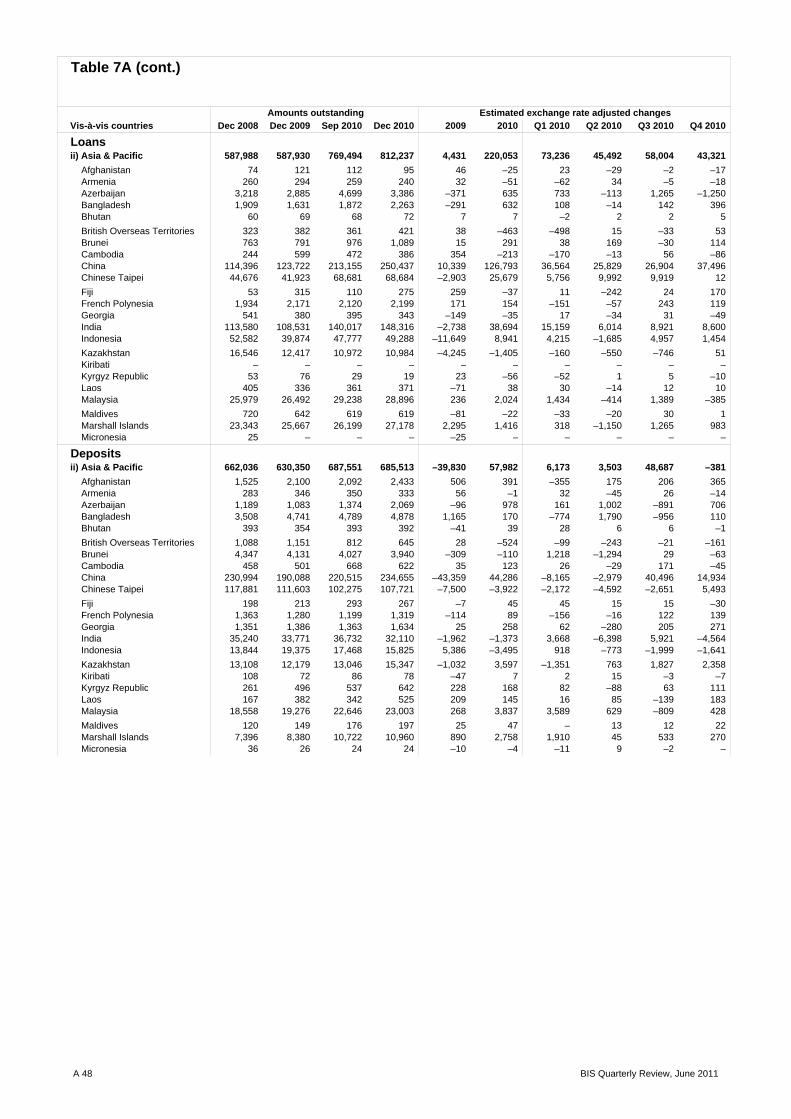
Vis-à-vis countries Dec 2008 Dec 2009 Sep 2010 Dec 2010 2009 2010 Q1 2010 Q2 2010 Q3 2010 Q4 2010
Loansii) Asia & Pacific 587,988 587,930 769,494 812,237 4,431 220,053 73,236 45,492 58,004 43,321
Afghanistan 74 121 112 95 46 –25 23 –29 –2 –17 Armenia 260 294 259 240 32 –51 –62 34 –5 –18 Azerbaijan 3,218 2,885 4,699 3,386 –371 635 733 –113 1,265 –1,250 Bangladesh 1,909 1,631 1,872 2,263 –291 632 108 –14 142 396 Bhutan 60 69 68 72 7 7 –2 2 2 5
British Overseas Territories 323 382 361 421 38 –463 –498 15 –33 53 Brunei 763 791 976 1,089 15 291 38 169 –30 114 Cambodia 244 599 472 386 354 –213 –170 –13 56 –86 China 114,396 123,722 213,155 250,437 10,339 126,793 36,564 25,829 26,904 37,496 Chinese Taipei 44,676 41,923 68,681 68,684 –2,903 25,679 5,756 9,992 9,919 12
Fiji 53 315 110 275 259 –37 11 –242 24 170 French Polynesia 1,934 2,171 2,120 2,199 171 154 –151 –57 243 119 Georgia 541 380 395 343 –149 –35 17 –34 31 –49 India 113,580 108,531 140,017 148,316 –2,738 38,694 15,159 6,014 8,921 8,600 Indonesia 52,582 39,874 47,777 49,288 –11,649 8,941 4,215 –1,685 4,957 1,454
Kazakhstan 16,546 12,417 10,972 10,984 –4,245 –1,405 –160 –550 –746 51 Kiribati – – – – – – – – – – Kyrgyz Republic 53 76 29 19 23 –56 –52 1 5 –10 Laos 405 336 361 371 –71 38 30 –14 12 10 Malaysia 25,979 26,492 29,238 28,896 236 2,024 1,434 –414 1,389 –385
Maldives 720 642 619 619 –81 –22 –33 –20 30 1 Marshall Islands 23,343 25,667 26,199 27,178 2,295 1,416 318 –1,150 1,265 983 Micronesia 25 – – – –25 – – – – –
Depositsii) Asia & Pacific 662,036 630,350 687,551 685,513 –39,830 57,982 6,173 3,503 48,687 –381
Afghanistan 1,525 2,100 2,092 2,433 506 391 –355 175 206 365 Armenia 283 346 350 333 56 –1 32 –45 26 –14 Azerbaijan 1,189 1,083 1,374 2,069 –96 978 161 1,002 –891 706 Bangladesh 3,508 4,741 4,789 4,878 1,165 170 –774 1,790 –956 110 Bhutan 393 354 393 392 –41 39 28 6 6 –1
British Overseas Territories 1,088 1,151 812 645 28 –524 –99 –243 –21 –161 Brunei 4,347 4,131 4,027 3,940 –309 –110 1,218 –1,294 29 –63 Cambodia 458 501 668 622 35 123 26 –29 171 –45 China 230,994 190,088 220,515 234,655 –43,359 44,286 –8,165 –2,979 40,496 14,934 Chinese Taipei 117,881 111,603 102,275 107,721 –7,500 –3,922 –2,172 –4,592 –2,651 5,493
Fiji 198 213 293 267 –7 45 45 15 15 –30 French Polynesia 1,363 1,280 1,199 1,319 –114 89 –156 –16 122 139 Georgia 1,351 1,386 1,363 1,634 25 258 62 –280 205 271 India 35,240 33,771 36,732 32,110 –1,962 –1,373 3,668 –6,398 5,921 –4,564 Indonesia 13,844 19,375 17,468 15,825 5,386 –3,495 918 –773 –1,999 –1,641
Kazakhstan 13,108 12,179 13,046 15,347 –1,032 3,597 –1,351 763 1,827 2,358 Kiribati 108 72 86 78 –47 7 2 15 –3 –7 Kyrgyz Republic 261 496 537 642 228 168 82 –88 63 111 Laos 167 382 342 525 209 145 16 85 –139 183 Malaysia 18,558 19,276 22,646 23,003 268 3,837 3,589 629 –809 428
Maldives 120 149 176 197 25 47 – 13 12 22 Marshall Islands 7,396 8,380 10,722 10,960 890 2,758 1,910 45 533 270 Micronesia 36 26 24 24 –10 –4 –11 9 –2 –
Table 7A (cont.)
Amounts outstanding Estimated exchange rate adjusted changes
A 48 BIS Quarterly Review, June 2011

Vis-à-vis countries Dec 2008 Dec 2009 Sep 2010 Dec 2010 2009 2010 Q1 2010 Q2 2010 Q3 2010 Q4 2010
LoansMongolia 138 148 252 333 27 185 19 25 59 82 Myanmar 1,353 278 240 239 –295 –26 –45 27 –11 3 Nauru 16 10 114 8 –6 –7 1 –3 100 –105 Nepal 57 73 76 83 15 9 –12 2 12 7 New Caledonia 3,433 3,518 3,165 3,184 –21 –87 171 –99 –241 82
North Korea 62 64 61 91 –2 32 –1 23 –19 29 Pakistan 4,635 4,366 4,509 4,336 –198 –73 –214 –56 366 –169 Palau 33 31 30 28 –2 –3 –1 – – –2 Papua New Guinea 202 250 419 455 36 237 34 174 –5 34 Philippines 14,028 13,366 17,707 20,090 –346 6,427 934 296 2,837 2,360
Solomon Islands 21 25 29 28 4 3 4 –4 4 –1 South Korea 123,880 138,427 143,204 128,681 13,780 –10,498 7,108 5,023 –7,961 –14,668 Sri Lanka 2,779 2,341 3,243 3,225 –39 889 5 360 527 –3 Tajikistan 30 17 8 7 –13 –10 –8 1 –2 –1 Thailand 16,717 20,434 26,094 31,084 3,636 10,339 852 1,894 2,587 5,006
Timor Leste 9 5 6 10 –5 5 3 –3 1 4 Tonga 10 13 22 21 3 7 –2 14 –4 –1 Turkmenistan 251 250 181 134 –7 –103 –73 –6 20 –44 Tuvalu 1 11 10 31 10 20 – – –1 21 US Pacific Islands 646 172 841 825 –480 663 384 –251 539 –9
Uzbekistan 737 1,034 1,172 1,280 288 265 115 –135 174 111 Vietnam 13,678 10,000 11,586 13,176 –3,424 3,296 475 107 1,057 1,657 Wallis/Futuna 22 18 15 14 –5 –3 – – –2 –1 Residual 3,566 3,761 8,018 9,313 181 5,492 208 381 3,621 1,282
DepositsMongolia 94 84 168 510 –13 427 –15 28 71 343 Myanmar 505 1,378 971 974 831 –356 –229 –181 38 16 Nauru 11 24 12 12 –3 –12 2 –10 –4 – Nepal 1,538 2,062 1,661 1,504 489 –534 –208 –221 43 –148 New Caledonia 1,188 1,339 1,268 1,197 104 –102 –24 –60 41 –59
North Korea 141 106 79 110 –39 4 –36 –1 11 30 Pakistan 10,247 12,972 11,836 11,132 2,680 –1,674 –1,717 1,250 –525 –682 Palau 91 2 2 8 –89 6 – 2 –2 6 Papua New Guinea 984 3,013 2,861 2,868 1,931 –141 –260 57 57 5 Philippines 18,414 17,403 16,816 16,955 –1,105 –427 –912 744 –412 153
Solomon Islands 150 185 232 221 22 30 7 18 18 –13 South Korea 49,982 38,577 61,660 42,930 –11,912 4,328 7,074 12,286 3,645 –18,677 Sri Lanka 1,253 1,870 2,186 2,646 573 780 155 –35 191 469 Tajikistan 100 112 213 161 12 49 –74 5 169 –51 Thailand 23,628 18,343 18,769 19,661 –5,493 1,482 848 1,313 –1,624 945
Timor Leste 13 22 63 125 8 102 3 –2 39 62 Tonga 31 29 49 53 –4 21 –1 22 –3 3 Turkmenistan 11,815 14,399 13,661 13,872 2,534 –467 –796 –430 532 227 Tuvalu 14 20 18 18 1 –4 –2 1 –2 –1 US Pacific Islands 182 86 181 274 –99 198 279 –225 51 93
Uzbekistan 8,238 10,846 12,042 12,442 2,236 2,111 264 369 987 491 Vietnam 3,373 4,040 3,938 4,770 642 832 –257 233 19 837 Wallis/Futuna 40 34 37 33 –6 2 – – 5 –3 Residual 76,588 90,321 96,899 93,418 12,528 3,811 3,396 528 3,181 –3,294
Table 7A (cont.)
Amounts outstanding Estimated exchange rate adjusted changes
BIS Quarterly Review, June 2011 A 49

Vis-à-vis countries Dec 2008 Dec 2009 Sep 2010 Dec 2010 2009 2010 Q1 2010 Q2 2010 Q3 2010 Q4 2010
Loansiii) Europe 682,366 618,125 597,616 584,820 –75,827 –12,347 –10,458 –7,270 11,644 –6,263
Albania 627 779 764 574 157 –161 191 –232 57 –177 Belarus 3,131 2,571 2,872 3,249 –622 817 144 46 200 427 Bosnia and Herzegovina 3,988 4,061 3,376 3,075 –90 –782 –120 –284 –112 –266 Bulgaria 19,851 19,253 16,938 16,270 –1,208 –1,591 –898 –502 139 –330 Croatia 33,824 36,771 33,052 31,945 1,791 –2,518 –810 105 –1,653 –160
Czech Republic 31,317 28,992 26,855 29,957 –2,980 1,950 –2,225 –183 855 3,503 Estonia 14,245 13,041 10,829 9,851 –1,555 –2,751 –814 –572 –602 –763 Hungary 64,138 66,661 64,920 52,872 849 –12,371 –922 1,294 –1,061 –11,682 Latvia 21,570 18,399 15,375 14,285 –3,751 –2,588 –1,389 –401 –446 –352 Lithuania 18,797 15,842 12,081 10,766 –3,563 –4,183 –1,754 –566 –770 –1,093
Macedonia, FYR 467 579 675 682 98 124 –24 26 49 73 Moldova 554 469 342 358 –89 –96 –65 –20 –30 19 Montenegro 1,385 1,549 1,371 1,462 138 –12 –104 – –18 110 Poland 73,972 78,229 83,461 80,755 2,247 3,584 1,794 –21 4,297 –2,486 Romania 59,517 55,463 48,630 49,374 –5,733 –1,524 –1,276 –1,713 –75 1,540
Russia 160,972 121,294 119,990 115,113 –40,448 –4,409 –3,441 –6,447 9,644 –4,165 Serbia 9,150 10,032 8,378 8,464 607 –940 –202 –513 –451 226 Turkey 127,668 116,199 120,163 129,484 –12,119 16,513 472 3,207 2,464 10,370 Ukraine 30,172 21,331 18,948 18,430 –9,043 –2,763 –771 –722 –817 –453
Res. Serbia & Montenegro 82 65 79 1 –19 –66 –47 –4 63 –78 Residual Europe 6,939 6,545 8,517 7,853 –493 1,426 1,803 236 –88 –525
Depositsiii) Europe 321,325 306,060 300,306 298,810 –23,985 4,643 25,708 –32,301 9,867 1,369
Albania 485 471 681 676 –24 223 49 34 134 6 Belarus 2,997 2,828 3,819 1,888 –183 –917 1,170 –278 98 –1,907 Bosnia and Herzegovina 2,741 2,134 2,011 1,816 –642 –184 138 –160 3 –165 Bulgaria 7,285 8,564 9,157 8,506 1,044 176 137 –925 1,474 –510 Croatia 9,072 9,409 8,592 8,913 180 68 –393 282 –289 468
Czech Republic 19,998 19,099 21,443 22,373 –1,351 3,652 155 769 1,571 1,157 Estonia 2,901 1,656 1,944 1,699 –1,286 131 158 –197 393 –223 Hungary 11,446 15,908 16,427 17,141 3,515 2,041 2,456 –787 –596 968 Latvia 2,340 4,237 4,500 5,426 1,760 1,316 –77 504 –101 990 Lithuania 1,729 3,115 3,584 2,650 1,251 –341 365 371 –195 –882
Macedonia, FYR 616 725 710 826 82 117 –103 65 28 127 Moldova 900 1,107 845 695 183 –361 –47 30 –204 –140 Montenegro 215 258 284 254 34 4 –29 16 44 –27 Poland 21,206 16,609 24,830 22,517 –4,973 6,442 5,848 –2,981 5,622 –2,047 Romania 3,921 5,000 4,038 4,201 923 147 48 –673 568 204
Russia 130,154 117,405 97,895 101,182 –17,252 –11,859 15,919 –28,162 –3,698 4,082 Serbia 3,190 3,033 3,310 3,597 –198 758 714 –132 –168 344 Turkey 64,757 59,268 55,860 52,877 –6,267 –3,880 –2,514 333 971 –2,670 Ukraine 19,873 18,578 23,804 25,211 –1,655 7,092 –359 2,393 3,504 1,554
Res. Serbia & Montenegro 231 214 323 184 –18 –31 –28 5 131 –139 Residual Europe 15,268 16,442 16,249 16,149 889 18 2,099 –2,809 578 150
Table 7A (cont.)
Amounts outstanding Estimated exchange rate adjusted changes
A 50 BIS Quarterly Review, June 2011

Vis-à-vis countries Dec 2008 Dec 2009 Sep 2010 Dec 2010 2009 2010 Q1 2010 Q2 2010 Q3 2010 Q4 2010
Loansiv) Latin America/Caribbean 310,346 288,926 348,601 365,120 –21,717 76,204 16,114 13,823 29,488 16,779
Argentina 15,676 11,937 11,734 11,299 –3,689 –704 –268 –12 –7 –417 Belize 2,388 2,874 2,921 2,763 445 29 81 –42 135 –145 Bolivia 340 675 508 489 333 –185 –112 –41 –13 –19 Bonaire, Saint Eustatius and Sa ... – ... – – – – ... ... – Brazil 106,140 92,401 135,835 138,660 –13,795 46,519 11,948 13,895 17,674 3,002 Chile 33,836 41,476 42,299 42,868 7,598 1,425 –1,069 –550 2,439 605
Colombia 10,245 7,592 9,179 12,107 –2,610 4,450 348 868 287 2,947 Costa Rica 6,126 4,624 4,485 4,798 –1,490 176 –98 83 –124 315 Cuba 1,834 1,891 1,654 1,740 –4 –106 –148 –34 –21 97 Dominica 120 62 63 76 –58 14 2 15 –16 13 Dominican Republic 3,365 3,221 3,651 3,649 –151 479 106 276 70 27
Ecuador 2,261 1,975 2,151 2,362 –287 381 –18 30 158 211 El Salvador 2,278 1,651 1,450 1,737 –532 72 –217 –183 197 275 Falkland Islands 37 35 40 38 –5 5 –1 6 1 –1 Grenada 59 51 97 96 –8 41 5 –3 40 –1 Guatemala 4,220 3,337 3,401 3,964 –845 627 77 44 –57 563
Guyana 870 836 710 704 –34 –134 –68 –50 –10 –6 Haiti 251 196 189 154 –57 –39 8 –9 –3 –35 Honduras 1,374 1,089 879 1,014 –288 –66 –59 –27 –116 136 Jamaica 1,897 2,086 1,860 2,019 205 –36 162 –598 250 150 Mexico 74,523 67,568 76,851 81,965 –7,249 14,133 5,169 1,261 2,567 5,136
Nicaragua 644 559 445 484 –86 –70 –17 –65 –27 39 Paraguay 908 770 817 1,130 –112 362 4 19 26 313 Peru 13,504 12,949 16,995 18,283 –368 5,325 409 –515 4,186 1,245 St. Lucia 579 403 400 400 –179 –2 –46 55 –11 – St. Vincent 1,191 1,249 1,289 1,327 28 11 29 6 –34 10
Surinam 30 35 45 46 3 11 4 – 5 2 Trinidad and Tobago 5,652 6,185 6,091 6,325 470 189 163 –542 325 243 Turks and Caicos 500 966 531 573 455 –385 –189 –150 –89 43 Uruguay 2,582 3,095 2,172 4,361 509 1,196 –391 –167 –435 2,189 Venezuela 6,327 5,499 7,389 7,191 –900 1,722 85 –120 1,927 –170
Residual 10,589 11,639 12,470 12,498 980 765 216 372 164 13 Int. organisations 41,263 50,520 64,215 64,312 8,485 13,416 3,612 8,458 1,042 304 Unallocated 287,011 231,734 242,209 252,312 –64,905 42,172 8,620 40,161 –17,087 10,478
Depositsiv) Latin America/Caribbean 372,556 357,642 380,867 382,543 –17,456 27,486 2,542 6,079 16,271 2,594
Argentina 27,844 27,522 28,257 25,997 –469 –1,275 594 –10 347 –2,206 Belize 9,518 9,535 9,945 9,958 –151 651 –316 83 817 67 Bolivia 3,097 2,490 2,709 2,725 –609 259 46 –32 219 26 Bonaire, Saint Eustatius and Sa ... – ... – – – – ... ... – Brazil 53,643 48,854 56,643 54,190 –5,091 5,899 –2,150 912 9,443 –2,306 Chile 21,946 23,824 21,335 25,542 1,688 1,982 –1,085 –161 –1,057 4,285
Colombia 12,341 14,094 14,193 12,812 1,715 –1,453 –175 –299 391 –1,370 Costa Rica 5,720 4,583 4,455 4,241 –1,182 –282 –24 19 –73 –204 Cuba 2,849 4,285 5,272 5,387 1,321 1,358 479 507 164 208 Dominica 218 273 264 289 48 21 –1 –12 7 27 Dominican Republic 6,431 5,860 5,573 6,280 –585 454 199 148 –611 718
Ecuador 6,058 7,019 6,956 7,093 950 89 –82 –492 522 141 El Salvador 2,286 2,458 2,084 2,280 167 –187 –78 –305 –2 198 Falkland Islands 116 135 146 156 7 25 3 –2 12 12 Grenada 183 139 117 100 –49 –34 21 –20 –19 –16 Guatemala 3,594 4,115 3,969 4,367 514 267 –53 200 –281 401
Guyana 531 441 555 430 –97 –15 104 –54 59 –124 Haiti 646 771 1,317 1,368 123 592 299 151 91 51 Honduras 3,105 3,508 2,843 3,251 399 –251 –206 –158 –296 409 Jamaica 2,183 1,863 2,652 2,157 –346 269 499 –266 525 –489 Mexico 87,206 78,266 88,433 92,540 –9,549 14,182 2,002 5,500 2,458 4,222
Nicaragua 1,008 1,310 1,510 1,705 300 398 141 190 –129 196 Paraguay 1,759 1,813 1,870 2,142 35 347 9 100 –38 276 Peru 8,733 9,074 14,024 13,355 305 4,298 2,773 1,800 380 –655 St. Lucia 409 482 285 494 63 22 –45 –44 –102 213 St. Vincent 3,431 2,778 2,477 2,599 –722 –49 –84 –92 –11 138
Surinam 1,092 1,262 1,220 1,279 146 20 95 –67 –82 74 Trinidad and Tobago 9,013 7,650 6,887 7,107 –1,449 –521 –137 51 –675 240 Turks and Caicos 1,871 2,216 2,212 2,163 283 –14 –20 –7 52 –39 Uruguay 13,270 14,269 15,074 12,913 945 –1,142 720 178 98 –2,138 Venezuela 58,861 53,008 54,658 54,455 –6,080 2,082 –1,446 –1,421 4,997 –48
Residual 23,594 23,745 22,932 23,168 –90 –500 461 –316 –933 288 Int. organisations 210,321 208,548 220,503 211,192 –9,310 12,989 9,536 16,162 –6,375 –6,334 Unallocated 182,218 184,075 178,243 184,674 –3,586 23,625 3,915 17,910 –4,408 6,208
Table 7A (cont.)
Amounts outstanding Estimated exchange rate adjusted changes
BIS Quarterly Review, June 2011 A 51

Vis-à-vis countries Dec 2008 Dec 2009 Sep 2010 Dec 2010 2009 2010 Q1 2010 Q2 2010 Q3 2010 Q4 2010
LoansAll countries 6,312,720 6,001,409 6,301,430 6,370,338 –458,184 399,669 126,715 24,179 202,727 46,048 Developed Countries 4,409,074 4,130,855 4,359,162 4,396,908 –408,257 272,055 78,938 36,680 149,647 6,790 i) Europe 2,757,806 2,613,334 2,773,620 2,793,115 –262,263 180,759 35,576 54,542 108,028 –17,387
Euro area 1,765,497 1,635,286 1,672,435 1,731,561 –193,666 69,773 –22,633 58,626 29,163 4,617
(of which in EUR) 1,199,921 1,113,216 1,161,921 1,178,491 –129,605 48,577 –16,702 71,567 31,240 –37,528
Austria 32,564 30,132 31,484 27,404 –3,211 –659 944 –84 1,661 –3,180 Belgium 102,365 87,775 85,980 78,235 –17,023 –7,595 508 –2,659 680 –6,124 Cyprus 29,067 29,107 30,394 28,020 –302 –528 136 –611 2,094 –2,147
Finland 25,391 21,541 24,279 21,021 –4,729 644 1,055 2,079 281 –2,771 France 290,475 240,947 266,931 258,034 –59,101 29,757 34,203 15,240 –15,598 –4,088 Germany 267,091 279,761 290,566 377,111 3,622 56,625 –13,927 31,298 –3,789 43,043 Greece 27,917 29,169 32,871 32,283 681 4,334 –940 4,119 902 253
Ireland 226,397 238,561 225,147 262,986 653 –14,841 –13,267 –8,058 3,368 3,116 Italy 50,750 51,102 47,721 45,033 –886 –272 1,340 1,981 –2,156 –1,437 Luxembourg 220,506 185,741 185,181 203,323 –48,294 24,348 –2,699 –3,769 10,255 20,561 Malta 10,143 9,884 8,938 9,500 –353 –25 154 –687 –127 635
Netherlands 327,758 282,011 297,584 255,776 –53,667 –18,662 –26,248 18,769 26,746 –37,929 Portugal 23,571 23,516 22,170 17,410 –923 –3,148 –32 –1,269 1,669 –3,516 Slovakia 7,464 7,569 7,747 8,109 –137 969 –36 259 191 555 Slovenia 11,339 11,021 10,890 10,123 –716 260 206 20 150 –116 Spain 112,699 107,449 104,552 97,193 –9,279 –1,432 –4,029 1,999 2,836 –2,238
Andorra 1,619 1,802 1,275 1,636 122 –31 –138 32 –315 390 Denmark 59,759 56,799 49,245 50,197 –4,538 –3,038 562 –4,591 –905 1,896 Iceland 6,497 6,419 5,420 2,560 –207 –2,627 30 –296 –452 –1,909 Liechtenstein 5,852 5,301 4,654 5,103 –620 –40 –610 53 38 479 Norway 34,921 31,664 31,945 32,621 –4,410 2,162 1,151 771 –875 1,115
Sweden 56,940 64,970 70,286 61,949 6,695 –1,601 403 –1,452 7,092 –7,644 Switzerland 147,128 132,987 134,843 141,709 –17,103 7,452 –420 –4,390 5,348 6,914 (of which in CHF) 50,314 38,003 41,197 44,053 –13,388 3,169 1,991 –282 –662 2,122 United Kingdom 678,900 677,250 802,702 765,005 –48,672 108,743 57,294 5,665 69,004 –23,220 (of which in GBP) 135,567 131,015 124,917 120,868 –18,467 667 2,591 –1,831 –5,283 5,190
Vatican 1 – 1 1 –3 1 1 –1 1 – Other 692 856 814 773 135 –33 –64 126 –69 –26
DepositsAll Countries 6,999,870 6,589,873 6,902,964 6,989,173 –501,555 478,289 127,167 30,876 209,712 110,534 Developed Countries 4,622,374 4,321,068 4,642,328 4,704,483 –381,899 448,017 139,575 51,272 179,638 77,532 i) Europe 2,603,831 2,413,838 2,586,763 2,534,652 –253,833 187,766 69,027 23,451 136,145 –40,857
Euro area 1,444,322 1,372,867 1,426,055 1,417,862 –118,240 79,273 13,514 22,322 57,002 –13,565
(of which in EUR) 902,755 900,702 941,331 933,285 –39,601 75,980 27,929 7,793 51,038 –10,780
Austria 25,805 21,238 19,474 18,218 –5,085 –2,115 –1,516 1,685 –1,240 –1,044 Belgium 59,818 96,024 78,737 67,307 32,838 –22,709 –16,042 –3,680 6,793 –9,780 Cyprus 19,162 19,650 20,974 20,396 74 1,516 –873 261 2,125 3
Finland 9,816 9,017 17,727 12,321 –1,698 4,101 5,132 –1,053 5,336 –5,314 France 170,355 168,375 176,795 162,360 –8,679 4,873 6,587 –682 11,359 –12,391 Germany 304,167 312,076 331,700 366,729 –3,550 50,738 5,782 17,469 13,487 14,000 Greece 12,349 12,275 18,517 18,970 –323 7,092 2,268 4,195 –59 688
Ireland 226,763 200,107 218,394 218,407 –37,413 14,575 6,052 1,266 4,098 3,159 Italy 58,434 65,733 49,289 50,296 5,433 –10,784 –11,496 –3,234 2,193 1,753 Luxembourg 218,048 153,776 143,122 132,085 –61,893 –17,510 –6,970 –1,526 399 –9,413 Malta 11,374 13,553 9,423 8,891 1,748 –3,712 –1,694 –718 –873 –427
Netherlands 260,324 243,857 282,959 287,927 –27,063 53,231 27,495 5,767 10,975 8,994 Portugal 18,549 15,723 16,854 15,881 –3,330 1,492 628 1,321 237 –694 Slovakia 1,191 1,660 1,357 1,722 421 184 17 101 –324 390 Slovenia 1,311 1,010 970 996 –348 39 –4 3 –2 42 Spain 46,856 38,793 39,763 35,356 –9,373 –1,737 –1,852 1,148 2,498 –3,531
Andorra 1,373 1,477 1,242 1,378 57 –28 –17 18 –186 157 Denmark 8,015 8,576 11,527 12,488 64 4,217 1,603 –1,084 2,609 1,089 Iceland 904 1,230 1,887 1,960 287 836 –119 549 307 99 Liechtenstein 7,407 5,837 5,621 5,336 –1,718 –260 –34 296 –287 –235 Norway 12,622 14,535 17,981 16,407 1,245 2,169 1,714 1,950 –104 –1,391
Sweden 25,282 23,537 31,008 26,586 –2,647 3,917 3,201 – 4,929 –4,213 Switzerland 226,353 193,156 158,564 162,755 –35,872 –23,993 –4,971 –19,842 –4,595 5,415 (of which in CHF) 22,878 21,000 18,471 17,582 –2,385 –4,665 –2,321 –208 –603 –1,533 United Kingdom 875,909 791,362 931,949 889,088 –96,614 122,005 54,259 19,385 76,449 –28,088 (of which in GBP) 93,428 92,756 84,032 67,474 –9,750 –22,547 –9,839 3,075 –1,106 –14,677
Vatican 802 595 611 439 –223 –124 –60 –13 114 –165 Other 842 666 318 353 –172 –244 –63 –130 –92 41
Table 7B: External loans and deposits of reporting banks vis-à-vis the non-bank sectorVis-à-vis individual countriesin millions of US dollars
Amounts outstanding Estimated exchange rate adjusted changes
A 52 BIS Quarterly Review, June 2011
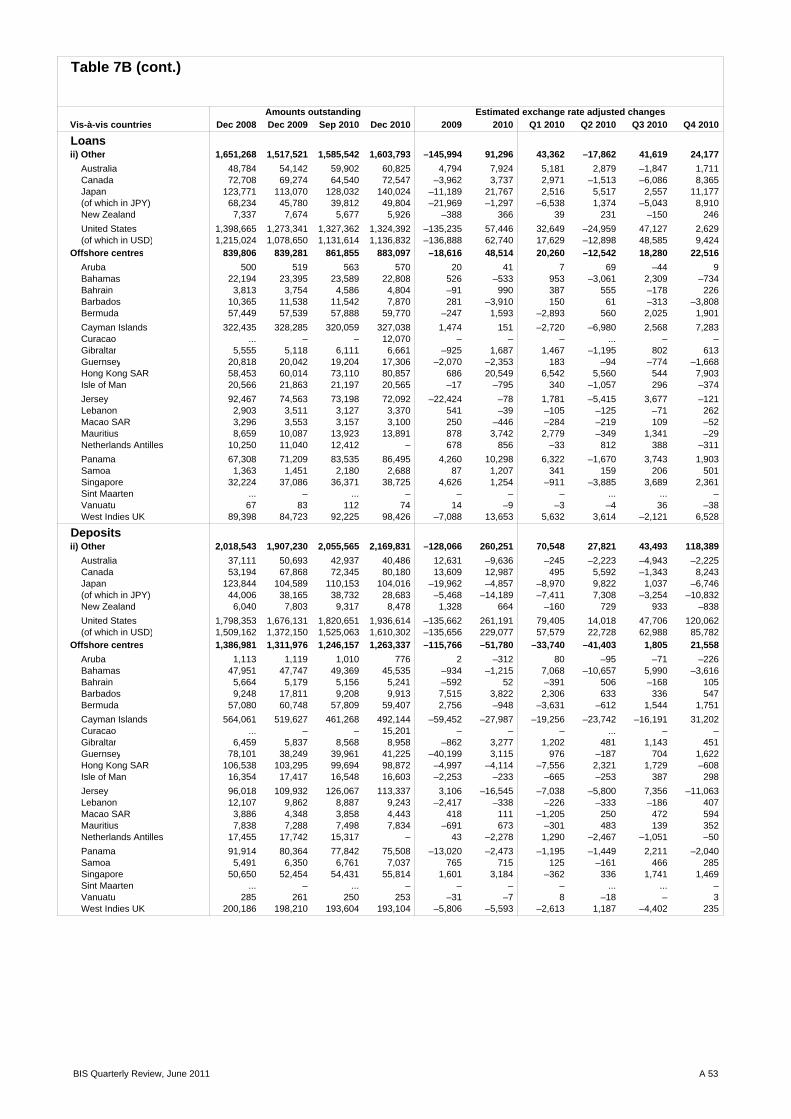
Vis-à-vis countries Dec 2008 Dec 2009 Sep 2010 Dec 2010 2009 2010 Q1 2010 Q2 2010 Q3 2010 Q4 2010
Loansii) Other 1,651,268 1,517,521 1,585,542 1,603,793 –145,994 91,296 43,362 –17,862 41,619 24,177
Australia 48,784 54,142 59,902 60,825 4,794 7,924 5,181 2,879 –1,847 1,711 Canada 72,708 69,274 64,540 72,547 –3,962 3,737 2,971 –1,513 –6,086 8,365 Japan 123,771 113,070 128,032 140,024 –11,189 21,767 2,516 5,517 2,557 11,177 (of which in JPY) 68,234 45,780 39,812 49,804 –21,969 –1,297 –6,538 1,374 –5,043 8,910 New Zealand 7,337 7,674 5,677 5,926 –388 366 39 231 –150 246
United States 1,398,665 1,273,341 1,327,362 1,324,392 –135,235 57,446 32,649 –24,959 47,127 2,629 (of which in USD) 1,215,024 1,078,650 1,131,614 1,136,832 –136,888 62,740 17,629 –12,898 48,585 9,424
Offshore centres 839,806 839,281 861,855 883,097 –18,616 48,514 20,260 –12,542 18,280 22,516 Aruba 500 519 563 570 20 41 7 69 –44 9 Bahamas 22,194 23,395 23,589 22,808 526 –533 953 –3,061 2,309 –734 Bahrain 3,813 3,754 4,586 4,804 –91 990 387 555 –178 226 Barbados 10,365 11,538 11,542 7,870 281 –3,910 150 61 –313 –3,808 Bermuda 57,449 57,539 57,888 59,770 –247 1,593 –2,893 560 2,025 1,901
Cayman Islands 322,435 328,285 320,059 327,038 1,474 151 –2,720 –6,980 2,568 7,283 Curacao ... – – 12,070 – – – ... – – Gibraltar 5,555 5,118 6,111 6,661 –925 1,687 1,467 –1,195 802 613 Guernsey 20,818 20,042 19,204 17,306 –2,070 –2,353 183 –94 –774 –1,668 Hong Kong SAR 58,453 60,014 73,110 80,857 686 20,549 6,542 5,560 544 7,903 Isle of Man 20,566 21,863 21,197 20,565 –17 –795 340 –1,057 296 –374
Jersey 92,467 74,563 73,198 72,092 –22,424 –78 1,781 –5,415 3,677 –121 Lebanon 2,903 3,511 3,127 3,370 541 –39 –105 –125 –71 262 Macao SAR 3,296 3,553 3,157 3,100 250 –446 –284 –219 109 –52 Mauritius 8,659 10,087 13,923 13,891 878 3,742 2,779 –349 1,341 –29 Netherlands Antilles 10,250 11,040 12,412 – 678 856 –33 812 388 –311
Panama 67,308 71,209 83,535 86,495 4,260 10,298 6,322 –1,670 3,743 1,903 Samoa 1,363 1,451 2,180 2,688 87 1,207 341 159 206 501 Singapore 32,224 37,086 36,371 38,725 4,626 1,254 –911 –3,885 3,689 2,361 Sint Maarten ... – ... – – – – ... ... – Vanuatu 67 83 112 74 14 –9 –3 –4 36 –38 West Indies UK 89,398 84,723 92,225 98,426 –7,088 13,653 5,632 3,614 –2,121 6,528
Depositsii) Other 2,018,543 1,907,230 2,055,565 2,169,831 –128,066 260,251 70,548 27,821 43,493 118,389
Australia 37,111 50,693 42,937 40,486 12,631 –9,636 –245 –2,223 –4,943 –2,225 Canada 53,194 67,868 72,345 80,180 13,609 12,987 495 5,592 –1,343 8,243 Japan 123,844 104,589 110,153 104,016 –19,962 –4,857 –8,970 9,822 1,037 –6,746 (of which in JPY) 44,006 38,165 38,732 28,683 –5,468 –14,189 –7,411 7,308 –3,254 –10,832 New Zealand 6,040 7,803 9,317 8,478 1,328 664 –160 729 933 –838
United States 1,798,353 1,676,131 1,820,651 1,936,614 –135,662 261,191 79,405 14,018 47,706 120,062 (of which in USD) 1,509,162 1,372,150 1,525,063 1,610,302 –135,656 229,077 57,579 22,728 62,988 85,782
Offshore centres 1,386,981 1,311,976 1,246,157 1,263,337 –115,766 –51,780 –33,740 –41,403 1,805 21,558 Aruba 1,113 1,119 1,010 776 2 –312 80 –95 –71 –226 Bahamas 47,951 47,747 49,369 45,535 –934 –1,215 7,068 –10,657 5,990 –3,616 Bahrain 5,664 5,179 5,156 5,241 –592 52 –391 506 –168 105 Barbados 9,248 17,811 9,208 9,913 7,515 3,822 2,306 633 336 547 Bermuda 57,080 60,748 57,809 59,407 2,756 –948 –3,631 –612 1,544 1,751
Cayman Islands 564,061 519,627 461,268 492,144 –59,452 –27,987 –19,256 –23,742 –16,191 31,202 Curacao ... – – 15,201 – – – ... – – Gibraltar 6,459 5,837 8,568 8,958 –862 3,277 1,202 481 1,143 451 Guernsey 78,101 38,249 39,961 41,225 –40,199 3,115 976 –187 704 1,622 Hong Kong SAR 106,538 103,295 99,694 98,872 –4,997 –4,114 –7,556 2,321 1,729 –608 Isle of Man 16,354 17,417 16,548 16,603 –2,253 –233 –665 –253 387 298
Jersey 96,018 109,932 126,067 113,337 3,106 –16,545 –7,038 –5,800 7,356 –11,063 Lebanon 12,107 9,862 8,887 9,243 –2,417 –338 –226 –333 –186 407 Macao SAR 3,886 4,348 3,858 4,443 418 111 –1,205 250 472 594 Mauritius 7,838 7,288 7,498 7,834 –691 673 –301 483 139 352 Netherlands Antilles 17,455 17,742 15,317 – 43 –2,278 1,290 –2,467 –1,051 –50
Panama 91,914 80,364 77,842 75,508 –13,020 –2,473 –1,195 –1,449 2,211 –2,040 Samoa 5,491 6,350 6,761 7,037 765 715 125 –161 466 285 Singapore 50,650 52,454 54,431 55,814 1,601 3,184 –362 336 1,741 1,469 Sint Maarten ... – ... – – – – ... ... – Vanuatu 285 261 250 253 –31 –7 8 –18 – 3 West Indies UK 200,186 198,210 193,604 193,104 –5,806 –5,593 –2,613 1,187 –4,402 235
Table 7B (cont.)
Amounts outstanding Estimated exchange rate adjusted changes
BIS Quarterly Review, June 2011 A 53

Vis-à-vis countries Dec 2008 Dec 2009 Sep 2010 Dec 2010 2009 2010 Q1 2010 Q2 2010 Q3 2010 Q4 2010
LoansDeveloping countries 1,001,979 986,051 1,030,992 1,038,252 –15,867 63,333 16,619 –697 33,482 13,929 i) Africa & Middle East 258,220 263,993 267,326 269,740 5,507 6,028 2,738 –3,490 3,363 3,417
Algeria 1,253 1,303 1,041 1,151 31 –99 –131 –61 –29 122 Angola 3,426 3,778 3,468 3,350 301 –412 15 –74 –268 –85 Benin 70 71 50 48 –3 –16 26 –6 –35 –1 Botswana 37 76 86 108 31 73 47 –18 22 22 Burkina Faso 298 316 365 350 11 48 19 10 31 –12
Burundi 41 8 10 11 –32 3 3 – –1 1 Cameroon 1,153 1,121 1,288 1,112 –64 42 –11 12 198 –157 Cape Verde 114 112 165 171 –5 64 5 22 28 9 Central African Republic 15 13 6 7 –2 –5 –2 – –4 1 Chad 92 82 77 58 –10 –22 – –6 3 –19
Comoros Islands 10 8 6 6 –2 –2 – – –2 – Congo 303 281 319 321 –189 50 –8 –2 55 5 Congo Democratic Republic 465 464 473 512 104 68 35 –7 –3 43 Côte d’Ivoire 3,766 1,417 1,257 1,015 –2,290 –325 –136 –52 87 –224 Djibouti 155 142 121 104 –15 –51 – 2 –36 –17
Egypt 10,451 8,426 9,749 8,272 718 –170 250 49 995 –1,464 Equatorial Guinea 77 116 25 27 38 –89 –90 – –1 2 Eritrea 8 1 2 1 –7 – – – 1 –1 Ethiopia 19 245 243 360 226 116 –25 –11 34 118 Gabon 723 702 733 804 –43 129 –47 19 70 87
Gambia 92 101 89 92 8 –20 –5 4 –23 4 Ghana 1,893 2,610 2,337 3,640 655 1,050 –30 –393 151 1,322 Guinea 255 271 216 208 9 –47 –13 14 –43 –5 Guinea-Bissau 4 9 6 5 5 –3 1 – –3 –1 Iran 8,397 7,947 6,973 6,363 –636 –1,197 –21 –827 158 –507
Iraq 1,384 860 850 824 –581 6 34 –19 5 –14 Israel 6,310 6,891 7,499 8,519 1,096 1,579 563 670 –719 1,065 Jordan 1,601 2,757 2,394 2,892 1,235 118 –921 520 16 503 Kenya 1,008 1,037 1,071 1,205 68 193 22 5 22 144 Kuwait 20,341 15,460 12,422 14,359 –4,960 –1,164 –260 919 –3,801 1,978
Lesotho 25 20 52 26 –10 5 –2 7 26 –26 Liberia 18,874 21,675 23,697 24,542 2,794 2,577 443 287 1,050 797
DepositsDeveloping countries 785,298 790,769 842,284 849,127 –8,231 66,949 13,706 18,357 24,790 10,096 i) Africa & Middle East 243,333 246,397 269,544 268,604 –3,079 24,489 –398 13,842 10,718 327
Algeria 3,406 3,545 3,559 3,289 48 –77 –49 –173 359 –214 Angola 4,577 5,135 3,885 3,435 525 –1,690 –1,176 507 –588 –433 Benin 227 298 216 190 66 –95 –69 4 –7 –23 Botswana 221 303 347 369 47 67 33 –29 40 23 Burkina Faso 252 226 233 231 –32 19 9 6 3 1
Burundi 113 141 140 143 23 –1 –3 –5 3 4 Cameroon 960 1,212 1,242 1,305 218 151 74 –194 191 80 Cape Verde 89 89 66 61 –2 –22 –14 –6 2 –4 Central African Republic 81 66 78 72 –17 8 4 1 8 –5 Chad 175 222 206 134 45 –79 19 –96 68 –70
Comoros Islands 50 53 49 43 1 –9 –4 –1 2 –6 Congo 695 636 742 754 –74 151 65 20 44 22 Congo Democratic Republic 1,076 1,139 1,077 1,238 45 144 30 –2 –55 171 Côte d’Ivoire 1,436 1,202 1,154 1,216 –269 81 –60 –26 86 81 Djibouti 174 225 236 203 47 –15 –6 6 17 –32
Egypt 13,635 13,356 13,273 12,665 –451 –505 –91 –141 276 –549 Equatorial Guinea 586 406 5,202 4,883 –190 4,498 1,452 3,137 221 –312 Eritrea 30 20 58 26 –9 7 2 4 33 –32 Ethiopia 295 283 312 356 –25 83 46 2 –13 48 Gabon 995 862 838 859 –153 30 –36 –17 50 33
Gambia 120 126 121 115 – –16 –31 23 –3 –5 Ghana 740 711 855 936 –44 238 231 –40 –38 85 Guinea 300 306 212 204 – –91 27 –27 –86 –5 Guinea-Bissau 28 50 49 47 22 –1 3 –3 – –1 Iran 3,938 4,855 3,465 3,205 663 –1,393 97 –273 –1,006 –211
Iraq 586 562 561 430 –37 –132 –26 7 16 –129 Israel 19,389 17,293 15,562 15,431 –2,421 –1,633 –667 –839 –68 –59 Jordan 5,881 5,378 5,104 4,645 –585 –681 –785 443 99 –438 Kenya 4,234 4,493 4,410 4,487 –22 66 –92 63 –30 125 Kuwait 24,997 22,030 24,010 23,895 –3,417 1,519 –760 1,886 450 –57
Lesotho 16 125 109 119 18 –17 14 – –38 7 Liberia 17,043 17,431 19,119 20,019 220 2,949 1,382 88 516 963
Table 7B (cont.)
Amounts outstanding Estimated exchange rate adjusted changes
A 54 BIS Quarterly Review, June 2011

Vis-à-vis countries Dec 2008 Dec 2009 Sep 2010 Dec 2010 2009 2010 Q1 2010 Q2 2010 Q3 2010 Q4 2010
LoansLibya 727 1,358 1,025 923 605 –417 –278 388 –426 –101 Madagascar 450 606 635 659 143 60 6 –347 375 26 Malawi 87 161 116 109 51 –54 –64 29 –12 –7 Mali 217 216 189 178 –6 –24 –3 –11 –2 –8 Mauritania 136 147 130 150 7 11 5 –10 –6 22
Morocco 4,404 5,134 5,070 5,079 919 203 123 –49 28 101 Mozambique 503 735 778 824 50 101 –5 –11 71 46 Namibia 779 909 850 747 110 –128 –19 –19 7 –97 Niger 115 144 49 43 31 –98 –104 9 3 –6 Nigeria 4,671 5,090 4,774 4,220 25 –855 265 –23 –552 –545
Oman 7,923 7,843 8,000 7,630 –95 –253 126 –630 624 –373 Palestinian Territory 8 11 15 12 3 1 1 – 3 –3 Qatar 32,255 35,231 39,357 42,234 2,794 7,157 1,808 –761 3,035 3,075 Rwanda 8 40 33 34 29 –7 –4 –1 –3 1 Sao Tomé and Principe 41 41 51 52 – 14 11 2 –1 2
Saudi Arabia 37,129 36,947 34,596 35,626 –510 –1,497 464 –3,598 512 1,125 Senegal 807 846 732 701 16 –90 31 –25 –77 –19 Seychelles 974 1,263 1,344 1,447 266 225 58 58 1 108 Sierra Leone 57 60 48 176 – 122 –4 –8 3 131 Somalia 98 110 92 91 8 –11 –2 –3 –7 1
South Africa 10,057 9,841 10,277 10,474 –436 768 –157 205 430 290 St. Helena 4 10 7 12 6 2 –5 – 2 5 Sudan 599 641 668 663 31 33 47 17 –24 –7 Swaziland 23 34 109 111 3 77 61 13 1 2 Syria 739 679 707 690 –38 15 48 –43 25 –15
Tanzania 276 495 561 598 158 108 35 15 18 40 Togo 78 99 99 73 19 –22 – – 3 –25 Tunisia 2,532 2,421 1,973 1,908 3 –354 –42 –96 –188 –28 Uganda 189 264 362 362 41 101 –14 69 44 2 United Arab Emirates 58,555 59,065 63,906 59,815 –246 109 2,326 1,041 712 –3,970
Yemen 924 1,142 1,024 1,362 212 50 –27 –341 79 339 Zambia 567 706 846 739 44 32 175 –12 –24 –107 Zimbabwe 787 353 389 278 –112 –83 –5 –31 63 –110 Residual 8,841 13,031 11,424 11,257 2,894 –1,777 –1,886 –385 662 –168
DepositsLibya 5,779 5,712 8,183 7,528 –124 1,900 682 705 1,120 –607 Madagascar 668 862 608 566 177 –262 –226 –2 – –34 Malawi 117 137 225 218 6 77 5 54 24 –6 Mali 285 263 249 205 –28 –46 11 –33 16 –40 Mauritania 382 311 366 455 –78 154 9 –15 68 92
Morocco 4,394 3,993 3,958 4,142 –505 411 –177 203 141 244 Mozambique 270 410 445 474 63 83 37 –5 21 30 Namibia 301 509 515 580 73 75 110 –78 –20 63 Niger 92 111 139 114 15 8 73 141 –183 –23 Nigeria 6,859 7,250 6,349 7,615 271 377 643 –549 –1,004 1,287
Oman 5,766 4,480 5,048 5,007 –1,440 553 –370 204 727 –8 Palestinian Territory 362 274 234 258 –91 –11 36 –64 –8 25 Qatar 8,798 9,079 13,390 13,530 202 4,424 211 1,941 2,133 139 Rwanda 162 226 197 148 53 –80 –3 –50 20 –47 Sao Tomé and Principe 15 12 16 9 –2 –3 –1 1 4 –7
Saudi Arabia 38,704 40,823 53,586 54,121 1,665 13,292 –1,369 9,106 4,858 697 Senegal 1,391 1,330 1,099 976 –97 –278 –180 18 –11 –105 Seychelles 4,115 5,142 5,391 5,534 936 497 –449 59 701 186 Sierra Leone 116 83 116 112 –37 23 2 2 22 –3 Somalia 16 16 15 16 –1 – –1 –1 1 1
South Africa 11,899 12,594 14,386 13,816 58 1,511 739 367 842 –437 St. Helena 8 14 19 11 5 –6 –7 4 5 –8 Sudan 496 538 741 465 21 –64 95 24 87 –270 Swaziland 601 290 263 227 –484 –78 –22 –8 –7 –41 Syria 2,332 2,270 1,841 1,979 –107 –210 165 –245 –284 154
Tanzania 716 777 856 833 30 69 –40 110 14 –15 Togo 293 308 290 276 4 –19 –8 –4 3 –10 Tunisia 1,561 1,699 1,601 1,581 93 –31 –100 11 54 4 Uganda 255 329 329 309 61 –23 –20 49 –34 –18 United Arab Emirates 29,710 31,338 32,925 31,518 861 –38 889 –1,310 1,694 –1,311
Yemen 879 1,008 1,053 1,781 99 730 323 –226 –112 745 Zambia 501 561 809 714 18 157 127 –21 141 –90 Zimbabwe 689 778 761 704 2 –67 –75 94 –32 –54 Residual 8,456 10,091 7,051 7,777 958 –2,188 –1,127 –962 –835 736
Table 7B (cont.)
Amounts outstanding Estimated exchange rate adjusted changes
BIS Quarterly Review, June 2011 A 55
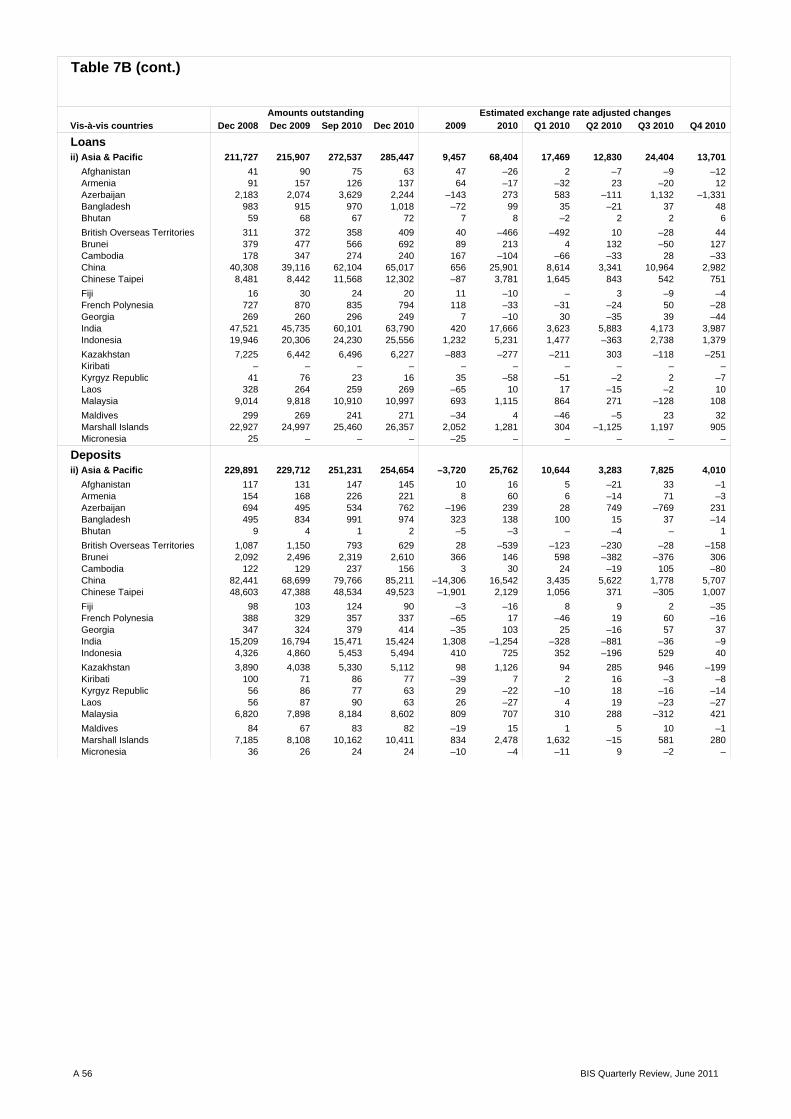
Vis-à-vis countries Dec 2008 Dec 2009 Sep 2010 Dec 2010 2009 2010 Q1 2010 Q2 2010 Q3 2010 Q4 2010
Loansii) Asia & Pacific 211,727 215,907 272,537 285,447 9,457 68,404 17,469 12,830 24,404 13,701
Afghanistan 41 90 75 63 47 –26 2 –7 –9 –12 Armenia 91 157 126 137 64 –17 –32 23 –20 12 Azerbaijan 2,183 2,074 3,629 2,244 –143 273 583 –111 1,132 –1,331 Bangladesh 983 915 970 1,018 –72 99 35 –21 37 48 Bhutan 59 68 67 72 7 8 –2 2 2 6
British Overseas Territories 311 372 358 409 40 –466 –492 10 –28 44 Brunei 379 477 566 692 89 213 4 132 –50 127 Cambodia 178 347 274 240 167 –104 –66 –33 28 –33 China 40,308 39,116 62,104 65,017 656 25,901 8,614 3,341 10,964 2,982 Chinese Taipei 8,481 8,442 11,568 12,302 –87 3,781 1,645 843 542 751
Fiji 16 30 24 20 11 –10 – 3 –9 –4 French Polynesia 727 870 835 794 118 –33 –31 –24 50 –28 Georgia 269 260 296 249 7 –10 30 –35 39 –44 India 47,521 45,735 60,101 63,790 420 17,666 3,623 5,883 4,173 3,987 Indonesia 19,946 20,306 24,230 25,556 1,232 5,231 1,477 –363 2,738 1,379
Kazakhstan 7,225 6,442 6,496 6,227 –883 –277 –211 303 –118 –251 Kiribati – – – – – – – – – – Kyrgyz Republic 41 76 23 16 35 –58 –51 –2 2 –7 Laos 328 264 259 269 –65 10 17 –15 –2 10 Malaysia 9,014 9,818 10,910 10,997 693 1,115 864 271 –128 108
Maldives 299 269 241 271 –34 4 –46 –5 23 32 Marshall Islands 22,927 24,997 25,460 26,357 2,052 1,281 304 –1,125 1,197 905 Micronesia 25 – – – –25 – – – – –
Depositsii) Asia & Pacific 229,891 229,712 251,231 254,654 –3,720 25,762 10,644 3,283 7,825 4,010
Afghanistan 117 131 147 145 10 16 5 –21 33 –1 Armenia 154 168 226 221 8 60 6 –14 71 –3 Azerbaijan 694 495 534 762 –196 239 28 749 –769 231 Bangladesh 495 834 991 974 323 138 100 15 37 –14 Bhutan 9 4 1 2 –5 –3 – –4 – 1
British Overseas Territories 1,087 1,150 793 629 28 –539 –123 –230 –28 –158 Brunei 2,092 2,496 2,319 2,610 366 146 598 –382 –376 306 Cambodia 122 129 237 156 3 30 24 –19 105 –80 China 82,441 68,699 79,766 85,211 –14,306 16,542 3,435 5,622 1,778 5,707 Chinese Taipei 48,603 47,388 48,534 49,523 –1,901 2,129 1,056 371 –305 1,007
Fiji 98 103 124 90 –3 –16 8 9 2 –35 French Polynesia 388 329 357 337 –65 17 –46 19 60 –16 Georgia 347 324 379 414 –35 103 25 –16 57 37 India 15,209 16,794 15,471 15,424 1,308 –1,254 –328 –881 –36 –9 Indonesia 4,326 4,860 5,453 5,494 410 725 352 –196 529 40
Kazakhstan 3,890 4,038 5,330 5,112 98 1,126 94 285 946 –199 Kiribati 100 71 86 77 –39 7 2 16 –3 –8 Kyrgyz Republic 56 86 77 63 29 –22 –10 18 –16 –14 Laos 56 87 90 63 26 –27 4 19 –23 –27 Malaysia 6,820 7,898 8,184 8,602 809 707 310 288 –312 421
Maldives 84 67 83 82 –19 15 1 5 10 –1 Marshall Islands 7,185 8,108 10,162 10,411 834 2,478 1,632 –15 581 280 Micronesia 36 26 24 24 –10 –4 –11 9 –2 –
Table 7B (cont.)
Amounts outstanding Estimated exchange rate adjusted changes
A 56 BIS Quarterly Review, June 2011

Vis-à-vis countries Dec 2008 Dec 2009 Sep 2010 Dec 2010 2009 2010 Q1 2010 Q2 2010 Q3 2010 Q4 2010
LoansMongolia 88 109 153 198 39 89 8 33 3 45 Myanmar 70 40 33 33 –31 –7 –4 –3 – – Nauru 16 10 10 8 –6 –2 1 –3 2 –2 Nepal 26 41 38 42 14 – –9 1 4 4 New Caledonia 1,687 1,846 1,743 1,779 106 67 160 –48 –117 72
North Korea 33 41 44 40 6 –3 –1 23 –21 –4 Pakistan 3,457 3,151 3,607 3,372 –238 185 –95 126 384 –230 Palau 33 30 29 28 –3 –2 – –1 – –1 Papua New Guinea 35 30 94 106 –13 111 65 62 –27 11 Philippines 7,787 7,352 8,818 9,476 –206 1,929 177 518 581 653
Solomon Islands 21 21 26 25 – 4 6 –3 2 –1 South Korea 20,659 25,050 24,752 25,545 4,216 330 –86 1,869 –2,278 825 Sri Lanka 1,643 1,356 1,934 1,866 114 524 10 219 349 –54 Tajikistan 3 2 1 – –1 –2 –2 3 –2 –1 Thailand 6,682 7,310 9,195 10,475 730 3,168 312 801 689 1,366
Timor Leste 5 5 6 7 – 2 3 –3 1 1 Tonga 3 – – – –3 – – – – – Turkmenistan 2 57 55 12 55 –45 –48 –3 49 –43 Tuvalu 1 11 10 31 10 20 – – –1 21 US Pacific Islands 646 170 839 823 –478 656 381 –332 620 –13
Uzbekistan 224 654 734 805 430 159 49 21 17 72 Vietnam 4,917 5,277 6,097 6,933 512 1,793 300 137 437 919 Wallis/Futuna 22 18 15 14 –5 –3 – – –2 –1
Residual 2,315 2,201 5,692 7,089 –125 4,850 –27 344 3,152 1,381
DepositsMongolia 54 28 41 272 –28 245 6 7 1 231 Myanmar 310 1,078 603 602 739 –435 –301 –109 –34 9 Nauru 11 24 12 12 –3 –12 2 –10 –4 – Nepal 328 340 270 394 10 57 –75 33 –27 126 New Caledonia 713 741 772 730 5 2 21 –61 78 –36
North Korea 41 64 54 45 19 –18 –13 – 4 –9 Pakistan 2,875 2,769 3,027 3,066 –186 312 397 –114 –26 55 Palau 3 2 2 8 –1 6 – 1 –1 6 Papua New Guinea 511 1,928 1,766 1,744 1,376 –186 –312 42 107 –23 Philippines 5,928 5,830 5,842 5,396 –156 –440 302 –540 238 –440
Solomon Islands 68 78 74 61 4 –15 –2 –2 2 –13 South Korea 8,379 7,923 12,638 8,689 –680 782 1,834 –37 2,922 –3,937 Sri Lanka 677 815 1,045 1,260 107 437 14 23 180 220 Tajikistan 21 22 32 31 – 8 –1 – 10 –1 Thailand 6,115 6,530 7,149 7,351 226 885 187 1,041 –574 231
Timor Leste 8 11 28 54 3 42 –1 3 14 26 Tonga 3 2 2 2 –1 – – – – – Turkmenistan 32 29 31 28 –5 – 5 –2 – –3 Tuvalu 5 7 4 18 – 11 –1 –2 – 14 US Pacific Islands 181 86 181 269 –97 190 278 –227 51 88
Uzbekistan 614 1,283 1,196 1,353 646 93 –79 –3 9 166 Vietnam 688 763 830 794 62 31 8 32 26 –35 Wallis/Futuna 39 34 37 33 –6 2 – – 5 –3 Residual 27,878 35,040 36,227 36,016 6,568 1,150 1,210 –2,439 2,507 –128
Table 7B (cont.)
Amounts outstanding Estimated exchange rate adjusted changes
BIS Quarterly Review, June 2011 A 57

Vis-à-vis countries Dec 2008 Dec 2009 Sep 2010 Dec 2010 2009 2010 Q1 2010 Q2 2010 Q3 2010 Q4 2010
Loansiii) Europe 335,450 314,634 286,923 270,125 –25,879 –32,708 –8,184 –12,274 –21 –12,229
Albania 568 670 699 542 107 –84 19 22 20 –145 Belarus 1,010 935 835 1,030 –95 135 –115 –49 89 210 Bosnia and Herzegovina 1,106 1,348 1,197 1,100 175 –162 –32 –52 –2 –76 Bulgaria 9,899 9,924 9,260 9,285 –350 54 –276 2 114 214 Croatia 21,628 21,697 20,448 19,119 –600 –778 –462 –103 233 –446
Czech Republic 16,565 17,053 16,122 16,319 –14 –68 –372 –963 805 462 Estonia 2,883 2,370 2,179 2,065 –589 –594 –140 –288 –102 –64 Hungary 25,950 29,938 26,962 19,659 3,273 –9,234 –1,062 –894 –316 –6,962 Latvia 3,986 3,962 3,681 2,919 –168 –512 53 –286 –21 –258 Lithuania 4,520 3,231 2,211 1,972 –1,384 –1,193 –421 –218 –363 –191
Macedonia, FYR 433 455 456 419 8 46 8 6 8 24 Moldova 109 92 91 110 –19 23 3 –6 6 20 Montenegro 544 767 641 764 224 39 –107 35 –25 136 Poland 29,309 31,514 30,705 29,826 1,453 –167 894 –1,391 690 –360 Romania 24,485 24,469 20,653 19,937 –865 –2,771 –1,397 –756 –340 –278
Russia 84,570 69,830 61,677 58,510 –15,054 –10,827 –3,650 –4,927 507 –2,757 Serbia 6,524 5,827 5,013 4,709 –902 –743 –177 –93 –259 –214 Turkey 90,233 81,010 73,197 71,556 –9,376 –6,557 –2,434 –2,169 –983 –971 Ukraine 7,997 6,813 6,461 6,130 –1,250 –762 –313 –39 –108 –302
Res. Serbia & Montenegro 82 65 79 1 –19 –66 –47 –4 63 –78 Residual Europe 3,049 2,664 4,356 4,153 –431 1,516 1,843 –100 –34 –193
Depositsiii) Europe 91,110 93,455 93,613 99,495 –244 9,119 516 –1,803 3,687 6,719
Albania 89 100 97 86 7 –8 –6 5 3 –10 Belarus 303 307 327 472 1 179 22 –23 30 150 Bosnia and Herzegovina 583 473 447 436 –116 –10 –17 –9 20 –4 Bulgaria 1,410 1,858 1,762 2,414 397 411 –225 –83 30 689 Croatia 1,951 1,853 1,667 1,645 –145 –120 –101 17 –36 –
Czech Republic 4,282 4,905 4,625 4,402 380 –316 200 –52 –286 –178 Estonia 317 367 423 539 34 196 – 23 51 122 Hungary 4,221 9,461 7,958 9,201 4,531 299 –558 –246 –262 1,365 Latvia 446 548 511 578 84 57 –52 9 27 73 Lithuania 386 633 1,082 1,005 238 434 543 –173 120 –56
Macedonia, FYR 248 228 230 202 –27 –28 –4 –1 2 –25 Moldova 192 168 199 147 –27 –10 31 17 –8 –50 Montenegro 83 104 122 106 20 7 –3 –2 26 –14 Poland 3,957 4,070 4,723 5,560 10 1,617 139 –503 1,085 896 Romania 1,569 1,458 1,728 1,801 –144 452 229 –80 204 99
Russia 31,024 32,217 31,799 33,102 528 1,879 688 –1,661 1,293 1,559 Serbia 1,067 923 993 988 –167 102 18 128 –51 7 Turkey 33,096 27,431 29,735 31,477 –6,031 4,785 –308 1,315 1,864 1,914 Ukraine 2,129 2,144 2,021 2,391 –93 339 53 156 –255 385
Res. Serbia & Montenegro 10 2 8 7 –8 4 1 1 3 –1 Residual Europe 3,747 4,205 3,156 2,936 285 –1,152 –134 –644 –172 –202
Table 7B (cont.)
Amounts outstanding Estimated exchange rate adjusted changes
A 58 BIS Quarterly Review, June 2011

Vis-à-vis countries Dec 2008 Dec 2009 Sep 2010 Dec 2010 2009 2010 Q1 2010 Q2 2010 Q3 2010 Q4 2010
Loansiv) Latin America/Caribbean 196,582 191,517 204,206 212,940 –4,954 21,609 4,596 2,237 5,736 9,040
Argentina 12,244 9,509 9,646 9,332 –2,676 –237 132 –1 –69 –299 Belize 2,366 2,842 2,875 2,740 435 38 66 –27 121 –122 Bolivia 242 612 470 471 369 –141 –103 –27 –12 1 Bonaire, Saint Eustatius and Sa ... – ... – – – – ... ... – Brazil 51,001 52,580 63,840 66,156 1,524 13,738 1,364 6,886 3,083 2,405 Chile 18,657 21,608 21,395 21,395 2,956 –199 –177 –337 260 55
Colombia 6,533 5,155 5,487 6,153 –1,328 945 178 91 5 671 Costa Rica 3,943 2,852 2,956 3,026 –1,077 174 89 70 –57 72 Cuba 710 596 617 521 –124 –53 5 –34 67 –91 Dominica 94 43 57 68 –51 25 15 14 –15 11 Dominican Republic 2,772 2,637 2,997 2,827 –138 238 143 136 101 –142
Ecuador 1,850 1,718 1,771 1,994 –133 270 –35 –7 89 223 El Salvador 1,090 674 491 570 –326 –104 –83 –17 –83 79 Falkland Islands 37 35 31 28 –5 –5 –1 –2 – –2 Grenada 33 23 36 36 –10 10 6 –3 7 – Guatemala 2,789 2,537 2,530 2,656 –212 118 4 –13 1 126
Guyana 662 813 684 681 151 –135 –72 –49 –11 –3 Haiti 96 94 92 62 –3 –30 15 –8 –7 –30 Honduras 854 599 568 588 –257 –5 8 –7 –26 20 Jamaica 1,290 1,375 952 1,112 122 –218 255 –572 –66 165 Mexico 58,196 54,047 54,388 57,717 –4,299 3,554 2,430 –2,909 639 3,394
Nicaragua 387 398 299 317 11 –76 –23 –45 –26 18 Paraguay 691 625 617 633 –39 10 –10 –18 22 16 Peru 7,030 6,614 7,665 8,403 –202 1,831 145 –395 1,340 741 St. Lucia 424 227 183 178 –200 –46 –51 18 –9 –4 St. Vincent 542 563 548 553 14 –10 24 31 –71 6
Surinam 30 35 44 46 3 11 4 – 4 3 Trinidad and Tobago 2,792 2,930 2,692 2,584 121 –322 345 –770 207 –104 Turks and Caicos 465 722 441 486 243 –232 –189 –108 20 45 Uruguay 2,268 2,777 1,797 3,645 502 792 –394 –212 –449 1,847 Venezuela 5,264 4,593 5,245 4,974 –704 420 260 –1 414 –253
Residual 11,230 11,684 12,792 12,988 377 1,247 247 552 255 193 Int. organisations 11,638 13,242 13,477 16,218 2,487 3,018 –213 453 –2 2,780 Unallocated 50,223 31,980 35,944 35,863 –17,931 12,750 11,111 285 1,320 34
Depositsiv) Latin America/Caribbean 220,964 221,205 227,896 226,374 –1,190 7,578 2,944 3,035 2,560 –961
Argentina 25,637 25,526 25,863 24,030 –238 –1,267 700 –311 129 –1,785 Belize 9,184 9,145 9,253 9,585 –202 734 –288 –19 657 384 Bolivia 2,146 1,987 1,756 1,685 –167 –287 –72 –50 –97 –68 Bonaire, Saint Eustatius and Sa ... – ... – – – – ... ... – Brazil 25,612 23,342 26,490 27,204 –2,427 4,583 –1,485 3,730 1,538 800 Chile 7,325 6,565 6,516 8,037 –790 1,491 91 –300 162 1,538
Colombia 10,068 11,194 11,760 10,923 1,097 –414 197 –284 501 –828 Costa Rica 4,030 3,430 3,024 2,984 –638 –385 –110 –20 –224 –31 Cuba 206 220 258 243 8 35 10 9 29 –13 Dominica 213 268 262 285 49 20 – –13 8 25 Dominican Republic 4,659 4,475 4,017 3,915 –197 –541 –42 –257 –147 –95
Ecuador 4,536 4,901 4,638 4,603 357 –287 –70 –103 –81 –33 El Salvador 1,193 1,269 1,248 1,303 74 42 –34 50 –30 56 Falkland Islands 43 43 63 67 –3 25 8 1 11 5 Grenada 134 131 116 98 –9 –28 24 –24 –11 –17 Guatemala 3,106 3,130 3,255 3,272 19 151 88 5 39 19
Guyana 225 211 144 148 –20 –64 127 –203 7 5 Haiti 404 328 385 391 –78 57 16 3 32 6 Honduras 1,120 1,046 1,023 1,053 –75 9 –14 –23 16 30 Jamaica 1,103 952 976 937 –168 –9 72 –242 197 –36 Mexico 40,532 40,518 45,854 43,392 –133 2,944 4,001 1,339 –15 –2,381
Nicaragua 627 672 625 834 45 165 1 –26 –20 210 Paraguay 1,227 1,225 1,178 1,243 –9 34 –94 21 39 68 Peru 4,972 4,914 5,443 5,019 –73 130 164 330 53 –417 St. Lucia 375 445 233 285 61 –153 –61 –39 –107 54 St. Vincent 3,410 2,764 2,468 2,584 –716 –50 –77 –96 –9 132
Surinam 365 433 471 462 58 16 59 –34 –7 –2 Trinidad and Tobago 1,026 1,628 1,568 1,711 581 90 111 –285 117 147 Turks and Caicos 1,453 1,871 1,857 1,843 358 12 –28 18 26 –4 Uruguay 7,852 8,625 8,447 7,126 729 –1,382 344 37 –456 –1,307 Venezuela 36,937 37,043 36,502 38,629 –73 2,159 –1,100 –22 1,048 2,233
Residual 21,244 22,904 22,203 22,483 1,390 –258 403 –159 –846 344 Int. organisations 99,183 55,925 62,442 61,338 3,425 6,836 4,441 6,291 –3,635 –261 Unallocated 106,034 110,135 109,753 110,888 915 8,266 3,184 –3,642 7,114 1,610
Table 7B (cont.)
Amounts outstanding Estimated exchange rate adjusted changes
BIS Quarterly Review, June 2011 A 59

End-December 2010CDs &
securitiesParent country of bank Assets Liab. Assets Liab. Assets Liab. Assets Liab. Assets Liab. Liab.
All countries 33,851.5 32,681.3 10,063.6 9,417.7 9,638.3 8,875.9 14,022.7 13,627.0 126.8 760.6 4,059.5 Reporting countries 33,201.2 32,059.4 9,897.4 9,295.8 9,415.9 8,691.2 13,762.7 13,345.3 125.2 727.1 3,978.0
Australia 453.9 800.3 142.4 129.5 152.7 466.9 154.7 187.8 4.0 16.1 392.6 Austria 402.3 296.6 16.9 14.1 170.5 100.1 213.6 179.3 1.3 3.2 – Bahamas 16.0 11.5 – – 6.1 4.4 9.9 6.6 – 0.5 0.7 Bahrain 33.1 29.6 0.9 1.3 14.1 15.0 18.1 10.6 0.0 2.6 0.0 Belgium 471.4 506.7 159.7 104.5 110.9 103.6 200.3 293.3 0.5 5.4 93.2 Bermuda 7.6 8.6 0.3 0.3 3.6 0.7 3.4 7.3 0.3 0.3 1.3 Brazil 204.9 235.7 86.1 67.9 42.3 118.8 71.6 45.1 4.9 3.9 34.3 Canada 927.8 798.5 476.4 381.0 139.5 72.5 311.8 321.4 0.1 23.6 26.0 Cayman Islands 2.2 12.1 0.0 0.0 1.1 4.9 1.1 7.1 – – 0.2 Chile 18.4 24.8 0.0 – 1.5 36.9 16.6 –12.1 0.2 – – Chinese Taipei 274.3 300.5 22.1 12.8 91.3 74.1 159.8 198.2 1.1 15.3 0.8 Cyprus 67.3 54.2 4.0 8.4 30.9 9.6 32.4 36.1 0.0 – 0.4
Denmark 283.1 376.6 113.3 105.8 64.5 75.0 102.4 181.5 2.8 14.3 116.1 Finland 43.8 88.2 11.5 1.2 21.0 7.5 11.3 79.4 – – 46.9 France 4,315.6 4,132.0 1,231.7 1,216.5 1,661.8 1,469.9 1,404.5 1,331.8 17.6 113.9 682.0 Germany 4,279.6 3,458.8 1,294.3 1,297.5 1,055.9 627.4 1,917.3 1,456.0 12.1 77.9 659.8 Greece 225.2 147.1 17.1 45.4 104.0 43.2 104.2 57.8 0.0 0.6 0.0 Guernsey 0.0 0.0 – – 0.0 – 0.0 0.0 – – – Hong Kong SAR 251.9 449.0 69.1 119.2 30.1 61.8 152.6 268.1 0.1 – – India 148.0 173.9 18.6 24.8 53.0 41.4 76.3 106.8 0.1 0.9 10.3 Ireland 488.5 368.2 179.1 154.0 90.9 132.2 216.8 77.9 1.7 4.0 29.0 Isle of Man 0.3 0.3 0.2 0.1 0.0 0.0 0.0 0.2 – – – Italy 942.9 950.4 246.1 211.4 306.6 416.4 387.7 287.2 2.5 35.4 140.8
Japan 3,655.3 2,023.7 618.9 572.8 815.0 608.5 2,221.3 809.2 0.2 33.1 48.3 Jersey 0.1 0.2 – – 0.0 – 0.0 0.2 – – 0.1 Luxembourg 156.9 122.4 38.1 34.2 49.6 23.7 69.1 63.9 0.1 0.5 11.9 Macao SAR 0.3 0.2 0.0 0.0 0.1 – 0.2 0.2 0.0 – – Malaysia 42.0 51.0 8.2 3.4 19.7 18.2 14.1 28.6 0.0 0.8 1.6 Mexico 46.1 44.6 2.7 0.8 19.1 31.3 24.3 12.5 – – 4.5 Netherlands 1,432.1 1,534.5 402.4 375.0 476.3 694.3 551.9 431.4 1.5 33.9 41.9 Norway 125.6 144.0 42.1 25.8 20.1 84.0 62.0 32.7 1.3 1.6 55.4 Panama 14.7 10.8 2.0 1.4 6.3 5.5 6.4 4.0 – – 2.6 Portugal 200.0 213.6 62.7 33.1 64.0 110.1 72.9 62.7 0.3 7.9 18.0 Singapore 167.7 190.5 9.8 28.6 7.6 10.1 150.3 150.9 0.0 0.9 0.3 South Africa 80.3 79.2 8.1 14.4 49.1 40.8 23.1 23.1 0.1 0.8 5.1 South Korea 196.3 195.4 18.0 16.7 66.1 140.7 109.0 36.7 3.2 1.2 66.6 Spain 798.2 999.8 309.3 266.1 148.4 231.2 338.6 469.6 1.9 32.9 153.7 Sweden 864.5 1,004.5 362.1 231.9 287.6 308.5 208.9 447.6 5.9 16.5 298.3
Switzerland 2,503.5 2,711.0 735.3 907.5 809.9 649.7 954.8 1,137.6 3.4 16.1 191.1 Turkey 169.6 199.8 11.1 7.6 79.9 81.8 63.6 109.9 15.0 0.4 1.0 United Kingdom 4,554.3 4,465.1 1,298.3 1,148.9 1,260.8 984.4 1,955.1 2,209.9 40.0 121.9 726.1 United States 4,107.4 4,708.2 1,798.2 1,682.7 1,047.3 762.2 1,258.7 2,126.6 3.1 136.7 114.8 Unallocated 308.6 216.4 88.0 63.6 85.3 64.7 135.1 83.5 0.1 4.6 7.4
Non-rep. countries 520.9 438.6 157.3 106.5 151.1 121.2 211.6 184.4 0.9 26.6 11.3 Developed 9.2 6.2 3.1 2.5 0.6 0.6 5.5 3.2 0.0 – 3.1 Offshore centres 12.3 13.2 2.0 0.7 7.2 3.8 3.1 8.7 0.0 – 0.0 Africa & Mid. East 128.4 139.1 19.0 20.0 52.5 39.6 56.5 71.2 0.4 8.4 1.0 Asia & Pacific 317.8 219.7 125.3 73.8 76.4 57.6 115.7 70.1 0.4 18.1 1.6 Europe 25.6 25.9 2.6 6.4 6.5 13.4 16.4 6.2 0.1 0.0 1.4
Latin America 27.8 34.4 5.3 3.1 7.9 6.2 14.6 25.1 – 0.1 4.1 Consortium Banks 38.6 31.1 0.0 0.1 16.9 12.7 21.0 12.2 0.6 6.1 0.2
Unallocated 7.7 70.0 0.1 0.0 4.8 9.6 2.9 60.3 – – 64.9
authoritiesrelated offices other banks non-banks official monetary
Amounts outstandingTable 8A: International positions by nationality of ownership of reporting banks
In billions of US dollars
Total positions of which: vis-à-vis
A 60 BIS Quarterly Review, June 2011
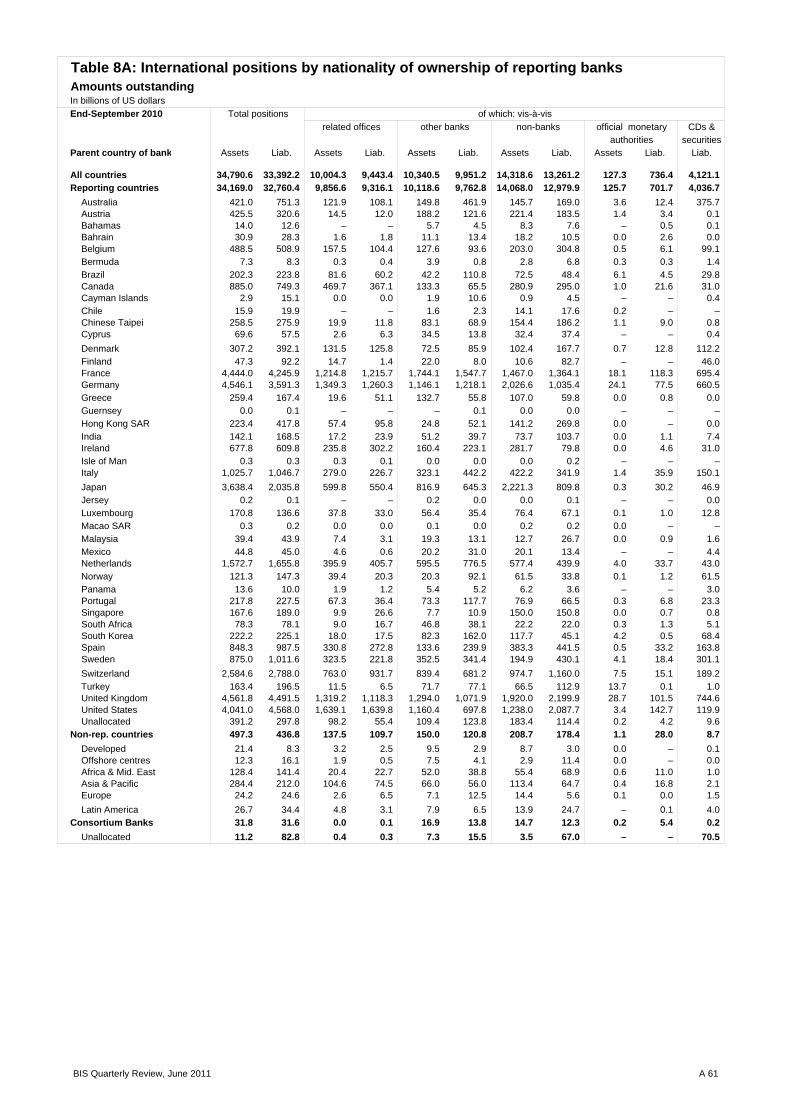
End-September 2010CDs &
securitiesParent country of bank Assets Liab. Assets Liab. Assets Liab. Assets Liab. Assets Liab. Liab.
All countries 34,790.6 33,392.2 10,004.3 9,443.4 10,340.5 9,951.2 14,318.6 13,261.2 127.3 736.4 4,121.1 Reporting countries 34,169.0 32,760.4 9,856.6 9,316.1 10,118.6 9,762.8 14,068.0 12,979.9 125.7 701.7 4,036.7
Australia 421.0 751.3 121.9 108.1 149.8 461.9 145.7 169.0 3.6 12.4 375.7 Austria 425.5 320.6 14.5 12.0 188.2 121.6 221.4 183.5 1.4 3.4 0.1 Bahamas 14.0 12.6 – – 5.7 4.5 8.3 7.6 – 0.5 0.1 Bahrain 30.9 28.3 1.6 1.8 11.1 13.4 18.2 10.5 0.0 2.6 0.0 Belgium 488.5 508.9 157.5 104.4 127.6 93.6 203.0 304.8 0.5 6.1 99.1 Bermuda 7.3 8.3 0.3 0.4 3.9 0.8 2.8 6.8 0.3 0.3 1.4 Brazil 202.3 223.8 81.6 60.2 42.2 110.8 72.5 48.4 6.1 4.5 29.8 Canada 885.0 749.3 469.7 367.1 133.3 65.5 280.9 295.0 1.0 21.6 31.0 Cayman Islands 2.9 15.1 0.0 0.0 1.9 10.6 0.9 4.5 – – 0.4 Chile 15.9 19.9 – – 1.6 2.3 14.1 17.6 0.2 – – Chinese Taipei 258.5 275.9 19.9 11.8 83.1 68.9 154.4 186.2 1.1 9.0 0.8 Cyprus 69.6 57.5 2.6 6.3 34.5 13.8 32.4 37.4 – – 0.4
Denmark 307.2 392.1 131.5 125.8 72.5 85.9 102.4 167.7 0.7 12.8 112.2 Finland 47.3 92.2 14.7 1.4 22.0 8.0 10.6 82.7 – – 46.0 France 4,444.0 4,245.9 1,214.8 1,215.7 1,744.1 1,547.7 1,467.0 1,364.1 18.1 118.3 695.4 Germany 4,546.1 3,591.3 1,349.3 1,260.3 1,146.1 1,218.1 2,026.6 1,035.4 24.1 77.5 660.5 Greece 259.4 167.4 19.6 51.1 132.7 55.8 107.0 59.8 0.0 0.8 0.0 Guernsey 0.0 0.1 – – – 0.1 0.0 0.0 – – – Hong Kong SAR 223.4 417.8 57.4 95.8 24.8 52.1 141.2 269.8 0.0 – 0.0 India 142.1 168.5 17.2 23.9 51.2 39.7 73.7 103.7 0.0 1.1 7.4 Ireland 677.8 609.8 235.8 302.2 160.4 223.1 281.7 79.8 0.0 4.6 31.0 Isle of Man 0.3 0.3 0.3 0.1 0.0 0.0 0.0 0.2 – – – Italy 1,025.7 1,046.7 279.0 226.7 323.1 442.2 422.2 341.9 1.4 35.9 150.1
Japan 3,638.4 2,035.8 599.8 550.4 816.9 645.3 2,221.3 809.8 0.3 30.2 46.9 Jersey 0.2 0.1 – – 0.2 0.0 0.0 0.1 – – 0.0 Luxembourg 170.8 136.6 37.8 33.0 56.4 35.4 76.4 67.1 0.1 1.0 12.8 Macao SAR 0.3 0.2 0.0 0.0 0.1 0.0 0.2 0.2 0.0 – – Malaysia 39.4 43.9 7.4 3.1 19.3 13.1 12.7 26.7 0.0 0.9 1.6 Mexico 44.8 45.0 4.6 0.6 20.2 31.0 20.1 13.4 – – 4.4 Netherlands 1,572.7 1,655.8 395.9 405.7 595.5 776.5 577.4 439.9 4.0 33.7 43.0 Norway 121.3 147.3 39.4 20.3 20.3 92.1 61.5 33.8 0.1 1.2 61.5 Panama 13.6 10.0 1.9 1.2 5.4 5.2 6.2 3.6 – – 3.0 Portugal 217.8 227.5 67.3 36.4 73.3 117.7 76.9 66.5 0.3 6.8 23.3 Singapore 167.6 189.0 9.9 26.6 7.7 10.9 150.0 150.8 0.0 0.7 0.8 South Africa 78.3 78.1 9.0 16.7 46.8 38.1 22.2 22.0 0.3 1.3 5.1 South Korea 222.2 225.1 18.0 17.5 82.3 162.0 117.7 45.1 4.2 0.5 68.4 Spain 848.3 987.5 330.8 272.8 133.6 239.9 383.3 441.5 0.5 33.2 163.8 Sweden 875.0 1,011.6 323.5 221.8 352.5 341.4 194.9 430.1 4.1 18.4 301.1
Switzerland 2,584.6 2,788.0 763.0 931.7 839.4 681.2 974.7 1,160.0 7.5 15.1 189.2 Turkey 163.4 196.5 11.5 6.5 71.7 77.1 66.5 112.9 13.7 0.1 1.0 United Kingdom 4,561.8 4,491.5 1,319.2 1,118.3 1,294.0 1,071.9 1,920.0 2,199.9 28.7 101.5 744.6 United States 4,041.0 4,568.0 1,639.1 1,639.8 1,160.4 697.8 1,238.0 2,087.7 3.4 142.7 119.9 Unallocated 391.2 297.8 98.2 55.4 109.4 123.8 183.4 114.4 0.2 4.2 9.6
Non-rep. countries 497.3 436.8 137.5 109.7 150.0 120.8 208.7 178.4 1.1 28.0 8.7 Developed 21.4 8.3 3.2 2.5 9.5 2.9 8.7 3.0 0.0 – 0.1 Offshore centres 12.3 16.1 1.9 0.5 7.5 4.1 2.9 11.4 0.0 – 0.0 Africa & Mid. East 128.4 141.4 20.4 22.7 52.0 38.8 55.4 68.9 0.6 11.0 1.0 Asia & Pacific 284.4 212.0 104.6 74.5 66.0 56.0 113.4 64.7 0.4 16.8 2.1 Europe 24.2 24.6 2.6 6.5 7.1 12.5 14.4 5.6 0.1 0.0 1.5
Latin America 26.7 34.4 4.8 3.1 7.9 6.5 13.9 24.7 – 0.1 4.0 Consortium Banks 31.8 31.6 0.0 0.1 16.9 13.8 14.7 12.3 0.2 5.4 0.2
Unallocated 11.2 82.8 0.4 0.3 7.3 15.5 3.5 67.0 – – 70.5
Table 8A: International positions by nationality of ownership of reporting banksAmounts outstandingIn billions of US dollars
Total positions of which: vis-à-vis
authoritiesrelated offices other banks non-banks official monetary
BIS Quarterly Review, June 2011 A 61

2010 Q4CDs &
securitiesParent country of bank Assets Liab. Assets Liab. Assets Liab. Assets Liab. Assets Liab. Liab.
All countries –551.6 –462.6 125.7 36.1 –493.5 –546.9 –184.7 18.7 0.9 29.6 –27.8 Reporting countries –584.8 –455.6 106.2 40.8 –496.6 –543.9 –195.2 16.9 0.8 30.5 –25.4
Australia 31.2 48.4 19.9 20.7 1.5 4.5 9.4 19.6 0.4 3.7 17.8 Austria –17.3 –20.1 2.6 2.2 –15.1 –20.3 –4.7 –1.9 –0.1 –0.2 –0.1 Bahamas 2.2 –1.0 – – 0.4 –0.1 1.8 –1.0 – 0.1 0.6 Bahrain 0.5 –0.5 –0.7 –0.5 1.3 1.3 –0.2 –1.4 0.0 0.1 0.0 Belgium –9.7 6.0 4.8 1.8 –15.7 11.9 1.2 –6.9 0.0 –0.7 –4.4 Bermuda 0.3 0.3 0.0 –0.1 –0.3 –0.2 0.5 0.5 0.0 0.1 –0.1 Brazil 2.7 12.0 4.5 7.8 0.2 6.0 –0.8 –1.2 –1.2 –0.6 4.5 Canada 43.4 49.4 6.6 13.2 7.2 3.9 30.6 30.2 –1.0 2.0 –5.0 Cayman Islands –0.7 –3.0 – –0.0 –0.8 –5.7 0.1 2.7 – – –0.1 Chile 2.9 3.2 0.0 – 1.7 0.4 1.2 2.8 0.0 – – Chinese Taipei 16.1 24.8 2.2 1.0 8.3 5.3 5.5 12.2 –0.0 6.3 – Cyprus –1.3 –2.7 1.4 2.2 –3.2 –3.9 0.5 –1.0 0.0 – 0.0
Denmark –19.6 –10.4 –16.4 –18.3 –6.9 –10.0 1.5 16.0 2.1 1.8 5.3 Finland –2.8 –3.2 –3.1 –0.2 –0.5 –0.4 0.8 –2.6 – – 1.3 France –77.4 –69.0 29.7 13.1 –60.6 –62.3 –46.4 –16.7 –0.2 –3.0 –5.3 Germany –78.7 –85.5 –40.2 50.1 44.7 –74.3 –71.3 –62.2 –11.9 0.9 1.6 Greece –31.0 –19.2 –2.2 –4.7 –27.6 –12.5 –1.2 –1.8 –0.0 –0.2 – Guernsey 0.0 –0.1 – – 0.0 –0.1 –0.0 –0.0 – – – Hong Kong SAR 29.3 33.0 12.3 24.5 5.6 10.1 11.4 –1.7 0.0 – –0.0 India 6.3 5.8 1.4 0.9 2.1 1.8 2.8 3.2 0.0 –0.2 3.0 Ireland –181.8 –235.4 –54.2 –145.8 –67.7 –88.3 –61.6 –0.7 1.7 –0.5 –1.7 Isle of Man –0.0 0.0 –0.0 –0.0 0.0 –0.0 0.0 0.0 – – – Italy –69.7 –84.1 –29.2 –11.9 –11.7 –19.3 –29.8 –52.7 1.1 –0.3 –7.0
Japan 16.2 –12.7 18.6 24.0 –5.8 –41.2 3.5 1.6 –0.1 2.9 1.5 Jersey –0.2 0.1 – – –0.2 –0.0 0.0 0.1 – – 0.1 Luxembourg –10.6 –11.5 0.9 1.9 –5.2 –10.7 –6.3 –2.2 –0.0 –0.5 –1.0 Macao SAR 0.0 0.0 – – –0.0 –0.0 0.0 0.0 0.0 – – Malaysia 2.8 7.3 0.8 0.3 0.5 5.1 1.5 2.0 0.0 –0.1 –0.0 Mexico 1.3 –0.4 –1.9 0.2 –1.0 0.2 4.2 –0.8 – – 0.0 Netherlands –114.6 –97.5 10.5 –25.8 –111.4 –76.1 –11.3 3.8 –2.4 0.5 –1.0 Norway 5.2 –2.2 3.0 5.6 0.3 –7.8 0.8 –0.5 1.2 0.4 –5.6 Panama 1.1 0.9 0.2 0.2 0.8 0.2 0.2 0.4 – – –0.4 Portugal –14.4 –10.2 –3.7 –2.8 –8.2 –5.7 –2.6 –2.7 0.1 1.1 –5.0 Singapore 1.6 3.0 –0.0 1.9 –0.1 –0.7 1.7 1.6 0.0 0.2 –0.5 South Africa 1.6 0.4 –0.9 –2.2 1.8 2.1 0.9 0.9 –0.2 –0.5 –0.0 South Korea –26.2 –29.8 0.0 –0.8 –16.2 –21.4 –9.0 –8.3 –1.0 0.8 –1.8 Spain –40.6 23.7 –18.5 –4.3 19.2 –21.1 –42.7 49.2 1.4 –0.1 –8.3 Sweden –4.9 –1.1 42.0 12.2 –60.7 –29.3 11.9 17.8 2.0 –1.8 0.2
Switzerland –67.8 –61.6 –25.7 –21.3 –22.8 –24.2 –15.3 –17.2 –4.0 1.1 4.0 Turkey 7.7 6.0 –0.2 1.3 9.1 6.4 –2.5 –2.1 1.4 0.3 – United Kingdom 12.5 11.3 –11.3 39.9 –23.5 –71.0 35.5 20.7 11.7 21.8 –11.0 United States 76.4 145.4 161.2 43.4 –111.8 63.4 27.3 44.3 –0.3 –5.8 –5.0 Unallocated –75.3 –75.1 –9.2 8.9 –22.6 –57.9 –43.3 –26.5 –0.2 0.4 –2.2
Non-rep. countries 28.2 6.0 20.8 –2.7 3.8 1.5 3.8 8.2 –0.2 –1.1 2.6 Developed –12.0 –2.0 –0.1 –0.0 –8.8 –2.3 –3.1 0.3 – – 3.0 Offshore centres 0.0 –2.7 0.1 0.3 –0.3 –0.3 0.2 –2.7 – – – Africa & Mid. East 2.7 0.3 –1.4 –2.5 2.8 1.5 1.4 3.8 –0.2 –2.6 0.0 Asia & Pacific 35.0 8.8 21.5 –0.3 10.7 1.8 2.8 5.9 –0.0 1.4 –0.5 Europe 1.4 1.5 0.1 –0.1 –0.6 1.0 2.0 0.6 0.0 0.0 –0.0
Latin America 1.1 0.1 0.5 –0.0 –0.0 –0.3 0.6 0.4 – 0.0 0.1 Consortium Banks 7.1 –0.4 0.0 0.0 0.2 –1.0 6.4 –0.1 0.4 0.7 0.0
Unallocated –3.4 –13.5 –0.3 –0.2 –2.5 –5.9 –0.6 –7.4 – – –5.0
authorities
Estimated exchange rate adjusted changesTable 8B: International positions by nationality of ownership of reporting banks
In billions of US dollarsTotal positions of which: vis-à-vis
related offices other banks non-banks official monetary
A 62 BIS Quarterly Review, June 2011

2010 Q3CDs &
securitiesParent country of bank Assets Liab. Assets Liab. Assets Liab. Assets Liab. Assets Liab. Liab.
All countries 827.3 910.7 167.9 105.7 196.7 376.4 468.0 448.6 –5.3 –20.1 123.4 Reporting countries 787.7 871.5 155.8 94.7 180.4 363.4 456.6 430.2 –5.1 –16.7 122.4
Australia 12.0 32.4 1.7 1.2 3.8 38.1 5.9 –4.0 0.6 –2.8 5.7 Austria 4.5 18.1 –1.4 –3.4 –11.0 4.5 17.0 17.8 –0.1 –0.7 –0.0 Bahamas 2.2 –1.0 – – 0.4 –0.1 1.8 –1.0 – 0.1 0.6 Bahrain 0.5 –0.5 –0.7 –0.5 1.3 1.3 –0.2 –1.4 0.0 0.1 0.0 Belgium –36.1 –18.9 –4.4 –0.8 2.9 –2.0 –34.6 –15.1 –0.0 –0.9 0.3 Bermuda –7.6 –8.0 –1.2 –0.9 –4.8 –0.1 –1.8 –7.0 0.3 0.0 –2.7 Brazil 20.8 30.2 8.9 17.5 3.9 1.3 5.2 11.7 2.8 –0.3 7.3 Canada 14.1 0.4 9.7 –6.7 2.6 –2.1 1.3 10.8 0.5 –1.7 0.2 Cayman Islands –0.7 –3.0 – –0.0 –0.8 –5.7 0.1 2.7 – – –0.1 Chile –0.1 –0.1 – – –0.0 –0.0 –0.0 –0.1 – – – Chinese Taipei 14.1 14.0 0.8 1.1 4.3 2.2 9.0 11.1 –0.0 –0.4 –0.0 Cyprus 0.4 3.0 0.1 –0.7 0.2 0.0 0.2 3.6 –0.0 – 0.0
Denmark 17.4 14.9 15.4 16.1 5.2 11.1 –1.9 –16.4 –1.3 4.0 –17.8 Finland 5.8 3.3 6.9 0.2 –0.7 –1.1 –0.4 4.2 – – –2.8 France 238.8 270.6 116.8 94.6 104.2 116.8 27.0 47.6 –9.1 11.7 22.9 Germany –52.0 81.9 –3.8 34.3 –32.2 26.4 –18.8 19.9 2.8 1.4 19.4 Greece –40.7 –26.9 –6.7 –19.5 –29.0 –4.0 –5.0 –3.5 0.0 0.1 –0.0 Guernsey –0.0 –0.0 – – – – –0.0 –0.0 – – – Hong Kong SAR 16.3 16.5 11.9 2.1 4.8 1.3 –0.3 13.1 –0.0 – –0.0 India 9.8 16.6 2.0 3.5 3.7 5.4 4.0 7.5 –0.0 0.2 0.2 Ireland –16.7 –60.8 –9.0 –18.0 3.7 –19.4 –11.3 –22.0 –0.1 –1.3 –1.5 Isle of Man 0.0 0.0 0.0 0.0 –0.0 –0.0 –0.0 –0.0 – – – Italy 17.5 55.2 16.7 –1.5 –11.4 14.8 11.2 36.3 1.0 5.6 15.3
Japan 204.4 158.4 0.3 19.2 64.3 49.9 139.6 88.9 0.2 0.4 5.3 Jersey –0.0 –0.0 – – –0.0 – – –0.0 – – – Luxembourg 2.0 2.3 1.5 0.4 1.3 3.2 –0.7 –1.4 0.0 0.1 –1.4 Macao SAR –0.0 0.0 –0.0 – 0.0 – –0.0 0.0 –0.0 – – Malaysia 5.0 2.3 0.1 0.1 3.9 0.7 1.0 1.1 0.0 0.5 –0.3 Mexico –0.1 1.5 0.9 0.5 0.0 1.5 –1.0 –0.5 – – 0.2 Netherlands 82.7 93.7 7.4 15.9 49.7 67.4 22.9 15.5 2.7 –5.0 4.9 Norway –25.3 –51.5 –5.3 –31.9 –25.4 –19.3 5.2 1.2 0.1 –1.6 –3.3 Panama 0.1 0.6 0.4 0.2 –0.7 0.5 0.4 –0.1 – – –0.1 Portugal –10.5 –14.5 –2.8 –1.2 –6.2 –11.8 –1.4 –3.1 –0.1 1.5 –3.3 Singapore 1.6 3.0 –0.0 1.9 –0.1 –0.7 1.7 1.6 0.0 0.2 –0.5 South Africa 1.6 0.4 –0.9 –2.2 1.8 2.1 0.9 0.9 –0.2 –0.5 –0.0 South Korea –26.2 –29.8 0.0 –0.8 –16.2 –21.4 –9.0 –8.3 –1.0 0.8 –1.8 Spain 11.7 70.2 9.0 9.1 –11.4 –1.6 14.0 59.6 0.1 3.1 15.1 Sweden 28.2 24.5 1.6 –7.7 28.4 24.4 0.5 11.3 –2.3 –3.5 4.8
Switzerland 101.4 55.6 –11.3 20.8 21.1 2.5 98.2 33.9 –6.5 –1.6 8.8 Turkey 2.7 12.6 –3.6 0.0 3.3 2.7 1.2 10.1 1.8 –0.1 1.0 United Kingdom 110.9 42.0 38.6 –29.3 –32.5 23.3 104.0 70.3 0.8 –22.2 43.6 United States 36.0 28.2 –53.0 –6.4 43.1 18.4 45.1 18.7 0.7 –2.5 3.4 Unallocated –18.2 –16.4 6.0 –14.3 –21.2 3.1 –2.8 –4.2 –0.2 –1.0 –4.6
Non-rep. countries 31.1 18.1 11.9 10.6 10.7 6.6 8.9 3.2 –0.4 –2.2 0.4 Developed 3.6 –0.3 –0.5 –0.1 2.5 –0.1 1.6 –0.1 0.0 – –0.0 Offshore centres –0.6 –1.5 –0.3 –0.2 –0.3 –0.5 –0.1 –0.8 –0.0 – –0.0 Africa & Mid. East –3.9 –2.6 –0.8 –1.1 –0.9 –2.5 –2.0 1.6 –0.2 –0.6 –0.0 Asia & Pacific 28.3 18.8 13.0 12.3 8.2 7.2 7.3 1.0 –0.1 –1.7 0.1 Europe 1.7 1.8 –0.2 0.1 1.1 1.2 0.7 0.4 0.0 – –0.1
Latin America 2.2 1.9 0.7 –0.3 0.1 1.3 1.3 1.0 – –0.0 0.4 Consortium Banks –0.9 –1.2 0.0 0.0 –0.7 –0.6 –0.3 0.5 0.1 –1.1 –0.0
Unallocated 1.1 15.4 0.0 0.2 1.0 3.1 0.1 12.1 –0.0 – 0.8
Table 8B: International positions by nationality of ownership of reporting banksEstimated exchange rate adjusted changesIn billions of US dollars
Total positions of which: vis-à-vis
authoritiesrelated offices other banks non-banks official monetary
BIS Quarterly Review, June 2011 A 63

Total End-December 2010 foreign
claims on a Up to and Over one year Over two Banks Public Sectorcontractual international including one up to two years
Claims vis-à-vis basis claims year yearsA + L A B C D F G
All countries 30,220,492 19,707,376 10,045,275 978,409 5,667,575 8,159,470 2,616,530 Developed countries 22,707,200 14,877,034 7,636,725 735,768 4,161,475 7,080,912 2,082,169
Europe 14,664,600 10,902,067 5,863,194 535,310 2,977,268 5,617,142 1,391,300 Austria 285,077 210,025 63,176 9,485 80,255 114,943 45,079 Andorra 2,483 2,482 1,481 79 919 563 259 Belgium 524,135 289,132 163,887 12,780 83,642 134,172 68,161 Cyprus 50,782 43,483 19,684 2,178 19,449 10,373 2,019 Denmark 342,869 244,659 151,537 23,353 49,438 127,545 16,384
Finland 222,002 99,177 53,910 3,007 23,884 30,495 23,946 France 1,798,909 1,632,233 1,030,331 49,570 373,029 1,080,738 207,650 Germany 2,043,552 1,498,648 852,619 105,020 441,675 767,839 338,355 Greece 160,892 110,008 29,785 4,501 51,926 23,436 56,831 Iceland 14,696 14,693 9,327 599 2,669 8,570 1,029
Ireland 650,188 523,406 206,672 21,368 209,646 180,706 14,175 Italy 1,096,572 663,824 231,113 37,804 226,195 296,344 255,301 Liechtenstein 6,442 6,430 4,131 263 1,426 1,100 11 Luxembourg 665,405 576,341 219,342 16,353 182,726 183,505 12,603 Malta 19,200 13,047 3,588 1,154 6,338 2,067 186
Netherlands 967,853 854,710 345,386 51,606 317,535 360,195 60,313 Norway 295,739 152,796 80,256 7,563 45,868 56,942 38,786 Portugal 225,539 130,607 38,851 8,389 57,475 58,855 30,058 Slovakia 67,439 15,430 5,248 602 6,466 2,128 4,761 Slovenia 36,468 19,027 4,507 2,202 10,280 4,665 3,326
Spain 846,436 620,631 223,263 35,610 208,071 322,601 94,591 Sweden 290,249 233,765 119,877 14,451 68,335 127,644 23,129 Switzerland 571,252 534,083 381,220 11,544 88,028 328,043 40,517 United Kingdom 3,478,725 2,411,982 1,623,488 115,814 421,276 1,393,044 53,799 Vatican 2 2 2 – – – –
Other 1,694 1,446 513 15 717 629 31
Other developed countries 8,042,600 3,974,967 1,773,531 200,458 1,184,207 1,463,770 690,869 Australia 641,926 349,774 122,927 32,744 127,110 180,571 38,760 Canada 577,778 370,275 222,380 10,151 101,772 220,386 54,010 Japan 1,122,157 681,558 546,793 7,445 56,999 478,075 81,757 New Zealand 291,752 34,577 15,383 1,972 15,768 6,072 4,724 United States 5,407,946 2,537,742 865,476 148,146 881,796 578,620 510,605
Offshore centres 2,381,548 1,880,990 928,645 59,491 529,125 303,618 23,529 Aruba 1,260 1,260 383 41 209 187 110 Bahamas 52,235 48,043 36,314 1,669 7,677 13,728 939 Bahrain 31,308 25,000 17,267 2,653 4,659 18,225 433 Barbados 7,438 5,903 1,767 386 2,112 1,573 753 Bermuda 75,280 72,906 27,732 2,593 26,025 749 371
Cayman Islands 851,573 845,053 356,174 11,101 258,372 53,401 1,834
Curacao 15,376 15,243 6,054 654 4,508 2,816 506 Gibraltar 9,038 8,015 3,219 1,606 1,858 2,082 5 Guernsey 35,999 33,671 10,126 1,480 7,665 2,220 3 Hong Kong SAR 561,239 232,143 140,613 13,157 34,334 97,735 4,814 Isle of Man 30,232 25,139 9,964 1,059 12,972 1,635 6
Jersey 118,754 114,502 36,576 6,265 43,907 6,721 685 Lebanon 6,052 5,745 3,858 291 1,413 893 1,224 Macau SAR 19,722 18,392 11,521 872 5,818 10,282 151 Mauritius 17,347 15,564 10,934 773 3,365 1,494 30 Netherlands Antilles – – – – – – –
Panama 87,947 81,591 22,582 3,479 54,507 3,009 1,293 Samoa 3,344 3,082 2,218 131 732 9 – Singapore 328,937 203,262 140,094 6,986 36,653 85,814 9,616 Sint Maarten – – – – – – – Vanuatu 402 109 54 4 51 – 1 West Indies UK 128,065 126,367 91,195 4,291 22,288 1,045 755
Table 9A: Consolidated claims of reporting banks - immediate borrower basisOn individual countries by maturity and sector / Amounts outstanding In millions of US dollars
Maturities SectorsConsolidated cross-border claims in all currencies and local claims in non-local currencies
Total
A 64 BIS Quarterly Review, June 2011

Table 9A (cont.)
Sectors Net risk Total foreign End-December 2010Non-bank transfers claims on an
private sector Claims Liabilities ultimate riskbasis Claims vis-à-vis
H L M Q R(=A+L+Q)8,645,419 10,513,116 7,997,561 –232,080 29,988,412 All countries5,557,164 7,830,166 5,974,104 411,353 23,118,553 Developed countries3,803,969 3,762,533 2,714,792 238,889 14,903,489 Europe
49,895 75,052 104,735 1,663 286,740 Austria1,658 1 1 –475 2,008 Andorra
86,215 235,003 223,343 –3,305 520,830 Belgium30,807 7,299 10,254 –4,174 46,608 Cyprus86,531 98,210 65,186 3,222 346,091 Denmark
44,656 122,825 86,135 –1,988 220,014 Finland322,498 166,676 125,326 141,293 1,940,202 France382,949 544,904 529,839 227,943 2,271,495 Germany29,659 50,884 28,607 7,071 167,963 Greece5,086 3 – 870 15,566 Iceland
326,696 126,782 57,965 –87,549 562,639 Ireland111,013 432,748 178,075 14,610 1,111,182 Italy
5,273 12 – –157 6,285 Liechtenstein376,455 89,064 149,474 –110,496 554,909 Luxembourg10,316 6,153 6,850 –1,624 17,576 Malta
432,018 113,143 36,794 –8,065 959,788 Netherlands56,900 142,943 76,232 –7,394 288,345 Norway41,687 94,932 55,340 1,644 227,183 Portugal7,762 52,009 21,228 –2,332 65,107 Slovakia
10,731 17,441 4,832 –338 36,130 Slovenia
202,524 225,805 80,284 8,485 854,921 Spain82,694 56,484 30,541 9,199 299,448 Sweden
161,110 37,169 20,470 53,317 624,569 Switzerland938,068 1,066,743 823,054 –2,576 3,476,149 United Kingdom
2 – – –2 – Vatican
766 248 227 47 1,741 Other
1,753,195 4,067,633 3,259,312 172,464 8,215,064 Other developed countries126,507 292,152 207,477 –11,829 630,097 Australia95,146 207,503 133,822 15,516 593,294 Canada
117,699 440,599 259,984 49,480 1,171,637 Japan23,370 257,175 160,190 –3,190 288,562 New Zealand
1,390,178 2,870,204 2,497,839 122,379 5,530,325 United States
1,516,516 500,558 449,536 –537,155 1,844,393 Offshore centres962 – – –101 1,159 Aruba
32,979 4,192 4,981 –19,501 32,734 Bahamas6,337 6,308 5,237 –6,620 24,688 Bahrain3,485 1,535 1,343 –218 7,220 Barbados
71,172 2,374 2,124 –7,553 67,727 Bermuda
765,307 6,520 9,063 –277,726 573,847 Cayman Islands
11,840 133 167 –2,646 12,730 Curacao5,523 1,023 2,165 –1,209 7,829 Gibraltar
28,784 2,328 8,213 –1,364 34,635 Guernsey129,479 329,096 288,783 –67,511 493,728 Hong Kong SAR23,454 5,093 11,033 –5,218 25,014 Isle of Man
106,385 4,252 18,500 –10,922 107,832 Jersey3,628 307 197 –516 5,536 Lebanon7,107 1,330 1,732 –2,270 17,452 Macau SAR
14,040 1,783 1,007 –8,199 9,148 Mauritius– – – – – Netherlands Antilles
76,476 6,356 6,412 –41,495 46,452 Panama3,028 262 209 –1,893 1,451 Samoa
105,704 125,675 86,755 –40,897 288,040 Singapore– – – – – Sint Maarten
108 293 278 –26 376 Vanuatu120,718 1,698 1,337 –41,270 86,795 West Indies UK
offices with local residents
Local currency positions ofreporting banks' foreign
BIS Quarterly Review, June 2011 A 65

Total End-December 2010 foreign
claims on a Up to and Over one year Over two Banks Public Sectorcontractual international including one up to two years
Claims vis-à-vis basis claims year yearsA + L A B C D F G
Developing countries 5,021,236 2,840,727 1,447,486 177,298 945,594 762,063 434,895 Africa & Middle East 655,087 419,567 199,866 33,009 165,009 103,053 61,244
Algeria 8,575 2,594 1,481 230 840 552 517 Angola 7,176 6,602 2,465 485 3,564 924 2,186 Benin 60 50 16 10 24 10 15 Botswana 3,001 626 399 39 46 60 289 Burkina Faso 999 493 77 64 344 13 15
Burundi 48 48 20 8 12 23 – Cameroon 3,039 1,048 330 343 340 54 127 Cape Verde 1,345 738 360 129 149 434 89 Central African Republic 10 9 5 2 2 – – Chad 68 31 3 1 26 1 1
Comoros Islands 14 10 2 8 – 5 – Congo 315 296 126 5 98 33 45 Congo Democratic Republic 486 479 219 48 209 117 45 Côte d’Ivoire 4,046 1,723 652 248 543 277 602 Djibouti 221 220 128 7 77 2 17
Egypt 49,040 24,276 14,909 1,327 7,017 4,917 6,184 Equatorial Guinea 1,161 33 14 4 15 12 – Eritrea 10 10 10 – – – – Ethiopia 373 373 296 24 52 – – Gabon 994 833 185 47 566 16 714
Gambia 100 84 45 – 23 4 1 Ghana 6,649 4,815 2,348 286 1,860 196 1,785 Guinea 531 340 155 80 105 65 87 Guinea-Bissau 8 8 1 – 7 – – Iran 13,992 13,989 7,275 1,033 5,565 7,769 255
Iraq 1,371 1,227 481 – 735 304 809 Israel 23,363 18,528 11,276 488 3,615 2,911 5,491 Jordan 3,966 2,501 1,361 386 622 849 277 Kenya 4,019 1,972 997 37 881 278 49 Kuwait 16,990 16,174 11,091 604 4,066 2,193 5,883
Lesotho 9 9 – 9 – – – Liberia 34,342 34,339 7,465 1,597 25,011 2 – Libya 1,652 1,651 1,427 5 209 222 1,140 Madagascar 1,153 312 100 18 192 14 3 Malawi 147 147 62 19 63 79 –
Mali 341 221 65 41 101 75 12 Mauritania 303 300 181 30 84 139 1 Morocco 27,036 7,143 2,424 636 3,687 1,881 1,936 Mozambique 3,922 1,190 368 122 655 161 193 Namibia 430 430 210 27 172 1 48
Niger 90 87 86 3 –7 36 20 Nigeria 7,715 6,393 3,531 166 1,960 2,399 55 Oman 10,516 8,764 3,064 633 4,952 1,807 998 Palestinian Territory 52 50 23 1 22 6 33 Qatar 62,623 56,471 18,191 6,430 30,103 13,291 9,071
Rwanda 49 49 14 – 24 1 – Sao Tomé and Principe 54 54 14 – 40 2 14 Saudi Arabia 60,781 51,478 33,927 1,044 14,670 21,027 6,336 Senegal 2,777 905 176 286 419 44 81 Seychelles 1,926 1,711 1,151 337 195 3 1
Sierra Leone 128 87 11 – 74 – 75 Somalia 91 91 2 23 66 – 7 South Africa 135,412 33,623 14,198 2,974 10,815 11,582 8,382 St. Helena 6 6 – – 6 – – Sudan 778 778 421 14 248 214 434
Swaziland 237 237 195 – 40 136 –
Total Maturities Sectors
Table 9A (Cont.)
Consolidated cross-border claims in all currencies and local claims in non-local currencies
A 66 BIS Quarterly Review, June 2011

Table 9A (Cont.)
Sectors Net risk Total foreign End-December 2010Non-bank transfers claims on an
private sector Claims Liabilities ultimate riskbasis Claims vis-à-vis
H L M Q R(=A+L+Q)1,556,052 2,180,509 1,572,052 –101,546 4,919,690 Developing countries
252,695 235,520 205,727 –19,819 635,268 Africa & Middle East1,524 5,981 4,016 –822 7,753 Algeria3,182 574 959 –188 6,988 Angola
26 10 1 –4 56 Benin277 2,375 2,198 159 3,160 Botswana465 506 589 –32 967 Burkina Faso
24 – – –11 37 Burundi870 1,991 1,929 –97 2,942 Cameroon216 607 458 –77 1,268 Cape Verde
9 1 – –1 9 Central African Republic30 37 – –8 60 Chad
5 4 – 1 15 Comoros Islands217 19 – –66 249 Congo319 7 6 –39 447 Congo Democratic Republic842 2,323 2,080 –334 3,712 Côte d’Ivoire203 1 – –32 189 Djibouti
13,170 24,764 24,300 –965 48,075 Egypt21 1,128 776 –19 1,142 Equatorial Guinea10 – – –1 9 Eritrea
372 – – –31 342 Ethiopia102 161 189 –231 763 Gabon
80 16 91 4 104 Gambia2,838 1,834 1,598 –503 6,146 Ghana
185 191 155 –10 521 Guinea8 – – –1 7 Guinea-Bissau
5,964 3 – –4,306 9,686 Iran
114 144 155 9 1,380 Iraq10,053 4,835 1,478 –996 22,367 Israel1,367 1,465 946 85 4,051 Jordan1,643 2,047 1,726 –253 3,766 Kenya8,085 816 579 1,057 18,047 Kuwait
9 – – – 9 Lesotho34,113 3 23 –6,704 27,638 Liberia
290 1 1 87 1,739 Libya296 841 1,024 –88 1,065 Madagascar65 – – –90 57 Malawi
133 120 96 –51 290 Mali160 3 – 21 324 Mauritania
3,330 19,893 16,328 –1,918 25,118 Morocco836 2,732 1,583 –135 3,787 Mozambique381 – – –108 322 Namibia
31 3 – –17 73 Niger3,937 1,322 1,263 –193 7,522 Nigeria5,959 1,752 1,839 –1,929 8,587 Oman
11 2 2 11 63 Palestinian Territory33,874 6,152 3,746 –1,144 61,479 Qatar
48 – – –13 36 Rwanda39 – – –24 30 Sao Tomé and Principe
24,074 9,303 1,367 4,018 64,799 Saudi Arabia781 1,872 1,474 –49 2,728 Senegal
1,705 215 443 –657 1,269 Seychelles
11 41 70 249 377 Sierra Leone83 – – – 91 Somalia
13,593 101,789 100,830 1,555 136,967 South Africa6 – – 6 12 St. Helena
129 – – –68 710 Sudan
101 – – –44 193 Swaziland
offices with local residents
Local currency positions ofreporting banks' foreign
BIS Quarterly Review, June 2011 A 67
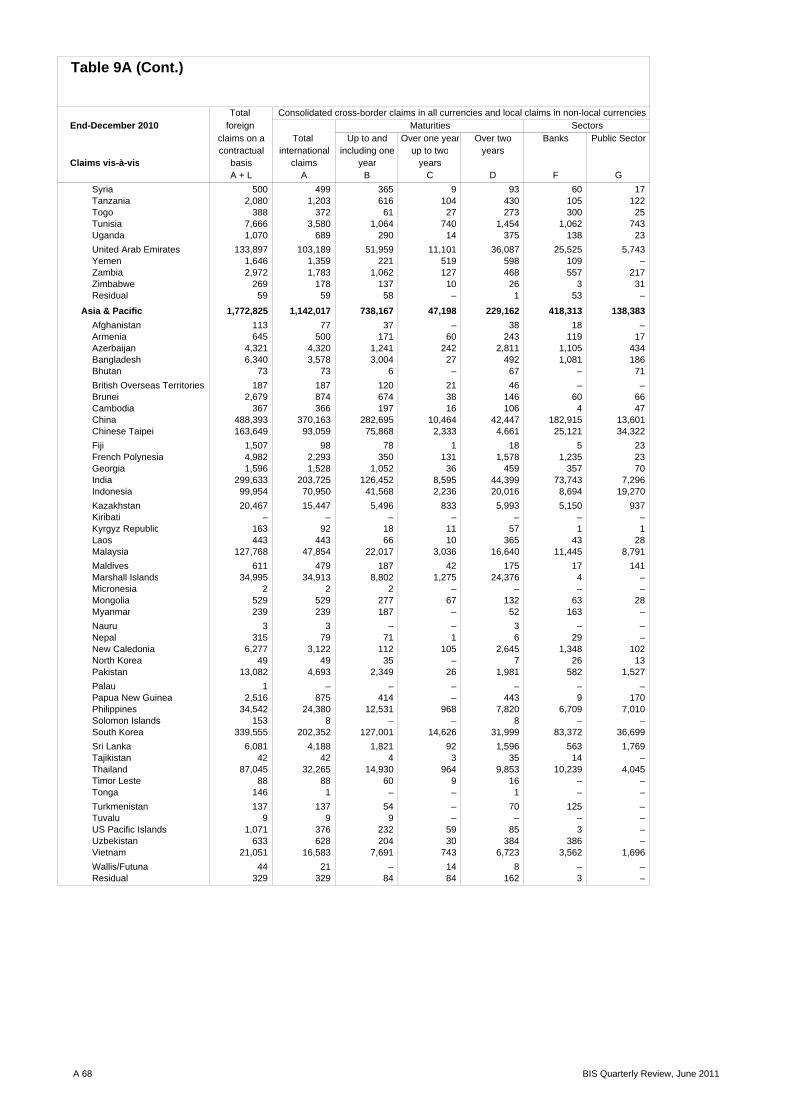
Total End-December 2010 foreign
claims on a Up to and Over one year Over two Banks Public Sectorcontractual international including one up to two years
Claims vis-à-vis basis claims year yearsA + L A B C D F G
Syria 500 499 365 9 93 60 17 Tanzania 2,080 1,203 616 104 430 105 122 Togo 388 372 61 27 273 300 25 Tunisia 7,666 3,580 1,064 740 1,454 1,062 743 Uganda 1,070 689 290 14 375 138 23
United Arab Emirates 133,897 103,189 51,959 11,101 36,087 25,525 5,743 Yemen 1,646 1,359 221 519 598 109 – Zambia 2,972 1,783 1,062 127 468 557 217 Zimbabwe 269 178 137 10 26 3 31 Residual 59 59 58 – 1 53 –
Asia & Pacific 1,772,825 1,142,017 738,167 47,198 229,162 418,313 138,383 Afghanistan 113 77 37 – 38 18 – Armenia 645 500 171 60 243 119 17 Azerbaijan 4,321 4,320 1,241 242 2,811 1,105 434 Bangladesh 6,340 3,578 3,004 27 492 1,081 186 Bhutan 73 73 6 – 67 – 71
British Overseas Territories 187 187 120 21 46 – – Brunei 2,679 874 674 38 146 60 66 Cambodia 367 366 197 16 106 4 47 China 488,393 370,163 282,695 10,464 42,447 182,915 13,601 Chinese Taipei 163,649 93,059 75,868 2,333 4,661 25,121 34,322
Fiji 1,507 98 78 1 18 5 23 French Polynesia 4,982 2,293 350 131 1,578 1,235 23 Georgia 1,596 1,528 1,052 36 459 357 70 India 299,633 203,725 126,452 8,595 44,399 73,743 7,296 Indonesia 99,954 70,950 41,568 2,236 20,016 8,694 19,270
Kazakhstan 20,467 15,447 5,496 833 5,993 5,150 937 Kiribati – – – – – – – Kyrgyz Republic 163 92 18 11 57 1 1 Laos 443 443 66 10 365 43 28 Malaysia 127,768 47,854 22,017 3,036 16,640 11,445 8,791
Maldives 611 479 187 42 175 17 141 Marshall Islands 34,995 34,913 8,802 1,275 24,376 4 – Micronesia 2 2 2 – – – – Mongolia 529 529 277 67 132 63 28 Myanmar 239 239 187 – 52 163 –
Nauru 3 3 – – 3 – – Nepal 315 79 71 1 6 29 – New Caledonia 6,277 3,122 112 105 2,645 1,348 102 North Korea 49 49 35 – 7 26 13 Pakistan 13,082 4,693 2,349 26 1,981 582 1,527
Palau 1 – – – – – – Papua New Guinea 2,516 875 414 – 443 9 170 Philippines 34,542 24,380 12,531 968 7,820 6,709 7,010 Solomon Islands 153 8 – – 8 – – South Korea 339,555 202,352 127,001 14,626 31,999 83,372 36,699
Sri Lanka 6,081 4,188 1,821 92 1,596 563 1,769 Tajikistan 42 42 4 3 35 14 – Thailand 87,045 32,265 14,930 964 9,853 10,239 4,045 Timor Leste 88 88 60 9 16 – – Tonga 146 1 – – 1 – –
Turkmenistan 137 137 54 – 70 125 – Tuvalu 9 9 9 – – – – US Pacific Islands 1,071 376 232 59 85 3 – Uzbekistan 633 628 204 30 384 386 – Vietnam 21,051 16,583 7,691 743 6,723 3,562 1,696
Wallis/Futuna 44 21 – 14 8 – – Residual 329 329 84 84 162 3 –
Total Maturities Sectors
Table 9A (Cont.)
Consolidated cross-border claims in all currencies and local claims in non-local currencies
A 68 BIS Quarterly Review, June 2011

Table 9A (Cont.)
Sectors Net risk Total foreign End-December 2010Non-bank transfers claims on an
private sector Claims Liabilities ultimate riskbasis Claims vis-à-vis
H L M Q R(=A+L+Q)
420 1 – 10 510 Syria975 877 734 –185 1,895 Tanzania46 16 – –17 371 Togo
1,781 4,086 3,184 –452 7,214 Tunisia529 381 1,101 –15 1,055 Uganda
70,326 30,708 25,364 –3,870 130,027 United Arab Emirates1,249 287 – –127 1,519 Yemen1,007 1,189 835 –118 2,854 Zambia
144 91 191 5 274 Zimbabwe2 – – –53 6 Residual
514,398 630,808 435,130 –42,925 1,729,900 Asia & Pacific58 36 33 –2 111 Afghanistan
365 145 67 –37 608 Armenia2,780 1 – –1,050 3,271 Azerbaijan2,308 2,762 2,900 –739 5,601 Bangladesh
2 – – –60 13 Bhutan
186 – – –43 144 British Overseas Territories749 1,805 4,416 –234 2,445 Brunei316 1 – –55 312 Cambodia
113,703 118,230 92,740 –2,276 486,117 China32,572 70,590 43,670 –2,367 161,282 Chinese Taipei
70 1,409 1,345 47 1,554 Fiji1,036 2,689 1,038 –28 4,954 French Polynesia1,098 68 58 –52 1,544 Georgia
117,081 95,908 54,509 9,639 309,272 India42,599 29,004 20,396 –23,677 76,277 Indonesia
9,076 5,020 2,336 –631 19,836 Kazakhstan– – – 33 33 Kiribati
90 71 42 –12 151 Kyrgyz Republic373 – – –86 357 Laos
26,768 79,914 63,938 1,571 129,339 Malaysia
315 132 78 –46 565 Maldives34,908 82 1 –3,277 31,718 Marshall Islands
2 – – –2 – Micronesia439 – – –28 501 Mongolia76 – – – 239 Myanmar
3 – – – 3 Nauru49 236 373 12 327 Nepal
1,674 3,155 2,249 –201 6,076 New Caledonia10 – – –2 47 North Korea
2,577 8,389 7,136 –2,111 10,971 Pakistan
– 1 5 – 1 Palau695 1,641 2,161 –355 2,161 Papua New Guinea
10,465 10,162 5,528 –3,326 31,216 Philippines8 145 133 – 153 Solomon Islands
80,321 137,203 87,079 2,371 341,926 South Korea
1,851 1,893 1,175 –602 5,479 Sri Lanka28 – – –8 34 Tajikistan
17,752 54,780 37,461 –10,263 76,782 Thailand88 – – – 88 Timor Leste1 145 148 – 146 Tonga
11 – – –29 108 Turkmenistan9 – – –9 – Tuvalu
318 695 – –10 1,061 US Pacific Islands245 5 157 –190 443 Uzbekistan
11,132 4,468 3,918 –4,728 16,323 Vietnam
21 23 40 – 44 Wallis/Futuna170 – – –62 267 Residual
Local currency positions ofreporting banks' foreign
offices with local residents
BIS Quarterly Review, June 2011 A 69

Total End-December 2010 foreign
claims on a Up to and Over one year Over two Banks Public Sectorcontractual international including one up to two years
Claims vis-à-vis basis claims year yearsA + L A B C D F G
Europe 1,386,678 789,101 285,180 64,435 372,090 134,673 120,333 Albania 6,315 3,165 1,108 208 1,834 185 878 Belarus 5,356 4,248 2,563 284 1,275 2,210 90 Bosnia and Herzegovina 10,450 3,917 1,527 379 1,615 549 192 Bulgaria 39,456 28,642 8,875 3,862 14,811 1,580 2,560 Croatia 76,579 52,107 16,049 5,632 28,309 3,568 7,229
Czech Republic 185,837 37,125 12,623 2,072 17,384 5,506 7,353 Estonia 21,148 18,354 3,385 1,966 12,749 1,310 515 Hungary 127,755 89,481 28,378 4,358 44,176 11,243 20,397 Latvia 25,054 21,406 4,868 1,228 13,545 1,512 1,211 Lithuania 27,401 20,807 4,349 1,900 12,113 1,262 3,397
Macedonia, FYR 2,539 1,647 498 164 885 117 180 Moldova 900 758 248 50 316 300 52 Montenegro 1,788 1,039 435 57 497 107 324 Poland 294,507 132,869 34,727 7,851 77,833 13,596 31,354 Romania 113,151 75,122 27,520 8,623 34,668 7,053 13,534
Russia 200,072 141,213 61,779 13,792 52,826 42,989 7,109 Serbia 26,245 16,816 7,072 1,617 7,154 1,501 2,916 Turkey 180,242 115,785 59,656 8,238 40,558 36,077 17,322 Ukraine 40,843 23,935 9,039 2,154 9,472 3,864 3,678 Res. Serbia & Montenegro 90 90 53 – 36 6 41
Residual Europe 950 575 428 – 34 138 1
Latin America/Caribbean 1,206,646 490,042 224,273 32,656 179,333 106,024 114,935 Argentina 39,620 18,560 10,064 1,811 5,133 1,436 4,385 Belize 2,922 2,573 2,158 70 305 63 38 Bolivia 353 344 146 36 163 24 2 Bonaire, Saint Eustatius and 8 8 8 – – – – Brazil 507,113 207,942 102,066 15,169 56,655 53,920 62,805 Chile 121,850 48,227 21,603 4,011 19,657 13,244 2,937
Colombia 34,900 15,440 9,259 734 4,485 5,038 2,847 Costa Rica 9,599 7,670 2,655 382 4,021 1,694 517 Cuba 1,815 1,765 815 258 572 1,206 185 Dominica 242 113 36 5 50 – 2 Dominican Republic 5,827 4,637 2,219 255 1,999 517 1,427
Ecuador 2,952 2,688 1,663 215 745 372 276 El Salvador 7,793 6,057 2,109 162 3,516 1,802 732 Falkland Islands 48 28 17 – 12 – – Grenada 323 135 28 2 73 – 8 Guatemala 4,708 3,900 1,747 132 1,961 1,367 118
Guyana 895 686 392 161 130 – – Haiti 271 174 103 – 69 4 97 Honduras 2,302 1,015 451 61 425 404 50 Jamaica 6,672 4,145 1,226 412 1,762 569 1,481 Mexico 359,569 103,530 37,279 4,960 55,217 14,072 25,781
Nicaragua 636 559 243 13 302 106 – Paraguay 4,035 1,857 1,254 75 281 400 127 Peru 41,452 28,622 14,457 2,073 9,773 6,402 5,019 St. Lucia 1,747 1,303 250 109 338 75 146 St. Vincent 900 786 515 46 178 1 22
Surinam 441 441 17 2 83 90 35 Trinidad and Tobago 10,070 3,751 1,117 147 2,469 111 425 Turks and Caicos 1,220 757 364 21 316 49 68 Uruguay 8,409 5,991 3,379 272 2,043 1,074 1,454 Venezuela 22,528 10,912 4,039 350 4,482 1,979 3,945
Residual 5,426 5,426 2,594 712 2,118 5 6 Int. organisations 91,744 89,907 17,150 5,627 29,335 10,723 75,430 Unallocated 18,764 18,718 15,269 225 2,046 2,154 507
Total Maturities Sectors
Table 9A (Cont.)
Consolidated cross-border claims in all currencies and local claims in non-local currencies
A 70 BIS Quarterly Review, June 2011

Table 9A (Cont.)
Sectors Net risk Total foreign End-December 2010Non-bank transfers claims on an
private sector Claims Liabilities ultimate riskbasis Claims vis-à-vis
H L M Q R(=A+L+Q)525,308 597,577 367,650 –34,328 1,352,350 Europe
2,094 3,150 1,247 –106 6,209 Albania1,846 1,108 – 80 5,436 Belarus2,932 6,533 1,425 –708 9,742 Bosnia and Herzegovina
23,898 10,814 8,104 –3,038 36,418 Bulgaria40,628 24,472 7,052 –2,679 73,900 Croatia
23,657 148,712 83,810 –1,964 183,873 Czech Republic16,446 2,794 6,125 –157 20,991 Estonia55,970 38,274 22,736 –5,003 122,752 Hungary18,274 3,648 3,263 –508 24,546 Latvia15,786 6,594 11,959 –2,415 24,986 Lithuania
1,316 892 602 –39 2,500 Macedonia, FYR381 142 84 –6 894 Moldova563 749 287 –238 1,550 Montenegro
87,211 161,638 129,935 3,369 297,876 Poland54,058 38,029 17,395 –3,921 109,230 Romania
89,767 58,859 29,350 –5,488 194,584 Russia11,964 9,429 1,817 –569 25,676 Serbia62,271 64,457 35,963 –6,721 173,521 Turkey15,846 16,908 6,266 –4,210 36,633 Ukraine
43 – 2 –6 84 Res. Serbia & Montenegro
357 375 228 –1 949 Residual Europe
263,651 716,604 563,545 –4,474 1,202,172 Latin America/Caribbean12,683 21,060 17,387 –1,157 38,463 Argentina2,470 349 327 –891 2,031 Belize
318 9 4 –97 256 Bolivia8 – – – 8 Bonaire, Saint Eustatius and
88,653 299,171 218,876 24,883 531,996 Brazil32,036 73,623 57,800 –7,366 114,484 Chile
7,548 19,460 15,246 –900 34,000 Colombia5,457 1,929 1,445 –504 9,095 Costa Rica
372 50 – –217 1,598 Cuba111 129 165 1 243 Dominica
2,691 1,190 935 –1,026 4,801 Dominican Republic
2,037 264 186 –712 2,240 Ecuador3,520 1,736 1,421 –11 7,782 El Salvador
28 20 111 –15 33 Falkland Islands128 188 213 –18 305 Grenada
2,413 808 465 11 4,719 Guatemala
686 209 192 –3 892 Guyana73 97 83 –70 201 Haiti
561 1,287 827 132 2,434 Honduras2,092 2,527 1,280 –27 6,645 Jamaica
63,587 256,039 218,520 –12,414 347,155 Mexico
451 77 41 –68 568 Nicaragua1,286 2,178 1,951 –104 3,931 Paraguay
17,166 12,830 9,413 –942 40,510 Peru1,083 444 406 –34 1,713 St. Lucia
754 114 102 –179 721 St. Vincent
315 – – –25 416 Surinam3,212 6,319 3,291 –235 9,835 Trinidad and Tobago
639 463 241 71 1,291 Turks and Caicos3,421 2,418 2,394 –799 7,610 Uruguay4,801 11,616 10,223 –790 21,738 Venezuela
3,051 – – –968 4,458 Residual3,748 1,837 1,751 –12,492 79,252 Int. organisations
11,939 46 118 7,760 26,524 Unallocated
Local currency positions ofreporting banks' foreign
offices with local residents
BIS Quarterly Review, June 2011 A 71

Table 9B: Consolidated foreign claims of reporting banks - immediate borrower basisOn individual countries by nationality of reporting banks / Amounts outstandingIn millions of US dollarsEnd-December 2010 Total
foreign European Australia Austria Belgium Brazil Canada Chile ChineseClaims vis-à-vis claims banks TaipeiAll countries 30,220,492 18,260,505 588,244 477,518 385,215 78,903 885,552 4,062 204,006 Developed countries 22,707,200 13,577,138 510,495 217,824 284,520 45,459 740,773 2,144 131,116
Europe 14,664,600 9,128,919 176,054 197,997 238,384 22,671 167,419 344 61,093 Austria 285,077 245,981 ... . 4,568 854 1,280 – 278 Andorra 2,483 2,013 – 4 1 ... – ... – Belgium 524,135 432,585 1,665 2,276 . 293 3,286 9 622 Cyprus 50,782 38,249 ... 1,976 263 – ... ... 137 Denmark 342,869 259,219 465 2,108 1,645 1,501 2,265 – 29
Finland 222,002 203,643 466 993 865 16 894 2 134 France 1,798,909 781,946 10,605 10,146 36,901 1,200 ... 67 2,514 Germany 2,043,552 1,216,307 ... 47,052 20,688 2,014 ... 42 3,194 Greece 160,892 130,091 ... 3,140 1,759 1 ... ... 38 Iceland 14,696 9,417 – 304 63 35 ... ... 82
Ireland 650,188 462,762 ... 2,997 45,604 7 4,210 ... 4,862 Italy 1,096,572 783,426 586 22,164 23,720 801 ... 14 224 Liechtenstein 6,442 6,063 – 781 171 ... – ... – Luxembourg 665,405 429,067 2,426 3,610 7,631 957 ... ... 35,127 Malta 19,200 17,872 ... 2,584 27 ... ... ... ...
Netherlands 967,853 583,131 8,636 15,233 23,473 760 ... 6 2,374 Norway 295,739 249,177 445 1,502 404 508 3,157 – 162 Portugal 225,539 194,263 ... 1,578 1,588 931 132 – 26 Slovakia 67,439 65,604 – 28,502 8,080 ... – ... 27 Slovenia 36,468 35,582 ... 15,498 1,075 – ... ... 32
Spain 846,436 641,614 ... 6,774 20,319 1,332 ... 53 212 Sweden 290,249 167,460 578 1,716 1,102 149 1,367 8 146 Switzerland 571,252 230,444 2,770 11,243 1,582 2,121 ... 5 3,438 United Kingdom 3,478,725 1,941,372 ... 15,816 36,855 9,191 89,460 138 7,373 Vatican 2 2 – ... ... ... – ... ...
Other 1,694 1,629 – ... – ... – ... 62
Other developed countries 8,042,600 4,448,219 313,215 19,827 46,136 22,788 537,600 1,800 70,023 Australia 641,926 308,345 . 1,806 2,649 41 ... 1 6,978 Canada 577,778 228,491 ... 1,248 1,959 430 . 44 1,042 Japan 1,122,157 465,754 ... 464 1,112 154 ... 12 3,765 New Zealand 291,752 22,224 255,896 108 7 1 842 ... 773 United States 5,407,946 3,423,404 57,319 16,201 40,409 22,162 536,758 1,743 57,465
Offshore centres 2,381,548 1,270,309 37,721 10,375 7,608 17,965 46,279 32 38,952 Aruba 1,260 385 – ... – 203 ... ... ... Bahamas 52,235 22,862 110 31 10 1,708 ... 15 11 Bahrain 31,308 20,319 259 426 77 60 176 ... 252 Barbados 7,438 2,221 ... ... 41 – ... ... ... Bermuda 75,280 42,567 629 128 48 638 ... ... 744
Cayman Islands 851,573 317,003 807 4,783 4,273 13,735 ... – 5,089
Curacao 15,376 7,134 ... ... 28 71 ... ... ... Gibraltar 9,038 7,651 ... 85 12 387 ... ... 22 Guernsey 35,999 29,661 ... 272 119 – ... ... 208 Hong Kong SAR 561,239 359,402 15,623 381 1,345 60 4,185 – 14,112 Isle of Man 30,232 27,482 ... 326 88 ... ... ... 148
Jersey 118,754 102,498 ... 1,624 657 ... ... ... 166 Lebanon 6,052 4,474 ... ... 3 ... ... ... 3 Macau SAR 19,722 5,545 178 ... – – ... ... 517 Mauritius 17,347 13,032 14 12 9 ... ... ... 522 Netherlands Antilles – – ... ... ... ... ... ... –
Panama 87,947 34,681 ... 38 142 288 ... 14 2,208 Samoa 3,344 778 ... ... – ... – ... 2,079 Singapore 328,937 186,867 18,614 ... 643 28 ... 3 5,441 Sint Maarten – – ... ... ... ... ... ... ... Vanuatu 402 51 ... ... ... ... – ... 24 West Indies UK 128,065 85,696 ... 807 113 787 3,908 ... 7,406
A 72 BIS Quarterly Review, June 2011

Table 9B (Cont.)
End-December 2010 Totalforeign European Australia Austria Belgium Brazil Canada Chile Chinese
Claims vis-à-vis claims banks TaipeiDeveloping countries 5,021,236 3,337,409 33,872 248,019 92,747 15,226 94,963 1,886 33,425
Africa & Middle East 655,087 507,204 2,306 4,777 2,143 38 2,413 2 6,739 Algeria 8,575 6,185 – 11 176 ... ... ... – Angola 7,176 6,744 – ... 9 1 ... ... – Benin 60 57 – ... – ... – ... ... Botswana 3,001 2,625 – ... – ... – ... ... Burkina Faso 999 706 ... ... 2 ... – ... 24
Burundi 48 27 – ... 4 ... – ... 8 Cameroon 3,039 2,743 – ... 22 ... – ... ... Cape Verde 1,345 1,334 – ... – 11 – ... ... Central African Republic 10 10 – ... – ... – ... ... Chad 68 67 – ... 4 ... – ... ...
Comoros Islands 14 13 – ... ... ... – ... ... Congo 315 240 – ... 1 – – ... ... Congo Democratic Republic 486 392 – ... 6 ... ... ... ... Côte d’Ivoire 4,046 3,690 – ... 14 ... ... ... 11 Djibouti 221 92 – ... – ... – ... 120
Egypt 49,040 39,327 ... ... 48 – ... ... 26 Equatorial Guinea 1,161 1,160 – ... – ... – ... 1 Eritrea 10 1 – ... – ... – ... 9 Ethiopia 373 340 – ... – ... – ... – Gabon 994 801 – ... – ... ... ... –
Gambia 100 75 – ... – ... – ... ... Ghana 6,649 5,583 ... 2 139 ... – ... 19 Guinea 531 497 – ... 1 ... – ... ... Guinea-Bissau 8 8 – ... – ... – ... ... Iran 13,992 8,356 ... ... 42 ... ... ... 20
Iraq 1,371 1,248 – ... – ... – ... ... Israel 23,363 14,903 4 123 14 ... 279 2 115 Jordan 3,966 2,859 – 7 2 ... ... ... 7 Kenya 4,019 3,054 ... 15 65 – ... ... 3 Kuwait 16,990 9,749 ... 202 1 ... ... ... 174
Lesotho 9 9 – ... ... ... – ... ... Liberia 34,342 27,478 ... ... 60 ... ... ... 3,235 Libya 1,652 821 – ... 37 ... ... ... – Madagascar 1,153 1,150 – ... – ... – ... – Malawi 147 128 – ... – ... – ... ...
Mali 341 324 – ... 3 ... – ... ... Mauritania 303 273 – ... 11 ... – ... ... Morocco 27,036 26,009 – 39 45 ... ... ... 1 Mozambique 3,922 3,899 – ... 2 ... – ... ... Namibia 430 406 – ... – 6 – ... ...
Niger 90 62 – ... 1 ... ... ... ... Nigeria 7,715 4,942 – 8 4 ... ... ... 2 Oman 10,516 8,441 36 192 51 ... ... ... 62 Palestinian Territory 52 49 – ... ... ... – ... ... Qatar 62,623 43,594 287 602 406 ... ... ... 452
Rwanda 49 45 – ... – ... – ... ... Sao Tomé and Principe 54 54 – ... ... ... – ... ... Saudi Arabia 60,781 49,013 152 347 185 – 131 ... 341 Senegal 2,777 2,447 ... ... 1 ... ... ... ... Seychelles 1,926 1,694 – 4 – ... – ... 73
Sierra Leone 128 111 ... ... – ... – ... ... Somalia 91 89 – ... ... ... – ... ... South Africa 135,412 114,586 180 729 161 – 179 – 855 St. Helena 6 6 – ... ... ... – ... ... Sudan 778 594 – ... – ... – ... –
Swaziland 237 59 – ... ... 20 – ... 3
BIS Quarterly Review, June 2011 A 73

Table 9B (Cont.)
End-December 2010 Totalforeign European Australia Austria Belgium Brazil Canada Chile Chinese
Claims vis-à-vis claims banks Taipei
Syria 500 219 – 2 1 ... – ... – Tanzania 2,080 1,786 ... ... 6 ... – ... ... Togo 388 376 – ... – ... – ... ... Tunisia 7,666 6,969 – 180 144 ... ... ... 1 Uganda 1,070 752 – ... 1 ... – ... 1
United Arab Emirates 133,897 93,769 963 1,612 472 – 1,016 ... 1,176 Yemen 1,646 1,496 – 7 – ... – ... – Zambia 2,972 2,405 ... ... 2 ... – ... ... Zimbabwe 269 261 ... ... – ... – ... ... Residual 59 2 – ... ... ... – ... ...
Asia & Pacific 1,772,825 831,960 29,941 6,668 3,665 319 18,918 489 24,143 Afghanistan 113 81 ... ... – ... – ... 1 Armenia 645 593 – 12 8 ... – ... 8 Azerbaijan 4,321 3,949 – 71 37 ... – ... 4 Bangladesh 6,340 4,990 ... ... 3 ... ... ... 72 Bhutan 73 73 – ... ... ... – ... ...
British Overseas Territories 187 57 ... ... ... ... – ... 1 Brunei 2,679 2,161 12 ... – ... ... ... 149 Cambodia 367 147 5 ... 7 ... ... ... 76 China 488,393 193,235 ... ... 1,065 111 ... 386 7,406 Chinese Taipei 163,649 86,389 ... ... 57 5 ... – ...
Fiji 1,507 40 ... ... 1 ... – ... 1 French Polynesia 4,982 4,974 ... ... – ... – ... – Georgia 1,596 1,279 – 1 2 ... – ... ... India 299,633 145,564 ... 605 521 12 ... 18 5,084 Indonesia 99,954 41,761 ... 738 14 4 399 ... 1,117
Kazakhstan 20,467 15,866 ... 321 60 1 ... ... 59 Kiribati – – – ... ... ... – ... ... Kyrgyz Republic 163 163 – ... – ... – ... ... Laos 443 366 – ... 57 ... – ... 2 Malaysia 127,768 52,892 ... 402 65 ... ... – 1,061
Maldives 611 560 – ... ... ... – ... ... Marshall Islands 34,995 33,246 ... 2 119 ... ... ... 384 Micronesia 2 – – ... ... ... – ... ... Mongolia 529 147 ... ... – ... – ... 3 Myanmar 239 184 – ... – ... – ... ...
Nauru 3 2 ... ... ... ... – ... ... Nepal 315 288 – ... – ... – ... 1 New Caledonia 6,277 6,213 ... ... – ... – ... – North Korea 49 42 ... 1 – ... – – ... Pakistan 13,082 11,066 ... ... – 1 ... ... 4
Palau 1 – – ... ... ... – ... 1 Papua New Guinea 2,516 237 ... ... – ... ... ... – Philippines 34,542 16,630 ... 108 144 1 720 ... 1,293 Solomon Islands 153 2 ... ... ... ... – ... ... South Korea 339,555 165,649 ... 1,435 564 163 ... 85 3,462
Sri Lanka 6,081 4,785 ... 20 3 ... ... ... 6 Tajikistan 42 42 – ... ... ... – ... ... Thailand 87,045 26,577 95 49 178 21 ... ... 1,084 Timor Leste 88 87 – ... ... ... – ... ... Tonga 146 – ... ... ... ... – ... ...
Turkmenistan 137 129 – ... ... ... – ... ... Tuvalu 9 – – ... ... ... – ... 9 US Pacific Islands 1,071 930 – ... 750 ... ... ... ... Uzbekistan 633 373 – ... – ... – ... ... Vietnam 21,051 10,092 ... 404 10 ... ... ... 2,855
Wallis/Futuna 44 44 – ... ... ... – ... ... Residual 329 55 – ... ... ... – ... ...
A 74 BIS Quarterly Review, June 2011

Table 9B (Cont.)
End-December 2010 Totalforeign European Australia Austria Belgium Brazil Canada Chile Chinese
Claims vis-à-vis claims banks TaipeiEurope 1,386,678 1,246,109 299 235,712 86,348 275 2,075 5 1,270
Albania 6,315 6,183 – ... – ... – ... 97 Belarus 5,356 4,599 – ... 48 ... – ... 8 Bosnia and Herzegovina 10,450 10,405 – 6,530 1 ... – ... 10 Bulgaria 39,456 36,953 ... 5,302 1,440 ... – ... 2 Croatia 76,579 75,272 ... 33,866 264 ... ... ... –
Czech Republic 185,837 180,528 ... 61,508 45,610 – ... ... 6 Estonia 21,148 21,051 ... 109 13 ... – ... – Hungary 127,755 113,704 ... 34,109 16,043 – ... ... 134
Latvia 25,054 24,715 – 480 3 – ... ... 35 Lithuania 27,401 26,839 – 232 10 ... – ... – Macedonia, FYR 2,539 2,492 – 348 1 ... – ... ... Moldova 900 892 – ... 1 ... – ... ... Montenegro 1,788 1,784 – 1,023 4 ... – ... ...
Poland 294,507 273,503 ... 14,856 15,686 4 ... ... 23 Romania 113,151 108,806 ... 40,018 439 ... ... ... 1 Russia 200,072 158,765 19 ... 4,220 44 250 ... 793 Serbia 26,245 26,034 – 6,952 77 ... – ... ... Turkey 180,242 134,605 ... 1,285 2,462 227 1,665 5 137 Ukraine 40,843 38,037 – 9,093 26 ... ... ... 24
Res. Serbia & Montenegro 90 1 – ... ... ... ... ... ... Residual Europe 950 941 – ... ... ... – ... ...
Latin America/Caribbean 1,206,646 752,136 1,326 862 591 14,594 71,557 1,390 1,273 Argentina 39,620 29,284 ... 38 112 2,855 ... 31 11 Belize 2,922 2,095 – 1 – – ... ... 218 Bolivia 353 238 – ... 6 21 – – ... Bonaire, Saint Eustatius and 8 – ... ... ... ... ... ... 8 Brazil 507,113 341,253 ... 218 158 ... ... 702 605 Chile 121,850 85,258 ... 65 35 8,177 ... ... 57
Colombia 34,900 19,900 ... 6 1 102 207 79 1 Costa Rica 9,599 2,573 ... 1 1 – ... 9 1 Cuba 1,815 1,333 – 16 1 ... ... – ... Dominica 242 76 – ... ... ... ... ... 2 Dominican Republic 5,827 2,016 ... 6 6 ... ... ... 12
Ecuador 2,952 1,055 ... 2 4 58 ... 3 4 El Salvador 7,793 2,004 ... ... 2 18 ... 9 4 Falkland Islands 48 48 – ... ... ... – ... ... Grenada 323 26 – ... ... ... ... ... ... Guatemala 4,708 929 ... ... 12 – ... ... 2
Guyana 895 8 – ... – ... ... ... ... Haiti 271 22 – ... – – ... ... 50 Honduras 2,302 1,222 ... ... 23 1 ... ... 91 Jamaica 6,672 743 ... 2 – ... ... ... ... Mexico 359,569 215,464 ... 374 203 152 ... 291 40
Nicaragua 636 168 – ... 11 1 ... ... – Paraguay 4,035 2,026 – ... – 1,594 ... ... 3 Peru 41,452 20,085 ... 23 16 119 ... 262 38 St. Lucia 1,747 130 5 ... ... ... ... ... ... St. Vincent 900 550 – 23 ... ... ... ... 104
Surinam 441 42 – ... – 1 ... ... ... Trinidad and Tobago 10,070 2,272 ... ... ... ... ... ... – Turks and Caicos 1,220 271 – ... – ... ... ... ... Uruguay 8,409 4,450 ... 26 – 1,383 ... 2 3 Venezuela 22,528 16,145 ... 9 – 112 156 2 19
Residual 5,426 450 – ... ... ... – ... ... Int. organisations 91,744 71,438 ... 1,300 340 ... 3,405 ... 509 Unallocated 18,764 4,211 ... ... ... 253 132 ... 4
BIS Quarterly Review, June 2011 A 75
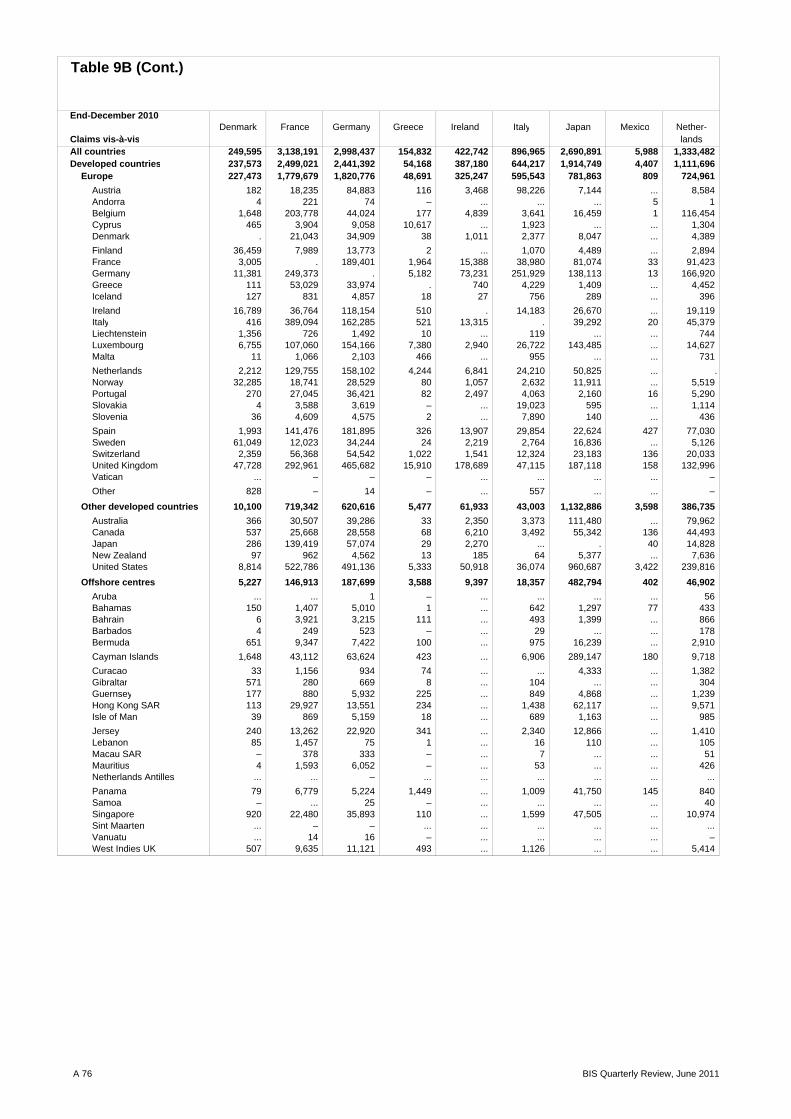
Table 9B (Cont.)
End-December 2010Denmark France Germany Greece Ireland Italy Japan Mexico Nether-
Claims vis-à-vis landsAll countries 249,595 3,138,191 2,998,437 154,832 422,742 896,965 2,690,891 5,988 1,333,482 Developed countries 237,573 2,499,021 2,441,392 54,168 387,180 644,217 1,914,749 4,407 1,111,696
Europe 227,473 1,779,679 1,820,776 48,691 325,247 595,543 781,863 809 724,961 Austria 182 18,235 84,883 116 3,468 98,226 7,144 ... 8,584 Andorra 4 221 74 – ... ... ... 5 1 Belgium 1,648 203,778 44,024 177 4,839 3,641 16,459 1 116,454 Cyprus 465 3,904 9,058 10,617 ... 1,923 ... ... 1,304 Denmark . 21,043 34,909 38 1,011 2,377 8,047 ... 4,389
Finland 36,459 7,989 13,773 2 ... 1,070 4,489 ... 2,894 France 3,005 . 189,401 1,964 15,388 38,980 81,074 33 91,423 Germany 11,381 249,373 . 5,182 73,231 251,929 138,113 13 166,920 Greece 111 53,029 33,974 . 740 4,229 1,409 ... 4,452 Iceland 127 831 4,857 18 27 756 289 ... 396
Ireland 16,789 36,764 118,154 510 . 14,183 26,670 ... 19,119 Italy 416 389,094 162,285 521 13,315 . 39,292 20 45,379 Liechtenstein 1,356 726 1,492 10 ... 119 ... ... 744 Luxembourg 6,755 107,060 154,166 7,380 2,940 26,722 143,485 ... 14,627 Malta 11 1,066 2,103 466 ... 955 ... ... 731
Netherlands 2,212 129,755 158,102 4,244 6,841 24,210 50,825 ... .Norway 32,285 18,741 28,529 80 1,057 2,632 11,911 ... 5,519 Portugal 270 27,045 36,421 82 2,497 4,063 2,160 16 5,290 Slovakia 4 3,588 3,619 – ... 19,023 595 ... 1,114 Slovenia 36 4,609 4,575 2 ... 7,890 140 ... 436
Spain 1,993 141,476 181,895 326 13,907 29,854 22,624 427 77,030 Sweden 61,049 12,023 34,244 24 2,219 2,764 16,836 ... 5,126 Switzerland 2,359 56,368 54,542 1,022 1,541 12,324 23,183 136 20,033 United Kingdom 47,728 292,961 465,682 15,910 178,689 47,115 187,118 158 132,996 Vatican ... – – – ... ... ... ... –
Other 828 – 14 – ... 557 ... ... –
Other developed countries 10,100 719,342 620,616 5,477 61,933 43,003 1,132,886 3,598 386,735 Australia 366 30,507 39,286 33 2,350 3,373 111,480 ... 79,962 Canada 537 25,668 28,558 68 6,210 3,492 55,342 136 44,493 Japan 286 139,419 57,074 29 2,270 ... . 40 14,828 New Zealand 97 962 4,562 13 185 64 5,377 ... 7,636 United States 8,814 522,786 491,136 5,333 50,918 36,074 960,687 3,422 239,816
Offshore centres 5,227 146,913 187,699 3,588 9,397 18,357 482,794 402 46,902 Aruba ... ... 1 – ... ... ... ... 56 Bahamas 150 1,407 5,010 1 ... 642 1,297 77 433 Bahrain 6 3,921 3,215 111 ... 493 1,399 ... 866 Barbados 4 249 523 – ... 29 ... ... 178 Bermuda 651 9,347 7,422 100 ... 975 16,239 ... 2,910
Cayman Islands 1,648 43,112 63,624 423 ... 6,906 289,147 180 9,718
Curacao 33 1,156 934 74 ... ... 4,333 ... 1,382 Gibraltar 571 280 669 8 ... 104 ... ... 304 Guernsey 177 880 5,932 225 ... 849 4,868 ... 1,239 Hong Kong SAR 113 29,927 13,551 234 ... 1,438 62,117 ... 9,571 Isle of Man 39 869 5,159 18 ... 689 1,163 ... 985
Jersey 240 13,262 22,920 341 ... 2,340 12,866 ... 1,410 Lebanon 85 1,457 75 1 ... 16 110 ... 105 Macau SAR – 378 333 – ... 7 ... ... 51 Mauritius 4 1,593 6,052 – ... 53 ... ... 426 Netherlands Antilles ... ... – ... ... ... ... ... ...
Panama 79 6,779 5,224 1,449 ... 1,009 41,750 145 840 Samoa – ... 25 – ... ... ... ... 40 Singapore 920 22,480 35,893 110 ... 1,599 47,505 ... 10,974 Sint Maarten ... – – ... ... ... ... ... ... Vanuatu ... 14 16 – ... ... ... ... – West Indies UK 507 9,635 11,121 493 ... 1,126 ... ... 5,414
A 76 BIS Quarterly Review, June 2011

Table 9B (Cont.)
End-December 2010Denmark France Germany Greece Ireland Italy Japan Mexico Nether-
Claims vis-à-vis landsDeveloping countries 6,641 485,665 344,890 96,981 21,729 229,660 293,348 725 172,810
Africa & Middle East 745 137,249 46,665 4,944 463 14,584 29,603 ... 9,915 Algeria 2 5,460 119 – ... 201 10 ... 52 Angola – 631 1,037 – ... ... ... ... 138 Benin – 54 2 – ... ... ... ... – Botswana 4 36 5 – ... ... ... ... 12 Burkina Faso – 635 – – ... ... ... ... 2
Burundi – 13 6 – ... ... ... ... 1 Cameroon – 2,212 16 1 ... 17 ... ... 46 Cape Verde – ... 1 – ... ... ... ... – Central African Republic ... 8 – – ... ... ... ... 1 Chad ... 59 – – ... ... ... ... 1
Comoros Islands – 13 – – ... ... ... ... – Congo 1 214 1 1 ... ... ... ... – Congo Democratic Republic ... 222 – – ... 4 – ... 29 Côte d’Ivoire 1 3,064 14 – ... ... 34 ... 7 Djibouti – 36 25 – ... ... ... ... –
Egypt 95 17,108 1,299 1,463 ... 6,695 703 ... 185 Equatorial Guinea ... ... 3 – ... 4 ... ... – Eritrea ... – – – ... ... ... ... – Ethiopia – ... 1 – ... ... – ... 3 Gabon ... 394 158 – ... 18 24 ... 13
Gambia – ... 1 – ... ... ... ... 19 Ghana 9 1,636 295 – ... 187 ... ... 441 Guinea ... ... 1 – ... ... ... ... 2 Guinea-Bissau ... ... – – ... ... ... ... – Iran 43 4,040 1,833 4 ... 805 501 ... 257
Iraq – 81 841 – ... 6 53 ... 49 Israel 45 2,894 3,066 3 ... 123 1,616 ... 143 Jordan 13 561 94 40 ... 20 70 ... 12 Kenya 3 622 39 – ... 7 39 ... 159 Kuwait 18 1,971 996 55 ... 229 599 ... 498
Lesotho ... ... – – ... ... ... ... – Liberia 167 3,994 6,853 2,982 ... 1,092 1,998 ... 278 Libya 3 152 46 – ... 22 8 ... 48 Madagascar – 1,070 – – ... ... ... ... 65 Malawi – 87 1 – ... ... ... ... 1
Mali – 272 1 – ... ... ... ... 8 Mauritania ... 234 8 – ... ... ... ... – Morocco 1 23,329 248 1 ... 99 63 ... 231 Mozambique 1 219 54 – ... 10 ... ... 64 Namibia – ... 69 – ... 13 ... ... 1
Niger – 26 – – ... 2 – ... 2 Nigeria 1 1,149 476 – ... 16 70 ... 155 Oman 10 1,925 1,316 – ... 257 1,260 ... 510 Palestinian Territory – ... – – ... ... ... ... – Qatar 83 9,791 5,225 48 ... 1,920 5,017 ... 1,589
Rwanda – ... 19 – ... ... ... ... 14 Sao Tomé and Principe ... – – – ... ... ... ... – Saudi Arabia 14 23,498 5,017 2 ... 444 3,832 ... 885 Senegal 1 2,326 5 – ... 7 9 ... 12 Seychelles 3 466 99 26 ... 46 ... ... 18
Sierra Leone – 62 – – ... ... ... ... 2 Somalia – 88 – – ... ... ... ... – South Africa 87 3,054 7,408 253 ... 608 5,470 ... 425 St. Helena ... – – 1 ... ... ... ... – Sudan 11 502 1 – ... 2 ... ... –
Swaziland – ... 10 – ... ... – ... –
BIS Quarterly Review, June 2011 A 77
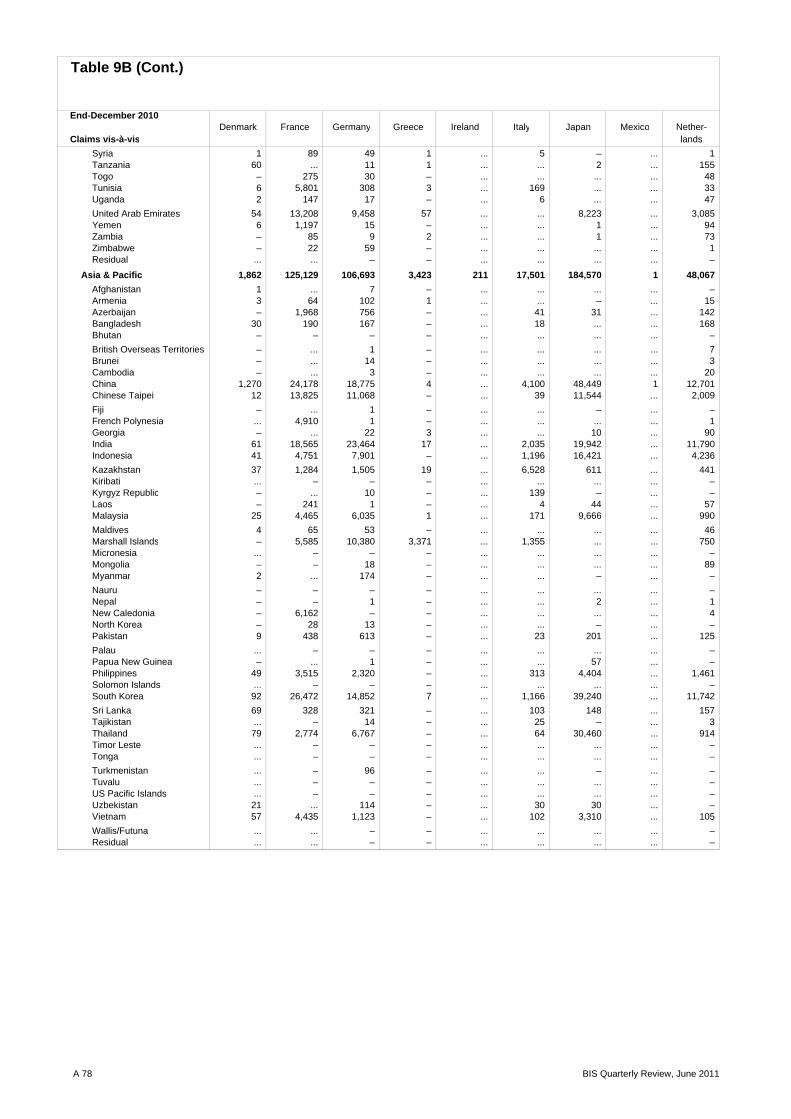
Table 9B (Cont.)
End-December 2010Denmark France Germany Greece Ireland Italy Japan Mexico Nether-
Claims vis-à-vis lands
Syria 1 89 49 1 ... 5 – ... 1 Tanzania 60 ... 11 1 ... ... 2 ... 155 Togo – 275 30 – ... ... ... ... 48 Tunisia 6 5,801 308 3 ... 169 ... ... 33 Uganda 2 147 17 – ... 6 ... ... 47
United Arab Emirates 54 13,208 9,458 57 ... ... 8,223 ... 3,085 Yemen 6 1,197 15 – ... ... 1 ... 94 Zambia – 85 9 2 ... ... 1 ... 73 Zimbabwe – 22 59 – ... ... ... ... 1 Residual ... ... – – ... ... ... ... –
Asia & Pacific 1,862 125,129 106,693 3,423 211 17,501 184,570 1 48,067 Afghanistan 1 ... 7 – ... ... ... ... – Armenia 3 64 102 1 ... ... – ... 15 Azerbaijan – 1,968 756 – ... 41 31 ... 142 Bangladesh 30 190 167 – ... 18 ... ... 168 Bhutan – – – – ... ... ... ... –
British Overseas Territories – ... 1 – ... ... ... ... 7 Brunei – ... 14 – ... ... ... ... 3 Cambodia – ... 3 – ... ... ... ... 20 China 1,270 24,178 18,775 4 ... 4,100 48,449 1 12,701 Chinese Taipei 12 13,825 11,068 – ... 39 11,544 ... 2,009
Fiji – ... 1 – ... ... – ... – French Polynesia ... 4,910 1 – ... ... ... ... 1 Georgia – ... 22 3 ... ... 10 ... 90 India 61 18,565 23,464 17 ... 2,035 19,942 ... 11,790 Indonesia 41 4,751 7,901 – ... 1,196 16,421 ... 4,236
Kazakhstan 37 1,284 1,505 19 ... 6,528 611 ... 441 Kiribati ... – – – ... ... ... ... – Kyrgyz Republic – ... 10 – ... 139 – ... – Laos – 241 1 – ... 4 44 ... 57 Malaysia 25 4,465 6,035 1 ... 171 9,666 ... 990
Maldives 4 65 53 – ... ... ... ... 46 Marshall Islands – 5,585 10,380 3,371 ... 1,355 ... ... 750 Micronesia ... – – – ... ... ... ... – Mongolia – – 18 – ... ... ... ... 89 Myanmar 2 ... 174 – ... ... – ... –
Nauru – – – – ... ... ... ... – Nepal – – 1 – ... ... 2 ... 1 New Caledonia – 6,162 – – ... ... ... ... 4 North Korea – 28 13 – ... ... – ... – Pakistan 9 438 613 – ... 23 201 ... 125
Palau ... – – – ... ... ... ... – Papua New Guinea – ... 1 – ... ... 57 ... – Philippines 49 3,515 2,320 – ... 313 4,404 ... 1,461 Solomon Islands ... – – – ... ... ... ... – South Korea 92 26,472 14,852 7 ... 1,166 39,240 ... 11,742
Sri Lanka 69 328 321 – ... 103 148 ... 157 Tajikistan ... – 14 – ... 25 – ... 3 Thailand 79 2,774 6,767 – ... 64 30,460 ... 914 Timor Leste ... – – – ... ... ... ... – Tonga ... – – – ... ... ... ... –
Turkmenistan ... – 96 – ... ... – ... – Tuvalu ... – – – ... ... ... ... – US Pacific Islands ... – – – ... ... ... ... – Uzbekistan 21 ... 114 – ... 30 30 ... – Vietnam 57 4,435 1,123 – ... 102 3,310 ... 105
Wallis/Futuna ... ... – – ... ... ... ... – Residual ... ... – – ... ... ... ... –
A 78 BIS Quarterly Review, June 2011
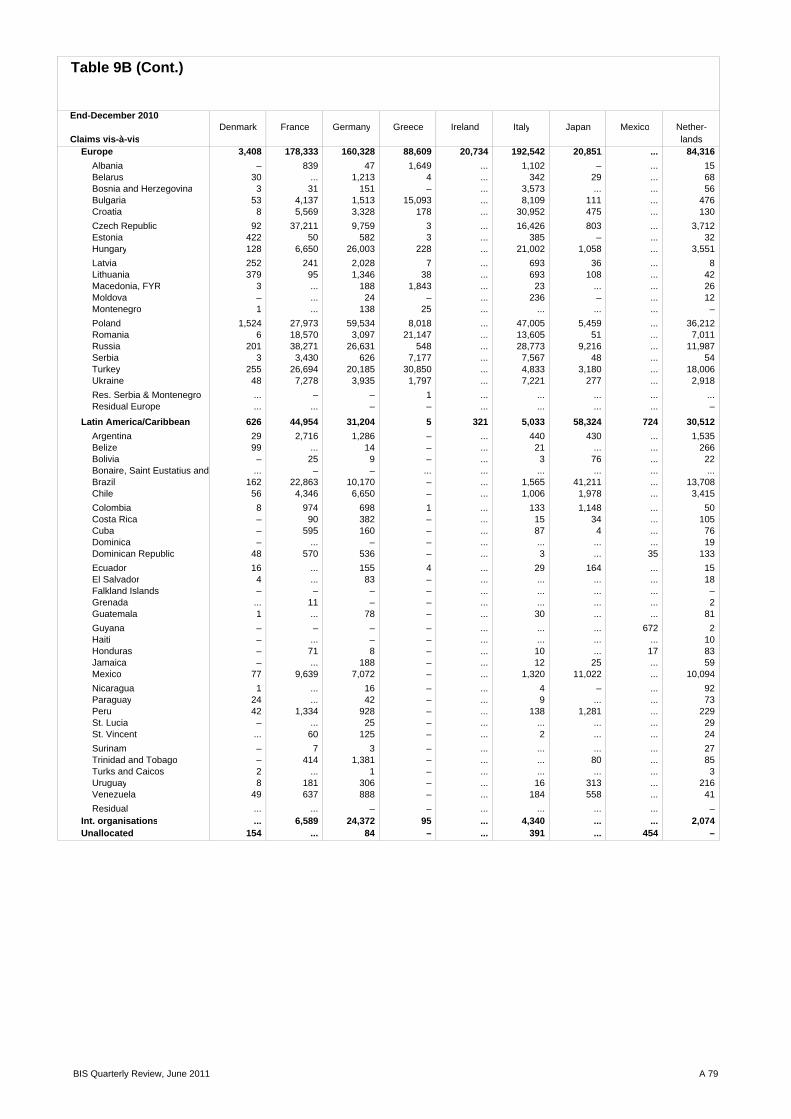
Table 9B (Cont.)
End-December 2010Denmark France Germany Greece Ireland Italy Japan Mexico Nether-
Claims vis-à-vis landsEurope 3,408 178,333 160,328 88,609 20,734 192,542 20,851 ... 84,316
Albania – 839 47 1,649 ... 1,102 – ... 15 Belarus 30 ... 1,213 4 ... 342 29 ... 68 Bosnia and Herzegovina 3 31 151 – ... 3,573 ... ... 56 Bulgaria 53 4,137 1,513 15,093 ... 8,109 111 ... 476 Croatia 8 5,569 3,328 178 ... 30,952 475 ... 130
Czech Republic 92 37,211 9,759 3 ... 16,426 803 ... 3,712 Estonia 422 50 582 3 ... 385 – ... 32 Hungary 128 6,650 26,003 228 ... 21,002 1,058 ... 3,551
Latvia 252 241 2,028 7 ... 693 36 ... 8 Lithuania 379 95 1,346 38 ... 693 108 ... 42 Macedonia, FYR 3 ... 188 1,843 ... 23 ... ... 26 Moldova – ... 24 – ... 236 – ... 12 Montenegro 1 ... 138 25 ... ... ... ... –
Poland 1,524 27,973 59,534 8,018 ... 47,005 5,459 ... 36,212 Romania 6 18,570 3,097 21,147 ... 13,605 51 ... 7,011 Russia 201 38,271 26,631 548 ... 28,773 9,216 ... 11,987 Serbia 3 3,430 626 7,177 ... 7,567 48 ... 54 Turkey 255 26,694 20,185 30,850 ... 4,833 3,180 ... 18,006 Ukraine 48 7,278 3,935 1,797 ... 7,221 277 ... 2,918
Res. Serbia & Montenegro ... – – 1 ... ... ... ... ... Residual Europe ... ... – – ... ... ... ... –
Latin America/Caribbean 626 44,954 31,204 5 321 5,033 58,324 724 30,512 Argentina 29 2,716 1,286 – ... 440 430 ... 1,535 Belize 99 ... 14 – ... 21 ... ... 266 Bolivia – 25 9 – ... 3 76 ... 22 Bonaire, Saint Eustatius and ... – – ... ... ... ... ... ... Brazil 162 22,863 10,170 – ... 1,565 41,211 ... 13,708 Chile 56 4,346 6,650 – ... 1,006 1,978 ... 3,415
Colombia 8 974 698 1 ... 133 1,148 ... 50 Costa Rica – 90 382 – ... 15 34 ... 105 Cuba – 595 160 – ... 87 4 ... 76 Dominica – ... – – ... ... ... ... 19 Dominican Republic 48 570 536 – ... 3 ... 35 133
Ecuador 16 ... 155 4 ... 29 164 ... 15 El Salvador 4 ... 83 – ... ... ... ... 18 Falkland Islands – – – – ... ... ... ... – Grenada ... 11 – – ... ... ... ... 2 Guatemala 1 ... 78 – ... 30 ... ... 81
Guyana – – – – ... ... ... 672 2 Haiti – ... – – ... ... ... ... 10 Honduras – 71 8 – ... 10 ... 17 83 Jamaica – ... 188 – ... 12 25 ... 59 Mexico 77 9,639 7,072 – ... 1,320 11,022 ... 10,094
Nicaragua 1 ... 16 – ... 4 – ... 92 Paraguay 24 ... 42 – ... 9 ... ... 73 Peru 42 1,334 928 – ... 138 1,281 ... 229 St. Lucia – ... 25 – ... ... ... ... 29 St. Vincent ... 60 125 – ... 2 ... ... 24
Surinam – 7 3 – ... ... ... ... 27 Trinidad and Tobago – 414 1,381 – ... ... 80 ... 85 Turks and Caicos 2 ... 1 – ... ... ... ... 3 Uruguay 8 181 306 – ... 16 313 ... 216 Venezuela 49 637 888 – ... 184 558 ... 41
Residual ... ... – – ... ... ... ... – Int. organisations ... 6,589 24,372 95 ... 4,340 ... ... 2,074 Unallocated 154 ... 84 – ... 391 ... 454 –
BIS Quarterly Review, June 2011 A 79
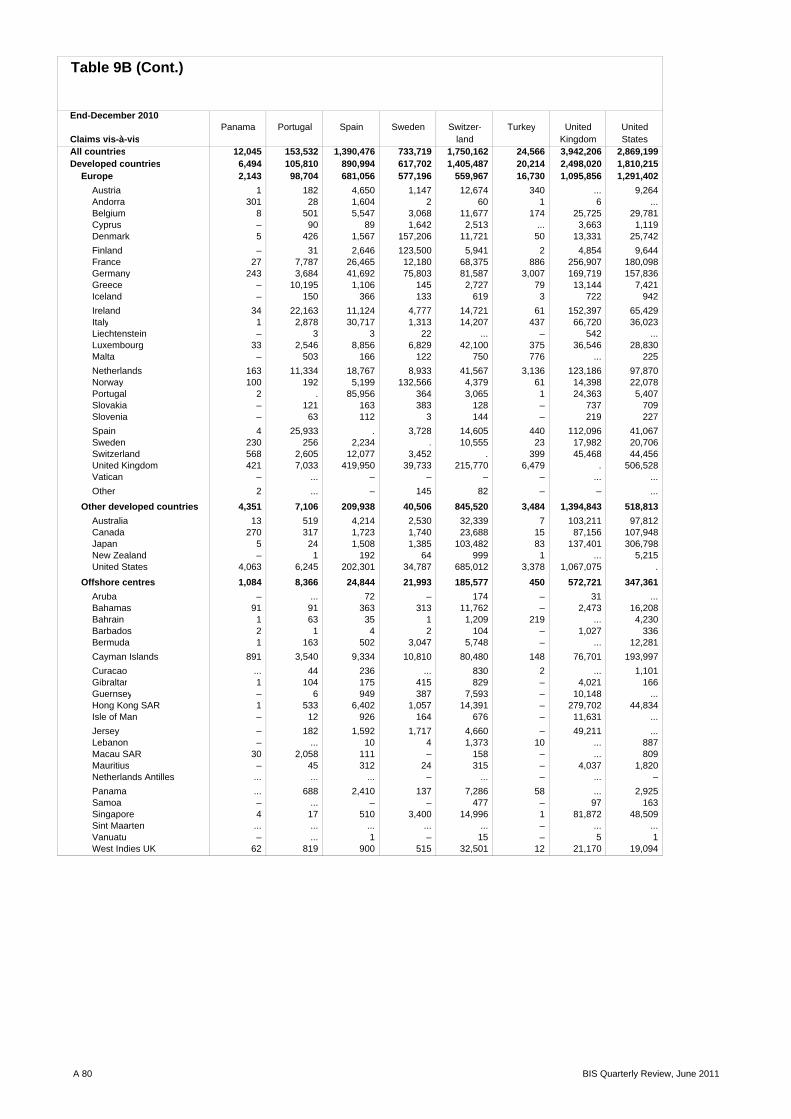
Table 9B (Cont.)
End-December 2010Panama Portugal Spain Sweden Switzer- Turkey United United
Claims vis-à-vis land Kingdom StatesAll countries 12,045 153,532 1,390,476 733,719 1,750,162 24,566 3,942,206 2,869,199 Developed countries 6,494 105,810 890,994 617,702 1,405,487 20,214 2,498,020 1,810,215
Europe 2,143 98,704 681,056 577,196 559,967 16,730 1,095,856 1,291,402 Austria 1 182 4,650 1,147 12,674 340 ... 9,264 Andorra 301 28 1,604 2 60 1 6 ... Belgium 8 501 5,547 3,068 11,677 174 25,725 29,781 Cyprus – 90 89 1,642 2,513 ... 3,663 1,119 Denmark 5 426 1,567 157,206 11,721 50 13,331 25,742
Finland – 31 2,646 123,500 5,941 2 4,854 9,644 France 27 7,787 26,465 12,180 68,375 886 256,907 180,098 Germany 243 3,684 41,692 75,803 81,587 3,007 169,719 157,836 Greece – 10,195 1,106 145 2,727 79 13,144 7,421 Iceland – 150 366 133 619 3 722 942
Ireland 34 22,163 11,124 4,777 14,721 61 152,397 65,429 Italy 1 2,878 30,717 1,313 14,207 437 66,720 36,023 Liechtenstein – 3 3 22 ... – 542 ... Luxembourg 33 2,546 8,856 6,829 42,100 375 36,546 28,830 Malta – 503 166 122 750 776 ... 225
Netherlands 163 11,334 18,767 8,933 41,567 3,136 123,186 97,870 Norway 100 192 5,199 132,566 4,379 61 14,398 22,078 Portugal 2 . 85,956 364 3,065 1 24,363 5,407 Slovakia – 121 163 383 128 – 737 709 Slovenia – 63 112 3 144 – 219 227
Spain 4 25,933 . 3,728 14,605 440 112,096 41,067 Sweden 230 256 2,234 . 10,555 23 17,982 20,706 Switzerland 568 2,605 12,077 3,452 . 399 45,468 44,456 United Kingdom 421 7,033 419,950 39,733 215,770 6,479 . 506,528 Vatican – ... – – – – ... ...
Other 2 ... – 145 82 – – ...
Other developed countries 4,351 7,106 209,938 40,506 845,520 3,484 1,394,843 518,813 Australia 13 519 4,214 2,530 32,339 7 103,211 97,812 Canada 270 317 1,723 1,740 23,688 15 87,156 107,948 Japan 5 24 1,508 1,385 103,482 83 137,401 306,798 New Zealand – 1 192 64 999 1 ... 5,215 United States 4,063 6,245 202,301 34,787 685,012 3,378 1,067,075 .
Offshore centres 1,084 8,366 24,844 21,993 185,577 450 572,721 347,361 Aruba – ... 72 – 174 – 31 ... Bahamas 91 91 363 313 11,762 – 2,473 16,208 Bahrain 1 63 35 1 1,209 219 ... 4,230 Barbados 2 1 4 2 104 – 1,027 336 Bermuda 1 163 502 3,047 5,748 – ... 12,281
Cayman Islands 891 3,540 9,334 10,810 80,480 148 76,701 193,997
Curacao ... 44 236 ... 830 2 ... 1,101 Gibraltar 1 104 175 415 829 – 4,021 166 Guernsey – 6 949 387 7,593 – 10,148 ... Hong Kong SAR 1 533 6,402 1,057 14,391 – 279,702 44,834 Isle of Man – 12 926 164 676 – 11,631 ...
Jersey – 182 1,592 1,717 4,660 – 49,211 ... Lebanon – ... 10 4 1,373 10 ... 887 Macau SAR 30 2,058 111 – 158 – ... 809 Mauritius – 45 312 24 315 – 4,037 1,820 Netherlands Antilles ... ... ... – ... – ... –
Panama ... 688 2,410 137 7,286 58 ... 2,925 Samoa – ... – – 477 – 97 163 Singapore 4 17 510 3,400 14,996 1 81,872 48,509 Sint Maarten ... ... ... ... ... – ... ... Vanuatu – ... 1 – 15 – 5 1 West Indies UK 62 819 900 515 32,501 12 21,170 19,094
A 80 BIS Quarterly Review, June 2011

Table 9B (Cont.)
End-December 2010Panama Portugal Spain Sweden Switzer- Turkey United United
Claims vis-à-vis land Kingdom StatesDeveloping countries 4,398 38,946 473,133 91,701 153,054 3,811 852,476 695,032
Africa & Middle East 18 9,368 6,103 3,691 26,280 343 237,273 58,065 Algeria – 2 64 11 63 – ... 2,120 Angola – 3,255 255 25 172 – 1,221 1 Benin – ... – – 1 – – – Botswana – ... – 43 1 – ... 242 Burkina Faso – ... – 48 5 – 14 19
Burundi – ... – – 3 – – 13 Cameroon – ... 3 – 5 – ... 226 Cape Verde – 1,294 15 – 6 – – – Central African Republic – ... 1 – – – – ... Chad – ... – – – – ... –
Comoros Islands – ... – – – – – ... Congo – ... 2 – 15 – ... 17 Congo Democratic Republic – 1 1 – 124 – ... 50 Côte d’Ivoire – ... 3 – 104 – ... 162 Djibouti – ... – – – – ... –
Egypt – 1 219 13 1,102 27 10,736 6,102 Equatorial Guinea – ... 15 – – – – ... Eritrea – ... – – 1 – – ... Ethiopia – ... – – 2 – ... 5 Gabon – ... 111 – 52 – 33 159
Gambia – ... – – 2 – ... – Ghana – ... 2 85 34 – ... 442 Guinea – ... 7 – 2 – ... 32 Guinea-Bissau – 2 4 – – – ... ... Iran – ... 142 185 241 68 488 –
Iraq – ... 1 1 29 13 ... – Israel 5 32 17 412 2,427 1 5,560 4,070 Jordan – 1 1 5 145 4 ... 535 Kenya – ... 2 4 215 – ... 752 Kuwait – 432 227 8 1,808 31 ... 5,438
Lesotho – ... – – – – ... – Liberia – 55 173 1,500 3,044 39 5,268 589 Libya – 12 2 3 35 – 427 591 Madagascar – ... 1 – 4 – ... – Malawi – 4 – – 2 – 33 1
Mali – ... – – 3 – ... 2 Mauritania – ... 12 – 6 – ... 5 Morocco – 133 1,312 14 137 1 395 736 Mozambique – 3,095 7 67 4 – 375 – Namibia – 2 174 7 4 – ... 1
Niger 2 ... – 22 3 – 6 13 Nigeria – 2 5 10 211 – ... 1,697 Oman – 25 65 11 100 2 ... 224 Palestinian Territory – ... – – 2 – ... ... Qatar 3 1 1,258 422 1,074 1 20,475 2,673
Rwanda – ... 3 6 1 – – – Sao Tomé and Principe – 54 – – – – – ... Saudi Arabia – 1 319 193 3,799 9 14,227 4,145 Senegal – ... 25 2 34 20 14 165 Seychelles – ... 6 2 593 – 406 14
Sierra Leone – ... – – – – ... ... Somalia – ... – – – – – – South Africa 1 908 148 48 3,536 – 97,159 10,873 St. Helena – ... – – – – ... ... Sudan – ... – 1 4 40 33 2
Swaziland – ... 1 – 1 – 9 –
BIS Quarterly Review, June 2011 A 81

Table 9B (Cont.)
End-December 2010Panama Portugal Spain Sweden Switzer- Turkey United United
Claims vis-à-vis land Kingdom States
Syria – ... 1 1 50 1 17 3 Tanzania – ... 1 113 13 – 1,332 261 Togo – ... – – 7 – ... 10 Tunisia – 33 63 73 44 3 103 516 Uganda – ... – 52 5 – ... 258
United Arab Emirates 7 22 1,434 302 6,922 83 55,392 14,379 Yemen – ... – 1 7 – 169 8 Zambia – ... – – 65 – ... 513 Zimbabwe – 1 1 1 11 – ... 1 Residual – ... – ... – – ... ...
Asia & Pacific 33 606 9,583 8,516 75,882 599 419,069 327,120 Afghanistan – ... – – – – ... 1 Armenia – ... 3 – 7 – ... – Azerbaijan – ... – – 369 320 243 161 Bangladesh – 1 3 99 64 – ... 836 Bhutan – ... – 11 – – 2 ...
British Overseas Territories – ... – – – – 3 ... Brunei – ... – – 39 – ... 138 Cambodia – ... – – 1 – 55 11 China – 175 7,726 3,075 17,183 4 100,079 69,477 Chinese Taipei 2 1 118 11 12,303 – 46,926 45,192
Fiji – ... – – 4 – 33 5 French Polynesia – ... 1 – 33 – ... 5 Georgia – ... 3 2 118 37 639 224 India 4 88 629 852 9,915 15 76,684 66,580 Indonesia – 1 42 623 5,592 – 16,414 15,329
Kazakhstan – 122 53 115 1,617 89 3,673 2,287 Kiribati – ... – – – – – ... Kyrgyz Republic – ... 3 – 2 4 – ... Laos – ... – 1 – – ... 1 Malaysia – ... 20 314 2,292 – 37,946 16,099
Maldives – ... – 7 15 – ... – Marshall Islands – 60 68 1,264 2,658 92 4,642 ... Micronesia – ... – – – – – ... Mongolia – ... 3 3 23 – 9 163 Myanmar – ... 1 – – – ... –
Nauru – ... – – – – ... ... Nepal – ... – – 4 – ... 2 New Caledonia – ... – – 3 – ... 17 North Korea – ... – – – – – ... Pakistan – 17 3 1,189 2,909 – 5,697 1,681
Palau – ... – – – – – ... Papua New Guinea – ... – – 3 – 106 109 Philippines – ... 31 250 1,520 – 6,915 7,059 Solomon Islands 3 ... – – – – ... ... South Korea 24 1 868 201 16,765 24 91,060 88,624
Sri Lanka – ... – 287 110 – ... 406 Tajikistan – ... – – – – – – Thailand – ... 4 113 1,891 – 13,683 10,757 Timor Leste – 85 – – – – ... ... Tonga – ... – – – – – ...
Turkmenistan – ... 1 26 – 4 ... ... Tuvalu – ... – – – – – ... US Pacific Islands – ... – – – – 180 20 Uzbekistan – ... 2 – 24 10 11 8 Vietnam – ... 1 73 418 – ... 1,824
Wallis/Futuna – ... – – – – ... ... Residual – 55 – ... – – ... 104
A 82 BIS Quarterly Review, June 2011
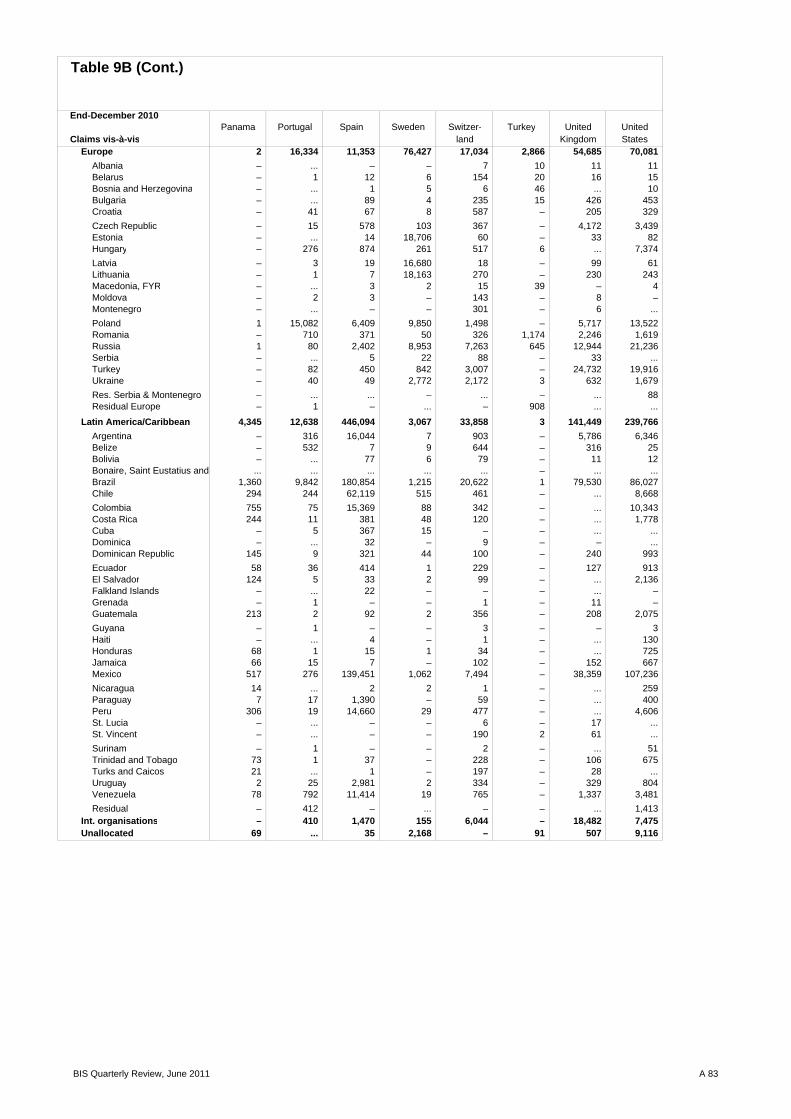
Table 9B (Cont.)
End-December 2010Panama Portugal Spain Sweden Switzer- Turkey United United
Claims vis-à-vis land Kingdom StatesEurope 2 16,334 11,353 76,427 17,034 2,866 54,685 70,081
Albania – ... – – 7 10 11 11 Belarus – 1 12 6 154 20 16 15 Bosnia and Herzegovina – ... 1 5 6 46 ... 10 Bulgaria – ... 89 4 235 15 426 453 Croatia – 41 67 8 587 – 205 329
Czech Republic – 15 578 103 367 – 4,172 3,439 Estonia – ... 14 18,706 60 – 33 82 Hungary – 276 874 261 517 6 ... 7,374
Latvia – 3 19 16,680 18 – 99 61 Lithuania – 1 7 18,163 270 – 230 243 Macedonia, FYR – ... 3 2 15 39 – 4 Moldova – 2 3 – 143 – 8 – Montenegro – ... – – 301 – 6 ...
Poland 1 15,082 6,409 9,850 1,498 – 5,717 13,522 Romania – 710 371 50 326 1,174 2,246 1,619 Russia 1 80 2,402 8,953 7,263 645 12,944 21,236 Serbia – ... 5 22 88 – 33 ... Turkey – 82 450 842 3,007 – 24,732 19,916 Ukraine – 40 49 2,772 2,172 3 632 1,679
Res. Serbia & Montenegro – ... ... – ... – ... 88 Residual Europe – 1 – ... – 908 ... ...
Latin America/Caribbean 4,345 12,638 446,094 3,067 33,858 3 141,449 239,766 Argentina – 316 16,044 7 903 – 5,786 6,346 Belize – 532 7 9 644 – 316 25 Bolivia – ... 77 6 79 – 11 12 Bonaire, Saint Eustatius and ... ... ... ... ... – ... ... Brazil 1,360 9,842 180,854 1,215 20,622 1 79,530 86,027 Chile 294 244 62,119 515 461 – ... 8,668
Colombia 755 75 15,369 88 342 – ... 10,343 Costa Rica 244 11 381 48 120 – ... 1,778 Cuba – 5 367 15 – – ... ... Dominica – ... 32 – 9 – – ... Dominican Republic 145 9 321 44 100 – 240 993
Ecuador 58 36 414 1 229 – 127 913 El Salvador 124 5 33 2 99 – ... 2,136 Falkland Islands – ... 22 – – – ... – Grenada – 1 – – 1 – 11 – Guatemala 213 2 92 2 356 – 208 2,075
Guyana – 1 – – 3 – – 3 Haiti – ... 4 – 1 – ... 130 Honduras 68 1 15 1 34 – ... 725 Jamaica 66 15 7 – 102 – 152 667 Mexico 517 276 139,451 1,062 7,494 – 38,359 107,236
Nicaragua 14 ... 2 2 1 – ... 259 Paraguay 7 17 1,390 – 59 – ... 400 Peru 306 19 14,660 29 477 – ... 4,606 St. Lucia – ... – – 6 – 17 ... St. Vincent – ... – – 190 2 61 ...
Surinam – 1 – – 2 – ... 51 Trinidad and Tobago 73 1 37 – 228 – 106 675 Turks and Caicos 21 ... 1 – 197 – 28 ... Uruguay 2 25 2,981 2 334 – 329 804 Venezuela 78 792 11,414 19 765 – 1,337 3,481
Residual – 412 – ... – – ... 1,413 Int. organisations – 410 1,470 155 6,044 – 18,482 7,475 Unallocated 69 ... 35 2,168 – 91 507 9,116
BIS Quarterly Review, June 2011 A 83

Table 9C: Consolidated foreign claims and other exposures of reporting banks - ultimate risk basisOn individual countries by sector and type / Amounts outstandingIn millions of US dollarsEnd-December 2010
Total Foreign of whichClaims vis-à-vis Claims of 24 Banks Public sector Non-bank cross-border Derivatives Guarantees Credit
countries private sector claims contracts extended commitmentsS F G H T V W X
All countries 25,153,260 5,864,352 4,664,053 14,381,711 13,519,832 3,707,029 6,874,132 3,685,597 Developed countries 18,789,976 4,848,889 3,355,744 10,398,442 10,364,123 3,376,186 5,534,353 2,846,527 Europe 11,500,339 3,483,575 1,813,641 6,120,382 7,160,216 2,216,240 3,903,914 1,638,854
Austria 264,774 101,481 56,754 106,414 167,973 29,479 62,420 12,947 Andorra 1,530 424 258 841 864 77 85 286 Belgium 473,598 109,683 103,962 258,924 227,434 52,039 80,629 112,035 Cyprus 35,502 2,561 2,067 30,677 25,192 1,621 4,063 4,037 Denmark 297,843 122,704 20,902 121,096 139,855 37,458 27,510 51,773
Finland 180,690 42,487 26,646 111,480 65,987 30,804 60,476 31,213 France 1,199,879 608,514 213,850 371,860 1,016,308 292,443 432,185 223,946 Germany 1,674,200 541,641 477,938 648,627 1,105,827 459,717 394,087 209,152 Greece 145,783 10,918 54,196 80,575 89,732 7,052 44,312 9,278 Iceland 11,477 5,788 1,041 4,641 11,411 443 4,830 301
Ireland 462,330 85,139 19,486 356,596 364,131 102,529 83,673 31,699 Italy 867,283 147,675 261,626 457,000 455,100 87,811 284,148 83,881 Liechtenstein 4,507 752 8 3,701 4,494 663 1,009 658 Luxembourg 526,160 118,192 15,676 386,959 426,802 43,613 147,329 49,381 Malta 17,132 2,314 540 13,725 10,171 402 488 740
Netherlands 742,342 190,303 83,104 466,878 646,268 169,091 327,503 88,948 Norway 247,169 49,400 46,525 151,095 117,110 16,378 30,865 30,728 Portugal 202,372 43,354 34,611 124,387 112,459 9,587 61,248 22,190 Slovakia 64,650 3,505 19,467 40,411 13,974 1,511 9,753 10,961 Slovenia 35,511 5,351 5,203 24,586 17,926 983 5,200 2,733
Spain 708,565 225,873 102,003 380,223 493,257 48,677 169,247 60,842 Sweden 153,893 61,332 18,813 72,944 140,553 20,061 87,237 29,459 Switzerland 357,929 148,412 45,722 163,423 304,549 105,047 136,875 74,427 United Kingdom 2,824,309 855,545 203,219 1,742,676 1,202,261 698,275 1,448,567 497,147 Vatican – – – – – – 2 –
Other 911 227 24 643 578 479 173 92
Other developed countries 7,289,637 1,365,314 1,542,103 4,278,060 3,203,907 1,159,946 1,630,439 1,207,673 Australia 543,223 147,427 74,708 320,589 252,960 75,329 119,176 75,149 Canada 425,008 82,918 101,051 240,430 210,262 68,285 84,828 69,621 Japan 856,659 265,965 337,706 250,614 344,579 96,438 202,240 64,858 New Zealand 287,203 15,002 18,160 253,693 19,816 8,661 11,296 35,401 United States 5,176,395 853,949 1,009,465 3,212,338 2,375,141 910,444 675,061 962,381
Offshore centres 1,738,574 146,830 173,155 1,386,023 1,092,299 137,023 262,284 236,531 Aruba 962 187 110 664 962 – 81 13 Bahamas 29,744 4,084 2,011 23,312 22,353 1,418 1,361 5,897 Bahrain 20,263 9,102 1,035 10,082 12,594 1,344 2,027 2,352 Barbados 7,056 1,593 995 4,466 2,652 1,002 2,726 519 Bermuda 65,354 1,183 406 63,501 59,821 4,208 30,471 20,730
Cayman Islands 547,535 12,881 2,040 510,357 528,797 53,858 76,330 35,668
Curacao 12,062 2,602 373 9,350 11,444 485 3,811 1,334 Gibraltar 6,185 1,364 83 4,623 4,793 101 171 615 Guernsey 33,588 2,028 58 28,940 30,031 1,727 7,747 6,215 Hong Kong SAR 482,679 58,060 104,403 319,153 99,861 22,207 61,676 53,401 Isle of Man 23,814 1,010 389 22,375 17,459 1,192 1,237 4,805
Jersey 105,583 5,532 158 99,452 98,075 12,249 5,271 38,344 Lebanon 4,886 895 1,592 2,391 3,721 386 2,517 1,615 Macau SAR 5,791 270 1,064 4,457 2,668 74 715 1,744 Mauritius 8,651 709 519 7,423 5,979 4,075 904 2,207 Netherlands Antilles – – – – – – – –
Panama 41,581 2,500 1,519 37,469 32,131 2,359 11,099 10,122 Samoa 1,405 14 25 1,367 1,126 28 95 393 Singapore 262,248 41,567 55,729 163,375 82,779 26,162 45,891 36,179 Sint Maarten – – – – – – – – Vanuatu 377 1 20 356 84 1 39 21 West Indies UK 78,810 1,248 626 72,910 74,969 4,147 8,115 14,357
Consolidated cross-border and local claims in all currencies Other exposuresof which on (not included in Foreign Claims)
A 84 BIS Quarterly Review, June 2011

Table 9C (cont.)
End-December 2010Total Foreign of which
Claims vis-à-vis Claims of 24 Banks Public sector Non-bank cross-border Derivatives Guarantees Credit countries private sector claims contracts extended commitments
S F G H T V W XDeveloping countries 4,525,480 859,625 1,069,522 2,576,779 1,970,122 174,956 951,853 589,836 Africa & Middle East 594,473 102,834 113,683 377,403 343,654 33,893 119,745 88,222
Algeria 7,508 560 3,552 3,396 2,854 31 3,873 2,012 Angola 6,580 693 1,811 3,737 4,473 15 947 1,081 Benin 54 6 26 22 51 – 18 14 Botswana 3,029 21 283 2,725 532 123 46 293 Burkina Faso 964 75 52 837 412 – 188 28
Burundi 36 17 – 19 36 3 35 7 Cameroon 2,874 371 575 1,928 879 1 416 85 Cape Verde 1,255 423 41 791 642 – 49 558 Central African Republic 9 – – 9 9 – 2 – Chad 61 – 1 60 62 – 21 –
Comoros Islands 16 9 – 7 15 – – 3 Congo 197 47 59 91 183 – 76 54 Congo Democratic Republic 408 7 125 275 357 6 107 88 Côte d’Ivoire 3,587 310 583 2,691 2,006 37 501 100 Djibouti 181 3 6 172 182 17 21 –
Egypt 45,846 5,563 14,004 26,278 17,356 1,176 10,042 4,706 Equatorial Guinea 1,142 8 1,021 113 11 – 180 148 Eritrea 9 – – 9 9 – 2 – Ethiopia 341 9 27 305 341 – 251 246 Gabon 754 11 635 107 597 – 22 841
Gambia 81 2 – 79 50 – 7 3 Ghana 5,740 713 1,047 3,982 3,648 62 300 1,031 Guinea 519 65 217 236 260 1 19 60 Guinea-Bissau 8 – – 8 8 – – – Iran 4,703 1,585 136 2,981 4,694 25 175 615
Iraq 1,356 107 959 287 1,140 – 1,493 271 Israel 19,878 2,415 8,353 9,070 14,493 3,687 8,296 3,351 Jordan 3,563 859 869 1,837 1,695 91 834 1,063 Kenya 3,705 366 353 2,983 1,337 13 330 633 Kuwait 17,280 2,418 6,804 8,057 16,274 405 2,022 1,260
Lesotho 9 – – 9 9 – – – Liberia 26,465 157 – 26,305 25,635 686 5,336 5,593 Libya 1,508 167 1,138 202 1,507 11 1,204 216 Madagascar 1,066 140 132 794 453 4 151 118 Malawi 38 32 – 7 38 – 7 20
Mali 291 75 29 187 173 – 71 14 Mauritania 302 116 – 186 299 100 194 195 Morocco 24,938 3,269 1,855 19,811 11,538 769 5,113 4,246 Mozambique 3,775 393 618 2,761 690 4 345 563 Namibia 301 – – 301 300 12 55 51
Niger 69 38 20 12 47 – 15 11 Nigeria 6,573 2,120 640 3,812 4,945 80 3,496 1,779 Oman 8,247 1,690 996 5,560 5,830 634 1,012 3,072 Palestinian Territory 59 3 38 19 14 – 22 33 Qatar 51,666 6,289 11,319 34,057 43,860 2,314 6,876 3,673
Rwanda 36 1 – 35 36 – 58 7 Sao Tomé and Principe 31 2 14 15 31 1 – 53 Saudi Arabia 62,237 27,303 13,966 20,946 58,655 3,929 10,635 6,860 Senegal 2,719 189 321 2,209 1,023 – 268 182 Seychelles 1,134 37 108 988 882 53 119 587
Sierra Leone 361 3 61 297 319 7 24 5 Somalia 90 2 18 70 90 – – – South Africa 134,157 18,146 24,486 91,479 30,152 10,191 23,613 14,782 St. Helena 12 – – 12 12 – – – Sudan 518 85 377 55 510 6 72 13
Swaziland 166 131 – 36 167 25 57 9
Consolidated cross-border and local claims in all currencies Other exposuresof which on (not included in Foreign Claims)
BIS Quarterly Review, June 2011 A 85

Table 9C (cont.)
End-December 2010Total Foreign of which
Claims vis-à-vis Claims of 24 Banks Public sector Non-bank cross-border Derivatives Guarantees Credit countries private sector claims contracts extended commitments
S F G H T V W X
Syria 235 52 5 176 226 – 2,623 79 Tanzania 1,830 238 437 1,155 427 10 270 242 Togo 373 317 8 46 371 – 37 9 Tunisia 7,041 1,117 1,098 4,827 2,832 138 2,010 1,126 Uganda 1,030 181 131 718 514 1 70 109
United Arab Emirates 121,049 22,896 13,884 84,190 75,387 9,090 25,210 25,876 Yemen 1,388 344 5 1,038 1,041 1 336 50 Zambia 2,808 637 393 1,776 863 55 157 43 Zimbabwe 265 1 47 218 170 79 16 55 Residual 2 – – 2 2 – – –
Asia & Pacific 1,506,666 413,042 300,105 792,244 763,428 68,665 282,149 151,529 Afghanistan 110 54 – 55 74 4 78 16 Armenia 575 99 106 370 227 4 29 219 Azerbaijan 3,088 737 125 2,227 3,064 – 435 1,010 Bangladesh 5,408 1,060 632 3,716 1,520 28 1,161 1,623 Bhutan 13 – 11 2 2 – 2 34
British Overseas Territories 50 – – 50 15 – 1 6 Brunei 2,440 108 369 1,963 736 911 171 608 Cambodia 235 5 47 183 161 – 9 16 China 354,726 170,736 39,530 144,411 204,101 13,202 47,260 26,488 Chinese Taipei 153,499 26,586 58,257 68,472 68,054 5,512 8,558 18,186
Fiji 1,554 3 138 1,413 142 2 51 79 French Polynesia 4,954 1,307 187 3,459 2,500 – 43 14 Georgia 1,533 367 121 1,044 1,263 5 83 161 India 265,129 62,042 29,042 173,898 162,330 14,328 31,733 18,242 Indonesia 74,103 9,939 23,175 40,639 42,470 2,120 18,934 12,275
Kazakhstan 18,197 4,511 1,615 12,027 8,689 226 16,915 1,256 Kiribati 33 33 – – 33 – 7 10 Kyrgyz Republic 151 4 23 124 17 – 8 31 Laos 327 13 25 288 326 44 2 74 Malaysia 125,390 18,136 29,464 77,766 32,385 3,268 27,139 26,155
Maldives 538 19 245 268 265 1 7 39 Marshall Islands 30,511 45 – 30,465 29,988 1,961 312 5,870 Micronesia – – – – – – – 1 Mongolia 286 62 25 201 286 – 12 20 Myanmar 233 186 – 47 226 – – 12
Nauru 3 – – 3 3 – – 4 Nepal 321 188 17 116 77 – 28 46 New Caledonia 6,038 1,478 444 4,116 3,480 3 545 519 North Korea 41 22 15 4 41 – 29 4 Pakistan 10,899 4,708 1,623 4,564 2,126 1,558 2,000 1,387
Palau 1 – – 1 – – – – Papua New Guinea 2,154 34 226 1,894 483 9 223 1,120 Philippines 30,263 7,316 10,785 12,136 18,184 1,813 23,919 5,649 Solomon Islands 150 1 44 105 5 – 3 13 South Korea 318,114 81,071 77,563 159,195 146,982 18,327 71,373 21,650
Sri Lanka 5,345 489 2,198 2,654 2,228 147 410 382 Tajikistan 34 9 – 25 34 – 3 1 Thailand 72,843 17,606 21,790 33,427 22,002 4,592 13,855 4,959 Timor Leste 87 – – 87 3 – – – Tonga 146 1 7 138 1 – 1 8
Turkmenistan 98 96 – 2 98 11 155 74 Tuvalu – – – – – – – – US Pacific Islands 963 701 – 207 950 217 105 8 Uzbekistan 202 191 3 9 194 327 239 378 Vietnam 15,728 3,069 2,253 10,330 7,535 44 5,087 2,879
Wallis/Futuna 43 8 – 35 18 – 4 – Residual 110 2 – 108 110 1 11,220 3
Consolidated cross-border and local claims in all currencies Other exposuresof which on (not included in Foreign Claims)
A 86 BIS Quarterly Review, June 2011

Table 9C (cont.)
End-December 2010Total Foreign of which
Claims vis-à-vis Claims of 24 Banks Public sector Non-bank cross-border Derivatives Guarantees Credit countries private sector claims contracts extended commitments
S F G H T V W X
Europe 1,301,407 197,208 268,326 820,149 502,961 24,301 324,908 137,415 Albania 6,188 494 2,359 3,161 1,570 – 112 405 Belarus 4,743 2,172 95 2,276 3,422 – 768 1,122 Bosnia and Herzegovina 9,714 903 863 7,450 3,162 – 893 974 Bulgaria 34,432 2,241 4,272 27,145 12,105 255 11,135 2,405 Croatia 73,398 5,322 13,205 53,862 29,007 341 9,055 8,597
Czech Republic 182,703 19,381 41,400 119,288 42,338 5,272 17,174 25,246 Estonia 20,555 2,178 546 17,734 8,429 346 2,207 794 Hungary 116,779 11,075 34,103 68,867 57,224 3,386 33,695 9,354 Latvia 24,096 3,156 1,364 18,814 7,325 348 5,801 646 Lithuania 24,373 1,434 4,020 17,351 14,777 144 4,280 1,789
Macedonia, FYR 2,456 98 359 1,964 564 – 170 309 Moldova 889 297 76 492 577 – 17 40 Montenegro 1,546 191 473 796 1,112 42 303 209 Poland 293,098 46,548 82,782 162,969 82,696 5,184 30,158 32,675 Romania 106,562 9,167 22,689 73,856 38,803 1,166 20,153 7,808
Russia 185,155 44,134 19,694 120,115 101,683 4,242 82,370 19,903 Serbia 25,510 2,503 4,687 17,576 7,094 76 4,106 2,409 Turkey 152,509 40,598 29,858 81,938 76,838 3,173 82,802 20,416 Ukraine 35,677 4,800 5,441 24,098 13,795 323 19,479 2,314 Res. Serbia & Montenegro 84 6 39 39 84 – 192 –
Residual Europe 940 510 1 358 356 3 38 –
Latin America/Caribbean 1,122,934 146,541 387,408 586,983 360,079 48,097 225,051 212,670 Argentina 35,588 2,172 11,765 21,591 10,923 184 23,447 4,772 Belize 1,855 179 110 1,562 1,421 81 88 402 Bolivia 231 13 2 215 222 2 63 58 Bonaire, Saint Eustatius and Sa 8 – – 8 8 – – – Brazil 497,795 78,755 185,019 232,585 194,329 12,906 75,753 100,034 Chile 103,184 12,310 12,347 78,496 27,842 13,426 20,737 27,604
Colombia 30,804 4,387 7,589 18,820 10,379 1,371 12,758 4,672 Costa Rica 6,430 671 1,002 4,756 2,318 94 884 817 Cuba 1,366 929 220 216 1,343 37 151 73 Dominica 241 – 14 227 113 1 – 1 Dominican Republic 3,731 315 1,275 2,140 2,367 13 432 781
Ecuador 1,487 243 250 993 862 5 836 414 El Salvador 6,563 869 1,220 4,475 705 33 847 826 Falkland Islands 35 5 – 30 14 – – 3 Grenada 305 – 36 269 83 – 4 2 Guatemala 3,143 1,458 245 1,439 2,086 176 335 79
Guyana 219 2 31 185 10 – – 60 Haiti 198 1 96 101 20 – 12 5 Honduras 2,192 697 377 1,118 796 148 44 79 Jamaica 6,565 616 3,211 2,732 2,759 74 747 1,481 Mexico 343,205 34,970 139,972 168,177 74,505 17,658 54,082 62,474
Nicaragua 377 103 12 260 177 19 9 277 Paraguay 2,313 230 461 1,622 328 2 90 175 Peru 34,526 5,034 8,893 20,585 9,343 902 11,398 2,866 St. Lucia 1,672 70 201 1,400 1,073 3 4 48 St. Vincent 631 1 31 590 510 11 17 277
Surinam 414 90 35 288 414 – 12 75 Trinidad and Tobago 9,670 439 2,804 6,425 2,813 258 479 526 Turks and Caicos 1,250 29 68 1,151 787 40 25 48 Uruguay 5,578 378 2,096 3,095 2,015 111 888 686 Venezuela 19,611 1,493 8,020 9,773 7,778 271 18,325 2,864
Residual 1,747 82 6 1,659 1,736 271 2,584 191 Int. organisations 74,352 7,275 65,167 1,904 70,700 15,155 1,091 1,155 Unallocated 24,878 1,733 465 18,563 22,588 3,709 124,551 11,548
Consolidated cross-border and local claims in all currencies Other exposuresof which on (not included in Foreign Claims)
BIS Quarterly Review, June 2011 A 87

Table 9D: Consolidated foreign claims of reporting banks - ultimate risk basisOn individual countries by nationality of reporting banks / Amounts outstandingIn millions of US dollarsEnd-December 2010 Total
of 24 European Australia Austria Belgium Canada Chile FranceClaims vis-à-vis countries banksAll countries 25,153,260 17,558,937 599,436 468,753 385,121 884,423 3,433 3,074,681 Developed countries 18,789,976 13,203,392 522,890 217,079 283,717 741,135 1,983 2,493,139 Europe 11,500,339 8,728,727 174,285 197,207 240,618 186,426 364 1,761,293
Austria 264,774 245,979 276 ... 3,212 1,165 – 18,563 Andorra 1,530 1,530 – 1 1 – ... 212 Belgium 473,598 419,847 1,177 2,388 ... 4,396 9 201,924 Cyprus 35,502 34,171 ... 1,889 262 ... ... 3,166 Denmark 297,843 258,561 574 2,034 1,698 2,425 – 20,981
Finland 180,690 162,905 569 1,020 868 884 2 7,860 France 1,199,879 796,671 17,191 9,265 57,357 24,166 58 ... Germany 1,674,200 1,242,121 16,755 48,204 18,357 20,210 55 260,927 Greece 145,783 136,317 ... 3,351 1,909 ... – 56,740 Iceland 11,477 9,516 – 304 63 ... – 853
Ireland 462,330 377,636 3,825 2,882 25,411 3,998 – 29,623 Italy 867,283 783,867 1,297 22,212 25,807 3,500 24 392,577 Liechtenstein 4,507 4,507 – 735 139 – – 536 Luxembourg 526,160 394,553 3,077 3,015 7,503 3,243 – 96,217 Malta 17,132 16,277 ... 2,316 27 ... – 641
Netherlands 742,342 574,155 8,338 15,726 23,270 14,216 6 126,819 Norway 247,169 209,424 469 1,503 404 2,997 – 18,772 Portugal 202,372 194,605 ... 1,635 3,542 189 – 26,923 Slovakia 64,650 63,625 – 27,901 8,179 ... – 3,195 Slovenia 35,511 35,136 ... 15,437 1,075 ... – ...
Spain 708,565 632,189 1,790 6,689 21,512 3,279 93 140,628 Sweden 153,893 109,493 656 1,681 1,133 2,830 8 13,119 Switzerland 357,929 235,837 7,032 11,243 1,876 3,587 45 55,017 United Kingdom 2,824,309 1,788,956 111,155 15,776 37,013 94,291 64 281,450 Vatican – – – ... ... – – –
Other 911 849 – ... – – – –
Other developed countries 7,289,637 4,474,665 348,605 19,872 43,099 554,709 1,619 731,846 Australia 543,223 296,922 – 1,780 2,353 22,725 1 26,839 Canada 425,008 231,153 16,471 1,215 1,946 ... 21 27,038 Japan 856,659 485,368 13,264 466 1,118 10,479 39 147,250 New Zealand 287,203 22,047 252,969 127 7 958 – 987 United States 5,176,395 3,439,174 65,901 16,284 37,675 520,547 1,558 529,732
Offshore centres 1,738,574 1,040,248 32,939 10,119 5,840 44,889 66 113,244 Aruba 962 293 – ... – ... ... ... Bahamas 29,744 10,379 ... 39 11 8,621 15 1,412 Bahrain 20,263 14,159 ... 421 75 160 – 3,076 Barbados 7,056 1,980 ... ... 21 4,778 – 54 Bermuda 65,354 36,376 635 161 47 ... – 6,044
Cayman Islands 547,535 231,154 734 4,609 2,932 16,466 – 25,520
Curacao 12,062 6,810 ... ... 21 ... ... 854 Gibraltar 6,185 6,032 ... 85 5 ... – 257 Guernsey 33,588 28,734 ... 177 111 ... – 805 Hong Kong SAR 482,679 328,319 12,538 234 1,285 3,738 – 26,087 Isle of Man 23,814 23,505 ... 144 88 ... – 836
Jersey 105,583 95,537 ... 1,500 496 ... – 13,032 Lebanon 4,886 4,020 ... ... 3 ... – 1,507 Macau SAR 5,791 4,180 111 ... – ... – 223 Mauritius 8,651 6,872 13 15 9 ... – 1,554 Netherlands Antilles – – ... ... ... ... – –
Panama 41,581 25,911 ... 47 143 ... 48 3,334 Samoa 1,405 294 ... ... – – – ... Singapore 262,248 157,301 17,429 ... 471 2,329 3 20,324 Sint Maarten – – ... ... ... ... ... – Vanuatu 377 48 ... ... ... – – 14 West Indies UK 78,810 58,344 ... 1,254 122 3,503 – 8,251
A 88 BIS Quarterly Review, June 2011

Table 9D (Cont.)
End-December 2010 Totalof 24 European Australia Austria Belgium Canada Chile France
Claims vis-à-vis countries banksDeveloping countries 4,525,480 3,255,429 35,234 240,236 95,216 94,940 1,384 460,663 Africa & Middle East 594,473 491,267 2,975 3,839 2,135 2,767 2 126,455
Algeria 7,508 5,622 – 9 180 ... ... 4,985 Angola 6,580 6,576 – ... 9 – ... 670 Benin 54 54 – ... – – ... 51 Botswana 3,029 2,786 – ... – – ... ... Burkina Faso 964 699 ... ... 2 – ... 632
Burundi 36 15 – ... 4 – ... 10 Cameroon 2,874 2,644 – ... 22 – ... 2,128 Cape Verde 1,255 1,255 – ... – – ... ... Central African Republic 9 9 – ... – – ... ... Chad 61 61 – ... 4 – ... 57
Comoros Islands 16 15 – ... ... – ... 15 Congo 197 174 – ... 1 – ... 140 Congo Democratic Republic 408 357 – ... 7 ... ... 228 Côte d’Ivoire 3,587 3,390 – ... 14 ... ... 2,864 Djibouti 181 60 – ... – – ... 27
Egypt 45,846 38,208 ... 25 37 ... ... 16,961 Equatorial Guinea 1,142 1,142 – ... – – ... ... Eritrea 9 – – ... – – ... – Ethiopia 341 325 – ... – – ... ... Gabon 754 537 – ... 1 – ... 339
Gambia 81 73 – ... – – ... 20 Ghana 5,740 5,022 ... ... 139 – ... 1,295 Guinea 519 481 – ... – – ... ... Guinea-Bissau 8 8 – ... – – ... – Iran 4,703 4,618 ... 25 29 ... ... 1,445
Iraq 1,356 1,300 – ... – – ... 84 Israel 19,878 13,477 3 118 15 281 2 3,086 Jordan 3,563 2,819 ... 31 10 ... ... 499 Kenya 3,705 2,937 ... ... 65 ... ... 631 Kuwait 17,280 10,561 ... 202 1 ... ... 2,421
Lesotho 9 9 – ... ... – ... ... Liberia 26,465 24,669 ... ... 60 ... ... ... Libya 1,508 913 – ... 37 ... ... 236 Madagascar 1,066 1,063 – ... – – ... 1,030 Malawi 38 36 – ... – – ... ...
Mali 291 285 – ... 3 – ... 275 Mauritania 302 296 – ... 9 – ... 245 Morocco 24,938 24,244 – 29 45 ... ... 22,101 Mozambique 3,775 3,764 – ... 2 – ... 172 Namibia 301 300 – ... – – ... 92
Niger 69 58 – ... 1 ... ... 26 Nigeria 6,573 4,779 – ... 4 ... ... 794 Oman 8,247 6,851 23 192 50 ... ... 1,118 Palestinian Territory 59 59 – ... ... – ... ... Qatar 51,666 41,057 292 602 406 ... ... 9,066
Rwanda 36 36 – ... – – ... ... Sao Tomé and Principe 31 31 – ... ... – ... – Saudi Arabia 62,237 54,529 117 364 185 130 ... 23,456 Senegal 2,719 2,402 ... ... 1 ... ... 2,319 Seychelles 1,134 1,090 – 4 – – ... 460
Sierra Leone 361 358 ... ... – – ... ... Somalia 90 88 – ... ... – ... ... South Africa 134,157 114,138 541 754 171 527 – 2,791 St. Helena 12 6 – ... ... – ... – Sudan 518 514 0 ... 0 0 ... 432
Swaziland 166 61 0 ... ... 0 ... ...
BIS Quarterly Review, June 2011 A 89

Table 9D (Cont.)
End-December 2010 Totalof 24 European Australia Austria Belgium Canada Chile France
Claims vis-à-vis countries banks
Syria 235 227 – 2 1 – ... 102 Tanzania 1,830 1,544 ... ... 6 – ... 89 Togo 373 361 – ... – – ... 274 Tunisia 7,041 6,496 – 168 141 ... ... 5,565 Uganda 1,030 745 – ... 1 – ... 148
United Arab Emirates 121,049 91,180 1,343 1,217 470 1,073 ... 12,352 Yemen 1,388 1,298 – 7 – – ... 1,039 Zambia 2,808 2,290 ... ... 2 – ... 85 Zimbabwe 265 263 ... ... – – ... ... Residual 2 2 – ... ... – ... ...
Asia & Pacific 1,506,666 810,002 30,088 6,304 3,959 19,017 480 122,514 Afghanistan 110 80 ... ... – – ... 33 Armenia 575 567 – 3 8 – ... ... Azerbaijan 3,088 2,717 – 72 37 – ... 1,041 Bangladesh 5,408 4,346 ... ... 3 ... ... 174 Bhutan 13 13 – ... ... – ... –
British Overseas Territories 50 49 – ... ... – ... ... Brunei 2,440 2,013 12 ... – ... ... 143 Cambodia 235 143 5 ... 7 ... ... 44 China 354,726 191,980 7,301 ... 1,043 5,260 386 24,162 Chinese Taipei 153,499 84,175 ... 5 50 ... – 14,752
Fiji 1,554 96 ... ... 1 – ... ... French Polynesia 4,954 4,948 ... ... – – ... 4,914 Georgia 1,533 1,236 – 1 2 – ... ... India 265,129 149,001 ... 1,010 592 ... 9 19,594 Indonesia 74,103 30,145 ... 865 6 394 ... 3,448
Kazakhstan 18,197 15,074 ... 307 60 ... ... 1,143 Kiribati 33 33 – ... ... – ... – Kyrgyz Republic 151 151 – ... – – ... ... Laos 327 314 – ... 33 – ... 207 Malaysia 125,390 54,128 539 396 251 ... – 5,128
Maldives 538 519 – ... ... – ... 63 Marshall Islands 30,511 30,298 ... 2 119 ... ... 2,213 Micronesia – – – ... ... – ... – Mongolia 286 119 ... ... – – ... ... Myanmar 233 214 – ... – – ... 9
Nauru 3 2 ... ... ... – ... – Nepal 321 284 – ... – – ... – New Caledonia 6,038 6,014 ... ... – – ... 5,974 North Korea 41 40 ... 1 – – – 28 Pakistan 10,899 9,215 ... 1 – ... ... 252
Palau 1 – – ... ... – ... – Papua New Guinea 2,154 73 ... ... – – ... ... Philippines 30,263 14,640 ... 36 263 614 ... 2,683 Solomon Islands 150 2 ... ... ... – ... – South Korea 318,114 172,750 ... 1,384 520 4,256 85 30,050
Sri Lanka 5,345 4,303 ... ... 3 ... ... 322 Tajikistan 34 34 – ... ... – ... – Thailand 72,843 21,132 74 59 201 ... ... 2,750 Timor Leste 87 87 – ... ... – ... – Tonga 146 – ... ... ... – ... –
Turkmenistan 98 98 – ... ... – ... – Tuvalu – – – ... ... – ... – US Pacific Islands 963 930 – ... 750 ... ... – Uzbekistan 202 197 – ... – – ... ... Vietnam 15,728 7,799 ... ... 10 ... ... 2,843
Wallis/Futuna 43 43 – ... ... – ... ... Residual 110 – – ... ... – ... ...
A 90 BIS Quarterly Review, June 2011

Table 9D (Cont.)
End-December 2010 Totalof 24 European Australia Austria Belgium Canada Chile France
Claims vis-à-vis countries banksEurope 1,301,407 1,204,657 481 229,260 88,620 2,064 5 171,010
Albania 6,188 6,081 – ... – – ... 804 Belarus 4,743 4,668 – ... 35 – ... ... Bosnia and Herzegovina 9,714 9,704 – 5,829 1 – ... 36 Bulgaria 34,432 33,979 ... 5,142 1,467 – ... 3,180 Croatia 73,398 72,649 ... 31,348 258 ... ... 5,573
Czech Republic 182,703 178,650 ... 59,585 45,648 ... ... ... Estonia 20,555 20,473 ... 90 13 – ... 57 Hungary 116,779 108,259 ... 35,028 16,589 ... ... 5,994
Latvia 24,096 23,953 – 290 45 ... ... ... Lithuania 24,373 23,883 – 245 148 – ... 85 Macedonia, FYR 2,456 2,455 – 343 1 – ... ... Moldova 889 889 – ... 1 – ... ... Montenegro 1,546 1,546 – 649 4 – ... ...
Poland 293,098 274,803 ... 14,305 17,377 ... ... 26,777 Romania 106,562 105,029 ... 39,517 495 ... ... ... Russia 185,155 151,144 92 ... 4,146 263 – 37,941 Serbia 25,510 25,440 – 6,968 84 – ... 3,418 Turkey 152,509 126,471 ... 1,258 2,282 1,579 5 23,873 Ukraine 35,677 33,640 ... 8,838 26 ... ... ...
Res. Serbia & Montenegro 84 1 – ... ... ... ... – Residual Europe 940 940 – ... ... – ... ...
Latin America/Caribbean 1,122,934 749,503 1,690 833 502 71,092 897 40,684 Argentina 35,588 28,606 ... 21 57 ... 19 1,869 Belize 1,855 1,270 – ... – ... – ... Bolivia 231 144 – ... 6 – – – Bonaire, Saint Eustatius and Sa 8 – ... ... ... ... ... – Brazil 497,795 359,235 ... 226 124 4,022 677 24,499 Chile 103,184 78,771 ... 65 35 ... – 3,318
Colombia 30,804 19,207 ... 5 1 223 23 ... Costa Rica 6,430 2,140 ... ... 1 ... – 88 Cuba 1,366 1,179 – ... 1 ... – 594 Dominica 241 72 – ... ... 163 – ... Dominican Republic 3,731 1,244 ... 3 6 ... – 158
Ecuador 1,487 653 – 2 4 – 3 ... El Salvador 6,563 2,024 ... ... 2 ... – ... Falkland Islands 35 35 – ... ... – – – Grenada 305 6 – ... ... ... – ... Guatemala 3,143 956 ... ... 12 ... – ...
Guyana 219 4 – ... – ... – – Haiti 198 16 – ... – ... – ... Honduras 2,192 1,421 ... ... 23 ... – ... Jamaica 6,565 775 ... 2 – ... – ... Mexico 343,205 208,229 ... 360 203 ... 49 7,365
Nicaragua 377 116 – ... 11 ... – – Paraguay 2,313 1,937 – ... – – – ... Peru 34,526 18,878 ... 23 16 ... 122 591 St. Lucia 1,672 93 – ... ... 1,579 – ... St. Vincent 631 355 – 23 ... ... – 48
Surinam 414 17 – ... – ... – ... Trinidad and Tobago 9,670 2,280 ... ... ... 6,615 – ... Turks and Caicos 1,250 354 – ... – 896 – ... Uruguay 5,578 3,915 ... 26 – ... 2 90 Venezuela 19,611 15,255 ... 9 – ... 2 394
Residual 1,747 316 – ... ... – – ... Int. organisations 74,352 55,900 4,773 1,319 348 3,330 ... 7,635 Unallocated 24,878 3,968 3,600 ... ... 129 ... –
BIS Quarterly Review, June 2011 A 91

Table 9D (Cont.)
End-December 2010Germany Greece India Ireland Italy Japan Nether- Portugal
Claims vis-à-vis landsAll countries 2,940,334 140,837 44,561 412,449 893,662 2,488,162 1,274,337 139,469 Developed countries 2,441,392 44,685 28,743 378,751 652,166 1,928,984 1,075,669 90,455 Europe 1,820,776 39,113 15,212 310,507 605,110 694,501 685,871 82,970
Austria 84,883 114 128 3,464 102,357 7,182 8,651 277 Andorra 74 – – ... ... ... 1 26 Belgium 44,024 175 1,070 5,385 4,211 15,324 112,218 505 Cyprus 9,058 10,267 234 ... 1,615 ... 1,389 74 Denmark 34,909 42 161 1,054 2,502 8,096 4,235 441
Finland 13,773 2 32 ... 1,198 4,589 2,963 32 France 189,401 2,089 1,151 16,484 42,440 97,865 86,691 7,808 Germany ... 5,185 3,180 71,832 257,408 147,580 170,714 4,334 Greece 33,974 ... 22 835 4,085 1,631 5,003 10,286 Iceland 4,857 18 23 – 759 289 637 153
Ireland 118,154 495 288 ... 13,519 20,713 16,709 5,154 Italy 162,285 584 370 13,158 ... 40,598 45,341 3,021 Liechtenstein 1,492 3 – ... 189 ... 624 2 Luxembourg 154,166 893 284 2,781 25,655 66,952 15,034 2,632 Malta 2,103 367 210 ... 724 ... 735 516
Netherlands 158,102 3,857 1,405 7,057 24,079 43,922 ... 10,793 Norway 28,529 80 188 1,057 2,648 11,944 3,995 192 Portugal 36,421 82 79 2,719 4,052 2,153 6,545 ... Slovakia 3,619 – 70 ... 18,541 201 1,058 121 Slovenia 4,575 3 2 ... 7,713 113 419 65
Spain 181,895 326 200 14,970 29,657 23,506 76,902 26,687 Sweden 34,244 24 34 2,228 2,745 17,743 5,587 258 Switzerland 54,542 1,066 466 4,800 12,220 25,850 21,159 2,682 United Kingdom 465,682 13,441 5,615 159,175 46,050 158,250 99,261 6,911 Vatican – – ... ... ... ... – ...
Other 14 – ... ... 740 ... – ...
Other developed countries 620,616 5,572 13,531 68,244 41,657 1,234,483 389,798 7,485 Australia 39,286 33 472 2,208 3,208 104,151 79,863 525 Canada 28,558 66 2,575 6,650 3,260 54,280 43,762 368 Japan 57,074 25 736 2,290 ... ... 16,037 25 New Zealand 4,562 13 32 155 46 5,031 7,225 1 United States 491,136 5,434 9,716 56,941 35,143 1,071,021 242,911 6,566
Offshore centres 147,263 2,839 7,429 7,617 15,762 279,372 31,326 8,873 Aruba – – – ... ... ... 56 ... Bahamas 1,319 – 71 ... 181 476 389 530 Bahrain 1,506 111 704 ... 277 1,132 882 63 Barbados 689 – ... ... 29 ... 89 ... Bermuda 7,044 66 15 ... 953 14,196 1,546 191
Cayman Islands 44,129 321 367 ... 5,994 161,771 4,508 3,539
Curacao 1,512 17 ... ... ... 2,112 805 115 Gibraltar 781 8 ... ... 41 ... 266 188 Guernsey 7,068 173 ... ... 906 4,232 912 2 Hong Kong SAR 9,789 234 2,803 ... 958 42,321 8,012 560 Isle of Man 4,936 18 – ... 367 170 456 8
Jersey 25,977 212 194 ... 2,171 9,284 1,070 181 Lebanon 242 1 6 ... 21 232 88 ... Macau SAR 343 – 5 ... 25 ... 51 2,071 Mauritius 1,037 – 980 ... 52 ... 389 45 Netherlands Antilles – ... – ... ... ... ... ...
Panama 6,909 1,081 46 ... 879 10,598 401 561 Samoa 28 – ... ... ... ... 18 ... Singapore 22,484 110 2,188 ... 1,617 32,848 8,062 9 Sint Maarten – ... ... ... ... ... ... ... Vanuatu 16 – ... ... ... ... – ... West Indies UK 11,454 487 50 ... 1,108 ... 3,326 810
A 92 BIS Quarterly Review, June 2011
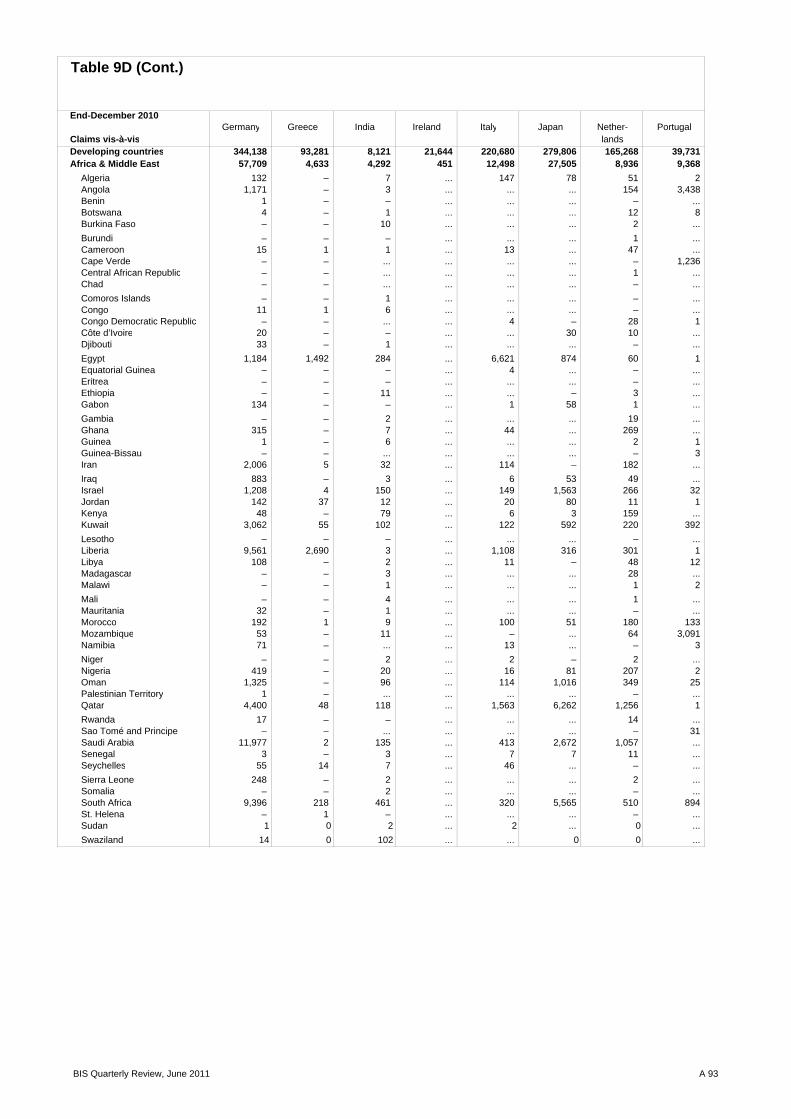
Table 9D (Cont.)
End-December 2010Germany Greece India Ireland Italy Japan Nether- Portugal
Claims vis-à-vis landsDeveloping countries 344,138 93,281 8,121 21,644 220,680 279,806 165,268 39,731 Africa & Middle East 57,709 4,633 4,292 451 12,498 27,505 8,936 9,368
Algeria 132 – 7 ... 147 78 51 2 Angola 1,171 – 3 ... ... ... 154 3,438 Benin 1 – – ... ... ... – ... Botswana 4 – 1 ... ... ... 12 8 Burkina Faso – – 10 ... ... ... 2 ...
Burundi – – – ... ... ... 1 ... Cameroon 15 1 1 ... 13 ... 47 ... Cape Verde – – ... ... ... ... – 1,236 Central African Republic – – ... ... ... ... 1 ... Chad – – ... ... ... ... – ...
Comoros Islands – – 1 ... ... ... – ... Congo 11 1 6 ... ... ... – ... Congo Democratic Republic – – ... ... 4 – 28 1 Côte d’Ivoire 20 – – ... ... 30 10 ... Djibouti 33 – 1 ... ... ... – ...
Egypt 1,184 1,492 284 ... 6,621 874 60 1 Equatorial Guinea – – – ... 4 ... – ... Eritrea – – – ... ... ... – ... Ethiopia – – 11 ... ... – 3 ... Gabon 134 – – ... 1 58 1 ...
Gambia – – 2 ... ... ... 19 ... Ghana 315 – 7 ... 44 ... 269 ... Guinea 1 – 6 ... ... ... 2 1 Guinea-Bissau – – ... ... ... ... – 3 Iran 2,006 5 32 ... 114 – 182 ...
Iraq 883 – 3 ... 6 53 49 ... Israel 1,208 4 150 ... 149 1,563 266 32 Jordan 142 37 12 ... 20 80 11 1 Kenya 48 – 79 ... 6 3 159 ... Kuwait 3,062 55 102 ... 122 592 220 392
Lesotho – – – ... ... ... – ... Liberia 9,561 2,690 3 ... 1,108 316 301 1 Libya 108 – 2 ... 11 – 48 12 Madagascar – – 3 ... ... ... 28 ... Malawi – – 1 ... ... ... 1 2
Mali – – 4 ... ... ... 1 ... Mauritania 32 – 1 ... ... ... – ... Morocco 192 1 9 ... 100 51 180 133 Mozambique 53 – 11 ... – ... 64 3,091 Namibia 71 – ... ... 13 ... – 3
Niger – – 2 ... 2 – 2 ... Nigeria 419 – 20 ... 16 81 207 2 Oman 1,325 – 96 ... 114 1,016 349 25 Palestinian Territory 1 – ... ... ... ... – ... Qatar 4,400 48 118 ... 1,563 6,262 1,256 1
Rwanda 17 – – ... ... ... 14 ... Sao Tomé and Principe – – ... ... ... ... – 31 Saudi Arabia 11,977 2 135 ... 413 2,672 1,057 ... Senegal 3 – 3 ... 7 7 11 ... Seychelles 55 14 7 ... 46 ... – ...
Sierra Leone 248 – 2 ... ... ... 2 ... Somalia – – 2 ... ... ... – ... South Africa 9,396 218 461 ... 320 5,565 510 894 St. Helena – 1 – ... ... ... – ... Sudan 1 0 2 ... 2 ... 0 ...
Swaziland 14 0 102 ... ... 0 0 ...
BIS Quarterly Review, June 2011 A 93

Table 9D (Cont.)
End-December 2010Germany Greece India Ireland Italy Japan Nether- Portugal
Claims vis-à-vis lands
Syria 46 1 5 ... 5 – 1 ... Tanzania 9 1 24 ... ... – 147 ... Togo 35 – 2 ... ... ... 48 ... Tunisia 220 3 11 ... 157 ... 32 29 Uganda 12 – 28 ... – ... 47 ...
United Arab Emirates 8,957 57 2,502 ... ... 8,130 2,950 29 Yemen 13 – 15 ... ... 74 63 ... Zambia 73 2 3 ... ... – 69 ... Zimbabwe 101 – – ... ... ... 1 ... Residual – – – ... ... ... – ...
Asia & Pacific 92,224 3,193 1,908 156 17,225 170,475 45,618 666 Afghanistan 7 – 27 ... ... ... – ... Armenia 99 1 – ... ... – 15 ... Azerbaijan 706 – – ... 35 136 150 ... Bangladesh 160 – 186 ... 18 ... 168 1 Bhutan – – – ... ... ... – ...
British Overseas Territories – – – ... ... ... ... ... Brunei 76 – – ... ... ... 2 ... Cambodia 3 – 1 ... ... ... 20 ... China 17,625 6 498 ... 3,960 44,320 11,704 183 Chinese Taipei 9,319 – 31 ... 126 12,128 2,051 1
Fiji – – 3 ... ... – – ... French Polynesia 7 – ... ... ... ... – ... Georgia 50 3 45 ... ... 32 89 5 India 16,082 17 ... ... 2,950 21,953 12,258 88 Indonesia 5,214 – 300 ... 170 12,927 3,051 8
Kazakhstan 1,383 25 6 ... 6,448 795 484 205 Kiribati 33 – ... ... ... ... – ... Kyrgyz Republic 5 – – ... 136 – – ... Laos 13 – ... ... – 11 54 ... Malaysia 5,453 1 42 ... 423 10,186 1,081 12
Maldives 52 – 14 ... ... ... 40 ... Marshall Islands 13,100 3,095 ... ... 1,215 ... 236 60 Micronesia – – ... ... ... ... – ... Mongolia 17 – ... ... ... ... 79 ... Myanmar 196 – 4 ... ... – – ...
Nauru – – – ... ... ... – ... Nepal – – 26 ... ... – 1 ... New Caledonia – – ... ... ... ... – ... North Korea 11 – – ... ... – – ... Pakistan 327 – 22 ... 6 176 103 17
Palau – – ... ... ... ... – ... Papua New Guinea – – – ... ... 44 – ... Philippines 1,444 – 19 ... 117 3,737 1,340 ... Solomon Islands – – ... ... ... ... – ... South Korea 17,243 45 148 ... 1,451 34,993 11,453 1
Sri Lanka 216 – 352 ... 1 167 105 ... Tajikistan 3 – – ... 25 – 3 ... Thailand 2,089 – 138 ... 47 26,636 1,032 ... Timor Leste – – – ... ... ... – 85 Tonga – – ... ... ... ... – ...
Turkmenistan 96 – ... ... ... – – ... Tuvalu – – ... ... ... ... – ... US Pacific Islands – – 19 ... ... ... – ... Uzbekistan 106 – – ... 5 – – ... Vietnam 1,089 – 27 ... 77 2,234 99 ...
Wallis/Futuna – – – ... ... ... – ... Residual – – ... ... ... ... – ...
A 94 BIS Quarterly Review, June 2011

Table 9D (Cont.)
End-December 2010Germany Greece India Ireland Italy Japan Nether- Portugal
Claims vis-à-vis landsEurope 156,395 85,450 1,500 20,722 184,429 21,768 81,552 16,440
Albania 50 1,649 – ... 1,064 – 7 ... Belarus 1,583 4 – ... 196 52 64 1 Bosnia and Herzegovina 259 1 – ... 3,528 ... 41 ... Bulgaria 1,855 13,452 3 ... 8,084 52 338 1 Croatia 3,126 182 13 ... 30,955 463 111 42
Czech Republic 10,063 3 2 ... 15,800 584 3,416 14 Estonia 582 3 2 ... 338 – 32 ... Hungary 20,543 228 6 ... 20,830 1,081 3,447 278
Latvia 1,830 7 19 ... 474 36 3 3 Lithuania 1,626 38 – ... 624 250 26 1 Macedonia, FYR 182 1,838 – ... 22 ... 26 ... Moldova 19 – – ... 236 – 12 3 Montenegro 242 25 ... ... ... ... – ...
Poland 65,034 8,012 29 ... 46,513 4,939 35,660 15,083 Romania 3,459 20,194 20 ... 12,931 20 6,648 711 Russia 25,295 571 1,196 ... 25,210 9,919 11,640 112 Serbia 650 7,024 ... ... 7,145 70 21 ... Turkey 18,306 30,451 162 ... 4,017 3,713 17,704 109 Ukraine 1,691 1,767 48 ... 6,462 589 2,356 81
Res. Serbia & Montenegro – 1 – ... ... ... – ... Residual Europe – – ... ... ... ... – 1
Latin America/Caribbean 37,810 5 421 315 6,528 60,058 29,162 13,257 Argentina 1,232 – 6 ... 326 861 1,551 458 Belize 9 – – ... 19 ... 103 252 Bolivia 27 – ... ... 3 76 22 ... Bonaire, Saint Eustatius and Sa – ... ... ... ... ... ... ... Brazil 16,527 – 71 ... 3,427 44,648 13,075 10,753 Chile 4,542 – 125 ... 813 2,000 3,205 270
Colombia 707 1 6 ... 131 1,077 40 67 Costa Rica 369 – – ... 15 32 105 11 Cuba 184 – ... ... 82 – 70 5 Dominica – – ... ... ... ... 17 ... Dominican Republic 541 – 1 ... 3 ... 66 9
Ecuador 151 4 – ... 28 24 9 26 El Salvador 123 – – ... ... ... 14 4 Falkland Islands 5 – ... ... ... ... – ... Grenada – – ... ... ... ... 2 1 Guatemala 209 – 3 ... 10 ... 81 2
Guyana – – – ... ... ... 2 1 Haiti – – – ... ... ... 10 ... Honduras 273 – 2 ... 4 ... 82 ... Jamaica 230 – – ... 13 34 59 15 Mexico 9,439 – 186 ... 1,229 8,038 9,975 301
Nicaragua 9 – – ... 2 – 72 ... Paraguay 37 – 1 ... 12 ... 73 6 Peru 930 – 10 ... 220 1,793 229 19 St. Lucia 25 – – ... ... ... 1 ... St. Vincent 116 – ... ... 2 ... 22 ...
Surinam – – – ... ... ... 7 ... Trinidad and Tobago 1,444 – 1 ... ... 80 85 1 Turks and Caicos 158 – ... ... ... ... 3 ... Uruguay 115 – 3 ... 16 420 143 13 Venezuela 408 – 6 ... 150 975 39 765
Residual – – ... ... ... ... – 278 Int. organisations 7,541 32 ... ... 4,663 ... 2,074 410 Unallocated – – 268 ... 391 ... – ...
BIS Quarterly Review, June 2011 A 95

Table 9D (Cont.)
End-December 2010Spain Sweden Switzerland Turkey United United
Claims vis-à-vis Kingdom StatesAll countries 1,373,201 721,013 1,736,486 23,605 3,866,503 3,154,137 Developed countries 885,454 616,837 1,456,560 20,224 2,467,335 2,178,696 Europe 675,305 576,005 564,756 15,262 1,087,097 1,616,940
Austria 4,397 1,143 11,808 205 6,370 9,420 Andorra 1,166 2 22 1 17 ... Belgium 5,412 3,439 12,848 406 25,010 30,875 Cyprus 83 1,298 1,599 ... 2,885 988 Denmark 1,546 158,677 10,596 11 14,021 27,842
Finland 2,736 121,991 4,077 1 3,942 11,601 France 27,376 12,794 69,176 1,578 269,088 256,535 Germany 41,918 77,171 101,825 4,152 174,451 236,155 Greece 974 145 2,864 107 14,060 7,318 Iceland 347 132 629 3 759 1,544
Ireland 10,025 4,345 14,059 61 135,240 50,943 Italy 31,226 1,094 18,304 439 66,387 36,749 Liechtenstein 2 22 ... – 722 ... Luxembourg 8,077 6,673 41,993 363 28,692 22,768 Malta 165 117 433 788 6,217 184
Netherlands 17,510 8,652 45,479 3,110 123,444 95,435 Norway 5,213 127,326 4,549 61 14,007 21,780 Portugal 84,622 364 2,857 1 24,345 5,273 Slovakia 93 130 41 – 629 583 Slovenia 113 3 136 – 219 216
Spain – 3,556 18,064 440 107,157 47,196 Sweden 2,104 ... 12,259 166 19,033 22,803 Switzerland 12,958 3,327 ... 579 50,400 79,632 United Kingdom 417,242 43,516 191,134 2,790 ... 651,100 Vatican – – – – ... ...
Other – 88 4 – – ...
Other developed countries 210,149 40,832 891,804 4,962 1,380,238 561,756 Australia 4,153 2,299 35,336 20 94,933 100,937 Canada 1,701 2,225 24,096 23 89,966 118,538 Japan 1,868 834 99,446 137 152,827 335,940 New Zealand 189 64 1,233 1 7,436 5,193 United States 202,238 35,410 731,693 4,781 1,035,076 ...
Offshore centres 20,975 20,497 131,226 449 518,070 266,154 Aruba 11 – 165 – 30 ... Bahamas 259 313 4,493 – 1,279 10,051 Bahrain 28 1 627 219 6,868 3,496 Barbados 3 2 81 – 955 287 Bermuda 423 2,957 5,569 – 9,191 12,572
Cayman Islands 8,357 9,346 55,007 148 65,588 132,930
Curacao 199 ... 832 2 ... 1,032 Gibraltar 27 414 414 – 3,488 106 Guernsey 944 381 7,765 – 8,728 ... Hong Kong SAR 4,945 1,066 13,009 – 261,614 42,623 Isle of Man 916 178 372 – 10,592 ...
Jersey 1,247 1,774 5,810 – 40,402 ... Lebanon – 6 722 10 1,420 619 Macau SAR 82 – 41 – 1,332 456 Mauritius 112 5 218 – 3,336 519 Netherlands Antilles ... – ... – ... –
Panama 2,040 140 2,933 58 7,215 2,206 Samoa – – 79 – 117 163 Singapore 479 3,346 20,534 – 76,580 46,803 Sint Maarten ... ... ... – ... ... Vanuatu – – 15 – 3 1 West Indies UK 903 568 12,540 12 17,192 12,290
A 96 BIS Quarterly Review, June 2011
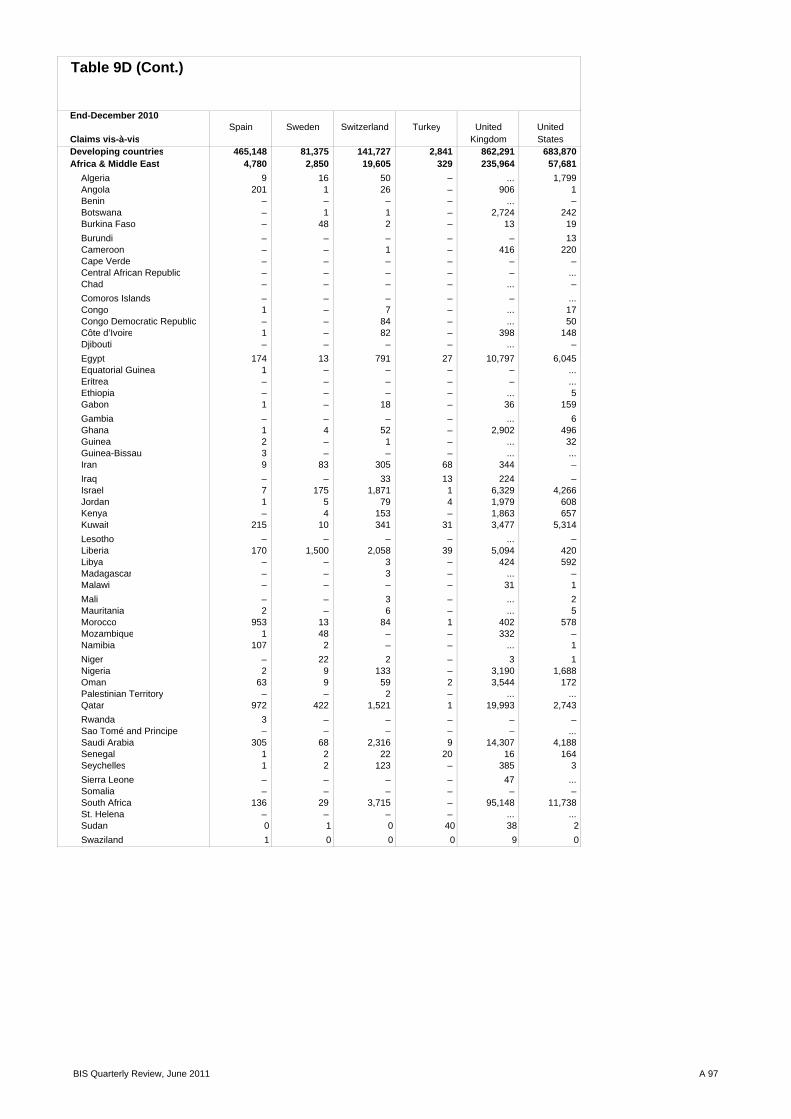
Table 9D (Cont.)
End-December 2010Spain Sweden Switzerland Turkey United United
Claims vis-à-vis Kingdom StatesDeveloping countries 465,148 81,375 141,727 2,841 862,291 683,870 Africa & Middle East 4,780 2,850 19,605 329 235,964 57,681
Algeria 9 16 50 – ... 1,799 Angola 201 1 26 – 906 1 Benin – – – – ... – Botswana – 1 1 – 2,724 242 Burkina Faso – 48 2 – 13 19
Burundi – – – – – 13 Cameroon – – 1 – 416 220 Cape Verde – – – – – – Central African Republic – – – – – ... Chad – – – – ... –
Comoros Islands – – – – – ... Congo 1 – 7 – ... 17 Congo Democratic Republic – – 84 – ... 50 Côte d’Ivoire 1 – 82 – 398 148 Djibouti – – – – ... –
Egypt 174 13 791 27 10,797 6,045 Equatorial Guinea 1 – – – – ... Eritrea – – – – – ... Ethiopia – – – – ... 5 Gabon 1 – 18 – 36 159
Gambia – – – – ... 6 Ghana 1 4 52 – 2,902 496 Guinea 2 – 1 – ... 32 Guinea-Bissau 3 – – – ... ... Iran 9 83 305 68 344 –
Iraq – – 33 13 224 – Israel 7 175 1,871 1 6,329 4,266 Jordan 1 5 79 4 1,979 608 Kenya – 4 153 – 1,863 657 Kuwait 215 10 341 31 3,477 5,314
Lesotho – – – – ... – Liberia 170 1,500 2,058 39 5,094 420 Libya – – 3 – 424 592 Madagascar – – 3 – ... – Malawi – – – – 31 1
Mali – – 3 – ... 2 Mauritania 2 – 6 – ... 5 Morocco 953 13 84 1 402 578 Mozambique 1 48 – – 332 – Namibia 107 2 – – ... 1
Niger – 22 2 – 3 1 Nigeria 2 9 133 – 3,190 1,688 Oman 63 9 59 2 3,544 172 Palestinian Territory – – 2 – ... ... Qatar 972 422 1,521 1 19,993 2,743
Rwanda 3 – – – – – Sao Tomé and Principe – – – – – ... Saudi Arabia 305 68 2,316 9 14,307 4,188 Senegal 1 2 22 20 16 164 Seychelles 1 2 123 – 385 3
Sierra Leone – – – – 47 ... Somalia – – – – – – South Africa 136 29 3,715 – 95,148 11,738 St. Helena – – – – ... ... Sudan 0 1 0 40 38 2
Swaziland 1 0 0 0 9 0
BIS Quarterly Review, June 2011 A 97

Table 9D (Cont.)
End-December 2010Spain Sweden Switzerland Turkey United United
Claims vis-à-vis Kingdom States
Syria – 2 41 1 25 3 Tanzania – 1 6 – 1,285 261 Togo – – 1 – ... 10 Tunisia 14 13 31 3 119 500 Uganda – 52 2 – 473 257
United Arab Emirates 1,423 293 5,512 69 56,208 13,740 Yemen – 1 4 – 171 1 Zambia – – 59 – 1,998 513 Zimbabwe – 1 2 – 139 1 Residual – ... – – ... ...
Asia & Pacific 10,377 4,756 67,666 528 430,710 319,542 Afghanistan – – – – ... 1 Armenia 1 – – – 377 – Azerbaijan – – 203 305 166 231 Bangladesh – 27 41 – 3,754 771 Bhutan – 11 – – 2 ...
British Overseas Territories – – – – 3 ... Brunei – – 1 – 1,791 166 Cambodia – – 1 – 53 11 China 8,503 2,589 14,990 4 104,627 68,316 Chinese Taipei 92 12 9,977 1 47,787 44,396
Fiji – – 14 – 33 3 French Polynesia – – 1 – ... 5 Georgia – 2 76 37 645 220 India 551 178 10,892 17 84,183 67,624 Indonesia 7 89 3,019 – 14,110 12,738
Kazakhstan 5 30 1,492 44 3,446 2,143 Kiribati – – – – – ... Kyrgyz Republic – – 1 4 – ... Laos – 1 – – ... – Malaysia – 31 1,908 – 39,236 15,951
Maldives – 7 2 – 352 – Marshall Islands 67 1,264 2,186 92 4,512 ... Micronesia – – – – – ... Mongolia – – 11 – 9 163 Myanmar – – – – ... –
Nauru – – – – ... ... Nepal – – 1 – 280 6 New Caledonia – – – – ... 17 North Korea – – – – – ... Pakistan 1 2 2,832 – 5,672 1,404
Palau – – – – – ... Papua New Guinea – – 26 – 3 113 Philippines 3 21 1,841 – 6,890 6,611 Solomon Islands – – – – ... ... South Korea 1,144 177 16,295 24 92,476 86,753
Sri Lanka – 183 41 – 3,424 352 Tajikistan – – – – ... – Thailand 3 53 1,337 – 13,462 10,048 Timor Leste – – – – ... ... Tonga – – – – – ...
Turkmenistan – – – – ... ... Tuvalu – – – – – ... US Pacific Islands – – – – 180 11 Uzbekistan – – 23 – 11 5 Vietnam – 79 455 – 3,095 1,373
Wallis/Futuna – – – – ... ... Residual – ... – – ... 110
A 98 BIS Quarterly Review, June 2011

Table 9D (Cont.)
End-December 2010Spain Sweden Switzerland Turkey United United
Claims vis-à-vis Kingdom StatesEurope 10,027 72,114 19,294 1,953 52,688 69,192
Albania – – 4 11 11 10 Belarus – 15 147 10 6 15 Bosnia and Herzegovina – – 6 – ... 10 Bulgaria 89 3 203 14 91 395 Croatia 65 7 647 – 208 265
Czech Republic 570 103 1,255 – 4,202 3,325 Estonia 10 18,631 41 – 22 79 Hungary 818 261 1,067 6 2,735 7,354
Latvia 16 16,688 63 – 95 50 Lithuania 7 15,265 335 – 191 240 Macedonia, FYR – 2 25 13 – 1 Moldova – – 147 – 9 – Montenegro – – 336 – 6 ...
Poland 6,309 9,523 1,951 – 5,553 13,175 Romania 368 48 238 476 1,987 1,490 Russia 1,559 8,541 7,499 513 12,291 21,208 Serbia 1 22 74 – 33 ... Turkey 210 234 2,953 – 24,685 20,157 Ukraine 5 2,771 2,303 3 560 1,335
Res. Serbia & Montenegro ... – ... – ... 83 Residual Europe – ... – 907 ... ...
Latin America/Caribbean 439,964 1,655 35,162 31 142,929 237,455 Argentina 15,597 4 1,991 – 5,431 5,926 Belize 1 9 322 – 363 8 Bolivia 74 – 4 – 8 11 Bonaire, Saint Eustatius and Sa ... ... ... – ... ... Brazil 181,080 1,145 23,282 29 84,834 87,381 Chile 61,500 100 624 – 3,933 7,835
Colombia 15,175 40 303 – 1,872 10,245 Costa Rica 104 4 64 – 1,379 1,702 Cuba 210 15 – – ... ... Dominica 31 – – – – ... Dominican Republic 210 12 28 – 208 853
Ecuador 174 – 40 – 89 802 El Salvador 31 1 86 – 1,739 2,120 Falkland Islands 3 – – – ... – Grenada – – – – – – Guatemala 44 1 496 – 72 2,070
Guyana – – – – – 3 Haiti 4 – – – ... 113 Honduras 4 1 13 – ... 690 Jamaica 6 – 164 – 150 599 Mexico 136,002 284 5,472 – 37,564 105,416
Nicaragua 1 2 – – ... 244 Paraguay 1,378 – 26 – 402 372 Peru 14,282 29 385 – 2,071 4,936 St. Lucia – – 1 – 19 ... St. Vincent – – 83 2 59 ...
Surinam – – 2 – ... 51 Trinidad and Tobago 37 – 285 – 103 689 Turks and Caicos 1 – 133 – 20 ... Uruguay 2,908 2 298 – 304 757 Venezuela 11,107 6 1,060 – 1,317 3,201
Residual – ... – – ... 1,431 Int. organisations 1,589 137 6,973 – 18,312 8,508 Unallocated 35 2,167 – 91 495 16,909
BIS Quarterly Review, June 2011 A 99

Table 9E: Consolidated foreign claims and other potential exposures - ultimate risk basis 1
On individual countries by nationality of reporting banks / Amounts outstanding2
In millions of US dollars Total of 24 counuropean ban-European b Belgium France Germany Italy End December 2010 Total
of 24 Exposures vis-à-vis countries All countries Foreign claims 25,153,260 17,558,937 7,594,323 385,121 3,074,681 2,940,334 893,662 All countries Public sector 4,664,053 2,951,407 1,712,646 88,825 554,188 284,452 130,646 All countries Banks 5,864,352 4,122,114 1,742,238 128,583 729,096 964,173 179,514 All countries Non-bank private sector 14,381,711 10,246,201 4,135,510 162,559 1,791,689 1,691,709 581,987 All countries Unallocated by sector 243,144 239,215 3,929 5,154 –292 ... 1,515 All countries Other potential exposures 14,266,758 8,207,573 6,059,185 144,958 1,589,212 1,336,918 625,904 All countries Derivatives contracts 3,707,029 3,171,779 535,250 … 321,301 456,077 69,158 All countries Guarantees extended 6,874,132 2,263,980 4,610,152 … 662,805 543,287 112,303 All countries Credit commitments 3,685,597 2,771,814 913,783 … 605,106 337,554 444,443
Australia Foreign claims 543,223 296,922 246,301 2,353 26,839 39,286 3,208 Australia Public sector 74,708 15,791 58,917 3 925 589 ... Australia Banks 147,427 71,056 76,371 839 7,887 10,478 891 Australia Non-bank private sector 320,589 209,578 111,011 1,501 18,027 28,219 2,317 Australia Unallocated by sector 499 497 2 10 ... ... ... Australia Other potential exposures 269,654 116,478 153,176 1,518 14,059 21,474 828 Australia Derivatives contracts 75,329 51,025 24,304 … 5,205 7,364 73 Australia Guarantees extended 119,176 17,237 101,939 … 1,815 8,839 365 Australia Credit commitments 75,149 48,216 26,933 … 7,039 5,271 390
Austria Foreign claims 264,774 245,979 18,795 3,212 18,563 84,883 102,357 Austria Public sector 56,754 50,485 6,269 1,685 6,040 19,139 14,415 Austria Banks 101,481 93,556 7,925 1,446 8,312 52,887 11,015 Austria Non-bank private sector 106,414 101,812 4,602 80 4,211 12,857 76,926 Austria Unallocated by sector 125 126 –1 1 ... ... 1 Austria Other potential exposures 104,846 57,783 47,063 467 5,882 17,009 17,874 Austria Derivatives contracts 29,479 21,660 7,819 … 1,609 4,458 2,708 Austria Guarantees extended 62,420 24,995 37,425 … 2,562 10,308 10,456 Austria Credit commitments 12,947 11,128 1,819 … 1,711 2,243 4,710
Belgium Foreign claims 473,598 419,847 53,751 . 201,924 44,024 4,211 Belgium Public sector 103,962 88,612 15,350 . 49,813 9,499 478 Belgium Banks 109,683 89,547 20,136 . 35,275 20,087 1,292 Belgium Non-bank private sector 258,924 240,659 18,265 . 116,836 14,438 2,441 Belgium Unallocated by sector 1,029 1,029 – . ... ... ... Belgium Other potential exposures 244,703 210,632 34,071 . 106,380 18,646 4,812 Belgium Derivatives contracts 52,039 48,506 3,533 … 6,606 4,490 637 Belgium Guarantees extended 80,629 54,962 25,667 … 37,613 8,299 654 Belgium Credit commitments 112,035 107,164 4,871 … 62,161 5,857 3,521
Brazil Foreign claims 497,795 359,235 138,560 124 24,499 16,527 3,427 Brazil Public sector 185,019 125,611 59,408 1 4,630 464 431 Brazil Banks 78,755 51,112 27,643 101 7,261 8,878 2,423 Brazil Non-bank private sector 232,585 181,151 51,434 23 12,608 7,185 573 Brazil Unallocated by sector 1,436 1,361 75 –1 ... ... ... Brazil Other potential exposures 188,693 124,869 63,824 13 9,316 9,298 548 Brazil Derivatives contracts 12,906 6,754 6,152 … 585 1,394 5 Brazil Guarantees extended 75,753 31,783 43,970 … 1,130 7,473 404 Brazil Credit commitments 100,034 86,332 13,702 … 7,601 431 139
Canada Foreign claims 425,008 231,153 193,855 1,946 27,038 28,558 3,260 Canada Public sector 101,051 63,608 37,443 149 8,531 7,013 1,377 Canada Banks 82,918 49,177 33,741 1,617 4,058 8,393 783 Canada Non-bank private sector 240,430 117,769 122,661 181 14,449 13,152 1,100 Canada Unallocated by sector 609 599 10 –1 ... ... ... Canada Other potential exposures 222,734 107,088 115,646 174 30,297 23,563 680 Canada Derivatives contracts 68,285 51,492 16,793 … 7,622 13,684 156 Canada Guarantees extended 84,828 22,570 62,258 … 12,688 3,815 152 Canada Credit commitments 69,621 33,026 36,595 … 9,987 6,064 372
Cayman Islands Foreign claims 547,535 231,154 316,381 2,932 25,520 44,129 5,994 Cayman Islands Public sector 2,040 1,438 602 ... ... ... ... Cayman Islands Banks 12,881 10,170 2,711 38 772 964 605 Cayman Islands Non-bank private sector 510,357 197,288 313,069 2,892 24,748 43,165 5,382 Cayman Islands Unallocated by sector 22,257 22,258 –1 2 ... ... 7 Cayman Islands Other potential exposures 165,856 83,404 82,452 618 21,338 21,972 1,485 Cayman Islands Derivatives contracts 53,858 33,558 20,300 … 7,710 5,955 ... Cayman Islands Guarantees extended 76,330 21,614 54,716 … 9,903 6,308 24 Cayman Islands Credit commitments 35,668 28,232 7,436 … 3,725 9,709 1,461
China Foreign claims 354,726 191,980 162,746 1,043 24,162 17,625 3,960 China Public sector 39,530 19,661 19,869 27 1,829 1,205 46 China Banks 170,736 90,958 79,778 427 9,246 8,528 3,120 China Non-bank private sector 144,411 81,333 63,078 589 13,087 7,892 794 China Unallocated by sector 49 28 21 ... ... ... ... China Other potential exposures 86,950 44,275 42,675 556 10,967 9,337 1,885 China Derivatives contracts 13,202 7,897 5,305 … 1,642 1,614 9 China Guarantees extended 47,260 21,556 25,704 … 3,518 6,173 1,721 China Credit commitments 26,488 14,822 11,666 … 5,807 1,550 155
6 Claims of Spanish banks, mainly vis-à-vis Portugal, are currently under review and are subject to revisions.
European
banks3
Non-Europ.
banks4Belgium France Germany5 Italy
5 Claims of German banks on developed countries are on an immediate borrower basis.
1 Other potential exposures consist of derivatives contracts at positive market value, guarantees extended and credit commitments.2 Exposures of banking groups vis-à-vis the home country are not included, as these are not foreign exposures. 3 Austria, Belgium, Finland, France, Germany, Greece, Ireland, Italy, Netherlands, Norway, Portugal, Spain, Sweden, Switzerland, Turkey, United Kingdom4 Australia, Canada, Chile, India, Japan, United States, Chinese Taipei, Singapore
A 100 BIS Quarterly Review, June 2011
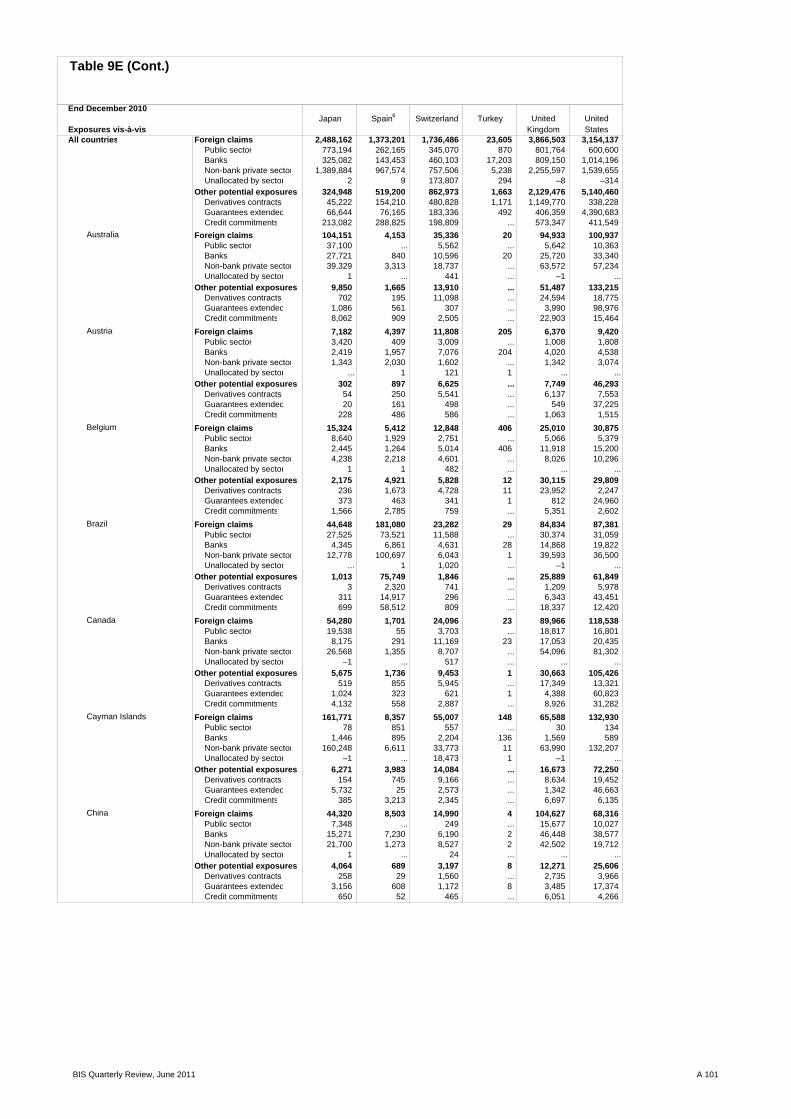
Table 9E (Cont.)
Japan Spain Switzerland Turkey United KingdomUnited States End December 2010
Exposures vis-à-vis All countries Foreign claims 2,488,162 1,373,201 1,736,486 23,605 3,866,503 3,154,137 All countries Public sector 773,194 262,165 345,070 870 801,764 600,600 All countries Banks 325,082 143,453 460,103 17,203 809,150 1,014,196 All countries Non-bank private sector 1,389,884 967,574 757,506 5,238 2,255,597 1,539,655 All countries Unallocated by sector 2 9 173,807 294 –8 –314 All countries Other potential exposures 324,948 519,200 862,973 1,663 2,129,476 5,140,460 All countries Derivatives contracts 45,222 154,210 480,828 1,171 1,149,770 338,228 All countries Guarantees extended 66,644 76,165 183,336 492 406,359 4,390,683 All countries Credit commitments 213,082 288,825 198,809 ... 573,347 411,549
Australia Foreign claims 104,151 4,153 35,336 20 94,933 100,937 Australia Public sector 37,100 ... 5,562 ... 5,642 10,363 Australia Banks 27,721 840 10,596 20 25,720 33,340 Australia Non-bank private sector 39,329 3,313 18,737 ... 63,572 57,234 Australia Unallocated by sector 1 ... 441 ... –1 ... Australia Other potential exposures 9,850 1,665 13,910 ... 51,487 133,215 Australia Derivatives contracts 702 195 11,098 ... 24,594 18,775 Australia Guarantees extended 1,086 561 307 ... 3,990 98,976 Australia Credit commitments 8,062 909 2,505 ... 22,903 15,464
Austria Foreign claims 7,182 4,397 11,808 205 6,370 9,420 Austria Public sector 3,420 409 3,009 ... 1,008 1,808 Austria Banks 2,419 1,957 7,076 204 4,020 4,538 Austria Non-bank private sector 1,343 2,030 1,602 ... 1,342 3,074 Austria Unallocated by sector ... 1 121 1 ... ... Austria Other potential exposures 302 897 6,625 ... 7,749 46,293 Austria Derivatives contracts 54 250 5,541 ... 6,137 7,553 Austria Guarantees extended 20 161 498 ... 549 37,225 Austria Credit commitments 228 486 586 ... 1,063 1,515
Belgium Foreign claims 15,324 5,412 12,848 406 25,010 30,875 Belgium Public sector 8,640 1,929 2,751 ... 5,066 5,379 Belgium Banks 2,445 1,264 5,014 406 11,918 15,200 Belgium Non-bank private sector 4,238 2,218 4,601 ... 8,026 10,296 Belgium Unallocated by sector 1 1 482 ... ... ... Belgium Other potential exposures 2,175 4,921 5,828 12 30,115 29,809 Belgium Derivatives contracts 236 1,673 4,728 11 23,952 2,247 Belgium Guarantees extended 373 463 341 1 812 24,960 Belgium Credit commitments 1,566 2,785 759 ... 5,351 2,602
Brazil Foreign claims 44,648 181,080 23,282 29 84,834 87,381 Brazil Public sector 27,525 73,521 11,588 ... 30,374 31,059 Brazil Banks 4,345 6,861 4,631 28 14,868 19,822 Brazil Non-bank private sector 12,778 100,697 6,043 1 39,593 36,500 Brazil Unallocated by sector ... 1 1,020 ... –1 ... Brazil Other potential exposures 1,013 75,749 1,846 ... 25,889 61,849 Brazil Derivatives contracts 3 2,320 741 ... 1,209 5,978 Brazil Guarantees extended 311 14,917 296 ... 6,343 43,451 Brazil Credit commitments 699 58,512 809 ... 18,337 12,420
Canada Foreign claims 54,280 1,701 24,096 23 89,966 118,538 Canada Public sector 19,538 55 3,703 ... 18,817 16,801 Canada Banks 8,175 291 11,169 23 17,053 20,435 Canada Non-bank private sector 26,568 1,355 8,707 ... 54,096 81,302 Canada Unallocated by sector –1 ... 517 ... ... ... Canada Other potential exposures 5,675 1,736 9,453 1 30,663 105,426 Canada Derivatives contracts 519 855 5,945 ... 17,349 13,321 Canada Guarantees extended 1,024 323 621 1 4,388 60,823 Canada Credit commitments 4,132 558 2,887 ... 8,926 31,282
Cayman Islands Foreign claims 161,771 8,357 55,007 148 65,588 132,930 Cayman Islands Public sector 78 851 557 ... 30 134 Cayman Islands Banks 1,446 895 2,204 136 1,569 589 Cayman Islands Non-bank private sector 160,248 6,611 33,773 11 63,990 132,207 Cayman Islands Unallocated by sector –1 ... 18,473 1 –1 ... Cayman Islands Other potential exposures 6,271 3,983 14,084 ... 16,673 72,250 Cayman Islands Derivatives contracts 154 745 9,166 ... 8,634 19,452 Cayman Islands Guarantees extended 5,732 25 2,573 ... 1,342 46,663 Cayman Islands Credit commitments 385 3,213 2,345 ... 6,697 6,135
China Foreign claims 44,320 8,503 14,990 4 104,627 68,316 China Public sector 7,348 ... 249 ... 15,677 10,027 China Banks 15,271 7,230 6,190 2 46,448 38,577 China Non-bank private sector 21,700 1,273 8,527 2 42,502 19,712 China Unallocated by sector 1 ... 24 ... ... ... China Other potential exposures 4,064 689 3,197 8 12,271 25,606 China Derivatives contracts 258 29 1,560 ... 2,735 3,966 China Guarantees extended 3,156 608 1,172 8 3,485 17,374 China Credit commitments 650 52 465 ... 6,051 4,266
Turkey United Kingdom
Japan UnitedStates
Spain6 Switzerland
BIS Quarterly Review, June 2011 A 101

Table 9E (Cont.)
End December 2010 Totalof 24
Exposures vis-à-vis countries Belgium France Germany Italy
Chinese Taipei Foreign claims 153,499 84,175 69,324 50 14,752 9,319 126 Chinese Taipe Public sector 58,257 36,280 21,977 3 8,571 4,843 ... Chinese Taipe Banks 26,586 12,864 13,722 45 2,426 2,168 47 Chinese Taipe Non-bank private sector 68,472 34,854 33,618 1 3,755 2,308 79 Chinese Taipe Unallocated by sector 184 177 7 1 ... ... ... Chinese Taipe Other potential exposures 32,256 11,557 20,699 29 2,197 1,441 137 Chinese Taipe Derivatives contracts 5,512 4,185 1,327 … 521 414 ... Chinese Taipe Guarantees extended 8,558 3,633 4,925 … 1,109 1,011 107 Chinese Taipe Credit commitments 18,186 3,739 14,447 … 567 16 30
Czech Republic Foreign claims 182,703 178,650 4,053 45,648 37,104 10,063 15,800 Czech Republic Public sector 41,400 39,402 1,998 20,157 1,180 1,823 3,395 Czech Republic Banks 19,381 19,240 141 3,167 1,541 1,820 963 Czech Republic Non-bank private sector 119,288 117,373 1,915 20,726 34,383 6,420 11,441 Czech Republic Unallocated by sector 2,634 2,635 –1 1,598 ... ... 1 Czech Republic Other potential exposures 47,692 41,017 6,675 7,364 12,003 2,837 3,907 Czech Republic Derivatives contracts 5,272 4,489 783 … 235 727 329 Czech Republic Guarantees extended 17,174 11,622 5,552 … 2,827 1,331 1,561 Czech Republic Credit commitments 25,246 24,906 340 … 8,941 779 2,017
Denmark Foreign claims 297,843 258,561 39,282 1,698 20,981 34,909 2,502 Denmark Public sector 20,902 15,741 5,161 172 2,566 408 14 Denmark Banks 122,704 108,982 13,722 1,444 5,862 15,247 1,457 Denmark Non-bank private sector 121,096 100,697 20,399 81 12,553 19,254 1,032 Denmark Unallocated by sector 33,141 33,141 – 1 ... ... –1 Denmark Other potential exposures 116,741 84,859 31,882 169 6,538 7,912 1,204 Denmark Derivatives contracts 37,458 33,876 3,582 … 1,383 3,924 91 Denmark Guarantees extended 27,510 6,410 21,100 … 1,565 2,425 230 Denmark Credit commitments 51,773 44,573 7,200 … 3,590 1,563 883
Finland Foreign claims 180,690 162,905 17,785 868 7,860 13,773 1,198 Finland Public sector 26,646 22,224 4,422 549 2,235 2,023 195 Finland Banks 42,487 34,731 7,756 261 1,394 6,407 626 Finland Non-bank private sector 111,480 105,875 5,605 58 4,231 5,343 377 Finland Unallocated by sector 77 75 2 ... ... ... ... Finland Other potential exposures 122,493 75,317 47,176 184 5,226 8,933 1,346 Finland Derivatives contracts 30,804 29,593 1,211 … 530 4,365 66 Finland Guarantees extended 60,476 17,360 43,116 … 1,211 3,007 115 Finland Credit commitments 31,213 28,364 2,849 … 3,485 1,561 1,165
France Foreign claims 1,199,879 796,671 403,208 57,357 . 189,401 42,440 France Public sector 213,850 136,396 77,454 4,900 . 21,533 1,911 France Banks 608,514 392,959 215,555 48,295 . 98,571 24,146 France Non-bank private sector 371,860 261,662 110,198 3,954 . 69,297 16,356 France Unallocated by sector 5,655 5,654 1 208 . ... 27 France Other potential exposures 948,574 536,485 412,089 32,326 . 95,167 70,318 France Derivatives contracts 292,443 255,774 36,669 … . 30,949 3,280 France Guarantees extended 432,185 111,438 320,747 … . 42,459 3,768 France Credit commitments 223,946 169,273 54,673 … . 21,759 63,270
Germany Foreign claims 1,674,200 1,242,121 432,079 18,357 260,927 . 257,408 Germany Public sector 477,938 303,073 174,865 3,370 54,750 . 37,405 Germany Banks 541,641 372,494 169,147 11,070 96,136 . 57,307 Germany Non-bank private sector 648,627 560,560 88,067 3,906 110,041 . 162,689 Germany Unallocated by sector 5,994 5,994 – 11 ... . 7 Germany Other potential exposures 1,062,956 662,302 400,654 9,639 108,286 . 106,181 Germany Derivatives contracts 459,717 389,720 69,997 … 39,469 . 26,566 Germany Guarantees extended 394,087 102,049 292,038 … 27,952 . 18,253 Germany Credit commitments 209,152 170,533 38,619 … 40,865 . 61,362
Greece Foreign claims 145,783 136,317 9,466 1,909 56,740 33,974 4,085 Greece Public sector 54,196 52,258 1,938 1,765 14,960 22,651 2,345 Greece Banks 10,918 8,888 2,030 107 2,150 2,241 193 Greece Non-bank private sector 80,575 75,076 5,499 37 39,630 9,082 1,547 Greece Unallocated by sector 94 95 –1 ... ... ... ... Greece Other potential exposures 60,642 26,111 34,531 100 8,307 5,949 1,693 Greece Derivatives contracts 7,052 5,891 1,161 … 1,418 625 326 Greece Guarantees extended 44,312 11,566 32,746 … 4,227 4,533 347 Greece Credit commitments 9,278 8,654 624 … 2,662 791 1,020
Hong Kong SAR Foreign claims 482,679 328,319 154,360 1,285 26,087 9,789 958 Hong Kong SAR Public sector 104,403 84,083 20,320 356 6,237 569 50 Hong Kong SAR Banks 58,060 34,103 23,957 447 3,549 1,668 82 Hong Kong SAR Non-bank private sector 319,153 209,500 109,653 482 16,301 7,552 826 Hong Kong SAR Unallocated by sector 1,063 633 430 ... ... ... ... Hong Kong SAR Other potential exposures 137,284 55,120 82,164 296 5,885 5,153 788 Hong Kong SAR Derivatives contracts 22,207 11,762 10,445 … 407 1,439 272 Hong Kong SAR Guarantees extended 61,676 18,209 43,467 … 1,476 2,757 265 Hong Kong SAR Credit commitments 53,401 25,149 28,252 … 4,002 957 251
European
banks3
Non-Europ.
banks4Belgium France Germany5 Italy
A 102 BIS Quarterly Review, June 2011

Table 9E (Cont.)
End December 2010
Exposures vis-à-vis Japan Spain Switzerland Turkey
Chinese Taipei Foreign claims 12,128 92 9,977 1 47,787 44,396 Chinese Taipe Public sector 1,089 90 1,863 ... 20,452 17,344 Chinese Taipe Banks 1,030 ... 2,952 ... 4,484 9,765 Chinese Taipe Non-bank private sector 10,008 1 4,986 1 22,852 17,287 Chinese Taipe Unallocated by sector 1 1 176 ... –1 ... Chinese Taipe Other potential exposures 2,048 28 1,562 ... 5,459 16,373 Chinese Taipe Derivatives contracts 142 7 983 ... 1,821 965 Chinese Taipe Guarantees extended 1,471 17 367 ... 751 2,558 Chinese Taipe Credit commitments 435 4 212 ... 2,887 12,850
Czech Republic Foreign claims 584 570 1,255 ... 4,202 3,325 Czech Republic Public sector 169 31 22 ... 1,508 1,828 Czech Republic Banks 70 123 479 ... 211 64 Czech Republic Non-bank private sector 345 416 751 ... 2,483 1,433 Czech Republic Unallocated by sector ... ... 3 ... ... ... Czech Republic Other potential exposures 97 51 144 ... 1,283 6,553 Czech Republic Derivatives contracts ... ... 32 ... 543 763 Czech Republic Guarantees extended 97 11 12 ... 288 5,451 Czech Republic Credit commitments ... 40 100 ... 452 339
Denmark Foreign claims 8,096 1,546 10,596 11 14,021 27,842 Denmark Public sector 3,710 ... 572 ... 1,598 721 Denmark Banks 1,966 452 6,219 11 7,807 9,705 Denmark Non-bank private sector 2,420 1,094 3,724 1 4,615 17,416 Denmark Unallocated by sector ... ... 81 –1 1 ... Denmark Other potential exposures 1,389 1,975 3,471 2 10,132 29,989 Denmark Derivatives contracts 34 499 2,854 2 8,150 3,141 Denmark Guarantees extended 118 230 411 ... 230 20,925 Denmark Credit commitments 1,237 1,246 206 ... 1,752 5,923
Finland Foreign claims 4,589 2,736 4,077 1 3,942 11,601 Finland Public sector 1,866 674 1,631 ... 1,049 1,794 Finland Banks 259 84 1,274 1 914 6,921 Finland Non-bank private sector 2,464 1,978 1,139 ... 1,979 2,886 Finland Unallocated by sector ... ... 33 ... ... ... Finland Other potential exposures 1,041 1,430 5,794 1 14,084 45,753 Finland Derivatives contracts 43 696 5,118 ... 10,927 958 Finland Guarantees extended 1 268 313 1 637 43,047 Finland Credit commitments 997 466 363 ... 2,520 1,748
France Foreign claims 97,865 27,376 69,176 1,578 269,088 256,535 France Public sector 36,957 5,691 16,220 ... 44,665 28,772 France Banks 28,064 7,943 21,164 1,444 135,278 162,044 France Non-bank private sector 32,844 13,743 27,304 134 89,144 65,719 France Unallocated by sector ... –1 4,488 ... 1 ... France Other potential exposures 18,525 40,331 44,543 125 192,024 373,401 France Derivatives contracts 2,956 15,872 32,231 122 112,838 23,469 France Guarantees extended 686 3,536 5,128 3 32,163 313,792 France Credit commitments 14,883 20,923 7,184 ... 47,023 36,140
Germany Foreign claims 147,580 41,918 101,825 4,152 174,451 236,155 Germany Public sector 92,140 3,777 22,341 672 56,490 71,365 Germany Banks 25,602 3,241 38,464 3,366 70,797 119,513 Germany Non-bank private sector 29,838 34,898 35,905 104 47,165 45,277 Germany Unallocated by sector ... 2 5,115 10 –1 ... Germany Other potential exposures 16,805 27,199 48,505 105 226,066 365,236 Germany Derivatives contracts 6,663 17,904 33,562 86 162,912 50,669 Germany Guarantees extended 1,474 812 5,067 19 35,922 287,928 Germany Credit commitments 8,668 8,483 9,876 ... 27,232 26,639
Greece Foreign claims 1,631 974 2,864 107 14,060 7,318 Greece Public sector 432 540 667 ... 3,408 1,505 Greece Banks 460 6 460 100 2,586 1,498 Greece Non-bank private sector 739 428 1,686 7 8,065 4,315 Greece Unallocated by sector ... ... 51 ... 1 ... Greece Other potential exposures 80 419 1,519 ... 4,958 34,133 Greece Derivatives contracts 1 101 648 ... 2,295 1,128 Greece Guarantees extended ... 74 94 ... 952 32,685 Greece Credit commitments 79 244 777 ... 1,711 320
Hong Kong SAR Foreign claims 42,321 4,945 13,009 ... 261,614 42,623 Hong Kong SAR Public sector 4,708 1,366 1,582 ... 72,836 9,762 Hong Kong SAR Banks 4,232 1,893 2,276 ... 22,172 9,889 Hong Kong SAR Non-bank private sector 33,381 1,686 8,531 ... 166,605 22,972 Hong Kong SAR Unallocated by sector ... ... 620 ... 1 ... Hong Kong SAR Other potential exposures 12,641 674 4,309 ... 31,951 37,986 Hong Kong SAR Derivatives contracts 598 82 2,254 ... 5,172 1,827 Hong Kong SAR Guarantees extended 2,661 249 772 ... 9,623 34,398 Hong Kong SAR Credit commitments 9,382 343 1,283 ... 17,156 1,761
Japan Spain6 Switzerland Turkey United Kingdom
UnitedStates
BIS Quarterly Review, June 2011 A 103
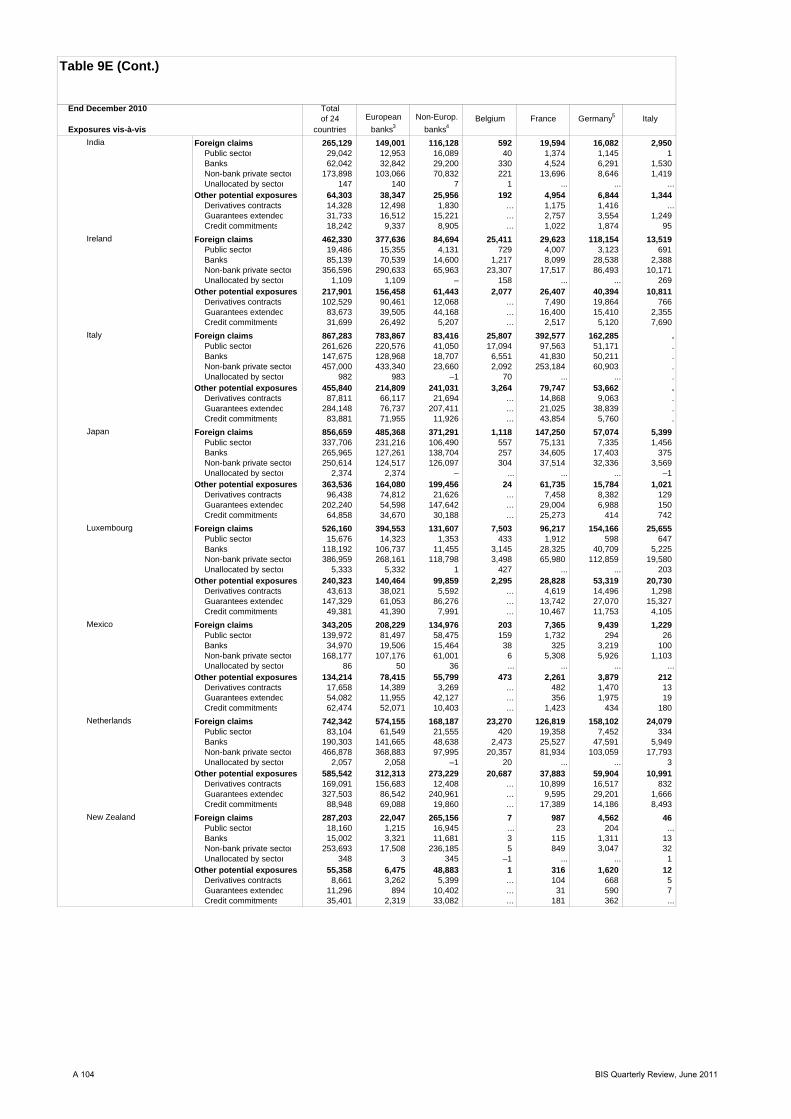
Table 9E (Cont.)
End December 2010 Totalof 24
Exposures vis-à-vis countries Belgium France Germany Italy
India Foreign claims 265,129 149,001 116,128 592 19,594 16,082 2,950 India Public sector 29,042 12,953 16,089 40 1,374 1,145 1 India Banks 62,042 32,842 29,200 330 4,524 6,291 1,530 India Non-bank private sector 173,898 103,066 70,832 221 13,696 8,646 1,419 India Unallocated by sector 147 140 7 1 ... ... ... India Other potential exposures 64,303 38,347 25,956 192 4,954 6,844 1,344 India Derivatives contracts 14,328 12,498 1,830 … 1,175 1,416 ... India Guarantees extended 31,733 16,512 15,221 … 2,757 3,554 1,249 India Credit commitments 18,242 9,337 8,905 … 1,022 1,874 95
Ireland Foreign claims 462,330 377,636 84,694 25,411 29,623 118,154 13,519 Ireland Public sector 19,486 15,355 4,131 729 4,007 3,123 691 Ireland Banks 85,139 70,539 14,600 1,217 8,099 28,538 2,388 Ireland Non-bank private sector 356,596 290,633 65,963 23,307 17,517 86,493 10,171 Ireland Unallocated by sector 1,109 1,109 – 158 ... ... 269 Ireland Other potential exposures 217,901 156,458 61,443 2,077 26,407 40,394 10,811 Ireland Derivatives contracts 102,529 90,461 12,068 … 7,490 19,864 766 Ireland Guarantees extended 83,673 39,505 44,168 … 16,400 15,410 2,355 Ireland Credit commitments 31,699 26,492 5,207 … 2,517 5,120 7,690
Italy Foreign claims 867,283 783,867 83,416 25,807 392,577 162,285 . Italy Public sector 261,626 220,576 41,050 17,094 97,563 51,171 . Italy Banks 147,675 128,968 18,707 6,551 41,830 50,211 . Italy Non-bank private sector 457,000 433,340 23,660 2,092 253,184 60,903 . Italy Unallocated by sector 982 983 –1 70 ... ... . Italy Other potential exposures 455,840 214,809 241,031 3,264 79,747 53,662 . Italy Derivatives contracts 87,811 66,117 21,694 … 14,868 9,063 . Italy Guarantees extended 284,148 76,737 207,411 … 21,025 38,839 . Italy Credit commitments 83,881 71,955 11,926 … 43,854 5,760 .
Japan Foreign claims 856,659 485,368 371,291 1,118 147,250 57,074 5,399 Japan Public sector 337,706 231,216 106,490 557 75,131 7,335 1,456 Japan Banks 265,965 127,261 138,704 257 34,605 17,403 375 Japan Non-bank private sector 250,614 124,517 126,097 304 37,514 32,336 3,569 Japan Unallocated by sector 2,374 2,374 – ... ... ... –1 Japan Other potential exposures 363,536 164,080 199,456 24 61,735 15,784 1,021 Japan Derivatives contracts 96,438 74,812 21,626 … 7,458 8,382 129 Japan Guarantees extended 202,240 54,598 147,642 … 29,004 6,988 150 Japan Credit commitments 64,858 34,670 30,188 … 25,273 414 742
Luxembourg Foreign claims 526,160 394,553 131,607 7,503 96,217 154,166 25,655 Luxembourg Public sector 15,676 14,323 1,353 433 1,912 598 647 Luxembourg Banks 118,192 106,737 11,455 3,145 28,325 40,709 5,225 Luxembourg Non-bank private sector 386,959 268,161 118,798 3,498 65,980 112,859 19,580 Luxembourg Unallocated by sector 5,333 5,332 1 427 ... ... 203 Luxembourg Other potential exposures 240,323 140,464 99,859 2,295 28,828 53,319 20,730 Luxembourg Derivatives contracts 43,613 38,021 5,592 … 4,619 14,496 1,298 Luxembourg Guarantees extended 147,329 61,053 86,276 … 13,742 27,070 15,327 Luxembourg Credit commitments 49,381 41,390 7,991 … 10,467 11,753 4,105
Mexico Foreign claims 343,205 208,229 134,976 203 7,365 9,439 1,229 Mexico Public sector 139,972 81,497 58,475 159 1,732 294 26 Mexico Banks 34,970 19,506 15,464 38 325 3,219 100 Mexico Non-bank private sector 168,177 107,176 61,001 6 5,308 5,926 1,103 Mexico Unallocated by sector 86 50 36 ... ... ... ... Mexico Other potential exposures 134,214 78,415 55,799 473 2,261 3,879 212 Mexico Derivatives contracts 17,658 14,389 3,269 … 482 1,470 13 Mexico Guarantees extended 54,082 11,955 42,127 … 356 1,975 19 Mexico Credit commitments 62,474 52,071 10,403 … 1,423 434 180
Netherlands Foreign claims 742,342 574,155 168,187 23,270 126,819 158,102 24,079 Netherlands Public sector 83,104 61,549 21,555 420 19,358 7,452 334 Netherlands Banks 190,303 141,665 48,638 2,473 25,527 47,591 5,949 Netherlands Non-bank private sector 466,878 368,883 97,995 20,357 81,934 103,059 17,793 Netherlands Unallocated by sector 2,057 2,058 –1 20 ... ... 3 Netherlands Other potential exposures 585,542 312,313 273,229 20,687 37,883 59,904 10,991 Netherlands Derivatives contracts 169,091 156,683 12,408 … 10,899 16,517 832 Netherlands Guarantees extended 327,503 86,542 240,961 … 9,595 29,201 1,666 Netherlands Credit commitments 88,948 69,088 19,860 … 17,389 14,186 8,493
New Zealand Foreign claims 287,203 22,047 265,156 7 987 4,562 46 New Zealand Public sector 18,160 1,215 16,945 ... 23 204 ... New Zealand Banks 15,002 3,321 11,681 3 115 1,311 13 New Zealand Non-bank private sector 253,693 17,508 236,185 5 849 3,047 32 New Zealand Unallocated by sector 348 3 345 –1 ... ... 1 New Zealand Other potential exposures 55,358 6,475 48,883 1 316 1,620 12 New Zealand Derivatives contracts 8,661 3,262 5,399 … 104 668 5 New Zealand Guarantees extended 11,296 894 10,402 … 31 590 7 New Zealand Credit commitments 35,401 2,319 33,082 … 181 362 ...
Germany5 ItalyEuropean
banks3
Non-Europ.
banks4Belgium France
A 104 BIS Quarterly Review, June 2011

Table 9E (Cont.)
End December 2010
Exposures vis-à-vis Japan Spain Switzerland Turkey
India Foreign claims 21,953 551 10,892 17 84,183 67,624 India Public sector 1,697 ... 1,200 ... 9,146 13,530 India Banks 4,549 243 3,210 3 14,201 16,528 India Non-bank private sector 15,707 308 6,343 14 60,837 37,566 India Unallocated by sector ... ... 139 ... –1 ... India Other potential exposures 587 73 2,621 3 18,647 17,539 India Derivatives contracts 32 ... 285 ... 9,473 1,562 India Guarantees extended 424 70 863 3 4,678 13,706 India Credit commitments 131 3 1,473 ... 4,496 2,271
Ireland Foreign claims 20,713 10,025 14,059 61 135,240 50,943 Ireland Public sector 1,169 101 142 ... 4,543 2,187 Ireland Banks 1,882 1,099 3,735 35 18,283 11,588 Ireland Non-bank private sector 17,662 8,825 9,547 26 112,414 37,168 Ireland Unallocated by sector ... ... 635 ... ... ... Ireland Other potential exposures 1,326 3,543 6,982 3 59,243 54,012 Ireland Derivatives contracts 793 2,373 5,163 3 49,545 9,355 Ireland Guarantees extended 110 510 264 ... 2,378 41,733 Ireland Credit commitments 423 660 1,555 ... 7,320 2,924
Italy Foreign claims 40,598 31,226 18,304 439 66,387 36,749 Italy Public sector 28,640 9,461 4,550 ... 11,497 10,955 Italy Banks 4,754 2,544 4,748 421 8,718 12,251 Italy Non-bank private sector 7,204 19,220 8,521 18 46,171 13,543 Italy Unallocated by sector ... 1 485 ... 1 ... Italy Other potential exposures 5,386 16,145 16,583 11 33,759 232,312 Italy Derivatives contracts 33 2,544 13,027 1 19,815 21,423 Italy Guarantees extended 1,286 6,309 715 10 6,242 205,340 Italy Credit commitments 4,067 7,292 2,841 ... 7,702 5,549
Japan Foreign claims . 1,868 99,446 137 152,827 335,940 Japan Public sector . 97 61,132 ... 76,251 91,482 Japan Banks . 1,231 12,041 120 54,251 132,081 Japan Non-bank private sector . 540 23,940 17 22,326 112,377 Japan Unallocated by sector . ... 2,333 ... –1 ... Japan Other potential exposures . 258 37,119 1 44,713 193,276 Japan Derivatives contracts . 44 21,059 1 35,917 19,086 Japan Guarantees extended . 148 14,929 ... 3,040 146,225 Japan Credit commitments . 66 1,131 ... 5,756 27,965
Luxembourg Foreign claims 66,952 8,077 41,993 363 28,692 22,768 Luxembourg Public sector 314 ... 3,977 ... 4,806 1,035 Luxembourg Banks 1,909 939 11,995 275 7,760 4,167 Luxembourg Non-bank private sector 64,729 7,138 21,444 68 16,126 17,566 Luxembourg Unallocated by sector ... ... 4,577 20 ... ... Luxembourg Other potential exposures 2,062 3,485 10,519 ... 13,832 95,581 Luxembourg Derivatives contracts 20 762 4,495 ... 9,460 4,683 Luxembourg Guarantees extended 632 351 1,176 ... 1,099 85,234 Luxembourg Credit commitments 1,410 2,372 4,848 ... 3,273 5,664
Mexico Foreign claims 8,038 136,002 5,472 ... 37,564 105,416 Mexico Public sector 5,551 52,183 1,545 ... 19,176 48,795 Mexico Banks 436 13,041 740 ... 1,188 8,891 Mexico Non-bank private sector 2,051 70,778 3,150 ... 17,200 47,730 Mexico Unallocated by sector ... ... 37 ... ... ... Mexico Other potential exposures 538 42,630 3,539 ... 23,817 52,477 Mexico Derivatives contracts 40 6,492 1,357 ... 3,767 3,150 Mexico Guarantees extended 83 3,104 268 ... 5,362 42,019 Mexico Credit commitments 415 33,034 1,914 ... 14,688 7,308
Netherlands Foreign claims 43,922 17,510 45,479 3,110 123,444 95,435 Netherlands Public sector 9,777 459 6,603 ... 25,015 4,641 Netherlands Banks 9,064 1,906 16,590 1,338 30,150 26,218 Netherlands Non-bank private sector 25,081 15,145 20,534 1,765 68,279 64,576 Netherlands Unallocated by sector ... ... 1,752 7 ... ... Netherlands Other potential exposures 6,144 10,113 24,200 12 140,480 258,813 Netherlands Derivatives contracts 751 4,745 10,469 7 109,526 9,187 Netherlands Guarantees extended 1,440 1,186 10,358 5 14,033 237,598 Netherlands Credit commitments 3,953 4,182 3,373 ... 16,921 12,028
New Zealand Foreign claims 5,031 189 1,233 1 7,436 5,193 New Zealand Public sector 2,703 ... 114 ... 867 1,960 New Zealand Banks 376 67 432 ... 1,163 1,313 New Zealand Non-bank private sector 1,953 122 684 1 5,406 1,920 New Zealand Unallocated by sector –1 ... 3 ... ... ... New Zealand Other potential exposures 663 6 1,324 ... 2,704 8,367 New Zealand Derivatives contracts 90 ... 1,035 ... 1,429 565 New Zealand Guarantees extended 1 ... 82 ... 153 6,878 New Zealand Credit commitments 572 6 207 ... 1,122 924
Switzerland Turkey United Kingdom
UnitedStates
Japan Spain6
BIS Quarterly Review, June 2011 A 105
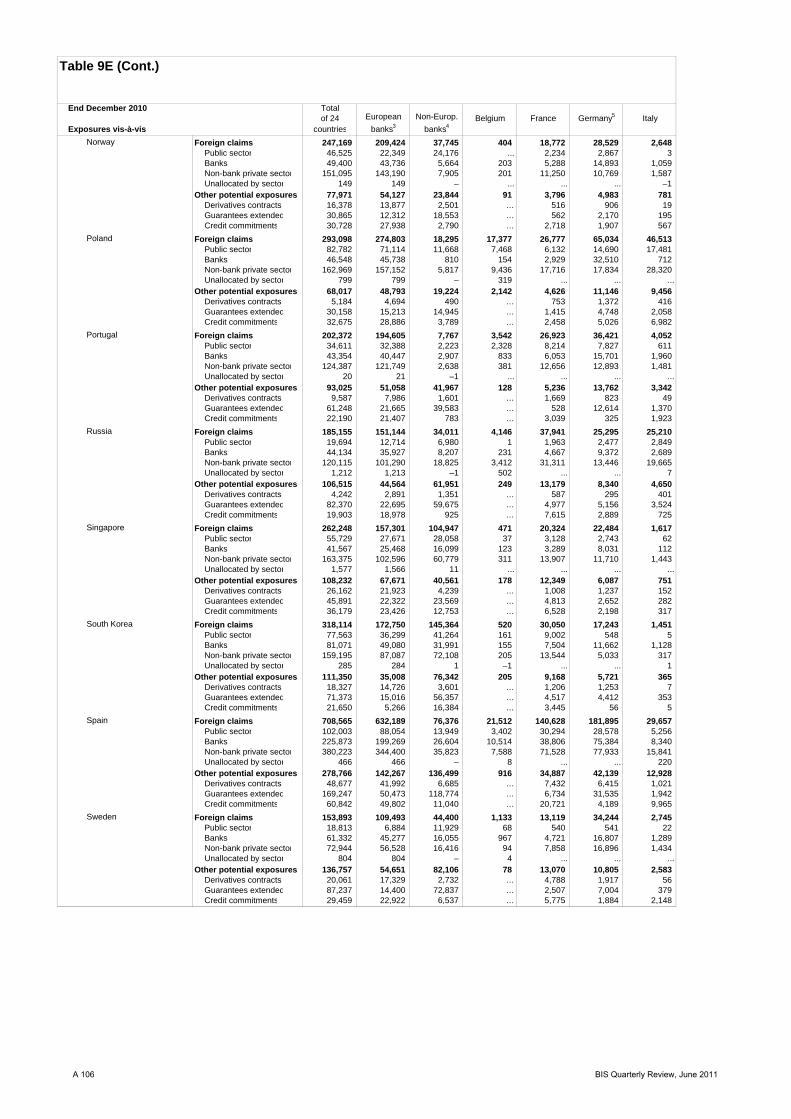
Table 9E (Cont.)
End December 2010 Totalof 24
Exposures vis-à-vis countries Belgium France Germany Italy
Norway Foreign claims 247,169 209,424 37,745 404 18,772 28,529 2,648 Norway Public sector 46,525 22,349 24,176 ... 2,234 2,867 3 Norway Banks 49,400 43,736 5,664 203 5,288 14,893 1,059 Norway Non-bank private sector 151,095 143,190 7,905 201 11,250 10,769 1,587 Norway Unallocated by sector 149 149 – ... ... ... –1 Norway Other potential exposures 77,971 54,127 23,844 91 3,796 4,983 781 Norway Derivatives contracts 16,378 13,877 2,501 … 516 906 19 Norway Guarantees extended 30,865 12,312 18,553 … 562 2,170 195 Norway Credit commitments 30,728 27,938 2,790 … 2,718 1,907 567
Poland Foreign claims 293,098 274,803 18,295 17,377 26,777 65,034 46,513 Poland Public sector 82,782 71,114 11,668 7,468 6,132 14,690 17,481 Poland Banks 46,548 45,738 810 154 2,929 32,510 712 Poland Non-bank private sector 162,969 157,152 5,817 9,436 17,716 17,834 28,320 Poland Unallocated by sector 799 799 – 319 ... ... ... Poland Other potential exposures 68,017 48,793 19,224 2,142 4,626 11,146 9,456 Poland Derivatives contracts 5,184 4,694 490 … 753 1,372 416 Poland Guarantees extended 30,158 15,213 14,945 … 1,415 4,748 2,058 Poland Credit commitments 32,675 28,886 3,789 … 2,458 5,026 6,982
Portugal Foreign claims 202,372 194,605 7,767 3,542 26,923 36,421 4,052 Portugal Public sector 34,611 32,388 2,223 2,328 8,214 7,827 611 Portugal Banks 43,354 40,447 2,907 833 6,053 15,701 1,960 Portugal Non-bank private sector 124,387 121,749 2,638 381 12,656 12,893 1,481 Portugal Unallocated by sector 20 21 –1 ... ... ... ... Portugal Other potential exposures 93,025 51,058 41,967 128 5,236 13,762 3,342 Portugal Derivatives contracts 9,587 7,986 1,601 … 1,669 823 49 Portugal Guarantees extended 61,248 21,665 39,583 … 528 12,614 1,370 Portugal Credit commitments 22,190 21,407 783 … 3,039 325 1,923
Russia Foreign claims 185,155 151,144 34,011 4,146 37,941 25,295 25,210 Russia Public sector 19,694 12,714 6,980 1 1,963 2,477 2,849 Russia Banks 44,134 35,927 8,207 231 4,667 9,372 2,689 Russia Non-bank private sector 120,115 101,290 18,825 3,412 31,311 13,446 19,665 Russia Unallocated by sector 1,212 1,213 –1 502 ... ... 7 Russia Other potential exposures 106,515 44,564 61,951 249 13,179 8,340 4,650 Russia Derivatives contracts 4,242 2,891 1,351 … 587 295 401 Russia Guarantees extended 82,370 22,695 59,675 … 4,977 5,156 3,524 Russia Credit commitments 19,903 18,978 925 … 7,615 2,889 725
Singapore Foreign claims 262,248 157,301 104,947 471 20,324 22,484 1,617 Singapore Public sector 55,729 27,671 28,058 37 3,128 2,743 62 Singapore Banks 41,567 25,468 16,099 123 3,289 8,031 112 Singapore Non-bank private sector 163,375 102,596 60,779 311 13,907 11,710 1,443 Singapore Unallocated by sector 1,577 1,566 11 ... ... ... ... Singapore Other potential exposures 108,232 67,671 40,561 178 12,349 6,087 751 Singapore Derivatives contracts 26,162 21,923 4,239 … 1,008 1,237 152 Singapore Guarantees extended 45,891 22,322 23,569 … 4,813 2,652 282 Singapore Credit commitments 36,179 23,426 12,753 … 6,528 2,198 317
South Korea Foreign claims 318,114 172,750 145,364 520 30,050 17,243 1,451 South Korea Public sector 77,563 36,299 41,264 161 9,002 548 5 South Korea Banks 81,071 49,080 31,991 155 7,504 11,662 1,128 South Korea Non-bank private sector 159,195 87,087 72,108 205 13,544 5,033 317 South Korea Unallocated by sector 285 284 1 –1 ... ... 1 South Korea Other potential exposures 111,350 35,008 76,342 205 9,168 5,721 365 South Korea Derivatives contracts 18,327 14,726 3,601 … 1,206 1,253 7 South Korea Guarantees extended 71,373 15,016 56,357 … 4,517 4,412 353 South Korea Credit commitments 21,650 5,266 16,384 … 3,445 56 5
Spain Foreign claims 708,565 632,189 76,376 21,512 140,628 181,895 29,657 Spain Public sector 102,003 88,054 13,949 3,402 30,294 28,578 5,256 Spain Banks 225,873 199,269 26,604 10,514 38,806 75,384 8,340 Spain Non-bank private sector 380,223 344,400 35,823 7,588 71,528 77,933 15,841 Spain Unallocated by sector 466 466 – 8 ... ... 220 Spain Other potential exposures 278,766 142,267 136,499 916 34,887 42,139 12,928 Spain Derivatives contracts 48,677 41,992 6,685 … 7,432 6,415 1,021 Spain Guarantees extended 169,247 50,473 118,774 … 6,734 31,535 1,942 Spain Credit commitments 60,842 49,802 11,040 … 20,721 4,189 9,965
Sweden Foreign claims 153,893 109,493 44,400 1,133 13,119 34,244 2,745 Sweden Public sector 18,813 6,884 11,929 68 540 541 22 Sweden Banks 61,332 45,277 16,055 967 4,721 16,807 1,289 Sweden Non-bank private sector 72,944 56,528 16,416 94 7,858 16,896 1,434 Sweden Unallocated by sector 804 804 – 4 ... ... ... Sweden Other potential exposures 136,757 54,651 82,106 78 13,070 10,805 2,583 Sweden Derivatives contracts 20,061 17,329 2,732 … 4,788 1,917 56 Sweden Guarantees extended 87,237 14,400 72,837 … 2,507 7,004 379 Sweden Credit commitments 29,459 22,922 6,537 … 5,775 1,884 2,148
Germany5 ItalyEuropean
banks3
Non-Europ.
banks4Belgium France
A 106 BIS Quarterly Review, June 2011

Table 9E (Cont.)
End December 2010
Exposures vis-à-vis Japan Spain Switzerland Turkey
Norway Foreign claims 11,944 5,213 4,549 61 14,007 21,780 Norway Public sector 7,380 ... 286 ... 7,395 16,621 Norway Banks 2,271 156 2,903 58 2,256 2,005 Norway Non-bank private sector 2,294 5,057 1,338 3 4,355 3,154 Norway Unallocated by sector –1 ... 22 ... 1 ... Norway Other potential exposures 365 1,487 2,805 ... 5,850 22,839 Norway Derivatives contracts 105 28 2,345 ... 3,544 2,048 Norway Guarantees extended 21 39 60 ... 420 18,392 Norway Credit commitments 239 1,420 400 ... 1,886 2,399
Poland Foreign claims 4,939 6,309 1,951 ... 5,553 13,175 Poland Public sector 3,956 593 167 ... 2,693 7,683 Poland Banks 144 154 1,268 ... 443 625 Poland Non-bank private sector 839 5,562 486 ... 2,417 4,867 Poland Unallocated by sector ... ... 30 ... ... ... Poland Other potential exposures 920 385 815 ... 2,506 18,220 Poland Derivatives contracts 4 9 95 ... 1,144 418 Poland Guarantees extended 549 21 16 ... 725 14,386 Poland Credit commitments 367 355 704 ... 637 3,416
Portugal Foreign claims 2,153 84,622 2,857 1 24,345 5,273 Portugal Public sector 1,120 8,451 468 ... 2,146 1,102 Portugal Banks 260 7,389 1,008 ... 4,657 2,470 Portugal Non-bank private sector 773 68,782 1,365 ... 17,541 1,701 Portugal Unallocated by sector ... ... 16 1 1 ... Portugal Other potential exposures 565 20,654 1,000 ... 4,718 41,227 Portugal Derivatives contracts ... 2,346 582 ... 2,395 1,528 Portugal Guarantees extended 106 4,301 40 ... 797 39,448 Portugal Credit commitments 459 14,007 378 ... 1,526 251
Russia Foreign claims 9,919 1,559 7,499 513 12,291 21,208 Russia Public sector 1,839 ... 217 ... 2,802 5,040 Russia Banks 1,732 239 2,270 319 4,811 5,337 Russia Non-bank private sector 6,348 1,320 4,851 169 4,678 10,831 Russia Unallocated by sector ... ... 161 25 ... ... Russia Other potential exposures 768 324 2,308 ... 3,244 60,939 Russia Derivatives contracts 71 ... 111 ... 1,018 1,241 Russia Guarantees extended 400 140 236 ... 1,116 59,189 Russia Credit commitments 297 184 1,961 ... 1,110 509
Singapore Foreign claims 32,848 479 20,534 ... 76,580 46,803 Singapore Public sector 5,873 11 3,600 ... 17,413 14,453 Singapore Banks 4,273 33 3,036 ... 8,734 8,848 Singapore Non-bank private sector 22,702 435 12,420 ... 50,433 23,502 Singapore Unallocated by sector ... ... 1,478 ... ... ... Singapore Other potential exposures 7,532 419 6,141 3 31,197 26,214 Singapore Derivatives contracts 525 8 2,897 ... 12,851 2,126 Singapore Guarantees extended 4,947 383 2,367 3 6,096 16,487 Singapore Credit commitments 2,060 28 877 ... 12,250 7,601
South Korea Foreign claims 34,993 1,144 16,295 24 92,476 86,753 South Korea Public sector 5,417 130 6,244 ... 17,729 31,593 South Korea Banks 8,239 410 3,882 24 18,258 13,118 South Korea Non-bank private sector 21,336 604 5,893 ... 56,488 42,042 South Korea Unallocated by sector 1 ... 276 ... 1 ... South Korea Other potential exposures 3,324 511 3,218 75 11,191 67,637 South Korea Derivatives contracts 554 111 2,628 ... 6,583 2,399 South Korea Guarantees extended 1,740 396 430 75 3,439 51,043 South Korea Credit commitments 1,030 4 160 ... 1,169 14,195
Spain Foreign claims 23,506 . 18,064 440 107,157 47,196 Spain Public sector 8,869 . 2,507 ... 9,589 3,765 Spain Banks 4,808 . 7,896 439 21,106 19,506 Spain Non-bank private sector 9,829 . 7,491 1 76,462 23,925 Spain Unallocated by sector ... . 170 ... ... ... Spain Other potential exposures 3,684 . 7,591 10 30,594 131,682 Spain Derivatives contracts 235 . 4,081 ... 17,692 5,885 Spain Guarantees extended 432 . 684 10 4,790 118,059 Spain Credit commitments 3,017 . 2,826 ... 8,112 7,738
Sweden Foreign claims 17,743 2,104 12,259 166 19,033 22,803 Sweden Public sector 6,941 ... 2,144 ... 1,578 3,174 Sweden Banks 3,110 324 5,321 162 7,317 11,636 Sweden Non-bank private sector 7,692 1,780 4,646 ... 10,138 7,993 Sweden Unallocated by sector ... ... 148 4 ... ... Sweden Other potential exposures 1,432 1,449 4,316 ... 14,321 79,888 Sweden Derivatives contracts 44 63 2,164 ... 6,126 2,437 Sweden Guarantees extended 44 171 1,355 ... 1,791 72,363 Sweden Credit commitments 1,344 1,215 797 ... 6,404 5,088
Switzerland Turkey United Kingdom
UnitedStates
Japan Spain6
BIS Quarterly Review, June 2011 A 107

Table 9E (Cont.)
End December 2010 Totalof 24
Exposures vis-à-vis countries Belgium France Germany Italy
Switzerland Foreign claims 357,929 235,837 122,092 1,876 55,017 54,542 12,220 Switzerland Public sector 45,722 38,788 6,934 18 5,082 6,957 80 Switzerland Banks 148,412 81,222 67,190 1,115 17,851 21,702 3,844 Switzerland Non-bank private sector 163,423 115,462 47,961 711 32,084 25,883 8,200 Switzerland Unallocated by sector 372 365 7 32 ... ... 96 Switzerland Other potential exposures 316,349 218,323 98,026 2,950 42,735 39,988 12,016 Switzerland Derivatives contracts 105,047 87,419 17,628 … 4,601 13,960 615 Switzerland Guarantees extended 136,875 71,560 65,315 … 17,689 18,024 2,786 Switzerland Credit commitments 74,427 59,344 15,083 … 20,445 8,004 8,615
Turkey Foreign claims 152,509 126,471 26,038 2,282 23,873 18,306 4,017 Turkey Public sector 29,858 22,842 7,016 37 3,862 1,565 505 Turkey Banks 40,598 26,633 13,965 2,045 5,961 7,212 1,315 Turkey Non-bank private sector 81,938 76,881 5,057 199 14,050 9,529 2,173 Turkey Unallocated by sector 115 115 – 1 ... ... 24 Turkey Other potential exposures 106,391 46,068 60,323 663 10,004 10,246 3,671 Turkey Derivatives contracts 3,173 2,532 641 … 630 516 148 Turkey Guarantees extended 82,802 26,256 56,546 … 5,732 7,968 2,943 Turkey Credit commitments 20,416 17,280 3,136 … 3,642 1,762 580
United Kingdom Foreign claims 2,824,309 1,788,956 1,035,353 37,013 281,450 465,682 46,050 United Kingdom Public sector 203,219 86,389 116,830 601 10,633 4,195 1,043 United Kingdom Banks 855,545 558,951 296,594 14,263 145,611 159,714 19,012 United Kingdom Non-bank private sector 1,742,676 1,121,005 621,671 21,976 125,206 301,773 25,992 United Kingdom Unallocated by sector 22,869 22,611 258 173 ... ... 3 United Kingdom Other potential exposures 2,643,989 1,267,414 1,376,575 22,163 306,648 217,789 178,634 United Kingdom Derivatives contracts 698,275 584,274 114,001 … 39,471 132,782 21,640 United Kingdom Guarantees extended 1,448,567 327,421 1,121,146 … 208,799 32,553 3,730 United Kingdom Credit commitments 497,147 355,719 141,428 … 58,378 52,454 153,264
United States Foreign claims 5,176,395 3,439,174 1,737,221 37,675 529,732 491,136 35,143 United States Public sector 1,009,465 479,627 529,838 10,034 65,197 18,245 4,469 United States Banks 853,949 668,947 185,002 11,063 111,282 113,065 7,986 United States Non-bank private sector 3,212,338 2,189,994 1,022,344 16,516 353,253 359,826 22,688 United States Unallocated by sector 100,643 100,606 37 62 ... ... ... United States Other potential exposures 2,547,886 2,197,535 350,351 24,291 433,298 374,399 98,223 United States Derivatives contracts 910,444 854,860 55,584 … 122,663 119,118 4,746 United States Guarantees extended 675,061 608,956 66,105 … 151,467 123,848 12,877 United States Credit commitments 962,381 733,719 228,662 … 159,168 131,433 80,600
Germany5 ItalyEuropean
banks3
Non-Europ.
banks4Belgium France
A 108 BIS Quarterly Review, June 2011

Table 9E (Cont.)
End December 2010
Exposures vis-à-vis Japan Spain Switzerland Turkey
Switzerland Foreign claims 25,850 12,958 . 579 50,400 79,632 Switzerland Public sector 788 5,493 . ... 14,443 5,835 Switzerland Banks 7,135 2,981 . 532 16,142 50,868 Switzerland Non-bank private sector 17,926 4,484 . 47 19,815 22,929 Switzerland Unallocated by sector 1 ... . ... ... ... Switzerland Other potential exposures 7,216 7,557 . 118 74,742 78,966 Switzerland Derivatives contracts 2,132 2,156 . 56 49,484 8,899 Switzerland Guarantees extended 1,438 1,264 . 62 15,057 61,473 Switzerland Credit commitments 3,646 4,137 . ... 10,201 8,594
Turkey Foreign claims 3,713 210 2,953 . 24,685 20,157 Turkey Public sector 2,040 1 327 . 5,011 4,970 Turkey Banks 1,106 128 1,491 . 5,295 11,201 Turkey Non-bank private sector 567 82 1,111 . 14,379 3,986 Turkey Unallocated by sector ... –1 24 . ... ... Turkey Other potential exposures 54 62 2,353 . 6,965 58,301 Turkey Derivatives contracts ... 3 111 . 725 637 Turkey Guarantees extended 50 42 269 . 916 56,444 Turkey Credit commitments 4 17 1,973 . 5,324 1,220
United Kingdom Foreign claims 158,250 417,242 191,134 2,790 . 651,100 United Kingdom Public sector 40,012 39,023 24,831 ... . 47,751 United Kingdom Banks 44,229 52,173 69,461 2,165 . 185,943 United Kingdom Non-bank private sector 74,009 326,047 75,008 543 . 417,406 United Kingdom Unallocated by sector ... –1 21,834 82 . ... United Kingdom Other potential exposures 28,888 128,441 228,883 778 . 1,220,736 United Kingdom Derivatives contracts 8,673 64,684 152,700 744 . 65,213 United Kingdom Guarantees extended 5,284 12,304 50,362 34 . 1,064,710 United Kingdom Credit commitments 14,931 51,453 25,821 ... . 90,813
United States Foreign claims 1,071,021 202,238 731,693 4,781 1,035,076 . United States Public sector 364,846 27,665 138,936 190 184,097 . United States Banks 82,838 17,483 165,790 4,493 169,403 . United States Non-bank private sector 623,337 157,090 326,740 82 681,576 . United States Unallocated by sector ... ... 100,227 16 ... . United States Other potential exposures 153,405 82,405 277,058 332 761,519 . United States Derivatives contracts 14,980 20,220 128,572 127 381,528 . United States Guarantees extended 22,675 12,487 71,758 205 191,915 . United States Credit commitments 115,750 49,698 76,728 ... 188,076 .
Switzerland Turkey United Kingdom
UnitedStates
Japan Spain6
BIS Quarterly Review, June 2011 A 109
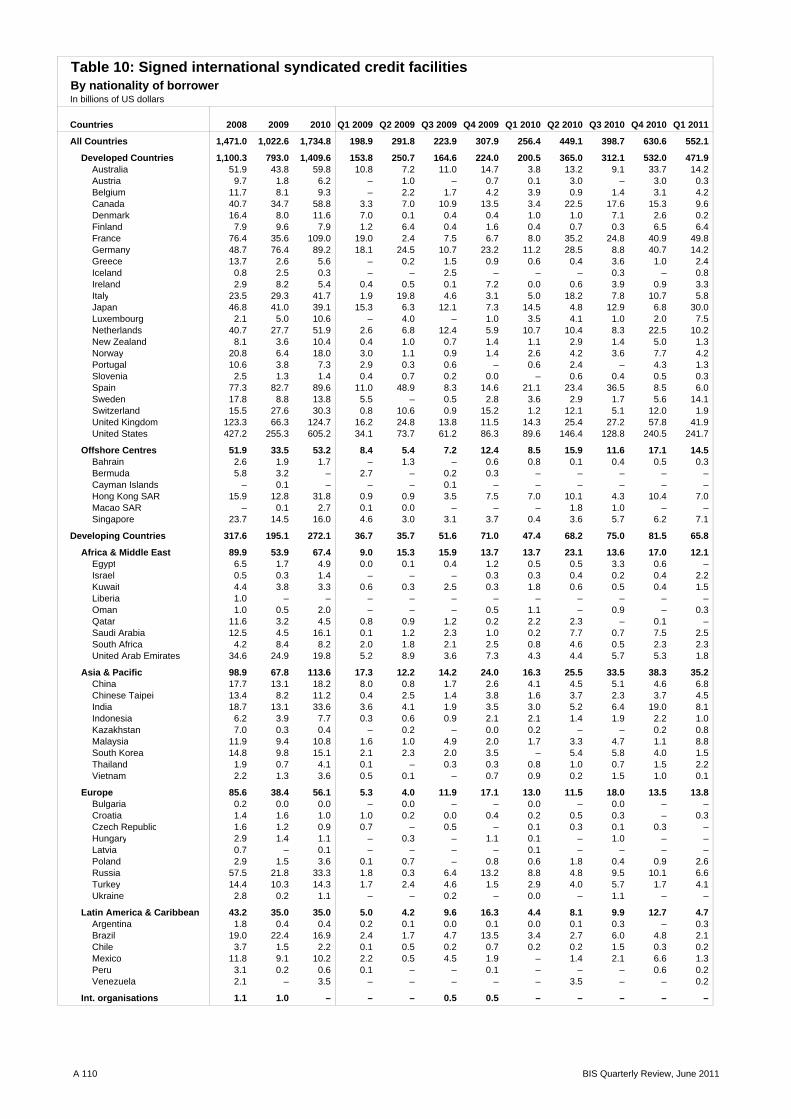
Countries 2008 2009 2010 Q1 2009 Q2 2009 Q3 2009 Q4 2009 Q1 2010 Q2 2010 Q3 2010 Q4 2010 Q1 2011
All Countries 1,471.0 1,022.6 1,734.8 198.9 291.8 223.9 307.9 256.4 449.1 398.7 630.6 552.1
Developed Countries 1,100.3 793.0 1,409.6 153.8 250.7 164.6 224.0 200.5 365.0 312.1 532.0 471.9 Australia 51.9 43.8 59.8 10.8 7.2 11.0 14.7 3.8 13.2 9.1 33.7 14.2 Austria 9.7 1.8 6.2 – 1.0 – 0.7 0.1 3.0 – 3.0 0.3 Belgium 11.7 8.1 9.3 – 2.2 1.7 4.2 3.9 0.9 1.4 3.1 4.2 Canada 40.7 34.7 58.8 3.3 7.0 10.9 13.5 3.4 22.5 17.6 15.3 9.6 Denmark 16.4 8.0 11.6 7.0 0.1 0.4 0.4 1.0 1.0 7.1 2.6 0.2 Finland 7.9 9.6 7.9 1.2 6.4 0.4 1.6 0.4 0.7 0.3 6.5 6.4 France 76.4 35.6 109.0 19.0 2.4 7.5 6.7 8.0 35.2 24.8 40.9 49.8 Germany 48.7 76.4 89.2 18.1 24.5 10.7 23.2 11.2 28.5 8.8 40.7 14.2 Greece 13.7 2.6 5.6 – 0.2 1.5 0.9 0.6 0.4 3.6 1.0 2.4 Iceland 0.8 2.5 0.3 – – 2.5 – – – 0.3 – 0.8 Ireland 2.9 8.2 5.4 0.4 0.5 0.1 7.2 0.0 0.6 3.9 0.9 3.3 Italy 23.5 29.3 41.7 1.9 19.8 4.6 3.1 5.0 18.2 7.8 10.7 5.8 Japan 46.8 41.0 39.1 15.3 6.3 12.1 7.3 14.5 4.8 12.9 6.8 30.0 Luxembourg 2.1 5.0 10.6 – 4.0 – 1.0 3.5 4.1 1.0 2.0 7.5 Netherlands 40.7 27.7 51.9 2.6 6.8 12.4 5.9 10.7 10.4 8.3 22.5 10.2 New Zealand 8.1 3.6 10.4 0.4 1.0 0.7 1.4 1.1 2.9 1.4 5.0 1.3 Norway 20.8 6.4 18.0 3.0 1.1 0.9 1.4 2.6 4.2 3.6 7.7 4.2 Portugal 10.6 3.8 7.3 2.9 0.3 0.6 – 0.6 2.4 – 4.3 1.3 Slovenia 2.5 1.3 1.4 0.4 0.7 0.2 0.0 – 0.6 0.4 0.5 0.3 Spain 77.3 82.7 89.6 11.0 48.9 8.3 14.6 21.1 23.4 36.5 8.5 6.0 Sweden 17.8 8.8 13.8 5.5 – 0.5 2.8 3.6 2.9 1.7 5.6 14.1 Switzerland 15.5 27.6 30.3 0.8 10.6 0.9 15.2 1.2 12.1 5.1 12.0 1.9 United Kingdom 123.3 66.3 124.7 16.2 24.8 13.8 11.5 14.3 25.4 27.2 57.8 41.9 United States 427.2 255.3 605.2 34.1 73.7 61.2 86.3 89.6 146.4 128.8 240.5 241.7
Offshore Centres 51.9 33.5 53.2 8.4 5.4 7.2 12.4 8.5 15.9 11.6 17.1 14.5 Bahrain 2.6 1.9 1.7 – 1.3 – 0.6 0.8 0.1 0.4 0.5 0.3 Bermuda 5.8 3.2 – 2.7 – 0.2 0.3 – – – – – Cayman Islands – 0.1 – – – 0.1 – – – – – – Hong Kong SAR 15.9 12.8 31.8 0.9 0.9 3.5 7.5 7.0 10.1 4.3 10.4 7.0 Macao SAR – 0.1 2.7 0.1 0.0 – – – 1.8 1.0 – – Singapore 23.7 14.5 16.0 4.6 3.0 3.1 3.7 0.4 3.6 5.7 6.2 7.1
Developing Countries 317.6 195.1 272.1 36.7 35.7 51.6 71.0 47.4 68.2 75.0 81.5 65.8
Africa & Middle East 89.9 53.9 67.4 9.0 15.3 15.9 13.7 13.7 23.1 13.6 17.0 12.1 Egypt 6.5 1.7 4.9 0.0 0.1 0.4 1.2 0.5 0.5 3.3 0.6 – Israel 0.5 0.3 1.4 – – – 0.3 0.3 0.4 0.2 0.4 2.2 Kuwait 4.4 3.8 3.3 0.6 0.3 2.5 0.3 1.8 0.6 0.5 0.4 1.5 Liberia 1.0 – – – – – – – – – – – Oman 1.0 0.5 2.0 – – – 0.5 1.1 – 0.9 – 0.3 Qatar 11.6 3.2 4.5 0.8 0.9 1.2 0.2 2.2 2.3 – 0.1 – Saudi Arabia 12.5 4.5 16.1 0.1 1.2 2.3 1.0 0.2 7.7 0.7 7.5 2.5 South Africa 4.2 8.4 8.2 2.0 1.8 2.1 2.5 0.8 4.6 0.5 2.3 2.3 United Arab Emirates 34.6 24.9 19.8 5.2 8.9 3.6 7.3 4.3 4.4 5.7 5.3 1.8
Asia & Pacific 98.9 67.8 113.6 17.3 12.2 14.2 24.0 16.3 25.5 33.5 38.3 35.2 China 17.7 13.1 18.2 8.0 0.8 1.7 2.6 4.1 4.5 5.1 4.6 6.8 Chinese Taipei 13.4 8.2 11.2 0.4 2.5 1.4 3.8 1.6 3.7 2.3 3.7 4.5 India 18.7 13.1 33.6 3.6 4.1 1.9 3.5 3.0 5.2 6.4 19.0 8.1 Indonesia 6.2 3.9 7.7 0.3 0.6 0.9 2.1 2.1 1.4 1.9 2.2 1.0 Kazakhstan 7.0 0.3 0.4 – 0.2 – 0.0 0.2 – – 0.2 0.8 Malaysia 11.9 9.4 10.8 1.6 1.0 4.9 2.0 1.7 3.3 4.7 1.1 8.8 South Korea 14.8 9.8 15.1 2.1 2.3 2.0 3.5 – 5.4 5.8 4.0 1.5 Thailand 1.9 0.7 4.1 0.1 – 0.3 0.3 0.8 1.0 0.7 1.5 2.2 Vietnam 2.2 1.3 3.6 0.5 0.1 – 0.7 0.9 0.2 1.5 1.0 0.1
Europe 85.6 38.4 56.1 5.3 4.0 11.9 17.1 13.0 11.5 18.0 13.5 13.8 Bulgaria 0.2 0.0 0.0 – 0.0 – – 0.0 – 0.0 – – Croatia 1.4 1.6 1.0 1.0 0.2 0.0 0.4 0.2 0.5 0.3 – 0.3 Czech Republic 1.6 1.2 0.9 0.7 – 0.5 – 0.1 0.3 0.1 0.3 – Hungary 2.9 1.4 1.1 – 0.3 – 1.1 0.1 – 1.0 – – Latvia 0.7 – 0.1 – – – – 0.1 – – – – Poland 2.9 1.5 3.6 0.1 0.7 – 0.8 0.6 1.8 0.4 0.9 2.6 Russia 57.5 21.8 33.3 1.8 0.3 6.4 13.2 8.8 4.8 9.5 10.1 6.6 Turkey 14.4 10.3 14.3 1.7 2.4 4.6 1.5 2.9 4.0 5.7 1.7 4.1 Ukraine 2.8 0.2 1.1 – – 0.2 – 0.0 – 1.1 – –
Latin America & Caribbean 43.2 35.0 35.0 5.0 4.2 9.6 16.3 4.4 8.1 9.9 12.7 4.7 Argentina 1.8 0.4 0.4 0.2 0.1 0.0 0.1 0.0 0.1 0.3 – 0.3 Brazil 19.0 22.4 16.9 2.4 1.7 4.7 13.5 3.4 2.7 6.0 4.8 2.1 Chile 3.7 1.5 2.2 0.1 0.5 0.2 0.7 0.2 0.2 1.5 0.3 0.2 Mexico 11.8 9.1 10.2 2.2 0.5 4.5 1.9 – 1.4 2.1 6.6 1.3 Peru 3.1 0.2 0.6 0.1 – – 0.1 – – – 0.6 0.2 Venezuela 2.1 – 3.5 – – – – – 3.5 – – 0.2
Int. organisations 1.1 1.0 – – – 0.5 0.5 – – – – –
Table 10: Signed international syndicated credit facilitiesBy nationality of borrowerIn billions of US dollars
A 110 BIS Quarterly Review, June 2011

BIS Quarterly Review, June 2011 A111
Securities markets1
11 International debt securities by residence of issuer ........................................ page A113
12 International debt securities by nationality of issuer A All issuers ...................................................................................................................... A114
B Financial institutions ...................................................................................................... A115
C Corporate issuers .......................................................................................................... A116
D Governments ................................................................................................................. A117
13 International debt securities by type, sector and currency A Money market instruments ............................................................................................. A118
B Bonds and notes ............................................................................................................ A119
14 International debt securities by residence of issuer A Money market instruments ............................................................................................. A120
B Bonds and notes ............................................................................................................ A121
15 International debt securities by nationality of issuer A Money market instruments ............................................................................................. A122
B Bonds and notes ............................................................................................................ A123
16 Domestic debt securities by sector and residence of issuer A All issuers and governments .......................................................................................... A124
B Financial institutions and corporate issuers.................................................................... A125
17 Debt securities with remaining maturity up to one year A Domestic securities........................................................................................................ A126
B International securities ................................................................................................... A127
18 Announced international equity issues by nationality of issuer .............................. A128
1 More detailed data and a full set of historical time series are available on the BIS website under
http://www.bis.org/statistics/secstats.htm.


Countries Dec 2008 Dec 2009 Dec 2010 Mar 2011 2009 2010 Q2 2010 Q3 2010 Q4 2010 Q1 2011
All countries 23,845.5 26,993.4 27,688.5 29,045.6 2,329.1 1,514.4 116.9 490.8 298.6 487.2
Developed countries 20,778.1 23,659.9 24,099.8 25,292.3 2,129.5 1,251.1 68.0 409.2 239.0 371.2 Australia 447.7 543.8 587.6 593.5 67.6 34.9 –3.1 17.5 5.4 –3.7 Austria 367.8 388.1 364.8 397.2 7.5 –6.9 –5.2 0.0 –6.1 13.6 Belgium 262.1 335.0 323.1 359.7 60.4 9.6 12.7 5.1 –10.9 17.1 Canada 460.7 566.6 654.8 682.1 71.0 80.1 29.9 12.5 27.6 15.1 Cyprus 10.2 13.0 13.6 14.9 2.4 1.5 –0.9 –0.2 1.1 0.7 Denmark 122.9 156.0 139.0 156.6 27.3 –11.1 6.2 –17.2 0.8 11.4 Finland 111.8 143.1 154.2 171.1 26.0 18.1 –0.9 1.2 8.6 9.3 France 1,498.3 1,842.0 1,904.1 2,086.4 279.3 163.5 11.3 39.3 36.6 81.7 Germany 2,148.5 2,147.0 2,035.8 2,157.0 –74.3 0.1 –8.6 –3.7 –9.9 19.2 Greece 192.8 260.2 335.2 358.9 55.7 92.3 39.6 7.1 26.4 2.8 Iceland 52.6 42.4 32.7 32.6 –11.0 –8.3 –2.3 –0.2 –2.6 –1.2 Ireland 1,213.8 1,369.3 1,250.8 1,244.1 104.5 –37.3 –8.4 –31.5 –7.8 –70.4 Italy 1,010.9 1,171.6 1,134.2 1,222.3 120.6 41.6 –2.1 33.4 13.7 19.9 Japan 185.2 170.6 183.6 184.6 –13.4 0.5 –6.9 5.8 –1.5 1.8 Luxembourg 445.0 477.2 447.6 463.6 21.2 –12.1 –7.8 –7.8 –0.9 –0.7 Netherlands 1,669.2 1,923.3 1,951.7 2,073.7 184.4 122.4 –26.1 71.8 18.3 29.3 New Zealand 12.5 10.9 13.2 16.1 –2.3 2.1 –0.2 –0.2 3.7 2.8 Norway 164.9 186.6 206.8 233.0 13.3 21.0 6.3 5.7 –0.2 19.5 Portugal 131.4 187.0 185.4 200.9 48.9 12.2 –5.0 4.9 –0.1 3.8 Slovakia 5.2 8.2 11.7 14.2 2.7 4.2 1.4 – 2.8 1.7 Spain 1,262.2 1,511.0 1,463.7 1,596.8 193.9 55.8 –19.2 40.3 7.4 44.2 Sweden 264.4 362.2 383.3 403.9 84.0 28.3 –9.7 –0.8 10.2 4.8 Switzerland 25.7 26.1 28.7 35.9 –0.1 1.6 0.1 –0.0 1.2 6.1 United Kingdom 3,433.3 3,774.4 3,674.3 3,837.9 146.5 29.4 –37.5 79.8 –84.9 47.8 United States 5,270.9 6,027.7 6,600.1 6,729.5 705.8 603.1 103.4 146.4 199.9 89.6
Offshore centres 1,508.3 1,512.2 1,546.7 1,562.0 –9.5 35.4 –12.5 25.3 17.0 2.8 Aruba 8.3 6.1 6.7 6.5 –2.1 –0.0 – –0.0 – –0.1 Bahamas 9.2 10.0 9.6 9.4 0.6 –0.3 –0.2 0.6 –0.7 –0.2 Bermuda 53.2 69.0 80.6 82.8 15.6 11.4 –0.2 4.7 5.1 1.9 Cayman Islands 1,143.2 1,146.7 1,151.2 1,154.0 –6.1 4.8 –9.2 7.0 6.0 –5.4 Hong Kong SAR 48.6 46.3 63.4 64.6 –2.5 17.1 1.5 5.5 7.2 0.9 Lebanon 24.0 23.7 24.7 25.0 –0.4 1.1 –0.1 –0.2 1.0 0.3 Netherlands Antilles 118.2 107.3 95.5 100.8 –13.3 –9.8 –2.7 –1.8 –2.8 2.2 Panama 9.4 10.8 10.7 10.8 1.3 –0.0 0.1 0.0 –0.1 0.1 Singapore 53.4 51.4 56.6 60.4 –2.5 4.3 –0.8 4.0 0.4 3.2 West Indies UK 28.8 28.1 34.5 35.0 –0.9 6.5 –1.1 5.2 1.4 0.5
Developing countries 901.8 1,021.1 1,149.4 1,214.0 107.5 134.7 30.7 39.5 39.3 51.0
Africa & Middle East 115.3 140.1 154.6 161.8 22.7 14.9 1.9 5.7 5.1 6.1 Israel 13.7 14.4 16.5 16.7 0.6 2.2 0.7 –0.2 0.1 –0.0 Qatar 11.3 21.8 25.7 25.6 10.5 3.9 0.6 3.4 –0.0 –0.1 South Africa 20.4 23.0 27.2 32.9 1.0 4.3 –0.4 2.3 0.8 5.2 Tunisia 3.9 3.8 3.4 3.5 –0.2 –0.4 – –0.4 – – United Arab Emirates 46.1 55.1 54.7 55.1 8.7 –0.3 –1.4 0.2 2.2 0.1
Asia & Pacific 256.3 286.6 313.3 328.0 29.4 24.1 2.2 5.7 11.1 13.8 China 22.4 24.9 24.3 27.2 2.4 –0.6 –1.5 –1.4 2.2 2.6 Chinese Taipei 9.4 5.7 6.9 7.6 –3.7 1.2 – 1.0 0.5 0.7 India 30.3 30.5 28.5 27.6 0.2 –2.2 –0.1 –1.2 –0.6 –0.9 Indonesia 13.5 19.1 22.9 22.4 5.6 3.6 0.3 –0.2 0.4 –0.4 Malaysia 24.9 24.5 27.5 27.7 –0.5 2.7 1.4 1.2 –0.3 0.2 Philippines 31.5 35.9 39.0 41.0 4.3 2.7 –0.0 0.7 1.1 2.0 South Korea 104.0 124.4 136.2 144.0 19.8 10.5 1.7 5.2 2.3 7.2 Thailand 9.0 8.5 8.1 8.4 –0.6 –0.7 –0.3 – –0.1 0.3
Europe 228.8 250.4 273.9 296.4 17.2 30.8 8.7 11.1 4.4 14.1 Croatia 6.1 7.6 7.6 8.2 1.3 0.5 – 1.2 – 0.3 Hungary 37.4 38.4 35.2 39.5 –0.1 –1.1 0.2 –1.8 –0.6 2.6 Poland 42.4 52.5 57.4 60.7 8.7 6.7 –0.4 2.6 –1.0 0.7 Russia 63.0 61.0 65.7 70.4 –2.3 4.8 6.3 0.5 1.8 4.1 Turkey 40.8 42.8 48.5 52.3 1.6 6.5 0.3 3.0 1.7 2.9
Latin America & Caribbean 301.4 344.0 407.6 427.8 38.3 65.0 17.9 17.0 18.7 17.0 Argentina 59.1 55.3 56.2 58.9 –4.6 2.6 1.4 0.6 0.9 1.3 Brazil 75.7 90.8 117.5 121.1 12.7 26.7 6.1 5.6 8.3 2.9 Chile 12.9 14.8 22.2 24.4 1.8 7.3 0.9 3.4 2.6 2.1 Colombia 17.0 21.9 22.3 23.8 4.6 0.3 0.6 0.8 –0.5 1.6 Mexico 63.4 77.0 93.2 98.9 13.3 15.9 7.2 3.6 0.5 4.9 Peru 9.7 13.3 19.4 20.2 3.4 6.1 1.0 0.9 3.6 0.8 Uruguay 8.6 9.3 9.2 8.5 0.3 –0.0 –0.0 – – –0.8 Venezuela 33.6 43.0 48.1 51.4 9.3 5.2 0.2 1.7 3.2 3.2
Int. organisations 657.2 800.1 892.6 977.3 101.6 93.2 30.7 16.8 3.3 62.3
Amounts outstanding Net issues
Table 11: International debt securities - all issuersBy residence of issuerIn billions of US dollars
BIS Quarterly Review, June 2011 A 113

Countries Dec 2008 Dec 2009 Dec 2010 Mar 2011 2009 2010 Q2 2010 Q3 2010 Q4 2010 Q1 2011
All countries 23,845.5 26,993.4 27,688.5 29,045.6 2,329.1 1,514.4 116.9 490.8 298.6 487.2
Developed countries 21,764.8 24,597.6 24,981.4 26,169.5 2,072.4 1,193.7 54.2 399.5 218.0 360.1 Australia 469.9 559.4 603.0 613.1 63.7 38.6 0.1 11.3 13.1 0.5 Austria 353.0 368.6 347.8 376.3 3.5 –5.3 –4.0 0.2 –5.6 10.7 Belgium 480.5 585.8 591.9 632.2 84.5 40.3 15.6 3.7 –11.4 8.1 Canada 466.9 567.2 651.6 678.6 65.6 76.6 29.2 14.0 23.2 14.6 Cyprus 8.8 14.7 15.3 15.2 5.3 1.8 –0.6 1.1 –0.2 –1.0 Denmark 140.5 171.5 156.5 170.6 25.0 –7.9 –2.0 –6.2 –1.4 6.9 Finland 104.8 136.5 144.7 162.0 26.6 14.7 0.6 0.7 4.6 10.1 France 1,685.1 2,005.4 1,997.4 2,207.5 251.5 98.5 –5.5 32.4 28.0 106.1 Germany 2,897.5 2,934.9 2,746.6 2,876.5 –62.9 –46.9 –22.9 3.5 –47.0 –0.1 Greece 284.3 369.0 428.9 449.8 68.1 85.4 32.9 5.1 24.2 –5.3 Iceland 58.4 51.0 41.3 42.0 –8.5 –8.1 –0.1 –2.9 –3.1 –0.6 Ireland 486.8 586.1 535.2 534.1 78.6 –14.6 2.8 –44.2 10.1 –28.7 Italy 1,250.3 1,416.4 1,359.0 1,463.5 119.1 33.7 –7.9 45.9 –1.5 25.7 Japan 403.6 399.2 419.1 424.1 –8.6 0.3 –15.2 16.5 0.5 3.9 Luxembourg 101.8 98.5 95.3 104.2 –5.8 1.3 –2.1 3.5 –0.7 5.0 Netherlands 1,116.0 1,283.2 1,343.9 1,431.5 119.4 117.4 –14.5 63.4 12.5 26.2 New Zealand 7.6 9.8 14.3 17.1 1.8 4.5 0.6 0.2 3.6 2.6 Norway 166.3 187.3 209.0 235.2 12.8 22.5 4.3 7.0 –1.5 19.4 Portugal 229.8 292.8 274.2 291.8 51.8 2.3 –13.8 2.6 –4.2 1.1 Slovakia 5.5 8.5 11.9 14.5 2.7 4.2 1.4 – 2.8 1.7 Spain 1,596.5 1,840.5 1,783.2 1,945.2 173.1 61.7 –18.1 52.2 –5.2 59.6 Sweden 296.5 391.1 407.1 432.9 79.7 25.2 –11.3 –1.9 10.4 8.9 Switzerland 391.2 453.0 462.7 488.1 47.3 19.8 4.2 2.8 –11.7 11.7 United Kingdom 2,726.0 3,148.9 3,135.3 3,231.8 263.6 90.0 –4.4 55.9 –17.0 4.2 United States 6,028.9 6,701.2 7,185.5 7,305.4 606.0 533.3 83.4 132.6 195.3 64.3
Offshore centres 230.0 254.4 268.8 263.2 21.5 15.0 –3.0 8.6 2.6 –8.2 Aruba 0.2 0.2 0.2 0.2 – – – – – – Bahamas 0.7 1.3 1.3 1.3 0.6 –0.0 –0.0 – – – Bermuda 4.5 7.7 10.8 11.3 3.1 3.2 0.0 1.3 0.6 0.4 Cayman Islands 61.5 68.9 65.8 59.5 5.9 –2.2 –1.9 –1.2 –2.2 –7.8 Hong Kong SAR 67.0 78.0 85.4 83.2 10.5 7.8 –0.4 4.3 3.4 –2.8 Lebanon 24.0 23.7 24.9 25.2 –0.4 1.3 –0.1 –0.2 1.0 0.3 Netherlands Antilles – – – – – – – – – – Panama 8.9 10.2 10.0 10.1 1.3 –0.2 – – –0.2 0.1 Singapore 52.1 52.1 57.1 60.3 –0.6 3.9 –1.7 4.4 0.6 2.6 West Indies UK 0.7 0.6 0.3 0.3 –0.1 –0.3 –0.2 –0.1 – 0.0
Developing countries 1,193.4 1,341.0 1,545.4 1,635.3 133.2 212.6 35.1 65.9 74.7 73.0
Africa & Middle East 161.4 201.3 230.3 245.2 36.9 30.1 4.0 10.0 13.1 13.0 Israel 18.7 19.3 23.9 24.9 0.6 4.7 3.2 –0.2 0.1 0.7 Qatar 11.6 25.2 33.9 33.9 13.6 8.7 0.6 4.1 4.2 –0.1 South Africa 36.9 39.8 45.0 52.5 0.7 5.8 0.7 2.4 1.0 6.6 Tunisia 3.9 3.8 3.4 3.5 –0.2 –0.4 – –0.4 – – United Arab Emirates 62.4 81.9 85.5 90.9 19.0 3.9 –1.8 2.0 5.0 4.9
Asia & Pacific 351.1 386.2 456.0 481.3 33.6 66.0 7.4 17.9 31.5 24.1 China 48.2 49.5 75.5 87.0 1.3 25.7 2.2 8.6 11.9 11.1 Chinese Taipei 13.2 9.0 10.5 11.3 –4.2 1.4 –0.0 1.0 0.8 0.8 India 43.9 45.7 50.5 52.4 1.7 4.7 –0.5 –0.3 5.7 1.7 Indonesia 23.3 32.1 36.7 36.2 8.8 4.2 0.1 –0.5 1.3 –0.4 Malaysia 32.9 33.8 40.8 41.2 0.6 5.8 2.5 2.2 0.4 0.4 Philippines 31.9 36.2 39.9 42.0 4.3 3.4 –0.0 1.3 1.1 2.0 South Korea 108.1 129.3 143.1 151.5 20.5 12.4 2.7 5.7 3.0 7.9 Thailand 9.8 8.7 10.3 10.6 –1.2 1.2 –0.3 0.7 1.1 0.3
Europe 315.8 339.4 384.1 409.3 18.7 53.6 8.3 15.6 17.7 15.2 Croatia 5.5 7.6 7.6 8.2 1.9 0.5 – 1.2 – 0.3 Hungary 37.4 39.3 36.2 40.6 0.9 –0.9 0.2 –1.8 –0.5 2.6 Poland 44.7 56.3 62.9 66.5 10.1 8.7 –0.5 3.0 0.7 0.7 Russia 137.5 133.2 156.9 162.7 –4.9 25.0 5.1 5.1 13.5 4.1 Turkey 49.7 51.5 57.2 60.9 1.4 6.5 0.4 2.9 1.7 2.8
Latin America & Caribbean 365.1 414.1 475.0 499.4 44.0 62.9 15.4 22.3 12.4 20.8 Argentina 53.9 53.3 53.8 56.4 –1.4 2.2 1.0 0.7 0.7 1.2 Brazil 119.0 141.3 175.3 186.7 19.6 33.8 7.0 12.4 6.5 10.4 Chile 10.0 11.2 16.2 17.9 1.2 5.0 0.4 2.2 1.9 1.6 Colombia 18.1 23.3 24.4 25.5 5.0 0.9 0.7 0.9 0.2 1.2 Mexico 88.2 97.4 105.9 109.8 8.6 8.9 4.3 3.8 –3.4 2.7 Peru 10.6 13.6 18.7 19.5 2.8 5.2 1.0 0.8 3.0 0.8 Uruguay 8.4 9.2 9.2 8.4 0.4 –0.0 –0.0 – – –0.8 Venezuela 33.6 43.2 48.6 51.4 9.6 5.5 0.5 1.7 3.2 2.7
Int. organisations 657.2 800.4 892.9 977.6 101.9 93.2 30.7 16.8 3.3 62.3
Amounts outstanding Net issues
Table 12A: International debt securities - all issuersBy nationality of issuerIn billions of US dollars
A 114 BIS Quarterly Review, June 2011

Countries Dec 2008 Dec 2009 Dec 2010 Mar 2011 2009 2010 Q2 2010 Q3 2010 Q4 2010 Q1 2011
All countries 18,886.7 20,879.5 20,821.8 21,709.0 1,341.2 593.7 –49.3 264.6 72.9 214.8
Developed countries 18,202.3 20,129.6 19,966.9 20,810.2 1,283.8 486.8 –48.0 214.7 32.6 178.7 Australia 439.9 525.7 562.4 570.5 62.8 32.4 0.6 8.8 10.6 –0.9 Austria 215.3 219.5 203.3 212.4 –3.1 –9.6 –5.4 2.6 –4.9 –0.2 Belgium 339.1 409.1 412.0 426.9 55.1 24.9 8.4 7.9 –12.1 –6.6 Canada 265.4 319.0 362.9 382.6 24.5 37.5 18.4 2.2 14.8 10.4 Cyprus 6.4 9.7 7.9 7.0 2.9 –1.1 –1.5 1.2 –1.3 –1.4 Denmark 112.2 134.0 123.5 130.3 17.0 –4.7 –0.2 –4.7 –0.6 1.0 Finland 40.6 51.3 55.1 60.6 9.0 4.9 –0.2 0.4 3.2 3.6 France 1,329.4 1,545.4 1,518.0 1,690.0 164.1 53.2 –14.0 28.3 13.8 93.9 Germany 2,493.5 2,502.2 2,318.3 2,420.8 –77.0 –70.0 –23.9 –10.3 –43.7 –2.3 Greece 103.5 125.6 193.0 202.0 16.6 74.8 36.3 5.7 25.5 –3.0 Iceland 53.9 46.7 36.7 37.3 –8.2 –8.7 –0.6 –2.9 –3.1 –0.5 Ireland 427.1 513.5 460.2 455.2 68.3 –22.1 1.9 –47.7 12.6 –28.3 Italy 954.6 1,072.8 1,000.7 1,084.8 81.3 –0.6 –14.8 31.2 –8.5 24.1 Japan 331.0 342.1 361.9 368.6 6.3 4.8 –12.4 14.5 2.2 5.3 Luxembourg 89.8 73.9 63.3 64.1 –17.7 –7.2 –5.1 0.9 –2.6 –1.7 Netherlands 1,024.7 1,186.6 1,240.1 1,328.8 117.2 105.5 –14.1 55.8 11.2 32.0 New Zealand 3.9 6.0 6.2 6.7 2.0 0.2 0.0 –0.0 0.2 0.4 Norway 146.3 158.2 179.1 203.9 4.7 20.8 5.0 5.2 –1.5 19.0 Portugal 165.4 210.3 196.6 204.4 37.0 1.4 –10.1 0.2 –2.2 –3.8 Slovakia 0.3 0.3 0.3 0.3 – – – – – – Spain 1,477.3 1,674.6 1,595.4 1,731.5 131.6 29.3 –19.1 48.0 –5.6 45.0 Sweden 257.3 321.9 336.2 359.5 52.5 21.7 –3.8 –1.3 1.6 9.4 Switzerland 376.3 432.4 442.4 465.9 42.2 19.9 4.0 3.6 –11.7 10.5 United Kingdom 2,443.1 2,799.8 2,744.1 2,819.1 213.0 37.7 –21.2 44.7 –23.3 –6.9 United States 5,104.0 5,443.7 5,540.5 5,569.5 279.0 140.0 22.7 20.4 57.9 –20.9
Offshore centres 160.1 176.4 182.6 177.6 13.8 7.0 –3.9 6.2 0.0 –7.3 Aruba 0.0 0.0 0.0 0.0 – – – – – – Bahamas 0.0 0.0 0.0 0.0 –0.0 –0.0 –0.0 – – – Bermuda 2.5 3.2 5.4 5.6 0.6 2.3 – 0.4 0.6 0.1 Cayman Islands 61.5 68.6 65.5 59.1 5.6 –2.2 –1.9 –1.2 –2.2 –7.8 Hong Kong SAR 48.8 58.5 64.3 63.8 9.3 6.2 –1.0 3.9 2.6 –1.0 Lebanon 0.6 0.8 0.9 0.9 0.2 0.1 –0.1 –0.2 – – Netherlands Antilles – – – – – – – – – – Panama 0.5 0.5 0.3 0.3 – –0.2 – – –0.2 – Singapore 36.0 34.2 36.7 39.5 –2.2 1.8 –1.3 3.6 –0.2 2.4 West Indies UK 0.5 0.4 0.1 0.1 –0.1 –0.3 –0.2 –0.1 – 0.0
Developing countries 524.3 573.5 672.3 721.2 43.6 99.9 2.6 43.6 40.3 43.5
Africa & Middle East 89.4 104.1 117.2 126.4 12.6 13.8 –1.5 8.7 7.1 7.9 Israel 5.0 4.8 7.3 8.0 –0.3 2.5 2.5 –0.0 –0.0 0.7 Qatar 3.3 6.4 14.1 14.1 3.1 7.7 – 3.5 4.2 – South Africa 23.1 24.7 26.2 28.2 –0.0 2.0 0.6 0.4 1.2 1.5 Tunisia – – – – – – – – – – United Arab Emirates 42.4 51.8 51.0 56.8 9.0 –0.6 –3.1 2.7 1.1 5.4
Asia & Pacific 210.5 229.4 275.8 295.4 17.7 43.6 4.5 15.3 18.2 18.8 China 34.8 36.5 60.0 69.7 1.6 23.3 1.9 8.2 10.0 9.5 Chinese Taipei 4.8 3.5 3.4 3.5 –1.3 –0.2 –0.0 –0.0 –0.0 0.0 India 18.3 17.5 20.4 23.9 –0.8 2.8 –0.3 0.3 3.3 3.4 Indonesia 11.2 14.1 15.5 15.5 2.9 1.3 –0.1 –0.5 0.7 0.0 Malaysia 24.0 26.5 32.1 32.4 2.2 4.6 1.3 2.2 0.4 0.4 Philippines 3.7 4.4 6.0 6.3 0.6 1.5 – 0.7 0.7 0.3 South Korea 75.1 86.9 95.3 100.8 11.3 7.3 1.9 5.0 –0.8 5.1 Thailand 4.9 4.2 5.6 5.6 –0.9 1.3 –0.3 0.5 1.4 –
Europe 125.7 125.4 143.1 148.7 –1.4 20.5 –2.1 7.6 14.6 3.0 Croatia 1.1 1.2 1.1 0.7 – – – – – –0.4 Hungary 12.7 13.4 10.3 10.2 0.3 –2.1 –0.7 –0.1 –0.5 –0.7 Poland 2.0 3.5 5.2 5.6 1.5 2.0 –0.1 0.3 1.8 0.1 Russia 90.1 86.8 102.8 105.8 –4.0 17.2 –2.7 5.8 12.4 1.7 Turkey 9.9 9.7 12.1 13.0 –0.3 2.4 –0.2 1.9 0.8 0.9
Latin America & Caribbean 98.7 114.6 136.2 150.7 14.8 21.9 1.6 12.0 0.4 13.8 Argentina 2.8 2.9 2.8 2.9 0.1 –0.1 –0.2 0.2 –0.1 0.1 Brazil 57.0 72.0 95.9 108.7 14.3 23.6 4.9 9.9 2.4 12.5 Chile 0.7 0.9 1.5 1.5 0.2 0.6 0.1 – 0.5 – Colombia 1.8 1.8 2.5 3.0 – 0.8 0.1 0.7 0.2 0.5 Mexico 29.6 28.7 22.6 22.8 –1.2 –5.6 –3.4 0.5 –3.4 –0.2 Peru 2.6 3.2 4.8 5.6 0.6 1.6 0.2 0.8 0.5 0.8 Uruguay 0.1 – – – –0.1 – – – – – Venezuela 1.5 1.4 1.4 1.4 –0.1 –0.0 –0.0 – –0.0 –
Amounts outstanding Net issues
Table 12B: International debt securities - financial institutionsBy nationality of issuerIn billions of US dollars
BIS Quarterly Review, June 2011 A 115

Countries Dec 2008 Dec 2009 Dec 2010 Mar 2011 2009 2010 Q2 2010 Q3 2010 Q4 2010 Q1 2011
All countries 2,423.4 3,050.8 3,556.7 3,760.3 566.8 568.1 95.8 151.3 196.6 134.5
Developed countries 2,183.0 2,760.5 3,203.9 3,388.3 518.7 506.5 77.5 141.8 172.9 117.7 Australia 20.7 23.5 30.3 32.7 1.5 6.9 –0.8 2.5 2.9 1.7 Austria 31.9 39.1 40.6 44.2 6.1 3.8 2.0 1.2 0.9 1.2 Belgium 13.2 30.2 30.9 30.7 16.3 1.8 1.5 –0.0 0.2 –1.4 Canada 121.0 148.0 171.1 174.9 24.5 22.3 1.6 9.0 7.6 2.7 Cyprus 0.4 0.4 1.0 1.1 –0.0 0.6 0.6 – – – Denmark 13.3 15.6 14.0 14.6 1.7 –0.9 0.2 –1.5 –0.3 –0.1 Finland 14.0 22.3 22.3 23.5 7.2 1.0 –0.2 1.6 –0.6 –0.0 France 310.9 404.1 417.1 447.3 78.2 34.9 8.0 4.4 14.0 8.3 Germany 121.6 130.3 127.1 133.8 4.3 5.0 3.4 0.3 –3.0 –0.4 Greece 15.4 14.3 12.4 11.2 –1.6 –1.0 0.2 – –1.3 –1.9 Iceland 2.3 2.3 2.2 2.1 –0.1 0.0 –0.0 0.0 0.1 –0.1 Ireland 7.8 10.1 13.4 13.7 2.2 3.6 0.1 1.3 2.2 – Italy 76.5 98.6 105.0 114.0 18.7 12.8 1.6 2.6 4.5 3.1 Japan 69.5 53.9 54.0 52.5 –14.9 –4.5 –2.8 1.9 –1.7 –1.3 Luxembourg 9.3 21.7 26.6 34.4 11.9 6.0 0.4 2.6 1.9 6.7 Netherlands 62.6 72.9 80.7 84.9 8.0 11.1 4.0 3.7 4.1 0.7 New Zealand 2.9 3.1 7.3 9.6 –0.1 4.2 0.6 0.2 3.4 2.3 Norway 19.9 29.1 29.9 31.3 8.0 1.7 –0.7 1.8 –0.0 0.4 Portugal 11.7 15.1 14.3 13.6 2.7 0.3 –0.3 0.5 0.1 –1.5 Slovakia 0.3 0.3 0.3 0.3 – – – – – – Spain 24.2 22.8 21.7 23.7 –1.7 0.3 –0.2 –3.0 1.5 0.9 Sweden 23.2 35.4 32.6 38.6 10.2 –1.3 –2.0 –0.5 1.2 4.1 Switzerland 13.9 19.8 19.4 21.2 5.4 –0.1 0.2 –0.8 0.0 1.2 United Kingdom 274.4 299.4 294.3 308.2 9.1 5.0 –0.8 2.2 –1.7 6.0 United States 920.9 1,246.6 1,633.7 1,724.6 320.2 392.9 60.7 112.1 137.1 85.3
Offshore centres 35.3 41.7 46.5 45.5 6.1 4.5 0.6 1.7 1.6 –1.3 Aruba – – – – – – – – – – Bahamas 0.4 0.7 0.7 0.7 0.3 – – – – – Bermuda 2.0 4.6 4.9 5.3 2.5 0.4 0.0 0.4 – 0.3 Cayman Islands – – – – – – – – – – Hong Kong SAR 16.3 18.0 19.6 17.9 1.6 1.7 0.6 0.4 0.8 –1.8 Lebanon – – – – – – – – – – Netherlands Antilles – – – – – – – – – – Panama 0.7 0.7 0.7 0.7 – – – – – – Singapore 15.8 17.6 20.4 20.8 1.7 2.4 –0.0 0.8 0.8 0.2 West Indies UK 0.2 0.2 0.2 0.2 – – – – – –
Developing countries 205.1 248.6 306.3 326.5 42.0 57.1 17.7 7.8 22.0 18.1
Africa & Middle East 37.3 45.8 51.7 55.6 7.9 5.8 1.8 1.7 2.4 3.7 Israel 5.7 5.7 6.2 6.0 –0.1 0.5 0.5 –0.2 0.1 –0.1 Qatar 5.9 7.4 7.8 7.8 1.5 0.4 – 0.6 –0.1 –0.1 South Africa 6.0 6.8 8.6 13.2 0.3 1.9 0.0 2.0 –0.2 4.4 Tunisia – – – – – – – – – – United Arab Emirates 17.2 21.3 24.4 24.0 4.1 3.1 1.3 –0.7 2.5 –0.5
Asia & Pacific 88.8 97.2 111.5 115.6 8.2 13.6 1.7 1.7 10.8 3.9 China 9.1 8.4 9.8 11.5 –0.7 1.3 0.3 0.4 0.8 1.6 Chinese Taipei 8.4 5.5 7.1 7.8 –2.9 1.5 – 1.0 0.8 0.7 India 25.7 28.2 30.1 28.5 2.4 2.0 –0.1 –0.6 2.5 –1.7 Indonesia 0.9 2.8 3.1 2.7 1.9 0.3 0.3 – –0.1 –0.4 Malaysia 5.6 5.6 5.7 5.8 –0.0 –0.0 –0.0 – – – Philippines 5.5 6.9 7.1 7.5 1.4 0.2 –0.0 –0.3 0.8 0.5 South Korea 28.7 35.1 40.6 43.5 6.3 5.1 0.8 0.7 3.8 2.8 Thailand 4.0 4.0 4.0 4.3 – –0.1 – 0.2 –0.3 0.3
Europe 26.4 31.2 37.6 41.3 4.6 6.8 4.9 –0.4 1.8 2.8 Croatia 0.6 1.0 0.9 1.2 0.4 – – – – 0.2 Hungary 1.3 1.4 2.3 2.4 – 1.0 1.0 – – – Poland 0.3 0.4 0.4 0.4 0.0 – – – – – Russia 19.5 20.0 23.5 25.4 0.4 3.5 2.3 –0.2 1.1 1.7 Turkey 0.3 0.4 0.5 0.6 – 0.2 – – 0.2 –
Latin America & Caribbean 52.6 74.3 105.6 114.0 21.4 30.9 9.4 4.8 7.1 7.8 Argentina 2.8 2.7 3.3 3.7 –0.1 0.7 –0.0 0.4 0.3 0.4 Brazil 13.1 16.8 27.4 27.0 3.3 10.7 1.8 1.3 4.9 –0.7 Chile 7.1 8.5 11.4 13.0 1.5 2.8 0.3 0.7 1.4 1.6 Colombia 1.1 3.6 3.6 4.2 2.4 – – – – 0.7 Mexico 17.0 25.7 38.3 41.9 8.7 12.2 6.7 2.1 –2.8 3.2 Peru 0.0 0.2 0.7 0.7 0.2 0.5 0.2 0.0 0.0 – Uruguay – – – – – – – – – – Venezuela 8.3 13.0 17.0 19.7 4.7 4.1 0.5 0.2 3.2 2.7
Amounts outstanding Net issues
Table 12C: International debt securities - corporate issuersBy nationality of issuerIn billions of US dollars
A 116 BIS Quarterly Review, June 2011

Countries Dec 2008 Dec 2009 Dec 2010 Mar 2011 2009 2010 Q2 2010 Q3 2010 Q4 2010 Q1 2011
All countries 1,878.1 2,262.7 2,417.1 2,598.7 319.2 259.3 39.8 58.1 25.9 75.5
Developed countries 1,379.4 1,707.4 1,810.7 1,971.0 269.9 200.4 24.7 42.9 12.5 63.7 Australia 9.3 10.2 10.2 10.0 –0.6 –0.7 0.4 0.0 –0.4 –0.3 Austria 105.8 109.9 104.0 119.8 0.5 0.6 –0.5 –3.5 –1.6 9.7 Belgium 128.2 146.5 149.1 174.6 13.1 13.5 5.7 –4.2 0.5 16.1 Canada 80.5 100.2 117.6 121.1 16.7 16.9 9.2 2.8 0.8 1.5 Cyprus 2.0 4.6 6.4 7.2 2.4 2.2 0.3 –0.1 1.1 0.4 Denmark 15.0 21.9 19.1 25.7 6.3 –2.3 –2.0 0.0 –0.5 6.0 Finland 50.3 62.9 67.3 77.9 10.4 8.8 1.0 –1.3 2.0 6.6 France 44.8 55.9 62.3 70.3 9.2 10.4 0.5 –0.2 0.2 4.0 Germany 282.4 302.4 301.2 322.0 9.8 18.1 –2.4 13.6 –0.2 2.5 Greece 165.4 229.0 223.4 236.7 53.2 11.5 –3.6 –0.6 – –0.5 Iceland 2.2 2.0 2.5 2.6 –0.2 0.5 0.5 – – – Ireland 51.9 62.5 61.7 65.2 8.1 3.8 0.9 2.3 –4.8 –0.3 Italy 219.3 245.0 253.3 264.7 19.0 21.5 5.3 12.2 2.5 –1.5 Japan 3.1 3.2 3.2 3.1 –0.0 – – – – –0.2 Luxembourg 2.8 2.9 5.3 5.7 – 2.6 2.6 – – – Netherlands 28.8 23.6 23.1 17.7 –5.8 0.8 –4.4 3.9 –2.8 –6.4 New Zealand 0.8 0.8 0.8 0.7 –0.0 – – – – –0.1 Norway – – – – – – – – – – Portugal 52.7 67.4 63.3 73.8 12.1 0.7 –3.3 1.9 –2.0 6.4 Slovakia 4.9 7.9 11.4 13.9 2.7 4.2 1.4 – 2.8 1.7 Spain 94.9 143.1 166.0 189.9 43.2 32.1 1.1 7.2 –1.0 13.7 Sweden 15.9 33.8 38.3 34.8 16.9 4.7 –5.5 –0.1 7.6 –4.7 Switzerland 1.1 0.8 0.9 0.9 –0.3 – – – – – United Kingdom 8.5 49.7 97.0 104.6 41.4 47.2 17.6 9.1 7.9 5.1 United States 4.0 11.0 11.4 11.3 6.9 0.4 0.0 0.0 0.4 –0.1
Offshore centres 34.6 36.3 39.7 40.0 1.7 3.4 0.3 0.7 1.0 0.3 Aruba 0.2 0.2 0.2 0.2 – – – – – – Bahamas 0.3 0.6 0.6 0.6 0.3 – – – – – Bermuda – – 0.5 0.5 – 0.5 – 0.5 – – Cayman Islands – 0.3 0.3 0.3 0.3 – – – – – Hong Kong SAR 1.9 1.4 1.4 1.4 –0.5 – – – – – Lebanon 23.4 22.8 23.9 24.3 –0.6 1.2 – – 1.0 0.3 Netherlands Antilles – – – – – – – – – – Panama 7.7 9.1 9.1 9.1 1.3 – – – – 0.1 Singapore 0.3 0.4 – – – –0.4 –0.4 – – – West Indies UK – – – – – – – – – –
Developing countries 464.1 519.0 566.8 587.7 47.6 55.5 14.8 14.5 12.3 11.5
Africa & Middle East 34.7 51.4 61.4 63.3 16.5 10.4 3.7 –0.4 3.5 1.4 Israel 7.9 8.9 10.5 10.8 1.0 1.8 0.2 – – 0.1 Qatar 2.4 11.4 11.9 11.9 9.0 0.6 0.6 – – – South Africa 7.8 8.3 10.2 11.1 0.5 2.0 – – – 0.8 Tunisia 3.9 3.8 3.4 3.5 –0.2 –0.4 – –0.4 – – United Arab Emirates 2.8 8.8 10.2 10.2 6.0 1.4 – – 1.4 –
Asia & Pacific 51.8 59.7 68.7 70.4 7.7 8.8 1.3 1.0 2.5 1.5 China 4.2 4.6 5.8 5.9 0.4 1.2 – – 1.2 – Chinese Taipei – – – – – – – – – – India – – – – – – – – – – Indonesia 11.2 15.2 18.0 18.0 4.0 2.6 – – 0.6 – Malaysia 3.4 1.8 3.0 3.0 –1.6 1.3 1.3 – – – Philippines 22.6 25.0 26.9 28.2 2.3 1.7 – 1.0 –0.4 1.3 South Korea 4.2 7.2 7.1 7.2 2.9 – – – – – Thailand 0.9 0.6 0.7 0.7 –0.3 – – – – –
Europe 163.7 182.8 203.5 219.3 15.6 26.3 5.5 8.4 1.3 9.5 Croatia 3.8 5.4 5.6 6.2 1.6 0.5 – 1.2 – 0.5 Hungary 23.3 24.6 23.7 27.9 0.5 0.2 –0.2 –1.6 – 3.3 Poland 42.4 52.4 57.4 60.5 8.6 6.7 –0.4 2.6 –1.0 0.5 Russia 27.8 26.5 30.7 31.6 –1.4 4.3 5.5 –0.5 – 0.8 Turkey 39.5 41.5 44.6 47.4 1.6 3.9 0.5 1.0 0.7 1.9
Latin America & Caribbean 213.8 225.2 233.3 234.7 7.8 10.1 4.3 5.5 5.0 –0.8 Argentina 48.3 47.7 47.7 49.8 –1.4 1.6 1.2 0.2 0.5 0.8 Brazil 49.0 52.5 51.9 51.0 1.9 –0.4 0.3 1.2 –0.8 –1.4 Chile 2.3 1.8 3.3 3.3 –0.5 1.5 – 1.5 – – Colombia 15.2 18.0 18.3 18.3 2.6 0.2 0.6 0.2 – – Mexico 41.6 42.9 45.1 45.1 1.1 2.3 1.0 1.1 2.8 –0.3 Peru 8.0 10.2 13.2 13.2 2.0 3.1 0.6 – 2.5 – Uruguay 8.3 9.2 9.2 8.4 0.5 –0.0 –0.0 – – –0.8 Venezuela 23.8 28.8 30.2 30.3 5.0 1.5 – 1.5 – –
Amounts outstanding Net issues
Table 12D: International debt securities - governmentsBy nationality of issuerIn billions of US dollars
BIS Quarterly Review, June 2011 A 117

Type, sector and currency Dec 2009 Dec 2010 Mar 2011 Q4 2010 Q1 2011 2009 2010 Q3 2010 Q4 2010 Q1 2011
Total issues 932.2 915.8 982.0 638.7 669.8 –237.5 13.4 45.5 –54.3 38.0
Commercial paper 598.9 511.9 556.7 402.6 456.8 –137.6 –64.3 –0.4 –40.1 26.8 US dollar 174.7 162.2 172.5 124.8 133.0 –37.8 –12.6 –3.0 6.1 10.3 Euro 306.5 240.3 254.4 185.5 211.0 –48.3 –44.0 0.7 –43.6 –1.0 Yen 3.9 5.4 3.6 3.9 3.5 –2.0 0.8 1.9 –1.7 –1.7 Pound sterling 80.9 76.1 96.4 68.6 85.9 –36.8 –1.5 1.7 3.7 18.2 Swiss franc 14.7 11.2 9.8 7.4 7.8 –4.2 –4.5 –1.9 –1.4 –1.6 Canadian dollar 0.7 1.3 1.4 1.1 1.1 0.0 0.6 0.1 0.2 –0.0 Other currencies 17.4 15.4 18.6 11.3 14.5 –8.5 –3.1 0.3 –3.5 2.7
Financial institutions 526.8 447.7 478.8 351.2 396.6 –49.5 –58.2 –1.6 –30.5 14.9 Governments 33.0 29.7 32.0 22.5 24.1 –47.6 –3.1 13.0 –12.4 1.8 International organisations 6.9 10.8 19.0 10.1 15.6 –11.9 3.9 –3.4 4.5 8.0 Corporate issuers 32.2 23.8 26.9 18.8 20.6 –28.7 –7.0 –8.4 –1.8 2.2
Other instruments 333.3 403.9 425.3 236.1 213.0 –99.9 77.8 45.9 –14.1 11.2 US dollar 145.4 178.4 189.5 100.1 77.5 –12.2 33.1 37.8 –19.1 11.0 Euro 136.5 137.8 147.5 86.5 97.4 –39.4 11.1 –3.8 –6.3 0.9 Yen 13.0 16.0 14.7 4.2 4.8 –12.9 1.1 0.5 –0.8 –1.1 Pound sterling 18.2 49.5 50.4 34.1 21.1 –27.7 31.8 11.2 12.8 –0.4 Swiss franc 6.1 3.8 3.9 1.6 2.6 0.3 –2.8 –0.4 –2.1 0.0 Canadian dollar 0.3 0.5 1.5 0.4 1.2 –1.0 0.2 0.2 0.1 1.0 Other currencies 13.8 17.8 17.9 9.2 8.3 –7.0 3.3 0.3 1.3 –0.2
Financial institutions 330.4 399.6 421.0 235.0 212.2 –96.3 76.3 46.1 –14.5 11.3 Governments 0.8 3.1 2.9 0.5 0.2 –1.8 2.3 –0.2 0.3 –0.2 International organisations 1.1 0.2 0.2 0.1 0.0 0.5 –0.9 –0.2 0.0 0.0 Corporate issuers 0.9 1.0 1.2 0.6 0.5 –2.3 0.1 0.2 0.0 0.1
Currency of issueArgentine peso – – – – – – – – – – Australian dollar 10.0 9.1 11.1 7.3 9.7 –2.5 –2.4 –0.2 –3.7 1.8 Baht – 0.0 0.0 0.0 0.0 –0.0 0.0 0.0 0.0 –0.0 Canadian dollar 1.0 1.8 2.9 1.5 2.4 –0.9 0.7 0.3 0.3 1.0 Czech koruna 0.0 0.0 0.0 0.0 0.0 –0.2 0.0 0.0 –0.0 0.0 Danish krone 0.2 0.6 0.0 0.6 0.0 –1.3 0.4 0.0 0.4 –0.6 Euro 443.0 378.1 401.9 272.0 308.3 –87.7 –32.9 –3.1 –49.9 –0.2 Hong Kong dollar 9.2 9.2 9.4 4.9 4.0 –3.6 –0.0 1.2 1.2 0.3 New Taiwan dollar – – – – – – – – – – New Zealand dollar 2.4 2.2 2.4 1.9 2.1 –0.7 –0.4 –0.5 –0.4 0.2 Norwegian krone 0.8 0.6 2.0 0.6 1.9 –2.2 –0.1 –0.3 0.2 1.3 Pound sterling 99.0 125.6 146.8 102.7 107.0 –64.4 30.3 12.9 16.5 17.8 Rand 0.2 0.2 0.2 0.1 – –0.2 –0.0 –0.1 0.0 – Russian rouble 1.1 1.0 1.1 0.0 0.0 –0.0 –0.1 0.0 0.0 0.0 Singapore dollar 1.8 2.0 2.3 1.2 1.3 0.5 0.1 0.4 –0.1 0.3 Swedish krona 1.7 2.5 1.8 1.3 1.4 –1.9 0.6 –0.7 –0.0 –0.8 Swiss franc 20.8 15.0 13.7 9.0 10.4 –3.9 –7.3 –2.3 –3.5 –1.6 US dollar 320.1 340.6 361.9 224.9 210.5 –50.0 20.5 34.8 –13.0 21.3 Yen 16.9 21.4 18.3 8.1 8.2 –14.9 2.0 2.4 –2.5 –2.8 Zloty 1.9 2.7 2.7 1.2 1.2 –0.2 0.8 0.2 0.1 –0.1
Memorandum item:Domestic moneymarket instruments
Total issues 12,756.5 12,563.1 … … … –590.9 –392.4 –3.0 –227.6 …Commercial paper 1,869.3 1,786.2 … … … –623.8 –85.0 38.9 17.8 …Treasury bills 5,587.7 5,738.6 … … … 411.0 –25.0 –113.0 –29.0 …Other instruments 5,299.4 5,038.4 … … … –378.0 –282.5 71.1 –216.4 …
Table 13A: International money market instrumentsBy type, sector and currencyIn billions of US dollars
Amounts outstanding Gross issuance Net issues
A 118 BIS Quarterly Review, June 2011

Type, sector and currency Dec 2009 Dec 2010 Mar 2011 Q4 2010 Q1 2011 2009 2010 Q3 2010 Q4 2010 Q1 2011
Total issues 26,061.2 26,772.7 28,063.6 1,070.7 1,562.8 2,566.6 1,500.9 445.2 352.9 449.2
Floating rate 8,349.1 7,885.6 8,175.4 249.0 346.6 169.3 –129.6 3.8 –40.6 –12.6 US dollar 2,258.4 2,166.4 2,184.6 75.7 137.5 29.5 –92.1 –55.8 –11.7 18.2 Euro 4,663.2 4,305.7 4,564.4 131.3 150.3 41.4 –18.3 41.6 –26.5 –13.1 Yen 181.1 194.8 189.9 5.2 4.3 5.0 –8.6 2.9 0.0 –1.7 Pound sterling 991.5 942.8 942.5 21.4 26.4 82.6 –14.7 16.3 –8.0 –25.6 Swiss franc 23.3 23.3 23.0 1.3 3.8 –6.2 –1.9 –0.1 1.7 –0.9 Canadian dollar 30.0 32.0 35.6 2.0 2.6 –0.7 0.6 –1.0 1.6 2.5 Other currencies 201.5 220.6 235.3 12.1 21.6 17.6 5.3 –0.0 2.3 8.0
Financial institutions 7,992.2 7,499.5 7,749.5 225.9 300.8 162.9 –172.2 –16.0 –50.9 –35.6 Governments 113.4 155.4 178.6 11.7 23.1 11.4 48.2 21.7 8.3 14.2 International organisations 48.7 61.6 65.6 3.5 8.2 24.0 13.2 0.6 1.7 2.2 Corporate issuers 194.8 169.2 181.7 7.9 14.5 –29.0 –18.8 –2.5 0.2 6.6
Straight fixed rate 17,268.4 18,401.8 19,387.7 799.6 1,192.4 2,357.1 1,590.6 428.3 383.5 453.9 US dollar 6,970.0 8,092.3 8,328.0 471.7 555.1 1,140.8 1,122.3 343.8 321.4 235.7 Euro 7,591.3 7,382.6 8,039.5 214.5 476.0 1,021.3 351.9 49.0 43.8 182.6 Yen 461.6 513.2 506.0 19.1 22.1 –35.9 –7.5 2.1 3.0 0.7 Pound sterling 1,143.1 1,137.8 1,177.5 27.5 50.3 157.6 31.3 9.1 –15.1 8.9 Swiss franc 332.8 371.8 387.4 8.3 19.6 26.6 5.8 4.2 –3.2 5.4 Canadian dollar 269.3 308.4 317.9 12.7 14.3 22.2 26.4 1.9 10.6 –0.3 Other currencies 500.3 595.7 631.5 45.7 55.0 24.5 60.3 18.2 23.1 21.0
Financial institutions 11,818.8 12,252.2 12,828.3 514.5 799.0 1,322.1 735.6 230.5 168.1 220.5 Governments 2,114.1 2,227.8 2,384.1 43.4 111.4 357.4 212.1 23.5 29.6 59.8 International organisations 743.7 820.4 892.7 28.4 78.2 89.3 77.0 19.8 –3.0 52.0 Corporate issuers 2,591.9 3,101.4 3,282.7 213.4 203.8 588.3 565.8 154.4 188.8 121.6
Equity-related 443.7 485.3 500.5 22.1 23.9 40.2 40.0 13.1 9.9 7.8 US dollar 196.6 244.4 254.4 15.5 16.5 38.7 47.9 12.6 10.8 10.0 Euro 123.3 107.2 114.1 3.1 4.3 7.0 –7.1 –2.7 0.9 0.1 Yen 51.2 52.8 47.8 0.1 0.6 –10.4 –4.5 1.4 –1.1 –4.1 Pound sterling 7.7 8.7 8.9 0.6 – –0.6 1.3 –0.6 0.2 – Swiss franc 9.4 6.1 6.2 – – 0.6 –3.9 –0.0 –2.1 –0.1 Canadian dollar 7.4 11.8 12.8 1.4 0.7 2.9 4.0 0.6 1.4 0.6 Other currencies 48.2 54.4 56.3 1.2 1.9 2.0 2.4 1.8 –0.2 1.3
Financial institutions 211.2 222.8 231.4 9.5 9.3 2.0 12.2 5.5 0.6 3.8 Governments 1.4 1.1 1.2 – – –0.3 –0.2 – – – International organisations – – – – – – – – – – Corporate issuers 231.1 261.4 267.9 12.6 14.6 38.5 28.0 7.6 9.3 4.0
Convertibles 439.4 482.1 498.0 22.1 23.9 41.2 40.9 13.1 9.9 8.5 Warrants 4.2 3.2 2.6 – – –1.1 –0.9 –0.0 – –0.7
Currency of issueArgentine peso 0.7 0.6 0.5 – – 0.1 –0.1 0.0 – –0.2 Australian dollar 266.4 326.5 339.8 11.7 27.7 15.0 22.0 6.9 1.0 7.2 Baht 3.6 4.0 4.9 0.3 1.0 0.4 –0.1 –0.2 0.1 1.0 Canadian dollar 306.7 352.3 366.4 16.2 17.6 24.4 31.1 1.5 13.7 2.9 Czech koruna 18.4 15.0 16.1 0.3 0.3 –1.8 –2.9 –0.3 –0.7 –0.2 Danish krone 5.2 3.9 3.8 – – –2.6 –1.0 –0.2 –0.2 –0.4 Euro 12,377.8 11,795.4 12,718.0 348.9 630.5 1,069.7 326.6 88.0 18.1 169.6 Hong Kong dollar 60.9 59.9 60.0 1.9 2.8 0.4 –0.8 1.1 –1.8 0.1 New Taiwan dollar 1.6 1.4 1.3 – – –0.1 –0.3 –0.2 –0.0 –0.1 New Zealand dollar 41.9 36.8 34.8 1.2 0.8 –5.8 –7.5 –1.0 –2.3 –1.6 Norwegian krone 53.7 64.5 72.9 2.8 6.3 17.9 11.3 1.3 1.9 4.3 Pound sterling 2,142.3 2,089.3 2,129.0 49.6 76.7 239.5 17.9 24.7 –22.9 –16.7 Rand 37.7 35.6 35.4 1.6 2.3 –1.8 –5.9 –1.5 –2.6 0.6 Russian rouble 13.3 15.1 18.8 2.5 3.3 1.4 1.9 0.4 1.9 2.5 Singapore dollar 29.3 33.7 35.0 1.3 1.5 –2.5 1.7 2.1 –0.2 0.5 Swedish krona 69.1 92.1 103.0 11.9 12.1 14.0 17.9 5.1 9.1 4.6 Swiss franc 365.6 401.2 416.6 9.7 23.4 21.0 0.0 4.1 –3.7 4.4 US dollar 9,425.0 10,503.1 10,767.0 562.8 709.1 1,209.1 1,078.1 300.6 320.5 263.9 Yen 693.9 760.8 743.7 24.4 27.0 –41.3 –20.6 6.4 2.0 –5.2 Zloty 12.6 12.3 11.9 0.3 0.2 –0.5 0.1 0.6 –0.1 –1.0
Memorandum item:Domestic bonds and notes
Total issues 50,664.8 54,590.5 … … … 3,859.4 3,056.7 765.7 966.9 …Medium-term notes 752.9 744.3 … … … 77.7 –1.4 –13.0 7.6 …Bonds 49,911.9 53,846.3 … … … 3,781.7 3,058.2 778.7 959.3 …
Table 13B: International bonds and notesBy type, sector and currencyIn billions of US dollars
Amounts outstanding Announced issues Net issues
BIS Quarterly Review, June 2011 A 119

Countries Dec 2009 Dec 2010 Mar 2011 Q4 2010 Q1 2011 2009 2010 Q3 2010 Q4 2010 Q1 2011
All countries 932.2 915.8 982.0 638.7 669.8 –237.5 13.4 45.5 –54.3 38.0
Developed countries 890.9 871.3 922.4 609.7 628.9 –220.7 9.9 47.0 –58.2 23.5 Australia 50.2 48.0 45.0 39.0 36.9 5.7 –2.3 –1.0 –0.1 –3.7 Austria 14.9 14.4 26.7 9.0 20.2 –14.0 –0.1 1.2 –2.2 11.7 Belgium 31.4 20.7 22.2 18.4 17.9 4.0 –9.7 2.3 –7.8 0.4 Canada 1.8 0.9 0.8 0.8 0.7 –1.3 –0.9 0.1 –0.3 –0.1 Cyprus 0.9 0.3 0.5 0.4 0.2 –0.7 –0.5 –0.1 –0.3 0.2 Denmark 14.4 9.1 7.0 7.1 5.8 –4.9 –5.2 –7.6 1.6 –2.2 Finland 15.6 17.3 15.6 13.3 10.6 4.8 2.3 1.8 1.2 –2.2 France 67.7 86.9 113.6 60.2 88.3 –16.0 21.2 0.1 3.2 23.3 Germany 91.8 97.9 109.5 76.0 82.0 –34.1 8.6 –3.7 8.2 8.8 Greece 2.7 5.5 3.8 3.4 – –5.8 3.0 1.2 3.4 –2.1 Iceland 0.0 0.1 0.1 0.1 – –0.5 0.0 – 0.0 – Ireland 99.2 79.8 55.7 56.7 46.7 –28.0 –14.1 –6.0 –0.7 –27.7 Italy 0.0 0.0 2.7 – 2.6 –0.5 –0.2 4.2 –5.7 2.6 Japan 2.5 2.0 1.3 0.3 0.4 0.4 –0.8 –0.4 –0.3 –0.7 Luxembourg 26.4 26.1 27.6 19.5 19.5 –1.9 0.7 1.0 –5.1 0.1 Netherlands 87.4 102.7 108.2 68.2 70.0 –8.0 18.0 19.2 2.8 2.0 New Zealand 0.3 0.6 1.4 0.6 1.1 –0.8 0.3 –0.2 0.3 0.8 Norway 7.2 4.5 8.7 1.6 6.6 –6.9 –3.0 –0.8 –1.9 4.2 Portugal 6.2 2.6 2.2 2.3 2.0 2.4 –3.1 –0.3 –2.5 –0.5 Slovakia – – – – – – – – – – Spain 44.7 28.7 27.3 22.1 23.0 10.3 –13.5 2.2 –5.2 –2.9 Sweden 42.5 39.6 34.7 32.3 24.7 4.6 –1.0 –5.2 1.6 –5.9 Switzerland 0.2 0.2 0.2 0.2 0.2 –0.4 0.0 –0.0 –0.0 –0.0 United Kingdom 220.7 186.1 207.3 130.0 146.3 –102.9 –25.8 27.5 –55.7 14.6 United States 61.6 96.5 99.4 47.8 22.6 –26.8 35.7 11.4 7.2 2.6
Offshore centres 24.1 27.4 33.5 16.7 21.7 –8.3 3.5 2.0 1.1 5.7 Aruba – – – – – – – – – – Bahamas 0.9 1.2 1.2 0.9 0.9 –0.7 0.3 0.1 0.2 –0.0 Bermuda 0.1 0.1 0.1 – 0.0 –0.0 – – – 0.0 Cayman Islands 17.1 14.5 14.6 9.7 9.6 –5.5 –2.1 –0.3 –0.8 –0.1 Hong Kong SAR 2.3 6.0 7.5 3.0 4.2 –1.0 3.7 1.4 1.6 1.4 Lebanon – – – – – – – – – – Netherlands Antilles 1.7 2.4 5.5 1.0 3.9 –0.9 0.7 0.1 0.0 3.0 Panama – 0.1 0.1 0.0 0.0 – 0.1 0.0 0.0 –0.0 Singapore 2.0 2.9 4.2 2.1 3.0 –0.2 0.8 0.8 –0.1 1.2 West Indies UK 0.0 0.0 0.0 0.0 0.0 –0.0 –0.0 – 0.0 –0.0
Developing countries 9.2 6.2 6.9 2.1 3.6 3.0 –3.0 0.1 –1.7 0.7
Africa & Middle East 1.2 0.2 0.4 0.1 0.3 –0.2 –0.9 0.0 –0.2 0.2 Israel – – 0.1 – 0.1 – – – – 0.1 Qatar – – – – – – – – – – South Africa – – 0.0 – 0.0 – – – – 0.0 Tunisia – – – – – – – – – – United Arab Emirates 1.2 0.2 0.3 0.1 0.2 –0.1 –0.9 0.0 –0.2 0.1
Asia & Pacific 6.7 4.1 4.4 1.1 2.4 3.4 –2.6 –0.3 –1.7 0.2 China – – – – – – – – – – Chinese Taipei – – – – – – – – – – India – 0.0 0.0 – – – 0.0 0.0 – – Indonesia – – – – – – – – – – Malaysia – – – – – – – – – – Philippines – – – – – –0.1 – – – – South Korea 6.7 4.1 4.4 1.1 2.4 3.5 –2.6 –0.3 –1.7 0.2 Thailand – – – – – –0.1 – – – –
Europe – – – – – –0.0 – – – – Croatia – – – – – – – – – – Hungary – – – – – – – – – – Poland – – – – – – – – – – Russia – – – – – – – – – – Turkey – – – – – – – – – –
Latin America & Caribbean 1.3 1.8 2.1 0.9 0.9 –0.2 0.5 0.4 0.2 0.2 Argentina 0.1 0.1 0.1 – – –0.1 – – – – Brazil 1.1 1.8 1.9 0.9 0.9 –0.2 0.6 0.4 0.2 0.2 Chile – – – – – – – – – – Colombia – – – – – – – – – – Mexico 0.1 0.0 0.1 – 0.1 0.0 –0.1 0.0 –0.1 0.1 Peru – – – – – – – – – – Uruguay – – – – – – – – – – Venezuela – – – – – – – – – –
Int. organisations 8.0 11.0 19.2 10.2 15.6 –11.4 3.0 –3.6 4.6 8.1
Net issuesAmounts outstanding Gross issuance
Table 14A: International money market instruments - all issuersBy residence of issuerIn billions of US dollars
A 120 BIS Quarterly Review, June 2011

Countries Dec 2009 Dec 2010 Mar 2011 Q4 2010 Q1 2011 2009 2010 Q3 2010 Q4 2010 Q1 2011
All countries 26,061.2 26,772.7 28,063.6 1,070.7 1,562.8 2,566.6 1,500.9 445.2 352.9 449.2
Developed countries 22,769.0 23,228.5 24,369.9 940.2 1,352.7 2,350.2 1,241.1 362.2 297.2 347.6 Australia 493.6 539.6 548.5 29.3 32.7 61.9 37.2 18.4 5.5 0.1 Austria 373.2 350.4 370.5 5.0 19.5 21.5 –6.8 –1.2 –3.9 1.8 Belgium 303.6 302.4 337.5 0.7 16.8 56.4 19.3 2.9 –3.1 16.7 Canada 564.8 653.9 681.3 31.4 40.4 72.2 81.0 12.4 28.0 15.2 Cyprus 12.1 13.2 14.4 1.4 0.5 3.1 2.0 –0.1 1.4 0.5 Denmark 141.5 129.9 149.5 6.6 15.7 32.2 –5.9 –9.7 –0.8 13.6 Finland 127.5 136.9 155.5 10.8 19.8 21.2 15.8 –0.6 7.4 11.5 France 1,774.4 1,817.2 1,972.8 91.0 139.6 295.3 142.3 39.2 33.4 58.4 Germany 2,055.2 1,937.9 2,047.5 48.8 145.7 –40.2 –8.6 –0.0 –18.1 10.3 Greece 257.5 329.6 355.1 27.7 6.5 61.5 89.4 5.8 23.0 4.9 Iceland 42.3 32.6 32.5 0.1 – –10.6 –8.4 –0.2 –2.6 –1.2 Ireland 1,270.1 1,171.0 1,188.4 29.3 16.4 132.5 –23.2 –25.5 –7.1 –42.7 Italy 1,171.6 1,134.2 1,219.7 44.3 58.6 121.1 41.8 29.3 19.4 17.3 Japan 168.1 181.7 183.3 1.8 12.3 –13.9 1.3 6.1 –1.2 2.5 Luxembourg 450.8 421.5 436.0 20.3 19.8 23.1 –12.7 –8.8 4.3 –0.9 Netherlands 1,835.9 1,849.0 1,965.4 58.6 95.5 192.4 104.4 52.7 15.5 27.3 New Zealand 10.6 12.6 14.7 3.4 2.0 –1.5 1.9 0.0 3.4 2.0 Norway 179.3 202.3 224.2 12.4 27.3 20.2 24.0 6.5 1.7 15.3 Portugal 180.8 182.8 198.7 3.6 8.2 46.5 15.3 5.2 2.4 4.3 Slovakia 8.2 11.7 14.2 2.8 1.7 2.7 4.2 – 2.8 1.7 Spain 1,466.3 1,434.9 1,569.5 26.7 96.0 183.6 69.3 38.1 12.6 47.0 Sweden 319.7 343.7 369.2 18.2 41.4 79.4 29.3 4.4 8.6 10.8 Switzerland 25.9 28.5 35.7 1.7 6.9 0.2 1.6 –0.0 1.3 6.2 United Kingdom 3,553.7 3,488.2 3,630.5 110.4 152.5 249.4 55.3 52.3 –29.2 33.3 United States 5,966.1 6,503.6 6,630.1 354.0 372.4 732.5 567.4 135.0 192.7 87.1
Offshore centres 1,488.2 1,519.3 1,528.5 45.6 48.1 –1.1 31.9 23.2 15.9 –3.0 Aruba 6.1 6.7 6.5 – – –2.1 –0.0 –0.0 – –0.1 Bahamas 9.1 8.4 8.2 0.2 0.1 1.3 –0.7 0.5 –0.9 –0.2 Bermuda 69.0 80.5 82.8 6.1 5.3 15.6 11.4 4.7 5.1 1.9 Cayman Islands 1,129.6 1,136.6 1,139.4 22.5 30.5 –0.6 6.9 7.3 6.8 –5.3 Hong Kong SAR 44.0 57.5 57.2 7.8 3.8 –1.5 13.4 4.1 5.5 –0.5 Lebanon 23.7 24.7 25.0 1.7 0.3 –0.4 1.1 –0.2 1.0 0.3 Netherlands Antilles 105.6 93.0 95.3 2.3 3.0 –12.4 –10.5 –1.9 –2.9 –0.8 Panama 10.8 10.6 10.7 – 0.5 1.3 –0.1 – –0.2 0.1 Singapore 49.4 53.7 56.2 1.4 2.4 –2.2 3.5 3.3 0.5 2.0 West Indies UK 28.0 34.4 35.0 3.1 1.9 –0.9 6.6 5.2 1.4 0.5
Developing countries 1,012.0 1,143.2 1,207.1 53.0 75.6 104.5 137.7 39.4 41.0 50.3
Africa & Middle East 138.9 154.4 161.4 6.4 7.4 22.8 15.8 5.7 5.3 5.9 Israel 14.4 16.5 16.5 0.1 – 0.6 2.2 –0.2 0.1 –0.1 Qatar 21.8 25.7 25.6 – – 10.5 3.9 3.4 –0.0 –0.1 South Africa 23.0 27.2 32.9 0.0 5.2 1.0 4.3 2.3 0.8 5.2 Tunisia 3.8 3.4 3.5 – – –0.2 –0.4 –0.4 – – United Arab Emirates 53.9 54.5 54.8 4.9 1.4 8.9 0.7 0.2 2.4 0.1
Asia & Pacific 279.9 309.2 323.6 17.9 21.8 26.0 26.7 6.0 12.8 13.5 China 24.9 24.3 27.2 2.2 2.7 2.4 –0.6 –1.4 2.2 2.6 Chinese Taipei 5.7 6.9 7.6 0.8 0.8 –3.7 1.2 1.0 0.5 0.7 India 30.5 28.5 27.6 0.2 1.8 0.2 –2.2 –1.2 –0.6 –0.9 Indonesia 19.1 22.9 22.4 0.6 0.2 5.6 3.6 –0.2 0.4 –0.4 Malaysia 24.5 27.5 27.7 – 0.3 –0.5 2.7 1.2 –0.3 0.2 Philippines 35.9 39.0 41.0 1.5 3.7 4.4 2.7 0.7 1.1 2.0 South Korea 117.7 132.1 139.6 7.7 10.0 16.2 13.2 5.6 4.0 7.0 Thailand 8.5 8.1 8.4 0.2 0.3 –0.5 –0.7 – –0.1 0.3
Europe 250.4 273.9 296.4 7.0 21.9 17.2 30.8 11.1 4.4 14.1 Croatia 7.6 7.6 8.2 – 1.7 1.3 0.5 1.2 – 0.3 Hungary 38.4 35.2 39.5 – 3.8 –0.1 –1.1 –1.8 –0.6 2.6 Poland 52.5 57.4 60.7 – 2.1 8.7 6.7 2.6 –1.0 0.7 Russia 61.0 65.7 70.4 2.4 5.8 –2.3 4.8 0.5 1.8 4.1 Turkey 42.8 48.5 52.3 1.7 3.9 1.6 6.5 3.0 1.7 2.9
Latin America & Caribbean 342.8 405.7 425.7 21.8 24.5 38.4 64.4 16.6 18.5 16.8 Argentina 55.3 56.2 58.8 1.5 1.3 –4.5 2.6 0.6 0.9 1.3 Brazil 89.7 115.7 119.2 8.4 6.7 12.8 26.0 5.2 8.1 2.7 Chile 14.8 22.2 24.4 2.1 2.3 1.8 7.3 3.4 2.6 2.1 Colombia 21.9 22.3 23.8 – 1.6 4.6 0.3 0.8 –0.5 1.6 Mexico 76.9 93.2 98.9 3.6 7.3 13.3 16.0 3.6 0.6 4.9 Peru 13.3 19.4 20.2 3.0 0.8 3.4 6.1 0.9 3.6 0.8 Uruguay 9.3 9.2 8.5 – – 0.3 –0.0 – – –0.8 Venezuela 43.0 48.1 51.4 3.0 3.0 9.3 5.2 1.7 3.2 3.2
Int. organisations 792.1 881.6 958.1 31.9 86.4 113.0 90.2 20.4 –1.3 54.3
Net issuesAmounts outstanding Announced issues
Table 14B: International bonds and notes - all issuersBy residence of issuerIn billions of US dollars
BIS Quarterly Review, June 2011 A 121

Countries Dec 2009 Dec 2010 Mar 2011 Q4 2010 Q1 2011 2009 2010 Q3 2010 Q4 2010 Q1 2011
All countries 932.2 915.8 982.0 638.7 669.8 –237.5 13.4 45.5 –54.3 38.0
Developed countries 898.1 878.9 934.4 612.8 636.1 –225.9 10.5 48.5 –57.5 27.9 Australia 28.4 31.1 30.5 25.5 21.7 –0.7 3.1 –3.8 8.7 –0.9 Austria 13.3 12.4 25.1 7.1 19.0 –15.3 –0.5 0.7 –2.2 12.2 Belgium 27.6 18.3 16.6 11.8 10.6 2.4 –8.2 0.9 –7.2 –2.5 Canada 5.5 3.5 3.8 3.2 3.3 0.8 –1.9 –0.4 –1.5 0.2 Cyprus 0.9 1.7 2.0 0.4 0.2 0.3 0.8 1.2 –0.3 0.2 Denmark 17.3 11.9 10.4 9.9 9.2 –4.4 –5.3 0.9 –2.4 –1.7 Finland 12.4 12.3 13.1 9.5 8.4 4.0 0.3 –0.0 0.9 0.5 France 101.9 117.8 157.2 88.2 125.2 –6.5 17.8 2.6 –4.2 34.8 Germany 113.3 122.1 132.6 93.4 97.8 –46.5 11.8 2.7 –0.1 7.0 Greece 3.8 7.4 3.8 3.5 1.3 –11.2 3.9 –0.6 3.4 –3.9 Iceland 1.8 0.1 0.1 0.1 0.0 1.0 –1.7 –2.6 –0.2 0.0 Ireland 50.5 43.5 22.4 22.7 17.0 –16.1 –4.8 –7.6 7.5 –22.7 Italy 45.8 40.5 43.7 34.9 37.7 –13.9 –3.2 18.9 –20.4 1.0 Japan 18.3 19.6 22.4 16.1 18.7 0.5 1.3 3.6 0.5 2.4 Luxembourg 3.4 4.2 4.0 3.7 3.0 –2.5 0.9 –0.1 –0.6 –0.2 Netherlands 86.6 91.7 95.3 59.7 61.1 –2.3 7.5 19.4 0.4 0.8 New Zealand 0.2 0.4 1.3 0.4 1.1 0.1 0.2 0.0 0.3 0.8 Norway 7.3 4.8 9.0 1.9 6.8 –7.3 –2.7 0.5 –4.2 4.1 Portugal 25.8 9.2 9.9 7.6 8.4 4.8 –14.6 –1.7 –5.6 0.3 Slovakia – – – – – – – – – – Spain 87.2 60.1 62.6 47.5 51.9 20.9 –22.2 4.5 –15.7 –0.7 Sweden 46.3 47.8 40.3 38.3 29.4 4.9 3.5 –1.7 1.2 –8.8 Switzerland 12.0 10.5 12.3 8.3 10.0 –6.0 –1.5 –2.4 1.5 1.6 United Kingdom 118.2 98.4 103.1 62.6 62.8 –90.7 –14.5 4.0 –25.4 0.8 United States 70.2 109.6 113.0 56.7 31.6 –42.5 40.5 9.6 8.1 2.6
Offshore centres 11.1 12.0 13.0 10.3 11.0 –1.0 1.1 0.7 –0.2 0.9 Aruba – – – – – – – – – – Bahamas 0.0 – – – – –0.0 –0.0 – – – Bermuda – – – – – – – – – – Cayman Islands 9.9 9.4 8.7 8.4 7.9 –0.8 –0.2 0.2 –0.7 –0.8 Hong Kong SAR 0.3 1.2 1.4 0.7 0.7 –0.3 0.9 0.2 0.6 0.2 Lebanon – – – – – – – – – – Netherlands Antilles – – – – – – – – – – Panama – – – – – – – – – – Singapore 0.9 1.4 2.9 1.2 2.4 0.2 0.4 0.3 –0.1 1.5 West Indies UK 0.0 – 0.0 – 0.0 –0.0 –0.0 – – 0.0
Developing countries 15.0 14.0 15.4 5.4 7.1 0.9 –1.1 –0.0 –1.2 1.2
Africa & Middle East 1.3 0.5 0.6 0.2 0.5 –0.8 –0.8 –0.1 –0.2 0.1 Israel – 0.0 0.1 – 0.1 – 0.0 0.0 – 0.1 Qatar – – – – – – – – – – South Africa 0.1 0.2 0.1 0.1 0.0 –0.7 0.1 –0.1 –0.0 –0.2 Tunisia – – – – – – – – – – United Arab Emirates 1.2 0.3 0.5 0.2 0.3 –0.1 –0.9 0.0 –0.1 0.2
Asia & Pacific 8.9 8.5 9.8 2.9 4.6 3.9 –0.5 –0.0 –0.5 1.3 China 0.8 2.8 3.9 1.4 1.5 –0.4 2.1 0.3 1.3 1.0 Chinese Taipei 0.0 0.0 0.0 0.0 0.0 –0.0 –0.0 –0.0 0.0 0.0 India 0.1 0.1 0.1 0.0 – 0.1 0.1 0.0 –0.0 –0.1 Indonesia 0.0 – – – – 0.0 –0.0 – – – Malaysia 0.4 0.5 0.4 0.1 – 0.4 –0.0 –0.1 0.0 –0.1 Philippines – – – – – –0.1 – – – – South Korea 7.6 5.0 5.5 1.4 3.1 4.1 –2.6 –0.3 –1.8 0.4 Thailand – – – – – –0.1 – – – –
Europe 1.5 1.2 1.3 0.1 0.0 –0.0 –0.3 –0.1 –0.3 0.0 Croatia – – – – – – – – – – Hungary – – – – – – – – – – Poland – – – – – – – – – – Russia 1.5 1.2 1.3 0.1 0.0 –0.0 –0.3 –0.1 –0.3 0.0 Turkey – – – – – – – – – –
Latin America & Caribbean 3.3 3.9 3.6 2.2 2.1 –2.2 0.5 0.2 –0.2 –0.2 Argentina 0.1 0.1 0.1 – – –0.1 – – – – Brazil 2.5 2.8 2.7 1.5 1.3 –2.1 0.3 –0.1 –0.1 –0.2 Chile – – – – – – – – – – Colombia – 0.1 0.1 0.0 0.0 – 0.1 0.0 0.0 –0.0 Mexico 0.7 0.8 0.8 0.6 0.7 –0.1 0.1 0.2 –0.1 –0.0 Peru – – – – – – – – – – Uruguay – – – – – – – – – – Venezuela – – – – – – – – – –
Int. organisations 8.0 11.0 19.2 10.2 15.6 –11.4 3.0 –3.6 4.6 8.1
Net issuesAmounts outstanding Gross issuance
Table 15A: International money market instruments - all issuersBy nationality of issuerIn billions of US dollars
A 122 BIS Quarterly Review, June 2011
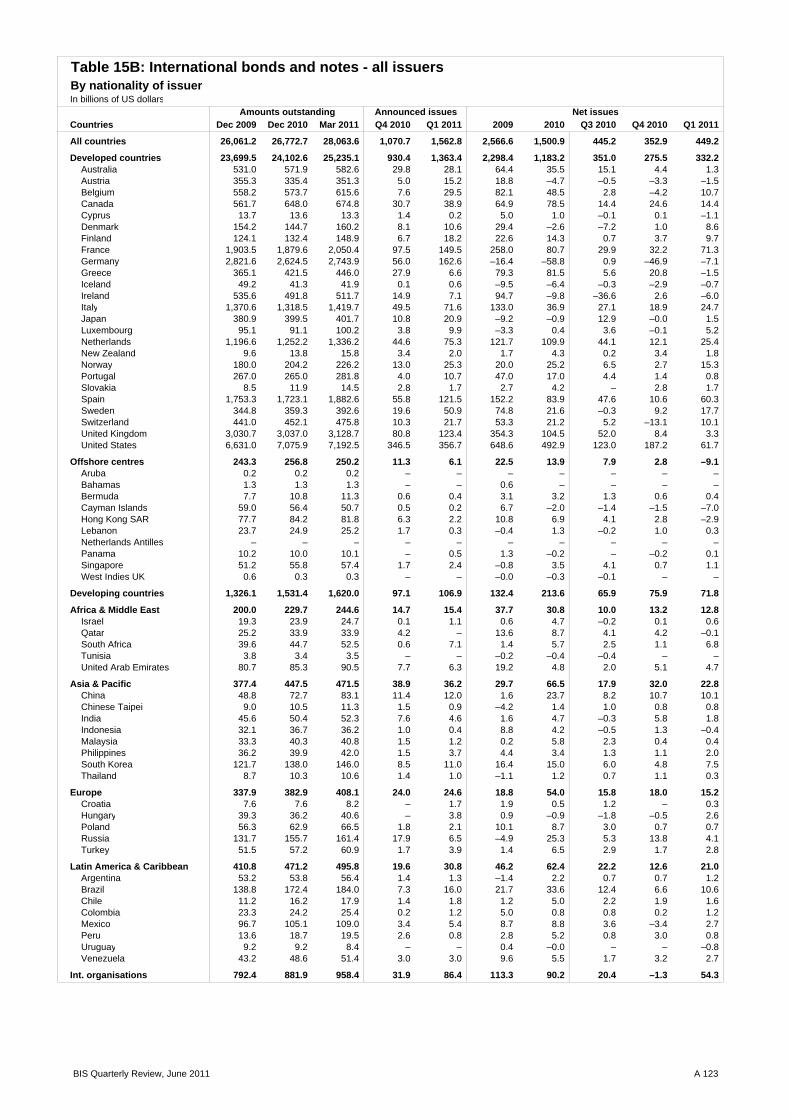
Table 15B: International bonds and notes - all issuersBy nationality of issuerIn billions of US dollars
Countries Dec 2009 Dec 2010 Mar 2011 Q4 2010 Q1 2011 2009 2010 Q3 2010 Q4 2010 Q1 2011
All countries 26,061.2 26,772.7 28,063.6 1,070.7 1,562.8 2,566.6 1,500.9 445.2 352.9 449.2
Developed countries 23,699.5 24,102.6 25,235.1 930.4 1,363.4 2,298.4 1,183.2 351.0 275.5 332.2 Australia 531.0 571.9 582.6 29.8 28.1 64.4 35.5 15.1 4.4 1.3 Austria 355.3 335.4 351.3 5.0 15.2 18.8 –4.7 –0.5 –3.3 –1.5 Belgium 558.2 573.7 615.6 7.6 29.5 82.1 48.5 2.8 –4.2 10.7 Canada 561.7 648.0 674.8 30.7 38.9 64.9 78.5 14.4 24.6 14.4 Cyprus 13.7 13.6 13.3 1.4 0.2 5.0 1.0 –0.1 0.1 –1.1 Denmark 154.2 144.7 160.2 8.1 10.6 29.4 –2.6 –7.2 1.0 8.6 Finland 124.1 132.4 148.9 6.7 18.2 22.6 14.3 0.7 3.7 9.7 France 1,903.5 1,879.6 2,050.4 97.5 149.5 258.0 80.7 29.9 32.2 71.3 Germany 2,821.6 2,624.5 2,743.9 56.0 162.6 –16.4 –58.8 0.9 –46.9 –7.1 Greece 365.1 421.5 446.0 27.9 6.6 79.3 81.5 5.6 20.8 –1.5 Iceland 49.2 41.3 41.9 0.1 0.6 –9.5 –6.4 –0.3 –2.9 –0.7 Ireland 535.6 491.8 511.7 14.9 7.1 94.7 –9.8 –36.6 2.6 –6.0 Italy 1,370.6 1,318.5 1,419.7 49.5 71.6 133.0 36.9 27.1 18.9 24.7 Japan 380.9 399.5 401.7 10.8 20.9 –9.2 –0.9 12.9 –0.0 1.5 Luxembourg 95.1 91.1 100.2 3.8 9.9 –3.3 0.4 3.6 –0.1 5.2 Netherlands 1,196.6 1,252.2 1,336.2 44.6 75.3 121.7 109.9 44.1 12.1 25.4 New Zealand 9.6 13.8 15.8 3.4 2.0 1.7 4.3 0.2 3.4 1.8 Norway 180.0 204.2 226.2 13.0 25.3 20.0 25.2 6.5 2.7 15.3 Portugal 267.0 265.0 281.8 4.0 10.7 47.0 17.0 4.4 1.4 0.8 Slovakia 8.5 11.9 14.5 2.8 1.7 2.7 4.2 – 2.8 1.7 Spain 1,753.3 1,723.1 1,882.6 55.8 121.5 152.2 83.9 47.6 10.6 60.3 Sweden 344.8 359.3 392.6 19.6 50.9 74.8 21.6 –0.3 9.2 17.7 Switzerland 441.0 452.1 475.8 10.3 21.7 53.3 21.2 5.2 –13.1 10.1 United Kingdom 3,030.7 3,037.0 3,128.7 80.8 123.4 354.3 104.5 52.0 8.4 3.3 United States 6,631.0 7,075.9 7,192.5 346.5 356.7 648.6 492.9 123.0 187.2 61.7
Offshore centres 243.3 256.8 250.2 11.3 6.1 22.5 13.9 7.9 2.8 –9.1 Aruba 0.2 0.2 0.2 – – – – – – – Bahamas 1.3 1.3 1.3 – – 0.6 – – – – Bermuda 7.7 10.8 11.3 0.6 0.4 3.1 3.2 1.3 0.6 0.4 Cayman Islands 59.0 56.4 50.7 0.5 0.2 6.7 –2.0 –1.4 –1.5 –7.0 Hong Kong SAR 77.7 84.2 81.8 6.3 2.2 10.8 6.9 4.1 2.8 –2.9 Lebanon 23.7 24.9 25.2 1.7 0.3 –0.4 1.3 –0.2 1.0 0.3 Netherlands Antilles – – – – – – – – – – Panama 10.2 10.0 10.1 – 0.5 1.3 –0.2 – –0.2 0.1 Singapore 51.2 55.8 57.4 1.7 2.4 –0.8 3.5 4.1 0.7 1.1 West Indies UK 0.6 0.3 0.3 – – –0.0 –0.3 –0.1 – –
Developing countries 1,326.1 1,531.4 1,620.0 97.1 106.9 132.4 213.6 65.9 75.9 71.8
Africa & Middle East 200.0 229.7 244.6 14.7 15.4 37.7 30.8 10.0 13.2 12.8 Israel 19.3 23.9 24.7 0.1 1.1 0.6 4.7 –0.2 0.1 0.6 Qatar 25.2 33.9 33.9 4.2 – 13.6 8.7 4.1 4.2 –0.1 South Africa 39.6 44.7 52.5 0.6 7.1 1.4 5.7 2.5 1.1 6.8 Tunisia 3.8 3.4 3.5 – – –0.2 –0.4 –0.4 – – United Arab Emirates 80.7 85.3 90.5 7.7 6.3 19.2 4.8 2.0 5.1 4.7
Asia & Pacific 377.4 447.5 471.5 38.9 36.2 29.7 66.5 17.9 32.0 22.8 China 48.8 72.7 83.1 11.4 12.0 1.6 23.7 8.2 10.7 10.1 Chinese Taipei 9.0 10.5 11.3 1.5 0.9 –4.2 1.4 1.0 0.8 0.8 India 45.6 50.4 52.3 7.6 4.6 1.6 4.7 –0.3 5.8 1.8 Indonesia 32.1 36.7 36.2 1.0 0.4 8.8 4.2 –0.5 1.3 –0.4 Malaysia 33.3 40.3 40.8 1.5 1.2 0.2 5.8 2.3 0.4 0.4 Philippines 36.2 39.9 42.0 1.5 3.7 4.4 3.4 1.3 1.1 2.0 South Korea 121.7 138.0 146.0 8.5 11.0 16.4 15.0 6.0 4.8 7.5 Thailand 8.7 10.3 10.6 1.4 1.0 –1.1 1.2 0.7 1.1 0.3
Europe 337.9 382.9 408.1 24.0 24.6 18.8 54.0 15.8 18.0 15.2 Croatia 7.6 7.6 8.2 – 1.7 1.9 0.5 1.2 – 0.3 Hungary 39.3 36.2 40.6 – 3.8 0.9 –0.9 –1.8 –0.5 2.6 Poland 56.3 62.9 66.5 1.8 2.1 10.1 8.7 3.0 0.7 0.7 Russia 131.7 155.7 161.4 17.9 6.5 –4.9 25.3 5.3 13.8 4.1 Turkey 51.5 57.2 60.9 1.7 3.9 1.4 6.5 2.9 1.7 2.8
Latin America & Caribbean 410.8 471.2 495.8 19.6 30.8 46.2 62.4 22.2 12.6 21.0 Argentina 53.2 53.8 56.4 1.4 1.3 –1.4 2.2 0.7 0.7 1.2 Brazil 138.8 172.4 184.0 7.3 16.0 21.7 33.6 12.4 6.6 10.6 Chile 11.2 16.2 17.9 1.4 1.8 1.2 5.0 2.2 1.9 1.6 Colombia 23.3 24.2 25.4 0.2 1.2 5.0 0.8 0.8 0.2 1.2 Mexico 96.7 105.1 109.0 3.4 5.4 8.7 8.8 3.6 –3.4 2.7 Peru 13.6 18.7 19.5 2.6 0.8 2.8 5.2 0.8 3.0 0.8 Uruguay 9.2 9.2 8.4 – – 0.4 –0.0 – – –0.8 Venezuela 43.2 48.6 51.4 3.0 3.0 9.6 5.5 1.7 3.2 2.7
Int. organisations 792.4 881.9 958.4 31.9 86.4 113.3 90.2 20.4 –1.3 54.3
Net issuesAmounts outstanding Announced issues
BIS Quarterly Review, June 2011 A 123

Sector and country Dec 2008 Dec 2009 Sep 2010 Dec 2010 2009 2010 Q1 2010 Q2 2010 Q3 2010 Q4 2010
All issuers 58,599.5 63,421.2 66,256.5 67,153.7 3,268.6 2,664.3 352.7 809.6 762.7 739.3 Argentina 66.2 57.3 58.4 58.9 –5.3 3.2 0.1 1.5 0.9 0.6 Australia 639.6 874.9 967.4 1,043.6 42.2 48.5 10.1 6.1 6.4 25.8 Austria 328.3 364.7 358.7 352.3 22.7 12.9 –7.2 11.0 8.0 1.1 Belgium 482.6 595.9 568.8 564.7 92.3 11.6 –5.1 –0.5 9.3 8.0 Brazil 858.8 1,237.2 1,296.9 1,337.5 69.4 58.9 8.6 –15.7 39.9 26.1 Canada 1,033.9 1,304.3 1,388.5 1,460.8 84.8 94.4 20.9 30.0 11.8 31.8 China 2,209.5 2,565.4 2,969.1 3,031.4 331.2 376.4 80.7 181.5 87.1 27.1 Czech Republic 65.2 80.3 78.5 74.2 12.1 –4.6 –6.5 1.8 1.3 –1.2 Denmark 591.1 691.2 607.8 659.9 95.0 17.8 –85.0 11.2 21.4 70.2 Finland 88.5 93.2 89.5 87.4 2.4 0.5 –5.5 3.6 2.6 –0.1 France 2,885.4 3,146.0 3,198.5 3,170.2 144.4 254.5 143.9 44.3 27.0 39.3 Germany 2,592.8 2,806.7 2,710.5 2,615.9 107.4 10.2 2.6 17.5 28.5 –38.4 Greece 224.3 227.6 231.3 256.5 –4.7 45.6 3.7 1.7 9.6 30.5 Hong Kong SAR 50.2 99.9 61.9 65.5 49.7 –34.2 11.8 5.8 –55.5 3.7 India 426.7 603.1 706.8 708.5 154.1 78.2 27.9 23.5 26.8 – Indonesia 70.7 97.7 107.3 93.4 13.7 –8.9 4.5 –0.2 –0.1 –13.2 Ireland 275.5 315.3 309.2 303.2 –16.6 11.4 11.4 –10.1 9.6 0.5 Italy 2,813.0 3,191.0 3,077.0 3,000.0 258.9 40.7 39.8 12.2 1.5 –12.7 Japan 11,052.1 11,521.5 13,275.1 13,734.4 614.2 649.8 184.3 289.7 36.2 139.5 Malaysia 172.7 189.3 218.8 239.9 14.2 28.9 4.6 1.7 2.0 20.6 Mexico 319.5 362.8 413.5 429.0 30.8 44.6 15.5 14.7 3.7 10.6 Netherlands 945.8 1,005.5 986.5 976.6 26.1 43.4 10.8 20.2 1.4 11.0 Norway 135.9 238.2 244.2 245.6 66.5 10.1 0.9 4.2 2.9 2.2 Poland 152.0 183.7 208.5 202.0 23.3 25.3 18.2 3.2 7.6 –3.7 Portugal 201.9 236.1 252.4 271.8 25.9 52.0 –0.9 14.4 13.4 25.1 Singapore 96.4 113.0 122.6 128.7 13.5 5.3 1.0 1.1 – 3.2 South Africa 93.8 140.4 169.7 189.0 20.1 29.8 6.4 10.0 3.5 9.9 South Korea 863.5 1,066.1 1,118.1 1,111.0 118.5 16.5 23.4 0.6 5.0 –12.4 Spain 1,360.7 1,560.8 1,465.3 1,475.2 142.9 27.0 –27.6 –14.4 27.8 41.3 Sweden 346.1 371.1 412.4 414.4 –6.9 19.4 5.1 2.6 9.0 2.7 Switzerland 259.0 259.5 275.5 291.0 –9.5 5.6 3.2 6.6 –9.7 5.5 Thailand 143.4 180.4 218.0 225.5 29.3 24.7 7.8 7.7 3.2 5.9 Turkey 180.6 221.7 242.5 229.9 35.5 15.8 7.2 1.9 4.4 2.4 United Kingdom 1,219.3 1,548.8 1,679.8 1,647.0 182.5 148.4 77.9 14.6 61.5 –5.5 United States 24,567.2 24,965.8 25,096.3 25,349.0 398.6 383.2 –279.2 98.6 311.0 252.8
Governments 29,448.2 34,088.1 37,852.4 38,959.9 3,843.7 3,764.4 1,178.3 1,015.6 631.8 938.8 Argentina 54.4 46.7 48.9 49.4 –4.2 4.3 0.8 1.7 1.2 0.7 Australia 109.3 230.5 310.4 339.9 74.8 70.7 21.0 17.7 18.7 13.2 Austria 110.6 132.6 134.4 135.1 17.1 11.1 –8.8 10.7 5.6 3.6 Belgium 279.4 297.6 286.5 288.3 7.1 12.5 4.0 –2.0 2.5 8.0 Brazil 545.8 803.7 821.9 829.4 59.7 0.2 1.2 –25.0 25.5 –1.6 Canada 675.1 908.8 970.7 1,021.5 107.5 69.3 15.4 20.7 10.7 22.5 China 1,416.5 1,459.8 1,616.9 1,622.8 19.4 114.0 18.2 104.6 4.4 –13.1 Czech Republic 45.4 55.9 53.4 48.7 8.5 –6.4 –6.6 1.7 1.2 –2.7 Denmark 85.4 97.5 106.3 99.4 10.2 9.1 5.6 6.0 1.6 –4.2 Egypt 49.7 67.6 78.1 78.1 17.4 13.4 9.4 –0.2 4.3 – Finland 24.0 28.3 30.7 33.0 3.9 6.4 –3.5 4.0 2.9 3.0 France 1,436.8 1,693.3 1,695.5 1,700.4 195.0 129.2 37.3 53.3 –2.5 41.1 Germany 1,364.3 1,547.6 1,555.5 1,724.4 126.5 290.6 28.4 44.1 13.1 204.9 Greece 181.5 181.1 160.9 159.1 –6.7 –8.4 –0.6 –12.8 3.4 1.5 Hong Kong SAR 21.0 69.8 29.3 30.7 48.8 –38.9 10.9 5.6 –56.8 1.4 India 387.6 530.5 606.8 608.3 123.2 54.1 10.8 22.5 20.8 – Indonesia 63.8 87.8 97.2 81.9 12.1 –10.2 4.7 –0.3 0.1 –14.7 Ireland 60.7 54.0 71.3 65.4 –13.1 15.1 8.3 2.8 8.5 –4.5 Italy 1,779.7 1,972.8 1,973.5 1,933.5 118.2 103.4 53.3 25.3 23.4 1.5 Japan 9,113.2 9,654.2 11,212.8 11,632.3 657.4 657.8 239.4 251.0 18.4 149.0 Malaysia 76.6 93.7 112.8 128.0 15.7 23.2 4.6 1.7 2.0 14.9 Mexico 174.6 210.0 239.4 247.0 27.6 24.5 11.1 9.9 –1.2 4.7 Netherlands 374.5 381.1 384.7 385.7 –5.1 31.8 6.3 13.1 3.3 9.2 Norway 49.5 94.7 98.4 98.5 31.7 4.9 1.6 2.3 0.6 0.4 Poland 147.8 176.6 199.9 193.6 20.6 23.7 18.1 1.5 7.9 –3.7 Portugal 86.9 98.8 108.6 114.8 8.5 22.6 –1.1 7.7 7.4 8.6 Singapore 72.7 88.1 97.2 102.8 13.1 6.4 2.1 1.1 – 3.2 South Africa 57.2 86.5 109.4 124.5 13.2 25.6 6.2 7.9 2.6 8.9 South Korea 337.5 425.6 480.6 475.1 52.4 37.6 32.7 4.5 8.2 –7.8 Spain 448.9 603.5 606.0 629.4 134.5 68.7 –1.6 23.2 10.4 36.7 Sweden 112.7 118.9 126.3 132.5 –3.8 6.4 4.0 0.2 –4.2 6.4 Switzerland 119.8 113.1 118.1 125.5 –10.2 1.2 3.6 3.7 –9.3 3.1 Thailand 97.3 125.5 159.6 166.1 22.8 25.9 8.0 6.8 5.8 5.3 Turkey 180.2 221.3 240.3 227.6 35.5 13.8 7.1 1.6 3.1 2.1 United Kingdom 825.8 1,188.9 1,343.8 1,324.2 262.9 172.4 84.3 38.6 47.2 2.3 United States 7,898.5 9,471.8 10,744.6 11,151.7 1,573.3 1,679.9 516.6 356.4 399.8 407.1
Amounts outstanding Changes in stocks
Table 16A: Domestic debt securitiesBy sector and residence of issuerIn billions of US dollars
A 124 BIS Quarterly Review, June 2011

Sector and country Dec 2008 Dec 2009 Sep 2010 Dec 2010 2009 2010 Q1 2010 Q2 2010 Q3 2010 Q4 2010
Financial institutions 23,382.0 23,121.1 21,832.2 21,521.9 –896.8 –1,497.8 –958.6 –313.5 58.4 –284.1 Argentina 4.0 3.2 3.1 3.0 –0.7 –0.2 0.2 –0.2 –0.0 –0.1 Australia 500.5 606.1 616.0 659.5 –32.5 –23.0 –10.4 –11.0 –13.1 11.6 Austria 185.8 191.6 180.5 173.3 –1.4 –4.5 0.1 –0.8 –0.2 –3.5 Belgium 181.8 268.3 258.0 252.6 77.7 3.1 –8.3 0.5 10.9 – Brazil 306.2 423.8 465.0 497.4 8.8 58.1 7.6 9.0 14.4 27.1 Canada 249.2 252.2 261.5 273.8 –36.5 9.9 1.8 5.8 –2.5 4.7 China 607.5 751.9 859.0 886.5 143.8 108.7 24.4 28.1 39.1 17.2 Czech Republic 14.5 16.5 17.1 16.3 1.3 0.2 0.1 0.1 0.1 –0.1 Denmark 503.7 592.0 500.1 559.1 85.1 8.8 –90.4 5.2 19.8 74.3 Finland 52.9 52.6 45.7 42.5 –2.0 –6.3 –1.9 –1.1 –0.9 –2.3 France 1,159.8 1,174.7 1,207.7 1,182.5 –32.1 95.7 86.7 –2.6 11.4 0.1 Germany 928.6 914.4 806.0 539.4 –51.9 –313.6 –47.1 –29.5 17.0 –253.9 Greece 16.8 17.9 70.3 97.3 0.3 79.0 3.5 40.4 6.2 29.0 Hong Kong SAR 19.3 18.6 20.6 22.9 –0.7 4.4 0.6 0.2 1.2 2.3 India 31.2 53.2 75.1 75.3 20.1 19.3 20.2 –4.3 3.4 – Indonesia 3.3 4.8 4.7 5.3 0.9 0.3 –0.2 0.0 –0.2 0.7 Ireland 214.9 258.9 234.7 235.1 –3.4 –4.2 3.0 –13.5 0.9 5.4 Italy 675.6 782.6 730.6 702.6 76.5 –23.0 0.3 –5.5 –4.9 –12.8 Japan 1,172.3 1,084.5 1,206.4 1,201.2 –70.4 –24.3 –27.3 16.6 20.1 –33.6 Malaysia 40.4 40.6 45.0 47.6 –0.2 2.4 – – – 2.4 Mexico 119.9 123.7 140.8 146.5 0.0 15.5 3.4 3.7 4.4 4.1 Netherlands 492.4 509.7 481.2 472.9 0.2 0.1 –1.9 –0.1 0.3 1.8 Norway 65.3 116.5 119.7 120.4 33.6 5.3 –0.4 1.6 3.0 1.1 Poland 4.2 7.1 8.6 8.4 2.7 1.6 0.1 1.7 –0.2 –0.0 Portugal 68.9 85.4 92.0 105.5 13.6 26.1 0.1 4.8 5.6 15.7 Singapore 18.1 22.1 22.8 23.3 3.2 –0.7 –0.7 0.0 – – South Africa 23.1 32.2 33.9 36.0 2.8 0.1 –1.2 1.2 –0.1 0.2 South Korea 307.9 331.0 271.9 255.3 –0.7 –82.7 –23.5 –21.4 –19.9 –17.9 Spain 890.4 934.4 835.9 823.1 7.2 –43.2 –27.3 –37.9 17.2 4.8 Sweden 200.0 217.3 250.4 247.2 –0.8 15.2 2.2 1.9 13.8 –2.8 Switzerland 124.4 124.6 129.7 135.8 –4.7 –0.7 –1.8 1.3 –1.6 1.5 Thailand 3.1 3.3 1.5 1.5 0.1 –2.0 –0.6 0.3 –1.8 0.1 Turkey – – – – – – – – – – United Kingdom 377.8 338.0 314.7 301.8 –83.7 –23.8 –6.6 –23.9 14.5 –7.9 United States 13,751.4 12,701.6 11,456.3 11,301.0 –1,049.7 –1,400.6 –861.5 –287.7 –96.1 –155.3
Corporate issuers 5,769.3 6,212.0 6,571.9 6,671.9 321.7 397.6 133.0 107.5 72.6 84.6 Argentina 7.8 7.5 6.4 6.5 –0.3 –0.9 –0.8 0.0 –0.2 0.1 Australia 29.8 38.3 41.0 44.1 –0.1 0.7 –0.6 –0.6 0.8 1.0 Austria 31.9 40.5 43.9 44.0 7.0 6.3 1.6 1.2 2.6 1.0 Belgium 21.5 30.0 24.3 23.8 7.5 –4.0 –0.8 1.0 –4.1 – Brazil 6.7 9.8 10.0 10.7 0.9 0.6 –0.2 0.2 –0.0 0.6 Canada 109.6 143.2 156.3 165.4 13.8 15.3 3.6 3.6 3.5 4.6 China 185.5 353.7 493.1 522.1 168.0 153.6 38.2 48.8 43.6 23.0 Czech Republic 5.3 7.8 8.0 9.2 2.3 1.6 – – – 1.6 Denmark 2.0 1.7 1.4 1.4 –0.3 –0.1 –0.2 –0.0 –0.1 0.1 Finland 11.5 12.4 13.0 12.0 0.4 0.4 –0.1 0.6 0.7 –0.8 France 288.8 278.1 295.3 287.3 –18.5 29.7 19.9 –6.4 18.0 –1.9 Germany 299.9 344.7 349.0 352.1 32.7 33.2 21.3 2.9 –1.6 10.6 Greece 25.9 28.5 0.1 0.1 1.7 –25.0 0.8 –25.8 0.0 –0.0 Hong Kong SAR 9.9 11.6 12.0 11.9 1.7 0.4 0.3 0.0 0.1 –0.1 India 7.9 19.3 24.9 25.0 10.8 4.7 –3.1 5.2 2.6 – Indonesia 3.6 5.1 5.5 6.2 0.8 0.9 –0.0 0.1 – 0.8 Ireland – 2.3 3.2 2.7 – 0.5 0.2 0.6 0.2 –0.5 Italy 357.8 435.6 373.0 363.9 64.1 –39.7 –13.7 –7.6 –17.0 –1.4 Japan 766.6 782.7 855.9 900.9 27.2 16.3 –27.8 22.2 –2.3 24.2 Malaysia 55.7 54.9 60.9 64.3 –1.3 3.3 – – – 3.3 Mexico 25.0 29.2 33.3 35.5 3.2 4.6 1.1 1.2 0.5 1.8 Netherlands 78.9 114.7 120.6 118.1 30.9 11.6 6.4 7.3 –2.2 0.0 Norway 21.1 27.0 26.1 26.6 1.2 –0.0 –0.3 0.3 –0.7 0.6 Poland – – – – – – – – – – Portugal 46.2 51.9 51.8 51.5 3.8 3.3 0.2 1.9 0.4 0.8 Singapore 5.5 2.8 2.6 2.7 –2.7 –0.4 –0.4 0.0 – – South Africa 13.4 21.6 26.4 28.6 4.1 4.0 1.3 0.9 1.0 0.7 South Korea 218.1 309.5 365.6 380.6 66.7 61.7 14.2 17.5 16.7 13.3 Spain 21.4 22.9 23.4 22.7 1.1 1.5 1.3 0.3 0.2 –0.2 Sweden 33.4 34.9 35.6 34.7 –2.4 –2.3 –1.1 0.4 –0.7 –0.9 Switzerland 14.8 21.8 27.8 29.7 5.4 5.1 1.4 1.7 1.2 0.9 Thailand 43.0 51.6 57.0 57.9 6.4 0.8 0.4 0.7 –0.8 0.5 Turkey 0.5 0.4 2.2 2.3 –0.1 1.9 0.1 0.3 1.3 0.3 United Kingdom 15.7 21.9 21.3 21.0 3.3 –0.2 0.2 –0.1 –0.3 0.0 United States 2,917.4 2,792.4 2,895.4 2,896.3 –125.0 104.0 65.7 30.0 7.3 1.0
Amounts outstanding Changes in stocks
Table 16B: Domestic debt securitiesBy sector and residence of issuerIn billions of US dollars
BIS Quarterly Review, June 2011 A 125

Countries Dec 2007 Dec 2008 Dec 2009 Sep 2010 Dec 2010 Dec 2007 Dec 2008 Dec 2009 Sep 2010 Dec 2010
All countries 14,982.7 16,458.8 16,504.3 16,831.1 16,881.1 7,450.7 7,154.0 6,813.1 6,450.5 6,208.8 Australia 541.2 414.0 479.2 471.2 502.1 515.2 390.9 429.2 407.9 440.0 Austria 18.9 20.0 17.3 14.0 13.1 5.2 7.3 3.9 2.1 1.2 Belgium 125.5 127.4 141.1 133.8 132.9 33.8 34.8 45.5 43.7 42.8 Brazil 596.2 536.4 724.1 791.4 814.5 250.9 306.2 423.8 465.0 497.4 Canada 327.4 293.7 319.3 299.2 314.0 176.7 111.1 91.7 88.5 86.7 China 659.4 907.1 881.4 982.5 975.6 53.6 55.8 78.1 94.0 111.8 Czech Republic 11.3 12.4 11.6 8.3 7.8 0.0 0.0 0.0 – – Denmark 90.7 89.4 148.2 155.3 171.9 74.1 79.0 135.7 145.3 163.8 Finland 62.2 61.7 64.6 56.3 57.0 40.9 43.8 39.4 33.8 34.2 France 930.9 1,002.0 1,000.6 992.0 965.5 541.2 534.6 490.7 494.4 476.2 Germany 1,027.1 1,214.2 1,345.9 1,208.0 936.8 691.2 871.0 848.3 781.8 392.0 Greece 18.4 29.6 27.1 26.9 26.3 – – – – – Hong Kong SAR 30.4 27.8 74.6 37.0 40.2 17.9 12.8 11.4 14.6 16.9 India 73.6 68.8 101.4 127.0 127.3 31.3 31.2 53.2 75.1 75.3 Ireland 130.2 97.4 88.4 77.3 92.1 127.3 88.0 77.3 66.5 86.6 Italy 383.5 458.1 468.2 457.9 429.8 23.9 22.6 23.4 22.2 21.7 Japan 2,516.1 3,155.7 2,981.5 3,641.2 3,791.7 296.0 379.2 368.4 445.7 440.6 Malaysia 28.0 25.4 21.2 23.5 24.8 22.4 19.9 17.4 19.3 20.4 Mexico 103.7 89.8 138.5 113.6 117.3 35.9 32.4 29.7 33.3 32.1 Netherlands 56.2 145.7 113.1 102.6 101.5 0.0 – – – – New Zealand 4.1 3.2 7.9 7.6 8.7 – – – – – Norway 24.7 25.9 59.5 59.4 58.5 11.3 6.4 2.0 3.2 3.2 Poland 12.5 20.5 31.0 40.6 34.6 – – – – – Portugal 42.5 52.3 62.8 62.7 60.0 0.9 1.8 5.5 6.9 2.4 Singapore 42.8 37.0 49.6 54.9 59.3 13.5 4.3 4.6 4.9 5.1 South Africa 19.9 22.7 25.4 30.4 31.9 5.8 4.3 5.6 4.5 4.9 South Korea 432.0 349.4 426.7 337.1 391.4 220.8 243.2 248.6 140.1 164.7 Spain 252.9 255.7 305.1 258.1 241.1 153.4 132.7 125.7 84.4 69.9 Sweden 80.3 67.2 52.7 42.9 38.9 36.5 35.9 25.3 21.8 15.1 Switzerland 29.9 35.6 32.1 32.7 34.3 10.9 11.9 12.2 10.7 11.7 Thailand 52.0 52.3 69.3 88.1 94.0 – 0.4 1.1 – – Turkey 8.2 9.4 13.4 7.8 6.2 – – – – – United Kingdom 516.9 503.9 459.1 499.6 475.4 432.9 377.8 338.0 314.7 301.8 United States 5,403.9 5,968.6 5,433.1 5,281.3 5,406.9 3,614.9 3,307.3 2,869.7 2,617.6 2,679.9
All countries 6,798.8 8,528.7 9,085.1 9,673.2 9,933.5 733.2 776.1 606.1 707.4 738.7 Australia 19.2 19.3 44.0 57.8 55.7 6.8 3.8 6.0 5.5 6.4 Austria 13.4 12.4 13.1 11.5 11.4 0.3 0.3 0.4 0.3 0.5 Belgium 83.1 83.7 86.8 86.5 86.6 8.6 9.0 8.8 3.6 3.5 Brazil 337.5 223.4 290.5 316.4 306.4 7.8 6.7 9.8 10.0 10.7 Canada 139.5 173.8 216.8 200.2 215.0 11.2 8.8 10.8 10.5 12.2 China 561.6 789.2 735.8 778.7 745.7 44.2 62.1 67.5 109.8 118.0 Czech Republic 11.3 12.4 11.6 8.3 7.8 – – – – – Denmark 16.6 10.5 12.6 10.0 8.2 – – – – – Finland 12.5 11.5 18.9 16.0 17.3 8.8 6.5 6.3 6.5 5.5 France 271.5 333.6 446.7 411.1 405.3 118.3 133.8 63.3 86.5 84.0 Germany 272.7 270.0 457.8 384.4 499.9 63.2 73.1 39.8 41.8 44.8 Greece 18.4 29.6 27.1 26.9 26.3 – – – – – Hong Kong SAR 11.4 13.9 62.0 20.7 21.1 1.1 1.0 1.3 1.7 2.2 India 32.1 29.7 28.9 27.0 27.0 10.2 7.9 19.3 24.9 25.0 Ireland 3.0 9.4 11.2 10.8 5.6 – – – – – Italy 359.5 434.5 444.0 434.6 407.0 0.1 0.9 0.7 1.1 1.1 Japan 2,080.5 2,627.6 2,489.0 3,084.7 3,224.9 139.6 149.0 124.2 110.9 126.2 Malaysia 1.3 1.2 1.3 1.4 1.4 4.3 4.2 2.6 2.8 3.0 Mexico 66.9 55.1 105.8 78.6 84.1 1.0 2.3 3.0 1.7 1.1 Netherlands 56.2 145.7 113.1 102.6 101.5 – – – – – New Zealand 4.1 3.2 7.9 7.6 8.7 – – – – – Norway 9.1 15.4 52.8 52.1 51.1 4.3 4.1 4.6 4.1 4.1 Poland 12.5 20.5 31.0 40.6 34.6 – – – – – Portugal 13.8 19.3 26.3 24.7 27.6 27.8 31.2 31.0 31.1 30.0 Singapore 27.3 31.8 44.1 49.0 53.3 2.0 0.9 0.9 0.9 1.0 South Africa 13.2 17.3 18.8 25.4 26.7 0.9 1.1 1.0 0.5 0.4 South Korea 144.2 66.4 111.8 116.0 131.3 67.0 39.8 66.3 81.0 95.5 Spain 93.7 117.0 176.1 172.8 170.6 5.8 6.0 3.2 0.9 0.5 Sweden 28.8 18.9 17.2 11.5 15.2 15.0 12.4 10.2 9.6 8.7 Switzerland 15.9 21.3 18.3 20.7 20.9 3.1 2.4 1.5 1.3 1.7 Thailand 49.8 50.0 66.1 86.1 92.1 2.3 1.9 2.1 2.0 1.9 Turkey 8.0 9.2 13.3 7.8 6.2 0.2 0.2 0.1 0.1 0.1 United Kingdom 83.3 125.8 120.1 184.0 172.5 0.7 0.3 0.9 0.9 1.1 United States 1,636.3 2,480.1 2,470.5 2,536.3 2,607.2 152.8 181.1 92.9 127.4 119.9
Corporate sector
All issuers
Table 17A: Domestic debt securitiesWith remaining maturity up to one year / Amounts outstanding by sector and residence of issuerIn billions of US dollars
Financial institutions
Governments
A 126 BIS Quarterly Review, June 2011
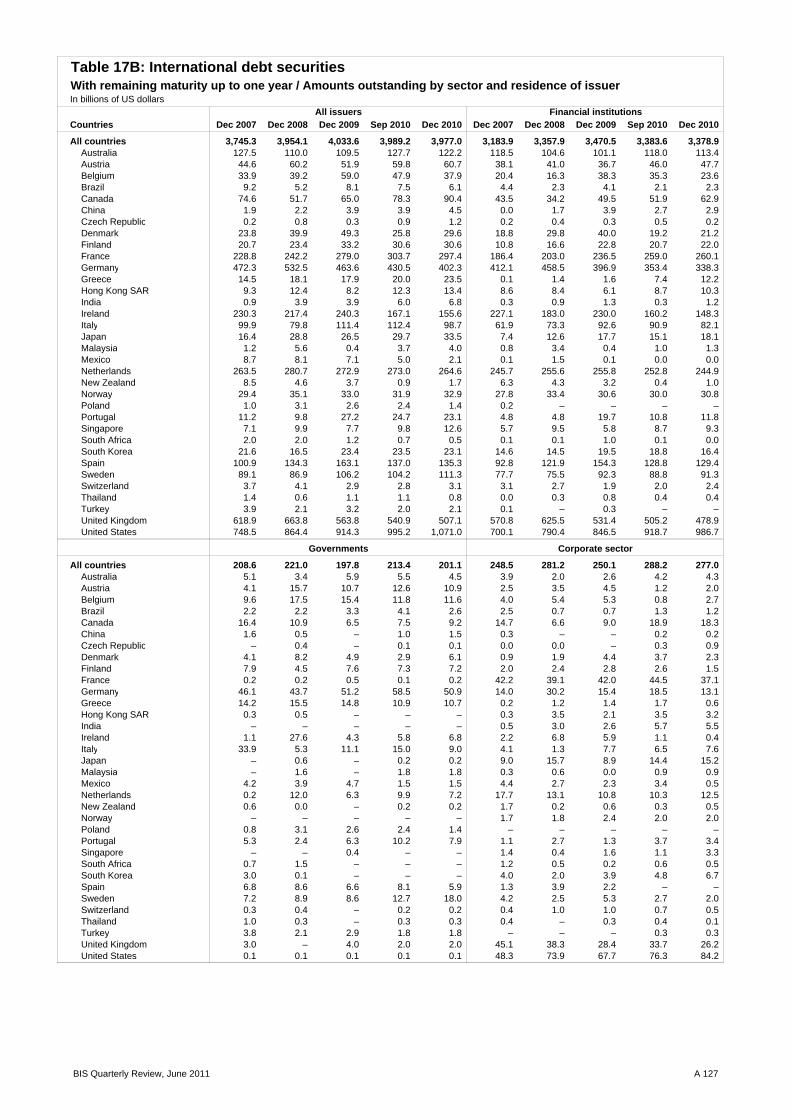
Countries Dec 2007 Dec 2008 Dec 2009 Sep 2010 Dec 2010 Dec 2007 Dec 2008 Dec 2009 Sep 2010 Dec 2010
All countries 3,745.3 3,954.1 4,033.6 3,989.2 3,977.0 3,183.9 3,357.9 3,470.5 3,383.6 3,378.9 Australia 127.5 110.0 109.5 127.7 122.2 118.5 104.6 101.1 118.0 113.4 Austria 44.6 60.2 51.9 59.8 60.7 38.1 41.0 36.7 46.0 47.7 Belgium 33.9 39.2 59.0 47.9 37.9 20.4 16.3 38.3 35.3 23.6 Brazil 9.2 5.2 8.1 7.5 6.1 4.4 2.3 4.1 2.1 2.3 Canada 74.6 51.7 65.0 78.3 90.4 43.5 34.2 49.5 51.9 62.9 China 1.9 2.2 3.9 3.9 4.5 0.0 1.7 3.9 2.7 2.9 Czech Republic 0.2 0.8 0.3 0.9 1.2 0.2 0.4 0.3 0.5 0.2 Denmark 23.8 39.9 49.3 25.8 29.6 18.8 29.8 40.0 19.2 21.2 Finland 20.7 23.4 33.2 30.6 30.6 10.8 16.6 22.8 20.7 22.0 France 228.8 242.2 279.0 303.7 297.4 186.4 203.0 236.5 259.0 260.1 Germany 472.3 532.5 463.6 430.5 402.3 412.1 458.5 396.9 353.4 338.3 Greece 14.5 18.1 17.9 20.0 23.5 0.1 1.4 1.6 7.4 12.2 Hong Kong SAR 9.3 12.4 8.2 12.3 13.4 8.6 8.4 6.1 8.7 10.3 India 0.9 3.9 3.9 6.0 6.8 0.3 0.9 1.3 0.3 1.2 Ireland 230.3 217.4 240.3 167.1 155.6 227.1 183.0 230.0 160.2 148.3 Italy 99.9 79.8 111.4 112.4 98.7 61.9 73.3 92.6 90.9 82.1 Japan 16.4 28.8 26.5 29.7 33.5 7.4 12.6 17.7 15.1 18.1 Malaysia 1.2 5.6 0.4 3.7 4.0 0.8 3.4 0.4 1.0 1.3 Mexico 8.7 8.1 7.1 5.0 2.1 0.1 1.5 0.1 0.0 0.0 Netherlands 263.5 280.7 272.9 273.0 264.6 245.7 255.6 255.8 252.8 244.9 New Zealand 8.5 4.6 3.7 0.9 1.7 6.3 4.3 3.2 0.4 1.0 Norway 29.4 35.1 33.0 31.9 32.9 27.8 33.4 30.6 30.0 30.8 Poland 1.0 3.1 2.6 2.4 1.4 0.2 – – – – Portugal 11.2 9.8 27.2 24.7 23.1 4.8 4.8 19.7 10.8 11.8 Singapore 7.1 9.9 7.7 9.8 12.6 5.7 9.5 5.8 8.7 9.3 South Africa 2.0 2.0 1.2 0.7 0.5 0.1 0.1 1.0 0.1 0.0 South Korea 21.6 16.5 23.4 23.5 23.1 14.6 14.5 19.5 18.8 16.4 Spain 100.9 134.3 163.1 137.0 135.3 92.8 121.9 154.3 128.8 129.4 Sweden 89.1 86.9 106.2 104.2 111.3 77.7 75.5 92.3 88.8 91.3 Switzerland 3.7 4.1 2.9 2.8 3.1 3.1 2.7 1.9 2.0 2.4 Thailand 1.4 0.6 1.1 1.1 0.8 0.0 0.3 0.8 0.4 0.4 Turkey 3.9 2.1 3.2 2.0 2.1 0.1 – 0.3 – – United Kingdom 618.9 663.8 563.8 540.9 507.1 570.8 625.5 531.4 505.2 478.9 United States 748.5 864.4 914.3 995.2 1,071.0 700.1 790.4 846.5 918.7 986.7
All countries 208.6 221.0 197.8 213.4 201.1 248.5 281.2 250.1 288.2 277.0 Australia 5.1 3.4 5.9 5.5 4.5 3.9 2.0 2.6 4.2 4.3 Austria 4.1 15.7 10.7 12.6 10.9 2.5 3.5 4.5 1.2 2.0 Belgium 9.6 17.5 15.4 11.8 11.6 4.0 5.4 5.3 0.8 2.7 Brazil 2.2 2.2 3.3 4.1 2.6 2.5 0.7 0.7 1.3 1.2 Canada 16.4 10.9 6.5 7.5 9.2 14.7 6.6 9.0 18.9 18.3 China 1.6 0.5 – 1.0 1.5 0.3 – – 0.2 0.2 Czech Republic – 0.4 – 0.1 0.1 0.0 0.0 – 0.3 0.9 Denmark 4.1 8.2 4.9 2.9 6.1 0.9 1.9 4.4 3.7 2.3 Finland 7.9 4.5 7.6 7.3 7.2 2.0 2.4 2.8 2.6 1.5 France 0.2 0.2 0.5 0.1 0.2 42.2 39.1 42.0 44.5 37.1 Germany 46.1 43.7 51.2 58.5 50.9 14.0 30.2 15.4 18.5 13.1 Greece 14.2 15.5 14.8 10.9 10.7 0.2 1.2 1.4 1.7 0.6 Hong Kong SAR 0.3 0.5 – – – 0.3 3.5 2.1 3.5 3.2 India – – – – – 0.5 3.0 2.6 5.7 5.5 Ireland 1.1 27.6 4.3 5.8 6.8 2.2 6.8 5.9 1.1 0.4 Italy 33.9 5.3 11.1 15.0 9.0 4.1 1.3 7.7 6.5 7.6 Japan – 0.6 – 0.2 0.2 9.0 15.7 8.9 14.4 15.2 Malaysia – 1.6 – 1.8 1.8 0.3 0.6 0.0 0.9 0.9 Mexico 4.2 3.9 4.7 1.5 1.5 4.4 2.7 2.3 3.4 0.5 Netherlands 0.2 12.0 6.3 9.9 7.2 17.7 13.1 10.8 10.3 12.5 New Zealand 0.6 0.0 – 0.2 0.2 1.7 0.2 0.6 0.3 0.5 Norway – – – – – 1.7 1.8 2.4 2.0 2.0 Poland 0.8 3.1 2.6 2.4 1.4 – – – – – Portugal 5.3 2.4 6.3 10.2 7.9 1.1 2.7 1.3 3.7 3.4 Singapore – – 0.4 – – 1.4 0.4 1.6 1.1 3.3 South Africa 0.7 1.5 – – – 1.2 0.5 0.2 0.6 0.5 South Korea 3.0 0.1 – – – 4.0 2.0 3.9 4.8 6.7 Spain 6.8 8.6 6.6 8.1 5.9 1.3 3.9 2.2 – – Sweden 7.2 8.9 8.6 12.7 18.0 4.2 2.5 5.3 2.7 2.0 Switzerland 0.3 0.4 – 0.2 0.2 0.4 1.0 1.0 0.7 0.5 Thailand 1.0 0.3 – 0.3 0.3 0.4 – 0.3 0.4 0.1 Turkey 3.8 2.1 2.9 1.8 1.8 – – – 0.3 0.3 United Kingdom 3.0 – 4.0 2.0 2.0 45.1 38.3 28.4 33.7 26.2 United States 0.1 0.1 0.1 0.1 0.1 48.3 73.9 67.7 76.3 84.2
Corporate sector
All issuers
Table 17B: International debt securitiesWith remaining maturity up to one year / Amounts outstanding by sector and residence of issuerIn billions of US dollars
Financial institutions
Governments
BIS Quarterly Review, June 2011 A 127

Countries 2008 2009 2010 Q1 2009 Q2 2009 Q3 2009 Q4 2009 Q1 2010 Q2 2010 Q3 2010 Q4 2010 Q1 2011
All countries 392.2 734.8 707.6 57.1 256.3 173.5 247.9 118.0 119.3 182.3 288.0 156.1
Developed countries 305.8 594.6 429.8 43.1 225.9 125.1 200.5 81.8 79.8 68.2 200.0 120.9 Australia 24.6 36.4 17.7 6.9 12.5 13.2 3.7 2.1 1.5 3.3 10.8 2.8 Austria 0.6 3.3 1.8 – – 0.5 2.8 – 0.0 0.0 1.7 – Belgium 9.9 1.2 0.8 0.1 0.7 – 0.4 0.1 0.1 0.2 0.5 0.7 Canada 11.4 33.1 37.2 4.9 7.5 10.4 10.4 8.4 7.6 7.0 14.1 13.4 Cyprus 2.5 – 0.5 – – – – – 0.0 – 0.5 0.7 Denmark 7.4 3.9 3.7 0.1 1.4 1.8 0.7 0.2 0.9 0.1 2.6 0.5 Finland 2.1 1.5 0.6 – 0.7 0.2 0.5 – 0.1 0.1 0.4 0.4 France 24.2 30.6 10.0 2.8 8.0 0.4 19.5 3.0 1.6 1.2 4.2 2.1 Germany 7.0 15.3 31.2 0.1 0.9 9.2 5.1 4.5 7.1 2.8 16.8 8.1 Greece 0.9 6.8 4.7 0.2 1.4 3.8 1.4 0.8 0.3 0.3 3.4 1.1 Iceland 0.3 0.1 0.0 – – – 0.1 – – – 0.0 – Ireland 0.1 2.7 2.6 1.7 0.1 0.0 0.9 0.4 2.0 0.1 0.0 0.9 Italy 11.3 15.7 12.7 0.0 12.5 0.5 2.7 7.7 0.1 0.8 4.2 4.1 Japan 2.9 27.3 20.6 1.3 5.4 5.7 14.8 9.3 0.7 8.0 2.7 4.7 Luxembourg – 3.2 2.4 – 3.2 – 0.0 – 0.3 – 2.0 0.1 Netherlands 0.2 18.4 2.8 2.0 0.4 3.7 12.3 1.2 0.8 0.5 0.3 2.8 New Zealand 0.1 0.6 0.1 – 0.5 0.0 0.1 0.1 0.0 – 0.0 – Norway 2.7 6.1 8.1 0.2 1.5 1.0 3.3 0.7 1.6 2.1 3.7 1.4 Portugal 5.0 2.0 0.4 – 1.7 – 0.3 0.4 – – – 0.3 Spain 10.4 15.5 11.7 1.6 3.2 1.3 9.4 0.4 2.1 0.9 8.4 3.5 Sweden 1.5 7.0 8.3 1.3 3.9 0.1 1.6 0.6 1.0 0.0 6.8 3.3 Switzerland 15.9 15.1 2.5 0.1 5.6 8.2 1.3 0.1 1.5 0.2 0.7 – United Kingdom 65.4 102.0 33.4 7.4 42.7 27.8 24.1 5.6 8.8 7.5 11.6 4.5 United States 98.9 246.8 215.5 12.3 112.2 37.2 85.1 36.1 41.7 33.2 104.5 65.5
Offshore centres 6.1 19.1 25.4 3.8 4.4 4.5 6.4 5.2 3.9 4.2 12.0 8.9 Bahamas – – – – – – – – – – – – Bahrain – 0.3 2.3 – – – 0.3 0.1 1.1 – 1.1 – Bermuda 0.5 1.7 1.3 0.1 0.8 0.1 0.8 0.8 – 0.1 0.4 – Cayman Islands 1.0 – – – – – – – – – – – Hong Kong SAR 3.1 8.2 13.5 0.1 2.9 2.4 2.8 3.0 2.3 2.9 5.3 6.9 Panama 0.2 – 0.1 – – – – 0.1 – – – – Singapore 0.8 8.2 7.8 3.6 0.6 1.8 2.2 1.1 0.5 1.2 5.1 2.1
Developing countries 80.3 121.1 252.4 10.3 26.0 43.9 41.0 30.9 35.6 109.9 76.0 26.3
Africa & Middle East 15.9 5.9 8.9 0.9 0.9 2.9 1.2 2.5 2.7 1.7 2.1 0.7 Egypt 0.8 0.1 1.1 – – – 0.1 0.9 0.2 – – – Israel 0.9 1.9 2.5 – 0.3 0.9 0.8 0.7 0.8 0.2 0.8 0.5 Jordan 0.0 – – – – – – – – – – – Kuwait 6.4 0.1 0.1 0.1 – – – 0.1 – – – – Nigeria 1.7 0.1 0.1 – – 0.1 – – 0.1 – – – Saudi Arabia 1.2 0.6 0.7 – – 0.6 – 0.2 0.3 0.2 – – South Africa 2.6 1.9 3.0 0.1 0.3 1.2 0.3 0.4 0.9 1.2 0.4 0.2 United Arab Emirates 0.4 0.5 0.4 0.0 0.3 0.2 0.0 0.1 0.1 – 0.2 –
Asia & Pacific 39.9 83.6 127.5 8.4 19.8 26.2 29.1 17.8 15.7 35.9 58.2 13.6 China 16.9 50.7 72.1 6.5 12.0 13.4 18.8 4.4 6.0 28.7 33.1 6.1 Chinese Taipei 1.2 2.5 1.9 0.1 0.4 1.9 0.2 0.3 0.3 0.3 1.0 0.6 Georgia 0.1 – – – – – – – – – – – India 12.0 17.8 25.8 0.0 3.9 9.2 4.6 8.6 4.7 3.7 8.7 2.2 Indonesia 5.9 1.0 7.0 0.0 0.3 0.0 0.7 1.6 0.3 0.8 4.3 1.9 Kazakhstan 0.2 0.4 0.2 – 0.3 0.2 – – – – 0.2 – Malaysia 0.4 5.9 7.3 – 1.8 0.5 3.7 0.9 0.6 0.2 5.6 0.5 Pakistan 0.1 – – – – – – – – – – – Philippines 0.1 0.2 1.6 – 0.1 – 0.1 0.3 0.4 0.2 0.7 0.2 South Korea 2.2 4.7 8.2 1.8 0.9 1.0 1.0 1.6 3.4 1.0 2.1 1.3 Thailand 0.4 0.3 2.7 0.1 0.0 0.1 0.1 0.0 0.1 1.0 1.6 0.5
Europe 7.2 11.1 18.9 0.0 0.3 6.9 3.8 4.3 4.7 0.8 9.2 5.0 Croatia – – – – – – – – – – – – Czech Republic 0.0 0.0 0.0 – – 0.0 – – – – 0.0 – Hungary 0.0 – – – – – – – – – – – Poland 1.5 3.5 7.9 – 0.3 0.2 3.0 1.7 2.6 0.3 3.2 0.6 Romania – – – – – – – – – – – – Russia 3.3 7.2 8.8 – 0.0 6.6 0.6 2.3 1.7 0.5 4.4 3.9 Turkey 1.5 0.1 1.4 – 0.1 – 0.1 0.2 0.1 – 1.2 0.5 Ukraine 0.9 0.2 0.7 0.0 – 0.1 0.1 0.0 0.3 0.0 0.3 –
Latin America & Caribbean 17.3 20.5 97.1 1.0 4.9 7.8 6.8 6.4 12.6 71.5 6.5 7.0 Argentina – 0.3 0.1 – – – 0.3 – – – 0.1 1.2 Brazil 14.9 17.4 94.3 1.0 4.9 5.6 5.9 5.9 12.0 70.9 5.5 4.3 Chile – 0.0 1.3 – – – 0.0 0.6 – 0.2 0.6 1.2 Mexico 2.4 2.1 0.9 – – 2.1 0.0 – 0.6 0.2 0.1 0.3 Peru – 0.2 0.2 – – 0.1 0.1 0.0 0.0 0.0 0.2 0.0
Table 18: Announced international equity issuesBy nationality of issuerIn billions of US dollars
A 128 BIS Quarterly Review, June 2011

BIS Quarterly Review, June 2011 A129
Derivatives markets1
19 Amounts outstanding of over-the-counter (OTC) derivatives by risk category and instrument ........................................................................ page A131
20 Amounts outstanding of OTC foreign exchange derivatives A By instrument and counterparty ..................................................................................... A131
B By currency.................................................................................................................... A132
C By instrument, maturity and counterparty....................................................................... A132
21 Amounts outstanding of OTC single-currency interest rate derivatives A By instrument and counterparty ..................................................................................... A133
B By currency.................................................................................................................... A133
C By instrument, maturity and counterparty....................................................................... A134
22 Amounts outstanding of OTC equity-linked and commodity derivatives A By instrument and counterparty ..................................................................................... A134
B By instrument and market .............................................................................................. A135
C By instrument, maturity and counterparty....................................................................... A135
23 Derivative financial instruments traded on organised exchanges by instrument and location A Notional principal ........................................................................................................... A136
B Number of contracts....................................................................................................... A137
1 More detailed data and a full set of historical time series are available on the BIS website under
http://www.bis.org/statistics/derstats.htm.


Risk Category / Instrument Dec 2008 Jun 2009 Dec 2009 Jun 2010 Dec 2010 Dec 2008 Jun 2009 Dec 2009 Jun 2010 Dec 2010
Total contracts 598,147 594,553 603,900 582,655 601,048 35,281 25,298 21,542 24,673 21,148
Foreign exchange contracts 50,042 48,732 49,181 53,125 57,798 4,084 2,470 2,070 2,524 2,482 Forwards and forex swaps 24,494 23,105 23,129 25,625 28,434 1,830 870 683 925 886 Currency swaps 14,941 15,072 16,509 16,347 19,271 1,633 1,211 1,043 1,187 1,235 Options 10,608 10,555 9,543 11,153 10,092 621 389 344 411 362
Interest rate contracts 432,657 437,228 449,875 451,831 465,260 20,087 15,478 14,020 17,533 14,608 Forward rate agreements 41,561 46,812 51,779 56,242 51,587 165 130 80 81 206
Interest rate swaps 341,128 341,903 349,288 347,508 364,378 18,158 13,934 12,576 15,951 13,001
Options 49,968 48,513 48,808 48,081 49,295 1,764 1,414 1,364 1,501 1,401
Equity-linked contracts 6,471 6,584 5,937 6,260 5,635 1,112 879 708 706 648 Forwards and swaps 1,627 1,678 1,652 1,754 1,828 335 225 176 189 167
Options 4,844 4,906 4,285 4,506 3,807 777 654 532 518 480
Commodity contracts 4,427 3,619 2,944 2,852 2,922 955 682 545 457 526 Gold 395 425 423 417 396 65 43 48 44 47
Other commodities 4,032 3,194 2,521 2,434 2,525 890 638 497 413 479
Forwards and swaps 2,471 1,715 1,675 1,551 1,781
Options 1,561 1,479 846 883 744
Credit default swaps 41,883 36,098 32,693 30,261 29,898 5,116 2,973 1,801 1,666 1,351 Single-name instruments 25,740 24,165 21,917 18,494 18,145 3,263 1,950 1,243 993 884
Multi-name instruments 16,143 11,933 10,776 11,767 11,753 1,854 1,023 559 673 467
of which index products ... ... ... 7,500 7,476
Unallocated 62,667 62,291 63,270 38,327 39,536 3,927 2,816 2,398 1,788 1,532
Memorandum Item:
Gross Credit Exposure 5,005 3,744 3,521 3,578 3,342
Instrument / counterparty Dec 2008 Jun 2009 Dec 2009 Jun 2010 Dec 2010 Dec 2008 Jun 2009 Dec 2009 Jun 2010 Dec 2010
Total contracts 50,042 48,732 49,181 53,125 57,798 4,084 2,470 2,070 2,524 2,482
reporting dealers 19,665 18,849 18,896 19,920 21,955 1,520 892 732 898 899
other financial institutions 21,300 21,441 21,445 23,475 25,626 1,768 1,066 888 1,084 1,049
non-financial customers 9,077 8,442 8,840 9,731 10,216 796 512 449 541 535
Outright forwards and foreign
exchange swaps 24,494 23,105 23,129 25,625 28,434 1,830 870 683 925 886
reporting dealers 8,472 7,701 7,683 8,370 9,261 662 301 235 314 326
other financial institutions 10,906 10,653 10,497 11,872 13,009 780 374 300 398 365
non-financial customers 5,116 4,751 4,949 5,383 6,163 388 195 148 213 195
Currency swaps 14,941 15,072 16,509 16,347 19,271 1,633 1,211 1,043 1,187 1,235
reporting dealers 6,009 6,330 7,112 7,006 8,320 568 402 332 397 390
other financial institutions 6,858 6,717 7,282 7,279 8,801 783 568 478 548 586
non-financial customers 2,074 2,025 2,115 2,062 2,149 282 241 233 243 259
Options 10,608 10,555 9,543 11,153 10,092 621 389 344 411 362
reporting dealers 5,184 4,818 4,101 4,544 4,374 290 190 166 187 183
other financial institutions 3,537 4,071 3,666 4,323 3,815 205 125 111 138 98
non-financial customers 1,887 1,666 1,775 2,286 1,904 126 75 68 86 81
Table 19: Amounts outstanding of over-the-counter (OTC) derivativesBy risk category and instrumentIn billions of US dollars
Notional amounts outstanding Gross market values
Notional amounts outstanding Gross market values
Table 20A: Amounts outstanding of OTC foreign exchange derivativesBy instrument and counterpartyIn billions of US dollars
BIS Quarterly Review, June 2011 A 131
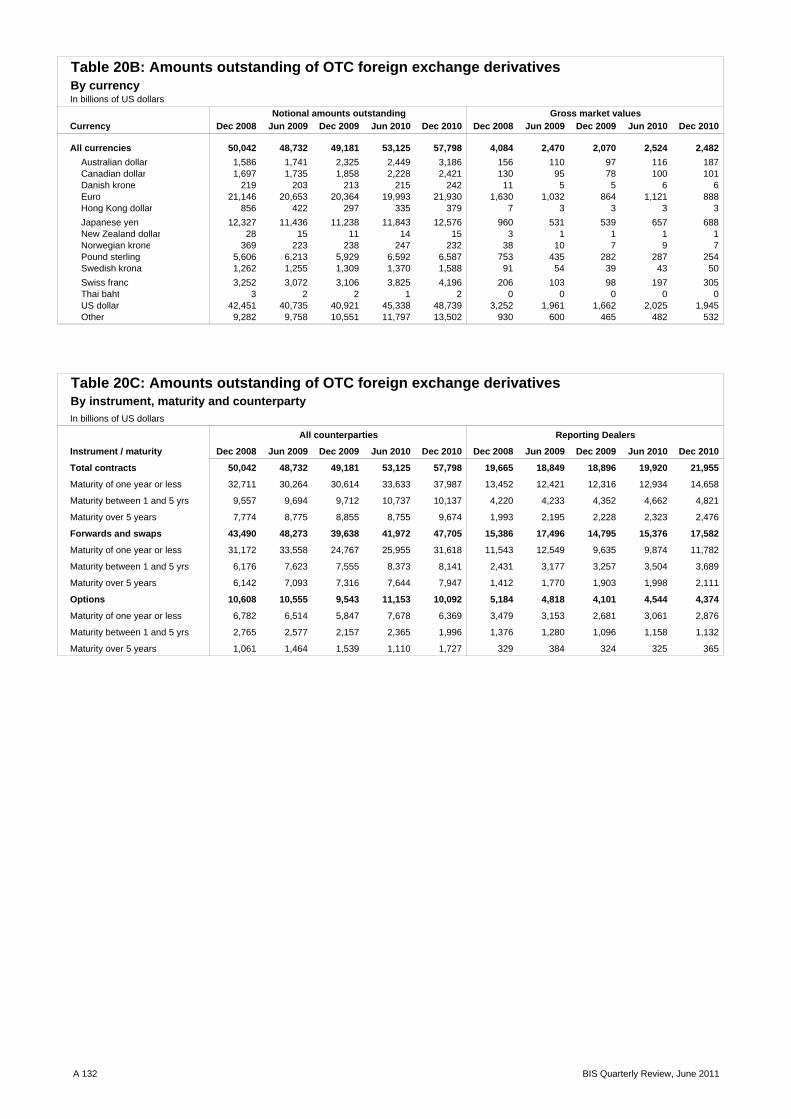
Currency Dec 2008 Jun 2009 Dec 2009 Jun 2010 Dec 2010 Dec 2008 Jun 2009 Dec 2009 Jun 2010 Dec 2010
All currencies 50,042 48,732 49,181 53,125 57,798 4,084 2,470 2,070 2,524 2,482 Australian dollar 1,586 1,741 2,325 2,449 3,186 156 110 97 116 187 Canadian dollar 1,697 1,735 1,858 2,228 2,421 130 95 78 100 101 Danish krone 219 203 213 215 242 11 5 5 6 6 Euro 21,146 20,653 20,364 19,993 21,930 1,630 1,032 864 1,121 888 Hong Kong dollar 856 422 297 335 379 7 3 3 3 3
Japanese yen 12,327 11,436 11,238 11,843 12,576 960 531 539 657 688 New Zealand dollar 28 15 11 14 15 3 1 1 1 1 Norwegian krone 369 223 238 247 232 38 10 7 9 7 Pound sterling 5,606 6,213 5,929 6,592 6,587 753 435 282 287 254 Swedish krona 1,262 1,255 1,309 1,370 1,588 91 54 39 43 50
Swiss franc 3,252 3,072 3,106 3,825 4,196 206 103 98 197 305 Thai baht 3 2 2 1 2 0 0 0 0 0 US dollar 42,451 40,735 40,921 45,338 48,739 3,252 1,961 1,662 2,025 1,945 Other 9,282 9,758 10,551 11,797 13,502 930 600 465 482 532
Table 20C: Amounts outstanding of OTC foreign exchange derivativesBy instrument, maturity and counterpartyIn billions of US dollars
Instrument / maturity Dec 2008 Jun 2009 Dec 2009 Jun 2010 Dec 2010 Dec 2008 Jun 2009 Dec 2009 Jun 2010 Dec 2010
Total contracts 50,042 48,732 49,181 53,125 57,798 19,665 18,849 18,896 19,920 21,955
Maturity of one year or less 32,711 30,264 30,614 33,633 37,987 13,452 12,421 12,316 12,934 14,658
Maturity between 1 and 5 yrs 9,557 9,694 9,712 10,737 10,137 4,220 4,233 4,352 4,662 4,821
Maturity over 5 years 7,774 8,775 8,855 8,755 9,674 1,993 2,195 2,228 2,323 2,476
Forwards and swaps 43,490 48,273 39,638 41,972 47,705 15,386 17,496 14,795 15,376 17,582
Maturity of one year or less 31,172 33,558 24,767 25,955 31,618 11,543 12,549 9,635 9,874 11,782
Maturity between 1 and 5 yrs 6,176 7,623 7,555 8,373 8,141 2,431 3,177 3,257 3,504 3,689
Maturity over 5 years 6,142 7,093 7,316 7,644 7,947 1,412 1,770 1,903 1,998 2,111
Options 10,608 10,555 9,543 11,153 10,092 5,184 4,818 4,101 4,544 4,374
Maturity of one year or less 6,782 6,514 5,847 7,678 6,369 3,479 3,153 2,681 3,061 2,876
Maturity between 1 and 5 yrs 2,765 2,577 2,157 2,365 1,996 1,376 1,280 1,096 1,158 1,132
Maturity over 5 years 1,061 1,464 1,539 1,110 1,727 329 384 324 325 365
All counterparties Reporting Dealers
Table 20B: Amounts outstanding of OTC foreign exchange derivativesBy currencyIn billions of US dollars
Notional amounts outstanding Gross market values
A 132 BIS Quarterly Review, June 2011

Table 21A: Amounts outstanding of OTC single-currency interest rate derivativesBy instrument and counterpartyIn billion of US dollars
Instrument / counterparty Dec 2008 Jun 2009 Dec 2009 Jun 2010 Dec 2010 Dec 2008 Jun 2009 Dec 2009 Jun 2010 Dec 2010
Total contracts 432,657 437,228 449,875 451,831 465,260 20,087 15,478 14,020 17,533 14,608
reporting dealers 165,741 148,152 138,580 132,128 134,483 7,099 4,759 3,970 4,548 4,114
other financial institutions 228,003 250,097 275,688 282,027 293,478 11,849 9,928 9,313 12,068 9,646
non-financial customers 38,914 38,979 35,607 37,677 37,299 1,138 790 736 917 848
Forward rate agreements 41,561 46,812 51,779 56,242 51,587 165 130 80 81 206
reporting dealers 20,818 24,158 27,352 30,228 26,262 78 43 32 32 60
other financial institutions 19,452 21,007 22,487 23,798 24,414 82 83 43 44 143
non-financial customers 1,292 1,648 1,940 2,216 911 6 4 6 5 3
Swaps 341,128 341,903 349,288 347,508 364,378 18,158 13,934 12,576 15,951 13,001
reporting dealers 119,641 100,167 87,994 79,717 83,180 6,095 3,988 3,229 3,756 3,265
other financial institutions 188,548 208,130 231,023 235,721 248,675 11,033 9,234 8,686 11,361 8,963
non-financial customers 32,939 33,606 30,270 32,070 32,523 1,030 712 660 835 773
Options 49,968 48,513 48,808 48,081 49,295 1,764 1,414 1,364 1,501 1,401
reporting dealers 25,282 23,827 23,233 22,183 25,041 926 728 709 760 789
other financial institutions 20,003 20,961 22,178 22,508 20,388 734 611 585 663 541
non-financial customers 4,683 3,726 3,397 3,391 3,866 103 75 71 77 72
Table 21B: Amounts outstanding of OTC single-currency interest rate derivativesBy currencyIn billions of US dollars
Currency Dec 2008 Jun 2009 Dec 2009 Jun 2010 Dec 2010 Dec 2008 Jun 2009 Dec 2009 Jun 2010 Dec 2010
All currencies 432,657 437,228 449,875 451,831 465,260 20,087 15,478 14,020 17,533 14,608
Australian dollar 1,791 1,720 2,379 2,564 4,195 93 44 49 46 48
Canadian dollar 2,704 3,227 3,427 4,411 4,247 186 141 102 102 90
Danish krone 319 305 306 264 344 10 11 12 14 12
Euro 161,445 160,668 175,790 161,515 177,831 5,643 6,255 6,073 7,043 5,827
Hong Kong dollar 672 470 406 334 357 27 11 11 10 9
Japanese yen 61,588 57,452 53,855 55,395 59,509 927 800 843 980 1,022
New Zealand dollar 81 44 135 52 121 4 2 4 1 3
Norwegian krone 1,755 718 789 715 750 25 13 10 12 10
Pound sterling 29,204 32,591 34,257 36,219 37,813 1,365 1,117 1,038 1,146 878
Swedish krona 5,082 5,294 4,696 4,461 5,098 130 118 99 98 71
Swiss franc 5,088 4,713 4,807 4,650 5,115 120 121 128 138 140
US dollar 148,661 154,174 153,373 164,119 151,583 11,092 6,473 5,347 7,573 6,177
Other 14,267 15,852 15,654 17,132 18,296 464 372 303 369 322
Notional amounts outstanding Gross market values
Notional amounts outstanding Gross market values
BIS Quarterly Review, June 2011 A 133

Table 21C: Amounts outstanding of OTC single-currency interest rate derivativesBy instrument, maturity and counterparty In billions of US dollars
Instrument / maturity Dec 2008 Jun 2009 Dec 2009 Jun 2010 Dec 2010 Dec 2008 Jun 2009 Dec 2009 Jun 2010 Dec 2010
Total contracts 432,657 437,228 449,875 451,831 465,260 165,741 148,152 138,580 132,128 134,483
Maturity of one year or less 155,581 159,145 180,007 196,040 190,487 71,139 62,635 63,129 62,032 60,606 Maturity between 1 and 5 years 127,511 128,319 134,312 129,488 138,206 50,734 43,872 43,117 40,886 42,219 Maturity over 5 years 149,565 149,765 135,556 126,303 136,567 43,868 41,645 32,334 29,209 31,657
Forwards and swaps 382,689 388,715 401,067 403,750 415,965 140,459 124,325 115,346 109,945 109,442
Maturity of one year or less 144,323 150,632 168,641 183,905 179,455 65,366 58,058 57,284 56,137 55,123 Maturity between 1 and 5 years 110,427 111,449 118,521 114,289 120,697 40,376 34,272 34,639 32,935 32,289 Maturity over 5 years 127,938 126,634 113,905 105,555 115,813 34,716 31,995 23,424 20,873 22,031
Options 49,968 48,513 48,808 48,081 49,295 25,282 23,827 23,233 22,183 25,041
Maturity of one year or less 11,258 8,513 11,366 12,135 11,032 5,773 4,578 5,845 5,896 5,484
Maturity between 1 and 5 years 17,084 16,870 15,791 15,199 17,508 10,358 9,599 8,478 7,951 9,931 Maturity over 5 years 21,626 23,130 21,651 20,748 20,755 9,151 9,650 8,910 8,336 9,627
Table 22A: Amounts outstanding of OTC equity-linked and commodity derivativesBy instrument and counterpartyIn billions of US dollars
Instrument / counterparty Dec 2008 Jun 2009 Dec 2009 Jun 2010 Dec 2010 Dec 2008 Jun 2009 Dec 2009 Jun 2010 Dec 2010
Total equity contracts 6,471 6,584 5,937 6,260 5,635 1,112 879 708 706 648
Reporting dealers 2,245 2,654 2,101 2,183 2,020 419 367 270 280 237
Other financial institutions 3,445 3,248 3,144 3,291 2,880 554 400 324 315 291
Non-financial institutions 781 682 692 785 734 140 112 115 111 120
Forwards and swaps 1,627 1,678 1,652 1,754 1,828 335 225 176 189 167
Reporting dealers 389 445 413 479 524 84 58 33 38 28
Other financial institutions 965 950 953 932 995 198 130 105 108 96
Non-financial institutions 273 283 287 343 310 54 37 38 42 43
Options 4,844 4,906 4,285 4,506 3,807 777 654 532 518 480
Reporting dealers 1,856 2,209 1,688 1,704 1,497 335 309 237 242 209
Other financial institutions 2,480 2,298 2,191 2,359 1,886 356 270 219 207 195
Non-financial institutions 509 399 406 442 424 86 75 76 69 77
Total commodity
Contracts 4,427 3,619 2,944 2,852 2,922 955 682 545 457 526
Gold 395 425 423 417 396 65 43 48 44 47
Forwards and swaps 152 179 201 224 230 – – – – –
Options 243 246 222 193 166 – – – – –
Other precious metals 111 93 107 127 123 18 24 15 29 18
Forwards and swaps 62 44 76 81 90 – – – – –
Options 49 49 31 46 32 – – – – –
Other commodities 3,921 3,101 2,414 2,307 2,403 873 614 482 384 461
Forwards and swaps 2,410 1,671 1,599 1,470 1,691 – – – – –
Options 1,511 1,430 815 837 712 – – – – –
All counterparties Reporting Dealers
Notional amounts outstanding Gross market values
A 134 BIS Quarterly Review, June 2011

Table 22B: Amounts outstanding of OTC equity-linked derivativesBy instrument and market In billions of US dollars
Instrument / market Dec 2008 Jun 2009 Dec 2009 Jun 2010 Dec 2010 Dec 2008 Jun 2009 Dec 2009 Jun 2010 Dec 2010
Total contracts 6,471 6,584 5,937 6,260 5,635 1,112 879 708 706 648
US Equities 1,488 1,512 1,749 1,732 1,563 249 202 192 195 191 European Equities 4,038 3,883 3,167 3,227 2,794 610 478 373 352 311 Japanese Equities 400 627 494 602 595 87 93 80 91 77 Other Asian Equities 183 173 180 258 252 94 56 27 25 24 Latin American Equities 99 125 38 105 58 20 8 5 6 5
Other Equities 264 264 309 336 373 51 43 32 38 40
Forwards and swaps 1,627 1,678 1,652 1,754 1,828 335 225 176 189 167
US Equities 508 520 528 571 543 97 55 46 63 51 European Equities 884 915 877 899 942 173 130 105 99 91 Japanese Equities 48 69 63 84 79 16 12 8 9 7 Other Asian Equities 36 34 29 29 52 14 6 4 3 4 Latin American Equities 40 34 20 17 20 15 5 3 3 2
Other Equities 111 107 136 154 192 19 18 11 12 13
Options 4,844 4,906 4,285 4,506 3,807 777 654 532 518 480
US Equities 980 992 1,221 1,161 1,020 152 147 146 132 140 European Equities 3,154 2,968 2,290 2,328 1,852 437 348 268 253 220 Japanese Equities 352 559 431 518 516 71 81 72 82 71 Other Asian Equities 146 139 151 230 200 80 50 23 22 20 Latin American Equities 60 90 19 88 37 5 3 2 3 3
Other Equities 152 158 173 181 182 32 25 21 26 27
Table 22C: Amounts outstanding of OTC equity-linked derivativesBy instrument, maturity and counterpartyIn billions of US dollars
Instrument / maturity Dec 2008 Jun 2009 Dec 2009 Jun 2010 Dec 2010 Dec 2008 Jun 2009 Dec 2009 Jun 2010 Dec 2010
Total contracts 6,471 6,584 5,937 6,260 5,635 2,245 2,654 2,101 2,183 2,020
Maturity of one year or less 2,972 2,935 2,838 3,036 2,650 1,074 1,178 949 1,033 861
Maturity between 1 and 5 yrs 2,692 2,873 2,409 2,551 2,357 969 1,241 900 900 912
Maturity over 5 years 807 777 691 673 628 201 235 252 250 247
Forwards and swaps 1,627 1,678 1,652 1,754 1,828 389 445 413 479 524
Maturity of one year or less 785 841 856 953 1,009 205 220 201 266 276
Maturity between 1 and 5 yrs 557 613 604 601 628 139 171 157 159 195
Maturity over 5 years 285 224 192 200 190 45 53 55 54 52
Options 4,844 4,906 4,285 4,506 3,807 1,856 2,209 1,688 1,704 1,497
Maturity of one year or less 2,187 2,094 1,982 2,083 1,641 870 957 748 767 584
Maturity between 1 and 5 yrs 2,135 2,260 1,805 1,950 1,729 830 1,069 743 741 717
Maturity over 5 years 522 552 499 473 437 156 182 197 196 195
Notional amounts outstanding Gross market values
All counterparties Reporting Dealers
BIS Quarterly Review, June 2011 A 135

Instrument / location Dec 2008 Dec 2009 Dec 2010 Mar 2011 2009 2010 Q2 2010 Q3 2010 Q4 2010 Q1 2011
Futures
All markets 19,508.1 21,737.9 22,311.9 27,422.0 1,126,516.5 1,380,537.4 384,717.4 305,363.1 343,639.6 414,861.1
Interest rate 18,732.3 20,627.7 21,013.4 25,999.8 1,016,361.6 1,235,907.5 344,455.0 270,635.0 307,252.3 374,228.8
Currency 125.1 144.3 170.2 200.8 24,598.7 35,771.2 9,825.0 8,306.8 9,181.8 9,289.6
Equity index 650.7 965.9 1,128.3 1,221.4 85,556.1 108,858.7 30,437.4 26,421.4 27,205.5 31,342.7
North America 10,138.2 10,720.9 11,863.5 14,750.0 599,025.0 729,195.9 210,146.1 153,648.6 187,775.5 219,109.5
Interest rate 9,818.8 10,284.9 11,351.1 14,164.5 543,950.8 658,193.5 189,903.7 136,806.6 170,449.4 199,349.3
Currency 60.8 90.7 114.8 135.0 19,606.8 28,649.0 7,824.1 6,736.0 7,294.8 7,704.9
Equity index 258.5 345.3 397.6 450.5 35,467.4 42,353.4 12,418.3 10,106.1 10,031.4 12,055.3
Europe 6,506.3 8,053.4 6,345.1 8,264.6 449,387.1 533,296.2 144,658.6 120,591.4 122,939.4 163,199.0
Interest rate 6,252.3 7,608.7 5,816.6 7,713.6 420,030.6 498,836.1 135,108.9 112,784.2 114,537.3 153,230.9
Currency 5.3 2.7 2.5 2.4 78.8 255.2 36.0 56.9 143.3 101.9
Equity index 248.8 441.9 526.0 548.6 29,277.7 34,204.8 9,513.7 7,750.3 8,258.9 9,866.2
Asia and Pacific 2,466.3 2,408.3 3,168.6 3,450.8 63,125.2 92,273.7 23,036.8 24,956.1 26,174.5 25,597.8
Interest rate 2,327.1 2,250.6 2,982.8 3,241.5 43,808.5 60,899.7 15,057.7 16,352.3 17,173.3 16,181.5
Currency 7.7 9.7 1.5 9.9 552.4 1,594.4 420.6 379.9 458.2 387.5
Equity index 131.5 148.1 184.2 199.3 18,764.3 29,779.6 7,558.5 8,223.9 8,543.0 9,028.8
Other Markets 397.2 555.4 934.7 956.7 14,979.2 25,771.7 6,875.9 6,167.0 6,750.2 6,954.8
Interest rate 334.0 483.5 862.9 880.2 8,571.7 17,978.1 4,384.7 4,691.9 5,092.4 5,467.1
Currency 51.3 41.2 51.4 53.6 4,360.8 5,272.6 1,544.2 1,134.0 1,285.6 1,095.4
Equity index 11.9 30.7 20.4 23.0 2,046.7 2,520.9 947.0 341.0 372.2 392.3
OptionsAll markets 38,236.2 51,379.6 45,634.6 56,882.4 533,634.9 606,661.8 170,949.9 132,386.7 135,205.9 166,425.9
Interest rate 33,978.8 46,428.7 40,930.0 51,458.6 434,601.0 468,872.0 135,190.9 100,874.2 95,986.5 123,434.3
Currency 129.3 147.3 144.2 123.0 1,980.3 3,048.5 837.3 724.5 696.4 605.0
Equity index 4,128.1 4,803.5 4,560.3 5,300.8 97,053.6 134,741.3 34,921.7 30,788.0 38,523.0 42,386.6
North America 19,533.5 23,874.9 24,353.4 25,834.2 216,390.4 261,543.9 80,344.0 59,979.7 61,885.6 65,111.7
Interest rate 17,788.9 21,817.7 22,070.2 23,156.6 188,438.5 225,342.9 69,593.8 51,976.8 53,482.2 55,318.1
Currency 45.0 65.3 72.3 80.5 657.5 1,600.9 473.3 380.4 428.6 381.9
Equity index 1,699.5 1,991.9 2,210.9 2,597.1 27,294.3 34,600.2 10,276.9 7,622.5 7,974.7 9,411.7
Europe 18,115.7 26,322.6 19,247.2 29,123.8 258,556.9 251,485.3 68,100.2 50,149.7 44,257.0 69,882.8
Interest rate 15,879.5 23,905.0 17,320.8 26,945.6 240,483.9 233,930.0 63,463.5 46,382.6 39,911.7 64,636.6
Currency 0.6 0.3 0.3 0.2 7.7 5.1 1.5 1.0 1.2 0.8
Equity index 2,235.6 2,417.2 1,926.1 2,178.0 18,065.4 17,550.2 4,635.3 3,766.1 4,344.1 5,245.5
Asia and Pacific 219.4 310.4 383.3 485.2 52,751.4 82,757.4 19,905.6 19,577.1 26,278.9 27,633.9
Interest rate 83.8 7.2 3.5 20.3 2,825.0 2,605.3 568.2 718.2 760.2 680.3
Currency – – 0.3 1.8 – 6.2 – 0.0 6.2 28.1
Equity index 135.6 303.3 379.4 463.2 49,926.4 80,145.8 19,337.4 18,858.9 25,512.5 26,925.5
Other Markets 367.6 871.7 1,650.7 1,439.2 5,936.2 10,875.2 2,600.1 2,680.2 2,784.5 3,797.5
Interest rate 226.6 698.9 1,535.5 1,336.1 2,853.6 6,993.8 1,565.4 1,796.6 1,832.4 2,799.3
Currency 83.7 81.7 71.3 40.5 1,315.1 1,436.3 362.4 343.1 260.4 194.3
Equity index 57.4 91.1 43.9 62.6 1,767.5 2,445.1 672.2 540.5 691.7 803.9
Amounts outstanding Turnover
Table 23A: Derivative financial instruments traded on organised exchangesBy instrument and locationNotional principal in billions of US dollars
A 136 BIS Quarterly Review, June 2011

Instrument / location Dec 2008 Dec 2009 Dec 2010 Mar 2011 2009 2010 Q2 2010 Q3 2010 Q4 2010 Q1 2011
Futures
All markets 110.3 94.3 86.2 95.2 4,571.9 6,353.2 1,768.5 1,530.8 1,611.3 1,719.6
Interest rate 77.1 63.9 63.3 69.5 1,935.9 2,546.1 696.4 608.1 637.0 748.6 Currency 7.6 5.9 6.1 7.5 377.4 1,410.2 374.8 330.3 416.1 358.4 Equity index 25.7 24.5 16.9 18.2 2,258.6 2,396.8 697.3 592.5 558.2 612.5
North America 72.3 56.6 43.5 47.8 1,825.6 2,160.9 622.4 513.8 525.5 592.4
Interest rate 57.4 42.4 36.5 40.5 913.2 1,177.9 330.4 274.7 303.8 350.7 Currency 0.7 0.9 1.3 1.5 158.0 234.8 66.4 55.9 57.6 60.8 Equity index 14.1 13.3 5.7 5.9 754.4 748.2 225.7 183.2 164.1 181.0
Europe 20.4 19.1 18.1 20.7 1,674.9 1,994.9 560.8 471.7 490.2 562.3
Interest rate 9.3 10.1 9.0 11.0 759.3 931.3 256.6 218.2 215.8 272.8 Currency 5.4 2.8 2.3 2.2 84.0 149.6 31.8 36.7 62.0 49.3 Equity index 5.8 6.2 6.8 7.5 831.6 914.0 272.5 216.7 212.4 240.3
Asia and Pacific 5.9 6.5 6.2 8.3 709.2 1,641.2 438.9 406.8 451.9 425.1
Interest rate 3.0 2.9 3.0 3.4 92.5 119.2 30.6 32.2 30.3 32.7 Currency 0.2 1.0 1.0 2.1 42.3 913.0 243.6 213.0 269.1 223.6 Equity index 2.7 2.7 2.2 2.9 574.4 609.0 164.6 161.7 152.5 168.7
Other Markets 11.8 12.1 18.4 18.3 362.2 556.2 146.4 138.5 143.7 139.8
Interest rate 7.4 8.5 14.8 14.7 170.9 317.8 78.9 82.9 87.1 92.4 Currency 1.3 1.2 1.5 1.7 93.2 112.8 33.0 24.6 27.4 24.8 Equity index 3.1 2.3 2.1 1.9 98.2 125.6 34.5 31.0 29.2 22.6
Memorandum items:
Commodity contracts 20.1 36.1 40.8 40.9 1,908.9 2,675.5 638.2 687.3 760.2 600.7
US markets 15.7 28.6 30.4 30.1 561.8 663.9 173.7 164.8 172.1 193.7 Other markets 4.4 7.5 10.4 10.8 1,347.1 2,011.6 464.5 522.6 588.2 407.0
Options
All markets 130.0 137.5 139.0 156.0 4,816.3 5,812.3 1,509.9 1,377.4 1,607.4 1,699.8
Interest rate 35.3 51.8 62.1 67.8 527.5 653.0 176.7 150.6 151.7 190.2 Currency 2.8 2.8 2.9 3.7 42.4 56.4 13.3 11.8 16.9 37.7 Equity index 91.9 82.9 74.0 84.5 4,246.4 5,102.9 1,319.8 1,214.9 1,438.8 1,472.0
North America 33.1 38.1 39.3 44.4 528.0 627.6 180.6 145.8 153.5 165.0
Interest rate 15.6 19.0 19.3 21.8 224.2 269.1 76.1 64.3 69.4 69.0 Currency 0.9 0.5 0.6 0.6 6.3 12.0 3.7 2.9 3.0 2.7 Equity index 16.6 18.6 19.4 22.0 297.5 346.6 100.8 78.5 81.2 93.4
Europe 80.0 73.6 62.5 76.1 754.2 720.5 203.5 156.7 160.9 198.5
Interest rate 14.3 20.7 16.9 24.2 243.3 256.0 71.5 53.4 49.8 72.9 Currency 0.1 0.1 0.1 0.1 2.5 1.6 0.4 0.4 0.5 0.3 Equity index 65.6 52.8 45.4 51.8 508.4 462.9 131.5 103.0 110.7 125.3
Asia and Pacific 5.4 9.0 8.2 11.1 3,369.7 4,226.3 1,065.2 1,017.1 1,234.9 1,260.7
Interest rate 0.1 0.0 0.0 0.1 4.5 5.0 1.1 1.5 1.4 1.7 Currency – – 0.3 1.8 – 6.2 – – 6.2 28.1 Equity index 5.3 9.0 7.8 9.2 3,365.2 4,215.1 1,064.1 1,015.6 1,227.3 1,231.0
Other Markets 11.5 16.8 29.1 24.4 164.4 237.8 60.6 57.8 58.0 75.6
Interest rate 5.3 12.2 25.9 21.8 55.6 122.8 28.0 31.4 31.0 46.6 Currency 1.8 2.2 1.8 1.2 33.5 36.7 9.2 8.6 7.3 6.7 Equity index 4.4 2.5 1.4 1.5 75.3 78.4 23.4 17.8 19.7 22.2
Memorandum items:
Commodity contracts 19.5 18.8 22.1 24.4 132.9 154.8 36.7 39.6 44.2 46.9
US markets 18.5 17.7 20.5 22.0 114.3 137.0 33.0 35.1 38.8 41.4
Other markets 1.0 1.1 1.7 2.5 18.6 17.7 3.7 4.5 5.5 5.5
Single equity contracts 341.9 365.3 387.4 396.3 5,624.1 6,008.3 1,665.2 1,342.4 1,531.0 1,673.6
US markets 235.8 256.7 282.3 272.5 4,175.0 4,284.4 1,206.0 930.0 1,107.4 1,211.9 Other markets 106.1 108.6 105.1 123.8 1,449.0 1,724.0 459.2 412.4 423.6 461.7
Contracts outstanding Turnover
Table 23B: Derivative financial instruments traded on organised exchangesBy instrument and locationNumber of contracts in millions
BIS Quarterly Review, June 2011 A 137

A138 BIS Quarterly Review, June 2011
Notes to tables Data for the most recent period are provisional. Data on changes in stocks have been calculated by
converting the relevant stocks into their original currencies using end-of-period exchange rates and subsequently converting the changes in stocks into US dollar amounts using period average rates. Flow or turnover data have been calculated by converting flows and turnover in original currencies into US dollar amounts using period average exchange rates.
Tables 1–8 The data in Tables 1–8 (the BIS international locational banking statistics) cover banks’ unconsolidated gross international on-balance sheet assets and liabilities. These data are based on the residence of the reporting institution and therefore measure the activities of all banking offices residing in each reporting country. Such offices report exclusively on their own unconsolidated business, which thus includes international transactions with any of their own affiliates (for data on the BIS consolidated banking statistics, see Table 9). BIS reporting banks include banks residing in the G10 countries, Australia, Austria, the Bahamas, Bahrain, Bermuda, Brazil, the Cayman Islands, Chile, Chinese Taipei, Curacao, Cyprus, Denmark, Finland, Greece, Guernsey, Hong Kong SAR, India, Ireland, Isle of Man, Jersey, Korea, Luxembourg, Macao SAR, Malaysia, Mexico, the Netherlands Antilles (till Q3 2010), Norway, Panama, Portugal, Singapore, South Africa, Spain and Turkey. Detailed tables, including time series data in CSV files, guidelines and information on breaks in series in the locational banking statistics, are available on the BIS website under http://www.bis.org/statistics/bankstats.htm.
Table 1 Local positions in foreign currency are available from all reporting banks except those in the United States. For Hong Kong SAR and Singapore, local positions include interbank business only (“Local” refers to positions vis-à-vis residents).
Tables 3 A–B The data on external loans and deposits are derived from reporting as such or calculated by subtracting separately reported data on positions other than loans and deposits from total external assets and liabilities. The only exceptions are Bahrain and the Netherlands Antilles, which do not provide this information separately. Their data on international loans and deposits therefore equal the data on external assets and liabilities shown in Tables 2 A–B.
Tables 5 The positions in domestic currency (item A) cover all reporting countries, except the Netherlands Antilles, Singapore and South Korea, while those in foreign currency (item B) only relate to reporting countries that provide a detailed currency breakdown. The foreign currency positions of countries (Hong Kong SAR, Macao SAR, Netherlands Antilles and Singapore) that do not supply sufficient currency detail are shown in the item “unallocated” (item C).
Tables 5 B Claims on non-banks include the positions of banks in the United States and their offshore branches vis-à-vis official monetary authorities.
Table 5 C Excludes, on the assets side, the positions of banks in the United States and their offshore branches, which are indistinguishably included under positions vis-à-vis non-banks.
Table 5 D The data cover all reporting banks, except those in the United States. For Hong Kong SAR and Singapore, local positions relate to interbank business only.
Table 6 A Positions vis-à-vis Switzerland and vis-à-vis Germany include those vis-à-vis the BIS and ECB respectively. The residual item for Africa & Middle East includes the positions of banks in the United States vis-à-vis regional OPEC countries (including Bahrain).The “Other” item for developed European countries comprises the Faeroe Islands, Greenland and San Marino, which have been merged together due to only partial reporting by reporting central banks.
For reasons of confidentiality, positions vis-à-vis certain countries may be included under the residual or unallocated items.
Tables 7 A–B See notes to Tables 3 A–B. In the case of reporting country Singapore, the breakdowns of international loans and deposits by vis-à-vis country have been partly estimated.
Tables 8 A–B The data in principle cover reporting banks’ cross-border positions in all currencies plus local positions in foreign currency. Figures for Latin America include the Caribbean area.
Positions vis-à-vis “related offices” cover cross-border positions only. In the case of banks in Canada, such positions are given for Canadian banks only.
Claims on official monetary authorities of banks in the United States and their offshore branches are included under positions vis-à-vis non-banks.
Tables 9 The BIS consolidated international banking statistics are based mainly on the country of incorporation of the reporting institutions and measure the international lending activities of banks’ head offices in the reporting countries and all their offices at home and abroad, with positions between offices of the same bank being netted out. In addition, foreign banks in reporting countries are requested to supply information about their international lending activities on an unconsolidated basis. The reporting countries comprise the G10 countries plus Australia, Austria, Brazil, Chile, Chinese Taipei, Denmark, Finland, Greece, Hong Kong SAR, India, Ireland, Luxembourg, Mexico, Norway, Panama, Portugal, Singapore, Spain and Turkey.
Consolidated international and foreign claims (Tables 9A-E) do not include any on-balance sheet derivatives exposures. Furthermore, “Other exposures” covering derivatives (on- or off-balance sheet) and two contingent exposures, credit commitments and guarantees extended”, shown in Table 9C are not part of foreign claims. The data in Tables 9 A–B cover BIS reporting banks’ worldwide consolidated contractual claims that are not adjusted for risk mitigants, such as guarantees and collateral. In addition, table 9A shows

BIS Quarterly Review, June 2011 A139
in column Q, as net risk transfers, aggregates on the reallocation of claims from the country of the immediate counterparty to that of the ultimate risk (ie a third-party guarantor or the head office of a legally dependent branch).
The data in Tables 9 A cover both foreign and international claims, while 9 B -E covers foreign claims only. International claims are defined as BIS reporting banks’ cross-border claims in all currencies plus the local claims of their foreign affiliates in foreign currency. Foreign claims include in addition, reporting banks’ foreign affiliates local claims in local currency, as shown below.
Types of claims
A B C D
Cross-border claims
Local claims of foreign affiliates in foreign currency
Local claims of foreign affiliates in
local currency
Domestic claims in the
reporting country
International claims (A + B)
Foreign claims (A + B + C)
The shaded area indicates claims excluded from the consolidated banking statistics; bold italics indicate claims published within the consolidated banking statistics.
The data on individual nationality groups of reporting banks may differ from data published in national sources because the data presented relate to consolidated claims of domestically owned banks only, while published national sources may in certain cases cover the unconsolidated claims of local subsidiaries and branches of foreign banks as well.
Item “Other” for developed European countries comprises the Faeroe Islands, Greenland and San Marino. Denmark reports its data on an unconsolidated basis, Austria and Portugal report on a partially consolidated basis.
Detailed information on breaks in series in the consolidated banking statistics are available on the BIS website under http://www.bis.org/statistics/consstats.htm.
Claims of Spanish banks, mainly vis-à-vis Portugal, are currently under review and are subject to revisions.
Table 9 A This table covers the data on consolidated foreign claims of banks in 30 BIS reporting countries vis-à-vis individual countries. A breakdown of international claims by maturity and sector is also provided. The column J “Banks with head offices outside the country of residence” and column K “undisbursed credit commitments and backup facilities” have been discontinued upon introduction of claims on ultimate risk basis since Q4 2004.
Columns E and I which related to “unallocated” maturities and sectors have been removed from the table. Respective data can be calculated by difference.
Column Q on net risk transfers refers to the amounts outstanding of contractual claims which have been reallocated from the country of the immediate counterparty to that of the ultimate borrower as provided by 26 of 30 reporting countries. In principle, the country of the ultimate counterparty (or of ultimate risk) is considered to be the country where the guarantor of a financial claim resides or where the head office of a legally dependent branch is located. However, this definition is not yet consistently applied by all countries. In some cases the data exclude guarantees, while in others they also include claims on legally independent subsidiaries, without any explicit guarantee being given.
Table 9 B This table provides the data on consolidated foreign claims vis-à-vis individual countries by nationality of banks in 30 BIS reporting countries. The grand total in the first column of the table also includes foreign claims of domestically owned banks in Finland, Hong Kong SAR, India, Luxembourg, Norway and Singapore, which are not shown separately in this table, as well as those of local subsidiaries and branches of foreign banks. European banks refer to domestically owned banks of European countries that report claims on an immediate borrower basis (i.e. Austria, Belgium, Denmark, Finland, France, Germany, Greece, Ireland, Italy, Luxembourg, the Netherlands, Norway, Portugal, Spain, Sweden, Switzerland, Turkey and the United Kingdom).
Table 9 C As of current quarter, this table provides a sectoral breakdown of consolidated foreign claims of banks in 24 BIS reporting countries vis-à-vis individual countries on an ultimate risk basis. The grand total in the first column of the table comprises foreign claims of domestically owned banks in Austria, Australia, Belgium, Canada, Chile, Chinese Taipei, Finland, France, Germany, Greece, India, Ireland, Italy, Japan, the Netherlands, Norway, Portugal, Singapore, Spain, Sweden, Switzerland, Turkey, the United Kingdom and the United States. The difference between total and sector components represents unallocated amounts (I) and the difference between total and cross-border claims represents local claims of foreign affiliates in all currencies(U). Data on additional contingent exposures through derivatives (positive market value only), guarantees extended and credit commitments are also shown.

A140 BIS Quarterly Review, June 2011
Table 9 D This table provides (as of current quarter) a breakdown of consolidated foreign claims vis-à-vis individual countries on an ultimate risk basis by nationality of reporting banks (in 24 reporting countries). The grand total in the first column of the table also includes foreign claims of domestically owned banks in Chinese Taipei, Finland, Norway and Singapore. European banks refer to domestically owned banks of European countries that report claims on an ultimate risk basis (i.e. Austria, Belgium, Finland, France, Germany, Greece, Ireland, Italy, the Netherlands, Norway, Portugal, Spain, Sweden, Switzerland, Turkey and the United Kingdom). German banks’ foreign claims vis-à-vis developed countries are on an immediate borrower basis.
Table 9 E As of current reporting quarter, this table provides a sectoral breakdown of consolidated foreign claims vis-à-vis individual countries by nationality of reporting banks on an ultimate risk basis. Data on other potential exposures through derivatives (positive market value only), guarantees extended and credit commitments are also shown. The grand total in the first column of the table comprises consolidated exposures of domestically owned banks in Austria, Australia, Belgium, Canada, Chile, Chinese Taipei, Finland, France, Germany, Greece, India, Ireland, Italy, Japan, the Netherlands, Norway, Portugal, Singapore, Spain, Sweden, Switzerland, Turkey, the United Kingdom and the United States. Exposures of banking groups vis-à-vis the home country are not included, as these are not foreign exposures. Up to 2010Q4, exposures of German banks on developed countries are on an immediate borrower basis.
Table 10 The data cover announcements of international syndicated credit facilities that are granted by syndicates consisting of at least two financial institutions (thus excluding bilateral deals) acting as lenders; the nationality of at least one of the syndicate banks must differ from that of the borrower. Facilities taking the form of amendments or derivative-like instruments such as currency swap facilities, interest rate swap facilities, etc. were excluded. Furthermore, only signed facilities with a maturity of at least three months are included. Finally, there are no restrictions on the purposes to which the proceeds of the facilities might be directed and the data therefore also include refinancing facilities. Sources: Dealogic Loan Analytics; BIS.
Tables 11–18 The methodology used to compile the securities statistics and a description of the coverage can be found on pages 13 to 17 of the Guide to the international financial statistics at http://www.bis.org/publ/bispap14.htm. In the sectoral breakdown, “governments” comprise central governments, other governments and central banks. “Financial institutions” comprise commercial banks and other financial institutions. The international debt securities data include “repackaged securities”, for example the new global issues of Argentina, resulting from the April 2005 exchange offer. “Repackaged securities” which are exclusively domestically targeted are allocated to the domestic debt securities database, such as the Argentine “bonos de la reestructuracion – DTO. 1735/04”. Non-marketable securities issued by Brazil, the UK, Czech Republic, Belgium, and the US are excluded from the domestic debt securities data. For recent changes in the coverage of domestic debt securities data see http://www.bis.org/statistics/coverage.htm
Tables 12 B, 12 C, 12 D, 13 A, 13 B, 16 A, 16 B and 17 B present data based on the sector of the borrower itself and not on the sector of the parent company of the borrower or any guarantor. In Tables 13 A, 14 A and 15 A the data cover commercial paper and notes with an original maturity of up to one year. Gross issuance excludes issues redeemed in the same quarter. In Tables 16 A, 16 B, 17 A and in the memorandum items of Tables 13 A and 13 B, the domestic statistics cover 74 OECD and emerging market countries. The complete list of countries can be seen at http://www.bis.org/statistics/qcsv/anx16a.csv.
Figures based on the World Bank Public Sector Debt Statistics (Albania, Armenia, Bangladesh, Bolivia, Costa Rica, Georgia, Guatemala, Honduras, Kenya, Lithuania, Mauritius, Moldova, Morocco, Nepal, Romania, Seychelles, Sri Lanka, Tanzania, and Tonga) relate only to central government outstanding domestic debt securities. The domestic data for Argentina, Peru and Venezuela include local issues in foreign currency. The Chilean domestic debt securities data for financial institutions include “bonos y letras hipotecarias en circulación”. Indian public sector domestic securities exclude those of government-guaranteed bodies. The Brazilian private sector and the Indian corporate sector issues only cover short-term paper, while no stocks data on bonds are available. The Colombian domestic data include only the public non-financial sector. The figures for Indonesia also include government issues for restructuring purposes. For the Netherlands, the source for data on domestic medium-term notes (MTNs) is different from that for data on domestic bonds, and there may therefore be some overlaps. Furthermore, data on domestic commercial paper (CP) include foreign issues in Dutch guilders. Issues of CDs by the Netherlands Bank are included under private short-term notes. French data on short-term notes also include foreign issues. For Bulgaria, Croatia, Egypt, New Zealand, Pakistan, Poland and Russia, the data on the non-government sector are missing. The partly estimated data for the corporate sector of Singapore relate to issues in Singapore dollar only. UK data include domestically targeted issues in foreign currency by the Bank of England, commercial paper and medium-term notes issued by the private sector are missing. Data for US short-term notes include CDs plus other time deposits. The US data on domestic CP include foreign issues. The data for Malaysia’s financial institutions and corporate issuers relate to end-June 2009. The data for Belgium, Bulgaria, Chile and India relate to end-September 2010. The latest available data on amounts outstanding have been carried forward for the periods thereafter.
In Tables 17 A and 17 B, data on remaining maturities of up to one year cover money market instruments and bonds and notes which are due for repayment within one year. For a few countries, no or only partial data are available on long-term domestic debt securities which are due for final repayment within one year.
Tables 19–22 The data are derived from the BIS regular OTC derivatives statistics and cover the notional amounts and gross market values outstanding of the worldwide consolidated OTC derivatives exposure of major banks and dealers in the G10 countries. Figures are adjusted for double-counting and cover foreign exchange, interest rate (single currency contracts only), equity, commodity and credit derivatives (CDS). The notional amount, which is generally used as a reference to calculate cash flows under individual contracts, provides a comparison of market size between related cash and derivatives markets. Gross market value is defined as the sum (in absolute terms) of the positive market value of all reporters’ contracts and the negative market
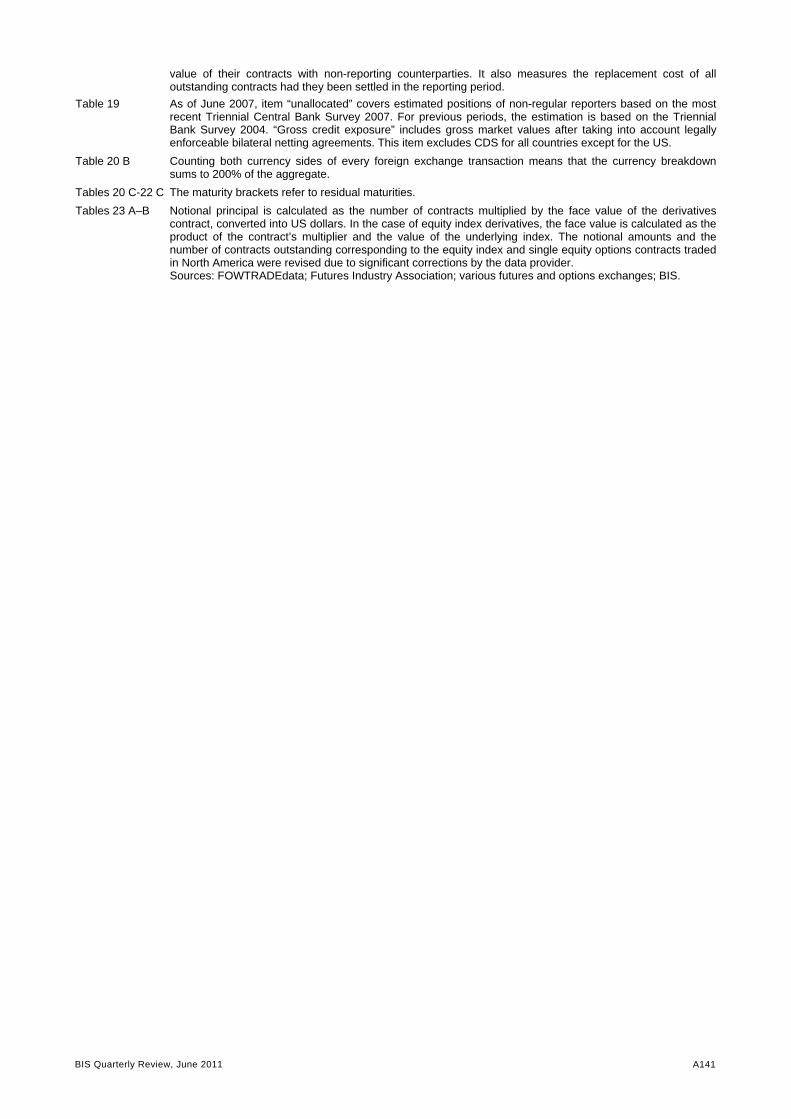
BIS Quarterly Review, June 2011 A141
value of their contracts with non-reporting counterparties. It also measures the replacement cost of all outstanding contracts had they been settled in the reporting period.
Table 19 As of June 2007, item “unallocated” covers estimated positions of non-regular reporters based on the most recent Triennial Central Bank Survey 2007. For previous periods, the estimation is based on the Triennial Bank Survey 2004. “Gross credit exposure” includes gross market values after taking into account legally enforceable bilateral netting agreements. This item excludes CDS for all countries except for the US.
Table 20 B Counting both currency sides of every foreign exchange transaction means that the currency breakdown sums to 200% of the aggregate.
Tables 20 C-22 C The maturity brackets refer to residual maturities.
Tables 23 A–B Notional principal is calculated as the number of contracts multiplied by the face value of the derivatives contract, converted into US dollars. In the case of equity index derivatives, the face value is calculated as the product of the contract’s multiplier and the value of the underlying index. The notional amounts and the number of contracts outstanding corresponding to the equity index and single equity options contracts traded in North America were revised due to significant corrections by the data provider. Sources: FOWTRADEdata; Futures Industry Association; various futures and options exchanges; BIS.

BIS Quarterly Review, June 2011 B1
Special features in the BIS Quarterly Review
March 2011 Systemic importance: some simple indicators M Drehmann & N Tarashev
March 2011 Inflation expectations and the great recession P Gerlach, P Hördahl & R Moessner
March 2011 The use of reserve requirements as a policy instrument in Latin America
C Montoro & R Moreno
March 2011 Foreign exchange trading in emerging currencies: more financial, more offshore
R McCauley & M Scatigna
December 2010 The $4 trillion question: what explains FX growth since the 2007 survey?
M R King & D Rime
December 2010 Derivatives in emerging markets D Mihaljek & F Packer
December 2010 Counterparty risk and contract volumes in the credit default swap market
N Vause
December 2010 A user's guide to the Triennial Central Bank Survey of foreign exchange market activity
M R King & C Mallo
September 2010 Debt reduction after crises G Tang & C Upper
September 2010 The collapse of international bank finance during the crisis: evidence from syndicated loan markets
M Chui, D Domanski, P Kugler & J Shek
September 2010 Options for meeting the demand for international liquidity during financial crises
R Moessner & W A Allen
September 2010 Bank structure, funding risk and the transmission of shocks across countries: concepts and measurement
I Fender & P McGuire
June 2010 Policy responses to dislocations in the FX swap market: the experience of Korea
N Baba & I Shim
June 2010 Currency collapses and output dynamics: a long-run perspective C E Tovar
June 2010 Was it credit supply? Cross-border bank lending to emerging market economies during financial crisis
E Takáts
June 2010 European banks’ US dollar funding pressures I Fender & P McGuire
March 2010 The architecture of global banking: from international to multinational R McCauley, P McGuire & G von Peter
March 2010 Exchange rates during financial crises M Kohler
March 2010 The dependence of the financial system on central bank and government support
P Gerlach
March 2010 The term “macroprudential”: origins and evolution P Clement
December 2009 Macro stress tests and crises: what can we learn? R Alfaro & M Drehmann
December 2009 Monetary policy and the risk-taking channel L Gambacorta
December 2009 Government size and macroeconomic stability M S Mohanty & F Zampolli
December 2009 Issues and developments in loan loss provisioning: the case of Asia S Angklomkliew, J George & F Packer
December 2009 Dollar appreciation in 2008: safe haven, carry trades and dollar shortage
P McGuire & R McCauley
B2 BIS Quarterly Review, June 2011
Recent BIS publications1 Working Papers
The bank lending channel: lessons from the crisis Leonardo Gambacorta and David Marques-Ibanez
http://www.bis.org/publ/work345.htm
The 2007-2010 financial crisis highlighted the central role of financial intermediaries' stability in buttressing a smooth transmission of credit to borrowers. While results from the years prior to the crisis often cast doubts on the strength of the bank lending channel, recent evidence shows that bank-specific characteristics can have a large impact on the provision of credit. We show that new factors, such as changes in banks' business models and market funding patterns, had modified the monetary transmission mechanism in Europe and in the US prior to the crisis, and demonstrate the existence of structural changes during the period of financial crisis. Banks with weaker core capital positions, greater dependence on market funding and on non-interest sources of income restricted the loan supply more strongly during the crisis period. These findings support the Basel III focus on banks' core capital and on funding liquidity risks. They also call for a more forward-looking approach to the statistical data coverage of the banking sector by central banks. In particular, there should be a stronger focus on monitoring those financial factors that are likely to influence the functioning of the monetary transmission mechanism particularly in a period of crisis. Dislocations in the won-dollar swap markets during the crisis of 2007-09 Naohiko Baba and Ilhyock Shim
http://www.bis.org/publ/work344.htm
Foreign exchange (FX) derivatives markets in the Korean won are comparatively thin and vulnerable to impaired functioning. During the crisis, Korea faced dislocations in its FX swap and cross-currency swap markets, so severe that covered interest parity (CIP) between the Korean won and the US dollar was seriously violated. Using a variation of the EGARCH model, we find that global market uncertainty – as proxied by VIX, the volatility index – was the main factor explaining the movement of deviations from CIP in the three-month FX swap market during the crisis period. The credit risk of Korean banks – as proxied by their credit default swap spread – was also a significant factor explaining deviations from CIP in the three-year cross-currency swap market before the crisis, while the credit risk of US banks was significant during the crisis period. The Bank of Korea's provision of funds using its own foreign reserves was not effective in reducing deviations from CIP, but the Bank of Korea's loans of the US dollar proceeds of swaps with the US Federal Reserve were effective. This is because the loans funded by swaps with the US Federal Reserve effectively added to Korea's foreign reserves and enhanced market confidence. Market structures and systemic risks of exchange-traded funds Srichander Ramaswamy
http://www.bis.org/publ/work343.htm
Crisis experience has shown that as the financial intermediation chain lengthens, it becomes complicated to assess the risks of financial products due to a lack of transparency as to how risks are managed at different levels of the intermediation chain. Exchange-traded funds, which have become popular among investors seeking exposure to a diversified portfolio of assets, share this characteristic, especially when their returns are replicated using derivative products. As the volume of such products grows, such replication strategies can lead to a build-up of systemic risks in the financial system. This article examines the operational frameworks of exchange-traded funds and identifies potential channels through which risks to financial stability can materialise. Measuring the systemic importance of interconnected banks Mathias Drehmann and Nikola Tarashev
http://www.bis.org/publ/work342.htm
We develop a measure of systemic importance that accounts for the extent to which a bank propagates shocks across the banking system and is vulnerable to propagated shocks. Based on Shapley values, this measure gauges the contribution of interconnected banks to systemic risk, in contrast to other measures proposed in the literature. An empirical implementation of our measure reveals that systemic importance depends materially on the bank's role in the interbank network, both as a borrower and as a lender. We also find substantial differences between alternative measures, which implies that prudential authorities should be careful in choosing the underlying approach. Securitization is not that evil after all Ugo Albertazzi, Ginette Eramo, Leonardo Gambacorta and Carmelo Salleo
http://www.bis.org/publ/work341.htm
A growing number of studies on the US subprime market indicate that, due to asymmetric information, credit risk transfer activities have perverse effects on banks' lending standards. We investigate a large part of the market for securitized assets ("prime mortgages") in Italy, a country with a regulatory framework analogous to the one prevalent in Europe. Information on over a million mortgages consists of loan-level variables, characteristics of the originating bank and, most importantly, contractual features of the securitization deal, including the seniority structure of the ABSs issued by the Special Purpose Vehicle and the amount retained by the originator. We borrow a robust way to test for the effects of
1 Requests for publications should be addressed to: Bank for International Settlements, Press & Communications, Centralbahnplatz 2, CH-4002 Basel. These publications are also available on the BIS website (www.bis.org).
BIS Quarterly Review, June 2011 B3
asymmetric information from the empirical contract theory literature (Chiappori and Salanié, 2000). Overall, our evidence suggests that banks can effectively counter the negative effects of asymmetric information in the securitization market by selling less opaque loans, using signaling devices (i.e. retaining a share of the equity tranche of the ABSs issued by the SPV) and building up a reputation for not undermining their own lending standards. Cyclical fiscal policy, credit constraints, and industry growth Philippe Aghion, David Hemous and Enisse Kharroubi
http://www.bis.org/publ/work340.htm
This paper analyzes the impact of cyclical fiscal policy on industry growth. Using Rajan and Zingales' (1998) difference-in-difference methodology on a panel data sample of manufacturing industries across 15 OECD countries over the period 1980-2005, we show that industries with relatively heavier reliance on external finance or lower asset tangibility tend to grow faster (both in terms of value added and of labor productivity growth) in countries which implement more countercyclical fiscal policies. Measuring disagreement in UK consumer and central bank inflation forecasts Richhild Moessner, Feng Zhu and Colin Ellis
http://www.bis.org/publ/work339.htm
We provide a new perspective on disagreement in inflation expectations by examining the full probability distributions of UK consumer inflation forecasts based on an adaptive bootstrap multimodality test. Furthermore, we compare the inflation forecasts of the Bank of England's Monetary Policy Committee (MPC) with those of UK consumers, for which we use data from the 2001-2007 February GfK NOP consumer surveys. Our analysis indicates substantial disagreement among UK consumers, and between the MPC and consumers, concerning one-year-ahead inflation forecasts. Such disagreement persisted throughout the sample, with no signs of convergence, consistent with consumers' inflation expectations not being "well-anchored" in the sense of matching the central bank's expectations. UK consumers had far more diverse views about future inflation than the MPC. It is possible that the MPC enjoyed certain information advantages which allowed it to have a narrower range of inflation forecasts. BASEL III: Long-term impact on economic performance and fluctuations Paolo Angelini, Laurent Clerc, Vasco Cúrdia, Leonardo Gambacorta, Andrea Gerali, Alberto Locarno, Roberto Motto, Werner Roeger, Skander Van den Heuvel and Jan Vlček
http://www.bis.org/publ/work338.htm
We assess the long-term economic impact of the new regulatory standards (the Basel III reform), answering the following questions. (1) What is the impact of the reform on long-term economic performance? (2) What is the impact of the reform on economic fluctuations? (3) What is the impact of the adoption of countercyclical capital buffers on economic fluctuations? The main results are the following. (1) Each percentage point increase in the capital ratio causes a median 0.09 percent decline in the level of steady state output, relative to the baseline. The impact of the new liquidity regulation is of a similar order of magnitude, at 0.08 percent. This paper does not estimate the benefits of the new regulation in terms of reduced frequency and severity of financial crisis, analysed in Basel Committee on Banking Supervision (BCBS, 2010b). (2) The reform should dampen output volatility; the magnitude of the effect is heterogeneous across models; the median effect is modest. (3) The adoption of countercyclical capital buffers could have a more sizeable dampening effect on output volatility. These conclusions are fully consistent with those of reports by the Long-term Economic Impact group (BCBS, 2010b) and Macro Assessment Group (MAG, 2010b).
Basel Committee on Banking Supervision
Range of methodologies for risk and performance alignment of remuneration - final document May 2011
http://www.bis.org/publ/bcbs194.htm
Ensuring that remuneration is effectively aligned with risk and performance is an essential element for reducing incentives that may arise from the design of remuneration schemes and that can lead to excessive risk taking. In practice, the idea that an employee's compensation should take account of the risks that employees take on behalf of their organisation has proven to be challenging to implement. The Basel Committee's report on the Range of Methodologies for Risk and Performance Alignment of Remuneration analyses the methods used by banks for incorporating risk into bonus pools and individual compensation schemes. Banks use various methods to adjust remuneration to take account of risk and performance. Depending on the remuneration scheme's design and detailed features, the effectiveness of such methods in creating incentives for prudent risk taking varies significantly. The report focuses on the practical and technical issues that might reduce the effectiveness of these methods. It also covers more general questions, including proportionality in the application of rules. The report, which contains a number of examples of banks' practices reflecting the supervisory experience to date, helps provide a representative, though perhaps still incomplete, picture of current remuneration practices in the industry. By providing clarification on the design of risk-adjusted remuneration schemes and by highlighting issues that may affect the effectiveness of the risk adjustment methodologies, the Committee expects the report will help support and facilitate the broader adoption of sound compensation practices in the banking sector. A consultative version of this paper was released for public comment in October 2010. The Committee wishes to thank those who have taken the time and effort to express their views on the consultative document.

-
B4 BIS Quarterly Review, June 2011
Committee on the Global Financial System
Statistics Interactions of sovereign debt management with monetary conditions and financial stability May 2011
http://www.bis.org/publ/cgfs42.htm
The financial crisis dramatically altered the environment in which sovereign debt managers and central banks had to operate. The interactions of sovereign debt management (SDM) with monetary conditions and financial stability was heightened in these historically unusual circumstances. This report discusses the implications of these interactions for central banks. It was prepared by a Study Group chaired by Paul Fisher of the Bank of England. The report concludes that in such circumstances, or where financial systems are still developing, there is benefit in debt managers taking a broad view of cost and risk. Central banks can likewise benefit from keeping abreast of SDM activities. Recent experience confirms that medium-term strategic outcomes for the maturity structure and risk characteristics of outstanding debt do matter, for financial stability in particular. This underscores the importance of close communication among the relevant agencies, yet with each agency maintaining independence and accountability for its respective role, consistent with internationally agreed principles for sovereign debt management.
Committee on Payment and Settlement Systems Statistics on payment and settlement systems in the CPSS countries - Figures for 2009 March 2011
http://www.bis.org/publ/cpss95.htm
This is an annual publication that provides data on payments and payment systems in the CPSS countries.
This version of the statistical update contains data for 2009 and earlier years. There are detailed tables for each individual country as well as a number of comparative tables.
A preliminary version was published in December 2010. Principles for financial market infrastructures - consultative report March 2011
http://www.bis.org/publ/cpss94.htm
The report Principles for financial market infrastructures contains new and more demanding international standards for payment, clearing and settlement systems. Issued for public consultation by the CPSS and the Technical Committee of the International Organization of Securities Commissions (IOSCO), the new standards (called “principles”) are designed to ensure that the essential infrastructure supporting global financial markets is even more robust and thus even better placed to withstand financial shocks than at present. The report contains a single, comprehensive set of 24 principles designed to apply to all systemically important payment systems, central securities depositories, securities settlement systems, central counterparties and trade repositories (collectively “financial market infrastructures” or “FMIs”). These FMIs collectively record, clear and settle transactions in financial markets. When finalised, the new principles will replace the three existing sets of CPSS and CPSS-IOSCO standards, the Core principles for systemically important payment systems (2001); the Recommendations for securities settlement systems (2001); and the Recommendations for central counterparties (2004). The CPSS and IOSCO believe that a single set of principles will provide greater consistency in the oversight and regulation of FMIs worldwide. Robust and efficient FMIs help to ensure that markets continue to function effectively even in times of crisis and are an essential prerequisite for financial stability. Although FMIs have generally performed well, there are nevertheless lessons to be learnt both from the recent crisis and from the years of more normal operation since the current standards were issued. Compared with the current standards, the new principles introduce more demanding requirements in many important areas including
the financial resources and risk management procedures an FMI uses to cope with the default of participants; the mitigation of operational risk; and the links and other interdependencies between FMIs through which operational and financial risks can spread.
There are also principles covering issues that are not fully addressed by the existing standards. These include new principles on segregation and portability, tiered participation and general business risk. Published along with the report is a cover note which sets out some specific issues on which the committees are seeking comments during the public consultation period. Comments on the principles are invited from all interested parties and should be sent by 29 July 2011 to both the CPSS secretariat ([email protected]) and the IOSCO secretariat ([email protected]). The comments will be published on the websites of the BIS and IOSCO unless commentators request otherwise. After the consultation period, the CPSS and IOSCO will review all comments received and publish a final report in early 2012. As set out in the cover note, the proposal is that relevant authorities will then strive to include the principles in their legal and regulatory framework by the end of 2012 and to apply the principles as part of their regulatory, supervisory and oversight activities as soon as possible. FMIs will be expected to take appropriate and swift action in order to meet the principles.
BIS Quarterly Review, June 2011 B5
Speeches Global liquidity: a view from Basel Speech by Mr Jaime Caruana, General Manager of the BIS, at the International Capital Markets Association Annual General Meeting and Annual Conference, Paris, 26 May 2011
http://www.bis.org/speeches/sp110526.htm
Policymakers have once again entered a discussion of global liquidity. Speaking to a group of capital market participants, the General Manager of the BIS suggested that bankers, bond underwriters and investors, as gatekeepers of credit, play an important role in the determination of global liquidity, defined as the growth and terms of global credit extension. The General Manager illustrated this role by contrasting the growth rates of US dollar credit within and outside the United States. He argued that international credit, including cross-currency credit involving maturity mismatches, tends to amplify domestic credit developments and poses challenges to policymakers. With new institutions and Basel III, policymakers are better equipped to moderate, or at least make the financial system less vulnerable to, swings in global liquidity. But better risk management, better analysis of liquidity risks and better funding strategies on the part of private market participants will be essential. Capital flows to the emerging market economies: a perspective on policy challenges Speech by Mr Jaime Caruana, General Manager of the BIS, at the Forty-sixth SEACEN Governors' Conference, Colombo, Sri Lanka, 24–26 February 2011
http://www.bis.org/speeches/sp110307.htm
Capital flows to emerging market economies (EMEs) have displayed a dramatic pattern over the past decade. Following the collapse during 2008, capital inflows have rebounded since 2009 to pre-crisis levels. The recent increase in international capital flows is a sign of strength for the world economy, but it also poses unusual policy challenges. Global accommodative financial conditions can spur capital inflows and make it more difficult for EM policymakers to pursue their internal stabilisation objectives. Growing inflation pressures in EMEs and a multispeed global recovery put a premium on the pursuit of sound macroeconomic policy, especially monetary policy. Fiscal policy should aim at reducing debt in good times. Real exchange rate appreciation should form part of the response in rapidly growing EMEs. Macroprudential policies can usefully complement, but not substitute for, such sound macroeconomic policies. Capital controls can only temporarily respond to highly unusual circumstances. Sound national policy action can contribute to better global outcomes, but policymakers in both advanced and emerging economies should take into account the implications of their actions beyond their own borders.