Intermodal Container Flow Simulation Model and Its ...docs.trb.org/prp/11-0875.pdf · 1 AN...
15
Meng and Wang AN INTERMODAL CONTAINER FLOW SIMULATION MODEL 1 AND ITS APPLICATIONS 2 3 Qiang Meng 4 Associate Professor 5 Department of Civil Engineering, 6 National University of Singapore, 7 117576 Singapore 8 Phone: (+65) 6516 5494 Fax: (+65) 6779 1635 9 Email: [email protected] 10 11 12 13 Shuaian Wang 14 Research Scholar 15 Department of Civil Engineering 16 National University of Singapore 17 117576 Singapore 18 Phone: (+65) 9482 9436 Fax: (+65) 6775 6762 19 Email: [email protected] 20 21 22 To the committee of Freight Transportation Planning and Logistics (AT015) for review 23 24 Paper submitted to the 90 th Annual Meeting of Transportation Research Board to be considered 25 for presentation and publication in Transportation Research Record 26 27 28 Submission Date: November 8, 2010 29 30 Total Number of Words 31 Number of words in text: = 5175 words 32 Number of tables: 2 (2×250) = 500 words equivalent 33 Number of figures: 7 (7×250) = 1750 words equivalent 34 ------------------------------- 35 Total number of words: = 7425 words equivalent 36 37 38 Corresponding author: Qiang Meng 39 TRB 2011 Annual Meeting Paper revised from original submittal.
Transcript of Intermodal Container Flow Simulation Model and Its ...docs.trb.org/prp/11-0875.pdf · 1 AN...

Meng and Wang
AN INTERMODAL CONTAINER FLOW SIMULATION MODEL 1
AND ITS APPLICATIONS 2 3
Qiang Meng 4 Associate Professor 5
Department of Civil Engineering, 6 National University of Singapore, 7
117576 Singapore 8 Phone: (+65) 6516 5494 Fax: (+65) 6779 1635 9
Email: [email protected] 10 11 12 13
Shuaian Wang 14 Research Scholar 15
Department of Civil Engineering 16 National University of Singapore 17
117576 Singapore 18 Phone: (+65) 9482 9436 Fax: (+65) 6775 6762 19
Email: [email protected] 20 21 22
To the committee of Freight Transportation Planning and Logistics (AT015) for review 23 24
Paper submitted to the 90th Annual Meeting of Transportation Research Board to be considered 25 for presentation and publication in Transportation Research Record 26
27 28
Submission Date: November 8, 2010 29 30
Total Number of Words 31 Number of words in text: = 5175 words 32 Number of tables: 2 (2×250) = 500 words equivalent 33 Number of figures: 7 (7×250) = 1750 words equivalent 34 ------------------------------- 35 Total number of words: = 7425 words equivalent 36 37 38 Corresponding author: Qiang Meng 39
TRB 2011 Annual Meeting Paper revised from original submittal.

Meng and Wang 2
ABSTRACT 1 This paper develops a container flow simulation model incorporating shippers, carriers, and port 2 operators for intermodal freight transportation systems. This model consists of the components as 3 follows: inland intermodal container transportation involving different inland transport modes, 4 liner shipping services provided by various carriers, competition between carriers in terms of 5 freight rate, transit time and service capacity, utility-based path choice principle for shippers, and 6 discrete event simulation procedure. It is also implemented by using the object-oriented 7 programming language C++ to facilitate the analysis of various scenarios. Finally, the developed 8 program is applied to predict the increased revenue and market share of a liner shipping company 9 if it introduces a new liner service route and to estimate quantitatively the impact on the container 10 throughput of Singapore port that Maersk shifted its Southeast Asian hub from Singapore to 11 Tanjung Pelepas. 12 13 KEY WORDS 14 Intermodal Transportation; Container Flow; Liner Shipping; Discrete Event Simulation 15
TRB 2011 Annual Meeting Paper revised from original submittal.

Meng and Wang 3
INTRODUCTION 1 Globalization is leading a steady growth in international seaborne trade. Liner shipping represents 2 around a quarter of total volume of cargo transported in the whole maritime freight transportation 3 market (1). Containerization has revolutionized the maritime transportation by minimizing cargo 4 handling cost and time. By the end of 2007, the global containership fleet has reached a total of 5 more than 25 million twenty-foot equivalent units (TEUs), an increase of more than 50 per cent 6 since the end of 2002 (1). 7 Shippers, carriers, and container terminal operators (or port operators) are major players 8 in the container cargo market. A shipper is a person or a company that has cargo to be shipped 9 from an origin to a destination, or an intermediary broker or a third-party logistics (3PL) company 10 governing and coordinating the whole shipment delivery process for cargo owners. A carrier is a 11 company which provides transportation services. A container terminal operator serves liner 12 shipping companies through container handling, storage, and bunkering. As this paper focuses 13 solely on the container operations at ports, we use the term port operators and container terminal 14 operators interchangeably. Shippers choose carriers according to their freight rate, transit time, 15 reliability, and reputation. A shipper chooses more than one carrier to transport containers from 16 origin to destination: Inland carriers transport containers from origin to export port or from import 17 port to destination by truck, rail, barge, or their combinations. Liner shipping companies are the 18 carriers which provide maritime transportation services. In order to efficiently deploy the 19 containerships, a liner shipping company seeks to forecast its container shipment demand 20 quantitatively while taking into account the competition with other companies. 21 Due to the acquisition, merger, and alliance within the liner shipping industry, liner 22 shipping companies are becoming larger and facing cut-throat competitions. To decrease the 23 operating cost, liner shipping companies usually adopt the hub-and-spoke shipping network by 24 deploying large containerships on trunk routes to reap the benefit of economies of scale. For 25 example, APL uses Singapore port as its hub for the Southeast Asian region (2). Consequently, 26 major ports in the same region are struggling to be the hub of the region to increase the 27 throughput of transshipped containers. In order to retain existing carriers and attract carriers from 28 other ports, port operators are building new berths to alleviate port congestion, dredging water to 29 accommodate larger containerships, purchasing new cranes to increase the container handling 30 efficiency, expanding container yard to store more containers, and improving intermodal facilities 31 to minimize the dwell time of cargo. All these constructions and improvements are extremely 32 costly. A quantitative estimation of the future container throughput is a precondition for making 33 the right construction and improvement decisions. 34 The purpose of this study is to develop an intermodal container flow simulation model to 35 predict the container shipment demand for each carrier and throughput for each port and thus to 36 assist the decision-making of carriers and port operators in a competitive context. The aggregated 37 origin-destination (O-D) container shipment demand can be forecasted from the world economy 38 development (1). To allocate this aggregated demand among carriers and ports, shippers’ choice 39 behavior must be accounted for. In other words, the competition between carriers and the 40 competition between ports must be examined. 41 42 Literature Review 43 A number of efforts have been devoted to the liner shipping fleet size and mix, fleet deployment, 44 and service network design problems (3). Most of these studies assume that the container 45 shipment demand is deterministic. Service factors such as the transit time and competition 46 between liner shipping companies are excluded in these models. 47 There are also studies on evaluating attractiveness factors of ports. One line of this 48 research (4-7) employs survey method to identify factors affecting port competitiveness, such as 49 inland distance, oceanic distance, and intermodal connection. However, the conclusions of 50 different research are not the same, mainly because of different population targeted for survey (8-51
TRB 2011 Annual Meeting Paper revised from original submittal.

Meng and Wang 4
9) and limited sample size. The other line of research has sought to investigate quantitatively the 1 significance of each selection factor and whether two factors are correlated by using discrete 2 choice model (10-11) or regression model (7). Nevertheless, these models focus on one or a few 3 ports and their applicability to a global liner shipping network is unclear. 4 Some researchers have integrated the selection of both carriers and ports into a single 5 container cargo flow simulation model. The first stream of the container cargo flow model (12-13) 6 aims to obtain the equilibrium between shippers and carriers. The selection of port is implicitly 7 included in the selection of liner service routes. At the equilibrium, shippers cannot reduce their 8 cost by unilaterally choosing another carrier and carriers cannot reduce their cost by changing the 9 liner services. One major drawback of this approach is ignorance of the volatility of liner shipping 10 market, since the system parameters have already changed before the ideal equilibrium is reached. 11 The second stream of the container cargo flow simulation model (14) calculates the container 12 cargo flow for the present liner shipping network. This approach takes into account the liner 13 services provided, freight rate, ship capacity and transshipment cost. However, the model in (14) 14 does not incorporate the effect of transit time on shippers’ choices. Moreover, this model 15 investigates the container flow from one country to another, and hence neglects the impact of 16 inland intermodal transportation on the choice of export/import port. Thirdly, containers are 17 allowed to be transshipped at most one time, which is not representative in liner shipping 18 practices. 19 20 Objectives and Contributions 21 The objective of this study is to develop an intermodal container flow simulation model for the 22 current container transport systems in order to assist the decision-making of carriers and port 23 operators in a competitive context. To achieve this goal, it first introduces an important concept 24 of segment-based path to facilitate the representation of transshipment and the generation of 25 candidate paths for an origin-destination pair. This paper proceeds to employ the utility-based 26 discrete choice model to formulate shippers’ choice behavior. The utility definition explicitly 27 contains the effect of transit time by using the value of time (VOT) of shipments. In addition, an 28 inland intermodal operating network is proposed to calculate the transfer cost and time between 29 different transport modes. Finally, this paper applies the discrete event simulation technique and 30 develops a computer program with the object-oriented programming language C++ to simulate 31 the container flow in the inland and maritime transportation networks. The container flow is 32 allocated to each liner service route. Therefore the container shipment demand for each liner 33 shipping company and the container throughput for each port can be easily derived. 34 This paper contributes to the literature in that it simulates the container flow whilst 35 capturing major characteristics of the practical intermodal transportation system: (i) Both the 36 inland and maritime transportation networks are investigated in the container flow model; (ii) The 37 competition between liner shipping companies is formulated by considering shippers’ utility-38 based choice principle; (iii) The concept of segment-based path allows for the representation of 39 transshipment at sea ports more than one time. The proposed model is applied to the container 40 flow on the Asia-Europe trade lane. This application predicts the increased revenue and market 41 share of a liner shipping company if it introduces a new liner service route and estimates 42 quantitatively the impact on the container throughput of Singapore port that Maersk shifted its 43 Southeast Asian hub from Singapore to Tanjung Pelepas. 44 45 PROBLEM DESCRIPTION 46 Consider an intermodal container transportation system comprising the inland intermodal 47 transportation network and the maritime transportation network. The origin and destination of 48 containers flowing in the system are located in inland areas. Containers from an inland origin are 49 first transported by available modes in the inland intermodal transportation network, such as truck, 50 rail, barge, or their combinations, to an export port, where containers are loaded onto ships 51
TRB 2011 Annual Meeting Paper revised from original submittal.
Meng and Wang 5
deployed on liner shipping service routes operated by different liner shipping companies and 1 transported to the import port. From the export port to the import port, ships may visit many 2 intermediate ports while these containers stay on board, and these containers can also be 3 transferred at transshipment ports to other ships. After arriving at the import port, containers are 4 discharged from ships and reloaded onto truck, rail, or barge, and delivered to the inland 5 destination. 6 Figure 1 depicts an intermodal transportation system and the container flow from Beijing 7 to Berlin. This intermodal container transportation system consists of two inland intermodal 8 networks (from the origin Beijing to the export port Qingdao and from the import port Rotterdam 9 to the destination Berlin) and one maritime network (from Qingdao port to Rotterdam port). An 10 inland intermodal network is defined by a set of nodes, denoted by N and a set of arcs A . There 11
are three types of nodes: area aN , port pN , and intermodal freight terminal iN . Area nodes are 12 locations of inland origins and/or destinations. Cargo can also be transferred from one transport 13 mode to another, e.g., truck to rail, at area nodes if there are such transshipment facilities. Port 14 nodes can be cargo origins and destinations. Cargo can also be transshipped at port nodes. 15 Intermodal terminals are locations without cargo demand or supply and solely used for cargo 16
transshipment. The arcs between nodes are the inland transportation services, namely, truck tA , 17
rail rA and barge bA . The transportation of containers in the inland network involves different 18 transport modes. For instance, containers from Beijing are firstly loaded onto a barge and shipped 19 to Jinan. In Jinan these containers are transferred to rail and transported to Qingdao port. The 20 maritime transportation network contains only the liner shipping services. Nevertheless, the port 21 to port transportation may be served by more than one carrier. For example, containers from 22 Qingdao port to Rotterdam port are transshipped at Singapore port and two different liner 23 shipping companies are in charge of the transportation of Qingdao-Singapore and Singapore-24 Rotterdam, respectively. It should be noted that a liner ship carrying containers from one port to 25 another port, for example, from Qingdao to Singapore, might call at other ports whereas these 26 containers stay on board. 27 Given the aggregated container shipment demand from shippers for each O-D pair in the 28 intermodal container transportation system, this paper aims to develop a model that can simulate 29 the movement of these containers by taking into account shippers’ route choice behavior and 30 carriers’ service level. This container flow simulation model can be used by liner shipping 31 companies to quantitatively analyze the profitability of opening a new liner shipping service route. 32 Also, it can be used by port operators to estimate port throughput. 33 34
TRB 2011 Annual Meeting Paper revised from original submittal.

Meng and Wang 6
1 FIGURE 1 An intermodal container transportation network. 2
3 CONTAINER FLOW SIMULATION MODEL 4 5 Segment-based Paths between an O-D Pair 6 In order to facilitate model formulation whilst not missing major characteristics of a container 7 flow path from origin to destination, we propose the concept of segment-based path. The 8 segment-based path formulation for the flow in Figure 1 is: Beijing→Qingdao port→Singapore 9 port→Rotterdam port→Berlin, where Qingdao port is the export port, Rotterdam port is the 10 import port and containers are transshipped at Singapore port. Thus, this segment-based path is 11 composed of a series of segments: Beijing→Qingdao port, Qingdao port→Singapore port, 12 Singapore port→Rotterdam port, and Rotterdam port→Berlin. Namely, a segment is from the 13 origin to the export port or from the import port to the destination, or from a loading port to a 14 discharge port. The first two types of segment are called inland segment and the segment from 15 port to port is referred to as maritime segment. Transshipment ports can easily be derived from 16 the definition of segment-based path. The term path mentioned in the remainder of the paper 17 refers to segment-based path. 18 19 Utility-Based Path Choice Model for Shippers 20 Shippers can choose different carriers for different segments in a path. Without loss of generality, 21 we assume that the load and discharge cost at both ends of a segment is included in the freight 22 rate of the transportation service for the segment. It is possible that containers are stored at ports 23 for some time as liner ships have fixed schedules, and the storage cost at port should be accounted 24 for. A shipper may have more than one batch of containers to transport, e.g., one batch in January 25 and another batch in May, or one batch every week. Here we simply consider those different 26 batches as from different shippers. Thus, one shipper has exactly one batch of containers (referred 27 to as a shipment hereafter). 28
TRB 2011 Annual Meeting Paper revised from original submittal.

Meng and Wang 7
From the origin to the destination, shippers have many candidate paths to choose. For 1 instance, another possible path in Figure 1 is Beijing→Tianjin port→Busan port→Hamburg port2 →Berlin. When facing with the path choice, each shipper’s individual preference can be 3 described by a utility function in terms of cost and time of the path (5) defined below: 4 ( ) ( ), VOT , ,= − + × ∈ ∈r s r od odV r s C T r R s S (1) 5
where odR is the set of candidate paths from origin o to destination d ; odS is the set of shippers 6
who have container shipment demand from origin o to destination d ; rC is the total charge 7 paid by the shipper who chooses path r (USD/TEU), including the freight rate and storage cost; 8 VOTs is the value of time of the shipment for shipper s (USD/TEU•hour). VOTs is mainly a 9
reflection of the inventory cost of the cargo in the containers; rT is the transit time (hours) from 10 origin to destination on path r . Due to various unobservable factors, the real utility of a path to 11 shipper s , denoted by ( ),U r s , equals the observed utility ( ),V r s plus an error term 12
( ),r sε (15) . The probability that a shipper s chooses a certain path *r among a set of candidate 13
paths odR is the probability that path *r has the largest utility, namely, 14
{ }* * *Pr( , ) Pr ( , ) ( , ), , ,od od odr s U r s U r s r R r R s S= ≥ ∀ ∈ ∈ ∈ (2) 15
Logit model and probit model are the most commonly used models in practice. 16 Carriers publish the information on the freight rate and schedule of their services, and 17
thus to model the container flow according to the utility-based discrete choice model, we need to 18 find the set of candidate paths. 19
20 Generation of Candidate Paths for an O-D Pair 21 Theoretically there are infinite paths for an O-D pair because containers can be transshipped 22 many times at ports. However, only a small subset of these paths is used in practice. Take Figure 23 1 as an example, one hardly considers Xiamen port as the export port for containers from Beijing 24 to Berlin because of the long inland distance between Beijing and Xiamen. To generate the 25 practical paths, we propose two concepts: export/import ports for an O-D pair and transshipment 26 ports for a pair of ports. The combination of these two concepts together with the concept of 27 segment-based path facilitates the generation of all practical candidate paths for an O-D pair. 28 Note that the generated paths in the model are based on the paths that are in operation in practice. 29 In other words, whether a port is qualified to be an export/import/transshipment port depends on 30 whether in practice it plays the role of export/import/transshipment port. As for the O-D of 31 Beijing-Berlin in Figure 1, it is reasonable to assume the export port is one of Qingdao port and 32 Tianjin port, and the import port is one of Rotterdam port and Hamburg port. Similarly, 33 containers cannot be transshipped at any port in maritime transportation. Hence we also define 34 the transshipment ports for each port pair. An illustrative definition for some ports in Figure 1 in 35 provided in Table 1. Note that Table 1 is only an example to clarify the concept of transshipment 36 ports rather than an enumeration of all transshipment ports. By the introduction of the concept of 37 segment-based path, export/import ports for an O-D and transshipment ports for a port pair, we 38 can list all the candidate paths for the O-D Beijing-Berlin, as shown in Table 2. 39 40 TABLE 1 Transshipment Ports for Some Port Pairs 41
No. Port Pair Transshipment Port 1 Tianjin, Hamburg Singapore 2 Tianjin, Singapore Busan 3 Tianjin, Rotterdam Singapore 4 Qingdao, Hamburg Singapore 5 Qingdao, Rotterdam Singapore
TRB 2011 Annual Meeting Paper revised from original submittal.

Meng and Wang 8
1 TABLE 2 Candidate Paths for the O-D Beijing-Berlin 2 No. Segment-Based Path 1 Beijing→Tianjin→Hamburg→Berlin 2 Beijing→Tianjin→Rotterdam→Berlin 3 Beijing→Tianjin→Singapore→Hamburg→Berlin 4 Beijing→Tianjin→Singapore→Rotterdam→Berlin 5 Beijing→Tianjin→Busan→Singapore→Hamburg→Berlin 6 Beijing→Tianjin→Busan→Singapore→Rotterdam→Berlin 7 Beijing→Qingdao→Hamburg→Berlin 8 Beijing→Qingdao→Rotterdam→Berlin 9 Beijing→Qingdao→Singapore→Hamburg→Berlin 10 Beijing→Qingdao→Singapore→Rotterdam→Berlin
3 Inland Intermodal Operational Network 4 An inland segment is within an inland intermodal network comprising transport modes such as 5 truck, rail or barge or their combinations. In our approach, the inland is divided into many areas 6 and all containers originated from the area are assumed to be located at the central city of the area. 7 Normally there are numerous inland carriers providing various transportation services and it is 8 difficult to trace each one of them. In addition, the inland transportation takes much shorter time 9 compared with the maritime transportation. Thus, it is reasonable to assume that in the inland 10 transportation network, there is at most one carrier providing service for each mode between two 11 nodes and this service has an unlimited capacity and is available at any time. For instance, in the 12 inland intermodal transportation network in Figure 2 there are truck and rail services between 13 node 1 and node 6; each service has a given freight rate and transit time. Note that directions for 14 the arcs in Figure 2 are not drawn as all the arcs are bi-directional in the inland intermodal 15 transportation network. 16 17
18
FIGURE 2 Inland intermodal transportation network. 19 20 The container flow in the inland intermodal transportation network is different from the 21
traditional network flow in that the transshipment cost and time are incurred at a node if the 22 incoming arc and the outgoing arc are of two types (transport modes). In order to use any shortest 23 path algorithm to calculate the utility of an inland segment, we transform the inland intermodal 24 transportation network into an equivalent inland intermodal operational network with cost or time 25 exclusively associated with arcs. The corresponding operational network for the inland 26 intermodal transportation network of Figure 2 is shown in Figure 3. In the inland intermodal 27 operational network, one node i N∈ in the transportation network is represented by at most 5 28
nodes: origin oin , destination d
in , truck terminal tin , railway terminal r
in and port terminal 29 pin (both inland port terminal and sea port terminal). There are inland transportation arc 30
TRB 2011 Annual Meeting Paper revised from original submittal.

Meng and Wang 9
(including truck, rail and barge), transshipment arc (transferring cargo between two transport 1 modes) and origin/destination arc (arc from origin to terminal and from terminal to destination). 2 The transshipment arc is not drawn for the ease of readability and cargo can be transferred from 3 one terminal to another in the same location. The inland transportation arc and transshipment arc 4 are bidirectional and have fixed cost and transit/transfer time. The origin/destination arcs are 5 unidirectional and associated with no cost or transit/transfer time. We can use the utility 6 definition equation (1) to calculate the utility of each arc, and thus employ the shortest path 7 algorithm to find the utility of an inland segment. For instance, the optimal segment from origin 1 8 to its export port 4 in the transportation network in Figure 2 corresponds to the shortest path from 9
1on to 4
pn in the operational network of Figure 3. 10
11
12
FIGURE 3 Inland intermodal operational network. 13 14
Maritime Transportation Network 15 Determining the utility of a maritime segment is straightforward. As a maritime segment has 16 defined the load port and the discharge port, we look up all the liner shipping services provided 17 by different carriers. By comparing the freight rate and transit time of these services, we can 18 choose the one with maximum utility. It should be noted that as a liner shipping service has its 19 fixed schedule, containers might need to be stored at ports for some time and wait for the 20 shipping service. To find the optimal liner service, we should take into consideration the storage 21 cost and wait time at port. For instance, in the path of Beijing→Qingdao port→Singapore 22 port→Rotterdam port→Berlin, we define the segment Singapore port→Rotterdam port as from 23 the arrival at Singapore port to the arrival at Rotterdam port. In other words, the storage time and 24 cost at Singapore port are included in the segment Singapore port→Rotterdam port. Therefore 25 which liner service is the optimal for the segment Singapore port→Rotterdam port depends on the 26 arrival time at Singapore port. In other words, it depends on the choice of service for the former 27 segment Qingdao port→Singapore port. 28
To determine the utility of a path, i.e., to obtain the optimal combination of the services 29 on each segment, we can employ the dynamic programming procedure as the utility of a service 30 on the latter segment depends solely on the choice of service for the former segment. 31
32 Discrete Event Simulation 33 Given the inland intermodal operational network and the maritime transportation network, we use 34 the discrete event simulation technique to simulate the container flow within a certain time period 35 (e.g. one year). The flowchart of the simulation process is shown in Figure 4. We simply assume 36 that the time interval between two adjacent shipments is exponentially distributed and each 37 shipment has a constant batch size (number of containers). A larger batch size leads to fewer 38 shipments, and thus reduces the simulation time. However, large batch size may decrease the 39
TRB 2011 Annual Meeting Paper revised from original submittal.

Meng and Wang 10
simulation accuracy, depending on the aggregated container number for each O-D and the ship 1 capacity. Besides, the distribution of VOT for the shipments is estimated based on the commodity 2 type and value. With these settings, we can generate all the shipments for a given aggregated O-D 3 container shipment demand. 4
5
Start
End
Generate shipments
Start to process the next shipment
Calculate the utility of all its segment-based paths
Use discrete-choice model to choose one segment-based path
Update the available capacity of the ships
Summarize the processing result, excluding the warm-up shipments
All shipments processed
Y
N
6
FIGURE 4 Flowchart of the simulation. 7 8 At the beginning of the simulation, we assume that all ships are empty. To reduce the 9
posed simulation error, we add a warm-up period (e.g., 2 months). Shipments for the warm-up 10 period are also generated and processed in the same manner as normal shipments, whereas they 11 are not summarized for conclusions. 12
A shipper chooses a segment-based path according to the utility-based discrete choice 13 model. After that the available capacity of ships on the path is updated. For example, if the 14 shipment is 100 TEUs and the original available ship capacity is 120 TEUs on a certain segment 15 in the path, then after processing the shipment, the available ship capacity is 20 TEUs. If the next 16 shipment is 100 TEUs, the current available ship capacity is not large enough to accommodate the 17 shipment and hence this shipment cannot be delivered by the ship. 18
19 Implementation Using C++ 20 The proposed container flow simulation model has been implemented using programming 21 language C++ and MySQL database. It has three modules as shown in Figure 5: the input and 22 output modules, which are interactive with users, and the process module. The “Simulate” block 23 in the process module represents the steps shown in Figure 4. 24
TRB 2011 Annual Meeting Paper revised from original submittal.

Meng and Wang 11
1
FIGURE 5 Structure of the container flow simulation program. 2 3
APPLICATIONS 4 There are three major container cargo transportation routes internationally: the transpacific, which 5 is between Asia and North America, the transatlantic, which connects North America and Europe, 6 and the Asia-Europe lane, which has the largest container flow volume. In 2007, container flows 7 from Asia to Europe and from Europe to Asia are estimated at 17.7 and 10 million TEUs 8 respectively (1). We thus employ the proposed model to analyze the container flow on the Asia-9 Europe lane in 2008. We consider three liner shipping companies, APL, OOCL and Maersk. 2 10 Asia-Europe routes and 3 intra-Asia routes are selected for each company. These 15 liner service 11 routes are modified by deleting the ports which are not in our case and adding a dummy port if 12 necessary in order to make the round-trip time be an integer number of weeks. APL and OOCL 13 take Singapore port as the Southeast Asian transshipment hub (2, 16) and Maersk uses Tanjung 14 Pelepas (17). The cargo flow from Asia to Europe is assumed to be from the 13 provinces of 15 Mainland China with the largest GDP in 2008 (18) to Rotterdam port. The capital cities of these 16 provinces are Guangzhou, Jinan, Nanjing, Hangzhou, Zhengzhou, Shijiazhuang, Shanghai, 17 Shenyang, Chengdu, Wuhan, Changsha, Fuzhou and Beijing, shown in Figure 1. The cargo flow 18 from Europe to Asia is assumed to be from Rotterdam port to 7 of the top 9 ports regarding the 19 number of TEUs handled in 2007 (19) in Mainland China. These 7 ports are Dalian, Tianjin, 20 Qingdao, Shanghai, Ningbo, Fuzhou, Xiamen and Shenzhen; Yingkou port and Guangzhou port 21 are not included because the selected 15 liner service routes do not call at these two ports. The 22 total number of TEUs in the two directions between Asia and Europe are adjusted proportionally 23 to fit the transportation capacity of the liner service routes. For each O-D pair, the number of 24 TEUs is proportional to the GDP of the origin Chinese province (from Asia to Europe) or the 25 number of TEUs handled at the destination Chinese port (from Europe to Asia). There are also 4 26 intermodal stations (Qinhuangdao, Dezhou, Xuzhou and Zhangping) in the inland transportation 27 network in Mainland China, and 7 transshipment ports (Hong Kong, Kaohsiung, Pusan, Kobe, 28 Port Klang, Tanjung Pelepas and Singapore). Thus, there are a total of 3 carriers, 15 liner routes, 29 13 areas, 4 intermodal stations, 17 ports (including a dummy port) and 20 O-D pairs, as shown in 30 Figure 1. 31
The cost and time of inland transportation are calculated according to (20). The 32 transshipment cost is assumed to be 50 USD and the time is 1 hour between any two inland 33 transportation modes. The storage cost is 1 USD/TEU•day (21). The freight rate for maritime 34 transportation is estimated from the report of UNCTAD (1). The VOT (USD/TEU•h) distribution 35 is estimated by the commodity types and the value of commodity shipped from Asia to US in 36 2004 (22). 37
As in this study the wait time at transshipment ports is considered, it is difficult to 38 quantify the correlation of the utilities of two paths. Hence we simply use the multinomial logit 39
TRB 2011 Annual Meeting Paper revised from original submittal.

Meng and Wang 12
model (15) to express the probability that a shipper s chooses a certain path *r among a set of 1 candidate paths odR , namely, 2
( )*( , )
* *( , )
Pr , , ,od
V r s
od odV r s
r R
er s r R s S
e
μ
μ∈
= ∈ ∈
(3) 3
where μ is the scale parameter. The scale parameter μ in the multinomial logit discrete choice 4 model is assume to be 0.005, which means that if there are only two services and the first has 200 5 USD more utility than the second, then the probability that shippers will choose the first service is 6 exp(1)/[exp(1)+exp(0)]=73%. The study period is 1 year and the warm-up period is 2 months. 7 The batch size of each shipment is 100 TEUs. 8 9
Next, we analyze two scenarios to illustrate how the model can be used as a quantitative 10 analysis tool to assist the decision-making for carriers and port operators. 11
12 Introduction of a New Liner Service Route 13 APL observes that ships have a very high loading factor on the legs of Rotterdam-Singapore and 14 Singapore-Rotterdam through simulation. Therefore APL considers chartering more ships to 15 provide a new liner service route between Rotterdam and Singapore. The simulation results are 16 shown in Figure 6. After introducing the new liner route, it is estimated that APL will increase its 17 revenue by 431 million USD and raise its market share from 34% to 43% (Here the market share 18 is defined as the ratio of one carrier’s revenue to the sum of all carriers’ revenues). By comparing 19 the operating cost of the new liner route with the increased revenue and taking into account its 20 marketing strategy, APL can make the decision whether to introduce this new liner service route 21 or not. 22
In this scenario, the freight rate of the new service is the same as existing services. There 23 are two reasons for the volume shift to APL. One is the availability of slots. The other is the more 24 frequent services, in other words, the container wait time at ports is shortened due to more 25 frequent services. Two managerial insights can be correspondingly obtained. First, some liner 26 shipping companies share slots on ships (slot charter). For example, a ship has the capacity of 27 4000 TEUs and is shared by 2 liner shipping companies. Each company manages 2000 TEUs. In 28 this case, it might be possible that each company has 100 TEUs’ free slots, while a potential 29 shipment is 150 TEUs. Consequently it is suggested that the ship capacity be flexibly allocated to 30 these two companies. If one company uses more than half the capacity, it should compensate the 31 other company. The flexible capacity allocation strategy dominates the rigid slot allocation. 32 Second, liner shipping companies try to provide fast services by visiting as few intermediate ports 33 as possible. From this model, to increase the service frequency can be considered as another 34 alternative. Of course, increasing the service frequency requires to deploy more ships. Whether 35 increasing the service frequency is justifiable should be examined on a case-by-case basis. 36
37
TRB 2011 Annual Meeting Paper revised from original submittal.

Meng and Wang 13
1
FIGURE 6 Revenue (billion USD) and market share before (a) and after (b) the introduction of a 2 new liner route by APL. 3
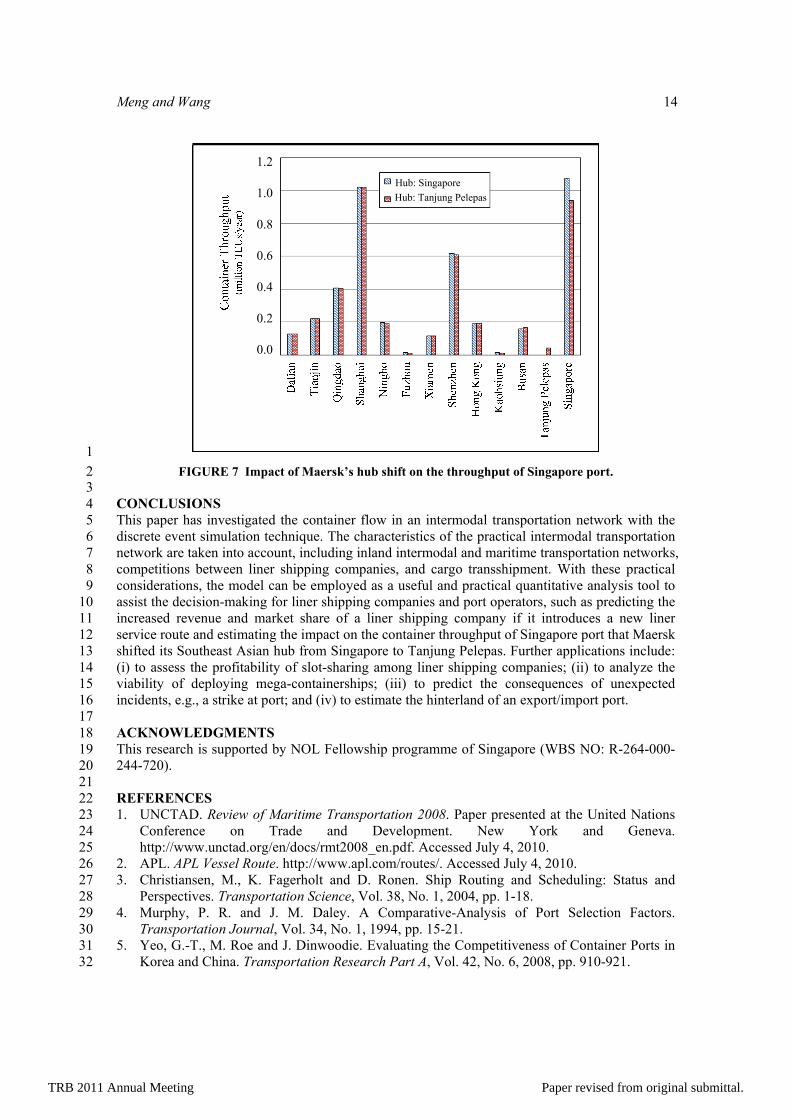
4 Maersk Shifted Its Southeast Asian Hub 5 A major concern for port operators is to retain their existing customers (carriers). Thus, we 6 analyze the impact of Maersk’s South Asian hub shift. Before the year 2000, Maersk used 7 Singapore port as its transshipment hub (23). The comparison of the container throughput for 8 some ports between the current situation (with Tanjung Pelepas as the hub) and the case that 9 Maersk would still use Singapore port as its hub is provided in Figure 7. Results indicate that 10 Singapore’s container throughput decreases by 14.5% as a result of Maersk’s hub shift. This 11 underscores the importance of retaining large liner shipping companies for a port. 12
We provide insights pertaining to the choice of hub port by analyzing these two case 13 studies. In the first case, APL, OOCL and Maersk roughly provide the same services (each has 2 14 Asia-Europe routes and 3 intra-Asia routes), whereas from Figure 6 (a), the market share of 15 Maersk is significantly smaller than the other two companies. This is due to the more frequent 16 shipping services at Singapore port. In other words, cargo from Asia to Europe and transshipped 17 at Singapore port wait short shorter time because there are 4 liner service routes from Singapore 18 to Europe (Tanjung Pelepas has only two services to Europe). In other words, Singapore port has 19 better connectivity. As a result, more shippers choose to transship at Singapore port. Similarly, in 20 Figure 6 (b), when APL introduces a new service connecting Singapore and Europe, the benefit 21 of transshipping at Singapore is more evident. Hence, OOCL also benefits from this new service 22 to some extent. The market share of OOCL drops because the competition of APL’s new service 23 outweighs the facilitation of transshipment. Maersk suffers the most in this case because both the 24 competition of APL’s new service and the facilitation of transshipment at Singapore are 25 detrimental to it. We can also explain the interesting result in Figure 7 that the container 26 throughput of Singapore when Maersk had not shifted its hub is even larger than the sum of the 27 container throughputs of both Singapore and Tanjung Pelepas after the hub shift. This result is 28 now intuitive, because when one hub is divided into two, the ship calling frequency decreases and 29 thus the benefit of transshipment is reduced. In this case, more containers are shipped from Asia 30 to Europe without transshipment. Therefore, liner shipping companies, especially small liner 31 shipping companies, should choose the hub port with many existing liner services. Also, from the 32 perspective of port operators, once a port has enough liner services calling, liner shipping 33 companies would naturally choose it as the hub. Therefore the foremost task for port operators is 34 to retain the global liner shipping companies or liner shipping alliances. 35
36
TRB 2011 Annual Meeting Paper revised from original submittal.
Meng and Wang 14
0.0
0.6
0.8
1.0
0.4
0.2
1.2
Hub: Tanjung Pelepas
Hub: Singapore
1
FIGURE 7 Impact of Maersk’s hub shift on the throughput of Singapore port. 2 3
CONCLUSIONS 4 This paper has investigated the container flow in an intermodal transportation network with the 5 discrete event simulation technique. The characteristics of the practical intermodal transportation 6 network are taken into account, including inland intermodal and maritime transportation networks, 7 competitions between liner shipping companies, and cargo transshipment. With these practical 8 considerations, the model can be employed as a useful and practical quantitative analysis tool to 9 assist the decision-making for liner shipping companies and port operators, such as predicting the 10 increased revenue and market share of a liner shipping company if it introduces a new liner 11 service route and estimating the impact on the container throughput of Singapore port that Maersk 12 shifted its Southeast Asian hub from Singapore to Tanjung Pelepas. Further applications include: 13 (i) to assess the profitability of slot-sharing among liner shipping companies; (ii) to analyze the 14 viability of deploying mega-containerships; (iii) to predict the consequences of unexpected 15 incidents, e.g., a strike at port; and (iv) to estimate the hinterland of an export/import port. 16 17 ACKNOWLEDGMENTS 18 This research is supported by NOL Fellowship programme of Singapore (WBS NO: R-264-000-19 244-720). 20 21 REFERENCES 22 1. UNCTAD. Review of Maritime Transportation 2008. Paper presented at the United Nations 23
Conference on Trade and Development. New York and Geneva. 24 http://www.unctad.org/en/docs/rmt2008_en.pdf. Accessed July 4, 2010. 25
2. APL. APL Vessel Route. http://www.apl.com/routes/. Accessed July 4, 2010. 26 3. Christiansen, M., K. Fagerholt and D. Ronen. Ship Routing and Scheduling: Status and 27
Perspectives. Transportation Science, Vol. 38, No. 1, 2004, pp. 1-18. 28 4. Murphy, P. R. and J. M. Daley. A Comparative-Analysis of Port Selection Factors. 29
Transportation Journal, Vol. 34, No. 1, 1994, pp. 15-21. 30 5. Yeo, G.-T., M. Roe and J. Dinwoodie. Evaluating the Competitiveness of Container Ports in 31
Korea and China. Transportation Research Part A, Vol. 42, No. 6, 2008, pp. 910-921. 32
TRB 2011 Annual Meeting Paper revised from original submittal.

Meng and Wang 15
6. Chang, Y.-T., S.-Y. Lee and J. L. Tongzon. Port Selection Factors by Shipping Lines: 1 Different Perspectives between Trunk Liners and Feeder Service Providers. Marine Policy, 2 Vol. 32, No. 6, 2008, pp. 877-885. 3
7. Tongzon, J. L. Port Choice and Freight Forwarders. Transportation Research Part E, Vol. 45, 4 No. 1, 2009, pp. 186-195. 5
8. Murphy, P. R., J. M. Daley and D. R. Dalenberg. Port Selection Criteria: An Application of A 6 Transportation Research Framework. Logistics and Transportation Review, Vol. 28, No. 3, 7 1992, pp. 237-255. 8
9. Murphy, P. R., J. M. Daley and P. K. Hall. Carrier Selection: Do Shippers and Carriers Agree, 9 or Not? Transportation Research Part E, Vol. 33, No. 1, 1997, pp. 67-72. 10
10. Malchow, M. and A. Kanafani. A Disaggregate Analysis of Factors Influencing Port 11 Selection. Maritime Policy & Management, Vol. 28, No. 3, 2001, pp. 265-277. 12
11. Malchow, M. B. and A. Kanafani. A Disaggregate Analysis of Port Selection. Transportation 13 Research Part E, Vol. 40, No. 4, 2004, pp. 317-337. 14
12. Shibasaki, R., T. Kadono and H. Ieda. Model Improvement of International Maritime 15 Container Cargo Flow and Policy Evaluation for International Logistics in Eastern Asia. 16 Presented at the First International Conference on Transport Logistics, Singapore, 2005. 17
13. Kuroda, K., M. Takebayashi and T. Tsuji. International Container Transportation Network 18 Analysis Considering Post-Panamax Class Container Ships. Research in Transportation 19 Economics, Vol. 13, 2005, pp. 369-391. 20
14. Song, D., J. Zhang, J. Carter, T. Field, J. Marshall, J. Polak, K. Schumacher, P. Sinha-Ray 21 and J. Woods. On Cost-Efficiency of the Global Container Shipping Network. Maritime 22 Policy & Management, Vol. 32, No. 1, 2005, pp. 15-30. 23
15. Ben-Akiva, M. and S. R. Lerman. Discrete Choice Analysis. The MIT Press, Cambridge, 24 Massachusetts and London, England. 1997. 25
16. OOCL. Service Routes. http://www.oocl.com/eng/ourservices/serviceroutes/tpt/. Accessed 26 July 4, 2010. 27
17. Maersk. Maersk Line Sailing Schedules. https://www.maerskline.com/frameset.jsp. Accessed 28 July 4, 2010. 29
18. Keyia. Province GDP Ranking. 30 http://www.keyia.net/finance/chenshipaiming/2009/3982.html. Accessed July 4, 2010. 31
19. American Association of Port Authorities. Port Industry Statistics. http://www.aapa-32 ports.org/Industry/content.cfm?ItemNumber=900&navItemNumber=549. Accessed July 4, 33 2010. 34
20. Meng, Q. and X. Wang. Utility-Based Probabilistic Port Hinterland Estimation for Intermodal 35 Freight Transportation Networks. Presented at the 89th Annual Meeting of Transportation 36 Research Board, 2010. 37
21. Imai, A., K. Shintani and S. Papadimitriou. Multi-Port vs. Hub-and-Spoke Port Calls by 38 Containerships. Transportation Research Part E, Vol. 45, 2009, pp.740-757. 39
22. Leachman, R. C. Port and modal allocation of waterborne containerized imports from Asia to 40 the United States. Transportation Research Part E, Vol. 44, No. 2, 2008, pp. 313-331. 41
23. Port of Tanjung Pelepas. History Journey of 2000. http://www.ptp.com.my/history-2000.html. 42 Accessed July 4, 2010. 43
TRB 2011 Annual Meeting Paper revised from original submittal.