
Interim results presentation Sept 2013 Final - Vodacom1 Excluding Gateway Carrier Services only ......
24
11/11/2013 1 For the six months ended September 2013 Vodacom Interim results presentation Disclaimer The following presentation is being made only to, and is only directed at, persons to whom such presentations may lawfully be communicated (‘relevant persons’). Any person who is not a relevant person should not act or rely on this presentation or any of its contents. Information in the following presentation relating to the price at which relevant investments have been bought or sold in the past or the yield on such investments cannot be relied upon as a guide to the future performance of such investments. This presentation does not constitute an offering of securities or otherwise constitute an invitation or inducement to any person to underwrite, subscribe for or otherwise acquire securities in any company within the Group. Promotional material used in this presentation that is based on pricing or service offering may no longer be applicable. This presentation contains certain non-GAAP financial information which has not been reviewed or reported on by the Group’s auditors. The Group’s management believes these measures provide valuable additional information in understanding the performance of the Group or the Group’s businesses because they provide measures used by the Group to assess performance. However, this additional information presented is not uniformly defined by all companies, including those in the Group’s industry. Accordingly, it may not be comparable with similarly titled measures and disclosures by other companies. Additionally, although these measures are important in the management of the business, they should not be viewed in isolation or as replacements for or alternatives to, but rather as complementary to, the comparable GAAP measures. This presentation also contains forward-looking statements which are subject to risks and uncertainties because they relate to future events. These forward-looking statements include, without limitation, statements in relation to the Group’s projected financial results of the 2014-2016 financial years. Some of the factors which may cause actual results to differ from these forward-looking statements are discussed on slide 41 of this presentation. Vodafone, the Vodafone logo, Vodafone Mobile Broadband, Vodafone WebBox, Vodafone WebBook, Vodafone Smart tab, Vodafone 858 Smartphone, Vodafone Passport, Vodafone live!, Power to You, Vodacom, Vodacom M-Pesa, Vodacom Millionaires, Vodacom 4 Less and Vodacom Change the World are trademarks of Vodafone Group Plc (or have applications pending). The trademarks RIM®, BlackBerry®, are owned by Research in Motion Limited and are registered in the US and may be pending or registered in other countries. Java® is a registered trademark of Oracle and/or its affiliates. Microsoft, Windows Mobile and ActiveSync are either registered trademarks or trademarks of Microsoft Corporation in the US and/or other countries. Google, Google Maps and Android are trademarks of Google Inc. Apple, iPhone and iPad are trademarks of Apple Inc., registered in the US and other countries. Other product and company names mentioned herein may be trademarks of their respective owners. 2
Transcript of Interim results presentation Sept 2013 Final - Vodacom1 Excluding Gateway Carrier Services only ......
11/11/2013
1
For the six months ended September 2013
Vodacom Interim results
presentation
Disclaimer
The following presentation is being made only to, and is only directed at, persons to whom such presentations may lawfully be communicated (‘relevant persons’). Any person who is not a relevant person should not act or rely on this presentation or any of its contents.
Information in the following presentation relating to the price at which relevant investments have been bought or sold in the past or the yield on such investments cannot be relied upon as a guide to the future performance of such investments. This presentation does not constitute an offering of securities or otherwise constitute an invitation or inducement to any person to underwrite, subscribe for or otherwise acquire securities in any company within the Group.
Promotional material used in this presentation that is based on pricing or service offering may no longer be applicable.
This presentation contains certain non-GAAP financial information which has not been reviewed or reported on by the Group’s auditors. The Group’s management believes these measures provide valuable additional information in understanding the performance of the Group or the Group’s businesses because they provide measures used by the Group to assess performance. However, this additional information presented is not uniformly defined by all companies, including those in the Group’s industry. Accordingly, it may not be comparable with similarly titled measures and disclosures by other companies. Additionally, although these measures are important in the management of the business, they should not be viewed in isolation or as replacements for or alternatives to, but rather as complementary to, the comparable GAAP measures.
This presentation also contains forward-looking statements which are subject to risks and uncertainties because they relate to future events. These forward-looking statements include, without limitation, statements in relation to the Group’s projected financial results of the 2014-2016 financial years. Some of the factors which may cause actual results to differ from these forward-looking statements are discussed on slide 41 of this presentation.
Vodafone, the Vodafone logo, Vodafone Mobile Broadband, Vodafone WebBox, Vodafone WebBook, Vodafone Smart tab, Vodafone 858 Smartphone, Vodafone Passport, Vodafone live!, Power to You, Vodacom, Vodacom M-Pesa, Vodacom Millionaires, Vodacom 4 Less and Vodacom Change the World are trademarks of Vodafone Group Plc (or have applications pending). The trademarks RIM®, BlackBerry®, are owned by Research in Motion Limited and are registered in the US and may be pending or registered in other countries. Java® is a registered trademark of Oracle and/or its affiliates. Microsoft, Windows Mobile and ActiveSync are either registered trademarks or trademarks of Microsoft Corporation in the US and/or other countries. Google, Google Maps and Android are trademarks of Google Inc. Apple, iPhone and iPad are trademarks of Apple Inc., registered in the US and other countries. Other product and company names mentioned herein may betrademarks of their respective owners.
2
11/11/2013
2
Highlights
My5
Group revenue
Group datarevenue
Group EBITDA
HEPSDividend ps
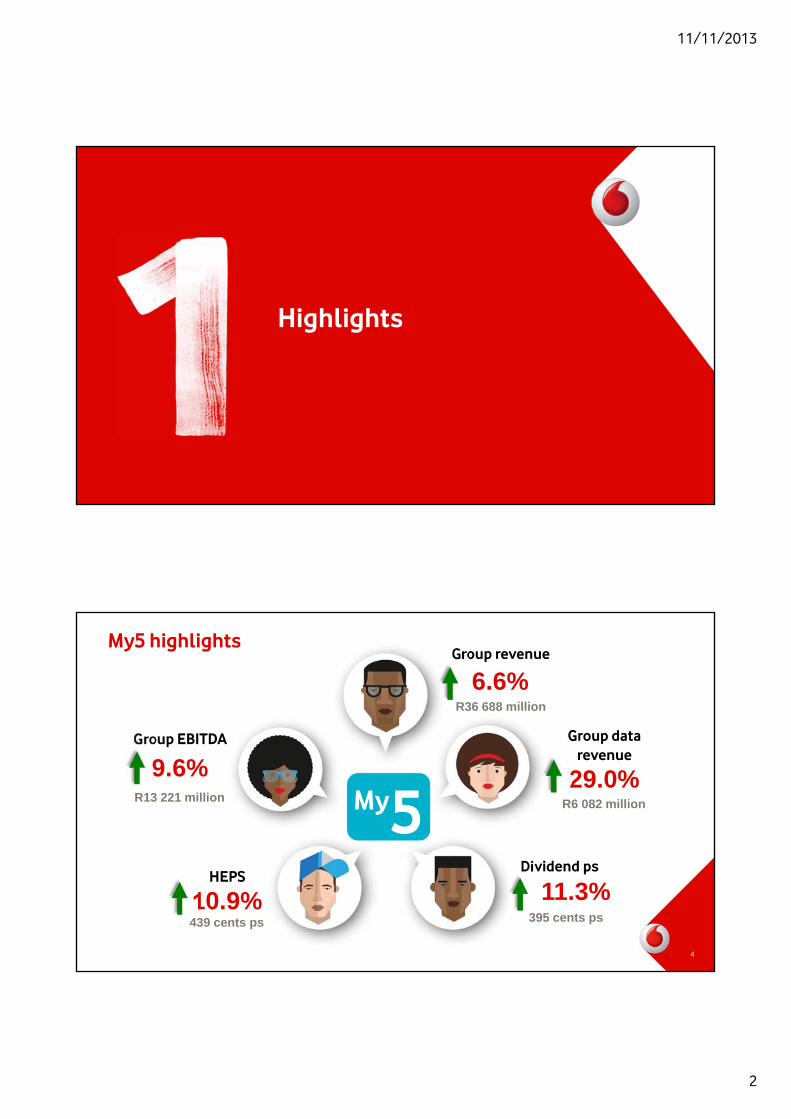
My5 highlights
6.6%R36 688 million
29.0%R6 082 million
9.6%R13 221 million
10.9%439 cents ps
11.3%395 cents ps
4
11/11/2013
3
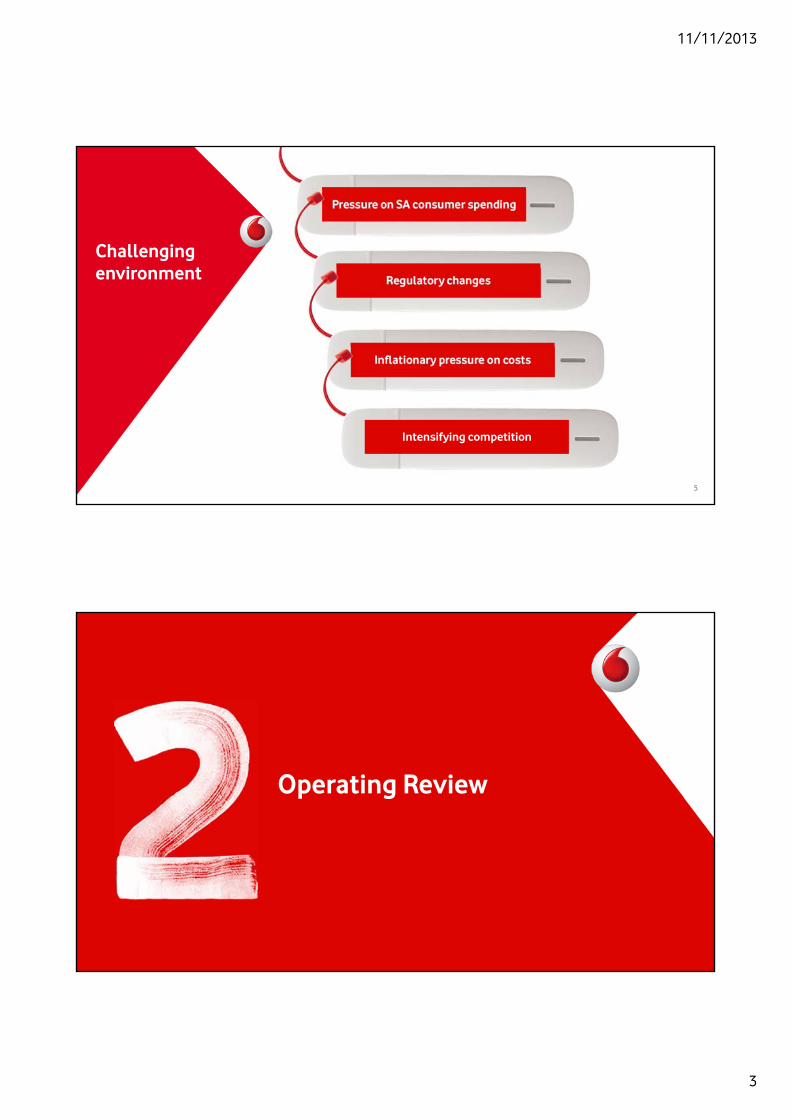
Challenging environment
5
Pressure on SA consumer spending
Regulatory changes
Inflationary pressure on costs
Intensifying competition
Operating Review

11/11/2013
4
South Africa: Successful execution of strategy
• Improved service revenue trends to flat (2.9% excl MTR)
– Revenue up 6.0% boosted by 41.2% increase in equipment sales
• 927k increase in prepaid customers
• Data revenue growth of 20.6%
– Data as percentage of service revenue up to 21.5% (2012: 17.8%)
• EBITDA grew 5.9% year on year with margin of 37.9%
7
Key indicators H1 2014 % change
Service revenue (Rm) 23 747 0.0
Revenue (Rm) 30 134 6.0
EBITDA (Rm) 11 421 5.9
Active customers (‘000) 30 139 1.4
Active data customers (‘000) 15 058 13.4
Smartphones (‘000) 6 568 24.0
International: Solid performance despite intense competition
• Excellent commercial execution delivered 17.2% underlying service revenue growth
– 34.7%1 including foreign exchange benefit
• Data revenue up 100.6%
• 26.5% (R1 781m) of revenue in network expansion to deliver growth
8
Key indicators H1 2014 % change
Service revenue (Rm) 6 516 8.7 (17.2*)
Revenue (Rm) 6 720 9.2 (16.5*)
EBITDA (Rm) 1 806 42.3 (24.8*)
Active customers (‘000) 23 671 22.4
Active data customers (‘000) 6 065 41.0
Outgoing voice traffic (m) 9 253 44.2
1 Excluding Gateway Carrier Services only
* Represents normalised growth excluding foreign exchange gains/losses and at a constant currency from on-going operations

11/11/2013
5
Strategic review
10
Snapshot of our strategic objectives
• Best network
• Best service
• Best value
• Grow data
• Grow internationally
• Grow enterprise
• Grow new services
• Best talent
• Best practices
• Transforming society
• Building trust
• Process efficiencies
• Cost efficiencies
Customer Growth Operations People ReputationCUSTOMER GROWTH OPERATIONS PEOPLE REPUTATION

11/11/2013
6
SA Customer: Delivering best value to customers
Contract: Migration to integrated plans Prepaid: Simplified and bundled offers
11
Worry free pricing
Transforming the base
…Worry free pricing through simplified offerings
1.39
0.54
1.54
0.79
Sep-09 Sep-10 Sep-11 Sep-12 Sep-13
Prepaid Blended
1 371 1 194
1 041
531 645 747
Mar-13 Jun-13 Sep-13
Voice contracts Integrated contracts
• Usage based migration and upgrade to integrated plans
• 41.8% of contracts changed to Smart and Red plans
• In bundle revenue of 63.8%
• 16.9% decrease in effective PPM
• MOU per month up 19.3%
• 927k new prepaid subscribers
(‘000) (R)
Simplify
SA Customer: Best network experience
Fastest speeds
4.0 3.2 3.1
Smartphone download speed
Vodacom SA Operator A Operator B
Widest coverage Self provided transmission
3 239 5 077 6 609
37.7
55.8 68.2
H1 2013 H2 2013 H1 2014
Sites % of sites
12
Fastest and widest coverage Quality
Capacity
Best forvideo and
smartphones
89% 68% 79%
3G population coverage
Vodacom SA Operator A Operator B
…we have taken a clear lead in SA
• 13.2% (R4.9bn) of Group revenue invested in network, R3.1bn in SA
• LTE coverage increased to 727 sites in SA
11/11/2013
7
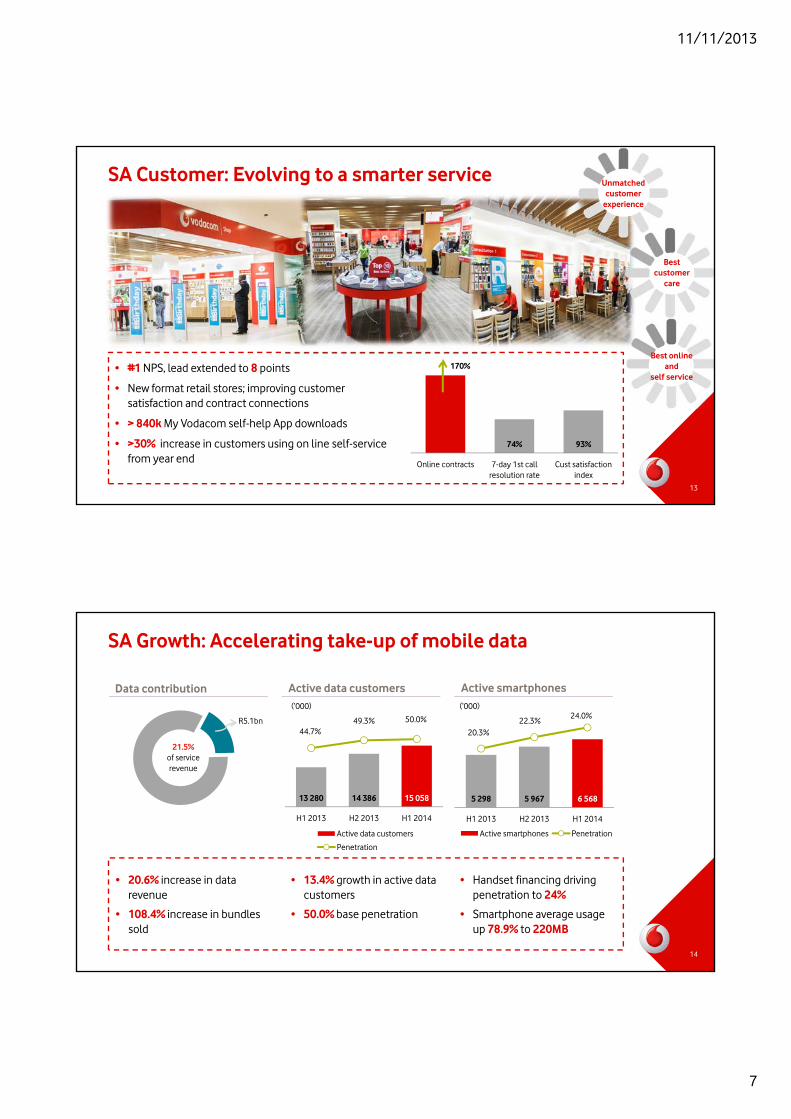
• #1 NPS, lead extended to 8 points
• New format retail stores; improving customer satisfaction and contract connections
• > 840k My Vodacom self-help App downloads
• >30% increase in customers using on line self-service from year end
170%
74% 93%
Online contracts 7-day 1st callresolution rate
Cust satisfactionindex
13
SA Customer: Evolving to a smarter service Unmatched customer
experience
Best customer
care
Best online and
self service
• 20.6% increase in data revenue
• 108.4% increase in bundles sold
SA Growth: Accelerating take-up of mobile data
21.5% of service revenue
R5.1bn
14
Data contribution
5 298 5 967 6 568
H1 2013 H2 2013 H1 2014
Active smartphones Penetration
20.3%22.3%
24.0%
Active smartphones
• Handset financing driving penetration to 24%
• Smartphone average usage up 78.9% to 220MB
(‘000)
Active data customers
• 13.4% growth in active data customers
• 50.0% base penetration
(‘000)
13 280 14 386 15 058
H1 2013 H2 2013 H1 2014
Active data customers
Penetration
44.7%49.3% 50.0%
11/11/2013
8
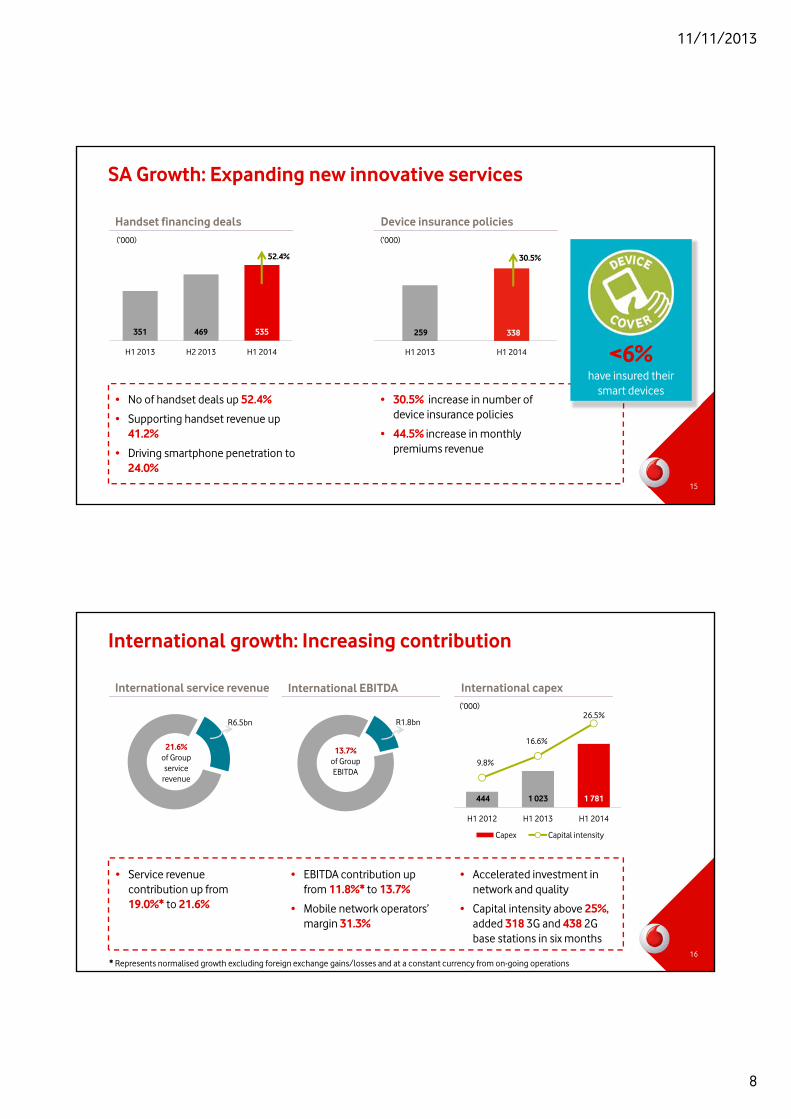
SA Growth: Expanding new innovative services
15
• No of handset deals up 52.4%
• Supporting handset revenue up 41.2%
• Driving smartphone penetration to 24.0%
Handset financing deals
351 469 535
H1 2013 H2 2013 H1 2014
52.4%
Device insurance policies(‘000)
H1 2013 H1 2014
30.5%
• 30.5% increase in number of device insurance policies
• 44.5% increase in monthly premiums revenue
(‘000)
259 338
<6%have insured their
smart devices
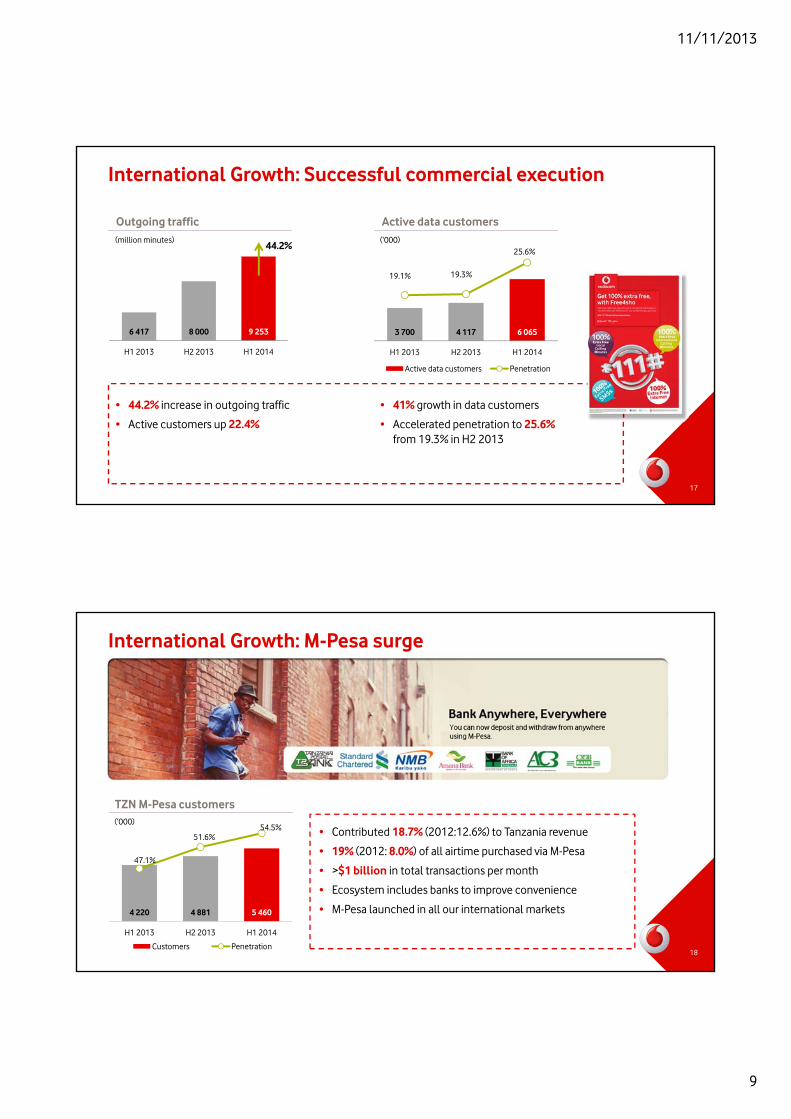
• Service revenue contribution up from 19.0%* to 21.6%
International growth: Increasing contribution
16
International service revenue International capex
• Accelerated investment in network and quality
• Capital intensity above 25%, added 318 3G and 438 2G base stations in six months
(‘000)
International EBITDA
• EBITDA contribution up from 11.8%* to 13.7%
• Mobile network operators’ margin 31.3%
21.6% of Group service
revenue
R6.5bn
13.7% of GroupEBITDA
R1.8bn
444 1 023 1 781
H1 2012 H1 2013 H1 2014
Capex Capital intensity
9.8%
16.6%
26.5%
* Represents normalised growth excluding foreign exchange gains/losses and at a constant currency from on-going operations
11/11/2013
9
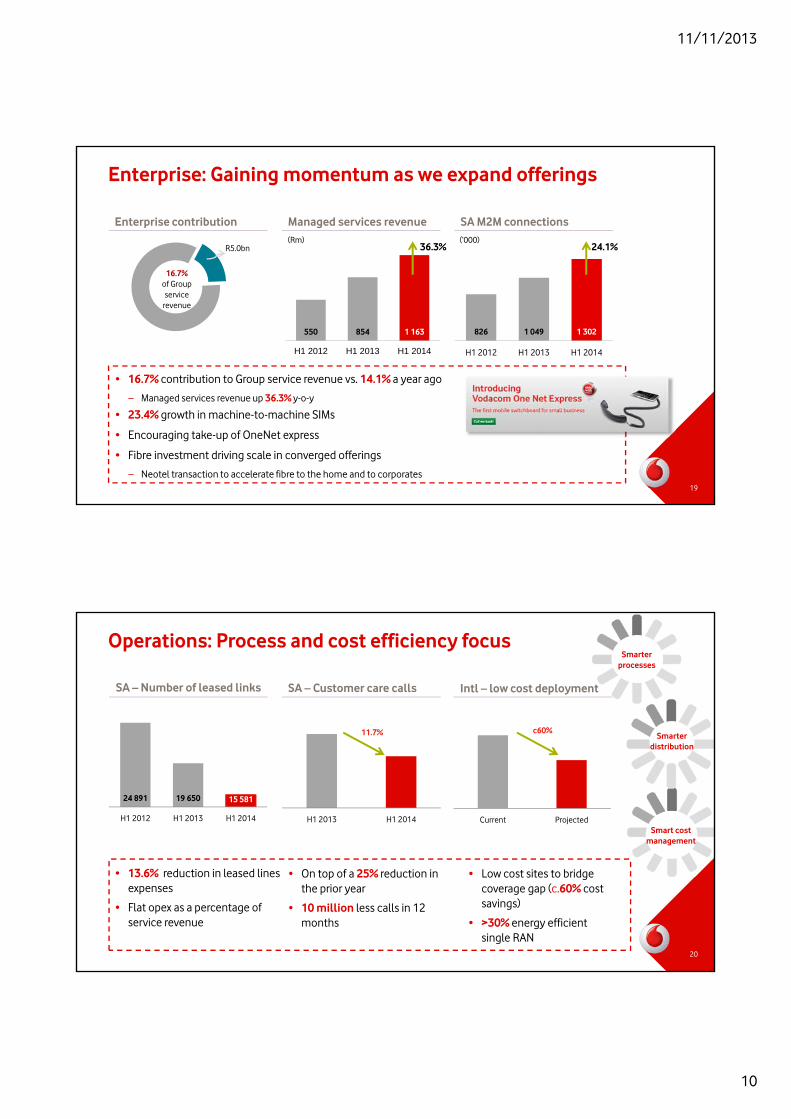
International Growth: Successful commercial execution
17
3 700 4 117 6 065
H1 2013 H2 2013 H1 2014
Active data customers Penetration
19.1% 19.3%
25.6%
Active data customersOutgoing traffic
• 41% growth in data customers
• Accelerated penetration to 25.6% from 19.3% in H2 2013
6 417 8 000 9 253
H1 2013 H2 2013 H1 2014
• 44.2% increase in outgoing traffic
• Active customers up 22.4%
44.2%(million minutes) (‘000)
International Growth: M-Pesa surge
TZN M-Pesa customers
4 220 4 881 5 460
47.1%
51.6%54.5%
H1 2013 H2 2013 H1 2014
Customers Penetration18
• Contributed 18.7% (2012:12.6%) to Tanzania revenue
• 19% (2012: 8.0%) of all airtime purchased via M-Pesa
• >$1 billion in total transactions per month
• Ecosystem includes banks to improve convenience
• M-Pesa launched in all our international markets
(‘000)
11/11/2013
10
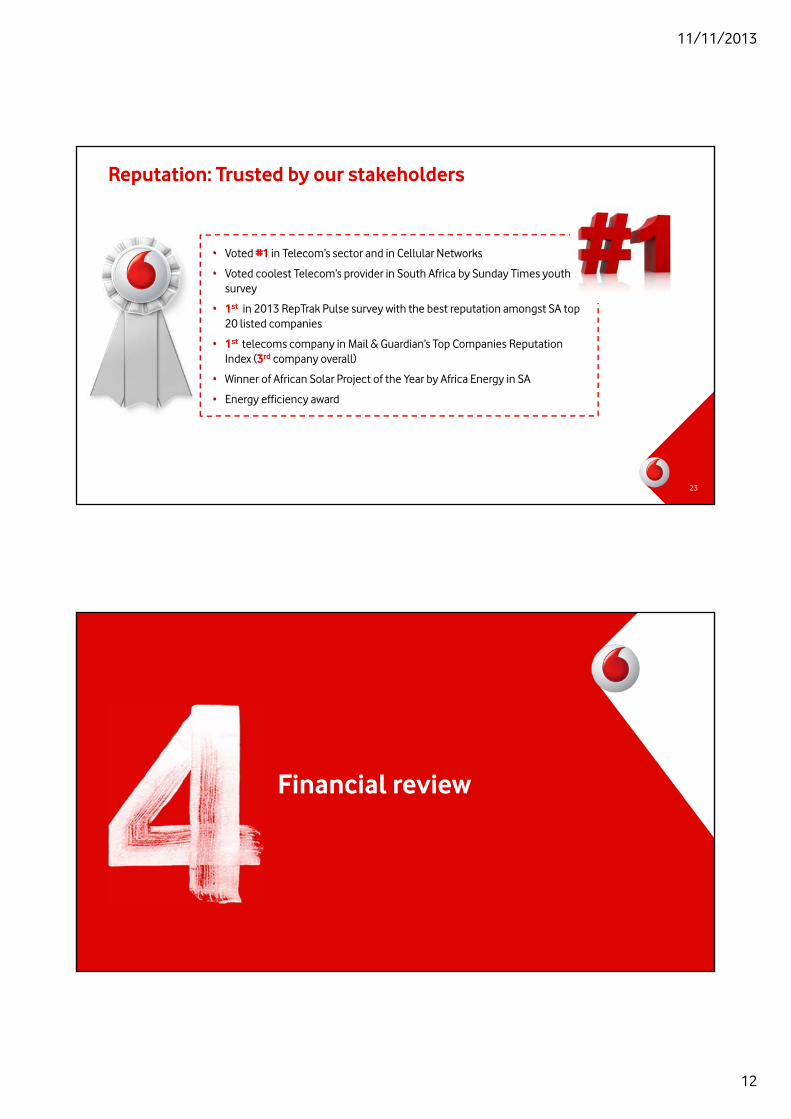
Enterprise: Gaining momentum as we expand offerings
• 16.7% contribution to Group service revenue vs. 14.1% a year ago
– Managed services revenue up 36.3% y-o-y
• 23.4% growth in machine-to-machine SIMs
• Encouraging take-up of OneNet express
• Fibre investment driving scale in converged offerings
– Neotel transaction to accelerate fibre to the home and to corporates19
SA M2M connections
826 1 049 1 302
H1 2012 H1 2013 H1 2014
24.1%(‘000)
16.7% of Group service
revenue
R5.0bn
Enterprise contribution Managed services revenue
550 854 1 163
H1 2012 H1 2013 H1 2014
36.3%(Rm)
Operations: Process and cost efficiency focus
SA – Number of leased links SA – Customer care calls Intl – low cost deployment
24 891 19 650 15 581
H1 2012 H1 2013 H1 2014 H1 2013 H1 2014
20
• 13.6% reduction in leased lines expenses
• Flat opex as a percentage of service revenue
• On top of a 25% reduction in the prior year
• 10 million less calls in 12 months
• Low cost sites to bridge coverage gap (c.60% cost savings)
• >30% energy efficient single RAN
11.7% c60%
Smarter processes
Smarter distribution
Smart cost management
Current Projected

11/11/2013
11
People: Building a talented and diverse team
21
Developing pipeline
Female leaders in waitingBursary and graduate
programsDeveloping learners
Raising the bar
• International secondments
• Advanced training programs
• Female development programs
New talent
• Diversifying local skills
• Driving transformation
• Import new skills from Vodafone
Reputation: Mobiles for good
22
…R87 million committed through the Vodacom Foundation in SA
• DRC: Raising R50m through M-Pesa/SMS for humanitarian needs, reconnecting refugee families with (7k) free calls
• LES: mobile platform for national centre to treat >40k HIV+ children
• MOZ: >1m treatment reminders for HIV+ pregnant women over SMS
• TZN: raising over R200m to eradicate fistula by 2016, M-Pesa channeling of funds to beneficiaries
• Connecting 990 schools
• 30 teacher centres
• 9 ICT resource centres
Mobile education Mobile health
• Integrated school health program
– 11 National Health insurance districts
Working with others to bring meaningful change to our communities
11/11/2013
12
Reputation: Trusted by our stakeholders
23
• Voted #1 in Telecom’s sector and in Cellular Networks
• Voted coolest Telecom’s provider in South Africa by Sunday Times youth survey
• 1st in 2013 RepTrak Pulse survey with the best reputation amongst SA top 20 listed companies
• 1st telecoms company in Mail & Guardian’s Top Companies Reputation Index (3rd company overall)
• Winner of African Solar Project of the Year by Africa Energy in SA
• Energy efficiency award
Financial review
11/11/2013
13
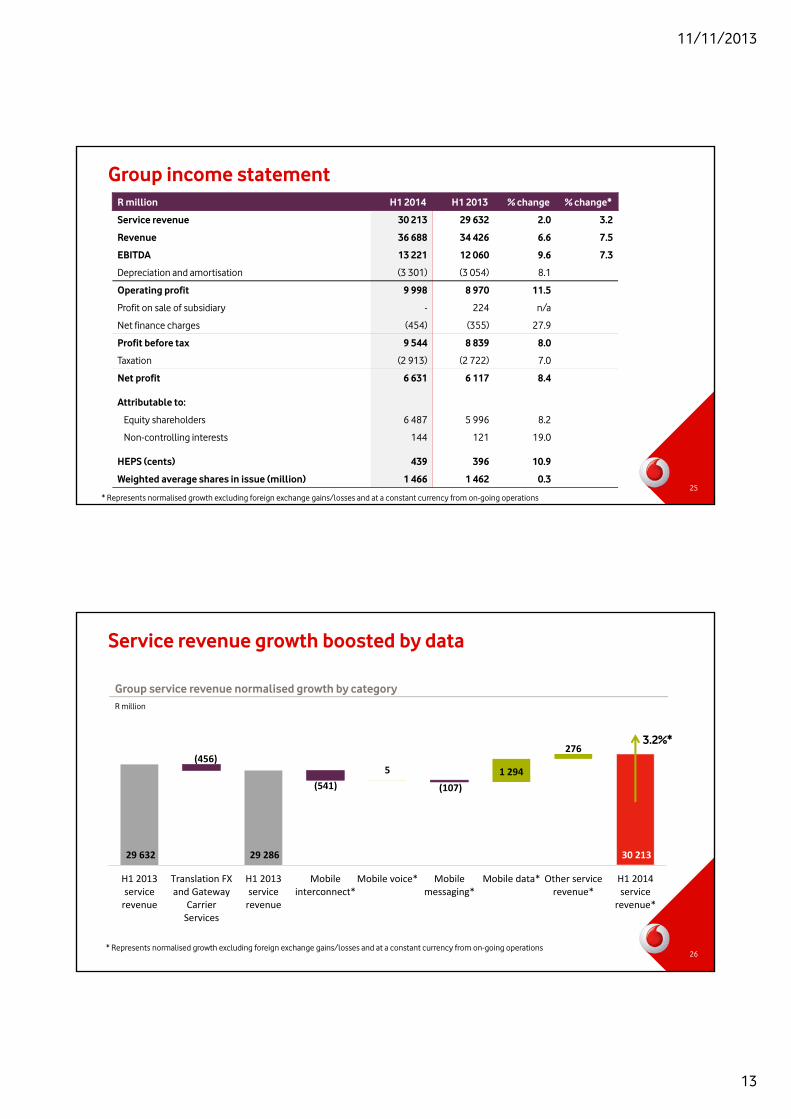
Group income statement
25
R million H1 2014 H1 2013 % change % change*
Service revenue 30 213 29 632 2.0 3.2
Revenue 36 688 34 426 6.6 7.5
EBITDA 13 221 12 060 9.6 7.3
Depreciation and amortisation (3 301) (3 054) 8.1
Operating profit 9 998 8 970 11.5
Profit on sale of subsidiary - 224 n/a
Net finance charges (454) (355) 27.9
Profit before tax 9 544 8 839 8.0
Taxation (2 913) (2 722) 7.0
Net profit 6 631 6 117 8.4
Attributable to:
Equity shareholders 6 487 5 996 8.2
Non-controlling interests 144 121 19.0
HEPS (cents) 439 396 10.9
Weighted average shares in issue (million) 1 466 1 462 0.3
* Represents normalised growth excluding foreign exchange gains/losses and at a constant currency from on-going operations
Service revenue growth boosted by data
26
29 632 29 286 30 213
5 1 294
276(456)
(541) (107)
H1 2013servicerevenue
Translation FXand Gateway
CarrierServices
H1 2013servicerevenue
Mobileinterconnect*
Mobile voice* Mobilemessaging*
Mobile data* Other servicerevenue*
H1 2014servicerevenue*
Group service revenue normalised growth by categoryR million
3.2%*
* Represents normalised growth excluding foreign exchange gains/losses and at a constant currency from on-going operations
11/11/2013
14
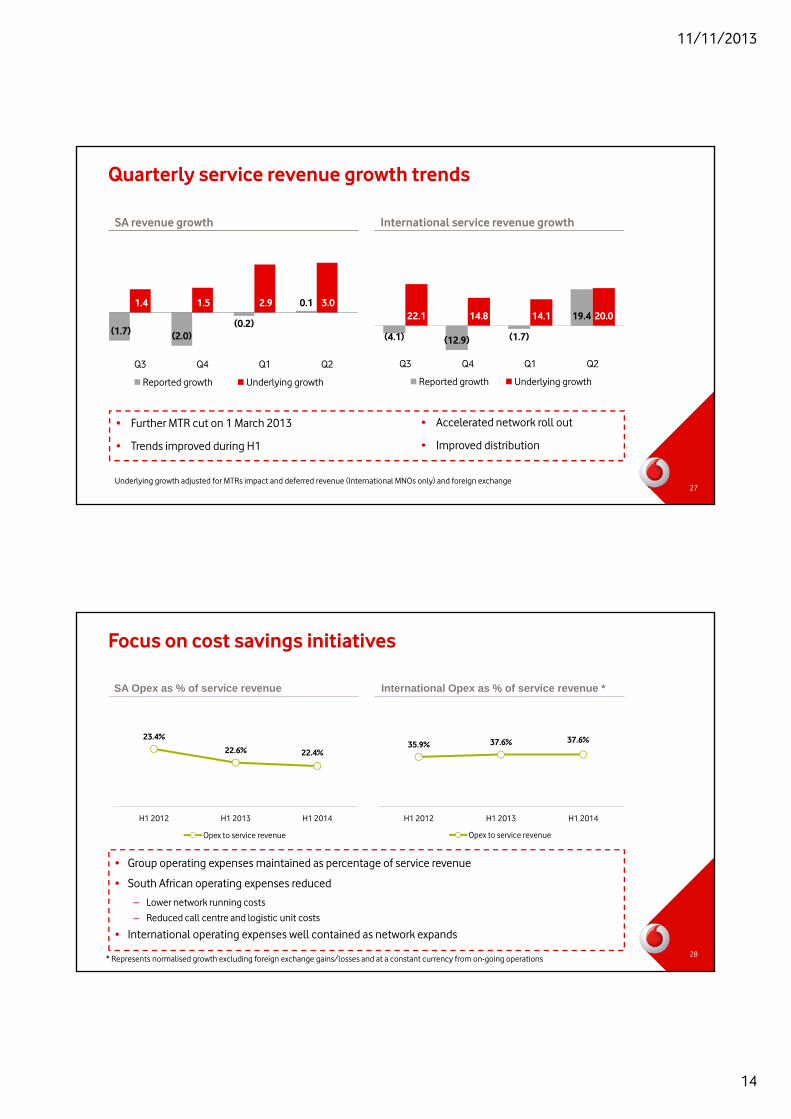
Quarterly service revenue growth trends
27
International service revenue growthSA revenue growth
(1.7) (2.0)(0.2)
0.11.4 1.5 2.9 3.0
Q3 Q4 Q1 Q2
Reported growth Underlying growth
(4.1) (12.9) (1.7)
19.422.1 14.8 14.1 20.0
Q3 Q4 Q1 Q2
Reported growth Underlying growth
Underlying growth adjusted for MTRs impact and deferred revenue (International MNOs only) and foreign exchange
• Further MTR cut on 1 March 2013
• Trends improved during H1
• Accelerated network roll out
• Improved distribution
Focus on cost savings initiatives
28
• Group operating expenses maintained as percentage of service revenue
• South African operating expenses reduced
– Lower network running costs
– Reduced call centre and logistic unit costs
• International operating expenses well contained as network expands
35.9% 37.6% 37.6%
H1 2012 H1 2013 H1 2014
Opex to service revenue
23.4%
22.6% 22.4%
H1 2012 H1 2013 H1 2014
Opex to service revenue
SA Opex as % of service revenue International Opex as % of service revenue *
* Represents normalised growth excluding foreign exchange gains/losses and at a constant currency from on-going operations
11/11/2013
15
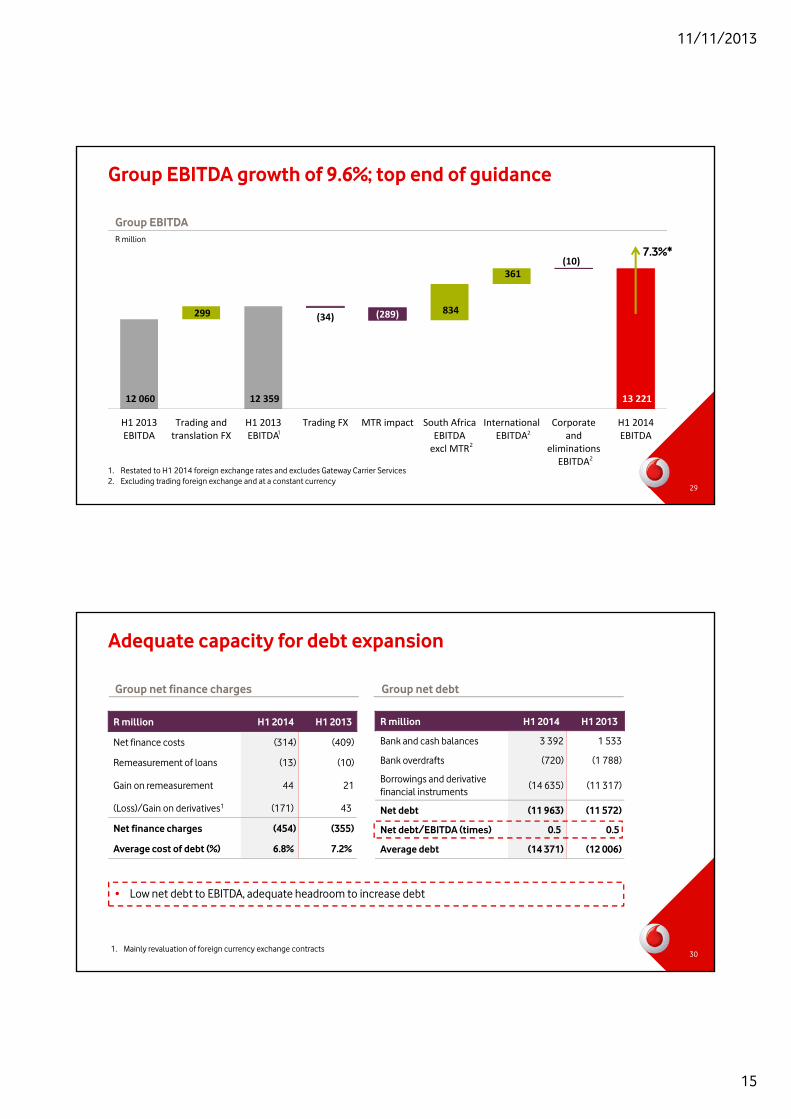
Group EBITDA
12 060 12 359 13 221
299 834
361
(34) (289)
(10)
H1 2013EBITDA
Trading andtranslation FX
H1 2013EBITDA
Trading FX MTR impact South AfricaEBITDAexcl MTR
InternationalEBITDA
Corporateand
eliminationsEBITDA
H1 2014EBITDA
R million
1. Restated to H1 2014 foreign exchange rates and excludes Gateway Carrier Services2. Excluding trading foreign exchange and at a constant currency
1 2
2
2
7.3%*
Group EBITDA growth of 9.6%; top end of guidance
29
R million H1 2014 H1 2013
Net finance costs (314) (409)
Remeasurement of loans (13) (10)
Gain on remeasurement 44 21
(Loss)/Gain on derivatives1 (171) 43
Net finance charges (454) (355)
Average cost of debt (%) 6.8% 7.2%
Group net finance charges Group net debt
R million H1 2014 H1 2013
Bank and cash balances 3 392 1 533
Bank overdrafts (720) (1 788)
Borrowings and derivative financial instruments
(14 635) (11 317)
Net debt (11 963) (11 572)
Net debt/EBITDA (times) 0.5 0.5
Average debt (14 371) (12 006)
1. Mainly revaluation of foreign currency exchange contracts
Adequate capacity for debt expansion
30
• Low net debt to EBITDA, adequate headroom to increase debt
11/11/2013
16
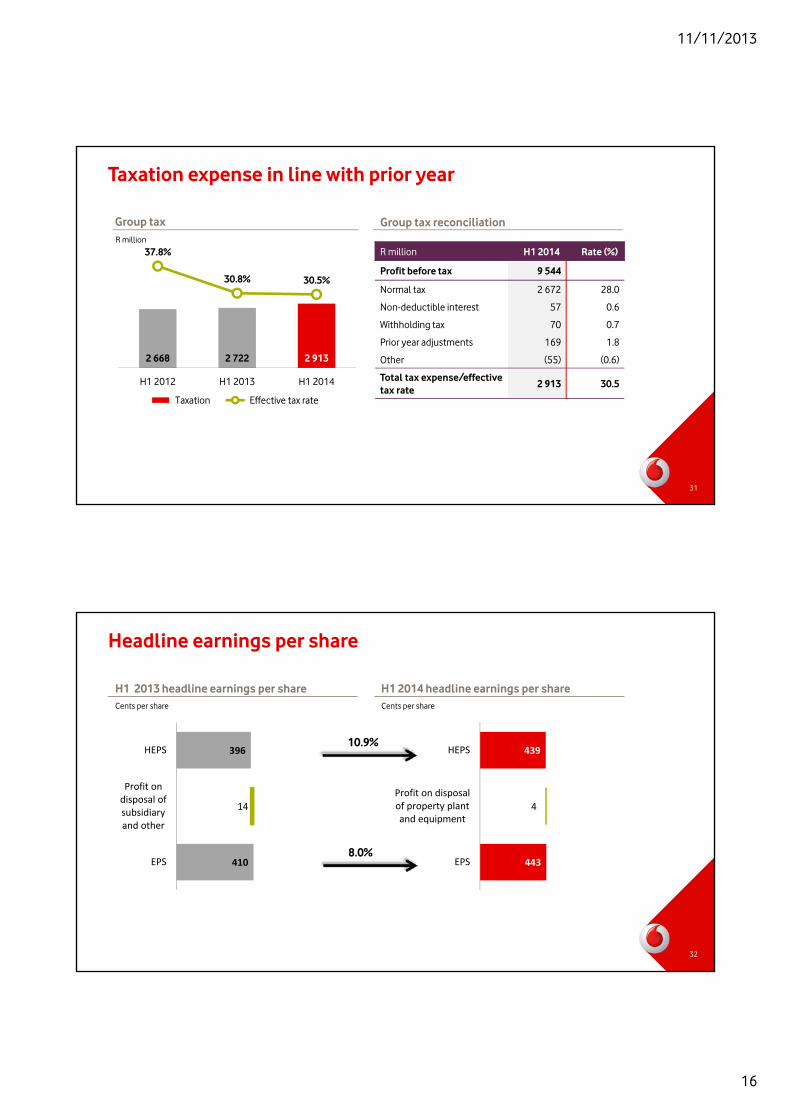
Group tax
2 668 2 722 2 913
37.8%
30.8% 30.5%
H1 2012 H1 2013 H1 2014
Taxation Effective tax rate
R million
R million H1 2014 Rate (%)
Profit before tax 9 544
Normal tax 2 672 28.0
Non-deductible interest 57 0.6
Withholding tax 70 0.7
Prior year adjustments 169 1.8
Other (55) (0.6)
Total tax expense/effective tax rate
2 913 30.5
Group tax reconciliation
Taxation expense in line with prior year
31
396
410
14
HEPS
Profit ondisposal ofsubsidiaryand other
EPS
H1 2013 headline earnings per share
439
443
4
HEPS
Profit on disposalof property plantand equipment
EPS
Cents per share
H1 2014 headline earnings per shareCents per share
10.9%
8.0%
Headline earnings per share
32
11/11/2013
17
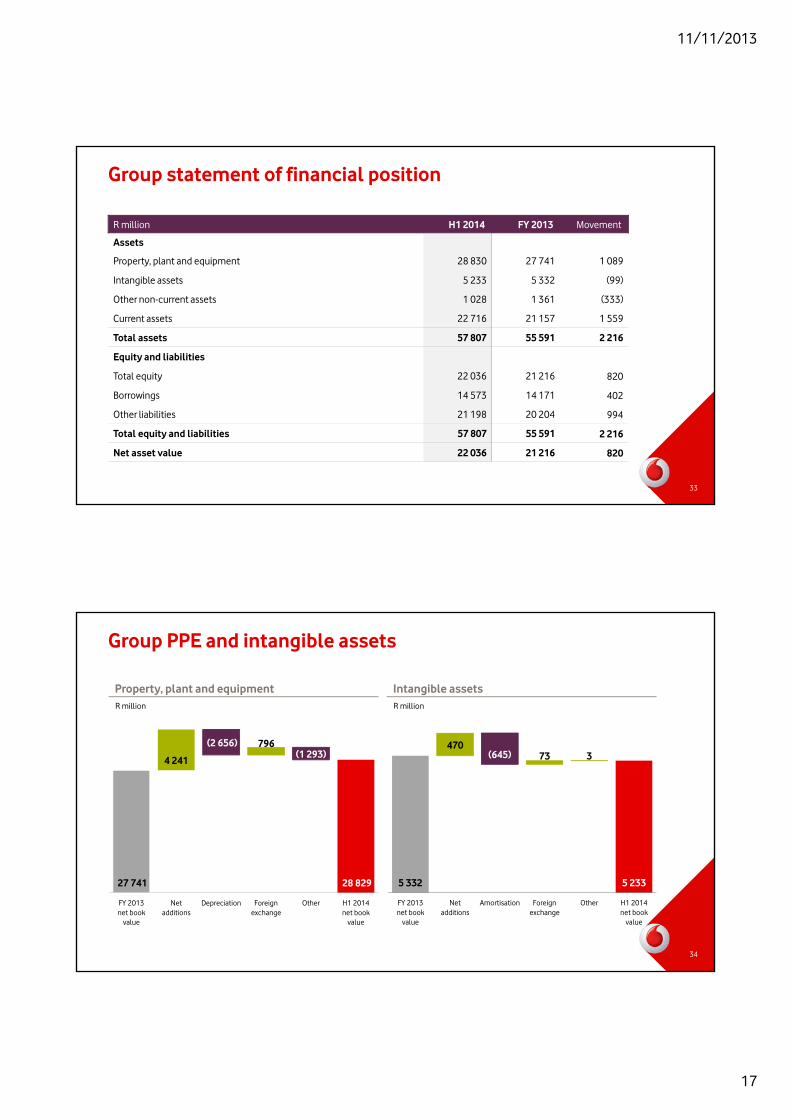
R million H1 2014 FY 2013 Movement
Assets
Property, plant and equipment 28 830 27 741 1 089
Intangible assets 5 233 5 332 (99)
Other non-current assets 1 028 1 361 (333)
Current assets 22 716 21 157 1 559
Total assets 57 807 55 591 2 216
Equity and liabilities
Total equity 22 036 21 216 820
Borrowings 14 573 14 171 402
Other liabilities 21 198 20 204 994
Total equity and liabilities 57 807 55 591 2 216
Net asset value 22 036 21 216 820
Group statement of financial position
33
27 741 28 829
4 241
796(2 656) (1 293)
FY 2013net book
value
Netadditions
Depreciation Foreignexchange
Other H1 2014net book
value
5 332 5 233
47073 3(645)
FY 2013net book
value
Netadditions
Amortisation Foreignexchange
Other H1 2014net book
value
Property, plant and equipment Intangible assetsR million R million
Group PPE and intangible assets
34
11/11/2013
18
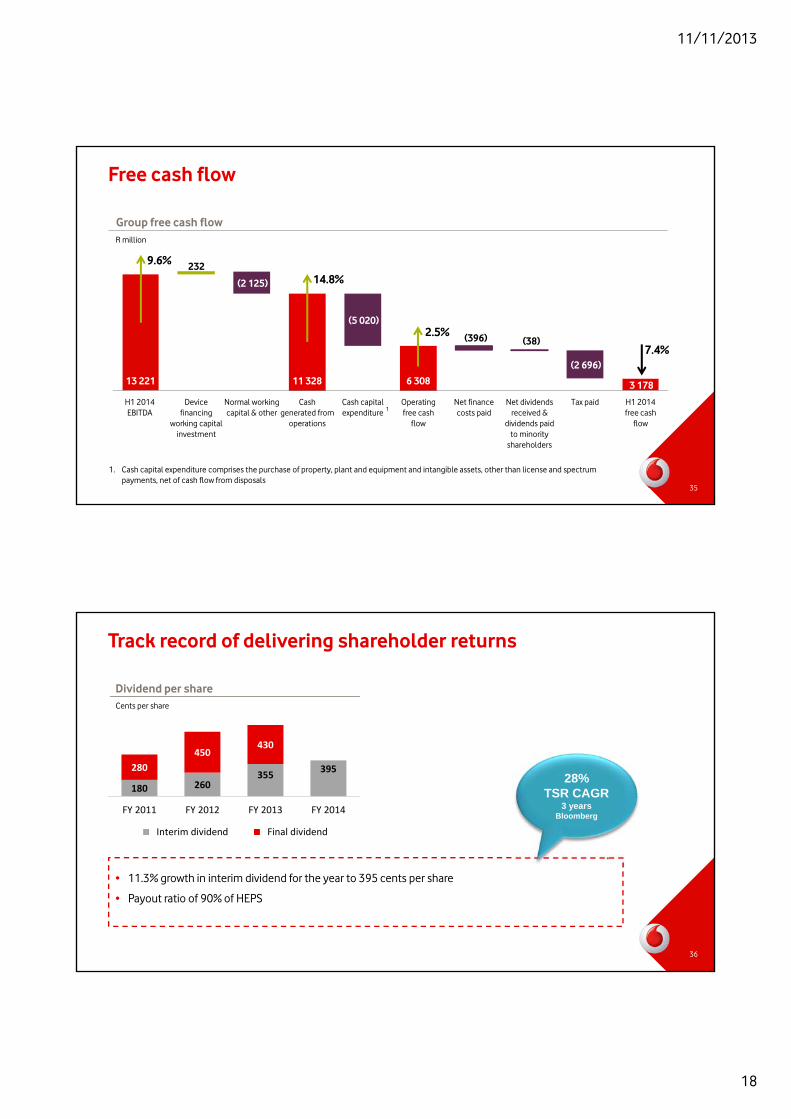
Group free cash flow
13 221 11 328 6 308 3 178
232
(2 125)
(5 020)
(396) (38)
(2 696)
H1 2014EBITDA
Devicefinancing
working capitalinvestment
Normal workingcapital & other
Cashgenerated from
operations
Cash capitalexpenditure
Operatingfree cash
flow
Net financecosts paid
Net dividendsreceived &
dividends paidto minority
shareholders
Tax paid H1 2014free cash
flow
2.5%
14.8%
9.6%
7.4%
R million
1. Cash capital expenditure comprises the purchase of property, plant and equipment and intangible assets, other than license and spectrum payments, net of cash flow from disposals
1
Free cash flow
35
• 11.3% growth in interim dividend for the year to 395 cents per share
• Payout ratio of 90% of HEPS
Dividend per share
180 260355
395280
450430
FY 2011 FY 2012 FY 2013 FY 2014
Interim dividend Final dividend
Cents per share
*
28% TSR CAGR
3 yearsBloomberg
Track record of delivering shareholder returns
36
11/11/2013
19
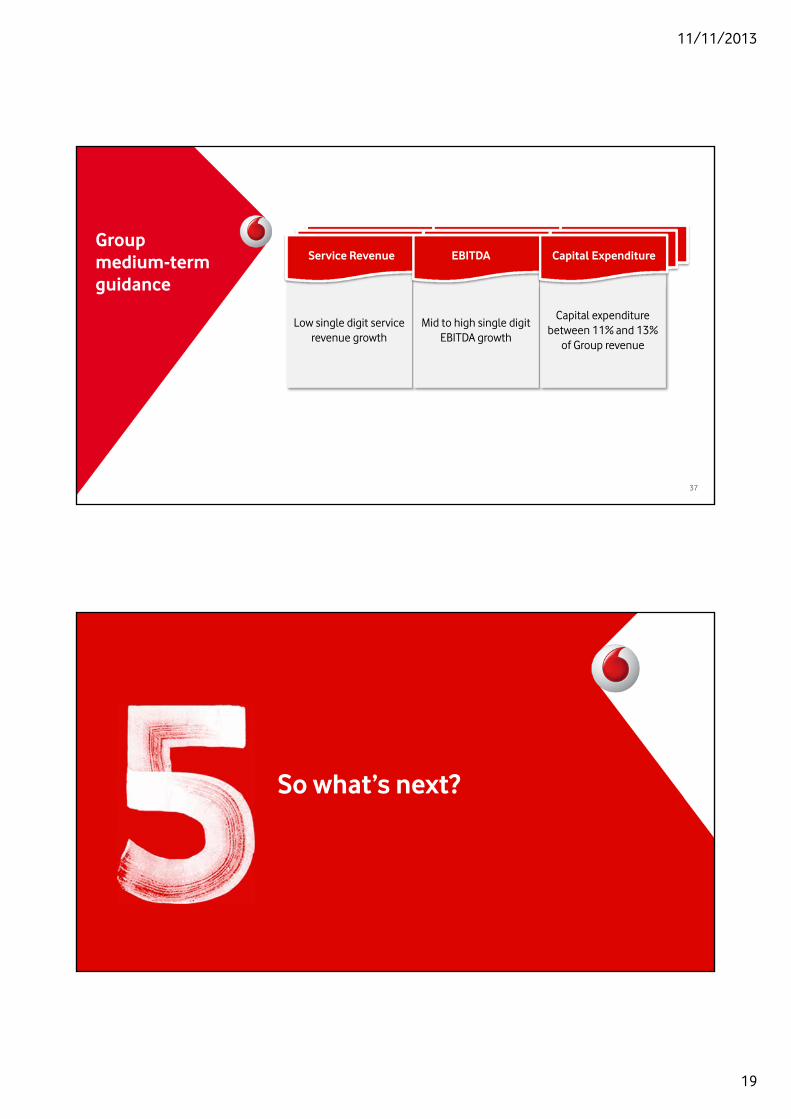
Low single digit service revenue growth
Mid to high single digit EBITDA growth
Capital expenditure between 11% and 13%
of Group revenue
Group medium-term guidance
37
Service Revenue EBITDA Capital Expenditure
So what’s next?

11/11/2013
20
39
Strategic focus areas for the remainder of the year
Customer Growth Operations People Reputation
• Pricing transformation
• Best service in retail and Online
• Best network experience
• NPS leadership
• Increase smartphones
• OneNet expansion for SMMEs
• Accelerate M-Pesadistribution
• Pursue expansion opportunities
• Continued investment in talent programmes
• Deliver on diversity targets
• Acquire talent in new growth areas
• Deliver on targeted school rollout plan
• Connect health providers to mHealthplatform
• Align broadband rollout plans with governments
• Cost programmes to deliver flat opex
• Customer facing system investment
• Invest to save
• Improved returns on commercial spend
CUSTOMER GROWTH OPERATIONS PEOPLE REPUTATION
39
Vodacom2013 - 2014
Vodacom2014 - 2017
LTE
Best data network
New retail concept
Pricing transformation
M-Pesa
Online acceleration
Neotel
OneNet for SME
3G Data where we have voice
Digital services
M2M acceleration
Integration of fixed business
Best network for video
Cloud services
Inorganic growth
FTTx DSL like services
Vodacom2012 - 2013
Single service offeringThe Vodacom of the future
Total communications
40
• Scale• 14 000km fibre network• Radio frequency spectrum• Acceleration of enterprise business• Cost and CAPEX synergies• Commercial growth

11/11/2013
21
Accelerated capital investment initiatives will be led by mobile
41
Backhaul fibre
Urban Centers/CitiesLarge Towns/Small Towns
Townships/Rural areas
LTEDifferentiated high speed data
services
3GBackhaul fibre to support
LTE/3G“3G where we have voice”
Deeper coverage to support densely populated townships
“FTTB – SME”Fibre to business leveraging
backhaul fibre
“FTTH”Fibre to high value households
in gated communities
41
Thank you
11/11/2013
22
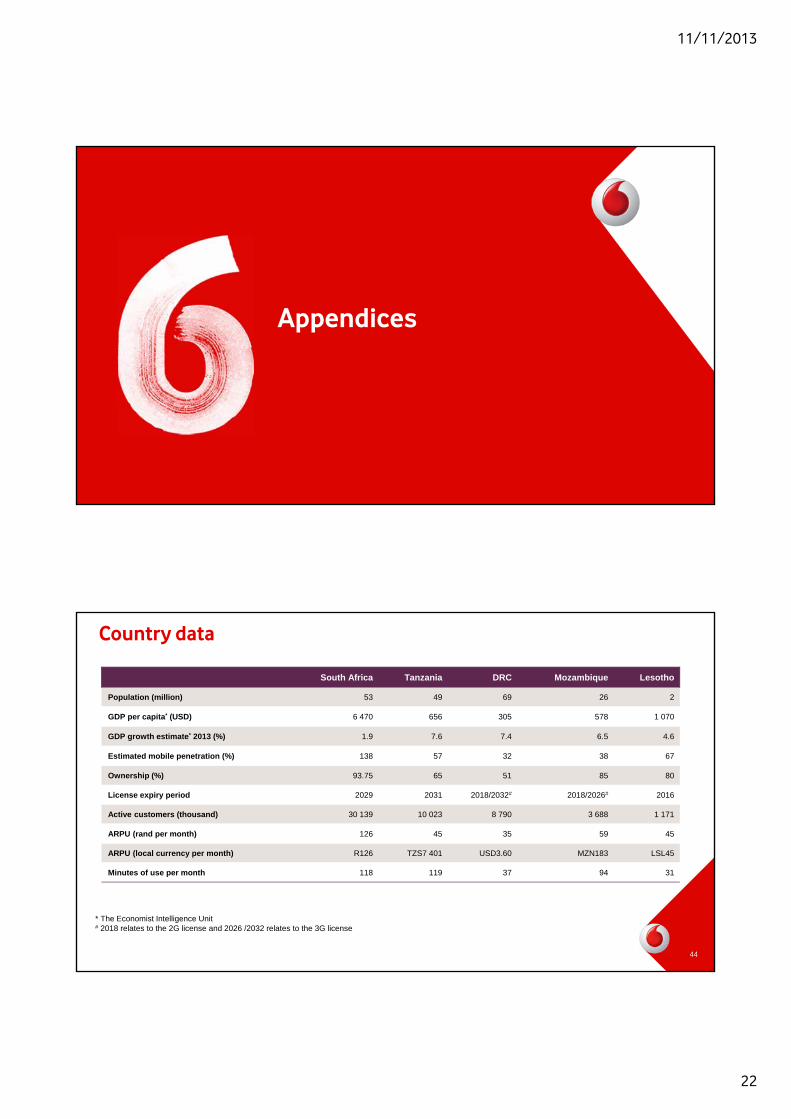
Appendices
Country data
South Africa Tanzania DRC Mozambique Lesotho
Population (million) 53 49 69 26 2
GDP per capita* (USD) 6 470 656 305 578 1 070
GDP growth estimate* 2013 (%) 1.9 7.6 7.4 6.5 4.6
Estimated mobile penetration (%) 138 57 32 38 67
Ownership (%) 93.75 65 51 85 80
License expiry period 2029 2031 2018/2032# 2018/2026# 2016
Active customers (thousand) 30 139 10 023 8 790 3 688 1 171
ARPU (rand per month) 126 45 35 59 45
ARPU (local currency per month) R126 TZS7 401 USD3.60 MZN183 LSL45
Minutes of use per month 118 119 37 94 31
* The Economist Intelligence Unit# 2018 relates to the 2G license and 2026 /2032 relates to the 3G license
44
11/11/2013
23
45
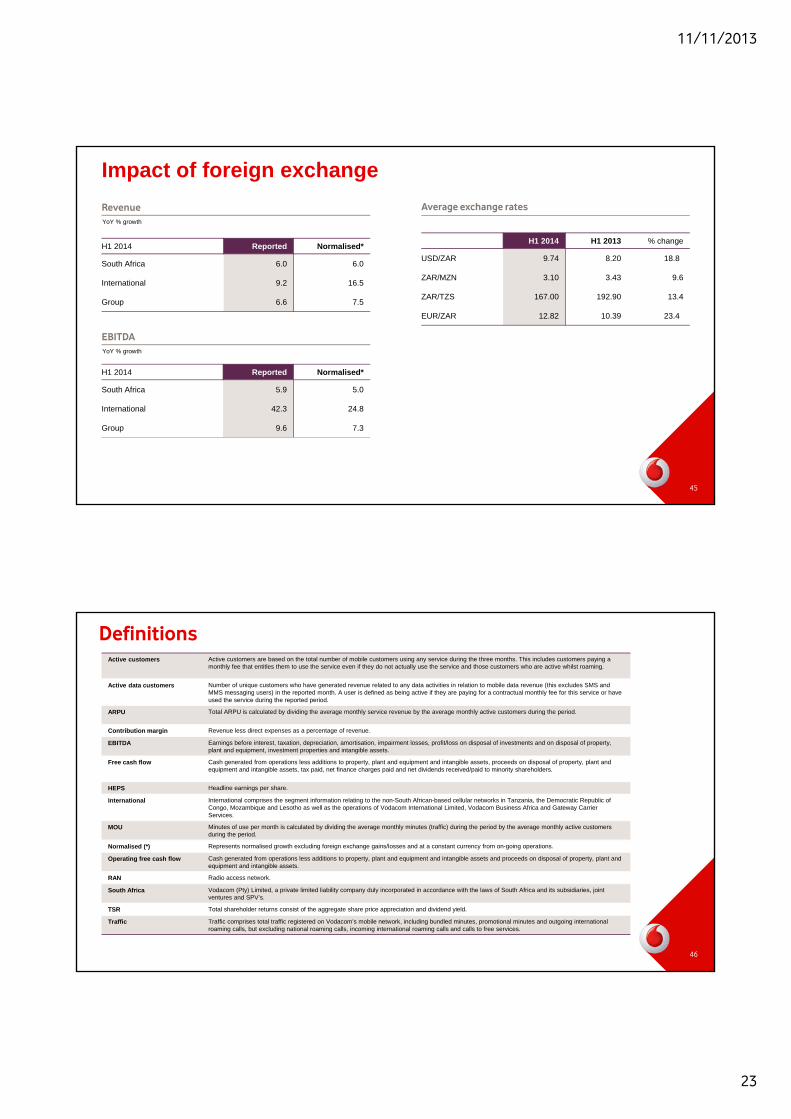
Impact of foreign exchange
H1 2014 Reported Normalised*
South Africa 5.9 5.0
International 42.3 24.8
Group 9.6 7.3
Average exchange rates
H1 2014 H1 2013 % change
USD/ZAR 9.74 8.20 18.8
ZAR/MZN 3.10 3.43 9.6
ZAR/TZS 167.00 192.90 13.4
EUR/ZAR 12.82 10.39 23.4
Revenue
EBITDA
H1 2014 Reported Normalised*
South Africa 6.0 6.0
International 9.2 16.5
Group 6.6 7.5
YoY % growth
YoY % growth
45
Active customers Active customers are based on the total number of mobile customers using any service during the three months. This includes customers paying a monthly fee that entitles them to use the service even if they do not actually use the service and those customers who are active whilst roaming.
Active data customers Number of unique customers who have generated revenue related to any data activities in relation to mobile data revenue (this excludes SMS and MMS messaging users) in the reported month. A user is defined as being active if they are paying for a contractual monthly fee for this service or have used the service during the reported period.
ARPU Total ARPU is calculated by dividing the average monthly service revenue by the average monthly active customers during the period.
Contribution margin Revenue less direct expenses as a percentage of revenue.
EBITDA Earnings before interest, taxation, depreciation, amortisation, impairment losses, profit/loss on disposal of investments and on disposal of property, plant and equipment, investment properties and intangible assets.
Free cash flow Cash generated from operations less additions to property, plant and equipment and intangible assets, proceeds on disposal of property, plant and equipment and intangible assets, tax paid, net finance charges paid and net dividends received/paid to minority shareholders.
HEPS Headline earnings per share.
International International comprises the segment information relating to the non-South African-based cellular networks in Tanzania, the Democratic Republic of Congo, Mozambique and Lesotho as well as the operations of Vodacom International Limited, Vodacom Business Africa and Gateway Carrier Services.
MOU Minutes of use per month is calculated by dividing the average monthly minutes (traffic) during the period by the average monthly active customers during the period.
Normalised (*) Represents normalised growth excluding foreign exchange gains/losses and at a constant currency from on-going operations.
Operating free cash flow Cash generated from operations less additions to property, plant and equipment and intangible assets and proceeds on disposal of property, plant and equipment and intangible assets.
RAN Radio access network.
South Africa Vodacom (Pty) Limited, a private limited liability company duly incorporated in accordance with the laws of South Africa and its subsidiaries, joint ventures and SPV’s.
TSR Total shareholder returns consist of the aggregate share price appreciation and dividend yield.
Traffic Traffic comprises total traffic registered on Vodacom’s mobile network, including bundled minutes, promotional minutes and outgoing international roaming calls, but excluding national roaming calls, incoming international roaming calls and calls to free services.
Definitions
46

11/11/2013
24
Forward-looking statements
This presentation which sets out the annual results for Vodacom Group Limited for the year ended 31 March 2013 contains 'forward-looking statements‘, which have not been reviewed or reported on by the Group’s auditors, with respect to the Group’s financial condition, results of operations and businesses and certain of the Group’s plans and objectives. In particular, such forward-looking statements include statements relating to: the Group’s future performance; future capital expenditures, acquisitions, divestitures, expenses, revenues, financial conditions, dividend policy, and future prospects; business and management strategies relating to the expansion and growth of the Group; the effects of regulation of the Group’s businesses by governments in the countries in which it operates; the Group’s expectations as to the launch and roll out dates for products, services or technologies; expectations regarding the operating environment and market conditions; growth in customers and usage; and the rate of dividend growth by the Group.
Forward-looking statements are sometimes, but not always, identified by their use of a date in the future or such words as 'will', 'anticipates', 'aims', 'could', 'may', 'should', 'expects', 'believes', 'intends', 'plans' or 'targets'. By their nature, forward-looking statements are inherently predictive, speculative and involve risk and uncertainty because they relate to events and depend on circumstances that will occur in the future, involve known and unknown risks, uncertainties and other facts or factors which may cause the actual results, performance or achievements of the Group, or its industry to be materially different from any results, performance or achievement expressed or implied by such forward-looking statements. Forward-looking statements are not guarantees of future performance and are based on assumptions regarding the Group’s present and future business strategies and the environments in which it operates now and in the future.
47
@vodacom
facebook.com/vodacom
www.vodacom.com
+27 11 653 5055
48
Interim results for the six months ended 30 September 2013