Interim Results 2014 - Petrofac - a leading international … · Important notice • This document...
23
Interim Results 2014 26 August 2014
Transcript of Interim Results 2014 - Petrofac - a leading international … · Important notice • This document...

Interim Results 201426 August 2014

Important notice
• This document has been prepared by Petrofac Limited (the Company) solely for use at presentations held in connection with its Interim Results on 26 August 2014. The information in this document has not been independently verified and no representation or warranty, express or implied, is made as to, and no reliance should be placed on, the fairness, accuracy, completeness or correctness of the information or opinions contained herein. None of the Company, directors, employees or any of its affiliates, advisors or representatives shall have any liability whatsoever (in negligence or otherwise) for any loss whatsoever arising from any use of this document, or its contents, or otherwise arising in connection with this document
• This document does not constitute or form part of any offer or invitation to sell, or any solicitation of any offer to purchase any shares in the Company, nor shall it or any part of it or the fact of its distribution form the basis of, or be relied on in connection with, any contract or commitment or investment decisions relating thereto, nor does it constitute a recommendation regarding the shares of the Company
• Certain statements in this presentation are forward-looking statements. Words such as "expect", "believe", "plan", "will", "could", "may", "project" and similar expressions are intended to identify such forward-looking statements, but are not the exclusive means of identifying such statements. By their nature, forward-looking statements involve a number of risks, uncertainties or assumptions that could cause actual results or events to differ materially from those expressed or implied by the forward looking statements. These risks, uncertainties or assumptions could adversely affect the outcome and financial effects of the plans and events described herein. Statements contained in this presentation regarding past trends or activities should not be taken as representation that such trends or activities will continue in the future. You should not place undue reliance on forward-looking statements, which only speak as of the date of this presentation
• The Company is under no obligation to update or keep current the information contained in this presentation, including any forward looking statements, or to correct any inaccuracies which may become apparent and any opinions expressed in it are subject to change without notice
2

2010 2011 2012 2013 1H2013
1H2014
433
540
632 650
243
136
Note: all figures presented above are for the Group’s continuing operations and are for financial years ended 31 December and interim periods ended 30 June (US$ millions unless otherwise stated)
Headlines
Revenue Net profit
• 2014 revenue and net profit significantly weighted towards 2H 2014, reflecting the phasing of project delivery
• Remain on track to deliver net profit in the range US$580 million to US$600 million for the full year 2014, in line with previous guidance
• Most successful year for new awards, with ECOM order intake of US$7.2 billion in 1H 2014, bid at margins consistent with our medium-term guidance; backlog up 35% to stand at record levels of US$20.3 billion at 30 June 2014
• Interim dividend maintained at 22.00 cents per share
Backlog (US$ billion)
3
2010 2011 2012 2013 1H2013
1H2014
4,354
5,8016,240 6,329
2,794 2,535
2010 2011 2012 2013 1H2014
11.7 10.8 11.8
15.0
20.3
↓ 9% ↓ 44% ↑35%

Ons
hore
Eng
inee
ring
&
Con
stru
ctio
nEn
gine
erin
g &
C
onsu
lting
Ser
vice
sMost successful year for new awards; ECOM order intake for 1H 2014 of US$7.2bn (1H 2013: US$4.3bn)
4
ECOM – Key contract awards
• Clean Fuels Project, Kuwait US$1.7bn EPC contract to develop the Mina Abdulla refinery in Kuwait
• Khazzan central processing facility, Oman US$1.2bn for the central processing facility (CPF) for the Khazzan gas project
• Reggane Project, Algeria US$1.0bn contract for the gas gathering, treatment and export facilities of the Reggane North development project
• EnQuest operations and maintenance contract, UK North Sea ten-year operations and maintenance contract providing services on the Thistle, Heather and Northern Producer assets and the EnQuest FPSO
• BorWin 3, German North Sea our largest EPCI project to date
• Thamama front end engineering design (FEED), Abu Dhabi US$21 million contract to look at enhancing the field for its future development and expansion
• Rabab Harweel Integrated Project (RHIP), Oman ECS’ largest engineering and procurement contract to date, with total revenues expected to be more than US$1bn
Offs
hore
Pro
ject
s &
Ope
ratio
ns

ECOM – Update on major projects
• In Salah, Algeria completed full remobilisation on the In Salah southern fields development
• Upper Zakum, Abu Dhabi agreed capacity enhancements and continue to make good progress on the project
• SARB3, Abu Dhabi significant increase in the of level activity as the project ramps up further
• Laggan-Tormore, Shetland progress continues with around 90% of the project now complete
• Petrofac JSD6000 construction going to plan and early pipeline of bidding opportunities established
ECO
M
5
Laggan‐Tormore, Shetland
Upper Zakum, Abu Dhabi

Equi
ty U
pstr
eam
In
vest
men
ts
• Block PM304 start-up of FPSO in progress for Cendor phase 2 production; original Cendor MOPU currently being decommissioned
• FPF1 good progress implementing changes to expedite completion of remaining works on FPF1; sailaway scheduled for spring 2015 and first production on Greater Stella Area in mid-2015
Ris
k Se
rvic
e C
ontr
acts • Berantai performing in line with expectations and we continue to work towards a
second phase
• Etinde Permit reached a mutually acceptable agreement with Bowleven to terminate our Strategic Alliance Agreement
• OML119 commenced early activities as we continue to work towards agreeing and finalising the Field Development Plan
Prod
uctio
n En
hanc
emen
tCon
trac
ts • Magallanes and Santuario continue to make good progress including early appraisal success on Santuario
• Pánuco and Arenque drilled new wells on both fields as we progress towards establishing Field Development Plans
• Ticleni in process of agreeing a revised Field Development Plan for the Ticlenifield in Romania
IES – Update on major projects
6

IES – PetroFirst Infrastructure Partners
• Petrofac and First Reserve have created PetroFirst Infrastructure Partners to deploy capital– to purchase a number of existing assets from IES– to invest in new energy infrastructure projects that utilise Petrofac’s development capability
• Agreement opens up future opportunities to create value for our customers that require access to capital alongside Petrofac's proven execution capability
• Effective 13 August 2014, we sold 80% of the share capital of Petrofac FPSO Holding Limited, to PetroFirst Infrastructure Holdings Limited, wholly owned by the First Reserve Energy Infrastructure Fund
• From 2015, IES’ trading results are likely to be approximately US$50 million lower per annum than they otherwise would have been over the next few years, reflecting the floating production facility profits foregone
7
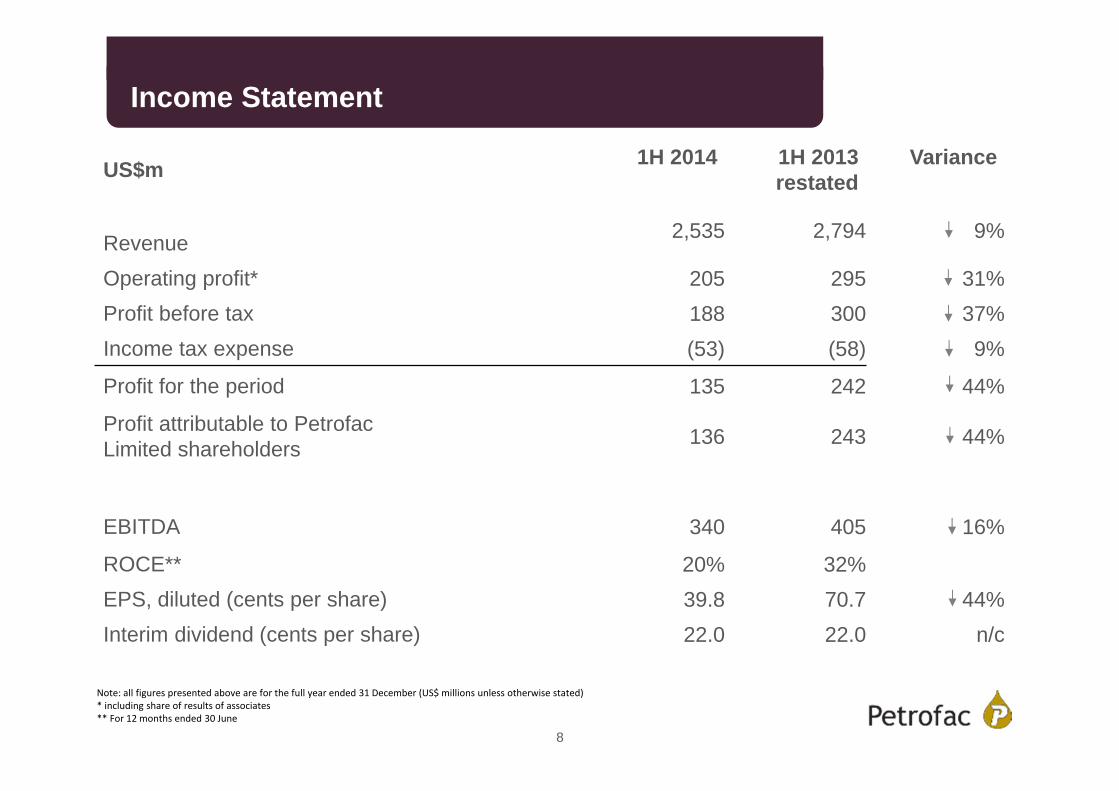
Income Statement
US$m 1H 2014 1H 2013 restated
Variance
Revenue 2,535 2,794 9%
Operating profit* 205 295 31%Profit before tax 188 300 37%Income tax expense (53) (58) 9%
Profit for the period 135 242 44%
Profit attributable to Petrofac Limited shareholders 136 243 44%
EBITDA 340 405 16%
ROCE** 20% 32%EPS, diluted (cents per share) 39.8 70.7 44%Interim dividend (cents per share) 22.0 22.0 n/c
Note: all figures presented above are for the full year ended 31 December (US$ millions unless otherwise stated)* including share of results of associates** For 12 months ended 30 June
8
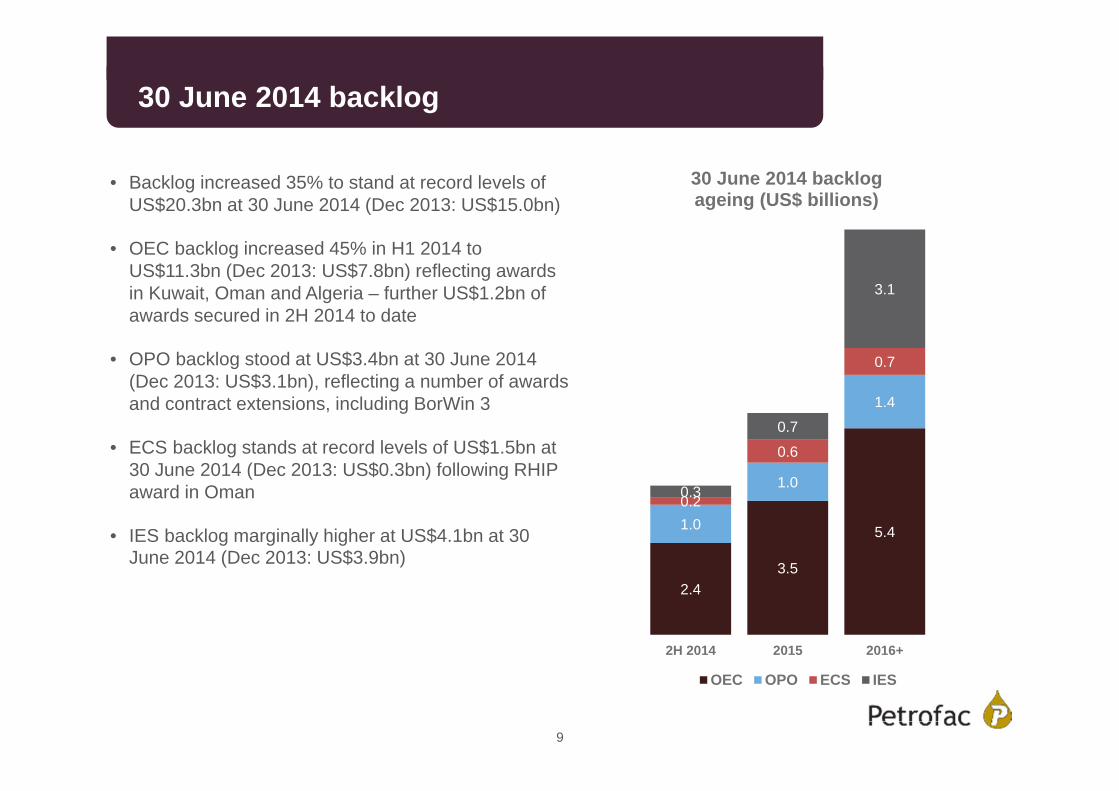
• Backlog increased 35% to stand at record levels of US$20.3bn at 30 June 2014 (Dec 2013: US$15.0bn)
• OEC backlog increased 45% in H1 2014 to US$11.3bn (Dec 2013: US$7.8bn) reflecting awards in Kuwait, Oman and Algeria – further US$1.2bn of awards secured in 2H 2014 to date
• OPO backlog stood at US$3.4bn at 30 June 2014 (Dec 2013: US$3.1bn), reflecting a number of awards and contract extensions, including BorWin 3
• ECS backlog stands at record levels of US$1.5bn at 30 June 2014 (Dec 2013: US$0.3bn) following RHIP award in Oman
• IES backlog marginally higher at US$4.1bn at 30 June 2014 (Dec 2013: US$3.9bn)
30 June 2014 backlog
9
2.43.5
5.41.0
1.0
1.4
0.2
0.6
0.7
0.3
0.7
3.1
2H 2014 2015 2016+
30 June 2014 backlog ageing (US$ billions)
OEC OPO ECS IES

Movement in net debt
Net debt stood at US$1.3bn at 30 June 2014 reflecting:
• working capital outflows of US$229m predominantly due to an increase in trade receivables and WIP and a reduction in accrued contract expenses
• investing activities, including on IES projects of US$352m and on the Petrofac JSD6000 of US$44m
• financing activities, including payment of the 2013 final dividend of US$150m
Includes advances received from customers of US$444m
Includes advances received from customers of US$540m
10* Includes amounts in assets held for sale

• Revenue 39% – reflecting the phasing of project delivery due to several large projects substantially completed in 2013 and low activity levels on recent awards while the projects are in their early stages
• Net profit 35% – reflecting the phasing of activity; net margin higher at 10.8%
Onshore Engineering & Construction
EBITDA (US$m) Net profit (US$m)Revenue (US$m)585 575
539
224
144
13.9% 14.6%14.1% 13.4%15.3%
2011 2012 2013 1H13 1H14
456 471433
164
107
10.2% 10.8%11.0% 11.0%12.3%
2011 2012 2013 1H13 1H14
4,146 4,288
3,534
1,610
988
2011 2012 2013 1H13 1H14
11
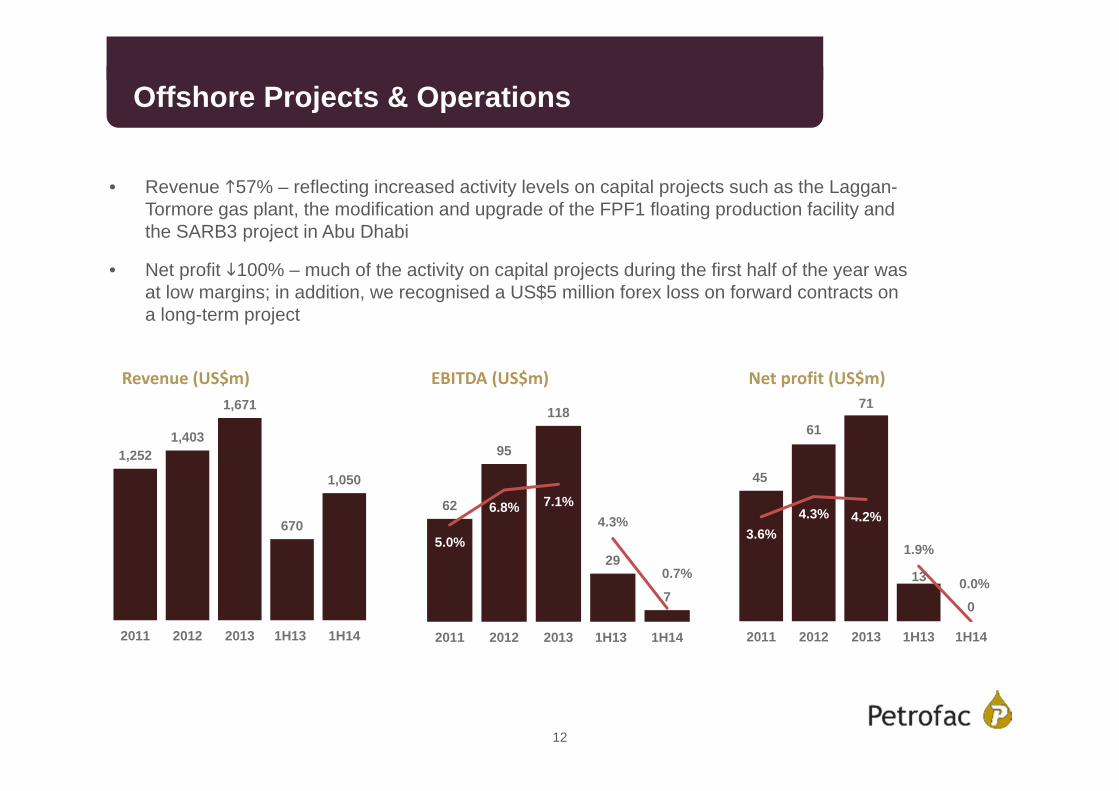
• Revenue 57% – reflecting increased activity levels on capital projects such as the Laggan-Tormore gas plant, the modification and upgrade of the FPF1 floating production facility and the SARB3 project in Abu Dhabi
• Net profit 100% – much of the activity on capital projects during the first half of the year was at low margins; in addition, we recognised a US$5 million forex loss on forward contracts on a long-term project
Offshore Projects & Operations
↑5%↑5%
1,2521,403
1,671
670
1,050
2011 2012 2013 1H13 1H14
62
95
118
29
7
4.3%
0.7%
5.0%
6.8% 7.1%
2011 2012 2013 1H13 1H14
45
61
71
13
1.9%
0.0%
3.6%4.3% 4.2%
2011 2012 2013 1H13 1H14
0
12
EBITDA (US$m) Net profit (US$m)Revenue (US$m)

• Revenues 19% – reflecting activity on a number of recent project awards and the In Salah Gas and In Amenas consultancy contract, awarded in January 2013
• Net profit 33% – as there was a lower contribution from our joint venture with China Petroleum Engineering & Construction Corporation
Engineering & Consulting Services
↑5%
208245
362
180214
2011 2012 2013 1H13 1H14
4036
38
9
5.0%2.8%
19.2%
14.7%
10.5%
2011 2012 2013 1H13 1H14
6
3128
32
64
3.3%1.9%
14.9%
11.4%8.8%
2011 2012 2013 1H13 1H14
13
EBITDA (US$m) Net profit (US$m)Revenue (US$m)

• Revenue 11% - commencement of operations on West Desaru in 2H 2013, increased activity levels on Mexico PECs and for Petrofac Training more than offset reduction in Berantai RSC which has moved into operations phase
• Net profit 20% – reflecting the above, albeit partially offset by recognition of Group’s share of losses in Seven Energy of US$10 million for the period to 15 April 2014
Integrated Energy Services
↑5%
519
708
934
419467
2011 2012 2013 1H13 1H14
89
196
315
116
18227.7%
39.0%
17.1%
27.7%33.7%
2011 2012 2013 1H13 1H14
25
92
126
4655
11.0% 11.8%
4.8%
13.0% 13.5%
2011 2012 2013 1H13 1H14
14
EBITDA (US$m) Net profit (US$m)Revenue (US$m)

Outlook
• In ECOM, we have already had our most successful year ever for new awards with US$8.4bn of order intake in the year to date, record backlog and very good revenue visibility for the second half of the year and beyond
• Our pipeline of ECOM bidding opportunities remains attractive and, given our strong competitive position in our core markets, we are confident of securing further awards and contract extensions during H2 2014
• Our disciplined approach to business development, with bid margins, on a country-by-country basis, in line with the last few years, and our relentless focus on project execution give us confidence that we will maintain sector-leading net margins in Onshore Engineering & Construction
• In IES, we are making good progress on addressing project performance issues and the delivery of key operational milestones
• We continue to see good demand for the provision of integrated services and are prioritising those opportunities which make the best use of our existing core areas of strength, offer clear synergies with ECOM, and deliver attractive returns on capital employed
• We remain on track to deliver net profit in the range US$580 million to US$600 million for the full year 2014, in line with previous guidance
15

Appendices

Appendix 1: Group organisation structure
Integrated Energy Services
Engineering & Consulting
Services (ECS)
Offshore Projects & Operations (OPO)
Onshore Engineering
& Construction
(OEC)Rep
ortin
g se
gmen
tsD
ivis
ions Engineering, Construction, Operations &
Maintenance (ECOM)Chief Executive, Marwan Chedid
Integrated Energy Services (IES)Chief Operating Officer,
Rob Jewkes
Production Solutions DevelopmentsTraining
Services
Engineering & Consulting
Services
Offshore Projects & Operations
Onshore Engineering & ConstructionSe
rvic
e lin
es Offshore Capital
Projects
17

Appendix 2: Key ECOM projectsOriginal contract value to PetrofacNOC/NOC led company/consortium Joint NOC/IOC company/consortium IOC/IOC led company/consortium
2012 2013 2014 2015
>US$800mLaggan-Tormore gas processing plant, UKCS
>US$600mGas sweetening facilities project, Qatar
US$330mBadra field, Iraq
US$1,200mIn Salah southern fields development, Algeria
US$3,400mGalkynysh gas field development, Turkmenistan
UndisclosedPetro Rabigh, Saudi Arabia
US$1,400mJazan oil refinery, Saudi Arabia
2016
Sarb 3, Abu Dhabi US$500m
US$450mAlrar, Algeria
US$1,050mSohar refinery improvement project, Oman
Upper Zakum field development, Abu Dhabi US$2,900m
Bab Compression and Bab Habshan, Abu Dhabi US$700m
Clean Fuels Project, Kuwait US$1,700m
US$1,200mKhazzan central processing facility, Oman
18
US$970mReggane North Development Project, Algeria
US$700mGathering Centre 29, Kuwait
>US$500mRAPID project, Malaysia
BorWin 3, German North Sea Undisclosed

Appendix 3: Key IES projects
Production Enhancement Contracts (PEC)
Ticleni, Romania
Magallanes and Santuario, Mexico
Risk Service Contracts (RSC)Berantai development, Malaysia
Equity Upstream Investments
Block PM304, Malaysia
Chergui gas plant, Tunisia
Greater Stella Area, UK
2011 2012 2013 2014
2025 (+10 YR EXTENSION OPTION)
2037
END DATE
2020
2026
2031
Life of field
2015
Pánuco, Mexico* 2043
Arenque, Mexico 2043
* In joint venture with Schlumberger
OML119, Nigeria 2033
TRANSITION PERIOD
TRANSITION PERIOD
TRANSITION PERIOD
TRANSITION PERIOD
19

Appendix 4: Effective tax rate
Effective tax rate (ETR) by segment 1H 2014 1H 2013
Onshore Engineering & Construction 13% 14%
Offshore Projects & Operations 100% 35%
Engineering & Consulting Services 0% 16%
Integrated Energy Services 39% 31%
Group 28% 19%
• The effective tax rate for the period was 28%, reflecting an increased proportion of total income being generated in higher tax jurisdictions and a greater proportion of the Group’s profits coming from Integrated Energy Services, which has a higher effective tax rate
20

36%
39%
8%
17%
1H 2014 revenue
OEC OPO ECS IES
Appendix 5: Segmental performance
• Onshore Engineering & Construction earned 36% of Group revenue and 65% of net profit
• Middle East and Africa: due to geographic diversification, represents only 46% of revenues in 1H 2014
• CIS and Asia: primarily relates to activity on Berantai and PM304 in Malaysia
• Europe: activity principally in UK North Sea, where significant proportion of Offshore Projects & Operations revenues are generated, the Shetland Islands and Romania
• Americas predominantly relates to our production enhancement contracts in Mexico
21
65%2%
33%
1H 2014 net profit
OEC ECS IES
46%
12%
34%
7%1%
1H 2014 revenue
Middle East & Africa CIS & AsiaEurope AmericasOther

5,200
5,800
4,300
3,400100
Total headcount
OEC OPO ECS IES Corporate
Appendix 6: Employees
• Approximately 18,800 people in 7 key operating centres and 24 offices
• Around 30% of our employees are shareholders/participants in employee share schemes
Operating centre Country office
22

Notes
• EBITDA means earnings before interest, tax, depreciation and amortisation and iscalculated as profit from operations before tax and finance costs adjusted to addback charges for depreciation and amortisation
• Net profit (for the Group) means profit for the period from operations attributableto Petrofac Limited shareholders
• Backlog consists of the estimated revenue attributable to the uncompleted portionof lump-sum engineering, procurement and construction contracts and variationorders plus, with regard to engineering, operations, maintenance and IntegratedEnergy Services contracts, the estimated revenue attributable to the lesser of theremaining term of the contract and five years. Backlog will not be booked onIntegrated Energy Services contracts where the Group has entitlement toreserves. The Group uses this key performance indicator as a measure of thevisibility of future revenue. Backlog is not an audited measure
• The Group reports its financial results in US dollars and, accordingly, will declareany dividends in US dollars together with a sterling equivalent. Shareholders whohave not elected to receive dividends in US dollars will receive a sterlingequivalent, based on the exchange rate on the record date. Shareholders havethe opportunity to elect by close of business on the record date to change theirdividend currency election
• Operating profit means profit from operations before tax and financecosts/(income) and our share of results of associates
23