Interim financial report first quarter 2015/media/vestas/investor/investor...Vestas Wind Systems A/S...
28
Vestas Wind Systems A/S Interim financial report First quarter 2015
Transcript of Interim financial report first quarter 2015/media/vestas/investor/investor...Vestas Wind Systems A/S...

Vestas Wind Systems A/S
Interim financial report First quarter 2015

Vestas Wind Systems A/S – company announcement No. 20/2015 Interim financial report – first quarter 2015 Page 2 of 27
Contents
Summary ............................................................................................................................ 3
Highlights for the Group ................................................................................................... 4
Financial performance ...................................................................................................... 6
Market development.......................................................................................................... 9
Strategy and financial and capital structure targets .....................................................10
Social and environmental performance .........................................................................13
Outlook 2015 .....................................................................................................................15
Consolidated financial statements 1 January - 31 March .............................................16
Management’s statement ................................................................................................25
Information meeting (audiocast)
On Wednesday 6 May 2015 at 10 a.m. CEST (9 a.m. BST), Vestas will host an information meeting via an audiocast. The audiocast will be accessible via vestas.com/investor. The meeting will be held in English and questions may be asked through a conference call. The telephone numbers for the conference call are: Europe: +44 208 817 9301 USA: +1 718 354 1226 Denmark: +45 7026 5040
Contact details
Vestas Wind Systems A/S, Denmark Hans Martin Smith, Senior Vice President, Investor Relations Tel: +45 9730 8209 Vestas Wind Systems A/S Hedeager 42 8200 Aarhus N Denmark Company reg. No.: 10 40 37 82 Tel: +45 9730 0000 Fax: +45 9730 0001 [email protected]
Vestas Wind Systems A/S – company announcement No. 20/2015 Interim financial report – first quarter 2015 Page 3 of 27
Summary
Outlook for 2015 improved. Revenue, earnings, and free cash flow increased compared to the first quarter of 2014.
In the first quarter of 2015, Vestas generated revenue of EUR 1,519m – an increase of 18 percent compared to the year-earlier period. EBIT before special items increased by EUR 39m to EUR 79m. The EBIT margin before special items was 5.2 percent and the free cash flow increased by EUR 170m to EUR 146m compared to the first quarter of 2014. The intake of firm and unconditional wind turbine orders amounted to 1,750 MW in the first quarter of 2015. The value of the wind turbine backlog amounted to EUR 7.5bn at 31 March 2015. In addition to the wind turbine order backlog, Vestas had service agreements with contractual future revenue of EUR 7.5bn at the end of March 2015. Thus, the value of the combined backlog
of wind turbine orders and service agreements stood at EUR 15bn – an increase of EUR 1.2bn compared to the year-earlier period. Vestas upgrades the 2015 guidance on revenue from minimum EUR 6.5bn to minimum EUR 7.5bn and EBIT margin guidance before special items is upgraded from minimum 7 percent to minimum 8.5 percent. Total investments are increased from approx EUR 300m to approx EUR 350m and guidance on free cash flow is upgraded from minimum EUR 400m to minimum EUR 600m.
Group President & CEO Anders Runevad said: “This has been a historically strong first quarter on revenue, margins, order intake, and return on invested capital. The first quarter results reaffirm that Vestas is making good progress toward achieving its profitable growth objectives and that we are in a very strong position in an otherwise highly competitive industry.”
Key highlights
Record-high Q1 order intake
Order intake in the quarter 1,750 MW.
Highest combined order backlog ever
Wind turbine and service order backlog of EUR 15bn.
Return on invested capital (ROIC) at highest level ever
ROIC increased to 44 percent (TTM).
Earnings improved – highest Q1 ever
EBIT margin before special items at 5.2 percent – up 2.1 percentage points compared to Q1 2014.
Guidance increased
Guidance for 2015 has been increased based on higher than expected order intake year to date, greater visibility for the
year, and USD exchange rate development.
Vestas Wind Systems A/S – company announcement No. 20/2015 Interim financial report – first quarter 2015 Page 4 of 27
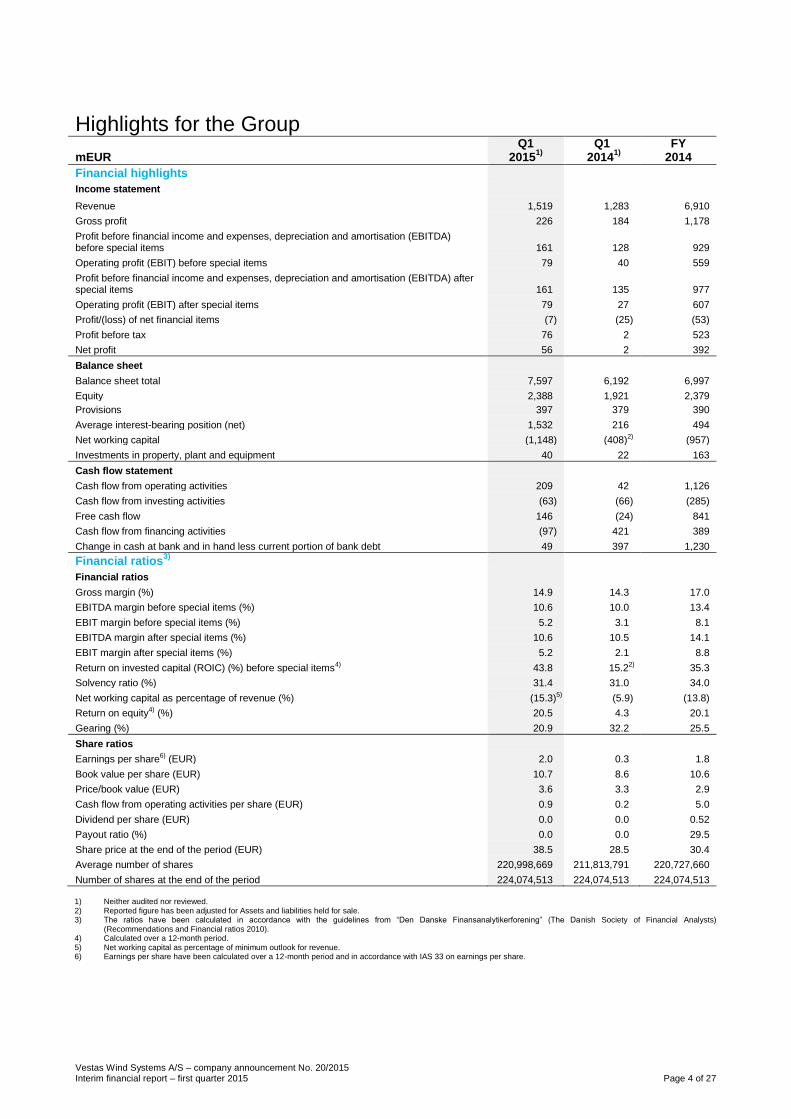
Highlights for the Group mEUR
Q1 2015
1)
Q1 2014
1)
FY 2014
Financial highlights Income statement
Revenue 1,519 1,283 6,910
Gross profit 226 184 1,178
Profit before financial income and expenses, depreciation and amortisation (EBITDA) before special items 161 128 929
Operating profit (EBIT) before special items 79 40 559
Profit before financial income and expenses, depreciation and amortisation (EBITDA) after special items 161 135 977
Operating profit (EBIT) after special items 79 27 607
Profit/(loss) of net financial items (7) (25) (53)
Profit before tax 76 2 523
Net profit 56 2 392
Balance sheet
Balance sheet total 7,597 6,192 6,997
Equity 2,388 1,921 2,379
Provisions 397 379 390
Average interest-bearing position (net) 1,532 216 494
Net working capital (1,148) (408)2) (957)
Investments in property, plant and equipment 40 22 163
Cash flow statement
Cash flow from operating activities 209 42 1,126
Cash flow from investing activities (63) (66) (285)
Free cash flow 146 (24) 841
Cash flow from financing activities (97) 421 389
Change in cash at bank and in hand less current portion of bank debt 49 397 1,230
Financial ratios3)
Financial ratios
Gross margin (%) 14.9 14.3 17.0
EBITDA margin before special items (%) 10.6 10.0 13.4
EBIT margin before special items (%) 5.2 3.1 8.1
EBITDA margin after special items (%) 10.6 10.5 14.1
EBIT margin after special items (%) 5.2 2.1 8.8
Return on invested capital (ROIC) (%) before special items4) 43.8 15.22)… 35.3
Solvency ratio (%) 31.4 31.0 34.0
Net working capital as percentage of revenue (%) (15.3)5).. (5.9) (13.8)
Return on equity4) (%) 20.5 4.3 20.1
Gearing (%) 20.9 32.2 25.5
Share ratios
Earnings per share6) (EUR) 2.0 0.3 1.8
Book value per share (EUR) 10.7 8.6 10.6
Price/book value (EUR) 3.6 3.3 2.9
Cash flow from operating activities per share (EUR) 0.9 0.2 5.0
Dividend per share (EUR) 0.0 0.0 0.52
Payout ratio (%) 0.0 0.0 29.5
Share price at the end of the period (EUR) 38.5 28.5 30.4
Average number of shares 220,998,669 211,813,791 220,727,660
Number of shares at the end of the period 224,074,513 224,074,513 224,074,513
1) Neither audited nor reviewed. 2) Reported figure has been adjusted for Assets and liabilities held for sale. 3) The ratios have been calculated in accordance with the guidelines from “Den Danske Finansanalytikerforening” (The Danish Society of Financial Analysts)
(Recommendations and Financial ratios 2010). 4) Calculated over a 12-month period. 5) Net working capital as percentage of minimum outlook for revenue. 6) Earnings per share have been calculated over a 12-month period and in accordance with IAS 33 on earnings per share.

Vestas Wind Systems A/S – company announcement No. 20/2015 Interim financial report – first quarter 2015 Page 5 of 27
Q1 2015
1)
Q1 2014
1)
FY 2014
Operational key figures Order intake (bnEUR) 1.6 1.0 5.8
Order intake (MW) 1,750 1,188 6,544
Order backlog – wind turbines (bnEUR) 7.5 6.9 6.7
Order backlog – service (bnEUR) 7.5 6.9 7.0
Produced and shipped wind turbines (MW) 1,331 1,124 6,125
Produced and shipped wind turbines (number) 518 463 2,527
Deliveries (MW) 1,271 988 6,252
Social and environmental key figures2)
Occupational health & safety
Total recordable injuries (number)3) 100 79 384
- of which lost time injuries (number) 17 15 53
- of which fatal injuries (number) 0 0 0
Consumption of resources
Consumption of energy (GWh) 145 138 501
- of which renewable energy (GWh) 66 63 278
- of which renewable electricity (GWh) 57 55 255
Consumption of fresh water (1,000 m3) 96 79 366
Waste disposal
Volume of waste (1,000 tonnes) 14 9 51
- of which collected for recycling (1,000 tonnes) 7 5 27
Emissions
Direct emission of CO2 (1,000 tonnes) 16 16 50
Indirect emission of CO2 (1,000 tonnes) 7 8 29
Local community
Environmental accidents (number) 0 0 0
Breaches of internal inspection conditions (number) 0 1 3
Employees4)
Average number of employees 17,942 15,399 16,335
Number of employees at the end of the period 18,162 15,629 17,598
- of which outside Europe and Africa 7,853 5,910 7,441
Social and environmental indicators2)
Occupational health and safety
Incidence of total recordable injuries per one million working hours 11.4 10.5 11.8
Incidence of lost time injuries per one million working hours 1.9 2.0 1.6
Absence due to illness among hourly-paid employees (%) 2.2 2.8 2.3
Absence due to illness among salaried employees (%) 1.4 1.3 1.3
Products
CO2 savings over the lifetime on the MW produced and shipped (million tonnes of CO2) 37 31 173
Utilisation of resources
Renewable energy (%) 46 46 56
Renewable electricity for own activities (%) 100 100 100
Employees
Women in Board of Directors5) and Executive Management (%) 23 23 23
Women at management level (%)6) 18 17 18
Non-Danes at management level (%)6) 55 53 54
1) Neither audited nor reviewed. 2) Accounting policies for social and environmental key figures for the Group, see page 107-109 of the annual report 2014. 3) Total recordable injuries include fatalities, lost time injuries, restricted work injuries and medical treatment injuries. 4) The employee counting practice has changed from 1 January 2015. With the new employee counting practice the Group no longer includes external hourly-paid
employees working for Vestas. Only employees on Vestas’ payroll are counted and reported as Vestas employees. The change has been made to give a direct correlation to staff costs. The Group still keeps track of contractors managed by Vestas to have a measure of the combined workforce and overall safety performance. Comparatives have been changed accordingly.
5) Only Board members elected by the general meeting are included. 6) Employees at management level comprise employees at level IPE54+ according to Mercer’s International Position Evaluation System.

Vestas Wind Systems A/S – company announcement No. 20/2015 Interim financial report – first quarter 2015 Page 6 of 27
Financial performance Order backlog and activities – wind turbines The quarterly order intake was 1,750 MW, of which 76 percent was announced. This is an improvement of 562 MW or 47 percent compared to the first quarter of 2014. The strong order intake came from a total of 20 countries. The order backlog amounted to 8,091 MW at the end of March 2015. This is an improvement of 517 MW compared to the first quarter of 2014. Europe and Africa accounted for 54 percent of the backlog, and Americas and Asia Pacific accounted for 39 and 7 percent, respectively. The value of the order backlog was EUR 7.5bn at the end of March 2015 compared to EUR 6.9bn at the end of March 2014.
In the first quarter of 2015, Vestas produced and shipped wind turbines with an aggregate output of 1,331 MW (518 wind turbines) against 1,124 MW (463 wind turbines) in the first quarter of 2014. Produced and shipped MW
Final capacity delivered (transfer of risk) to the customers amounted to 1,271 MW; an increase of 29 percent compared to the first quarter of 2014, mainly driven by increased deliveries in the USA. Deliveries (TOR*) MW
Overview per region as per Q1 2015 MW
Europe and
Africa Americas
Asia
Pacific Total
Under completion,
1 January 2015 945 446 86 1,477
Delivered (TOR) to
customers during the
period (457) (718) (96) (1,271)
Produced and
shipped during the
period 709 588 34 1,331
Under completion,
31 March 2015 1,197 316 24 1,537
At the end of March 2015, wind turbine projects with a total output of 1,537 MW were under completion as compared to 1,740 MW at the end of March 2014. This is reflected in the level of prepayments and inventories as a large share of these MW has not yet been recognised as revenue. The revenue recognition of these MW will take place when the projects are finally delivered to the customers.
Order backlog and activities – service At the end of March 2015, Vestas had service agreements with contractual future revenue of EUR 7.5bn – an increase of 9 percent compared to the end of March 2014. Service revenue amounted to EUR 255m in the first quarter of 2015 – an increase of 13 percent compared to the first quarter of 2014, which included offshore revenue. Onshore service revenue growth amounted to 21 percent. Even though revenue and earnings from the service business are more stable than from the wind turbine business, the revenue and earnings generating activities in the different service contracts may vary from quarter to quarter. Service revenue mEUR
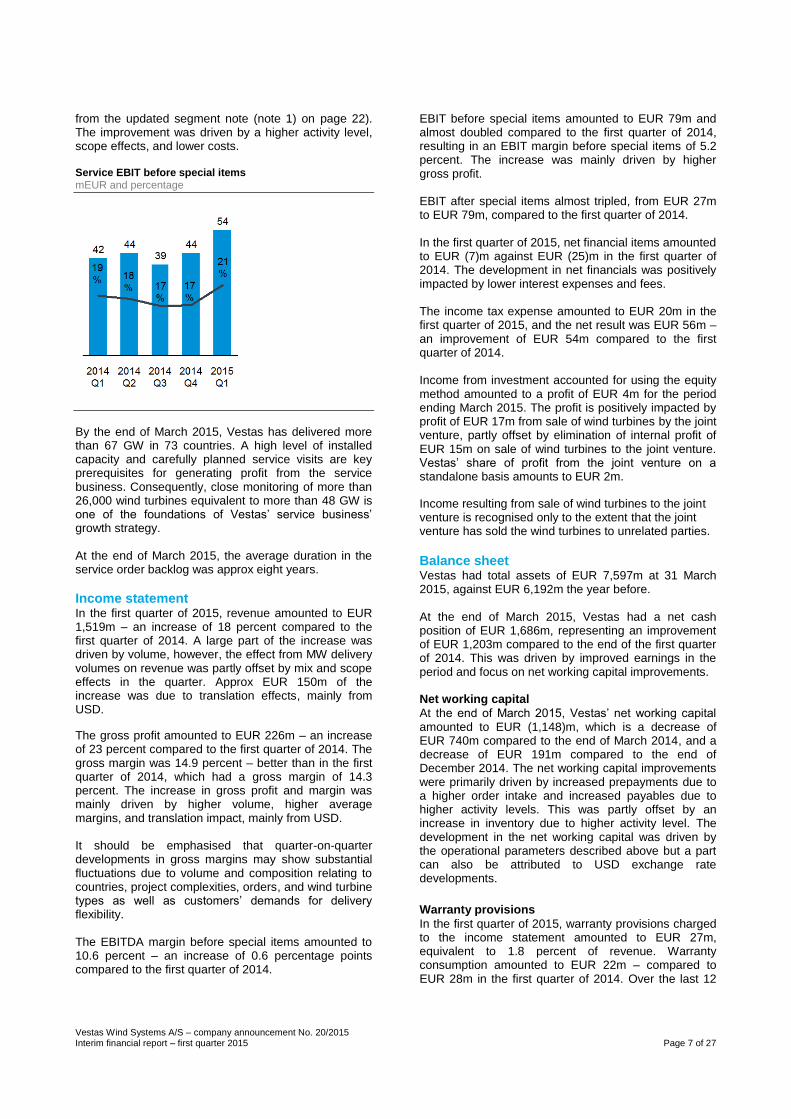
In the first quarter of 2015, the EBIT margin before special items amounted to 21 percent which is an increase of 2 percentage points compared to the first quarter of 2014 (comparison figures are based on data
Vestas Wind Systems A/S – company announcement No. 20/2015 Interim financial report – first quarter 2015 Page 7 of 27
from the updated segment note (note 1) on page 22). The improvement was driven by a higher activity level, scope effects, and lower costs. Service EBIT before special items mEUR and percentage
By the end of March 2015, Vestas has delivered more than 67 GW in 73 countries. A high level of installed capacity and carefully planned service visits are key prerequisites for generating profit from the service business. Consequently, close monitoring of more than 26,000 wind turbines equivalent to more than 48 GW is one of the foundations of Vestas’ service business’ growth strategy. At the end of March 2015, the average duration in the service order backlog was approx eight years.
Income statement In the first quarter of 2015, revenue amounted to EUR 1,519m – an increase of 18 percent compared to the first quarter of 2014. A large part of the increase was driven by volume, however, the effect from MW delivery volumes on revenue was partly offset by mix and scope effects in the quarter. Approx EUR 150m of the increase was due to translation effects, mainly from USD.
The gross profit amounted to EUR 226m – an increase of 23 percent compared to the first quarter of 2014. The gross margin was 14.9 percent – better than in the first quarter of 2014, which had a gross margin of 14.3 percent. The increase in gross profit and margin was mainly driven by higher volume, higher average margins, and translation impact, mainly from USD. It should be emphasised that quarter-on-quarter developments in gross margins may show substantial fluctuations due to volume and composition relating to countries, project complexities, orders, and wind turbine types as well as customers’ demands for delivery flexibility. The EBITDA margin before special items amounted to 10.6 percent – an increase of 0.6 percentage points compared to the first quarter of 2014.
EBIT before special items amounted to EUR 79m and almost doubled compared to the first quarter of 2014, resulting in an EBIT margin before special items of 5.2 percent. The increase was mainly driven by higher gross profit. EBIT after special items almost tripled, from EUR 27m to EUR 79m, compared to the first quarter of 2014. In the first quarter of 2015, net financial items amounted to EUR (7)m against EUR (25)m in the first quarter of 2014. The development in net financials was positively impacted by lower interest expenses and fees. The income tax expense amounted to EUR 20m in the first quarter of 2015, and the net result was EUR 56m – an improvement of EUR 54m compared to the first quarter of 2014. Income from investment accounted for using the equity method amounted to a profit of EUR 4m for the period ending March 2015. The profit is positively impacted by profit of EUR 17m from sale of wind turbines by the joint venture, partly offset by elimination of internal profit of EUR 15m on sale of wind turbines to the joint venture. Vestas’ share of profit from the joint venture on a standalone basis amounts to EUR 2m.
Income resulting from sale of wind turbines to the joint venture is recognised only to the extent that the joint venture has sold the wind turbines to unrelated parties.
Balance sheet Vestas had total assets of EUR 7,597m at 31 March 2015, against EUR 6,192m the year before. At the end of March 2015, Vestas had a net cash position of EUR 1,686m, representing an improvement of EUR 1,203m compared to the end of the first quarter of 2014. This was driven by improved earnings in the period and focus on net working capital improvements. Net working capital
At the end of March 2015, Vestas’ net working capital amounted to EUR (1,148)m, which is a decrease of EUR 740m compared to the end of March 2014, and a decrease of EUR 191m compared to the end of December 2014. The net working capital improvements were primarily driven by increased prepayments due to a higher order intake and increased payables due to higher activity levels. This was partly offset by an increase in inventory due to higher activity level. The development in the net working capital was driven by the operational parameters described above but a part can also be attributed to USD exchange rate developments.
Warranty provisions
In the first quarter of 2015, warranty provisions charged to the income statement amounted to EUR 27m, equivalent to 1.8 percent of revenue. Warranty consumption amounted to EUR 22m – compared to EUR 28m in the first quarter of 2014. Over the last 12

Vestas Wind Systems A/S – company announcement No. 20/2015 Interim financial report – first quarter 2015 Page 8 of 27
months, warranty consumption as a percentage of revenue amounted to 1.4 percent. In general, provisions are made for all expected costs associated with wind turbine repairs or replacements, and any reimbursement from other involved parties is not offset unless a written agreement has been made to that effect. Provisions are made to cover possible costs of remedy and other costs in accordance with specific agreements. Provisions are based on estimates, and actual costs may deviate substantially from such estimates. The ongoing improvement of the Lost Production Factor (LPF) on Vestas wind turbines implies that the customers achieve a consistently better return on their investment. At the end of March 2015, all the wind power plants where Vestas guaranteed the performance had an average LPF significantly lower than 2 percent. Lost Production Factor
Percentage
Data calculated across 20,021 Vestas wind turbines under full scope service.
Total equity
Vestas’ equity amounted to EUR 2,388m at 31 March 2015 – an increase of EUR 467m compared to 31 March 2014, primarily driven by improved net results. The solvency ratio increased by 0.4 percentage points to 31.4 percent. In the quarter, the solvency ratio was negatively impacted by dividend and working capital effects, however, this development is seen as a short term fluctuation without relevance for Vestas’ longer term solvency target of 35 percent. Cash flow and investments
In the first quarter of 2015, cash flow from operating activities increased by EUR 167m to EUR 209m compared to the first quarter of 2014. The increase was mainly driven by improvements in net working capital as well as improved earnings. Cash flow used for investments amounted to EUR (63)m, which is at the same level as the same period last year.
In the first quarter of 2015, the free cash flow increased by EUR 170m to EUR 146m compared to the first quarter of 2014. Issuance of green Eurobond In March 2015, Vestas successfully placed a new green corporate Eurobond for a principal amount of EUR 500m. The bonds have a coupon of 2.75 percent and a seven-year maturity. The bonds replaced the existing corporate Eurobond of EUR 600m which expired in March 2015.
March
2015

Vestas Wind Systems A/S – company announcement No. 20/2015 Interim financial report – first quarter 2015 Page 9 of 27
Market development
Deliveries and backlog per region During the first quarter of 2015, Vestas’ total backlog increased by 517 MW compared to first quarter of 2014 and by 578 MW compared to the end of 2014. Deliveries and wind turbine backlog per region
MW
Europe and
Africa Americas Asia
Pacific Total
Order intake Q1 2015 820 710 220 1,750
Backlog as per 31 March 2015 4,398 3,135 558 8,091
Europe and Africa
Deliveries in Europe and Africa in the quarter totalled 457 MW compared to 499 MW in the previous year. Deliveries were biased towards the northern parts of Europe, and South Africa. The order intake for the region amounted to 820 MW, up from 693 MW in the first quarter of 2014. This was driven by a general improvement in several European countries. The backlog comprised 4,398 MW as of 31 March 2015. Americas
Based on a strong foothold and a continued high market activity in the USA, Vestas announced US orders of 341 MW in the first quarter of 2015 and had deliveries of 597 MW. Deliveries for the region were thus strongly impacted by the increased deliveries in the USA. In the quarter, order intake especially increased in Brazil with a total order intake of 286 MW. The order backlog for the region amounted to 3,135 MW as of 31 March 2015, of which the majority relates to orders for the USA. Asia Pacific
Vestas received orders of a total of 220 MW from the Asia Pacific region, all coming from China. This was a significant relative increase from 50 MW in the first quarter of 2014. 96 MW was delivered to the markets in Asia Pacific and the order backlog amounted to 558 MW as of 31 March 2015.
Deliveries (TOR) MW
Q1 2015
Q1 2014
FY 2014
Netherlands 87 - 72
Germany 74 234 1,127
South Africa 68 2 158
Poland 55 20 146
Finland 50 - 89
France 31 18 385
Sweden 20 29 365
United Kingdom 18 45 319
Italy 16 6 82
Turkey 13 24 194
Greece 11 - 15
Denmark 7 - 47
Spain 4 - -
Ukraine 3 18 33
Croatia - 24 42
Austria - 21 51
Belgium - 58 114
Romania - - 120
Czech Republic - - 12
Portugal - - 7
Kenya - - 7
Total Europe and Africa 457 499 3,385
USA 597 385 1,517
Chile 57 - 202
Uruguay 42 25 175
Canada 22 6 39
Brazil - 58 87
Mexico - 9 170
Peru - - 112
Costa Rica - - 21
Total Americas 718 483 2,323
Australia 33 - 24
India 22 - 22
South Korea 21 - 38
China 20 6 310
Philippines - - 150
Total Asia Pacific 96 6 544
TOTAL WORLD 1,271 988 6,252
Vestas Wind Systems A/S – company announcement No. 20/2015 Interim financial report – first quarter 2015 Page 10 of 27
Strategy and financial and capital structure targets (For an extended introduction to the Vestas strategy, please refer to the annual report 2014.)
Strategic objectives
In the beginning of 2014, Vestas launched its mid-term strategy, Profitable Growth for Vestas and as part of its annual strategy process, the strategic plan has been updated to reflect developments occurring during 2014. This process confirmed Vestas’ strong global reach in both the wind turbine and service segments and also confirmed the relevance of Vestas’ ambition to continue to build its strength in those segments in 2015 and beyond. Thus, the overall strategic ambition to ensure profitable growth for Vestas remains, as does Vestas’ ambition to maintain and expand its global leadership and create an even more flexible and robust company, able to consistently deliver best-in-class margins. To achieve this, Vestas must balance and utilise its three key differentiators:
Expand global reach (i.e. by increasing market presence and further localising manufacturing).
Increase technology and service leadership (i.e. by reducing levelised cost of energy across product portfolio and by strengthening product and service offerings).
Leveraging global scale (i.e. by utilising installed base and sourcing opportunities).
To this end, Vestas has defined four strategic objectives which provide the operational basis for the implementation of the strategy.
1. Grow profitably in mature and emerging markets
Vestas will leverage on its strong position in mature markets such as Europe and North America. These markets have historically been the strongholds of Vestas. The product portfolio has a strong fit for these markets, the brand is well established and recognised, and an experienced sales force is in place. Simultaneously, Vestas plans to further reduce costs and capital expenditure requirements in these markets by offering tailored, technologically advanced product variants based on innovation of existing wind turbine platforms, targeting an even higher market share. Vestas has already established a strong track record of winning orders in new wind turbine markets in Eastern Europe, Asia, Africa and Latin America. Furthermore, Vestas expects to improve its regional competitiveness and presence in the specific markets China, India and Brazil. Plans have been developed for those markets and are now being implemented.
Building on its global presence, Vestas will also continue to pursue opportunities in markets, where wind energy is set to expand, such as for instance Chile, Costa Rica, Kenya, Slovenia, Vietnam, and Thailand. Consequently, Vestas will amplify the agility and competencies of its sales organisation and deepen the partnerships with its customers through the expansion of its key account programme. Furthermore, Vestas has established a Customer Advisory Board, involving key customers in the development of new wind power technologies and services. To win more and larger orders, Vestas seeks to partner with potential customers early in the project development phase. Through advanced services such as SiteHunt® and SiteDesign®, providing transparency and business case certainty for its customers, Vestas is able to unlock value and enhance customer relationships at an early stage of project planning. Thus, Vestas has increasingly become an opportunity originator by helping both established and new customers and investors to step up their commercial focus on wind power as well as enter new and promising wind power markets with a high return on their investments. Through its unrivalled track record and close customer relationships, Vestas has developed a clear understanding of the customers’ requirements and how to optimise projects to maximise value. Combined with Vestas’ unparalleled capabilities within siting, operation, and servicing of wind power plants, Vestas has a competitive advantage which will be utilised even further going forward, where the ambition is to grow faster than the market.
2. Capture full potential of the service business
Having delivered an accumulated amount of more than 67 GW of wind power – a significantly higher amount than the closest competitor – Vestas has a unique platform from which to grow its service business, which today, is already the largest in the wind power industry. As the majority of Vestas’ wind turbine contracts are sold with service agreements, typically running for five or ten years, the stable revenue stream from the service business is set to continue its growth as the installed base of wind turbines increases. In 2014, the service business was established as a separate division and a head of Global Service was appointed. Following this appointment, the global service organisation was implemented later in the year and the division is now set to capture the full potential of the service business. Vestas intends to expand its service business further by offering new and value-adding service solutions and a variety of upgrades of existing wind power plants to its customers. This is made possible through the use of the wind power industry’s most powerful supercomputer and a body of unrivalled wind data.

Vestas Wind Systems A/S – company announcement No. 20/2015 Interim financial report – first quarter 2015 Page 11 of 27
Vestas aims to increase the value of its customer offerings through further development and upselling of service solutions, product improvements, and services like Vestas PowerPlus™ and VestasOnline®. Due to its size and global presence, Vestas is well-positioned to offer its customers the most effective service at the lowest cost. It is thus an ongoing and unchanged ambition to continue to reduce the underlying cost structures in the service division. Simultaneously, Vestas intends to improve supply chain delivery performance within the service business through optimisation of distribution networks, better forecasting, and local sourcing. The ambition to grow the service business by more than 30 percent mid-term remains unchanged. 3. Reduce levelised cost of energy
Based on two wind turbine platforms, Vestas’ comprehensive product portfolio will continue to be customer and market driven whilst simultaneously improving cost structures. An example is the increased integration of standard components and modularisation across Vestas’ product platforms which reduces the technical complexity and thereby the cost of the wind turbines. In addition, the product strategy based on two platforms is designed to accelerate and streamline product development, thereby reducing the time it takes to bring new products to market, while maintaining a broad product offering. The recent technological improvements to the existing 2 MW and 3 MW wind turbine platforms have resulted in significantly increased Annual Energy Production (AEP), among other things, enabling Vestas to defend its strong position in market segments characterised by constraints in terms of grid compliance, tip-height, and noise. In these often highly complex markets, Vestas will further leverage on its vast expertise within site and power plant optimisation to maintain its already dominant position. For markets with less challenging requirements, cost per wind turbine is often more of a decisive factor. Consequently, Vestas will further utilise its proven 2 MW platform by developing new variants, targeted at reducing costs by means of design optimisations and sourcing of lower cost components. Combined with prioritising further development of existing, well-proven wind turbine technology over the costly development of entirely new platforms, Vestas is able to lower the cost of energy for its customers year after year. The intention is to reduce the cost of energy faster than the market. 4. Improve operational excellence
Cost savings remain a priority for Vestas, and Vestas will continue its journey towards lower costs through further site simplification, shared service centres and
increased efficiency by leveraging on the scale of its operations. The goal is to achieve cost leadership within the wind power industry. The size of Vestas provides a competitive foundation for lowering costs at every stage of the value chain. Through the Accelerated Earnings programme, launched at the end of 2012, Vestas has successfully lowered the costs of products delivered and the programme has helped Vestas consolidate its leading position in a competitive market. More value can be captured through further capability building, and the next generation of the programme, Accelerated Earnings Pro, is now in place. Optimisation of the supply chain and increased use of standard components also decrease Vestas’ need for investments, reduce lead time, and keep inventories low. Yet, the growing degree of outsourcing must never compromise Vestas’ leading position within the areas of safety, quality, and technology. Finally, working capital management remains an area of high priority for Vestas. Consequently, the focus remains on improving the cash conversion cycle and lowering the working capital tied up while transporting and installing the wind turbine projects.
Financial and capital structure targets and priorities Vestas’ financial and capital structure targets, as well as related dividend policy, link to the strategic aspirations of the company. Financial stability and structural strength of the balance sheet remain key priorities for the company. Both the Board of Directors as well as Executive Management believe that strong financial performance and stability are prerequisites for delivering excellent commercial results, and therefore adopt a conservative approach to the structure of the company’s balance sheet, whilst at the same time ensuring that management focuses on delivering strong financial results. Mid-term financial targets
By increasing earnings and keeping investment and net working capital requirements low, Vestas aims to generate a double-digit return on invested capital (ROIC) each year over the cycle. Vestas expects to be able to finance its own growth and thus the free cash flow is expected to be positive each financial year. Capital structure targets
As a player in a market where projects, customers and wind turbine investors become larger, Vestas aims to be a strong financial counterpart. Consequently, the target for the net debt/EBITDA ratio remains unchanged at less than 1 by the end of each financial year, and the solvency ratio target remains a minimum level of 35 percent, in line with the company’s prudent balance sheet approach. Dividend policy and priorities for excess cash allocation
Vestas has the following priorities for excess cash:
Vestas Wind Systems A/S – company announcement No. 20/2015 Interim financial report – first quarter 2015 Page 12 of 27
1. Repayment of debt if the net debt/EBITDA ratio is
above target. 2. Allocation to shareholders if the solvency ratio is
above target. The general intention of the Board of Directors is to recommend a dividend of 25-30 percent of the net result of the year. However, pay-out of dividends will always take into consideration the Group’s plans for growth and liquidity requirements. For the financial year 2014, a dividend payout ratio of 29.5 percent was thus adopted by the annual general meeting on 30 March 2015.

Vestas Wind Systems A/S – company announcement No. 20/2015 Interim financial report – first quarter 2015 Page 13 of 27
Social and environmental performance Standards, goals, and priorities Sustainable products and sustainable operations are integral for Vestas. The standards and goals build on global certificates for the three standards ISO 9001 for quality, ISO 14001 for environment, and OHSAS 18001 for health and safety as well as recognised conventions established by international organisations such as the UN, the International Labour Organization (ILO), and OECD.
The standards and goals are reflected in Vestas’ social and environmental priorities:
The lowest possible incidence of recordable injuries.
CO2 impact from wind power must excel against other energy forms.
The greatest possible recyclability of the wind turbines.
Code of Conduct
An update to Vestas’ framework against bribery and corruption was undertaken in the first quarter of 2015. As part of the update, a bribery risk assessment has been initiated, which will be completed by the end of the third quarter of 2015. Depending on the assessment findings, further initiatives to renew the existing risk measures will potentially be implemented.
Human rights and labour practices
Vestas recognises its responsibility to respect the Bill of
Human Rights. Commitments are outlined in Vestas’
Human Right Policy. Through the Social and Environ-mental Due Diligence process, Vestas initiates actions that either prevent or mitigate adverse human rights and labour impacts.
Employees The employee counting practice was changed from 1 January 2015. In the new employee definition (reflected also in the comparatives for 2014) external, hourly-paid employees working for Vestas are not included. The change has been made to give a direct correlation to staff costs. The Group still keeps track of contractors managed by Vestas to have a measure of the combined workforce and overall safety performance. Employee statistics – old and new definition
During the first three months of 2015, Vestas increased the number of employees by 564 to 18,162, mainly driven by the ramp-up at the factories in the USA, as seen in the preceding quarters. Vestas will continue to scale the organisation according to, among other things, the expected activity level.
Safety Since 2006, the incidence of lost time injuries per one million working hours at Vestas has been reduced at an average rate of 28 percent every year. By the end of 2014 it had reached a level of 1.6 per one million working hours, thereby reaching the target. In the first quarter of 2015, the number of lost time injuries increased slightly to 17 from 15 in the first quarter of 2014. However, due to the higher number of working hours in the first quarter of 2015, the incidence of lost time injuries decreased from 2.0 in the first quarter of 2014 to 1.9 in the first quarter of 2015. Incidence of lost time injuries
Per one million working hours
In 2015, Vestas is introducing a new safety KPI, ‘total recordable injuries’, which covers a broader range of injuries. In addition to ‘lost time injuries’, the measure ‘total recordable injuries’ includes ‘restricted work injuries’ and ‘medical treatment injuries’, thereby providing more data points on unsafe behaviour and the use of unsafe material. This allows Vestas to evaluate and target injury reduction programs more effectively. The target for 2015 is 10.1 total recordable injuries per million working hours. Compared to full year 2014, the incidence of total recordable injuries has decreased from 11.8 to 11.4 in the first quarter of 2015. However, quarter-on-quarter, the numbers show a 9 percent increase from last year. The high number of new employees, including new-hires with no prior factory work experience has been a challenge despite an intensive induction effort. Improving the safety culture is a focus area for 2015.
2014 2014 2014 2014 2015
Q1 Q2 Q3 Q4 Q1
Old definition 16,263 17,104 18,672 19,579 19,841
New definition 15,399 15,824 16,661 17,442 17,942
Old definition 16,610 17,586 19,323 19,669 20,055
New definition 15,629 16,078 17,046 17,598 18,162
Old definition 6,324 7,162 8,332 8,626 8,773
New definition 5,910 6,349 6,910 7,441 7,853
Average number of
employees
No. of employees at
the end of the quarter
- of which outside
Europe and Africa

Vestas Wind Systems A/S – company announcement No. 20/2015 Interim financial report – first quarter 2015 Page 14 of 27
Environmental performance Increased production in the first quarter of 2015 impacted environmental performance compared to the first quarter of 2014. While the relative level of water consumption was more or less in line with the increased production level, the consumption of energy and related carbon dioxide emissions increased relatively less due to higher efficiency usage. On the downside, the relative level of waste generation was significantly higher than the increased production level. Renewable energy
All electricity consumption in Vestas comes from renewable energy sources. Vestas achieves this, partly by purchasing renewable electricity where available, and partly by compensating for the consumption of non-renewable electricity with Vestas-owned wind power plants. In the first quarter of 2015, 46 percent of all energy consumption came from renewable energy sources, which was the same percentage as the year-earlier period. The decrease in the share of renewable energy for the quarter compared to full year is attributable to seasonality. Renewable energy Percentage of total energy consumption

Vestas Wind Systems A/S – company announcement No. 20/2015 Interim financial report – first quarter 2015 Page 15 of 27
Outlook 2015 Revenue is expected to be minimum EUR 7.5bn (compared to minimum EUR 6.5bn previously) including service revenue, which is expected to grow. Approximately two thirds of the increase is attributable to a greater than expected order intake year to date and, generally, improved delivery visibility for the year whereas approximately a third of the increase is driven by the USD exchange rate development. Consequently, Vestas now expects to achieve an EBIT margin before special items of minimum 8.5 percent (compared to minimum 7 percent previously) with the service margins remaining stable. Total investments are expected to amount to approx EUR 350m (compared to approx EUR 300m previously) due to the higher activity level. The free cash flow expectations are increased to minimum EUR 600m (compared to minimum EUR 400m previously) in 2015, mainly as a result of the increased earnings expectations. It should be emphasised that Vestas’ accounting policies only allow the recognition of supply-only and supply-and-installation projects as income when the risk has finally passed to the customer, irrespective of whether Vestas has already produced, shipped and installed the wind turbines. Disruptions in production and challenges in relation to wind turbine installation, for example bad weather, lack of grid connections, and similar matters may thus cause delays that could affect Vestas’ financial results for 2015. Further, movements in exchange rates from current levels may also impact Vestas’ financial results for 2015. Outlook 2015
Revenue (bnEUR) min. 7.5
EBIT margin before special items (%) min. 8.5
Total investments (mEUR) approx 350
Free cash flow (mEUR) min. 600

Vestas Wind Systems A/S – company announcement No. 20/2015 Interim financial report – first quarter 2015 Page 16 of 27
Consolidated financial statements 1 January-31 March Condensed consolidated income statement 1 January-31 March mEUR
Note Q1
2015
Q1
2014
Revenue 1,519 1,283
Cost of sales (1,293) (1,099)
Gross profit
226 184
Research and development costs (44) (53)
Distribution expenses (42) (38)
Administrative expenses (61) (53)
Operating profit (EBIT) before special items
79 40
Special items 0 (13)
Operating profit (EBIT) 79 27
Income from investments accounted for using the equity method 6 4 0
Net financial items (7) (25)
Profit before tax
76 2
Income tax (20) 0
Profit for the period
56 2
Earnings per share (EPS)
Earnings per share for the period (EUR), basic 0.25 0.01
Earnings per share for the period (EUR), diluted 0.25 0.01

Vestas Wind Systems A/S – company announcement No. 20/2015 Interim financial report – first quarter 2015 Page 17 of 27
Condensed consolidated statement of comprehensive income 1 January-31 March
mEUR Q1
2015 Q1
2014
Profit for the period 56 2
Items that may be subsequently reclassified to the income statement:
Exchange rate adjustments relating to foreign entities 93 (4)
Fair value adjustments of derivative financial instruments for the period (64) (1)
Fair value adjustments of derivative financial instruments transferred to the income statement (cost of sales) 20 (21)
Share of other comprehensive income of joint venture 1 -
Tax on items that may be subsequently reclassified to the income statement 11 6
Other comprehensive income after tax for the period 61 (20)
Total comprehensive income for the period 117 (18)

Vestas Wind Systems A/S – company announcement No. 20/2015 Interim financial report – first quarter 2015 Page 18 of 27
Condensed consolidated balance sheet – Assets
mEUR Note 31 March
2015 31 March
2014 31 December
2014
Goodwill 215 215 215
Completed development projects 242 330 274
Software 28 40 32
Development projects in progress 152 136 137
Total intangible assets
637 721 658
Land and buildings 737 723 695
Plant and machinery 208 207 211
Other fixtures, fittings, tools and equipment 172 138 168
Property, plant and equipment in progress 81 62 58
Total property, plant and equipment
1,198 1,130 1,132
Investments accounted for using the equity method
6 194 1 188
Other investments 14 - 14
Other receivables 42 34 36
Deferred tax 193 185 170
Total other non-current assets
443 220 408
Total non-current assets 2,278 2,071 2,198
Inventories 1,869 1,542 1,509
Trade receivables 673 559 598
Construction contracts in progress 98 101 104
Other receivables 338 412 402
Tax receivables 54 55 65
Cash at bank and in hand 2,184 1,094 2,018
Total current assets
5,216 3,763 4,696
Non-current assets held for sale 7 103 358 103
TOTAL ASSETS 7,597 6,192 6,997
Vestas Wind Systems A/S – company announcement No. 20/2015 Interim financial report – first quarter 2015 Page 19 of 27
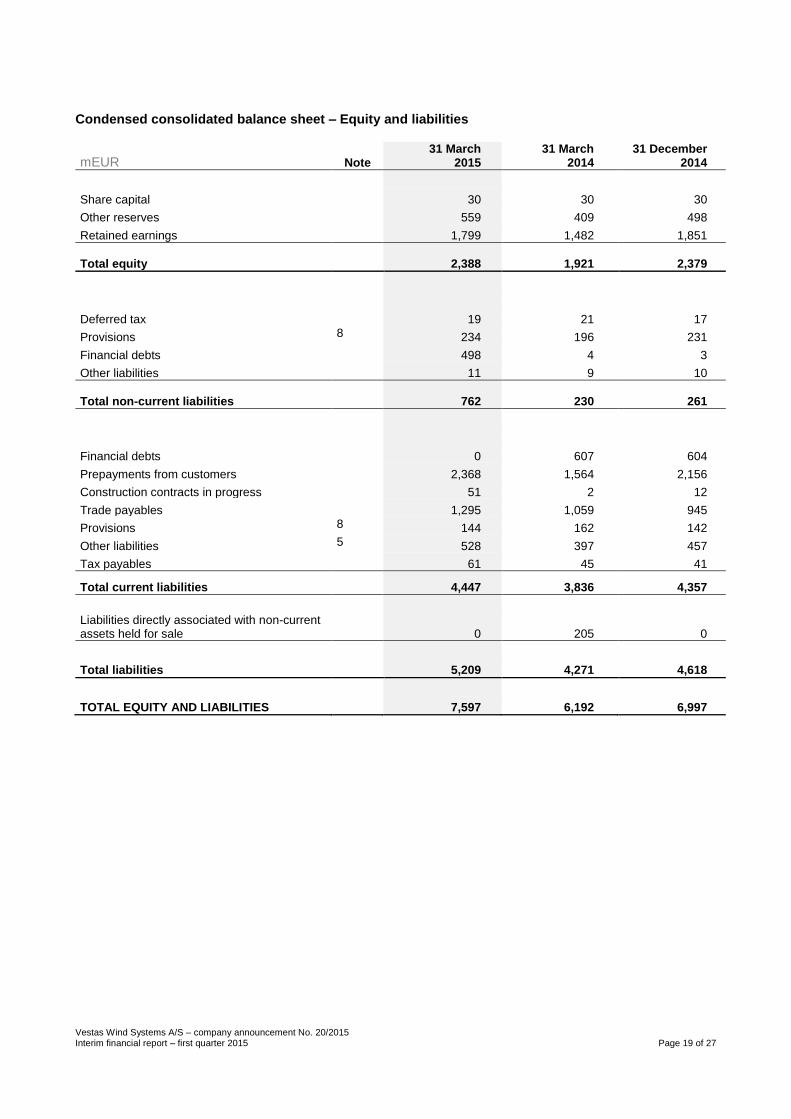
Condensed consolidated balance sheet – Equity and liabilities
mEUR Note 31 March
2015 31 March
2014 31 December
2014
Share capital 30 30 30
Other reserves 559 409 498
Retained earnings 1,799 1,482 1,851
Total equity
2,388 1,921 2,379
Deferred tax 19 21 17
Provisions 8 234 196 231
Financial debts 498 4 3
Other liabilities 11 9 10
Total non-current liabilities
762 230 261
Financial debts 0 607 604
Prepayments from customers 2,368 1,564 2,156
Construction contracts in progress 51 2 12
Trade payables 1,295 1,059 945
Provisions 8 144 162 142
Other liabilities 5 528 397 457
Tax payables 61 45 41
Total current liabilities
4,447 3,836 4,357
Liabilities directly associated with non-current assets held for sale
0 205 0
Total liabilities 5,209 4,271 4,618
TOTAL EQUITY AND LIABILITIES 7,597 6,192 6,997
Vestas Wind Systems A/S – company announcement No. 20/2015 Interim financial report – first quarter 2015 Page 20 of 27
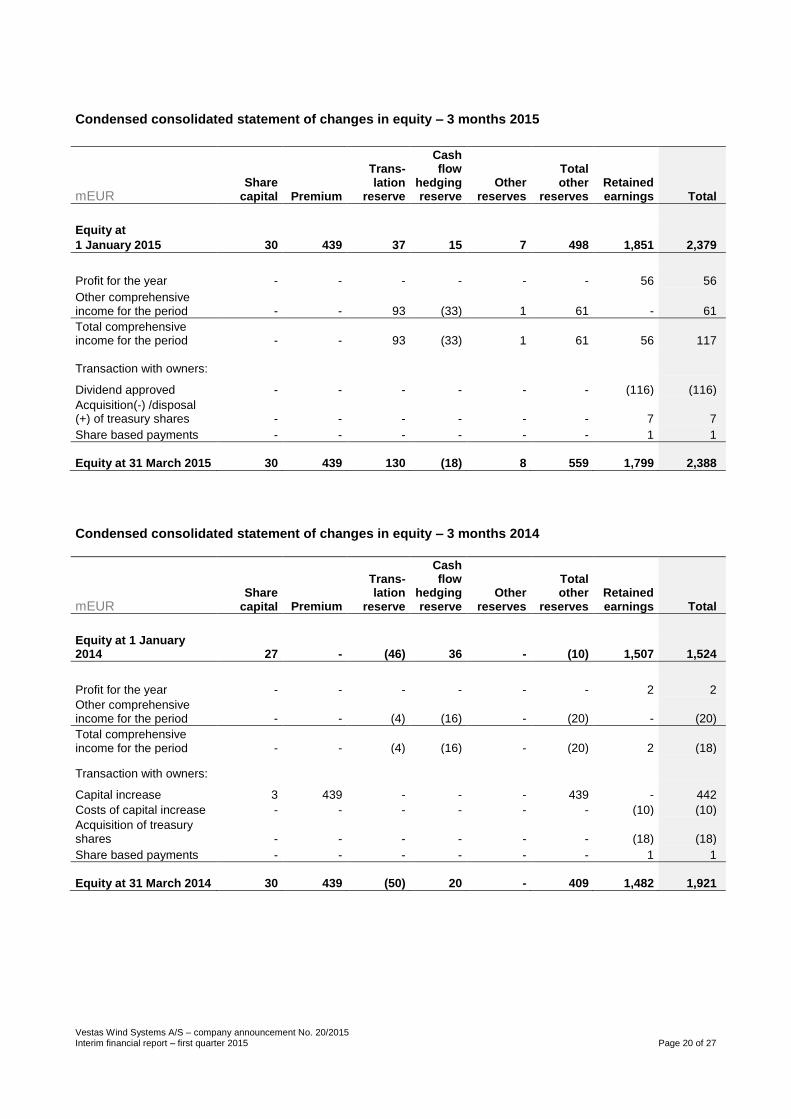
Condensed consolidated statement of changes in equity – 3 months 2015
mEUR Share
capital Premium
Trans-lation
reserve
Cash flow
hedging reserve
Other reserves
Total other
reserves
Retained earnings Total
Equity at
1 January 2015 30 439 37 15 7 498 1,851 2,379
Profit for the year - - - - - - 56 56
Other comprehensive income for the period - - 93 (33)
1 61 - 61
Total comprehensive income for the period - - 93 (33) 1 61 56 117
Transaction with owners:
Dividend approved - - - - - - (116) (116)
Acquisition(-) /disposal (+) of treasury shares - - - - - - 7 7
Share based payments - - - - - - 1 1
Equity at 31 March 2015 30 439 130 (18) 8 559 1,799 2,388
Condensed consolidated statement of changes in equity – 3 months 2014
mEUR Share
capital Premium
Trans-lation
reserve
Cash flow
hedging reserve
Other reserves
Total other
reserves
Retained earnings Total
Equity at 1 January 2014 27 - (46) 36 - (10) 1,507 1,524
Profit for the year - - - - - - 2 2
Other comprehensive income for the period - - (4) (16) - (20) - (20)
Total comprehensive income for the period - - (4) (16) - (20) 2 (18)
Transaction with owners:
Capital increase 3 439 - - - 439 - 442
Costs of capital increase - - - - - - (10) (10)
Acquisition of treasury shares - - - - - - (18) (18)
Share based payments - - - - - - 1 1
Equity at 31 March 2014 30 439 (50) 20 - 409 1,482 1,921

Vestas Wind Systems A/S – company announcement No. 20/2015 Interim financial report – first quarter 2015 Page 21 of 27
Condensed consolidated cash flow statement
mEUR Q1
2015 Q1
2014
Profit for the period 56 2
Adjustments for non-cash transactions 116 100
Income tax received/paid 16 (14)
Interest paid (28) (20)
Cash flow from operating activities before change in net working capital 160 68
Change in net working capital 49 (26)
Cash flow from operating activities 209 42
Investments in intangible assets (21) (44)
Investments in property, plant and equipment (40) (22)
Other (2) -
Cash flow used for investments (63) (66)
Free cash flow 146 (24)
Capital increase - 432
Disposal/(acquisition) of treasury shares 7 (18)
Repayment of financial debts (600) 0
Raising of financial debts 496 7
Cash flow from financing activities (97) 421
Change in cash at bank and in hand less current portion of bank debt 49 397
Cash at bank and in hand less current portion of bank debt at 1 January 2,014 690
Exchange rate adjustments of cash at bank and in hand 121 0
Cash at bank and in hand less current portion of bank debt at 31 March 2,184 1,087
The amount can be specified as follows:
Cash at bank and in hand without disposal restrictions 1,996 998
Cash at bank and in hand with disposal restrictions 188 96
Total cash at bank and in hand 2,184 1,094
Current portion of bank debt 0 (7)
2,184 1,087
Vestas Wind Systems A/S – company announcement No. 20/2015 Interim financial report – first quarter 2015 Page 22 of 27
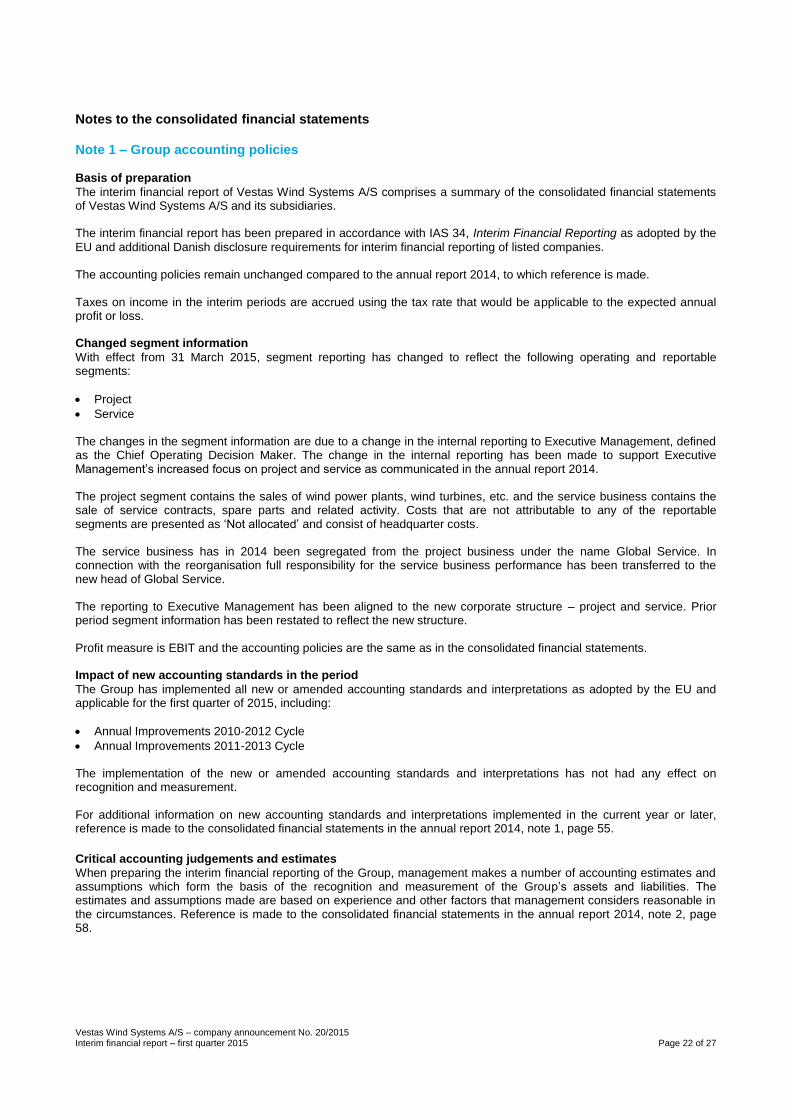
Notes to the consolidated financial statements Note 1 – Group accounting policies Basis of preparation
The interim financial report of Vestas Wind Systems A/S comprises a summary of the consolidated financial statements of Vestas Wind Systems A/S and its subsidiaries. The interim financial report has been prepared in accordance with IAS 34, Interim Financial Reporting as adopted by the
EU and additional Danish disclosure requirements for interim financial reporting of listed companies. The accounting policies remain unchanged compared to the annual report 2014, to which reference is made. Taxes on income in the interim periods are accrued using the tax rate that would be applicable to the expected annual profit or loss. Changed segment information
With effect from 31 March 2015, segment reporting has changed to reflect the following operating and reportable segments:
Project
Service The changes in the segment information are due to a change in the internal reporting to Executive Management, defined as the Chief Operating Decision Maker. The change in the internal reporting has been made to support Executive Management’s increased focus on project and service as communicated in the annual report 2014. The project segment contains the sales of wind power plants, wind turbines, etc. and the service business contains the sale of service contracts, spare parts and related activity. Costs that are not attributable to any of the reportable segments are presented as ‘Not allocated’ and consist of headquarter costs. The service business has in 2014 been segregated from the project business under the name Global Service. In connection with the reorganisation full responsibility for the service business performance has been transferred to the new head of Global Service. The reporting to Executive Management has been aligned to the new corporate structure – project and service. Prior period segment information has been restated to reflect the new structure. Profit measure is EBIT and the accounting policies are the same as in the consolidated financial statements. Impact of new accounting standards in the period
The Group has implemented all new or amended accounting standards and interpretations as adopted by the EU and applicable for the first quarter of 2015, including:
Annual Improvements 2010-2012 Cycle
Annual Improvements 2011-2013 Cycle The implementation of the new or amended accounting standards and interpretations has not had any effect on recognition and measurement. For additional information on new accounting standards and interpretations implemented in the current year or later, reference is made to the consolidated financial statements in the annual report 2014, note 1, page 55.
Critical accounting judgements and estimates
When preparing the interim financial reporting of the Group, management makes a number of accounting estimates and assumptions which form the basis of the recognition and measurement of the Group’s assets and liabilities. The estimates and assumptions made are based on experience and other factors that management considers reasonable in the circumstances. Reference is made to the consolidated financial statements in the annual report 2014, note 2, page 58.

Vestas Wind Systems A/S – company announcement No. 20/2015 Interim financial report – first quarter 2015 Page 23 of 27
Note 2 – Segment information
Note 3 – Key development in the balance sheet since 31 December 2014 Non-current financial debts have increased by EUR 495m. This is due to the successful placing of a new green corporate Eurobond for a principal amount of EUR 500m with a seven-year maturity. This new bond has replaced the previous corporate Eurobond of EUR 600m which was repaid in March 2015. The decrease in current financial debts is primarily due to repayment of the previous bond.
Note 4 – Financial risks Financial risks and other risks, including liquidity-, credit-, and market risks are addressed in the notes to the consolidated financial statements in the annual report 2014, note 37, page 94. The risks remain unchanged from 2014.
Note 5 – Financial instruments There are no material differences between the fair values and book values of financial assets and liabilities apart from the Eurobond, whose book value at 31 March 2015 was EUR 494m with a corresponding fair value of EUR 497m. The fair value of derivative financial instruments at 31 March 2015 amounts to a negative market value of EUR 51m which equals book value.
mEUR Project Service Not
allocated Total
Group
Q1 2015
External revenue 1,264 255 - 1,519
Total revenue 1,264 255 - 1,519
Total costs (1,195) (201) (44) (1,440)
Operating profit (EBIT) before special items 69 54 (44) 79
Special items -
Operating profit (EBIT) 79
Amortisation, depreciation and impairment losses included in total costs (74) (4) (4) (82)
mEUR Project Service Not
allocated Total
Group
Q1 2014
External revenue 1,058 225 - 1,283
Total revenue 1,058 225 - 1,283
Total costs (1,020) (183) (40) (1,243)
Operating profit (EBIT) before special items 38 42 (40) 40
Special items (13)
Operating profit (EBIT) 27
Amortisation, depreciation and impairment losses included in total costs (76) (5) (7) (88)

Vestas Wind Systems A/S – company announcement No. 20/2015 Interim financial report – first quarter 2015 Page 24 of 27
Note 6 – Investments accounted for using the equity method Investment in joint venture
As part of the agreement Vestas entered into in 2014 with Mitsubishi Heavy Industries Ltd. (MHI), MHI has to transfer up to EUR 200m to the joint venture MHI Vestas Offshore Wind A/S as milestone payments dependent on certain milestones which are to be achieved after the closing of the transaction. At the reporting date the joint venture MHI Vestas Offshore Wind A/S is yet to qualify for milestone payments of EUR 50m. It has been assessed that it is highly likely that these milestone payments will be achieved. The estimates and assumptions made to make this assessment are based on experience and other factors that management considers reasonable in the circumstances, but that are inherently uncertain. The closing balance sheet at 1 April 2014 of Vestas Offshore A/S has been approved by MHI in the first quarter of 2015. The final approval has not had any significant impact on the measurement of the net gain to date. In the Group’s share of profit from the joint venture, income resulting from the sale of wind turbines to the joint venture is recognised in the Group’s financial statements only to the extent that the joint venture has sold the wind turbines to unrelated parties. The share of profit from the joint venture on a standalone basis amounts to EUR 2m. The Group’s share of the joint venture’s revenue since 1 January 2015 and aggregated assets and liabilities at the end of the period amounts to: Revenue: EUR 88m, aggregated assets: EUR 395m, and aggregated liabilities: EUR 188m.
Note 7 – Non-current assets held for sale As part of the ongoing site simplification project, Vestas expects to sell a number of its office facilities, which are classified as held for sale at EUR 103m. The measurement basis is fair value less cost to sell.
Note 8 – Warranty provisions (included in provisions)
mEUR 31 March
2015 31 March
2014 31 December
2014
Warranty provisions, 1 January 321 307 307
Provisions for the period 27 25 122
Warranty provisions consumed during the period (22) (28) (108)
Warranty provisions 326 304 321
The provisions are expected to be payable as follows:
< 1 year 124 136 122
> 1 year 202 168 199
Note 9 – Related party transactions No significant changes have occurred to related parties or types and scale of transactions with these parties other than what is disclosed in the consolidated financial statements in the annual report 2014, note 32, page 92.
Note 10 – Contingent assets and liabilities On 31 March 2015 the Eastern High Court in Denmark ruled in favour of Vestas. The ruling of EUR 24m in favour of Vestas has not had any impact on Q1 2015 as IF Skadesforsikring has appealed the ruling. No other significant changes have occurred to contingent assets and liabilities other than what is disclosed in the consolidated financial statements in the annual report 2014, note 36, page 94.
Note 11 – Significant events after the reporting period
Between the end of the quarter and the publication of this interim financial report, other than the developments disclosed immediately above and in the interim review, no significant events have occurred which have not been recognised and adequately disclosed and which materially affect the profit for the period or the financial position.

Vestas Wind Systems A/S – company announcement No. 20/2015 Interim financial report – first quarter 2015 Page 25 of 27
Management’s statement The Executive Management and the Board of Directors have today discussed and approved the interim financial report of Vestas Wind Systems A/S for the period 1 January to 31 March 2015. The interim financial report has been prepared in accordance with IAS 34 on interim financial reporting as adopted by the EU and additional Danish disclosure requirements for interim financial reports of listed companies. The interim financial report has neither been audited nor reviewed.
In our opinion the interim financial report gives a true and fair view of the Group's assets, liabilities and
financial position at 31 March 2015 and of the results of the Group's operations and cash flow for the period 1 January to 31 March 2015.
Further, in our opinion the management report gives a true and fair review of the development in the Group's operations and financial matters, the results of the Group's operations for the period and the Group's financial position as a whole and describes the significant risks and uncertainties pertaining to the Group.
Aarhus, Denmark, 6 May 2015
Executive Management
Anders Runevad Group President & CEO
Marika Fredriksson Executive Vice President & CFO
Anders Vedel Executive Vice President & CTO
Jean-Marc Lechêne Executive Vice President & COO
Juan Araluce Executive Vice President & CSO
Board of Directors
Bert Nordberg Chairman
Lars Josefsson Deputy Chairman
Carsten Bjerg Eija Pitkänen Henrik Andersen
Henry Sténson Kim Bredo Rahbek Kim Hvid Thomsen
Lykke Friis Michael Abildgaard Lisbjerg Sussie Dvinge Agerbo
Torben Ballegaard Sørensen

Vestas Wind Systems A/S – company announcement No. 20/2015 Interim financial report – first quarter 2015 Page 26 of 27
Disclaimer and cautionary statement This document contains forward-looking statements concerning Vestas’ financial condition, results of operations and business. All statements other than statements of historical fact are, or may be deemed to be, forward-looking statements. Forward-looking statements are statements of future expectations that are based on management’s current expectations and assumptions and involve known and unknown risks and uncertainties that could cause actual results, performance or events to differ materially from those expressed or implied in these statements. Forward-looking statements include, among other things, statements concerning new potential accounting standards and policies, and Vestas’ potential exposure to market risks and statements expressing management’s expectations, beliefs, estimates, forecasts, projections and assumptions. There are a number of factors that could affect Vestas’ future operations and could cause Vestas’ results to differ materially from those expressed in the forward-looking statements included in this document, including (without limitation): (a) changes in demand for Vestas' products; (b) currency and interest rate fluctuations; (c) loss of market share and industry competition; (d) environmental and physical risks; (e) legislative, fiscal and regulatory developments, including changes in tax or accounting policies; (f) economic and financial
market conditions in various countries and regions; (g) political risks, including the risks of expropriation and renegotiation of the terms of contracts with governmental entities, and delays or advancements in the approval of projects; (h) ability to enforce patents; (i) product development risks; (j) cost of commodities; (k) customer credit risks; (l) supply of components from suppliers and vendors; and (m) customer readiness and ability to accept delivery and installation of products and transfer of risk. All forward-looking statements contained in this document are expressly qualified by the cautionary statements contained or referenced to in this statement. Undue reliance should not be placed on forward-looking statements. Additional factors that may affect future results are contained in Vestas’ annual report for the year ended 31 December 2014 (available at vestas.com/investor) and these factors should also be considered. Each forward-looking statement speaks only as of the date of this document. Vestas does not undertake any obligation to publicly update or revise any forward-looking statement as a result of new information or future events others than required by Danish law. In light of these risks, results could differ materially from those stated, implied or inferred from the forward-looking statements contained in this document.

Vestas Wind Systems A/S – company announcement No. 20/2015 Interim financial report – first quarter 2015 Page 27 of 27