
Interactive Reporting & Essbase - DOUG Reporting-Cube Query for... · The only Hyperion consulting...
100
Interactive Reporting & Essbase interRel Consulting
-
Upload
hoangkhuong -
Category
Documents
-
view
225 -
download
2
Transcript of Interactive Reporting & Essbase - DOUG Reporting-Cube Query for... · The only Hyperion consulting...
Interactive Reporting & Essbase
interRel Consulting

2
interRel - Founded in 1997
2008 Oracle Titan Award winner for “EPM Solution” of the year
2008 Oracle Excellence Award winner with Pearson Education
One of the fastest growing companies in USA (Inc. Magazine, ‟08)
The only Hyperion consulting partner with 2 Oracle ACE Directors
and one Oracle ACE
Founding Hyperion Platinum Partner; now an Oracle Certified Partner
Focused on Oracle Hyperion EPM software
100% of our senior consultants are Hyperion Certified Professionals
250+ Hyperion projects completed
Optimization improvements of more than 99%
Regular presenter at Hyperion‟s users‟ groups and solutions
conferences
If you like this presentation, we offer training!
Free weekly Thursday webcasts ([email protected])

Look Smarter Than You Are with Essbase
3 Essbase Books Available:
Complete Guide
System 9 Complete Guide
End User Guide
Find out more at
www.interrel.com
Search lulu.com for „Essbase‟ to
see all 3 books
Copyright © 2007, Hyperion. All rights reserved.3

Disclaimer
These slides represent the work and opinions of
the presenter and do not constitute official
positions of Oracle or any other organization.
This material has not been peer reviewed and is
presented here with the permission of the
presenter.
This material should not should not be reproduced
without the written permission of interRel
Consulting.

Agenda
The New Way – Introduction to CubeQuery
The Old Way
The Details – Walk Through the Setup and
Query Process
Comparison to Web Analysis
QA

CubeQuery
New connection method for Essbase databases
Introduced in 9.3.1
Much better than OLAPQuery

Olap Query vs. Cube Query
OLAP Query Cube Query
Pre 9.3 Available in 9.3
Slicer Filters
Side Rows
Top Columns
Filters from multiple members may be
selected and applied from a single
hierarchy
One filter member can be selected per
dimension (filters for multiple members
within the same dim are not supported)
Measures are treated as distinct
dimensions and can be placed on in the
Facts pane of the data layout
Measures can be in row, column, or filter
panes
Member selection in the data layout is
unavailable
Member selections in the Row, Column,
and Filter panes of the data layout can be
edited in the Member Selection dialog box
Short cut menu enables access to the Filter
dialog box and Remove option
Shortcut menu enables access to Remove
option, Member Selection dialog, Data Filter
option, Variable option and Filter option

Cube Query Requirements
Essbase 7x or 9x
Essbase 9.3 or greater runtime client

Create a Database Connection
Create database connection
Database connection file is a .oce file
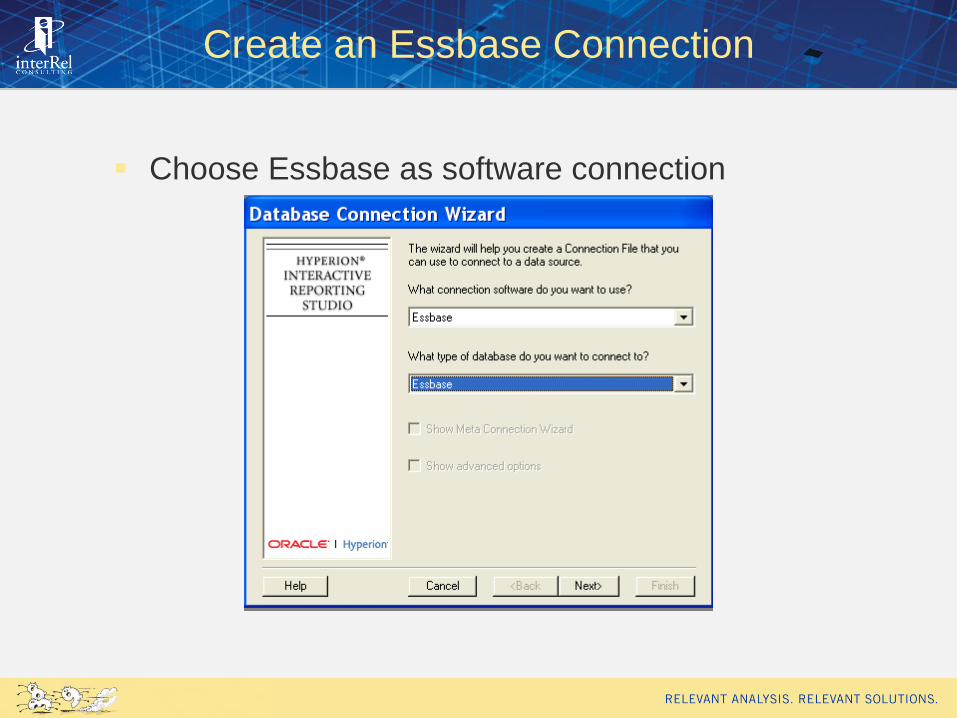
Create an Essbase Connection
Choose Essbase as software connection
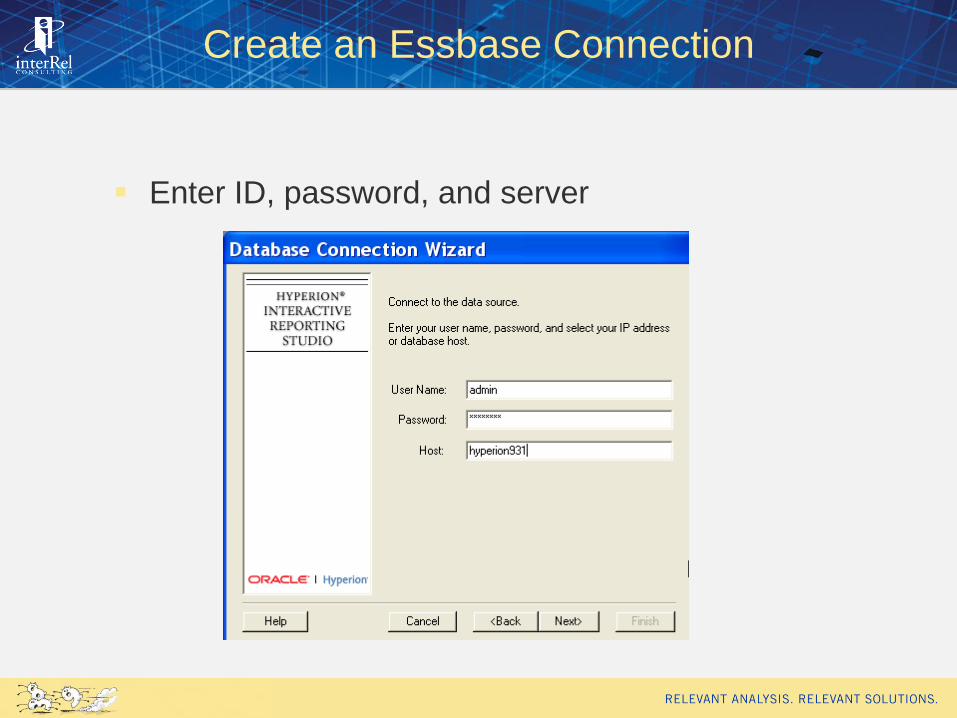
Create an Essbase Connection
Enter ID, password, and server

Create an Essbase Connection
Select the application and database

Choose an Measures Dimension
Select the Measures dimension
*This has important implications

Save the Database Connection
Save the OCE

Save the Database Connection
Save the OCE

Cube Query Window
CubeQuery section is the Interactive Reporting
interface with Essbase 7.x , and 9.x databases
Provides access to the cube in which
multidimensional data can be analyzed and
complex calculations can be applied before and
after the queries are processed
Resulting data set can be shown with relational
data side-by-side in a dashboard report, or
downloaded to a results set and joined to
relational sources
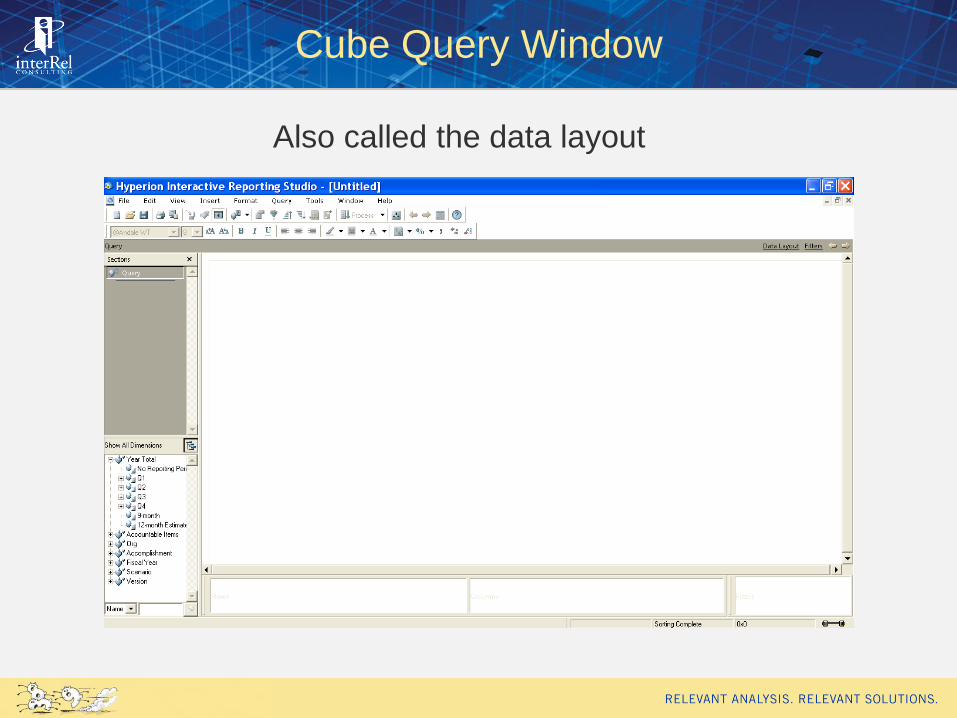
Cube Query Window
Also called the data layout
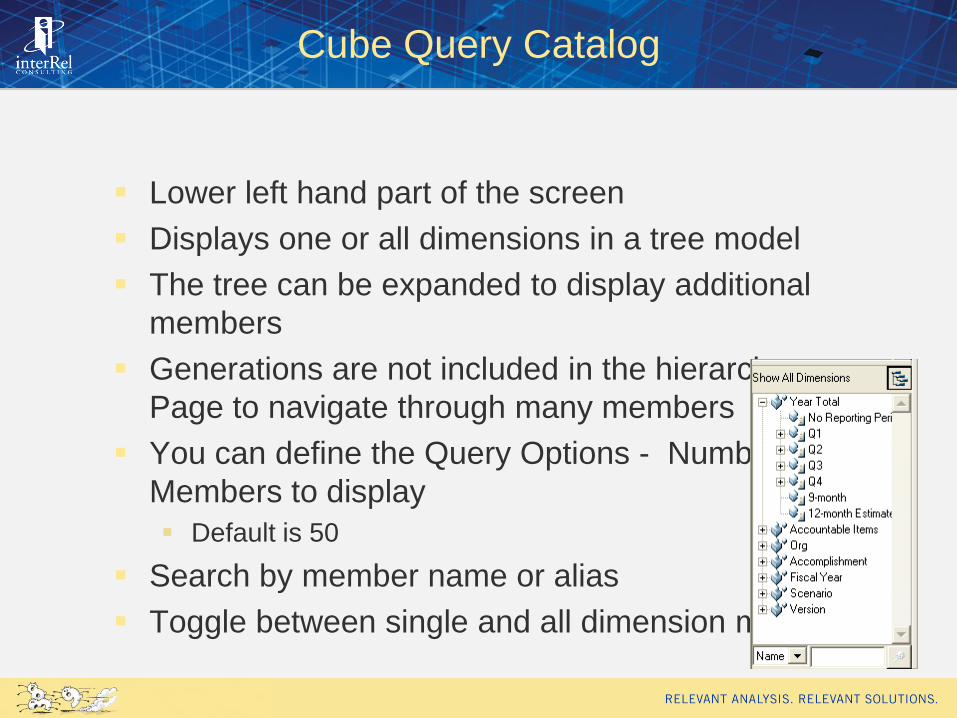
Cube Query Catalog
Lower left hand part of the screen
Displays one or all dimensions in a tree model
The tree can be expanded to display additional
members
Generations are not included in the hierarchy.
Page to navigate through many members
You can define the Query Options - Number of
Members to display
Default is 50
Search by member name or alias
Toggle between single and all dimension modes

Create a CubeQuery Section
Select Tools > Options > Program Options >
OLAP and clear “Use Old OLAP Query” section
CubeQuery is the default Essbase query type
Select Insert > New Query
Select an IR .oce file for the Essbase
application.database
Enter an ID and password and click OK
In the catalog, select a member dimension and
select Query > Add to Rows or Add to Columns
or Add to Filters
Click Process

Add to Columns

Add to Columns

Add to Rows

Add to Filters

Query Result
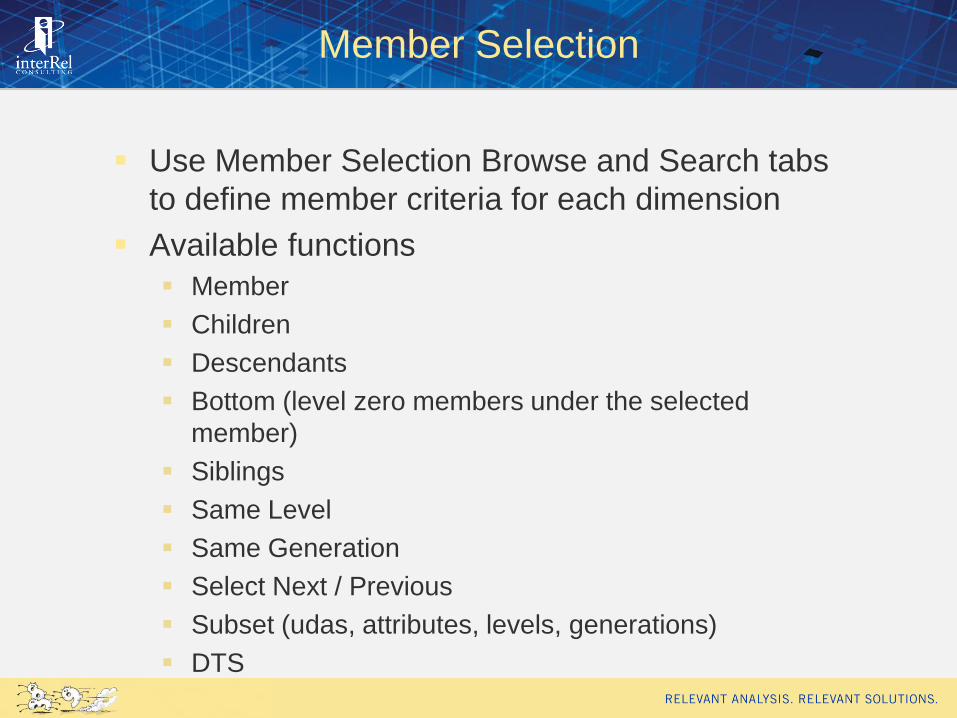
Member Selection
Use Member Selection Browse and Search tabs
to define member criteria for each dimension
Available functions
Member
Children
Descendants
Bottom (level zero members under the selected
member)
Siblings
Same Level
Same Generation
Select Next / Previous
Subset (udas, attributes, levels, generations)
DTS
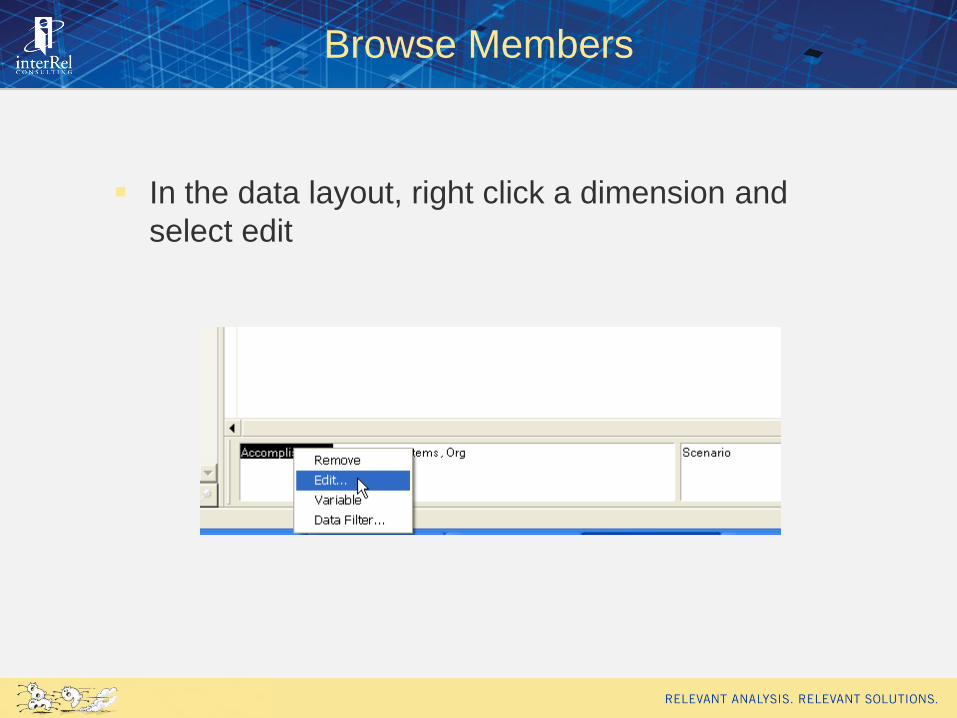
Browse Members
In the data layout, right click a dimension and
select edit

Member Selection
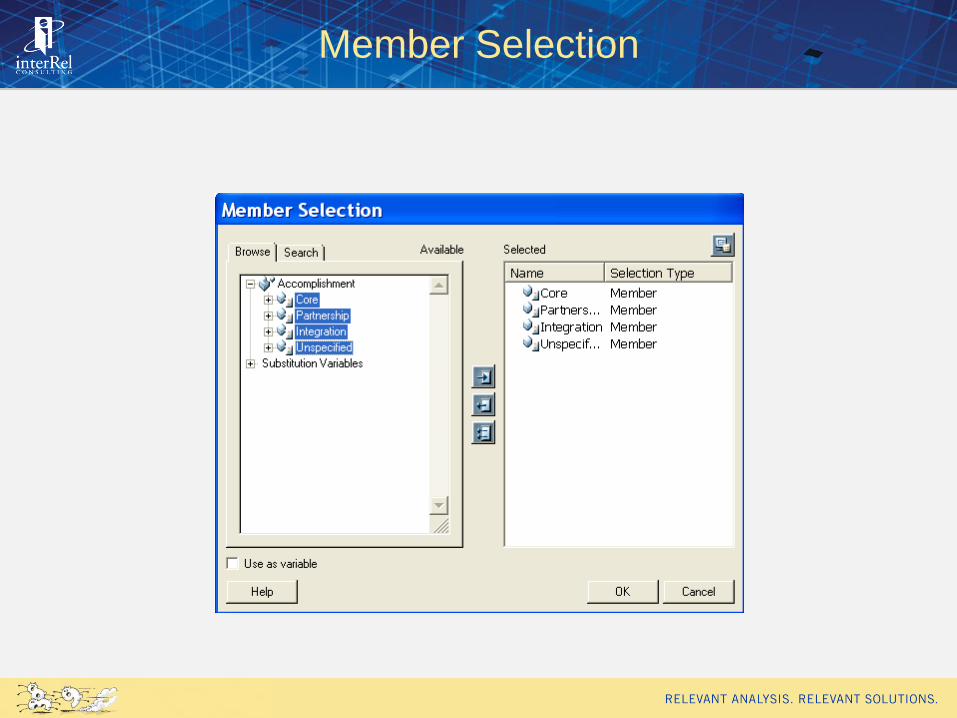
Member Selection

Member Selection

Member Search
Search tab by member name, alias or both
Use the * wildcard

Subsets

Subsets in Member Selection

DTS and CubeQuery
DTS members are predefined members for to
date reporting (YTD, MTD)
CubeQuery uses MDX to query Essbase and
MDX doesn‟t have the exact equivalent of DTS
functions
Combination of xTD and Sum functions are used
Watch out for those members with Two Pass and Time
Balance (order of calcs may not be right)
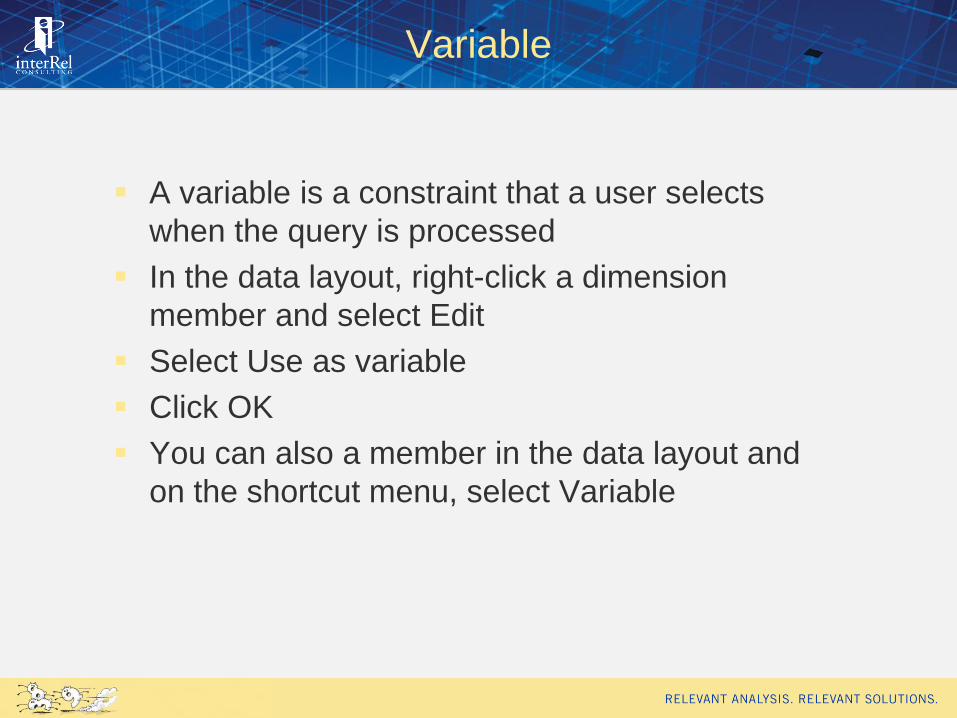
Variable
A variable is a constraint that a user selects
when the query is processed
In the data layout, right-click a dimension
member and select Edit
Select Use as variable
Click OK
You can also a member in the data layout and
on the shortcut menu, select Variable
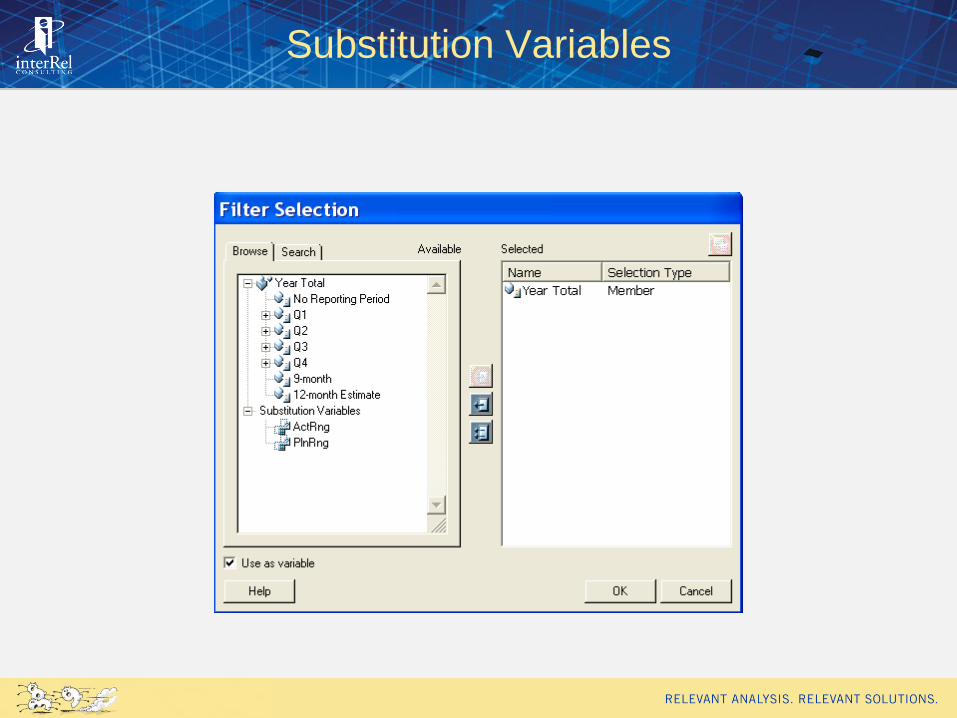
Substitution Variables

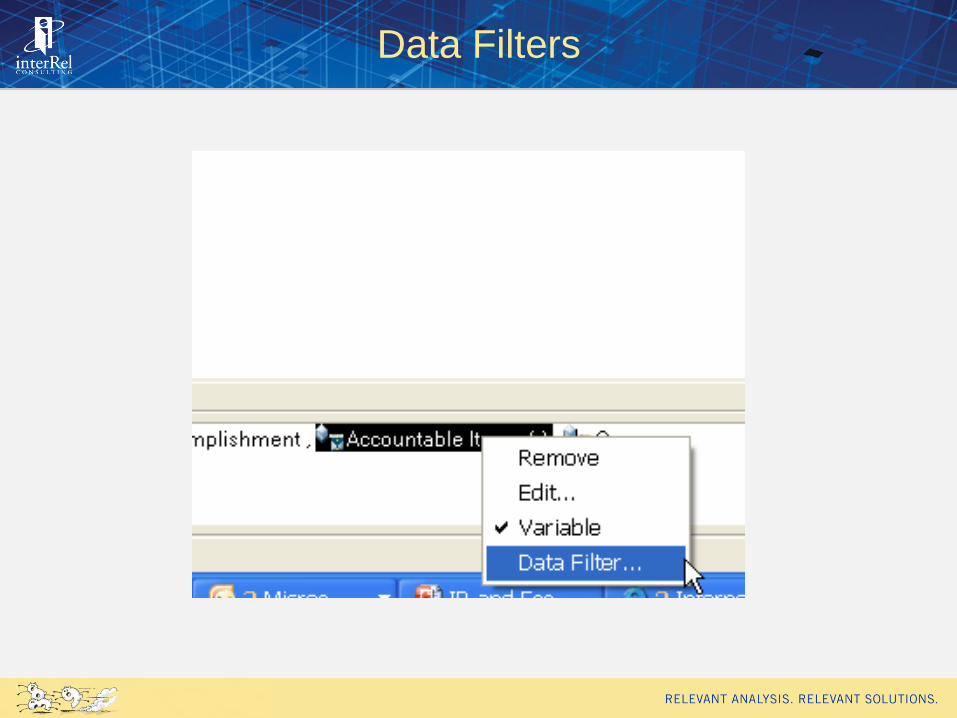
Data Filters
Limit data retrieved from the database
Applied on the server (not the client)
Filter data based on top or bottom values
Apply sorts to the data or metadata
Apply show / hide criteria
Used to create asymetric reports
Data Filters

Data Filters

Set Conditions
Available for Show/Hide feature of Data Filters
From the Where Pane of the Show/Hide definition, select
Value for dim member value
Click Condition
Select operator for comparison
=
<>
<
>
<+
>=
In the Edit box enter the numeric value
Click OK
Click the Arrow icon to add the conditioned value to the
selected pane
Click ok

Conditions

Persisting Data Filters
Data filters (Top/BottomN, Sort, or Hide/Show)
are persisted even after the members selected
for the data filter are no longer in the query.
As long as the overall dimension selections in
the data layout are not modified, the data filter
can still be applied.
Enables users to retain the data filter definition
even when the query is modified or rebuilt
If the dimension selections in the data layout are
changed and the data filter definition is not
removed or modified, the results set may not be
synchronized with what has been requested.

Persistent Data Filters
Prompt to remove or updated data filter
Leave – preserves the data filter regardless of
members that have been added or removed from the
query
Remove – remove the data filter
Update – launches the Data Filter dialog box
Sometimes a user is not prompted
Various drilling / analytic activies

Query Options
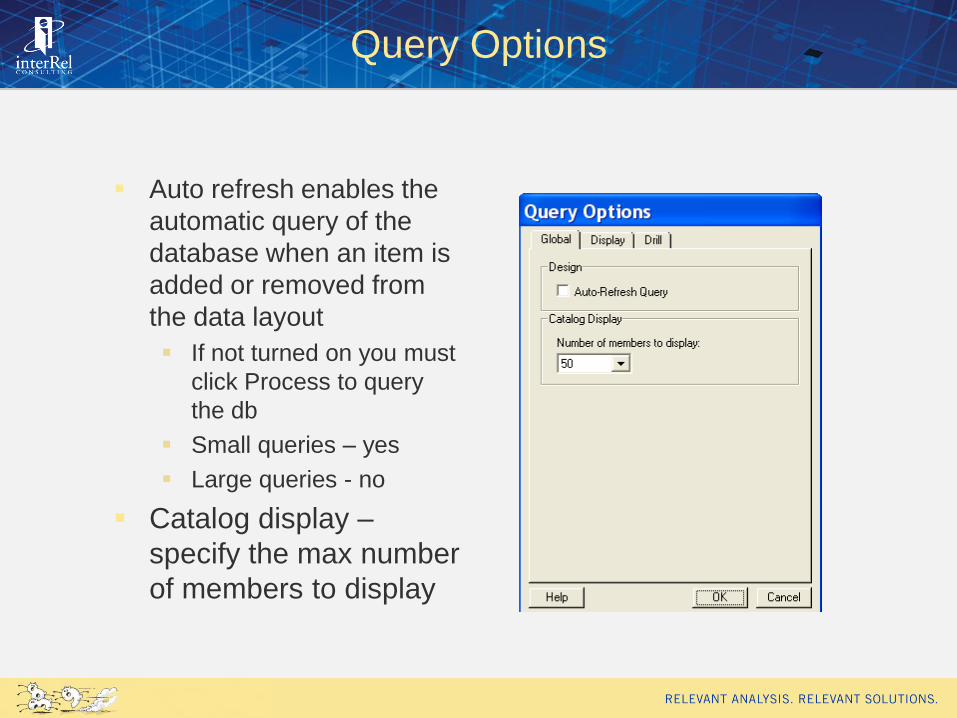
Query Options
Auto refresh enables the
automatic query of the
database when an item is
added or removed from
the data layout
If not turned on you must
click Process to query
the db
Small queries – yes
Large queries - no
Catalog display –
specify the max number
of members to display
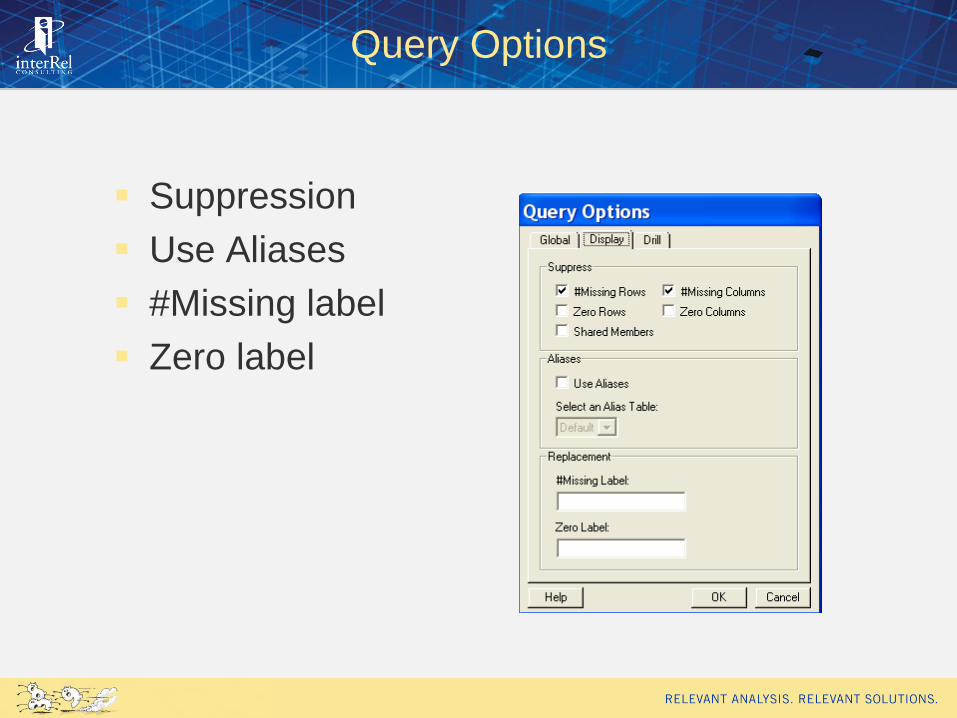
Query Options
Suppression
Use Aliases
#Missing label
Zero label
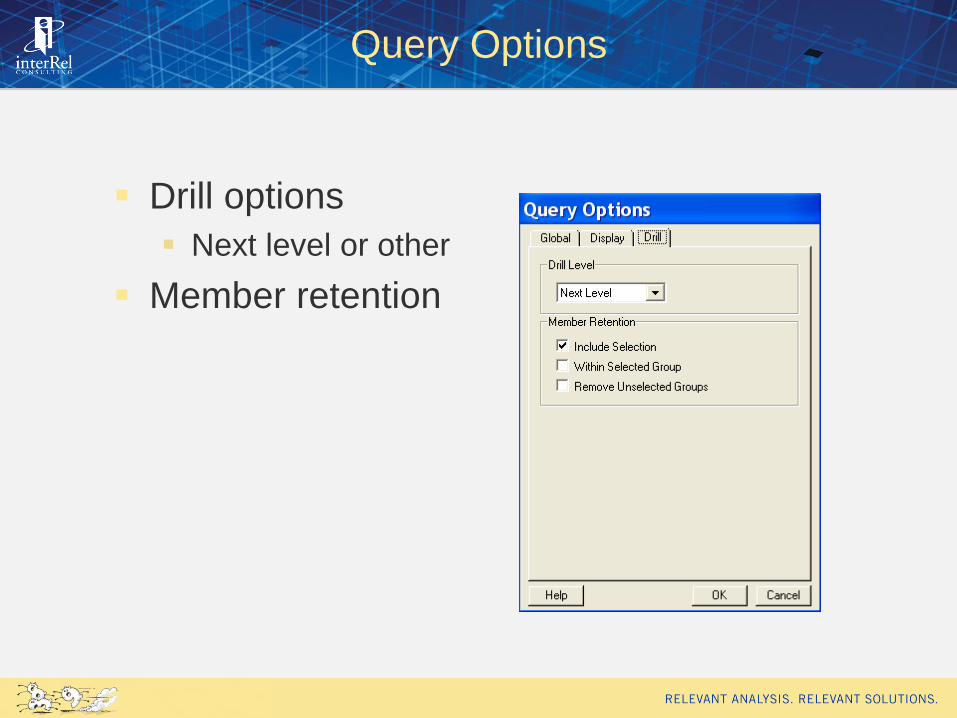
Query Options
Drill options
Next level or other
Member retention

Process Queries

Example

Navigating
Drill
Keep only
Remove only
Same Essbase functionality we know and love

Formatting Options
Font
Style
Number
Justify
Border
Auto-Size Width
Auto-Size Height
Corner Labels
Spotlighter (same as traffic lighting in WA)
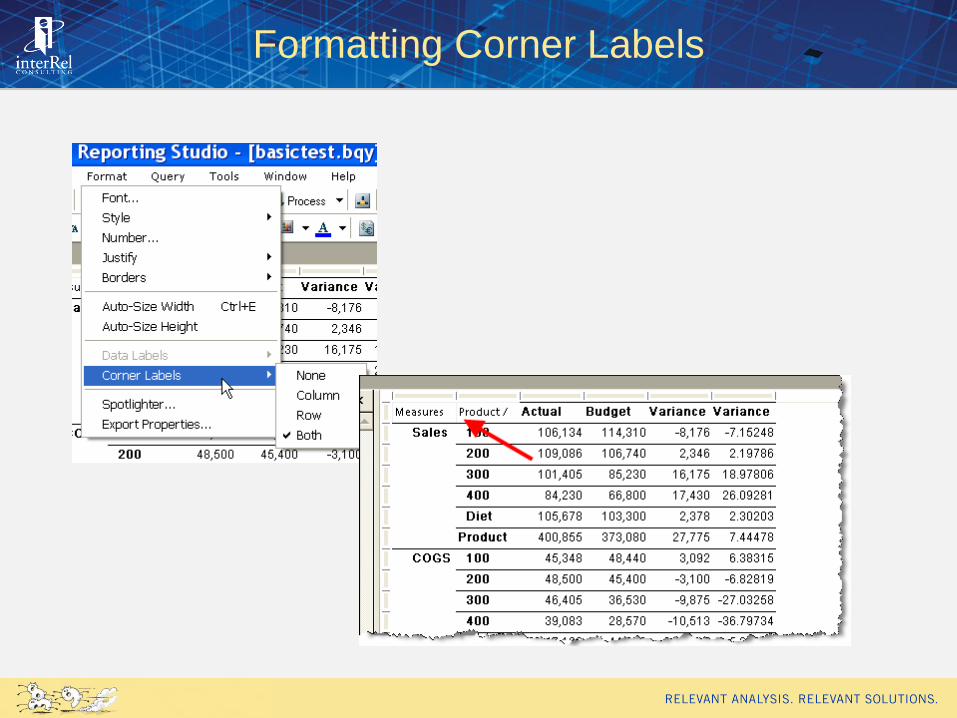
Formatting Corner Labels

Spotlighter

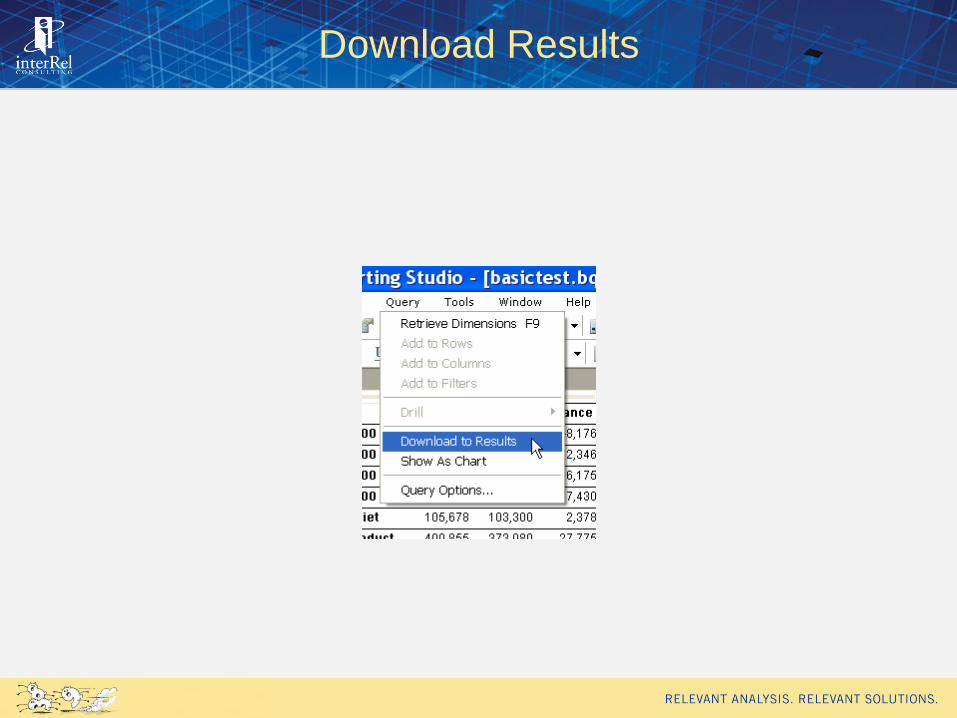
Download Results
Render flat table representation of multi-
dimensional Essbase
Result section can be used for further analysis,
report creation, and joining with data from
relational sources
Once in result section, processing is done on the IR
side (not Essbase)
Results are only updated when you select the
Download to Results feature or when you
process results again
Consider Auto Generate results for small queries
Download Results

Download Results

Downloaded Results (Flat view)
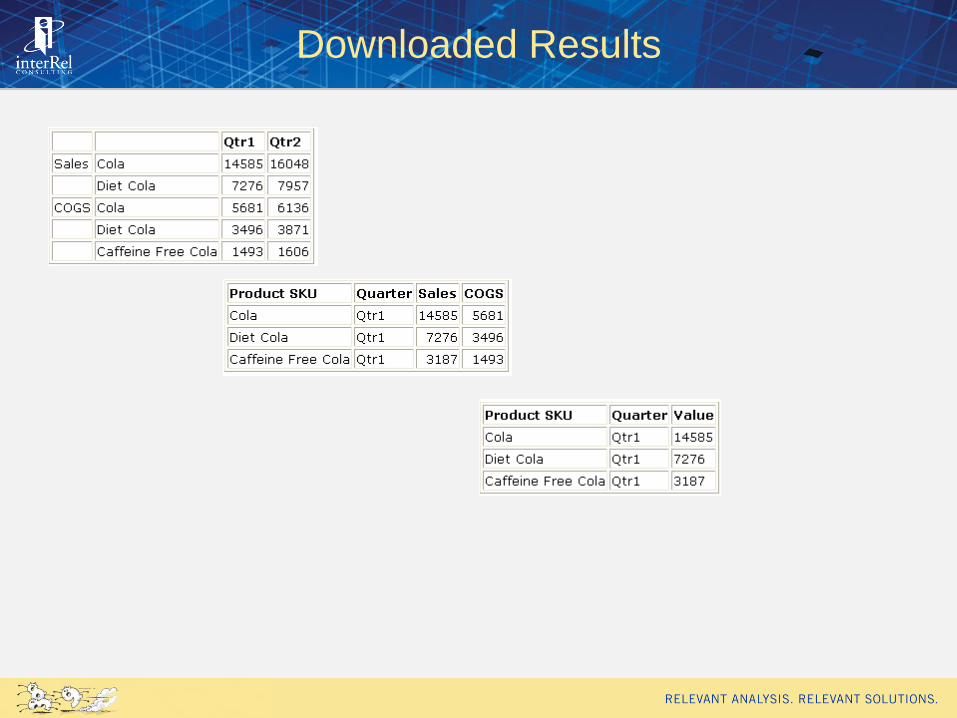
Downloaded Results
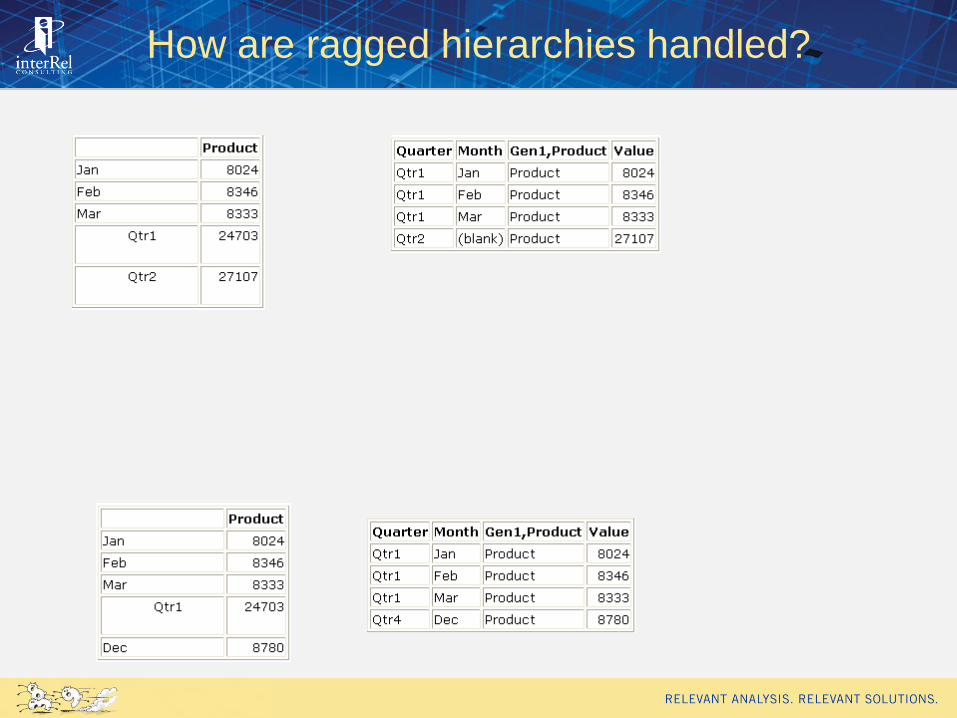
How are ragged hierarchies handled?

Creating Charts
Select Query > Show As Chart

Pivot – Accounts as Facts

Can Measures go down my rows?
No – Not if Measures is defined as the Accounts dimension

Can Measures Go Down my Rows?
You have to define another oce and define
another dimension as the Measures dimension
This will be required if you are creating reports
with Essbase data
If you are using Dashboards only, then you can
insert the Essbase query into the dashboard

Essbase Queries in IR
One big query?
Many smaller queries?
Depends on what you need for dashboards
If you are only rolling out controlled dashboards with no
analytics or true adhoc analysis, then you can create
the specific queries you need for the dashboard
Depends on privileges you give end users
If you users need to perform adhoc analysis and
advanced analytics, then you need to consider if they
can create new queries or if they are limited to working
in predefined queries

WITH A COMPARISON TO
WEB ANALYSIS
The End User Perspective – Interactive Reporting and Essbase

The End User Perspective
In most cases, you aren‟t going to rollout the IR
Studio to your mass of users
So what can IR end users do via the web?
For basic drilling or other analytic capability, use
HTML or IR web client
To modify the query, use the Interactive
Reporting web client

Open As…

IR Drill Options

Web Analysis Drill Options

Member Selection in IR

Member Selection in WA
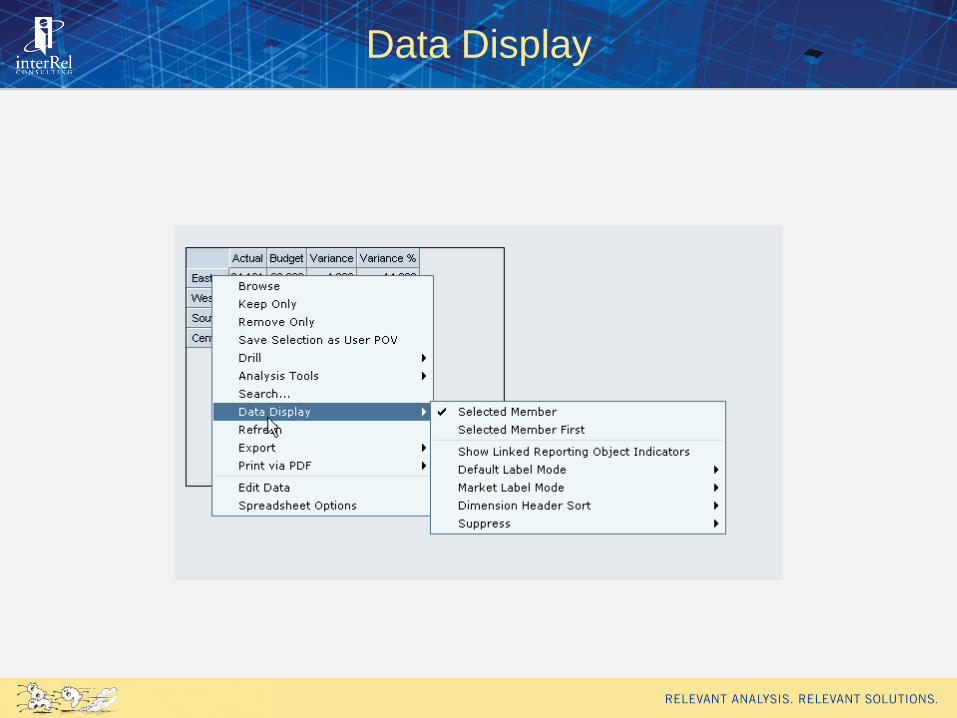
Data Display

Data Display Options
End User Capabilities – IR Web Client
Users can drill down and perform analysis in
Essbase
If the correct privileges are assigned, users can
make changes to the query
As long as the query is not saved to the
repository, then the main source query will not
be changed
Users can save their personal queries locally
If the correct privileges are assigned, they can
save their personal queries to the workspace as
well

Edit Permissions
To assign privileges, go to the properties of the
BQY
Select Edit permissions
Depending on your requirements, you will want
to set access to file and adaptive state
accordingly
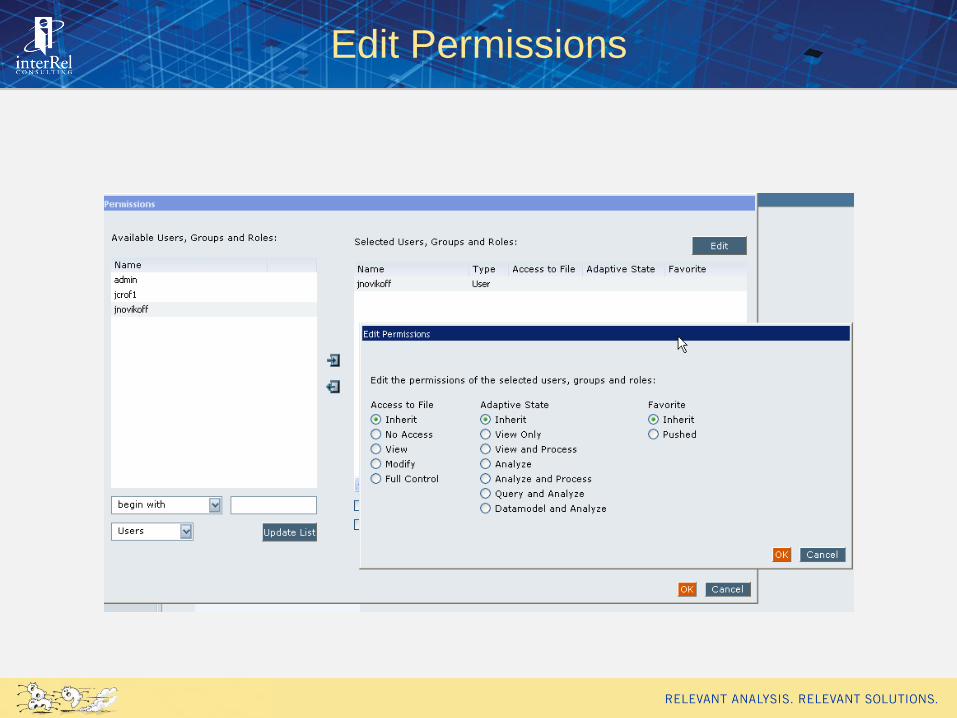
Edit Permissions

Edit Permissions
How you set permissions in Essbase queries
may differ in how you set permissions in
relational queries

Advanced Analytics IR vs. WA
WA Studio WA
Workspace
IR Studio IR Web
Client
IR HTML
Basic
Drilling
Yes Yes Yes Yes Yes
Swap Rows
and
Columns
Yes Yes Yes Yes No
Client install Required first
the first time
No install
necessary
Client
application
Required the
first time
No install
necessary
Adhoc
Query
Yes Yes Yes Yes No
Member
Selection
High High Medium Medium None
Traffic
Lighting
Yes Yes Yes – Called
Spotlighter
Yes – Called
Spotlighter
No
Formatting /
Presentation
Yes Yes Yes Yes No
Save
Personal
Queries
Yes Yes Yes Yes No

WITH A COMPARISON TO
WEB ANALYSIS
Essbase & Dashboards in Interactive Reporting

Reports vs. Dashboards
Reports
Offer greater flexibility in filtering (right click)
True analytics like drill down and swap rows and
columns
For analysts and power users
Dashboards
Guided user process
Allow radio buttons, drop downs
For execs and higher up managers or for novice, basic
users
Essbase and IR Reports
You can pull Essbase and relational data
together into one report
You cannot pull the Essbase query into the
report
You can pull Essbase query resulting options like
tables, pivots or charts into reports
You cannot add drop downs or other objects for
filtering across the two types of queries
That‟s where you create a dashboard

Essbase and IR Reports

Essbase and IR Dashboards
You can incorporate Essbase data into
dashboards just like any other query
You can pull the Essbase query itself on to the
dashboard or any other resulting objects
Although the Essbase analytic functions are not
available
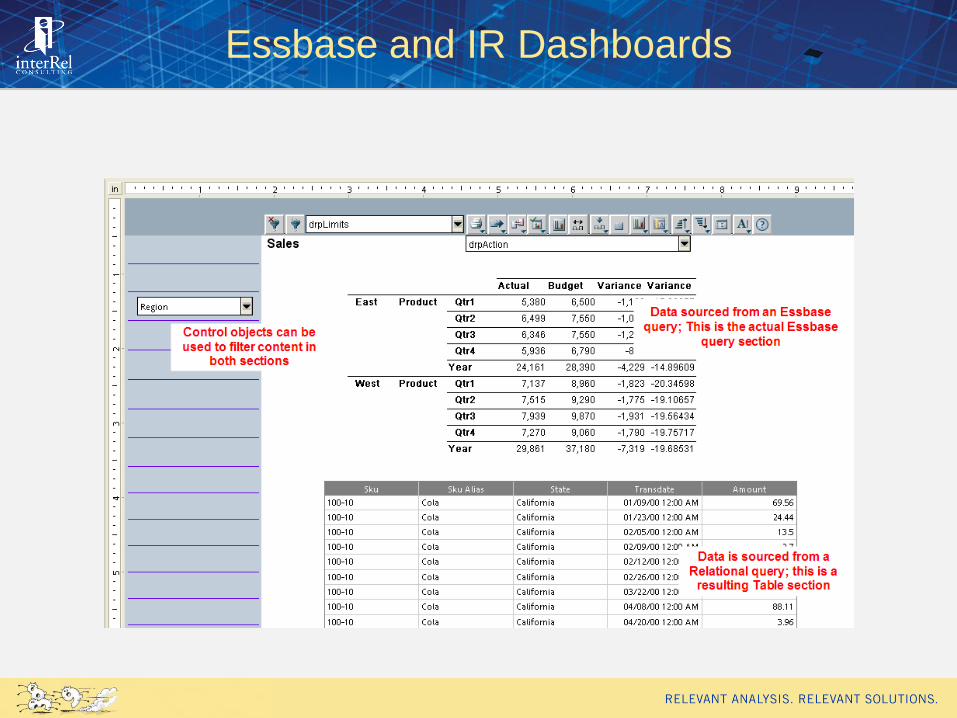
Essbase and IR Dashboards
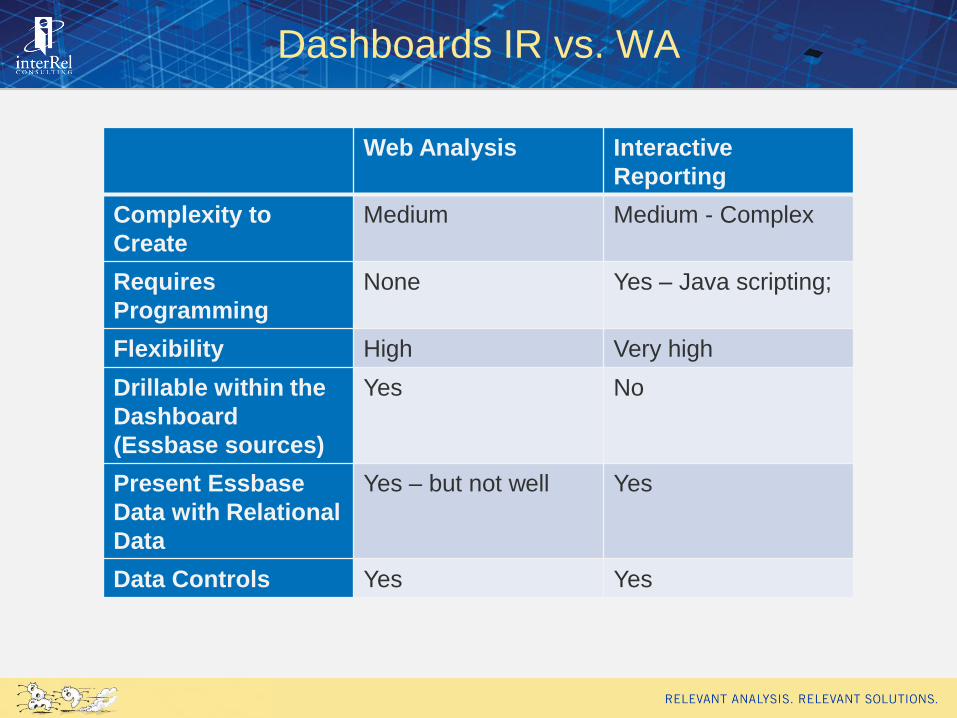
Dashboards IR vs. WA
Web Analysis Interactive
Reporting
Complexity to
Create
Medium Medium - Complex
Requires
Programming
None Yes – Java scripting;
Flexibility High Very high
Drillable within the
Dashboard
(Essbase sources)
Yes No
Present Essbase
Data with Relational
Data
Yes – but not well Yes
Data Controls Yes Yes

So if I‟m evaluation Web Analysis and Interactive Reporting, which
one?

Web Analysis vs. Interactive Reporting
Not really one right answer…
Technically you could use both but…
IR requires Java Scripting knowledge for creating and
maintaining dashboards
Learning curve for both products (similar concepts but
steps and design considerations are completely
different)
Web Analysis if you are only reporting on
Essbase
Interactive Reporting if you report against
relational sources
Interactive Reporting if you report against
Essbase and relational sources in the same
report or dashboard

Web Analysis vs. Interactive Reporting
Web Analysis if you don‟t have any technical
resources available / programmers
Web Analysis is easier to learn for administrators
No Java Scripting or “coding” required
From an end user perspective, you will want
users to report against Essbase in one of the
tools – either WA or IR
Don‟t have them try to learn both
IR and WA have the same functionality for the most
part (there may be a few more features in WA)
So then why not just use IR? Back to the note on
Dashboard building… more complex

The Future?

Future 11g
The Future
Answers
Dashboards
Reporting and Publishing (SQR & BI Publisher)
Delivers
Smart View
Financial Reporting (will continue to be supported)
Supported with Limited Enhancements
Interactive Reporting
Web Analysis
Compelled to move to Answers and Dashboards
Think Excel Add-in vs. Smart View
*11g coming next year sometime
Some items shown in the next slides are available today
89
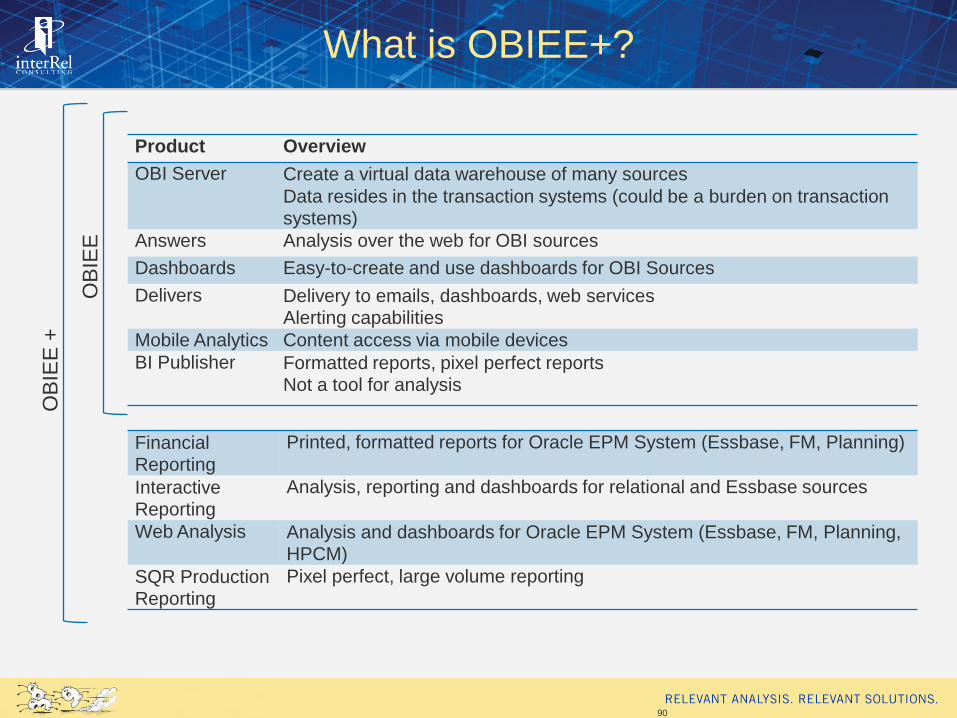
What is OBIEE+?
90
Product Overview
OBI Server Create a virtual data warehouse of many sources
Data resides in the transaction systems (could be a burden on transaction systems)
Answers Analysis over the web for OBI sources
Dashboards Easy-to-create and use dashboards for OBI Sources
Delivers Delivery to emails, dashboards, web servicesAlerting capabilities
Mobile Analytics Content access via mobile devices
BI Publisher Formatted reports, pixel perfect reportsNot a tool for analysis
Financial Reporting
Printed, formatted reports for Oracle EPM System (Essbase, FM, Planning)
Interactive Reporting
Analysis, reporting and dashboards for relational and Essbase sources
Web Analysis Analysis and dashboards for Oracle EPM System (Essbase, FM, Planning, HPCM)
SQR Production Reporting
Pixel perfect, large volume reporting
OB
IEE
OB
IEE
+

OBI Server
Provides integration of many
sources
Intelligent caching services
Intelligent request generation
and optimized data access
services
Three layers
Physical
Business Model /Mapping
Presentation
91
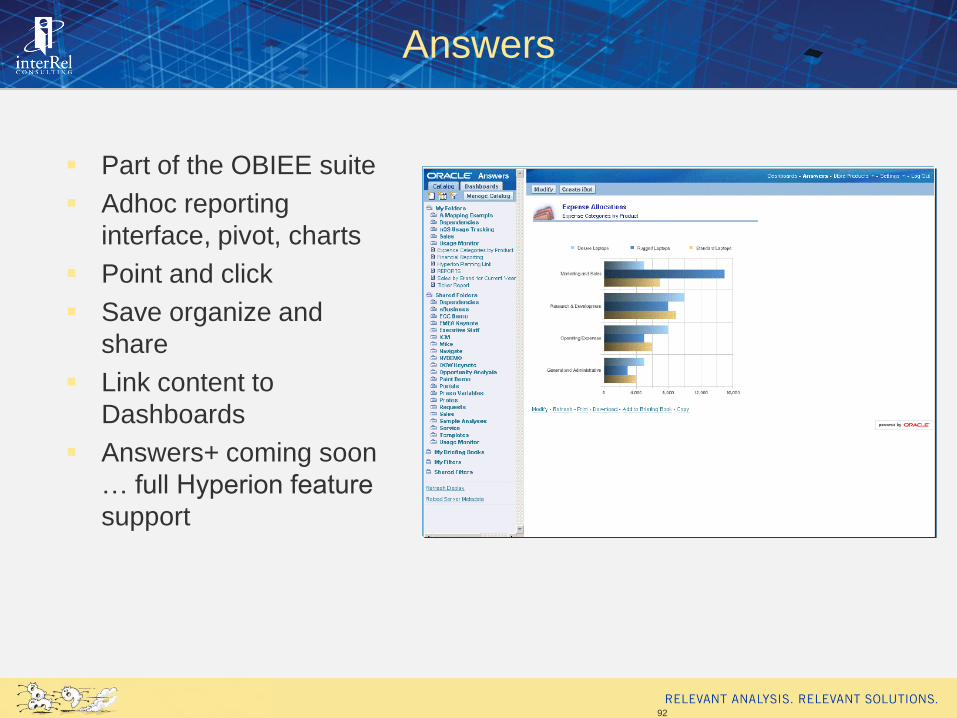
Answers
Part of the OBIEE suite
Adhoc reporting
interface, pivot, charts
Point and click
Save organize and
share
Link content to
Dashboards
Answers+ coming soon
… full Hyperion feature
support
92

Dashboards
Part of the OBIEE suite
Fully interactive
graphical dashboards
Real time data across
enterprise sources
Point and click to
create and use
Guided analytics –
intelligent links to aid
users in their
investigations
Dashboards+ coming
soon … full Hyperion
feature support
93

Hmm… Many tools that do the same
thing?
OBI Server – Answers – Dashboards vs. IR and
WA?
OBI Server vs Essbase?
Future direction
Answers and Dashboards
Publisher
94

Comparing OBIEE to Interactive
Reporting TODAY
OBIEE Interactive Reporting
Components OBI Server / Answers /
Dashboards
Interactive Reporting
(Data models, BQY,
clients
Foundation / “Virtual
Schemas”
OBI Server
Awesome
IR Data Model
Good
Relational Reporting Strong Strong
Static Essbase
Reporting
Strong Strong
Analytic Essbase
Reporting?
Not available Yes, with CubeQuery
introduced in 9.3.1
End user perspective –
Dashboards
Strong Strong
Dashboard creation Easy Difficult (scripting
required
Integration with
Workspace
Yes Yes
Future Yes No
95
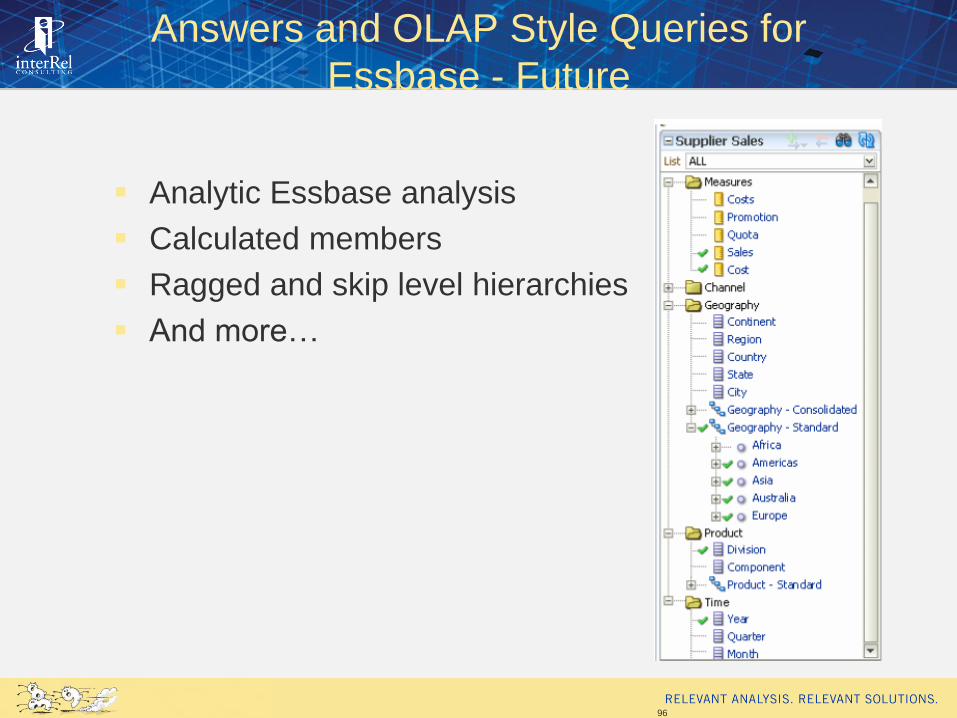
Answers and OLAP Style Queries for
Essbase - Future
Analytic Essbase analysis
Calculated members
Ragged and skip level hierarchies
And more…
96
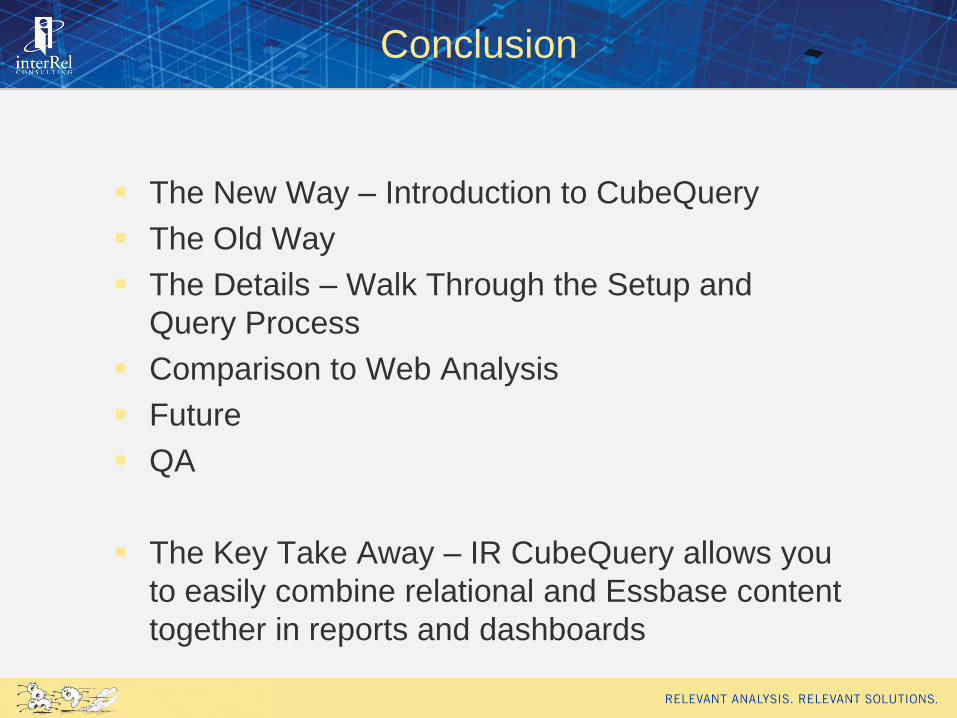
Conclusion
The New Way – Introduction to CubeQuery
The Old Way
The Details – Walk Through the Setup and
Query Process
Comparison to Web Analysis
Future
QA
The Key Take Away – IR CubeQuery allows you
to easily combine relational and Essbase content
together in reports and dashboards


99
Upcoming HPCM Events
Solutions Road Trip to Dallas
Tuesday, December 16th
Breakfast Briefings with Live Demo
Tuesday, January 21st in Dallas, Texas
Wednesday, January 22nd in Houston, Texas
For more information on these events, please
contact Danielle White at
QUESTIONS AND ANSWERS
Tracy McMullen
interRel Consulting
Looksmarter.blogspot.com