Inter-decadal trends in the annual cycles of atmospheric CO2 at Mauna Loa
9
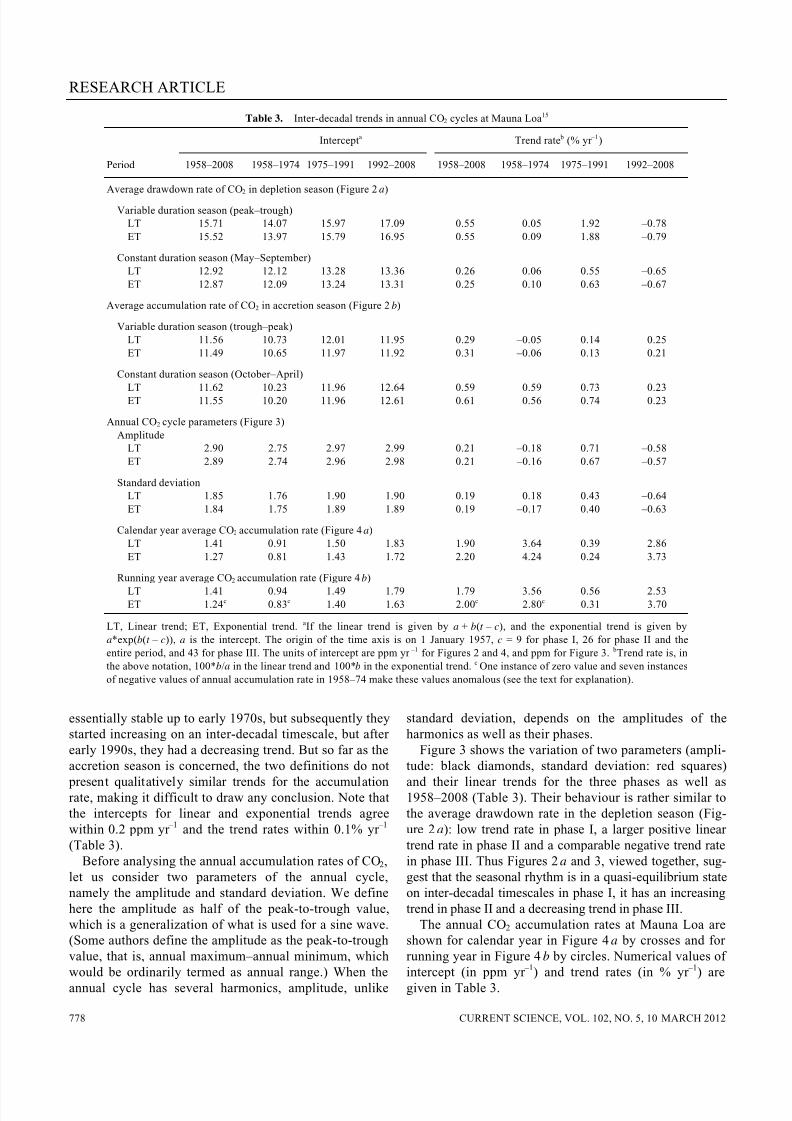
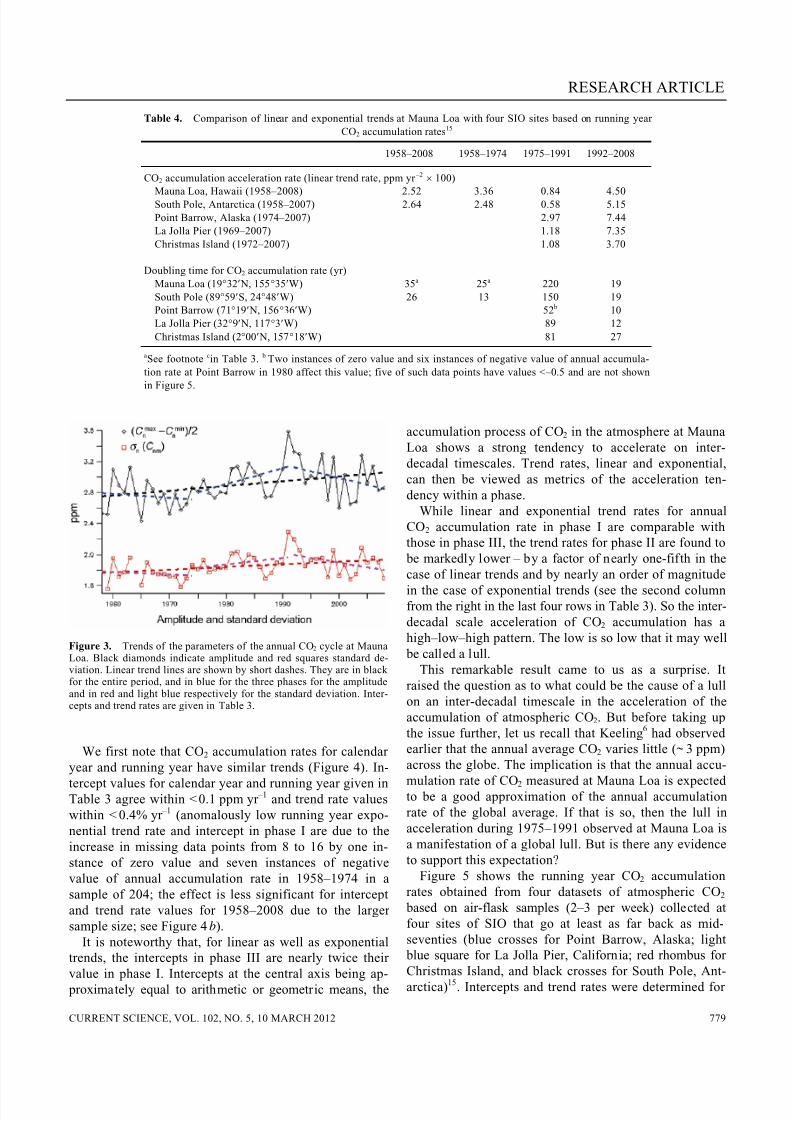
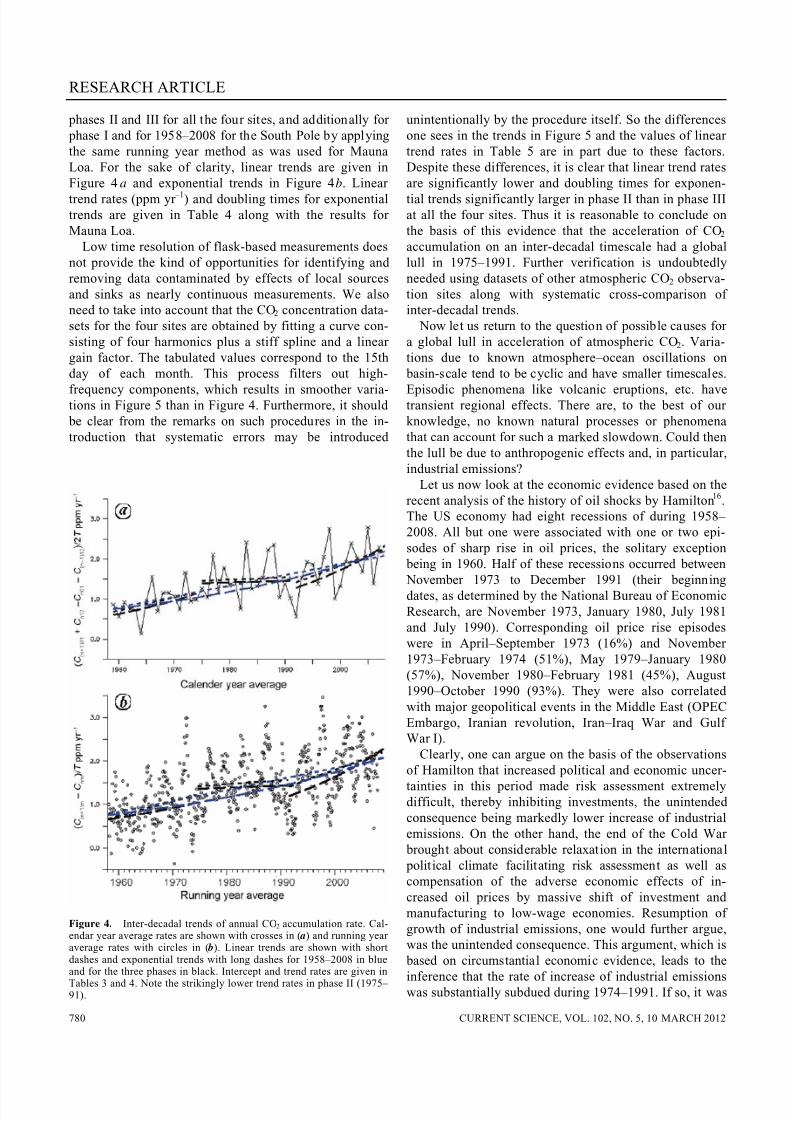
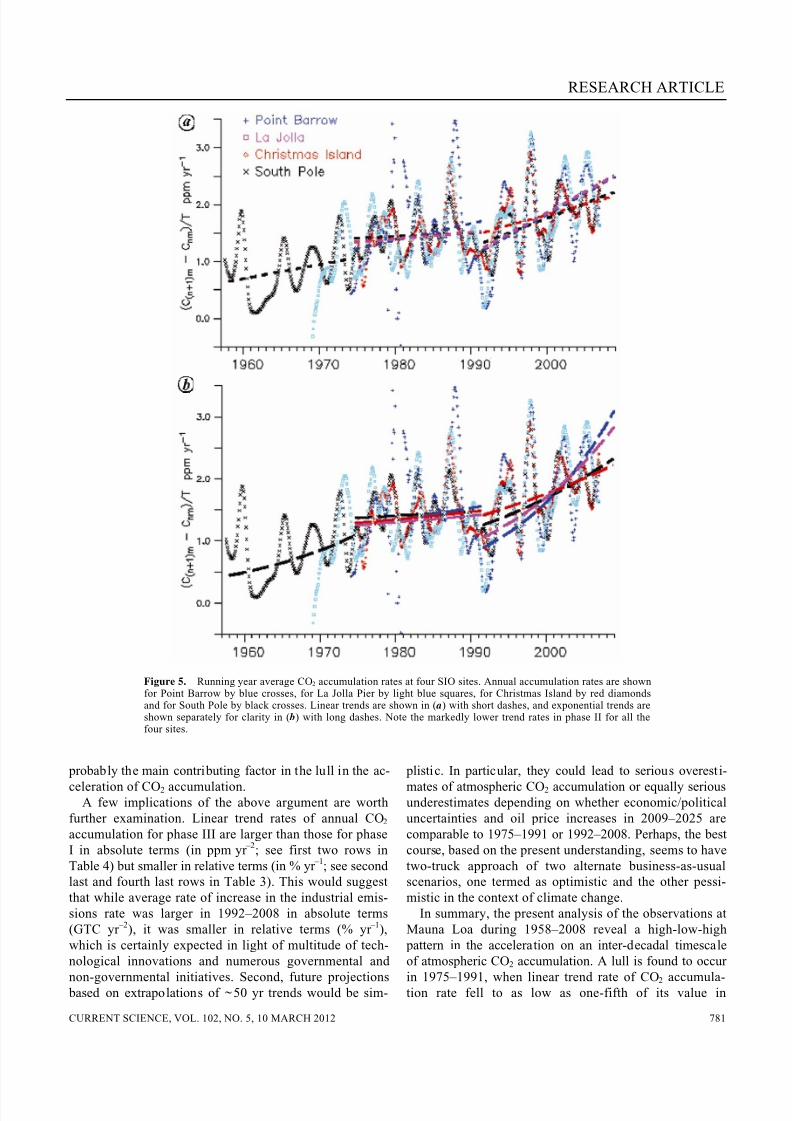
RESEARCH ARTICLE CURRENT SCIENCE, VOL. 102, NO. 5, 10 MARCH 2012 774 *For correspondence. (e-mail: [email protected]) Inter-decadal trends in the annual cycles of atmospheric CO 2 at Mauna Loa K. S. Yajnik* and P. S. Swathi CSIR Centre for Mathematical Modelling and Computer Simulation, NAL Belur Campus, Wind Tunnel Road, Bangalore 560 037, India Cyclical rise and fall of monthly mean CO 2 concentra- tion occurred rather regularly at Mauna Loa, Hawaii, USA, during 1958–2008, with peaks occurring in April or May followed by troughs in September or October. However, the frequency of troughs in September in- creased from 32% in 1958–1974 to 82% in 1992–2008 and the depletion season correspondingly decreased from 4.8 months on average to 4.2 months. Does this seemingly small change in the seasonal rhythm point to changes on an inter-decadal scale in the CO 2 accu- mulation rates? This question is studied here by exam- ining linear and exponential trends of seasonal and annual CO 2 accumulation rates in three equal phases (1958–1974, 1975–1991 and 1992–2008). We also dis- cuss tre nds of average accumulation rates in the accre- tion and depletion seasons, and of the amplitude and standard deviation of the annual CO 2 cycles at Mauna Loa, which can be viewed as representative of the North Central Tropical Pacific. Keywords: Annual cycles, atmospheric carbon dioxide, industrial emissions, inter-decadal trend. THE time series record of atmospheric CO 2 observations at Mauna Loa (19.5N, 155.6W; 3397 m; Mauna Loa (MLO), Hawaii), has long served as a focal element in most of the quantitative inferences on the secular increase of atmospheric CO 2 and associated variations of CO 2 fluxes. In its first decade, it provided direct evidence of secular increase and a seasonal variation, whose ampli- tude increases with latitude 1,2 . Observations in the subse- quent decades along with isotopic measurements showed the seasonal CO 2 cycle to be closely correlated with ter- restrial vegetation cycle in the northern hemisphere, and the long-term annual increase to be correlated with indus- trial CO 2 emissions. Indeed it was inferred that vegetation activity had increased peak to trough variation of sea- sonal change between 1964 and 1994 by ~ 20% (ref. 3). Also, extreme values of annual CO 2 increase variations were found to be correlated with El Nino events and vol- canic eruptions 4 . Furthermore, quantitative inferences from the observational records have been used for devel- oping a three-dimensional atmospheric model for CO 2 transport and, in more recent times, in developing inverse methods for determining regional carbon emissions from CO 2 measurements at a global network of observational sites 5 . It would not be an exaggeration to say that the Mauna Loa record has been the cornerstone in shaping the present knowledge of the carbon cycle. Nearly contin uous CO 2 measurements at Mauna Loa carried out by the Scripps Institution of Oceanography (SIO), USA, are based on absorption of infrared light from a dried sample of air drawn from a location upwind of the laboratory. Use of frequent calibration with work- ing standard gases ensures accuracy and reliability. Remoteness of the site assures a priori that the effects of vegetation and human activities are minimal. But upwind effects of distant sources do occur in the afternoon and downwind effects in the late evening. Contamination effects also occur during local volcanic eruptions. Proto- cols have been devised, and tested repeatedly, to exclude measurements contaminated by local disturbances from the sample used for determining first daily average and subsequently monthly average 2,6,7 . Working standard gases have been calibrated repeatedly over time with primary standard gases maintained in the SOI Standards Labora- tory. These exercises have led to several corrections for drift in calibration 8 . Numerous back-up studies on identi- fication and elimination of systematic errors and calibra- tion errors have enhanced confidence in the monthly mean record, which has a resolution of 0.01 ppm and an estimated accuracy/imprecision about 0.1 ppm, as the quantitative indicator of the state of large mixed air masses above the planetary boundary layer in the North Central Pacific 6 . When one deals with a dataset obtained over ~ 50 years, it is but natural to wonder about possible errors arising from various sources such as transition from analogue to digital instruments and from manual to automatic data processing, and evolutionary changes in calibration and other protocols. Some indication can be obtained from comparison with nondispersive infrared measurements carried out at Mauna Loa by the National Oceanographic and Atmospheric Administration (NOAA, USA), using instruments and data-analysis procedures that are distinct from SIO. Corresponding monthly mean CO 2 values of the NOAA and SIO datasets over 1974– 1985 were found to differ on average by 0.15 ppm, with a standard deviation of 0.18 ppm (ref. 9). The overall strategy of data analysis adopted by Keeling and co-workers is to suppress diurnal cycle for obtaining data representative of a broad area and to consider
Transcript of Inter-decadal trends in the annual cycles of atmospheric CO2 at Mauna Loa
8/12/2019 Inter-decadal trends in the annual cycles of atmospheric CO2 at Mauna Loa
http://slidepdf.com/reader/full/inter-decadal-trends-in-the-annual-cycles-of-atmospheric-co2-at-mauna-loa 1/9
8/12/2019 Inter-decadal trends in the annual cycles of atmospheric CO2 at Mauna Loa
http://slidepdf.com/reader/full/inter-decadal-trends-in-the-annual-cycles-of-atmospheric-co2-at-mauna-loa 2/9
8/12/2019 Inter-decadal trends in the annual cycles of atmospheric CO2 at Mauna Loa
http://slidepdf.com/reader/full/inter-decadal-trends-in-the-annual-cycles-of-atmospheric-co2-at-mauna-loa 3/9
8/12/2019 Inter-decadal trends in the annual cycles of atmospheric CO2 at Mauna Loa
http://slidepdf.com/reader/full/inter-decadal-trends-in-the-annual-cycles-of-atmospheric-co2-at-mauna-loa 4/9
8/12/2019 Inter-decadal trends in the annual cycles of atmospheric CO2 at Mauna Loa
http://slidepdf.com/reader/full/inter-decadal-trends-in-the-annual-cycles-of-atmospheric-co2-at-mauna-loa 5/9
8/12/2019 Inter-decadal trends in the annual cycles of atmospheric CO2 at Mauna Loa
http://slidepdf.com/reader/full/inter-decadal-trends-in-the-annual-cycles-of-atmospheric-co2-at-mauna-loa 6/9
8/12/2019 Inter-decadal trends in the annual cycles of atmospheric CO2 at Mauna Loa
http://slidepdf.com/reader/full/inter-decadal-trends-in-the-annual-cycles-of-atmospheric-co2-at-mauna-loa 7/9
8/12/2019 Inter-decadal trends in the annual cycles of atmospheric CO2 at Mauna Loa
http://slidepdf.com/reader/full/inter-decadal-trends-in-the-annual-cycles-of-atmospheric-co2-at-mauna-loa 8/9
8/12/2019 Inter-decadal trends in the annual cycles of atmospheric CO2 at Mauna Loa
http://slidepdf.com/reader/full/inter-decadal-trends-in-the-annual-cycles-of-atmospheric-co2-at-mauna-loa 9/9