Intensive Training Course on Microplanning and School...
154
Intensive training course on microplanning and school mapping Report Omdurman, Democratic Republic of Sudan 8-26 January 1983 International Institute for Educatbnal Planning (established within the framework of Unesco) In collaboration with the Ministry of Educatbn and Guidance, Sudan
Transcript of Intensive Training Course on Microplanning and School...

Intensive training course on microplanning and school mapping
Report
Omdurman, Democratic Republic of Sudan
8-26 January 1983
International Institute for Educatbnal Planning (established within the framework of Unesco)
In collaboration with the Ministry of Educatbn and Guidance, Sudan

Intensive training course on microplanning and school mapping
.A
Unesdoc
Document partially illegible

HS ^ 4 ^ 4Wk^ HAI
Intensive training course on microplanning and school mapping
/ \ I (\ V[> Í • / / \ M I» f\ • :i I / WWUM^vr>f\«Jc M W va.v-.a / -üduüjL M ; mo j í oJbW. vU/¡ M.f î
V • k*n 3
1
1 Report / (XJX*AAVAA<\ U S J U A . U ^
by H. Hajjar u, iv
\ ltP/lTC^(D
HEP DOCUMENTATION I IPE
017543000001
Internat ional Inst i tute for Educational P lanning (established within the f ramework of Unesco)
In col laborat ion with the Minis t ry of Education and Guidance, Sudan

Acknowledgement
The Federa l Republic of Germany provided a financial contribution for the organisation of this intensive training course .
Composition and make-up by HEP 7-9, rue Eu gène-Delacroix, 75116 Par i s May 1983
c) Unesco 1983

1.
TABLE OF CONTENTS
Page
Part I INTRODUCTION 1
Part II TEACHING MATERIALS : THE INTRODUCTION OF SCHOOL 9 MAPPING AND MICROPLANNING IN THE WHITE NILE PROVINCE - SUDAN
Annexes
I. Closing speech by the Sudanese Minister of 115 Education and Guidance
II. General information on the intensive course on 118 microplanning and school mapping, Sudan, 8-26 January 1983
III. List of participants 123
IV. Detailed programme 124
V. Evaluation questionnaire 127
VI. Questionnaire for surveying primary and 132-153 intermediate schools

PART I
INTRODUCTION

1.
INTRODUCTION
After two decades of educational planning practices, the hopes
placed in the development of education have not been fulfilled, or nave
been partly realized. The rapid growth in enrolments at all levels of
education have not led automatically to a reduction of social inequalities
nor even of purely educational inequalities. Educational objectives have
not been implemented in many cases and scarce available resources have
not oeen used in the most efficient way. Finally, education is often
accused of being irrelevant to the needs of local communities and to
development.
Many reasons could explain this state of affairs. Apart sometimes
from the lack of political commitment to alter tne situation and to change
it, certain shortcomings in the methodology of educational planning done
only at the central level and moulded in a uniform and general setting
nave often been underlined as being partly responsible for tnese results.
These shortcomings are:
- The insufficient knowledge of tne situation prevailing in
various regions and zones. The lack of a thorough diagnosis of factors
governing educational demand, environmental conditions, characteristics
of population to be served have led to the definition of objectives,
content and teaching methods irrelevant to the needs of certain regions
and zones.
- The insufficient importance attached to the way decisions could
be implemented in the field; the concentration on the preparation phase
of educational plans and the lack of administrative support structures
and financial means have led to the non-implementation of policy
objectives.
- Tne lack of participation on the part of regional and local
level personnel in the planning process.
Tnese limitations led to an increasing interest for microplanning
- of which school mapping is a major component - as an indispensable
complement to macroplanning of education. This microplanning approach
(or school mapping) is applied at tne regional or subregional level;
it starts from a very detailed analysis of tne coverage of the educational
system and of the teaching/learning conditions in each region or sub-
region before making any suggestions or proposals for the future.

2.
It aims at equalizing educational opportunities and teaching conditions
for pupils from different geographical zones and allows the rationalization
of human, material and financial resources. Thus, it requires the direct
involvement of regional and sub-regional education officers in the
preparation and implementation of educational plans ana projects, as
it implies also some participation of the various parties involved in
the decision-making process (local authorities, teachers, parents, etc.).
Based on the results of its research programme, the International
Institute for Educational Planning has organized, since 1974, various
intensive courses on school mapping : two courses in Paris (1974 and
1975) followed by various regional, sub-regional or national intensive
courses and seminars in Latin America (Colombia, Venezuela, Mexico
and Ecuador, Asia (Indonesia and Thailand), Arab States (Yemen Arab
Republic, Morocco, Oman) and Africa (Cameroon, Nigeria, Tanzania).
The Sudanese Ministry of Education and Guidance approached the HEP
requesting the organization of a national course to train the various
regional and central education officers on the techniques of school
mapping and microplanning. This training course constitutes in fact a
follow-up activity to the study undertaken jointly in 1981-82 by the
HEP and the Sudanese Ministry of Education and Guidance on planning
education at the local level in the White Nile Province for the
purpose of universalizing primary education in the Sudan. It was chus
decided after the completion of the study that HEP and the Ministry
of Education and Guidance would jointly organize a three-week course
for the above-mentioned personnel. The course was held in Omdurman
some 10 kms from Khartoum, from 8 to 26 January 1983. Mr Habib Hajjar
was in charge of its preparation and organization on behalf of the
HEP, and Mr,El-Rayah Talballa, Director of the Planning Unit at the
Ministry of Education and Guidance, was responsible of its
organization on behalf of the Sudanese Government.
Objectives of the course
Since 1977 the Government of Sudan has embarked on a long-term
objective of universalizing primary education in the whole country by
the end of 1990. Existing studies however estimate the present enrol
ment rate at 39% in 1982. Achieving UPE within this short period of
time will therefore require a very big effort in terms of school
construction, training of teachers, production of teaching materials, etc.

3.
Due to the extremely severe budgetary constraints under which the country
operates and to many other factors, the Government realized the necessity
to hold a national conference on education in December 1982 and to adopt,
as far as primary education is concerned, the two following resolutions :
1) postponement of UPE to the year 2000,
2) generalization of the microplanning and school mapping approach at
the regional and sub-regional level in harmony with the new policy of
regionalization and decentralization.
With reference to these elements of the Sudanese educational policy
and planning, and in line with the methodological purposes of the case
study undertaken in the White Nile Province, the training course had
the main following objectives :
a) to acquaint the participants with the microplanning and school
mapping approach,
b) to help them acquire the appropriate concepts and techniques in
microplanning and school mapping on the basis of the abovementioned case
study,
c) to help them identify the various factors needed to be taken into
account when planning for the preparation and implementation of a school
map project, with a view to generalizing the microplanning approach all
over the country.
As a result,the participants worked on various alternative
assumptions concerning the expansion of the primary school system up to
1990. All the alternatives implied the opening of a large number of
schools, but they also implied a better utilization of scarce available
resources, a reconsideration of the extent of reliance on communities
to provide resources for education in relation to the poorest areas, and
more specifically a change in the relations between the different levels
of decision-making (central, regional, provincial and local) for a major
role to be played by the sub-national levels.
Participants
With respect to the new policy of regionalization and decentralization
of educational administration, the elaboration of the school map for
primary level of schooling is the responsibility of the regional level
relayed at the provincial and district level by appropriate administrative
structures. In view of this, it was agreed that the Ministry of Education
and Guidance would proceed with the selection of some 40 participants

4.
representing the regional level of educational planning and administration,
the central unit of educational planning and the general directorate of
literacy and adult education in the Ministry of Education. A total of
33 participants attended the course instead of 40, the representatives
of the southern region being unable to attend for reasons apparently
related to transport and communication difficulties.
A detailed list of participants is attached to this report (Annex III).
Each candidate was sent a detailed programme of the course, together with
a copy of the HEP publication "Planning the location of schools" by
J. Hallak and a note explaining the data each participant should bring
with him for the preparation of regional projects.
Preparation, organization and financing of the course
Based mainly on the microplanning case study undertaken in the While
Nile Province in 1981-82, the simulation exercises for the course were
prepared by H. Hajjar at the HEP in Paris.
Inaugurated by Mr Mohammad Kamal Badr, Undersecretary of the Ministry
of Education and Guidance, the course took place at the Teacher Training
Institute for intermediate level in Omdurman some 10 kms from Khartoum.
A large seminar room was available for plenary sessions and two smaller
rooms for working group sessions and storage of teaching materials and
stationery. The secretarial and reproduction services needed during the
course were provided at the General Directorate of Strategy and Planning
in the Ministry of Education, Khartoum.
Initially the provisional programme foresaw two working sessions per
day (8 am - 13 pm and 5 pm - 7 pm) with a long break for lunch and rest.
This daily timetable has been modified at the request of the participants
in the way of one long session per day from 8 am to 3 pm with one hour
break for lunch and rest. In spite of its heaviness this formula proved
good and saved participants and organizers the trouble of undergoing
the daily transport and communication difficulties. This formula was
also made possible thanks to the system of quick lunch provided by the
Ministry of Education to all participants and responsibles in the course.
Some 20 participants coming from the various regions of the country
were accommodated in the dormitories of the Teacher Training Institute.
The HEP financed all international costs (travel and per diem for
staff) together with the costs related to the preparation and reproduction

5.
of teaching materials. The dispatch of these teaching materials
(lectures and books) to Khartoum was made possible thanks to the
cooperation of the Permanent Delegation of Sudan to Unesco. The Sudanese
Ministry of Education and Guidance bore all the other costs : transport and
per diem for " all participants, accommodation, feeding, secretarial
services and local reproduction, transportation facilities to staff
members in Khartoum and Omdurman as well as to and from the airport,
etc.
Programme and content of the course
The course consists of three basic components (the detailed programme
is shown in Annex IV) :
- Lectures/discussions during which the basic concepts and techniques
used in school mapping and microplanning were presented and discussed.
A detailed outline of each lecture was distributed to each participant
in advance.
- Practical exercises based essentially on the results of the case
study mentioned above. These exercises covered the various aspects of
diagnosis (enrolments, teachers, facilities..) as well as the projection
of requirements and preparation of a prospective school map. The
discussions which took place after each practical exercise were an
efficient means to make sure of the attainments of participants and to
deepen the techniques of analysis and interpretation of results. The
exercises were carried out in six working groups. A complete set of these
exercises is included in Part II of this report.
- Preparation of regional projects : each participant was asked
to bring with him detailed information on one district of his region in
order to start a project for the introduction of school mapping. The
participants were regrouped into six groups to start this activity1 ''
However, most of them were not able to collect, before the beginning of
the course, the necessary data (maps, information on schools, demographic
data..) because they had not been informed sufficiently in advance. On
the whole, they were able to start with the choice of the pilot zone
(district), the identification of necessary data for diagnosis and their
sources, the preparation of tables for computing indicators of diagnosis
and finally a work schedule for the implementation of this activity.

6.
One working day was devoted to visit primary and secondary schools
in the neighbourhood, in order to test the survey instruments and to
observe the problems related to the filling of questionnaires, the
ambiguity of questions posed and the reliability of information collected.
This working day was preceded by a detailed discussing session to which
all the principals of primary and secondary schools to be visited, were
conveyed.
Staffing of the course
On behalf of the HEP, Habib Hajjar, Ta Ngoc Châu and Françoise Caillods
were responsible for the teaching and tutoring of participants. On the
Sudanese side, Mr Talballa, former HEP trainee and Head of the Central
Planning Unit, played a vital role in the organization of the course.
On the other hand, Mr Mohammad Kamal Badr, Under-Secretary of the
Ministry of Education and Guidance gave, at the beginning of the course,
a lecture/presentation on the Sudanese educational policy, planning and
administration which allowed for a very lively discussion on the
educational policy of Sudan and the issues at stake. The lecture
devoted to the presentation of the pilot zone,which was to be given by
a member of the local team who conducted the survey, was cancelled because
of the non-availability of this specialist.
The working language of the course was English. However, it seemed
necessary on various occasions to resort to Arabic in order to clarify
better the concepts and make them understandable especially for those
whose English was not fluent.
Professor Osman Sayyid Ahmad, Minister of Education and Guidance,
closed officially the course on Tuesday evening 25 January 1983 and
delivered certificates of attendance to all participants. A copy of his
speech can be found in Annex I.
Evaluation of the course
A few days before the end of the course a questionnaire was
distributed to participants, asking them to evaluate the different phases
of the course and its preparation, in order to suggest improvements for
similar courses in the future. This written evaluation was complemented
by an oral evaluation on the last day of the course. The results of the
questionnaire are included in Annex V. The following main conclusions
can be drawn from the remarks in general :

7.
a) Preparation of the course
The majority of the participants mentioned that the information
material was not sent sufficiently in advance for them to be able to
prepare for the course. This material comprised, as indicated before,
the HEP publication on "Planning the location of schools" by J. Hallak,
the provisional programme of the course and an information note on data
to be collected for the preparation of regional projects. Nearly all
the participants were notified of their admission to the course a few
days only before its commencement and did not, therefore, have enough
time to collect the data required. Consequently, they felt that they
should be informed of their admission to the course at least one month
(51.6%), two months (25.8%) or even three months and more (16.2%) before
its beginning.
b) The course itself
- On the whole the course was judged as good (41.9%) or very good
(54.8%).
- The lectures/discussions and practical exercises were
very much appreciated and their content was found to be very useful by
respectively 74.2% and 77.4% of the participants.
- The majority of participants (75.9%) were of the opinion that not
enough time was devoted to the preparation of regional projects.
- 51.7% of participants felt that more time should be attributed to
the cost concepts.
- 61.4% of participants found the course to be short or even too
short (19.4%). Consequently, the majority felt that four weeks at least
(38.7%) or even eight weeks (48.4%) should be devoted to such a course.
c) Future courses
- 58.1% of participants would like future similar courses to be
organized on a regional base, inviting participants from Arab and East
African countries.
- Other topics proposed for the organization of future courses
included : educational management and administration, literacy and adult
education, curriculum development, costing and financing, teacher
training, etc.

8.
- In order to keep in touch with the Institute, many participants
suggested that we send them our list of publications and keep them
informed of similar training courses and seminars the HEP might organize
in the future. The organization of a follow-up activity to this course
was also proposed.
Conclusions
The course took place at a moment when the Sudan is proceeding to
the setting of its new regionalization and decentralization policy.
Having been organized after the national conference on education
(December 1982) which adopted a resolution concerning the generalization
of the microplanning and school mapping approach to implement UPE by
the year 2000 (instead of 1990), the course allowed a very enriching
exchange of views and discussions among representatives of different
administrative levels as regards the planning process at the central
and regional levels.
- As a follow-up to this course the Directorate of planning in the
Ministry of Education and Guidance is planning to hold a number of other
meetings in order to evaluate the work that the participants have carried
out in their respective regions. The IIEP might be requested to
participate in one of these meetings.
9.
PART II
THE INTRODUCTION OF SCHOOL MAPPING AND MICROPLANNING IN THE WHITE NILE PROVINCE - SUDAN

11. IIEP/ITC36/Data Bank
Working Document Paris, 27 December 1982 Original: English
Intensive Course on Microplanning and School Mapping Khartoum, Democratic Republic of Sudan
(8-26 January 1983)
DATA BANK ON THE SUDAN
This document has been prepared for the participants in the Intensive Training Course on Microplanning and School Mapping, organized
in Khartoum, Sudan, by the Ministry of Education and Guidance of the Sudan and the International Institute for Educational Planning (Unesco), Paris
(c) Unesco

Data Bank on Sudan
Table 1. Enrolment in primary
Province
1. Northern
2. Nile
3. Khartoum
4. Gezira
5. While Nile
6. Blue Nile
7. Kassala
8. Red Sea
9. North Kordofan
10.South "
11.North Darfour
12.South
13.Jonglei
14.Upper Nile
15.Lakes
16.Bahr El-Gazal
17.East Equatoria
18.West
All Sudan
Boys
39311
55850
111760
148788
53898
59065
63460
20483
71550
56192
48954
43251
9523
16466
9371
17307
39714
12548
878051
schools (public and private)
Enrolment
Girls
37013
49075
102183
125625
37673
31445
43216
14054
41073
26764
20780
19379
1458
4984
1571
4342
19779
5635
586079
Both sexes
76324
104925
213943
274413
91571
90510
106676
34537
112623
82956
69734
62630
10981
21450
10942
21649
59493
18183
1464130
in the Sudan
Boys
52489
70386
163451
221973
151200
112560
184925
90820
184309
136060
133971
171190
27310
55224
51140
93611
52483
25981
1979015
1980/1981 (by
Population (7
Girls
51235
68752
152244
203054
137620
102450
158362
74431
183852
135725
124757
174498
23010
46528
43064
78826
44057
21798
1824263
province and sex)
-12)
Both sexes
103674
139120
315695
425027
288820
215010
343287
165251
368161
271785
258728
345688
50320
101752
94204
172437
96540
47779
3803278
DA
T
\
to G O
Source: Educational Statistics for the year 1980/81 - Ministry of Education and Guidance, Khartoum.

14.
Table 2. Growth of enrolment (by level) for the period 1970/71 - 1980/81
in the Sudan
Level Primary Intermediate Sec. Sec. Higher (Academic) (Techn.)
1970/71
1971/72
1972/73
1973/74
1974/75
1975/76
1976/77
1977/78
1978/79
1979/80
1980/81
749049
883533
1008703
1036840
1099680
1145415
1207661
1284513
1504824
1435127
1464130
53572
68304
85978
115734
126497
139179
147427
168724
214419
258606
278767
19837
23871
29563
34016
37672
39402
43943
52213
62056
130395
115692
1974
2876
3842
4907
6515
6846
8297
8809
11715
12690
15302
N.A.
11
16328
18762
22069
21324
20887
24117
26883
27016*
N.A.
Average growth
rate 6,93% 17,92% 19,3% 23,6% 7,5%
x This number does not include the students who are studying abraod in 1979/80
and who accounted for more than 20 000.

15.
Table 3. Transition rates to intermediate and higher secondary education
School year
1980/81
in the Sudan
Enrolment in primary grade VI (1979/80)
176783
1980/81
Intermediate
Enrolment in grade I intermediate (1980/81)
98585
Transition rate
55,8
Secondary (Academic)
Enrolment grade III intermediate (1979/80)
77283
Enrolment in grade I secondary (1980/81)
32731
Transition rate
42,3
Table 4. Number of boarders by level of education in the Sudan 1980/81
Level Primary Intermediate Secondary (Academic) Sch.Yr
Total enrolment
N° of boarders
Total N° of % enrol- boarders ment
Total N° of % enrol- boarders ment
1980/81 1464130 117130 8,0 278767 59935 21,5 115692 32162 27,8

T a b l e 5 . B u d g e t a r y c o s t p e r p u p i l i n t h e l e v e l s ( P r i m . , I n t e r . , & S e c . ) 7 9 / 1 9 8 0 - i n S u d a n e s e P o u n d s
«jpcon^ary L e v e l
1 T e c h n i c a l i
¡"our l er
fin.'ì
3 1 0 . 1
3 2 ? . 1
3^7.*
559.1
*,
387-7
3#3.8
297-9
_
5*2.1
3?5.6
¿ 4 3 . 0
3 3 3 . 4 • — •
^ay " t u d .
105-4
790.2
1 8 1 . 4
183.6
1 5 0 . 5
_
1 9 2 . 3
1 8 5 . 9
195.''
».
189.^
1 8 7 . 1
161.7
182.5
(Scademic
Boarder
203.8
205.3
7*8.9
247.6
2 0 4 . 8
2 5 4 . 3
¿ 6 9 . 4
4 3 1 . 5
1 * 9 . 2
266.3
4 4 2 . 3
5 0 8 . 9
"~ • • *
250 . f i
Day " t u d .
ios.a
1 2 1 . 7
1 5 1 . 6
1 5 6 . 7
,111
1R1 .8
14*5.7
2 4 1 . 8
11=1.0
1 T \ ?
2 i o . f i
1 8 2 . 5
™ • • •
14=1.«5
I n t e r . L e v e l
Boarder
2 0 2 . 1
1 8 0 . *
2 7 P . 2
1 0 4 . 9
2 2 2 . 8
1 5 0 . 5
1 9 4 . 1
2 9 4 . 8
1 2 5 . 2
1 9 7 . S
2 4 1 . 4
1 0 9 . 7
™ • • •
1 8 4 . 3
Day S t u d .
95.9
1 0 0 . 2
5 0 . 7
9 0 . 2
7 6 . 3
6 6 . 5
7 0 . 8
1 0 7 . 1
7 3 . 5
1 2 . 4
1 1 5 . 8
1 0 1 . 2
"• • •
8 3 . 3
Pr imary l e v e j
Boarder
1 3 2 . 5
1 2 8 . 1
1 0 6 . 4
1 1 4 . 1
1 0 1 . 8
1 1 7 . 6
1 3 0 . 4
1 4 8 . 8
¿OsB
1 0 0 . 2
1 0 5 . 6
1 0 3 . 9
mm • • •
1 0 5
Day S t u d .
4 5 . 2
4 8 . 4
2 5 . 9
2 6 . 0
3 1 . 2
3 3 . 4
3 2 . 9
4 3 . 6
35
3 0 . 5
4 5 . 2
3 4 . 8
™ • • •
3 0 . 7
P r o v i n c e '
n o r t h e r n
N i l e
Thtir.
G e z i r a
W . N i l e
B . N i l e
F a s s a l a
Red Sea
N.Kordofan
S . F o r d o f a n
N . D a r f u r
S.Da-rfur
S . R e g i o n
A l l Sudan
Source : Educational Statistics - Ministry of Education and Guidance, Sudan 1979/80

Table 6. Summary table of recurrent expenditure on public schools in the seven provinces 1977/78
(in Sudanese pounds)
Total Province Expenditure Primary
All Suâ a n 59 917 010 • ^26.620 »
The V Provine.?-, 21 845 ?.?'< 27-210
Blue Nile
Red Sea
Su¿*t-h KonioP'an
fJoTtli Kordofan
North Derfur
Khartoum
Equntoria
1 930 5t7 16-.035
1 411 033 22.817
3 ?'72 208 127-679
2 315 719 Vf .978
3 776 663 48 060
8 313 19C 22 -058
1 326 335 43909 . . » „ • * • - •••-•• - • - . . , . . •
Cost/Day
Junior Sec.
78 65O
5? 64j
33 005
49 643
35 636
49 866
76 544
80 105
46 830
Pupil
Ac.Sec. Schools
152 46o
158 *41
73 867
117 518
77 090
54 674
78 093
233 172
(3)
Primary
64 03Z
51 2.79
C.) 57 013
54 645
93 042
50 oob
174 98.3
75 521
Junior Sec.
156 O78
138 131
113 236
178 286
108 O60
101 6C9
150 o84
500 079
104 463
Academic sec. schools
213 44o
249 396
153 211
196 298
142 467
96 108
149 613
360 126
139 350
(1) This is thß amount remitted by the Central Govt, to the Locri Goví. for .Tenerci education (2) All (foy-pupils (3) All boarders cost per pupils for the seven provinces are cveraged for them.
Source : Survey of educational expenditure on public education in selected provinces Planning and Ministry of Education, Khartoum 1978.
- Ministry of National

EXERCISES

20.
EXERCISE N° I
COLLECTION OF DATA
Given the information available in the file corresponding to your
region, indicate :
a) What kind of data could be collected easily both at the national
and regional levels? (Specify administrative components).
b) What kind of data requires special surveys :
- on pupils;
- on teachers;
- on school premises;
- others (specify).

Available Not available
Ministry of Other Local Survey on Survey on Others Education Ministries Administration Pupils Schools (Specify)
(Specify) (Specify)
1. Environment
2. Demography
3. Education
(a) Enrolment
(b) Teachers
(c) Curriculum
(d) Classrooms
& equipment
(e) Cost and t-finaneing
4. Other

22.
EXERCISE N° II
IDENTIFICATION OF HOMOGENEOUS ZONES
The district used for the pilot exercise is called the district of
Ed-Dueim. It is located at the North-Western part of the White Nile
Province and it has 81 primary schools, 27 intermediate schools, 3
academic secondary schools and one technical secondary school.
The district extends for about ICO kms from north to south and
25 kms from east to west. Its total population is estimated to be
686350 inhabitants in 1981 of whom 158 OOO approximately are nomads.
Ed-Dueim town the district headquarters has 36350 inhabitants in 1981
and the cities of Shabasha and S- fi have respectively 19600 and 14600
inhabitants.
There is only one highway paved road still under construction
linking Ed-Dueim to Khartoum in the north. All the other roads are
seasonal and the transportation network depends solely on lorries and
trucks. The only railway line that links the White Nile Province to
Khartoum crosses the Province from west to east at its southern part
and then, through the Gezira Province at the north-east it continues
to Khartoum in the north.
The predominant economic activity in the district is agriculture.
Irrigated schemes are extending on the western and eastern banks of
the White Nile in addition to rain cultivated land. The main crops
are cotton and dura.
Recently, sugar production schemes have been established in the
southern part of the Province at Asalaya and Kinana as a result of
which new towns have grown up. Cattle raising is also an important
part of the economic activity carried out by nomads.
The district is divided into 9 local councils : The city of
Ed-Dueim, the city of Shabasha, the city of Sofi, Arashkoul, Um Rimta,
Minidreep, Kereida, Wahda and Zereiga (See map 1). Due to unavailability
of data concerning the population, different procedures have been used
to estimate the population by district and local council. First,
population data have been collected from peoples' local councils out
of the lists of supplies and checked with estimates gathered from some
villages and schools. Then population data for age 18 and above have
been gathered from the lists of elections by councils and villages
and percentages of age group 1-17 have been calculated from the 1973
Census and the surveys carried out by the Department of Statistics

23.
in the Ministry of National Planning. Later, all data were checked with
population projections prepared by the Department of Statistics. Finally,
an estimation has been made concerning the school-age population using
the population structure prepared also by the Department of Statistics.
(See table 1).
A survey has been conducted in various primary schools and
information on enrolments, teachers and facilities has been collected.
It has only been possible, however, to conduct the survey in 59 schools
(72,8%). Data on the remaining 22 schools has been gathered from the
traditional school forms available at the Educational office of the
district. The location of each school, as well as the road network
is shown in map N° 1. The summary of the basic information on primary
schools is presented in table N° 2.
There are 27 intermediate schools in the district of Ed-Dueim,
(16 of them have been surveyed), three academic secondary schools (all
of them have been surveyed) and one technical secondary school (not
surveyed).
In order to make concrete suggestions and proposals for the
improvement of the primary school system and the location of new
primary schools in the future, it is necessary to analyze the present
teaching/learning conditions in the district and to highlight the
deficiencies in the system, as well as possible imbalances between
schools, groups of students and zones. The analysis could be carried
out by local'council. However, given the relative high number of
local councils within the district (the same can be said for the whole
province), it would be then a lengthy process. It is therefore
suggested to regroup local councils (and schools) with similar
characteristics, thus identifying various zones each one having its
specific problem. Within each zone, educational characteristics
should be as homogeneous as possible, and between zones they should
be as different as possible.
By analyzing the following criteria :
- Relief, road network and means of communications (map N° 1).
- Location and density of primary schools in the various local
councils and demographic criteria (map N°l).
- Enrolment ratios in primary education.

24.
- Percentage of trained teachers, number of classrooms per
stream..
and regrouping various local councils, identify 3 to 4 homogeneous zones.
Justify your choice.

Table 1. Total population and school-age population by local council - District of Ed-Dueim 1900/81 (estimates)
Local Council
Ed-Dueim
Shabasha
So fi
Arashkoul
Urn Rimta
Minidreep
Kereida
Wahda
Zereirta
Total population Age 7 7-12 13-15
M F M M
18500
ÎOOOO
7450
89650
1018O0
122300
17850 36350
9600 196O0
7150 14600
863O0 175950
98050 199850
117700 2400O0
888 784
480 421
358 314
4303 3789
4886 4304
5870 5167
1672 3656
901 1976
672 1472
8092 17715
9190 20116
11037 24166
3304 6960
1777 3753
1323 2/95
J.5974_ 33689
18149 38265
21786 45952
1075 934
581 502
433 374
5209 4513
5915 5128
7106 6156
2009
1083
807
9722
11043
13262
to
Total 349700 336650 686350 16785 14779 31564 69101 62313 131414 20312 17607 37919
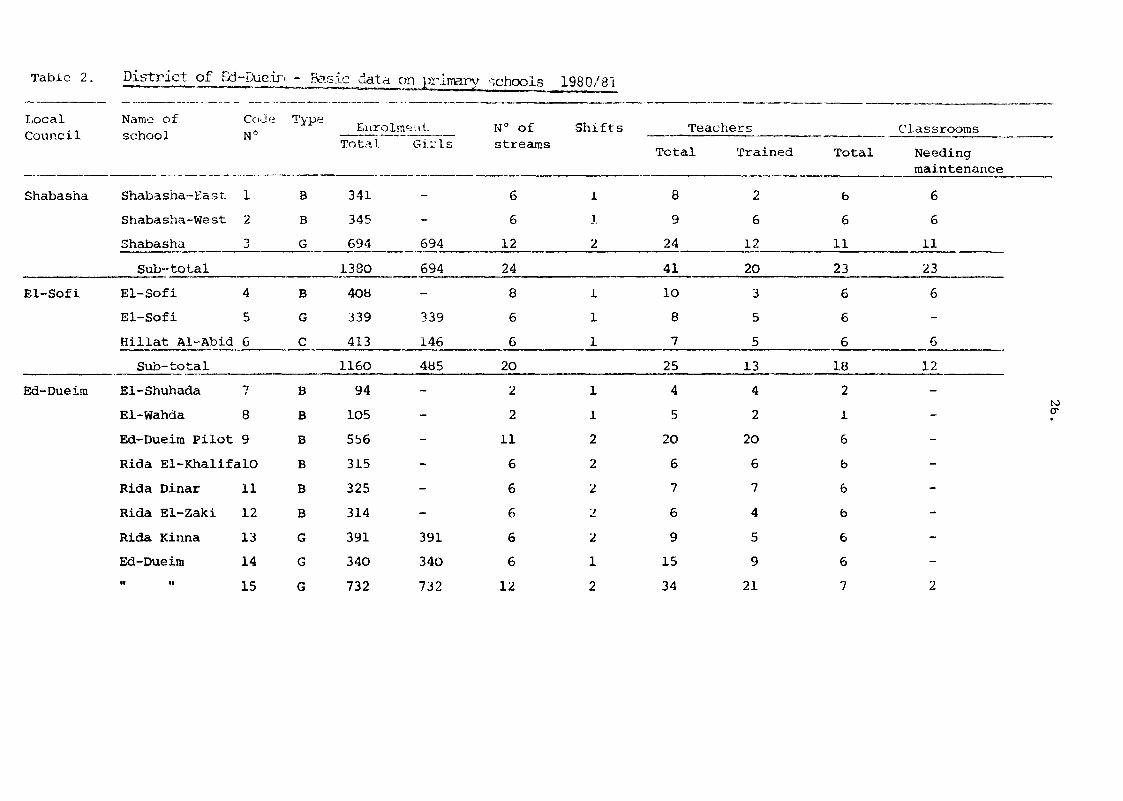
Table 2.
Local Council
Shabasha
El-Sofi
Ed-Dueim
District of Ed
Name of school
Shabasha-East
Shabasha-We st
Shabasha
Sub-total
El-Sofi
El-Sofi
Hillat Al-Abid
Sub-total
El-Shuhada
El-Wahda
Ed-Dueim Pilot
'-Due.TLT'
Code N°
1
2
3
4
5
6
i
8
9
Rida El-KhalifalO
Rida Dinar
Rida El-Zaki
Rida Kinna
Ed-Dueira
ii n
11
12
13
14
15
- Bas
Type
B
B
G
B
G
C
B
B
B
B
B
B
G
G
G
ic data
Enrol Tota].
341
345
694
1330
408
339
413
1160
94
105
556
315
325
314
391
340
732
on
me
—
i primary
•it
Girls
-
-
694
694
-
339
146
485
-
-
-
-
-
-
391
340
732
schools
N° of streams
6
6
12
24
8
6
6
20
2
2
11
6
6
6
6
6
12
1980/81
Shifts
1
1
2
1
1
1
1
1
2
2
2
2
2
1
2
Teach«
Total
8
9
24
41
10
8
7
25
4
5
20
6
7
6
9
15
34
sirs
Trained
2
6
12
20
3
5
5
13
4
2
20
6
7
4
5
9
21
Total
6
6
11
23
6
6
6
18
2
1
6
6
6
b
6
6
7
Classrooms
Needing
maintenance
6
6
11
23
6
-
6
12
-
-
-
-
-
-
-
-
2
0s

Table 2 (cn td . )
Local Council
Ed-Dueim
Arashkoul
Name of school
Ed-Dueira t»
El-Shati
Extension West
Roto
El-Talaa
Rida El-Mahdi
Rida Anja
Sub-Total
Arik
Arik
Sheikh El-Khan jar
El-Siferaya
Urn Gidad
Arashkoul
Banunab
El-Shiteib
Code
16
17
18
19
20
21
22
23
24
25
26
27
28
29
30
31
Type
G
G
G
G
C
C
C
C
B
G
C
C
C
C
C
C
Enrolment Total Girls
333
451
271
70
503
328
361
417
5906
262
239
72
327
151
110
211
321
333
451
271
70
201
150
132
155
3226
-
239
34
156
48
44
82
13b
N° of streams
6
6
6
2
10
6
6
6
105
6
6
2
6
4
6
6
6
Shifts
1
2
1
1
2
2
2
2
2
2
1
1
2
2
3
1
Teachers
Total
15
21
16
3
18
11
7
7
204
8
10
2
7
9
9
7
7
Trained
6
9
7
3
17
8
3
3
134
2
2
2
-
-
3
2
3
Total
6
6
6
2
4
6
3
6
85
6
6
2
6
4
6
4
6
Classrooms
Needing maintenance
6
-
-
2
4
2
-
4
20
6
3
2
2
-
-
-
6
27.
1

Table 2 ( cn td . )
Local Council
Arashkoul
Um Rimta
Name of school
El-Turaa
••
Selake
El-Oshera
El-Laouta
El-Awamra
El-Manara
El-Getaina
El-Humara
El-Halba
Wad-Gabur
Khur El-Mutrag
Idd El-Oud
Sub-Total
Wad Nimir
H ••
Code N°
32
33
34
35
36
37
38
39
40
41
42
43
44
45
46
Type
B
G
C
C
C
C
C
C
C
c
c c c
B
G
Enrolment Total
144
19 3
130
322
233
256
233
187
114
226
174
166
205
4276
354
345
Girls
-
19J
39
135
85
98
108
39
27
75
37
16
20
1613
-
345
N° of streams
6
6
3
6
6
6
6
6
2
6
6
4
6
105
6
6
Shifts
1
1
1
1
1
1
1
1
1
1
1
1
1
2
1
Teach
Total
7
6
5
7
7
7
8
9
4
8
7
4
4
137
6
8
ers
Trained
4
4
3
3
4
3
4
4
2
3
3
-
51
3
3
Total
6
6
3
6
6
6
6
6
2
6
6
4
6
109
6
6
Classrooms
Needing maintenance
6
4
3
4
3
4
6
4
2
5
6
4
70
6
-

Tabic ll (cntd.)
local Council
Name of schoo]
Cod« Type N°
Enrolment Total Girls
Urn Rita El-Shatawi 47
48
El-Kaddaba 49
El-Alaga 50
Ei-Etisain 5 i
Tjanunu E l -Humara 52
El-Sheikh Hussain 53
El-Hinew 54
Eid Um Ish 55
Sheikh Ahmad 56
Hillat El-Obid 57
El-Oshara El-Garbiyya 58
Shaqiri 5y
Gouz El-Baid 60
El-Marakha 61
El-Shigeg 62
El-Shawa 63
306
63
505
480
145
150
201
305
1B5
148
368
279
175
316
174
311
30
107
23
203
193
39
46
61
70
80
50
108
127
60
113
37
112
IO
Sub-Total 4840 1784
N° of streams
6
1
7
6
6
Shifts
1
1
2
1
1
Teachers
Total
6
1
9
5
6
Trained
-
-
4
1
-
Total
6
1
7
6
6
Classrooms
Needing maintenance
4
-
6
-
6
6
7
3
3
6
6
3
6
6
6
1
1
1
1
1
1
1
1
1
1
1
1
7
8
4
4
7
8
4
6
6
6
2
-
2
3
-
4
2
3
1
2
3
2
6
6
3
3
6
6
3
6
6
6
1
-
2
3
3
6
6
2
6
6
6
1
to
97 109 33 96 69

Table 2 (cntd.)
Local Council
Name of school
Code Type N°
Enrolment Total Girls
N° of streams
Shifts Teachers Classrooms
Total Trained Total Needing maintenance
Minidreep
Wahda & Zeraiga
Minidreep
»
El-Tahira
El-Kardoud
El-Rawda
Abou Shibika
Gouz Mirekfib
El-Mikefi
Erked Fayek
Wakra
64
65
66
67
68
69
70
71
72
73
B
G
. C
It
II
tl
II
•1
If
II
197
160
28b
337
250
184
281
303
275
354
160
77
127
111
70
100
86
125
124
6
6
6
6
6
6
6
6
6
1
2
1
2
1
3
2
2
2
9
6
8
6
7
7
8
9
12
6
1
1
1
1
2
3
6
5
6
6
6
4
5
6
4
6
3
6
4
5
6
4
6
U)
O
Sub-Total 2629 980 60 79 23 54 36
El-Kireida
ii
Kathir Bella
Abou Shabaka
Adida
74
75
76
77
78
B
G
G
C II
271
235
215
n.a
325
-
235
215
n.a
148
6
6
5
6
6
2
3
1
1
1
9
9
11
7
7
3
1
7
4
2
6
6
5
6
6
-
6
5
6
6

Table 2 (end)
Local
Council
El-Kireida
Name of school
El-Dir>eba
El-Goueiz
Mabrouka
Sub-Total
Code N°
79
80
81
Type
C II
il
Enrolment Total
336
289
301
1972
Girls
151
126
133
1008
N° of streams
6
6
6
47
Shi
1
l
1
fts Teachers
Total
10
8
11
72
Trained
4
4
2
27
Total
6
&
6
47
Classrooms
Needing maintenance
-
-
3
26
OJ

3 2 .
MAP 1 : LOCATION OF PRIMARY SCHOOLS. ADMINISTRATIVE DIVISIONS AND MEANS OF COMMUNICATING. DISTRICT OF EDDUEIM
' / SCALE 1 / 5000 000
O i _
10 _J
/ - • - • • S. EI Sidig Rural Council (Part of East of the Nile)
20Km i
Shabasha Town Council
1 2 3
r i » a " r f l i i
J IV.
El-Dueim City Council
7 8 9 10 11 12 13 14
15 16 17 18 19 20 21 22 23
District Boundaries
Council Boundaries
Wad.
Truck Road
Paved Road Under Construction
Sand Hill
Village
City or Town
Kereida Rural Council
y 2. 3 81 A Code Numbers of Existing Primary Schools
Southern District West of the Nile

$mfif

34.
SOLUTION TO EXERCISE N° II
IDENTIFICATION OF HOMOGENEOUS ZONES
The basic map on which the various zones are to be drawn is Map N° 1,
showing the administrative divisions as well as the road network and the
location of primary schools.
The first criteria to be applied are relief and quality of the road
network. They will allow us to identify those areas where communications
are relatively easy, i.e. where access to education and organization of the
educational service should be easier, and those areas where, on the
contrary communication is fairly difficult. Since the main objective
of the educational policy is the universalization of primary education,
one criterion will be determinant when drawing up our zone boundaries :
the admission rates to the first year of primary schooling or the gross
enrolment rate for the whole level of primary education. Other criteria,
such as percentage of trained teachers or state of classrooms (indicators
of quality of the educational service), will be applied only if there
is some doubt as to where to allocate any one local council.
A. Applying the criterion on relief and means of communication one can
identify two zones. The first one goes from north to south along the
Nile corresponding to the large agricultural area on the western bank
of the White Nile, and the second one corresponds to the remaining
parts in the west. In the first zone, communications are easy. In
fact the paved road under construction is linking the cities on the
Nile and the other settlements to the north and to the south. Apart
from this, the whole zone is benefiting from the transportation system
and other means of communication in use on the Nile, at least in
different points and at different periods of the year. In the other
zone communications are relatively more difficult : all the roads
are seasonal and the transportation network depends solely on lorries,
trucks and animals.
B. The demographic criterion as well as that of the density of primary
schools allows us to separate out two definitely urban and semi-urban
areas: the city of Ed-Dueim (17 primary schools) and the two cities
of Shabasha and Sofi (3 primary schools for each) from the rest of the
district.

35.
C. If we now analyze the gross enrolment rate, three zones also seem
to emerge:
. A zone corresponding to the city of Ed-Queim, the district
headquarters, where the gross enrolment rate for both sexes is about
85 per cent : schooling is relatively high, although not yet
universalized.
. A zone corresponding to the two cities of Shabasha and Sofi
with a comparatively low gross enrolment rate (38,8%) close to the
national average (38,5%) for the whole Sudan in 1980/81.
. A third zone corresponding to the rest of the district with
a very low enrolment rate (10,6%). That is in this zone where the
158 OOO estimated nomads and semi-nomads are living (23% of the total
population of the district).
D. The percentage of trained teachers seems to follow to some extent
the same pattern between zones. The urban zone of Ed-Dueim seems to
have a high percentage of trained teachers (65,7%) either coming
from the Teacher Training Institutes or secondary school leavers trained
on the job. This percentage falls to 50% in the two cities of Shabasha
and Sofi and almost 34% in the rest of the district.
We have therefore concluded on three zones:
. An urban zone corresponding to the city of Ed-Dueim.
. A semi-urban zone corresponding to the towns of Shabasha and
£vfi.
. A rural zone corresponding to the rest of the district.
A more detailed information on this third rural zone might help
eventually to split it into two zones: one corresponding to the west
bank of the White Nile where most of the people are settled and
another one corresponding to the interior part of the district where
most of the people are nomads and semi-nomads.

36.
EXERCISE N° III
DIAGNOSIS OF ENROLMENT AT PRIMARY LEVEL
When preparing the diagnosis of enrolment at primary level of education,
one should look in particular at :
- the coverage of the educational system;
- the efficiency of the educational system;
- the location of primary schools and the distances covered by pupils
to go to school every day.

I. Coverage of the educational system
Table 1. Apparent admission rates by sex and zone - District of Ed-Dueim 1980/81
Zone
Urban
Semi urban
Rural
Population 7 years old (1981)
M F T
888 784 1672
838 735 1573
15059 13260 28319
Enrolment in Grade 1 11980/81)
M F
545 602
224 209
2072 1190
T
1147
433
3262
Of whom repeaters
M
147
29
258
F
94
17
121
T
241
46
379
Apparent admission rate %
M F T
44,8 64,8 54,2
Whole District 16785 14779 31564 2841 20O1 4842 434 232 666

Table 2. Gross enrolment rates by sex and zone - District of Ed-Dueim 1980/81
Zone
Urban
Semi-urban
Rural
Whole District
Population (1981:
M
3656
3448
61997
69101
F
3304
3100
55909
62313
7-12 1
T
6960
6548
117906
131414
Enrolment in grades 1-6 (1980/81)
M
2680
1361
8332
12373
F
3226
1179
5385
9790
T
5906
2540
13717
22163
Gross enrolment rates
M F T
73,3 97,6 84,9
IO

3y.
Table 3. Percentage of girls in primary education
District of Ed-Dueim 19QO/81
Zone
Urban
Semi-urban
Rural
Whole District
Total enrolment
5y06
2540
13717
22163
Girls
3226
1179
5385
9790
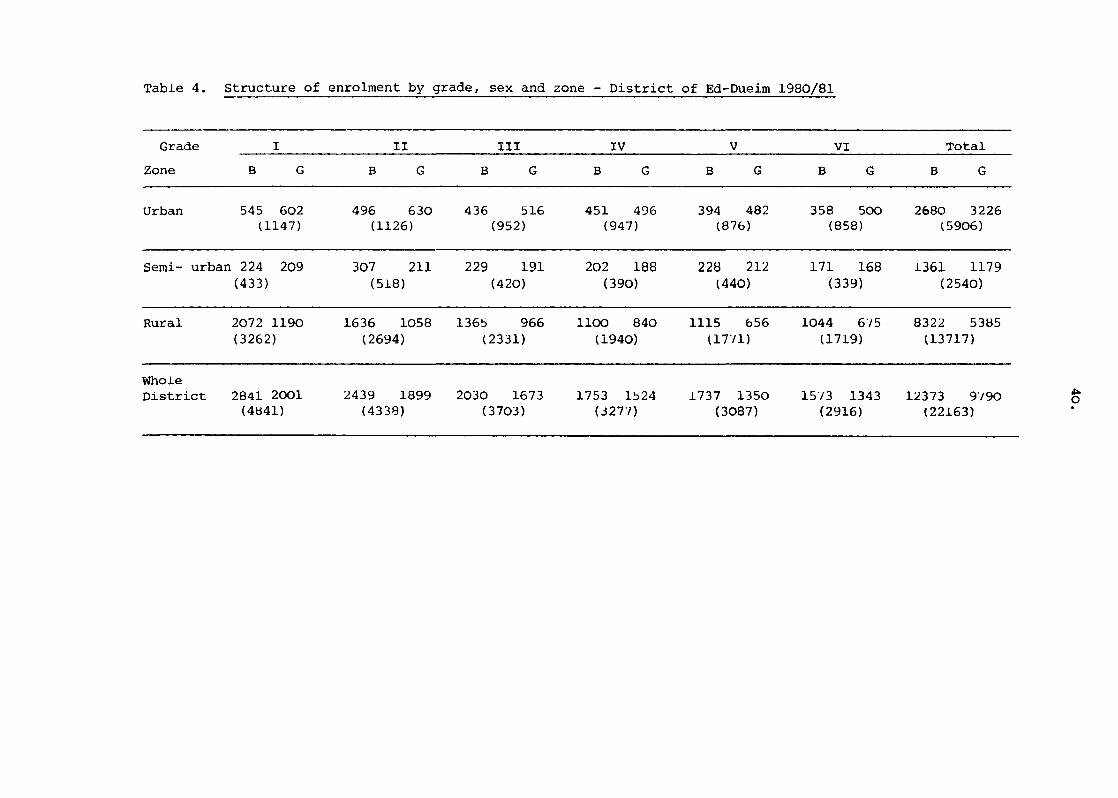
Table 4. Structure of enrolment by grade, sex and zone - District of Ed-Dueim 1980/81
Grade I II III IV V VI Total
Zone B G B G B G B G B G B G B G
Urban 545 602 496 630 436 516 451 496 394 482 358 500 2680 3226 (1147) (1126) (952) (947) (876) (858) (5906)
Semi- urban 224 209 307 211 229 191 202 188 228 212 171 168 1361 1179 (433) (518) (420) (390) (440) (339) (2540)
Rural 2072 1190 1636 1058 1365 966 llOO 840 1115 656 1044 675 8322 5385 (3262) (2694) (2331) (1940) (17/1) (1719) (13717)
Whole District 2841 2001 2439 1899 2030 1673 1753 1524 1737 1350 1573 1343 12373 9/90
(4841) (4338) (3703) (3277) (3087) (2916) (22163)

41.
Prepare a graph showing the distribution of enrolment by sex and grade for both rural and urban zones.
Comment on the various indicators calculated. What can you conclude
concerning the coverage of the primary school system in the district.
II. Efficiency of the educational system
The educational information collected regularly at the school
level and then agreggated at the provincial and central level says
nothing about the internal efficiency of the school system, being
admitted that there is automatic promotion and in particular from grade I
to grade IV. During the survey it has been possible to collect data
on promotees and repeaters in 18 primary schools in the different local
councils of the district. This survey comprised schools for boys, girls
and co-educational schools and covered 35%bf those enrolled in urban
primary schools, 58% in semi-urban schools and 23% in rural schools.
On the basis of this information complete the following tables
and give your comments.
Table 5. Promotion, repetition and drop-out rates in the rural zone
of Ed-Dueim District 1980/81 (Schools surveyed)
Grades
I I_I IIJ IV V VI
1980 enrolment 558 557 515 485 371 388
1981
Promoted/ admitted
Repeaters 65 77 76 61 43 60
Total 695 547 521 463 425 378
I/II II/III III/IV IV/V V/VI
Promotion rate
Repetition "
Drop-out "

42.
Table 6. Promotion, repetition and drop-out rates by zone (Schools surveyed)
Zone I-II II-III III-IV IV-V V-VI
Urban
Promotion rate 83,5 78,2 81,3 80,9 81,7
Repetition " 13,8 13,9 12,7 13,5 13,7
Drop-out " 2,7 7,9 6,0 5,6 4,6
Semi-urban
Promotion rate 87,6 86,3 80,9 79,1 83,1
Repetition " 10,0 11,5 16,4 18,5 15,3
Drop-out " 2,4 2,2 2,7 2,4 1,6
Rural
Promotion rate
Repetition "
Drop-out "

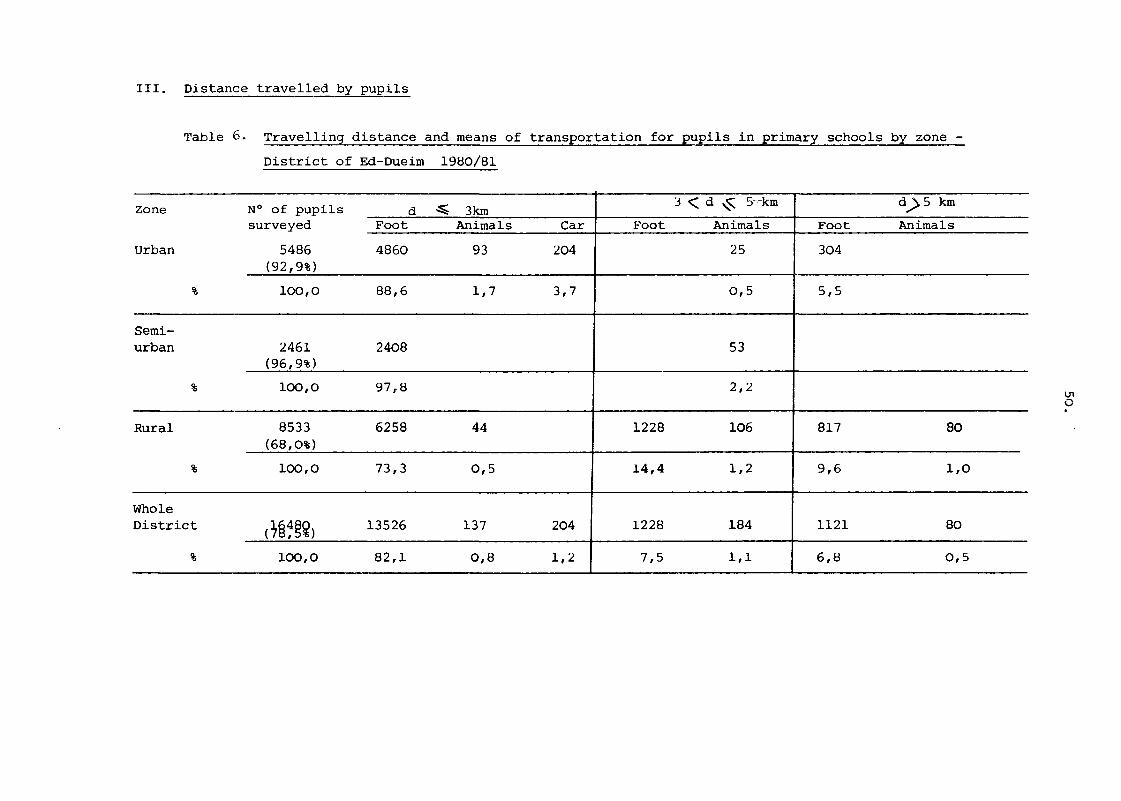
III. Distance travelled by pupils
Comment the following table
Table 7. Travelling distance and means of transportation for pupils in primary schools by zone -
District of Ed-Pueim 1980/81
Zone
Urban
%
Semi-urban
%
Rural
%
Whole District
%
N° of pupils surveyed
5486 (92,9%)
100,0
2461 (96,9%)
100,0
8533 (68,0%)
100,0
c*i«> 100,0
d Foot
4860
88,6
2408
97,8
6258
73,3
13526
82,1
^ 3km Animals
93
1,7
44
0,5
137
0,8
i
Car
204
3,7
204
1,2 j
r — —
Foot
1228
14,4
1228
7,5
^ < ; d ^ 5 km
Animals
25
0,5
53
2,2
106
1,2
184
1,1
Foot
304
5,5
817
9,6
1121
6,8
d^>5 km
Animals
80
1,0
80
0,5

I. Coverage of the educational system
Table 1. Admission rates by sex and zone - District of Ed-Dueim 1980/81
Zone Population 7 years old (1981)
M
Enrolment in Grade 1 (1980/81)
Of whom repeaters Admission rate %
M M T
Urban 888 784 1672 545 602 1147 147 94 241 44,8 64,8 54,2
D H > O Z O (/) H Uì
O ^ M Z
8 o« M 2,
> H •ti 3> H !£ S • <
f M
en O F G •3 H O z H o •>
£> M X H W o H en M
Z o
H H H
Semi urban 838 735 1573 224 209 433 29 17 46 23,3 26,1 24,6
Rural 15059 13260 28319 2072 1190 3262 258 121 379 12,0 8,1 10,2
Whole District 16785 14779 31564 2841 2001 4842 434 232 666 14,3 12,0 13,2

Table 2. Gross enrolment ratio by sex and zone - District of Ed-Dueim 1980/81
Zone
Urban
Semi-urban
Rural
Whole District
Population (1981)
M
3656
3448
61997
69101
F
3304
3100
55909
62313
7-12 l
T
6960
6548
117906
131414
Enrolment in grades 1-6 (1980/81)
M
2680
1361
8332
12373
F
3226
1179
5385
9790
T
5906
2540
13717
22163
Gross
M
73,3
39,5
13,4
17,9
enrolment ratio
F
97,6
38,0
9,6
15,7
T
84,9
38,8
11,6
16,9

46.
Table 3. Percentage of girls in primary education by zone
District of Ed-Dueim 1980/81
Girls
3226
1179
5385
9790
Zone
Urban
Semi-urban
Rural
Whole District
Total enrolment
5906
2540
13717
22163
54,6
46,4
39,3
44,2

47.
Graph 1. Distribution of enrolments by grade and sex in the rural
and urban zones of Ed-Dueim District - 1980/81 RURAL ZONE
Boys
1044
1115
11O0
1365
1636
2072
Girls
675
656
840
966
1058
1190
URBAN ZONE
Boys Girls
358
394
451
436
496
545
500
482
496
516
630
602

48.
Table 4. Promotion, repetition and drop-out rates in the rural zone
of Ed-Dueim District 1980/81
Grades
I II III IV V VI
1980 enrolment 558 557 515 485 371 388
1981
Promoted/ admitted 630 470 445 402 382 318
Repeaters 65 77 76 61 43 60
Total 695 547 521 463 425 378
I II III IV V VI
Promotion rate 84,2 79,9 78,1 78,8 85,7
Repetition " 11,6 13,8 14,8 12,6 11,6 15,5
Drop-out " 4,2 6,3 7,1 8,6 2,7

4y.
Table 5. Promotion, repetition and drop-out rates by zone
Zone I-II II-III III-IV IV-V V-VI
Urban
Promotion rate 83,5 78,2 81,3 80,9 81,7
Repetition " 13,8 13,9 12,7 13,5 13,7
Drop-out " 2,7 7,9 6,0 5,6 4,6
Semi-urban
Promotion rate 87,6 86,3 80,9 79,1 83,1
Repetition " 10,0 11,5 16,4 18,5 15,3
Drop-out " 2,4 2,2 2,7 2,4 1,6
Rural
Promotion rate 84-r2 79,9 78,1 78,8 85,7
Repetition " 11,6 13,8 14,8 12,6 11,6
Drop-out " 4,2 6,3 7,1 8,6 2,7
III. Distance travelled by pupils
Table 6. Travelling distance and means of transportation for pupils in primary schools by zone -
District of Ed-Dueim 1980/81
Zone
Urban
%
Semi-urban
%
Rural
%
Whole District
%
N° of pupils surveyed
5486 (92,9%)
100,0
2461 (96,9%)
100,0
8533 (68,0%)
100,0
ÒV®) 100,0
d Foot
4860
88,6
2408
97,8
6258
73,3
13526
82,1
^ 3km Animals
93
1,7
44
0,5
137
0,8
Car
204
3,7
204
1,2
Foot
1228
14,4
1228
7,5
3 < d ^ 5-
Animal
25
0,5
53
2,2
106
1,2
184
1,1
km
s Foot
304
5,5
817
9,6
1121
6,8
d^.5 km
Animals
80
1,0
80
0,5
51.
EXERCISE N° IV
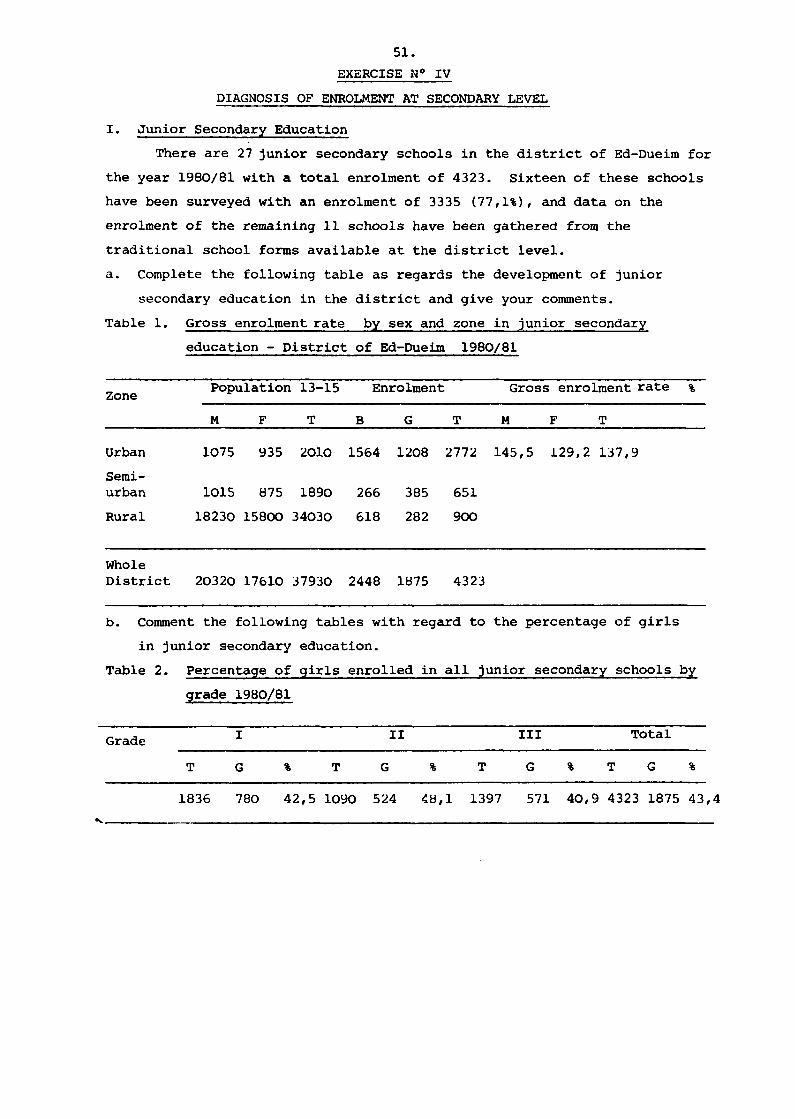
DIAGNOSIS OF ENROLMENT AT SECONDARY LEVEL
I. Junior Secondary Education
There are 27 junior secondary schools in the district of Ed-Dueim for
the year 1980/81 with a total enrolment of 4323. Sixteen of these schools
have been surveyed with an enrolment of 3335 (77,1%), and data on the
enrolment of the remaining 11 schools have been gathered from the
traditional school forms available at the district level,
a. Complete the following table as regards the development of junior
secondary education in the district and give your comments.
Table 1. Gross enrolment rate by sex and zone in junior secondary
education - District of Ed-Dueim 1980/81
Population 13-15 Enrolment Gross enrolment rate % Zone e
M F T B G T M F T
Urban 1075 935 2010 1564 1208 2772 145,5 129,2 137,9
Semi-urban 1015 875 1890 266 385 651
Rural 18230 15800 34030 618 282 900
Whole District 20320 17610 37930 2448 1875 4323
b. Comment the following tables with regard to the percentage of girls
in junior secondary education.
Table 2. Percentage of girls enrolled in all junior secondary schools by
grade 1980/81
Grade
» •
T
1836
I
G
780
% T
42,5 1090
II
G
524
%
48,1
T
1397
III
G
571
Total
% T G %
40,9 4323 1875 43,<

Table 3. Percentage of girls enrolled in junior secondary schools by grade and zone - District of Ed-Duelm
1980/81 (schools surveyed)
ï~ H ÏÏÏ Total Grade
Enrol- Girls % Enrol- Girls % Enrol- Girls % Enrol- Girls % ment ment ment ment
Urban 850 409 48,1 605 306 50,6 679 302 44,5 2134 1017 47,7
Semi-urban 203 146 71,9 146 78 53,4 166 100 60,2 515 324 62,9
Rural 258 87 33,7 144 44 30,6 279 107 38,3 681 238 34,9
Whole District 1311 642 49,0 895 428 47,8 1124 509 45,3 3330 1579 47,4

53.
e. Due to the non-availability of data on pupils enrolled t>y grade in the
district of Ed-Dueim for the year 1979/80, the transition rate to junior
secondary education for the same district in the year 1980/81 cannot be
calculated. It is possible however to do it for the whole province.
Compute this transition rate for the whole province and give your comments.
Table 4. Apparent transition rate to junior secondary education in the
White Nile Province by sex 1980/81
Enrolment in grade VI Enrolment in grade I (inter- Apparent (Primary) - 1979/80 mediate)- 1980/81 transition rate
B G T B G T B G % T
7378 5317 12695 4622 2609 7231

d. Travelling distance and means of transportation
Complete the following table and give your comments with regard to 16 junior secondary schools surveyed in
the district of Ed-Dueim.
Table 5. Travelling distance and means of transportation for students in junior secondary schools - District
of Ed-Dueim 1980/81
Zone N° of resp. schools
Urban 8
%
Semi- 3 urban
%
Rural 5
%
N°of students
2139
515
681
d ¿1 5km
Foot Don- Bicy- Car Total keys cíe
1771 26 1797
82,8 - - 1,2 84,0
327 327
192 5 6 - 203
• • . ! , • , - , . , - , - • • -
5 < d <L 8
Foot Don- Bicy- Car Total keys cíe
24 24
1,1 - - - 1,1
168 20 - - 188
95 7 - - 102
" " • • • - •
d J7 8
Foot Don- Bicy- Car Total keys cle
20 75 8 67 170
0,9 3,5 0,4 3,1 7,9
- - - -
216 22 24 39 301
N° of
boarders
148
6,9
•
75

55.
II. Higher secondary education
The district of Ed-Dueim has 3 academic and one technical secondary
schools all of them located in the city of Ed-Dueim. Two of these academic
secondary schools are for boys and one is for girls. All of them are
providing boarding facilities. One of the boys' schools and the schools
for girls have been constructed by the parents and offered to the Ministry
of Education,
a. Transition rate
Complete the following table by computing the transition rate for
higher secondary grade I education. It is important to note that this
transition rate is not actual but merely shows the transfer of junior
secondary school leavers in 1979/80 to higher secondary grade I education
in schools located in the city of Ed-Dueim in 1980/81.
Table 6. Transition rate to higher secondary education in the district
of Ed-Dueim - 1980/81
Junior secondary leavers
Grade III 1979/80
821
Grade I Enrolment 1980/81
Total Of whom repeaters
Transition rate %
576 30
b. Travelling distance and means of transportation
Complete the following table with respect to school B and
comment upon the findings.
Table 7. Travelling distance and means of transportation for students
in higher secondary schools - District of Ed-Dueim 1980/81
School
A
B
C
N° of students
785
%
508 %
719
%
N° of boarders
498
63,4
60
397
55,2
Foot
100
12,7
300
148
20,6
J ?iiy-40
5,2
50
79
11,0
^ 5 k. Car
147
18,7
50
95
13,2
**% Total
287
36,6
400
322
44,8
Foot
-
¿ >s Bicy- Car
48
Tota
48

56.
SOLUTION TO EXERCISE N" IV
DIAGNOSIS OF ENROLMENT AT SECONDARY LEVEL
I. Junior secondary education
Table 1. Gross enrolment rate by sex and zone in junior secondary
education - District of Ed-Dueim 1980/81
Population 13-15 Enrolment Gross enrolment rate % Zone
M F T B G T M F T
Urban 1075 935 2010 1564 1208 2772 145,5 129,2 137,9
Semi-urban 1015 875 1890 266 385 651 26,2 44,0 34,4
Rural 18230 15800 34030 618 282 900 3,4 1,8 2,6
Whole District 20320 17610 37930 2448 1875 4323 12,O IO,6 11,4
Table 2. Percentage of girls enrolled in all junior secondary schools by
grade 1980/81
Grade
v.-
T
1836
I
G
780
% T
42,5 1090
II
G
524
%
48,1
T
1397
III
G
571
Total
% T G %
40,9 4323 1875 43,'

Table 3. Percentage of girls enrolled in junior secondary schools by grade and zone - District of Ed-Dueim
1980/81 (schools surveyed)
Total Grade
Zone Enrolment
II III
Girls Enrolment
Girls Enrolment
Girls Enrolment
Girls
Urban 850 409 48,1 605 306 50,6 679
Semi-urban 203 146 71,9 146 78 53,4 166
Rural 258 87 33,7 144 44 30,6 279
302
lOO
107
44,5 2134
60.2 515
38.3 681
1017 47,7
324 62,9
238 34,9
Whole District 1311 642 49,0 895 428 47,8 1124 509 45,3 3330 1579 47,4
en

58.
Table 4. Apparent transition rate to junior secondary education in the
White Nile Province by sex 1980/bl
Enrolment in grade VI Enrolment in grade I (inter- Apparent (Primary) - 1979/80 mediate)- 1980/81 transition rate
B G T B G T B G T
7378 5317 12695 4622 2609 7231 62,6 49,1 57,0

Table 5. Travelling distance and means of transportation for students in junior secondary schools - District
of Ed-Dueim 1980/81
Zone
Urban
Semi-urban
Rural
N° of resp. schools
8
%
3
%
5
%
N°of students
2139
515
681
Foot
1771
82,8
327
63,5
192
28,2
Don-Reys
-
-
5
0,7
d
£tiy-
-
-
6
0,9
¿1 5kra
- Car Total
26 1797
1,2 84,0
327
63,5
203
29,8
Foot
24
1,1
168
32,6
95
13,9
5 < d -^ 8
Don- Bicy-keys cle
-
-
20
3,9
7
1,1
Car
-
-
-
-
Total
24
1,1
188
36,5
102
15,0
d 7 8
Foot Donkeys
20 75
0,9 3,5
-
216 22
31,7 3,2
Bicycle
8
0,4
-
24
3,5
Car
67
3,1
-
39
5,7
Total
170
7,9
-
301
44,2
N° of
boarders
148
6,9
- V!
75
11,0

60.
II. Higher secondary education
Table 6. Transition rate to higher secondary education in the district
of Ed-Dueim - 1980/81
Junior secondary leavers
Grade III 1979/80
Grade I Enrolment 1980/81
Total Of whom repeaters
821 576 30
Transition rate %
66,5
Table 7. Travelling distance and means of transportation for students
in higher secondary schools - District of Ed-Dueim 1980/81
School
A
B
C
N° of students
785
%
508 %
719
%
N° of boarders
498
63,4
60 11,8
397
55,2
Foot
100
12,7
300 59,1
148
20,6
d^: 5
liiy-40
5,2
50 9,8
79
11,0
km Car
147
18,7
50 9,8
95
13,2
Total
287
36,6
400 78,7
322
44,8
Foot
-
5 <. d >S10 Bicy- Car Tote
48 4Í 9,5 9

61.
EXERCISE N'V
DIAGNOSIS OF STAFFING CONDITIONS
I) Primary education
1) Qualification of teachers
Until 1970, all primary teachers entered the profession only after
completing teacher training. The recruits to primary teacher training may
be either intermediate school-leavers who follow a four-year course of
training or secondary school-leavers who follow a one-year course of
training. But the subsequent rapid expansion of primary education has
meant that the demand for new teachers has increased faster than the
expansion of teacher training facilities, so that untrained secondary
school-leavers are now recruited as teachers as well. To cater for the
needs of these untrained primary teachers, a series of in-service education
institutes has been created, and one of these is located in Ed-Dueim.
On the basis of this information, complete the following table
and give your comments.
Table 1. Qualification and training of primary school teachers by zone.
District of Ed-Dueim 1980/81
Zone
Total
District
N° of schools surveyed
59
Category of teachers
Sec. school leavers (untrained)
Sec.school leavers trained on the job
268 22
Teacher training institute leavers
232
Total
Urban
Semi urban
Rural
17
%
6
%
36
%
63
32,0
33
172
8
4,1
2
12
126
63,9
31
75
197
100,0
66
259
522
2) Staffing ratio
The standard teaching load in primary schools is taken to be 24
periods per week. Most of the schools have introduced a double-shift
system, or sometimes a triple-shift system because of the lack of classromms
facilities. They thus teach less periods to all grades compared to schools
organized on a single shift basis.

62.
In a typical one-stream school, the same teacher teaches all the
subjects to the grade one i.e. 25 periods per week. The other teachers
teach on a subject basis to different classes and grades. The official
staffing ratio for a full one-stream primary school is 6 x 1 . 3 = 7 . 8 = 8 .
In the light of this information complete tables 2 and 3 and comment.

Table 2. Pupil/teacher ratio in primary schools - District of Ed-Dueim 1980/81
Zone
Urban
N° of sch. surveyed
17
Enrol- Total N° Total N° Enrol- N° of Pupils Total N° ment of of ment per teachers p e r o f tea_
teachers sections section per.. teacher ching periods per wk,
per section
Average teaching load
5526 197 101 54.7 1.95 28.1 3247 16,5
Semi urban 2514 66 46 1372
Rural 36 6985 259 207 6480
Seni urban %
Total District
Table 3.
Zone
Urban c O
59 15025 522 354
Primary teaching force by sex and zone - District of Ed-Dueim 1980/81
Type of schools surveyed Teaching force
B G C Total M F Total
6 4 7 17 76 121 197 35,3 23,5 41,2 100,0
11099
3
50,0
2
33,3
1
16,7
6
lOO,O
35 31 66
Ol
u>
Rural %
4
11,1
5 13,9
27 75,0
36 100,0
197 62 259
Total 13 14 32 59 308 214 522 District 22,O 23,7 54,2 100,0

II) Secondary education a) Comment on the following table with respect to training of intermediate and secondary school teachers.
Table 4. Training of teachers in junior and higher secondary schools - District of Ed-Dueim 1980/81
Zone Intermediate level
N° of schools Junior secondary school teachers surveyed Trained Untrained Total
Secondary level Higher secondary school teachers School Trained Untrained Total
Urban
Semi urban
Rural
8 %
3
%
5 %
57 56,4
tí
10
44 43,6
14
24
101 100,0
22
34
A %
B
C
13 48,2
7
9
14 51,8
9
13
27 100,0
16
22
Total
District
16
%
75 82 157 Total District
%
29 36 65
b) Staffing ratio
- Secondary school "A" - Enrolment in 1980/81: 785 - Total number of teachers: 27 Using the information available in table 5, calculate the following
- Average number of periods taught per teacher = - N° of teachers full-time equivalent = - Pupil/teacher ratio = - Full-time equivalent pupil/teacher ratio =
en
Note : A full-time teacher should teach 24 periods per week.
P

65.
Table 5. Weekly teaching load per teacher in secondary school "A"
Teacher N° of periods taught per week Subject
1 12 Religion 2 12 3 15
4 24 Arabic 5 24 6 22 7 16
8 18 English y 24 10 20 11 24
12 18 Mathematics 13 18 14 18 15 14 16 14
17 18 Science 18 18 ly 18 20 16
2\ 9 Geography 22 9 23 9
24 21 History 25 22
26 16 French
27 9 Physical education

66.
SOLUTION TO EXERCISE N° V
DIAGNOSIS OF STAFFING CONDITIONS
Table 1. Qualification and training of primary school teachers by zone
District of Ed-Dueim 1980/81
Category of teachers Zone N° of schools Sec. school Sec. school Teacher- Total
surveyed leavers leavers training (untrained) trained on institute
the job leavers
Urban
Semi urban
Rural
Total District
17 %
6 %
36
%
59
63 32,0
33 50,0
172
66,4
268
8 4,1
2 3,0
12
4,6
22
126 63,9
31 47,0
75
29,0
232
197 100,0
66 100,0
259
100,0
522
% 51,3 4,2 44,5 100,0

Table 2. Pupil/teacher ratio in primary schools - District of Ed-Dueim 1980/81
Zone
Urban
Semi urban
N° of sch. surveyed
17
Enrol- Total N° Total N° Enrol- N° of Pupils Total N° ment of of ment per teachers per of tea-
teachers sections section per teacher ching _________^: gp<-Mr.n periods per wk
Average teaching load
5526
2514
197 101 54.7 1.95 28.1
66 46 54,7 1.43 38.1
3247
1372
16,5
20,8
Rural 36 6985 259 207 33,7 1.25 27,0 6480 25,0:
Total District 59 15025 522 354 42,4 1.47 28,8 11099 21,3
Table 3. Primary teaching force by sex and zone - District of Ed-Dueim 198Q/81
Type of schools surveyed Teaching force
CTi «O
Zone
Semi urban %
B Total M Total
Urban 6 4 T 17 % 35,3 23,5 41,2 100,O
76 121 197 38,6 61,4 lOO,O
3 2 1 6
50,0 33,3 16,7 100,0
35 31 66
53,0 47,0 100,0
Rural 4 5 27 36 % 11,1 13,9 75,0 lOO,O
197 62 259 76,1 23,9 1O0,O
Total 13 14 32 59 308 214 522 District 22,0 23,7 54,2 lOO,0 59,0 41,0 100,0
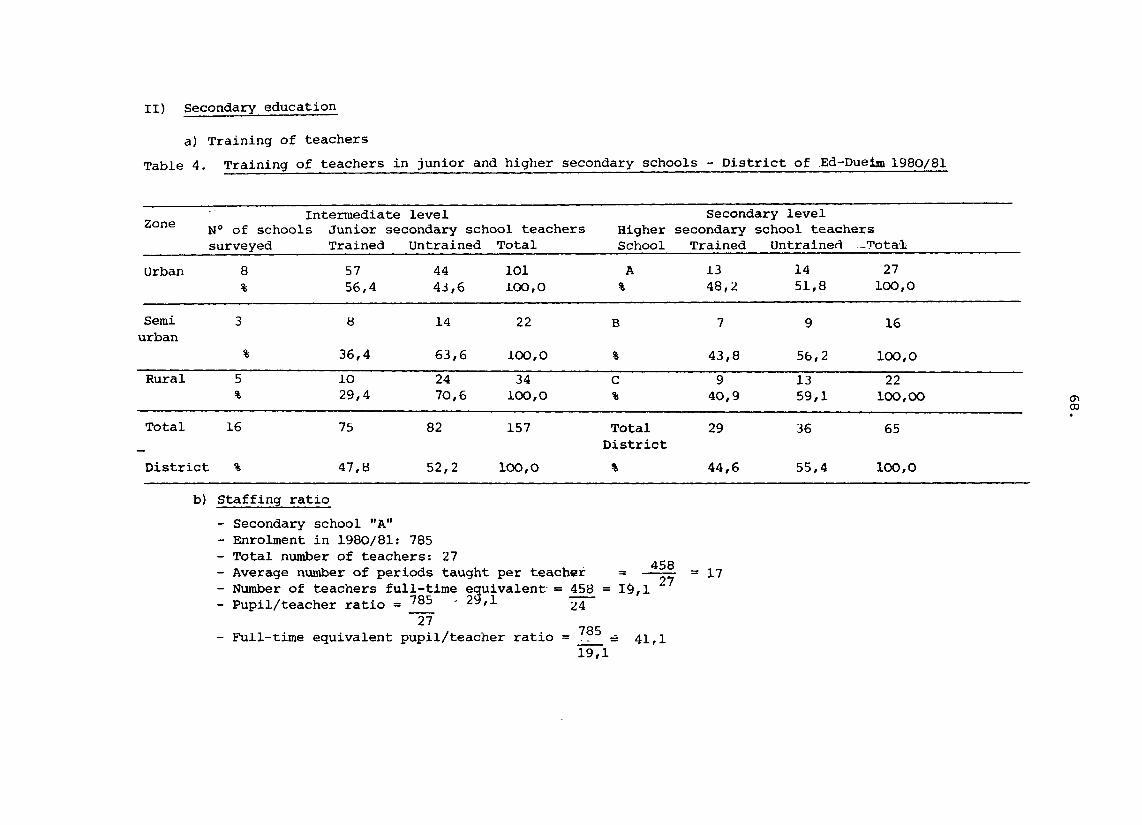
II) Secondary education
a) Training of teachers
Table 4. Training of teachers in junior and higher secondary schools District of .Ed-Duelm 1980/81
Zone
Urban
Semi urban
Rural
]
Total
District
b)
Intermediate level H° of schools Junior secondary school teachers surveyed Trained Untrained Total
8 %
3
%
5 %
16
%
Staffing
57 56,4
8
36,4
IO 29,4
75
47,8
ratio
44 43,6
14
63,6
24 70,6
82
52,2
101 100,0
22
100,0
34 100,0
157
ioo,o
Higher School
A %
B
%
C %
Total District
%
Secondary level secondary school teachers Trained Untrained -Total
13 48,2
7
43,8
9 40,9
29
44,6
14 51,8
9
56,2
13 59,1
36
55,4
27 100,0
16
100,0
22 100,OO
65
100,0
CO • • •
- Secondary school "A" - Enrolment in 1980/81: 785 - Total number of teachers: 27 - Average number of periods taught per teacher 458
27 = 17
- Number of teachers full-time equivalent = 458 = 19,1 - Pupil/teacher ratio = 7 8 5 ' 2^'1 ¿4
27 785
- Full-time equivalent pupil/teacher ratio = __ =s 41,1 19,1

69.
EXERCISE N° VI
DIAGNOSIS OF EDUCATIONAL FACILITIES
I. Primary education
a) Teaching spaces
Using the data available in Appendix 1, complete tables 1
and 2 and give your comments.
Table 1. Analysis of educational spaces per zone - District of Ed-Dueim
1980/81
Zone Total N° of class- Total class- Area per Area per enrol- rooms rooms area classroom pupil ment sq m sq m sq m
Urban 5906 85 3550
Semi urban 2540 41 1739
Rural 92)4 199 8813
Total District 17660 325

Table 2. Analysis of primary education classrooms (area and state) in the District of Ed-Dueim
1980/81 (schools surveyed)
Zone Total N° of schools Enrol- N° of double N° of sections N° of class- State of classrooms enrol- raent per shift sch. rooms Good or Bad Needing ment school regular main
tenance
Urban
Semi urban
Rural
5906 %
2540 %
9214 %
17
6
36
347
423
256
11 64,7
1 16,7
15 41,7
105
44
208
85 100,0
41 100,0
199 100,0
58 68,2
6
89
-
-
8
27 31,8
35
102
Whole Dis- O trict 17660 59 299 27 357 325 153 8 164
% 45,8 100,0

71.
b) Other facilities, equipment and services available
Complete the following tables 3 and 4 with regard to the
availability of other facilities, equipment and teaching material in
primary schools.
Table 3. Other facilities and services available in primary schools
by zone - District of Ed-Dueim 1980/81
Zone
Whole District
N° of responding schools
Schools provided with electricity
56
Schools Schools Schools provided provided having with with storage water latrines room
Urban %
Semi urban
%
Rural %
16
6
34
7 43,7
2
2
16 100,0
5
23
il 68,7
3
10
7 43,7
3
13
11 44 24 23

Table 4. School furniture and textbooks available in,primary schools - District of Ed-Dueim 1980/81
Zone Pupils, covered in the survey
, Availability of seats Seat& in Seats to Shortage good be recondition placed
Availability of textbooks Textbooks Available To be re-needed placed
Shortage
Urban 5906 4048 68,5
547 9,3
1311 22,2
20571 6578 32,0
4032
31,7
5278 25,7
2697
21,2
8715 42,3
5990
47,1
Semi urban
2540 1108
43,6
651
25,6
781
30,8
12719
Rural 8752 %
3813 2127 2812 51380 15478 14277 21625
Total District
%
17198 8969 3325 4904 84670 26088 22252 36330
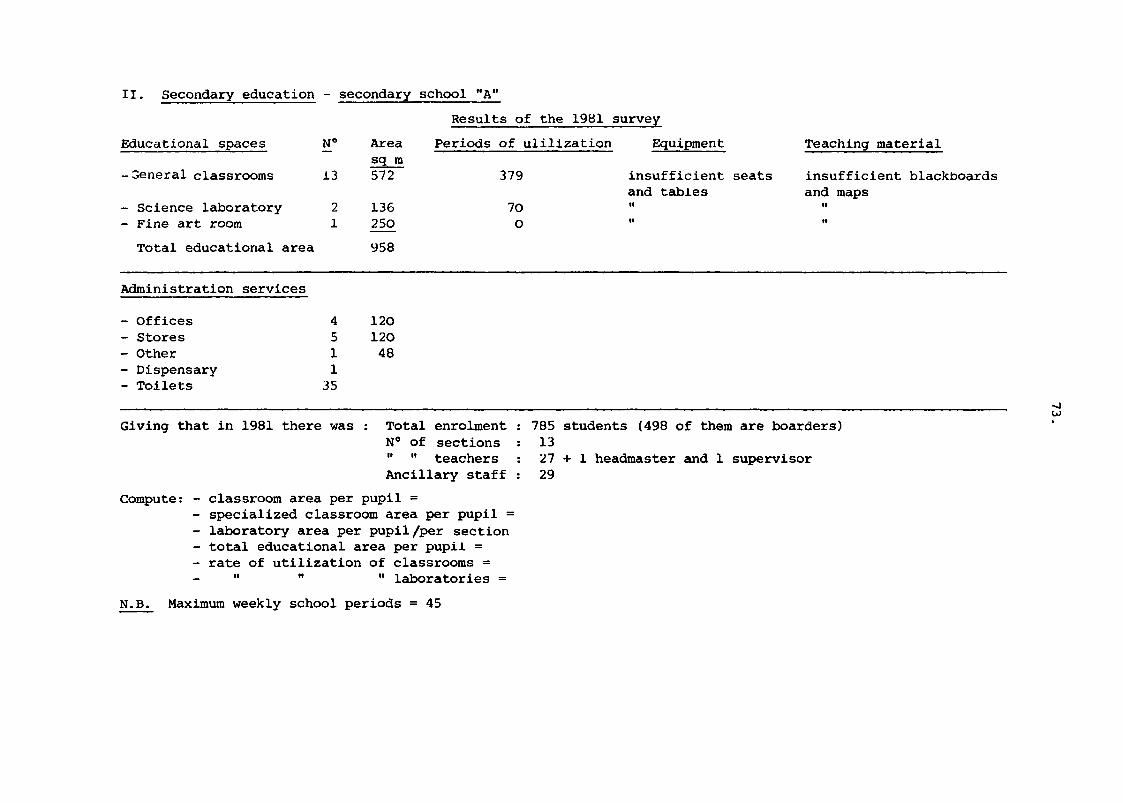
II. Secondary education - secondary school "A"
Results of the 1981 survey
Educational spaces N° Area Periods of ulilization Equipment sq m
-General classrooms 13 572 379 insufficient seats and tables
- Science laboratory 2 136 70 " - Fine art room 1 250 O "
Total educational area 958
Administration services
- Offices 4 120 - Stores 5 120 - Other 1 48 - Dispensary 1 - Toilets 35
-j
w Giving that in 1981 there was : Total enrolment : 785 students (498 of them are boarders)
N° of sections : 13 " " teachers : 2 7 + 1 headmaster and 1 supervisor Ancillary staff : 29
Compute: - classroom area per pupil = - specialized classroom area per pupil = - laboratory area per pupil /per section - total educational area per pupil = - rate of utilization of classrooms =
" " " laboratories = N.B. Maximum weekly school periods = 45
Teaching material
insufficient blackboards and maps
it

Appendix 1. Data on educational spaces in primary schools - Semi-urban zone - District of Ed-Dueim 1980/81
School N°
Total enrolment
N° of sections
Shifts Classrooms N° Surface State of classrooms
Good or Bad Needing regular mainte
nance
Head Staff Storage Teachers' master's room room houses office
1
2
3
4
5
6
341
345
694
408
339
413
6
6
12
8
6
6
r-l
1
2
1
1
1
6 x
6 x
11 x
6 x
6 x
6 x
40
40
49
40
40
40
6
6
11
6
1
1
1
1
1
1
1
1
1
1
1
1

75.
SOLUTION TO EXERCISE N° VI
DIAGNOSIS OF EDUCATIONAL FACILITIES
I. Primary education
a) Teaching spaces
Table 1. Analysis of educational spaces per zone - District of
Ed-Dueim 1980/81
Zone
Urban
Semi
urban
Rural
Total
Dis
trict
Total enrolment
5906
2540
92)4
17660
N° of classrooms
85
41
199
325
Total class rooms area
sq m
3550
1739
8813
14102
Area per Area per classroom pupil sq m sq m
41,8
42,4
44,3
43,4
0,60
0,68
0,96
0,80

Table 2. Analysis of primary education classrooms (area and state) in the district of Ed-Dueim
1980/81 (schools surveyed)
Zone Total N° of schools enrolment
Urban 5906 17
%
Semi
urban 2540 6
%
Rural 9214 36
%
Whole 17660 59
District %
Enrolment N° of double N° of sections per school shift schools
347 11 105
64,7
423 1 44
16,7
256 15 208
41,7
299 27 357
45,8
N° of class State of classrooms rooms „ , „ , .
Good or Bad. Needing regular maintenance
85 58 - 27
100,0 68,2 - 31,8
41 6 - 3 5
100,0 14,6 - 85,4
199 89 8 102
100,0 44,7 4,0 51,3 -J CTi
325 153 8 164
100,0 47,1 2,5 50,4

77.
b) Other facilities, equipment and services available
Table 3. Other facilities and services available in primary schools
by gone - District of Ed-Dueim 1980/81
Zone N° of res- Schools Schools Schools Schools ponding provided provided provided having schools with with with storage
electricity water latrines room
Urban 16 7 16 11 7
% 43,7 100,O 68,7 43,7
Semi
urban 6 2 5 3 3
% 33,3 83,3 50,0 50,0
Rural 34 2 23 IO 13
% 5,9 67,6 29,4 3b,2
Whole
District 56 11 44 24 23
% 19,6 78,6 42,9 41,1

Table 4. School furnitures and textbooks available in primary schools - District of Ed-Dueim 1980/81
Availability of seats Availability of textbooks Seats in Seats to Shortage Textbooks Available To be re- Shortage good be re- needed placed condition placed
Urban
%
Semi urban
%
Rural %
5906
2540
8752
4048 68,5
1108
43,6
3813 43,6
547 9,3
651
25,6
2127 24,3
1311 22,2
781
30,8
2812 32,1
20571
12719
51380
6578 32,0
4032
31,7
15478 30,1
5278 25,7
2697
21,2
14277 27,8
8715 42,3
5990
47,1
21625 42,1
Total 17198 8969 3325 4904 84670 26088 22252 36330 District
% 52,2 19,3 28,5 30,8 26,3 42,9
Zone Pupils, covered in the survey

79.
II. Secondary education - Secondary school "A" 572
- classroom area per pupil = rj-r- = 0,73 sq m 386
- Specialized classroom area per pupil = -=^r = 0,49 sq m /ob
- Laboratory area per pupil/per section = Z^. = 60,4; 136 = 68 fin
958 TTÍ A ~ 1'i^ sq.m - Total educational area per pupil = -= r— = 1,22 sq m b 0» 4
78b 379
- Rate of utilization of classrooms =rrr 7=- = 64,8% 13 x 45
of laboratories = -~r=- = 77,8 % 2x45
N.B. Maximum weekly school periods =45

80.
EXERCISE N° VII
PROJECTION OF ENROLMENT IN PRIMARY EDUCATION
When projecting enrolment in primary education one has to :
- project school-age population,
- make some assumptions concerning the evolution of the rate of admission,
- project admission,
- define the rates of promotion, repetition and drop-out to be used in
the future,
- compute future enrolment.
1. Projection of enrolment in the rural zone of Ed-Dueim
District : assumptions
a) The seven-year old population will represent 4.6 per cent per
year of the total projected population in the zone as done by the
Central Statistical Department.
b) The rates of promotion, repetition and drop-out observed in
1980/81 will remain the same all over the period 1980/81 - 1990/91.
c) Two alternatives are used concerning the evolution of the
rates of admission : alternative A_ with 100% as admission rate in
the year 1990/91 and alternative B with 40% as admission rate in the
year 1990/91.
In the light of these assumptions complete the following tables
and give your comments.

81.
Table 1. Projection of admissions in primary schools - rural zone of
Year
1980/81
1981/82
1982/83
1983/84
1984/85
1985/86
1986/87
1987/88
ly88/89
1989/90
1990/91
Ed-Dueim district 1980/81 -
N° of 7-yr olds
28320
29284
30274
31297
32355
33449
34579
35748
36y56
38205
39497
- 1980/81 -
Alternative A
Admission rate %
10,6
15,0
20,0
25,0
35,0
45,0
55,0
65,0
75,0
85,0
100,0
New adm.
2989
1990/91
Alternative B
Adm. rate %
10,6
10,7 *
10,8 *
12,0
13,5
15,0
20,0
25,0
30,0
35,0
40,0
New adm.
2989
x estimated

Table 2. Projection of enrolment by grade (rural zone) District of Ed-Dueim - 1980/81 - 1990/91
(Alternative A)
Year
1980/81
1981/82
1982/83
1983/84
1984/85
1985/86
1986/87
1987/88
1988/89
1989/90
1990/1991
New Grade admissions
2989
p T R p T R P T R P T R P T R P T R P T R P T R P T R P
I
3368
II
2383
III
2151
IV
1737
V
1524
VI
1380
Totai
12543
Note: R = Repeaters P = Promoted T = Total or admitted

Table 3. Projection of enrolment by grade (rural zone) District of Ed-Dueim - 1980/81 - 1990/91
(Alternative B)
Year
1980/81
1981/82
1982/83
1983/84
1984/85
1985/86
1986/87
1987/88
1988/89
1989/90
1990/1991
New Grade admissions
2989 R P T R P T R P T R P T R P T R P T R P T R P T R P T R P
I
3368
II
2383
III
2151
IV
1737
V
1524
VI
1380
Total
12543
Note: R = Repeaters P = Promoted T = Total or admitted

84.
2. Draw a graph showing the growth of enrolment in the rural zone of
Ed-Dueim from 1980/81 to 1990/91 and compute the average growth rate
for the same period for each of the two alternatives.

85.
Annex 1. Promotion, repetition and drop-out rates -District of Ed-Dueim 1980/81
Grade
Promotion
Repetition
I
83,0
13,0
II
80,0
14,0
III
77,0
16,0
IV
79,0
15,0
V
78,0
16,0
VI
19,0
Drop-out 4,0 6,0 7,0 6,0 6,0

86.
SOLUTION TO EXERCISE N° VII
PROJECTION OF ENROLMENT IN PRIMARY EDUCATION
Table 1. Projection of admissions to primary schools for the rural
zone of Ed-Dueim District (1980/81 - 1990/91)
Year N° of.,7-yr olds
Admission New adm. Admission New adm. rate % rate %
1980/81
1981/82
1982/83
1983/84
1984/85
1985/86
1986/87
1987/88
1988/89
1989/90
1990/91
28320
29284
30274
31297
32355
33449
34579
35748
36956
38205
39497
10,6
15,0
20,0
25,0
35,0
45,0
55,0
65,0
75,0
85,0
ioo,o
2989
4393
6055
7824
11324
15052
19018
23236
27717
32474
39497
10,6
10,7 *
10,8 *
12,0
13,5
15,0
20,0
25,0
30,0
35,0
40,0
2989
3133
3270
3756
4368
5017
6916
8937
11087
13372
15800
estimated

Table 2. Projection of enrolment by grade (rural zone) District of Ed-Dueim 1980/81 - 1990/91 (Alternative A)
Year New admis
sions
1980/81 2989
1981/82 ¿TO'? .
1982/83 6055
1983/84
7824
1984/85
11324
1985/86 15052
1986/87 .
xyuiu
1987/88
zJ/Ju —• ' —-—
1988/89 27717
1989/90 J Z f è /H •• - • • ••--
1990/91 39497
Grade
R
T R
rP T
R rf> T
R PP
T
R *P T
R
T
R
T
R >P T
R
T
R ¿P T
I
3368
439*3* 4831
628 6055 6683
869
7824 8b$3
1130
11324 12454
1619
15052 16671
2167 19018 21185
2754 23236 25990
3379 27717 31096
4042 32474 36516
4747 39497 44? 44
II
2383
•Mi 3129 438
4010 4448
623 5547 6170
864 7215 8079
1131 10336 11467
1605 13826 15441
2161 17584 19745
2764 21572 24336
3407 25810 29217
4090 30308 -Í41QR
III
2151
1 & 6 2250 360
2503 2863
458 3558 4016
643 4936 5579
893 6463 7356
1177 9173 10350
lb56 12352 14008
2241
15796 18037
2886 19469 22355
3577 23374 26951
IV
1737
16Ì6 1917 288
1732 2020
303 2205 2508
376 3092 3468
520 4296 4816
722 5564 6286
943 7969 8912
1337 10786 12123
1816 13887 15703
2355 17213 19560
V
1524
1616 259
1514 1773
284 1596 1880
301 1981 2282
365 2740 3105
497 3805 4302
688 4966
5654
905 7040 7945
1271 9577 10848
1736 12408 14144
VI
1380
m 1451 276 1260 1536
292 1383 1675
318 1466 1784
339 1780 2119
403 2422 2825
537 3356 3893
740 4410 5150
979 6197 7176
1363 8461 9824
Total
12543
15194
19323
24942
33646
45534
603B9
78202
98687
121B15
149130
CO •
R = Repeaters P = Promoted or Admitted T = Total

Taöle 3. Projection of enrolment by grade (rural zone) District of Ed-Dueim 1980/81 - 1990/9I (Alternative B)
Year New Grade ï ïï ÏÏÏ IV V VI Total adm.
1980/81 2989 3368 2383 2151 1737 1524 1380 12543
1981/82 R 438 334 344 261 244 262 3133 P 3133 2795 1906 1656 1372 1189 13934
T 3571 3129 2250 1917 1616 14bl
1982/83 R 464 438 360 288 259 2/6 3270 P 3270 2964 2503 1732 1514 1260 15328
T 3734 3402 2863 2020 1/73 1536
1983/84 R 485 476 458 303 284 292 3756 P 3756 3099 2722 2205 1596 1383 17059
T 4241 3575 3180 2508 1880 1675
1984/85 R 551 500 509 376 30l 318 4368 P 4368 3520 2860 2449 1982 1466 19200 co
T 4919 4020 3369 2825 2283 1784
1985/86 R 639 563 539 424 365 339 5017 P 5017 4083 3216 2594 2232 1780 21791
5656 4646 3755 3018 2597 2119
1986/87 R 735 650 601 453 416 403 6916 P 6916 4694 371/ 2891 2384 2026 25886
T 7651 5344 4318 3344 2800 2429
1987/88 R 995 748 691 502 448 389 8937 P 8937 6350 4275 3325 2642 2184 31486
T 9932 7098 4966 3827 3o90 2573
1988/89 R 1291 994 795 574 494 489 11087 P 11087 8244 5678 3824 3023 2410 38903
T 12378 9238 6473 4398 3517 2899
1989/90 R 1609 1293 1036 660 563 551 13372 P 13372 10274 7390 4984 3474 2743 47949
T 14981 11567 8426 5644 4037 3294
1990/91 R 1948 1619 1348 847 646 626
15800 P 15800 12434 9254 6488 4459 3.149 58600
T 17/48 14053 10602 7335 5105 3775

89.
Graph 1. Growth of enrolment in primary education - Rural zone of Ed-Dueim District 19ÜO/81 - 1990/91
~rm-
Alternativé A tAveragp growth rate •=• 28/1%)
(Av«ragi2 6,7%)
PH
CO \ o CO
CM 00 ^ r-t CO
m CO \ CM CO
*r CO ^ m CO
in CO \ rr CO
^ CO •v. in CO
r-00 \ <D CO
CO CO
CO
CO
CO
co
O Ti V, CM 3)
(Ti • ^
O

90.
EXERCISE N° VIII
NORMS AND STANDARDS FOR JUNIOR SECONDARY SCHOOLS
I. In the city of Shabasha which forms part of the semi-urban zone of
Ed-Dueim District, there was 191 pupils in the sixth grade of primary
education in 1980/81. Assuming that :
- all these 191 pupils are living in a catchment area of 5 km radius
- there will be 45% of transition rate to grade I in junior secondary
education for the year 1981/82
- the pupil/class ratio is 40 - 45 in junior secondary schools
- the grade to grade progression rate in junior secondary education is
95%
- there are no bussing and no boarding facilities provided
a) Compute the number of students and the number of sections in grades
I, II and III in a full day junior secondary school.
II. The time-table for grades I to III is as follows:
Subject Form
Religion
Arabic
English
Mathematics
Science
Geography
History
Civics & Social Sciences
I
4
9
9
6
4
3
2
1
II
4
9
9
6
4
3
2
1
III
4
9
9
6
4
3
2
1
Physical education 1 1 1
Total 39 39 39
a) Compute the total number of teachers required for a co-educational
junior secondary school and the corresponding pupil/teacher ratio assuming
that the :
- Teacher work load = 24 periods per week
- Professor of religion can teach arabic also
- Professor of history can teach geography, civics and social sciences
b) Compute the number of equivalent full-time teachers and the pupil/
teacher ratio in full-time equivalent.

91.
III. Teaching area and rate of utilization
a. Compute the number of general and multipurpose classrooms required
assuming that :
- science is taught in a multipurpose classroom,
- all other subjects are taught in general classrooms except physical
education,
- the maximum utilization of classrooms is 45 periods per week,
- the maximum time utilization rate of classrooms is 80%
Apply the formula n = "ic
i x p
n = number of classrooms required
c = total periods of teaching per week
i = maximum index or rate of utilization as given
p = maximum periods of utilization of one classroom per week
b. Compute the effective utilization rate of general and multipurpose
classrooms. Apply the formula i = -fee
nxp
c. Compute the teaching area required assuming that :
- a multipurpose classroom has an area of 80 sq. m
- a general classroom has an area of 60 sq. m
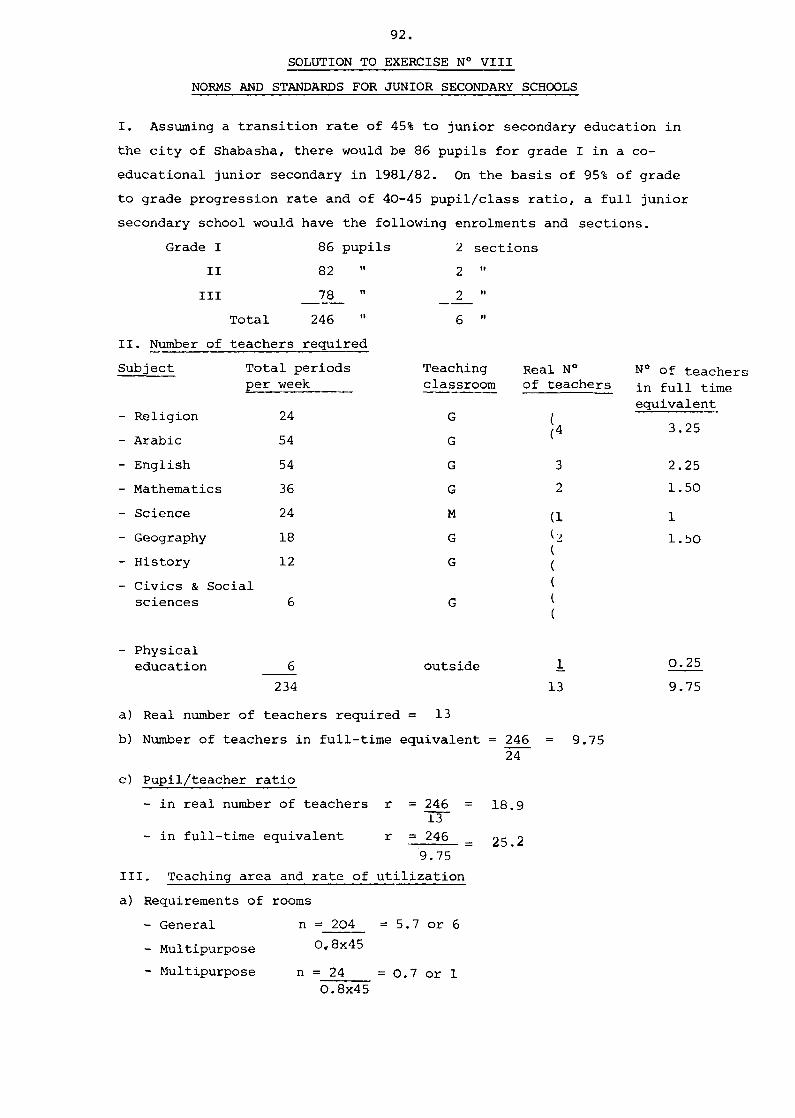
92.
SOLUTION TO EXERCISE N° VIII
NORMS AND STANDARDS FOR JUNIOR SECONDARY SCHOOLS
I. Assuming a transition rate of 45% to junior secondary education in
the city of Shabasha, there would be 86 pupils for grade I in a co
educational junior secondary in 1981/82. On the basis of 95% of grade
to grade progression rate and of 40-45 pupil/class ratio, a full junior
secondary school would have the following enrolments and sections.
Grade I
II
III
II. Number of
Subject
- Religion
- Arabic
- English
- Mathematics
- Science
- Geography
- History
Total
teachers
86
82
78
246
pupils
•i
ti
H
required
Total periods per
- Civics & Social sciences
- Physical education
week
24
54
54
36
24
18
12
6
6
2 sec
2 "
__?_ " 6 "
Teaching classroom
G
G
G
G
M
G
G
G
outside
tions
Real N° of teachers
( (4
3
2
(1
' i
l_ 234 13
a) Real number of teachers required = 13
b) Number of teachers in full-time equivalent = 246 = 9.75
c) Pupil/teacher ratio
- in real number of teachers r = 246 = 13
- in full-time equivalent r = 246 _
9.75
III. Teaching area and rate of utilization
a) Requirements of rooms
- General n = 204 = 5.7 or 6
- Multipurpose
24
18.9
25.2
- Multipurpose
0,8x45
n = 24 0.8x45
N° of teachers in full time equivalent
3.25
2.25
1.50
1
l.bO
0.25
9.75
= 0.7 or 1

93.
D) Effective rate of utilization
- For general classrooms i = 204 = 75.6% 6x 45
- For multipurpose classroom i = 24 = 53.3%
1x45
c) Teaching area
- General 6 x 60 = = 360 sq.m
- Multipurpose 1 x 80 = 80 sq.m
Total 440 sq.m

94.
EXERCISE N° IX
PROSPECTIVE PRIMARY SCHOOL MAP
(ARASHKOUL RURAL COUNCIL)
Arashkoul rural council is one of the six rural councils in the
district of Ed-Dueim. The total population of the council (nomads
included) is estimated to be 175950 inhabitants in 1980/81 (see table 1
of exercise N° II) of whom 109000 are settled in 81 villages and the
remaining 66950 are considered as nomadic and semi-nomadic tribes people.
The 7-12 age group in 1980/81 is estimated at 20012 for the settled
population and 12292 for the nomads.
The primary school network in the council consists of 21 schools
mainly concentrated in the villages that lie on the white Nile Western
bank. Admissions in these 21 primary schools in 1980/81 are approximately
105y pupils, which corresponds to a gross intake rate of 13.1%, the
total enrolment at primary level is about 4276 which corresponds to a
gross enrolment rate of 12,7% (see table 1 attached).
Assuming universal primary education should be attained by the
year 2000, admission rate in the rural zone of Ed-Dueim district will
increase to 40% by 1990/91 (alternative B in the exercise on enrolment
projection). Enrolment in the rural zone has been projected at 58600
in 1990/91 which corresponds to an enrolment rate of 36%. We assume this
enrolment rate should be the same in all rural councils included in the
rural zone, among which Arashkoul rural council.
The Department of Statistics has prepared projection of the total
population and of the 7-12 age group for the Arashkoul rural council and
for each village in the council (see table 3).
According to these projections, primary school enrolment in the
whole council should be 16069 in 1990/91 (36% of the 7-12 age group).
We assume that this enrolment will be distributed in the following way :
1990/1991 7-12 age group enrolment enrolment rate %
Settled population 28090 50 14045
Nomadic tribes people 1654b 12.2 2024
Total council 44635 36 16069
You are asked to prepare proposals for the expansion of the
school network which will allow to enrol 50% of the settled school-age
population and 12.2% of the nomadic school-age population, ensure equality

95.
of opportunity all over the rural council and at the same time respect
the national norms concerning the minimum school size.
1. Applying the b0% enrolment rate, estimate the potential enrolment in
each village of the rural council by 1990/91 (table 3).
2. Using table 3 and map N° 1 , propose the location of new schools and
the expansion of existing ones. The following norms and criteria should
be applied.
- pupil can walk up to 5 km;
- whenever possible, schools of 300 pupils or more should be opened
(6 sections of 50 pupils). This may require the opening of school
enrolling children of several neighbouring villages (the catchment areas
radius should however not exceed 5 km);
- all schools should have 3 teachers or more (3 sections of 50 pupils =
150 pupils);
- îf a village has between 100 and 150 potential pupils and if it is not
located within 5 km of an existing or proposed school, the opening of a
school will be recommended. No school will be located if it does not have
at least 100 pupils.
3. Compute for each of the proposed or existing schools:
- the number of sections assuming 50 to 55 pupils per section,
- the number of teachers required on the basis of 1.33 teacher per class
(present regulation),
- the number of classrooms required excluding first the possibility of
double shift and second allowing the use of double shift,
- make some suggestions on how to enrol nomads in the council,
- comment on the findings.

Table 1. Basic data on primary schools - Arashkoul Rural Council 1980/81
Name of s c h o o l
A r i k
A r i k
She ikh E l - K h a n j a r
E l - S i f e r a y a
lin Gidad
Arashkou l
Banunab
E l - S h i t e i b
E l - T u r a a M
S e l a k e
E l - O s h e r a
E l - L a o u t a
El-Awamra
E l -Mana ra
V i l l a
22
22
1
27
30
20
15
16
9
9
7
1 1
34
28
29
1P Type
B
G
C
B
G
C
II
C
It
II
E n r o l m e n t T o t a l
262
239
72
327
1 5 1
1 1 0
2 1 1
3 2 1
1 4 4
1 9 3
1 3 0
3 2 2
233
2 5 6
2 3 3
G i r l s
_
2 3 9
34
1 5 6
4 8
44
82
1 3 8
-
1 9 3
39
1 3 5
8 5
9 8
1 0 8
N° of s t r e a m s
6
6
2
6
4
6
6
6
6
6
3
6
6
6
6
S h i f t s
2
2
1
1
2
2
3
1
1
1
1
1
1
1
1
T e a c h e r s
T o t a l
8
IO
2
7
4
9
7
7
7
6
5
7
7
7
8
T r a i n e d
2
*J
2
-
-
3
2
3
4
4
3
3
4
3
4
T o t a l
6
6
2
6
4
6
4
6
6
6
3
6
6
b
6
C l a s s r o o m s
Need ing m a i n t e n a n c e
6
3
2
2
-
-
-
b
6 Vi
4 ?
3
4
3
4
b

Table !•• (end)
Name of school Village N° Type
El-Geteina 55 C
El-Humara 50 "
El-Halba 65
Wad Gabur 72 "
Khur El-Mutrag 33 "
Idd El-Oud 39
Total
Enrolment No. of Shifts Total Girls streams
187 39 6 1
114 27 2 1
226 75 6 1
174 37 6 1
166 16 4 1
205 20 6 1
4276 1613 105
Teachers Classrooms
Total Trained Total Needing maintenance
9 4 6 4
4 2 2 2
8 3 6 5
7 3 6 6
4 - 4 4
4 - 6
137 51 109 70
vo

98.
Table 2. Projected population of Arashkoul - Rural Council by village,
and Age (1990/91)
I. Settled population
Population Age 7 Age 7 - 1 2 Village
Both sexes Both sexes
1 110 ,- 455 2 3 5 141 3 6b • 221
4 ¿7 108 5 28 117
6 27 1C6 7 7^ 302 S ^1 129 9 ' 2£4 1098
1C 52 ! 212
_2-
y
11 60 249 12 34 137
13 68 292
14 27 108 15 105 434 16 136 563
17 32 134 18 70 289
19 60 2^7 20 _ _ 201 1210
21 101 ^15
22 499 2075
23 53 222 24 23 11S
25 29 122 2 6 1-4-9 623
27 300 1253 28 68 292
29 92 386 30 21 89
6 1 - ?••
3¿ . 85 355 33 80 3 í ; n

9 9 .
Table 2 . (cn td . )
Popula t ion Age 7 Age 7 - 1 2 V i l l a g e
Both sexes Both sexes
34 180
44
59 102 60 122
61
62 24 63 7 1
64 i ?
65 136 66 64
750 7'5 77 ; a i 36 30 ^aç
37 57 236 38 57 239
39 224 923
^° 53 218
^ 133 555 ^ 2 92 386
^3 75 313 92 386
^5 134 46 64
47 73 48
49 80 50 74 ? 1 2
56D ?68
503
532
51 131 5/ 9
563 52 136
53 20 81
54 35 145 55 81 56 21
57 22
58 64 268
335 89 94
425 ^00
50 2CÖ
" ' ; S Í" 7 CI
565
252

Table 2. (end)
100.
Population Village
Age 7
Both sexes
Age 7 - 1 2
Both s e x e s
67 68
69 70
184
20
52 46
770 82
215 187
71
72
75 74
75 76 77 78 79 80
151
87 81
?e
49
49
85
629 563
s -' y
/ i c e
196
201
201
555
Tota l 6750 28090
I I . Nomads 4145 16545
Grand To ta l 10Ö95 44635

IO!.
"f* ílíN
.^
^
iniM
aw* -
a«
^-/ •
in»
./ co
5» §
•
c-JJ-.-
/ / / /
o> C
M«
»•
•s s
8/
s»4
$• «•
r4
J =
/ /
| /§
o
/
/
/
* /
o 8«
CO
« 4
<*>•
"•3
2 in
*
N
CM
« 4
co
a
5 un»
$•
S«
* /•
s / m
H
UJI
*l 1 3 O
m Cou nei i 1 1 1
~ Sand H
Q
T3 3
ce
Village
Truck
•
ool
.c <J
(/) >. Primar
<
/ 1/
/ /
/ /
/ /
ajNiA
oya NV
doaHO
M

102.
SOLUTION TO EXERCISE N° IX
PROSPECTIVE PRIMARY SCHOOL MAP
(ARASHKOUL RURAL COUNCIL)
If there is no dramtic change in the population distribution
between the rural area where the populations are settled and the
outlying area where the populations are mainly nomadic, and if there is
no dramatic change among villages after 1980/81 - no special migration
in particular - one can estimate the school-age population for 1990/91
as presented in table N° 2 of the simulation exercise.
And if the educational policy is to universalize primary education
by the year 20O0, the struggle for it must take into account the present
situation where the schooling of nomadic and semi-nomadic tribes
people is still very low. Therefore one of the corner-stones of this
educational policy should be the reduction of disparities between social
groups and zones as it appeared from the diagnosis and analysis. This
would mean taking special measures in favour of nomadic populations.
These measures could take different forms :
- try to settle down the nomadic and semi-nomadic tribes
people in order to provide them with the same kind of educational services
provided to settled population in the villages. Such a measure could
encounter many difficulties to be implemented, as many tribes could
refuse it;
- try to create mobile schools moving with the tribes from one
place to another. The teachers who would teach in these mobile schools
could be taken essentially from the tribes themselves and trained
adequately;
- provide boarding facilities at least to start with as a
temporary solution for putting down the adequate long-term solutions.
Any of these measures would necessitate further in-depth
studies about the various degrees and patterns of nomadism which, as
a matter of fact, tend to merge into one another, in order to take the
specific measures adapted to the pattern of life of nomadic tribes.
Meanwhile, it seems uneven to continue with the same trends, where the
emphasis in educational development is mainly put in general on urban
areas as against rural areas and on settled population as against
nomadic population in the rural areas themselves.

103.
As far as the primary schooling of the settled population in the
81 villages of Arashkoul Rural Council is concerned, the proposals for
reorganizing the corresponding primary school network imply also an
inflexion on the existing supply policy of educational services. This
inflexion would mean more emphasis to be put on developing primary
education in the villages located in the outlying area on one hand, and
a reorganization policy aiming at a better utilization of available
resources in the reorganized school network on the other hand.
The proposals concerning the location of new schools, the
expansion of existing ones and the computation of requirements in terms
of sections, teachers and classrooms are given in map N° 1 and table N° 2.
It appears from these proposals and calculations that, in order to
achieve 50% of enrolment in the years 1990/91 for the 7-12 school-age
population settled in the 81 villages of Arashkoul Rural Council, we
need a large number of classrooms to be built and a large number of
teachers to be trained. However, this large number of classrooms could
t>e reduced by more than 76% of the system of double shift is introduced,
provided that the norm of 50-55 pupils per section is respected.
The problem is to see to what extent the teacher training system
in the region is in a position to produce the sufficient number of
trained teachers and to train on the job those who are untrained.

15
—*—*—~*-~-^*-±-— — "- - - - — - m rr "
„enrolled
104.
Table 1. Projected school-age of Arashkoul - Rural Council by village,
and % to be enrolled (1990/91)
I. Settled population
Population Age 7 Age 7 - 12 Nos* t o b e
Village Both sexes Both sexes
1 110 ' 4 5 5 2 2 8
2 : 5 -141 7i
5 £(> 221 i n
4" ¿ ? 108 !>4
5 25 117 5 y
6 2? -ICS 54
7 73 502 I5i
S 51 129 6 5
9 ' 204 1098 5'49
1C 52 î 212 loe
1" 60 249 125
12 54 137 69 1 3 68 292 146
^ 27 108 54
15 105 434 217
156 563 28ü
17 32 154 67
18 70 289 1 4 5
1 9 60 247 124 2 0 . . 29I 1210 605
2 1 101 ¿i lo 209 2 2 '+99 2075 1038 2 3 55 222 m
24 23 11S 58
25 29 122 61
26 T-i-9 625 312
2? 300 I 2 5 5 627
23 68 292 146
29 92 586 193
30 21 89 45
31 61 ' 254 127
32 . 85 555 i 7 8
33 30 w ; 184

Table 1. ( cn td . )
105.
Popula t ion V i l l a g e
34
^5 56
37
58
39 40
41
42
45
4 4
4 5 46
47
4 8
49
50
51
52
55
54
55
56
57
56
59 60
61
62
6?
t >
65
66
Age 7
Both sexes
180
77
36
57 57
224
53
133
92
75
92 154
64
7^
-
80
74
151
156
20
35 81
21
22
64
102
122
50
24
71
129
136
64
Age 7 - 1 2 N o s -enro
Both sexes
1
3^1
148
256
259
9 2 3
218
555 386
313
586
560
?68
505 —
552
312
549
565
81
V¡5
335
89
94
268
4 2 5 509
2CÖ
99
;--'95
555
563
268
t o be l i e d
375
161
74
118
120
462
l o y
278
193
157
i y 3
280
134
152
-
166
156
275
282
41
73
168
45
47
134
213
255
104
50
148
268
282
134

Table 1•(end)
106.
Popula t ion V i l l a g e
Age 7
Both sexes
Age 7 ' - 12 Nos . to be _ _ _ _ _ _ _ _ e n r o l l e d Both sexes
67 66
69 70
71
72
75 74
75 76
77 78 79 80
• • i i n »
184
20
52 46
151
81
49
49
85
770 82
215 187
629
563
155 196
201 201
355
385
4 1
108
94
315
182
178
78
98
101
101
178
Tota l 6750 28090 14045
I I . Nomads 4145 16545 2024
(¿rand To ta l 10095 44b35 16069

able 2. Reorganizing of primary school network in Arashkoul Rural Council 1990/91
illage & chool
Catchment area
School(s) enrolment in 1980/81
Enrolment in 1990/ 91
NO. of sections
No. of teachers
No.of classrooms 1 shift 2 shifts
C o m m e n t s
72 C 228 2 existing classrooms. 1 new cl.room needed if double shift introduced. 3 cl.rooms needed otherwise plus maintenance.
2-3-4-5-6 349 10 4 to 7 classrooms to be built
7-8 130 C 216 Distance with village 52 should be checked on the field.If distance between village 7 & 52 is less or equal to 5 kms for the majority of pupils, children of villages 8 & 7 could be sent to school 52. Otherwise, no expansion needed if double shift introduced or 2 new cl.rooms built
9-10-12-14 144 B 193 G
778 15 20 15 18) 2 existing schools with 12 cl. rooms, no construction required if double shift introduced, otherwise 3 cl.rooms needed plus maintenance
11 11 322 C 320 (125) 13) The present school has 6 cl.rooms,
no construction needed. Enrolment will probably be maintained at 320 or slightly increased in the present facilities.

Table 2. Reorganizing of primary school network in Arashkoul Rural Council 1990/91 (cntd. )
Village & School
13
Catchment School(s) Enrolment NO.of No.of No.of class-area enrolment in 1990/ sections teachers rooms
in 1980/61 91
13 146
1 shift 2 shifts C o m m e n t s
2 to 3 cl.rooms to be bu i l t
•15 15 211 C 217 (2) The present school has 4 cl. rooms. No construction needed. Enrolment to be maintained at present level or slightly increased. Two teachers to be transferred.
16 16-17 321 C 349 Present school has 6 cl.rooms. No construction needed, if double shift introduced, otherwise 1 classroom is needed. Enrolment to be maintained or slightly increased.
18
20
18-19 269 3 to 5 cl.rooms to be built.
20-21 110 C 814 15 20 15 8 Existing school has 6 cl.rooms. 2 new cl.rooms needed if double shift is introduced, or 9 needed otherwise.
O oo
22 22-23 262 B 239 G
1149 21 28 21 11 No new cl.room needed if double shift is introduced. 9 are needed otherwise plus maintenance.
2b 24-25-26 431 11 4 to 8 cl.rooms needed.
27 27 327 C 627 12 16 12 6 No new cl.room needed if double shift is introduced. 6 new cl. rooms are needed otherwise plus maintenance.
28 28-35 256 C 307 5 to 6 7 5 to b (3) Present school has 6 cl.rooms. No new construction required.
29 29 233 C 233 (193)
(2) Present school has 6 cl.rooms; no construction needed. Enrolment to be maintained at present level or slightly increased. 3 teachers to be transferred.
30 30-31-32 151 C 350 No new cl.room needed if double shift is introduced. 3 cl.rooms are needed otherwise.

Table \ Reorganizing of primary school network in ArashRoul Rural Council 1990/91 (cntd.)
Villaye & School
33
Catchment School(s) Enrolment NO.of No.of area enrolment in 1990/ sections teachers
in 1980/81 91
33
No.of class-rooms 1 shift 2 shifts
C o m m e n t s
166 184 (4) Present school has 4 cl.rooms, no expansion required; maintenance needed
34 34 233 C 375 Present school has 6 cl.rooms. No expansion needed if double shift is introduced. 1 new cl, room needed otherwise plus maintenance
37 36-37 192 2 to 4 cl.rooms needed
39 38-39 205 C 582 11 15 11 6 cl.rooms available - No new ones required with double shift. 5 needed otherwise.
41
44
46
49
41-42
40-43-44
45-46-47
49
-
-
-
-
471
459
566
166
9
9
11
3
12
12
15
4
9
9
11
3
5
5
6
2
5 to 9 cl.rooms needed
5 to 9 cl.rooms needed
6 to 11 cl.rooms needed
2 to 3 cl.rooms to be built
50 50 114 156 existing school has 2 cl.rooms. No expansion needed with double shift, one cl.room needed otherwise plus maintenance.

Table 2. Reorganizing of primary school network in Arashkoul Rural. Council 1990/91
Village & Catchment School(s) Enrolment No.of No.of No.of class-School area enrolment in 1990/ sections teachers rooms C o m m e n t s
in 1980/81 91 1 shift 2 shifts
51 51 - 275 5 7 5 3 3 to 5 new cl.rooms needed
52 52 - 282 6 8 6 3 3 to 6 cl.rooms needed
55 53-54-55- 187 C 374 7 9 7 4 Present school has 6 cl.rooms; 56-57 no expansion needed if double
shift introduced. 1 cl.room is needed otherwise plus maintenance
58
59
62
64
58
59
61-62-68
60-64
-
-
-
-
134
213
195
523
3
4
4
10
4
5
5
13
3
4
4
10
2
2
2
5
2 to 3 cl.rooms needed
2 to 4 cl.rooms needed
2 to 4 cl.rooms needed
5 to 10 cl.rooms needed
65 65-70-71 226 691 13 17 13 7 Existing school has 6 rooms, 1 cl.room is needed if double shift is introduced. With single shift 7 more cl.rooms would be needed, plus maintenance
67 63-66-67- - 775 14 19 14 7 7 to 14 cl.rooms needed 69
72 72-73 174 360 7 9 7 4 Existing school has 6 cl.rooms; no expansion is needed if double shift is introduced; 1 cl.room is needed otherwise plus maintenance.
Total 4276 ^ 13756 262 348 262 145
N.B. Villages 74 to 81 do not appear on the map.

MAP I ARASHKOL RURAL COUNCIL
PRIMARY SCHOOL NETWORK 1990/91

1 1 3 .
ANNEXES

115. Annex I to report
Closing speech by the Minister of Education & Guidance, Sudan
Distinguished guests, ladies and gentlemen,
I am delighted to have the opportunity this evening to formally
close this three-week intensive training course on microplanning and
school mapping. First of ali, let me start by conveying my Government's
appreciation to the Director of the International Institute for
Educational Planning for having accepted to organize this national
training course in order to help us in the struggle for universalizing
primary education in the Sudan. Our thanks go specially to Mr H. Hajjar,
Miss F. Caillods and Mr Ta Ngoc Châu who, on behalf of the Institute,
participated in organizing and conducting this training course. I also
wish to welcome Mr C.Tibi who arrived to-day in Khartoum in order to
start with us a new study on educational costs and financing.
You might all know that the history of cooperation between the
HEP and the Sudan is a long standing one. It covered through various
stages various aspects of research and training on higher education
and employment, educational administration, education and agricultural
development and planning education at the local level for the
purpose of universalizing primary schooling. This trend of
cooperation will, I hope, continue to develop in the future
as it is the case now with the new project on educational costs and
financing.
Ladies and gentlemen,
I cannot close my speech without saying a few words on the
training course and its usefulness for the Sudan.
You might all know that the Sudan has embarked on a long
regionalization and decentralization process which affects first of ali
educational administration. And you might also all know that the
educational strategy of the Sudan is aiming at achieving universal
primary education and eradicating illiteracy by the end of 1990.
On the basis of this long-term strategy the Sudanese Government
prepared its VIth Year Plan for economic and social development (1977/7B-
1982/83) with the objective of raising the enrolment rate in primary
education from 35% to 60% in 1983 and reducing the disparities between
the different regions and provinces of the Sudan as well as between
boys and girls.

116.
In spite of their importance and nobleness these objectives have
not been implemented because of many difficulties related to scarce
available resources and to the high increase in educational costs.
And now we are in the process of preparing a new development plan for
education with the aim of universalizing primary education and
eradicating illiteracy by the year 2000 instead of ly90 and setting up
the modalities that will ensure the implementation of these new
objectives. The challenge is getting more difficult with the necessity
to expand at the same time our technical and vocational education to
meet the requirements of our economic and social development and
increasing the efficiency of our educational system and decreasing its
costs.
In order to implement all these objectives, taking into account
the scarcity of our resources, and in line with our regionalization
and decentralization policy, we have to cali on planning in a
scientific way. However, this planning could not be realistic unless
it takes place at the grass roots level where education is realiy
taking place. With this in mind, we requested the HEP to organize
this course in order to build up our capacities of planning at the
regional and sub-regional levels.
I understand that your course comprised the analysis of the
educational system in one district of the White Nile Province and
the preparation of the prospective school map for this district with
the aim of achieving UPE by the year 2000, as it comprised also the
preparation of regional projects by the participants attending the
course. This would mean for us that these techniques and methods of
planning education at the local level in which the participants have
been trained, will be a starting point in a long process where the
regional representatives have a major role to play. On this occasion
I would like to assure the participants of the support they will be
obtaining from the central level in preparing their regional projects
and putting them into execution, with the steady hope that the HEP
will continue to help us in the future.
117.
Once again, I would like to express my Government's appreciation
to the International Institute for Educational Planning for the
continuing support it provided to the Sudan and to convey my special
thanks to the HEP professors who participate in this course. I
would also like to convey my thanks to the organizers of this course
from the Ministry of Education, to the Director of the Teacher Training
Institute at Omdurman where the course took place and to the participants
themselves for their active cooperation, wishing them every success
in their task.
With these words I declared the course closed.
Thank you.

Annex II to Report 118.
IIEP/lTC36/lnformation WORKING DOCUMENT Paris 15 October 1982
Original : English
INTENSIVE COURSE ON MICROPLANNING AND SCHOOL MAPPING
KHARTOUM, DEMOCRATIC REPUBLIC OF SUDAN
(8 - 26 January 1983)
INFORMATION
This document has been prepared for the participants in the Intensive Training Course on Microplanning and School Mapping, organized in Khartoum, Sudan, Jby the Ministry of Education and Guidance of the Sudan and the International Institute for Educational Planning (Unesco)
Paris
(c) Unesco

119.
General information on the Intensive Course on Microplanning and School Mapping and Data necessary for the preparation of regional projects.
I. COURSE OBJECTIVES
The course has three main objectives :
- to show the role of microplanning and school mapping in the overall planning of education;
- to train participants in the various techniques involved in microplanning and school mapping;
- to help each participant prepare an actual project for introducing microplanning and school mapping in his/her region.
The course is intended to help participants to :
- better identify the various factors needed to be taken into account in the preparation of a school map and a microplan of education;
- increase their knowledge of certain techniques (enrolment projections, demography, cost effectiveness analysis) which are used in the preparation of the school map and microplan as well as to plan the actual organization of their work;
- acquire training in certain statistical methods (questionnaire building, carrying out surveys, analysis of maps..).
II. PROVISIONAL PROGRAMME OF THE COURSE
It can be seen from the attached programme that the course includes three main activities carried out in parallel :
(1) Discussions, lectures, sessions (2) Exercises, statistical examples (3) Preparation of regional projects
To help you prepare yourself for activities (1) and (2), a copy of the book prepared by J. Hallak on "Planning the location of schools" has been sent to your office under separate cover. You are requested to study it prior to your arrival in Khartoum. Kindly bring it with you to the course for reference purposes as no other copies will be available for distribution during the course.
III. PREPARATION OF REGIONAL PROJECTS
This activity is an essential task for all the participants as it offers the opportunity to study the practical conditions for introducing microplanning and school mapping in the various regions represented. With this purpose in view, you will be analysing in detail the organization of the school network, the coverage and the efficiency of the system for one or two levels of education (primary, junior secondary, higher secondary) in one particular province or district that you should select. In order to perform this task you should bring with you :

120.
- detailed maps showing relief,road network, location of cities, boundaries of provinces and districts, enumeration areas and the exact location of schools;
- data on economic activities, employment, various socio-economic centres;
- demographic data giving as much detail as possible on :
. distribution of population by district, local councils and villages;
. birth rates, death rates, migration and density;
- detailed information about the process of resource allocation between provinces, districts and local councils (teachers & buildings) as well as administrative structures and procedures.
- detailed information on the present school network, school by school showing :
. enrolments by grade, sex and age for two consecutive school years,
. teachers by qualification and training,
. school facilities and equipment.
In order to help you carefully collect the data required, the table herebelow gives, by way of illustration, a list of information and the sources from which it may be obtained.

121.
Data required for the preparation of regional projects
Type of information
Sources
Specific data to be collected Ministry Other of Ministries Education or bodies
General 1 ...Educational system: structure and functioning
2. Organigram of the Ministry of Education
3. structure of the provincial education offices
44. educational reform projects
5.SSpecific objectives of current educational pian and/or future educational plan
6. Methods or decision-making for the implementation of the school map
7. Rules and noaoms
Directorate of strategy & Planning
Office of the Executive Asst. Commissioner
Strategy and Planning Directorate
" or school map division
strategy & Planning Directorate or School Construction Division
Region selected 1.Detailed map (largest scale possible)
showing relief, road network, districts towns, and villages..
2.Map showing the location of present school network (marked on a tracing of map 1.above)
3.Demographic data (distribution of population by age or age-group for each district/village/neighbourhood). Statistics on death rates, birth rates, migration, population density.
Office of the Executive Asst. Commissioner
Ministry of Public Works or Transport
Ministry of National Planning Department of Statistics

122.
Type of information
Sources Specific data to be collected
Ministry Other of Ministries Education or bodies
Region selected Data by school on the present school
network giving :
(a) pupils enrolled during the last 3 years by grade, age, sex and repeaters by grade
(b) Teachers by sex and level of qualification
(c) School building by.: date of construction and area, number of classrooms (general and specializec". )and their condition.
Economic data
Regional Planning Office
Ministry of Economic Affairs
IV. OTHER
You will be requested at the beginning of the course to make a presentation on the educational problems prevailing in your region. Any information concerning the region you are representing is an asset for this purpose.
It you have your own calculator, kindly bring it with you to the course. You will need it in doing practical exercises and preparing regional projects.
Good Luck!

123.
Annex III to Report
HEP/ITC36/List ot participants Paris, 17 March 19o¿
Intensive Course on Microplanning and School Mapping Khartoum, Democratic Republic of Sudan
(8 - 26 January 1983)
No. Name Region Position
1 MuDarak Saeed Munammad 2 Hamid Hamad El-Zaylai
3 Mali* Mahjoub Muhammad Khoir 4 Muhammad Osman El-Khodr
b Abd El-Karim hl-Amine 6 Hassan Ahmad El-Amir 7 El-Hadi Muhammad El-Mowag
8 Malik Ibrahim Haydoub
9 Mskki Hanafi Mustata 10 Abbas Ahmad Muhammad
11 Ahmad And El-Aziz Muhammac 12 Knalid Osman Mustata 13 Obeid Abdallah Rahmatallal 14 Apa El-Rahman El-Sayyid 1^ MUSÒ A-am Anmaa
16 Muha.'iiinad Yassin El-Hajj
17 Hasnim Saad Ahmad 18 Muhammad Ahmad Abdallah
19 Abbas Ibrahim Abdallah 20 Bashir Ibrahim Ajouca 21 Muhammad Osman El-Sharif
22 Siddiq Aûd El-Sadiq ¿3 Abdallah Abd El-Rahim 24 ¿1-Hadi Adam Muhammad 25 Hanim Fadl Nasir 26 Buthayna Baoikr Abdallah 27 Muhammad El-Amine El-Ageb
26 ADjallan El-Baqir Abd El-Halim 29 Layla Vaha Salin
30 Abd El-Qadir Muhammad El-Hijj
31 Hassan And El-Ghafour
32 Abd El-Azim El-Nourani
33 Bakheita Osman Hassan
Darfur
Kordofan
central
Eastern
Nortnern
Khartoum Province
Central Ministry of Education
Director, Primary Schools Directorate Director, Planning Directorate, Statistic; Section Secondary school Principal Head ot Arabic Department - Secondary schools Directorate Ed. Supervisor, Intermediate Schools Direct. Technical Inspector, Primary Schools Direct. Cnief Technical Inspector of English, Secondary Schools Directorate Chief Educational Supervisor, Intermedíate» Schools Directorate Director, Planning Directorate Statistics Officer, Statistics Section, Planning Directorate Principal, Teacher Training Institute Ed. Supervisor, Intermediate Schools Direct. Statistics Officer, St.Section, Pi.Direct. Assistant Director, Planning Directorate Statistics Officer, Statistics Section, Planning Directorate Statistics Officer, Statistics Section, Planning Directorate Ed.Supervisor, Primary Schools Directorate Statistics Officer, Statistics Section, Planning Directorate • Statistics Officer,St. Section, PI. Direct. Assistant Director, Primary Schools Direct. Statistics Officer, Statistics Section, Planning Directorate Technical Inspector, Primary Schools Direct. ditto Ed. Supervisor, Primary Schools Direct. Technical Inspector, Primary Sch., Direct. Ed. Supervisor, Primary Sch., Direct. Cnief District Ed. Supervisor, Intermediate School Directorate Director, Statistics Section, Planning Direct Assistant Director, Planning Section, Strategy & Planning Directorate Planning Senior Officer, PI. Section, Strategy & Planning Directorate Statistics Officer, Statistics Section, Planning Directorate Director, Evaluation & Research Unit Literacy & Aoult Education Directorate Officer, Educational Evaluation Directorate

124. Annex IV to Report
PROGRAMME
Saturday 8/1/X983
8.00 - 9.00 am lO.OO - 11.OO am 11.30 - 1.00 pm
1.00 3.00 pm
Sunday 9/1/1983
8.00 - 11.00 am
12.00 - 3.O0 pm
Monday 10/1/1983
8.00 - 9.30 am 9.30 - 11.00 am
12.OO - 1.30 pm 1. 30 - 3.00 pm
Tuesday ll/l/19b3
8.0Ó - 9.30 am
9.30 - 11.OO am
12.OO - 1.30 pm 1.30 - 3.00 pm
Wednesday 12/1/1983
8.00 - il.00 am
12.00 - 1.00 pm 1.00 - 3.00 pm
Tnursday 13/1/1983
8.00 - 9.30 am
9.30 - 11.00 am
12.00 - 1.00 pm
Registration Inauguration of the course Lecture I: Sudanese educational policy, planning and administration
Lecture II: Educational planning and school mapping - General introduction
Lecture III: Statistical units and parameters for diagnosis
Regional presentation by participants
Exercise I : Collection of data Exercise II : Identification of homogeneous zones Exercise II: continued Discussion on exercise II
Lecture IV : Demographic data and analysis of school enrolment Exercise III: Diagnosis of enrolment (primary) Exercise III: continued Discussion on exercise III
Exercise IV : Diagnosis of enrolment (secondary) Exercise IV : continued Discussion on exercise IV
Lecture V: Diagnosis of the quality of educational services Exercise V : Diagnosis of staffing conditions Exercise V : continued
Muhammad Karaal Badr
H. Hajjar
Ta Ngoc Châu
Participants
Faculty ii
•i
H. Hajjar
H. Hajjar
Faculty
•i
Ta Ngoc Châu
Faculty
II
Ta Ngoc Châu
H. Hajjar
Faculty

125.
Saturday 15/1/1983
8.00 9.30 12.00 1.30
Sunday
8.O0
- 9.30 am - 11.00 am
1.30 pm 3.O0 pm
16/1/1983
- 10.00 am
10.OO - 11.OO am 12.OO - 1.30 pm 13.30 - 3.00 pm
Monday 17/1/1983
8.00 - 11.00 am 12.00 - 3.O0 pm
Tuesday 18/1/1983
8.00 - 10.OO am
10.00 - 11.00 am
12.OO - 2.00 pm 2.O0 - 3.00 pm
Wednesday 19/1/1983
8.00 - 11.00 am 12.00 - 2.O0 pm
Tnursaay 20/1/1983
8.O0 - 10.OO am
10.00 - 11.00 am 12.OO - 2.00 pm
Saturday 22/1/1983
8.00 - 10.00 am
10.00 - 11.00 am
12.00 - 3.00 pm
Discussion on exercise V Exercise VI : Diagnosis of facilities Exercise VI : continued Discussion on exercise VI
Lecture VI : An introduction to cost concepts Exercise VII : Educational costs Exercise VII : continued Discussion on exercise VII
Consultation on regional projects Discussion on the questionnaire for data collection
Lecture VII : Projection of enrolments Exercise VIII : Projection of enrolments (primary) Exercise VIII : continued Discussion on exercise VIII
Consultation on regional projects Lecture VIII : Norms, standards and catchment area
Exercise IX : Norms, standards and catchment area (secondary) Discussion on exercise IX Consultation on regional projects
Lecture IX : Prospective school map and microplan Exercise X : Prospective school map (primary) Exercise X : continued
Ta Ngoc Cnâu Faculty ti
H. Hajjar
Ta Ngoc Cháu
Faculty •i
Ta Ngoc Cnâu
Faculty
F. Cai Hods
Faculty
F.caillods
Faculty H. Hajjar
Faculty
H. Hajjar Faculty
F.Caillods
Faculty

126.
Sunday 23/1/1983
8.00 - 11.00 ara 12.00 - 3.O0 pm
Monday 24/1/1983
8.00 - 1.00 pm
1.30 - 3.00 pm
Tuesday 25/1/1983
8.00 - 9.30 am
9 . 3 0 -
1 2 . 0 0 -6 . 0 0 -
• 11.OO
• 1 3 . 3 0 8 . 0 0
am
pm pm
Discussion on exercise X Presentation of regional projects
Visit to schools and collection of data Discussion on collection of data
Lecture X : Generalization and administrative procedures in school mapping How to implement the school map in the Sudan?
Oral evaluation of the course Closing session
K. Cailloai; Participant:
Participants Faculty Faculty
F.Caillods
Faculty, cent Planning Unit Participants

127
Annex V to Report
EVALUATION QUESTIONNAIRE
This course on microplanninp; and school rapping was organized bv
the Ministry of Education and Gui ciance, Sudan, and the International
Institute for Educational Planning, Paris (UNESCO).
We would greatly appreciate your comments with a view to helping
us improve the orrani*ation of future courses.
-•TORE Til}: COURSE
Was the raterial sent to you sufficiently in advance in order to
allow you to prepare for the course?
Yes No M.R.
6,5% 93,5%
Please corment. - have received only the invitation to attend the course and was not informed of the material to bring to the course (12)
- have been invited to attend the course 2 days after it started (2) - information on materials to be collected for the course received 2 weeks before the course (6) on one week only (9), so not enough time to collect data
?. !iow rnanv months in -advance would you have liked to have been informed
of your arìrdssion io this course? : - 1 month : - 2 months : - 3 months :
51,6% 25,8% 6,5%
- 4 months or more
- N.K.
:
:
9,7%
6,4%
TT. PURTK'G THE COURSE
1, On the whole, how TJOUICÍ you rate this course? :
- very poor
- ooor
- a v e r a* e 3,3%
- good 41,9%
- very good 54,8%

128 .
4. The course consisted of a succession of lectures and exercises on various topics :
Lectures
Practical exercises
Preparation of regional projects
General introduction to micro- and macroplanning
Sudanese educational policy and planning
i T ta t i s t ica l units & • oaranetc-rs t *
i r.'<ia£nosis of enrolment
j Diagnosis of rochers
Diagnosis of . f ac i l i t i e s
• Introduction to i cost concepts
1
; Projection of ; ?nrolments
i *'orms, standards & ( catchment areas
j Prospective school ; rrap
; Generalization & J administrative i proced ares
How did you find the content of the sessions ?
Very useful
74.2%
77.4%
67.7%
71%
58.1%
74.2%
74.2%
77.4%
71%
67.7%
74.2%
80.6%
87 .1%
74.2%
Useful
25.8%
19.4%
19.4%
29%
32.2%
25.8%
22.6%
19.4%
29%
32.3%
22.6%
19.4%
9.7%
25.8%
Not very useful
-
3.2%
12.9%
-
9.7%
-
3.2%
3.2%
-
-
3.2%
-
3.2%
-
Was the time devoted to ? the topic : \
Insufficient
31%
27.6%
75.9%
17.2%
17.2%
24 .1%
24 .1%
13.7%
13.8%
51.7%
17.2%
24 .1%
37.9%
24 .1%
Suffi- i Too j cient | much !
65.5%
72.4%
2 4 . 1 %
82.8%
79.3%
69%
72.4%
82.8%
65.5%
44.8%
75.9%
72.4%
58.6%
75.9%
3.5%
""
3.5%
6.9%
3.5%
3.5%
20.7%
1 3.b%
6.9%
3.5%
J .5%
_ . -

129.
5. On the whole, was the material presented to you in lectures and exercises
relevant to the problems in your region/country ?
- irrelevant 3.2%
- relevant 71%
- very relevant
6. Given the range of subject covered, did you find the length of the
course : f
- too short 19-3%
- short 61-4%
- adequate 19.3%
- too ]ong
7. Is thet« any other subject you would have liked us to cover during
the course ? Please specify. - Data collection (4) - Technical & vocational education (3)
- Planninq out-of-schooi education (2) - Educational planning & educational ? statistics i«
- Seif-nelp policy and its role in UPE (3)
- Teacher training and migration of qualified teachers to oil-producing countries (i
- Allocation of resources (3)
- Curriculum development (5)
8. How did you find relations between participants and
Bad Average Good •*'."•
- teaching staff " " l00%
- non-teaching staff 3.2% 25.8% 64.5% 6.5%
•?. How did you find the arrangements with respect to :
- the lecture room : - Fair.- 16.1% - Good: 83.9%
- other working rooms :- unconvenient: 6.4% Fair: 12.9%
- Good: 35.5% - N.R. 45.2%
- accommodation : All those who have seen lodged in the Teacher Training
Institute (20 participants coming from the regions) found the "accommodation not convenient and uncomfortable1.

130.
9. (Cont'd.)
Comments
III. ORGANIZATION OF FUTURE COURSES
10. Assuming that another course is to be organized in the future,
what, in your view, would be the best formula ?
- International (countries from all over the world) 16'1%
- Regional (e.g. East Africa, Arab Countries) 58.1%
- National 19.4%
- Regional 6.4%
11. How much time should be devoted to such a course ?
- less than 2 weeks
- 2 weeks
- 3 weeks 12.9%
- one month 38.7%
- two months . 48.4%
12. On what other topics (apart from school mapping and microplanning) do
you think it would be useful to organize a training course ?
- Curriculum development and evaluation 5
- Teacher training programmes 5
- Educational administration 4
- Educational statistics and data collection 3
- Educational costs 3
- Scnooi inspection techniques 3 - Literary programmes and adult education 2 - How to improve the quality of educational 2 services
- Rationalization oí self-ñelp 2 - General concepts of educational planning 2

131.
Apart from other courses, what do you suggest IIEP could do to
keep in touch with you (e.g. : sending you the list of publications ...)
- Sending IIEP publications (31)
- Organize follow-up courses (8)
- Foilow-up missions to the different regions to evaluate implementation of ~ ~ — — — — — — — — — — — — — - — — — — — — — — — — — — — — — — — — school mapping 15 - Send information on other IIEP courses (9) and research activities (8)
Give your general comments on the course. - Good and very useful course (25) - Course too intensive (5) and too short (6) - Not enough time for regional projects (22) - Course would have been more successful if arabic language had been used (7) - Course would have been organized in Khartoum rather than in Um Durraan to avoid transportation problems (8)
- Ministry of Education should give more attention to accommodation (20) and financing (12) in the future.
Which region are you from?
(optional)
Thank you.

132.
Annex VI to Report
QUESTIONNAIRE FOR SURVEYING PRIMARY SCHOOLS
Ministry of Education and Guidance
Khartoum, Sudan
This questionnaire has been prepared for the participants in the Intensive Training Course on Microplanning and School Mapping in Omdurman from 8 to 26 January ly83, as a testing of
survey instruments and data collection

133.
I - SCHOOL IDENTIFICATION
1.
2.
3.
Nane of the School :
Type : Boys-P""""*] Girls j I Co-educational f"-"}
Complementary j—"—i "
Location î Village
District
Local Council
Province .
4» Status : Government mm . ' • •»»
Aided
Private
5 . Nuxiber of s choo l shifts 11 ]
6 . Number of s e c t i o n s by grade Î
Grade
S e c t i o n
I I I I I I IV V VI Totea
I I , 1981/82 Enrolment
X^rade Euro iS .
...ont >v
B
G
T
I
•
.
I I I I I IV V VI
•
•
Tota l •
1

134.
Ill 1982/83 Enrolment
^ s . Grade
Lnrol^y. L-ent ^ V
3
G
T
Hop-eat arg
B
G
T
I II III IV V VI Tutal
-
IV Attendance on the day of Survey
Number '""""""--- of pupils attending the day of Survey
i
1 B
G
T
i
— — — —
II III IV V VI l
Tutal i !

V. .Distr ibut ion of ^ u ^ i l s by a¿,G
-, Grado and
« 6
7
tí
9
1 0
1 1
12
13
> 1 4
T o t a l
I
B
!
G T
I I
B G T
I I I
B G Ï
IV
B G T
V
B G T
VI
B G T
Total
B G T

VI. Travel l ing d is tance and L¿eans of transportation for pup i l s
Grade
I
II
III
IV
V
VI
Total
1
Section
i . 2
1
2
1
2
1
2
1
2
1
2
JÑuuber of pupils according to distance between houe and school
Less than 2 kn
2-4 Kn
Foot Bus Car
4-6 ku Foot Bus
<
i
Car
Total

VII. Teaching staff
No. Name of Sex Educational Training No. of No. of Subjects taught, teacher M F level Teacher On the Untrained yrs of periods class and
Training job ex- taught section Institute perience per wk

vili. Teaching premises Shifts Li. any) ist shift From
a) Generai classrooms 2nd shift From
to
to
No. of Sect, concerned
No. of Sect, concerned
Classroom Number
Grade and sections concerned
R O O M S
Length (m)
Width (m)
Area (m2)
State
Very bad Bad
(1)
Regular Good
Number of seating places
-:2.
6.
8.
10.
11.
12.
1) very bad = need reconstruction? bad = need heavy repair; regular = need normal maintenance and good = need no repair

139.
b) Other premises
Specialized classrooms (Specify)
1.
2.
3.
Headmasters ' Office
Teachers' Office
No. Area in m2 Length Width (m) (m)
Surface (m2)
Very State
Bad Regular Good
Storage room

140.
IX Services available in the schoü1
I t eu
wa te r
E l e c t r i c i t y
L¿:-. t r i t t u s
F i r s t íi i vi
i ' i ^ l ' i »Scorta ! i Lc..:_ - .va i l ab lú * f u r expans ion
L i b r a r y
Ganor (b¿>dC i f y
•
Yes N o . Speci fy
k
i
i
CO

X- Equipment and teaching materials available
Gro.de
u.nd : s e c t i o n
nunber
I 1
2
I I 1
2
i l l i
2
IV 1
2
V 1
2
VI 1
2
i
C l a s s — rooa nunber
i
Á v a i l a b i l i t . y U'J Blackboard
Yes
- _l
No
f
T e a c h e r s ' desk
Yes No
1 i ex tbooks i
None I n s u f f i c i e n t
i
S u f f i c i e n t
Exerc i se Books
None I n s - 1 S u f f i -u f f i - j c i e n t c i e n t
! ! vn S & 'fe n c i l s
None li insu f f i c i e n t
¡¿uffi cienf

142.
Annex VI to Report
QUESTIONNAIRE FOR SURVEYING INTERMEDIATE SCHOOLS
Ministry of Education and Guidance
Khartoum, Sudan
This questionnaire has been prepared for :'the participants in the Intensive Training Course on Microplanning and School
Mapping in Omdurman from 8 to 26 January 1983, as a testing of survey instruments and data collection

143.
I. School Identification
1.
2.
3.
4*
5.
6.
Nane of the School :
Type ; Boys j | Girls | | Day school [
Boarding school[" j Day and Boarding school
Location : Village Local Council
District Province
Status : Government( { Aided [ | Private | |
Number of school-shifts > 1 j { 2 j j
Nunber of sections by grade :
Grade
Section
I II III Total
.Grade
II - 1981 - 1982 Enrolment
II Enro lment
T
III Total

144.
Ill 1982 - 1983 ìlnrolnent
Grade
ILìxr c l i e n t
3
G
T
Rujjt- ott-rc B
G ï
...
I
f
I I I I I T o t a l
4
IV. Attenaance on the day of Survey
j Gl'À'j.U
Number of p u p i l s a 11 e : i J. i rig t he a a.¿ of survey
ì J
C
I I I I I I T o t a l
V. Distribution of pupils b/ a&e
s ™ ^ ™ — -e and
Sex
r
U
JO.)
lb
17
M i. /
iVl T
II
T
III
M F T
Total
M F T

VI » Travolliiy; dictate?; ..:_ ...•-• .112^ transportation for day-^Uj-ilG
Grade
I
II
III
ï j t; ai
Section
1
2
3
1
2
3
1
2
3
liUi Lor 01 pupils according to distanee betv;een houe and school
Less than 3 kn
3-6
Foot Bus Car Bicycle
no re than 6
Foot Bus Car Bicycle
1
•Total

VII ilu^Lo-r oí' u..'T:ii,iri - | S , i j i l s ani t h e i r ^eo^pajjàical Origin I f churu, aro xi-- : _•'-iv.ii;j-J.-àJ.Jil& in the school uov¿ to quest ion VIII
1 1 t
1 I
Geographical Origin of pup i l s
Local Council
"— 1
I
District?,
!
Province
Number of
b o arcling-pupi 1s
1

VTTI urinary schools feeding grade ohe new aouissionS'in 1982/83
•
Nane of the prinary school Government Private
.'Distance fren this ¿rinary school to the intoruediate ..school
Number of new grade- one-pupils coning fron this priuary school in 1982/83
•
147.

IX - ¡s ta f f
;eací ier Hi F
Educational Level Teacher Training
Institute
Trainila
un the job
untrained
No. of years of
experience
Subject(s) taught
ie lÑu. Gr; & Section
of period-taught per week

X r e a c h i n g i . r^u i sea shift ( i f - ^7 ) 1 s t shift fror ! t o I - . . ...f Sect« concerned
a ) Genera l c l a s s r o o n s 2nd shift fror. to tij. j í c;^ct .concerne^
ï l a s s -coon tfunber
1
2
3
4
3
6
7 1
Grade and
s e c t i o n s concerned
1) "
ROOIVJS
Length
(r-0
/cry bad
í e ^ u l a r
Width
( - )
= need
= need
Area ( n 2 )
B u i l d i n g n a t e r i a l s
Walls
r e c o n s t r u c t i o n ; Bad = need
n o r n a l u a i n t e n a n c e and Good
Roofs Very bad
heavy r e p a i r ;
= need no i fepâir
S t a t e ( 1 )
Bad
. .,.
Regula r Good

1 5 0 .
B) Other premises
c i a l i ^ d
» ' l^ss roous
L M o r a t o r y
Workshop
Houe Economics
A r t
L i b r a r y
¿ i c^duas t^ r ' s ü l i. i Ci.'
>jachv.rs' L'iJ-'iCv.-
.~.u,.ra¿e
Others 1 ' • ;'¿oÍÍ""v")
Nun-b e r
2 Area i n (u )
Length (a )
i Width (u)
Surface ini
B u i l d i n g n a t e r i a l s
Wal ls Roofs
State
Very bad
Bad Regni a i Good
j i
í

151.
XI. Services available in the school
Iten
Water
electricity
Latrines
. F i r s t xiid Box
Field Sports
Land availaDie for expansion
Other (s^ucify)
Yes No Specify

XII » Lquipuen c i ¡.vai I ab 1 e a) General clasSPOOLS equipment
Grade and
Section nuuber
I
II
III
1
2
t
1
2
3
1
2
3
Giass-ruon nuuber
...._ . ,.. . availability of
Blackboard
Yes
i
No
Teacher's desk
Yes No
naps
Sufficient
Insufficient
..Science English
Suff- In- Sufficient suffj- icitìnt
icient
Insufficient
•
i 1

153.
v. "' ) S o c i a l i z e d Classroons equipment
i Specialised
; Classroom !
Laboratory
17 o rk shop
Lconcaics
• Art i
I
Equipment
Sufficient Insufficient
Specify

![Physical concept ontology for the knowledge intensive ... · of the Knowledge Intensive Engineering Framework (KIEF) to support knowledge-intensive engineering [6]. Knowledge-intensive](https://static.fdocuments.us/doc/165x107/5b90c6fd09d3f28a7e8cb604/physical-concept-ontology-for-the-knowledge-intensive-of-the-knowledge-intensive.jpg)