Intelligent Transportation Systems Early Deployment ...
134
Intelligent Transportation Systems Early Deployment Planning Study June 1996 Sacramento Area Council of Governments 3000 S Street Suite 300 Sacramento, CA 95816
Transcript of Intelligent Transportation Systems Early Deployment ...
IntelligentTransportation SystemsEarly DeploymentPlanning Study
June 1996
SacramentoArea
Councilof
Governments
3000 S StreetSuite 300Sacramento,CA95816
The Sacramento Area Council of Governments (SACOG) is an association of local governments formed byfour counties and fifteen cities. SACOG serves the entire Counties of Sacramento, Sutter, Yolo and Yubaand the Cities of Lincoln, Rocklin and Roseville in Placer County.
SACOG is governed by a Board of Directors composed of County Supervisors or City Councilpersons,appointed by the member jurisdictions. The Board is advised by several policy and technical committees.A full time staff is employed to implement Council policies and work programs as well as coordinate theefforts of consultants who are retained to augment the staffs efforts.
SACOG serves as an advisory agency to local government on matters of interjurisdictional concern, and hasdeveloped a comprehensive planning program in the areas of transportation, housing, water quality, land useand air quality.
MEMBER CITIES AND COUNTIES
SACRAMENTO COUNTY YOLO COUNTYCity of Sacramento City of DavisCity of Folsom City of West SacramentoCity of Galt City of WintersCity of Isleton City of Woodland,
SUTTER C O U N T Y ’ YUBA COUNTYCity of Yuba City City of MarysvilleCity of Live Oak City of Wheatland
City of Lincoln (Placer County)City of Rocklin (Placer County)
City of Roseville (Placer, County)
BOARD OF DIRECTORS
JOAN BECHTEL, (Chair) Supervisor, Sutter CountyJUANITA NEYENS, (Vice-Chair) Mayor, City of Wheatland, representing Wheatland and MarysvilleHAROLD ANDERSON, Councilmember, City of Winters, representing Davis, West Sacramento, Winters
and Woodland,DAVID COX, Supervisor, Sacramento CountyHARRY CRABB, JR., Mayor, City of Roseville, representing Lincoln, Rocklin and RosevilleBRENT HASTEY, Supervisor, Yuba CountySANDRA HILLIARD, Councilmember, City of Yuba City, representing Live Oak and Yuba CityROB KERTH, Councilmember, City of SacramentoRICHARD PRATT, Councilmember, City of Galt, representing Folsom, Galt and IsletonTOM STALLARD, Supervisor, Yolo CountyIRENE ITAMURA, (Ex-Officio), Director for Caltrans District 3

TABLE O F CONTENTS
I.
II.
I I I .
IV.
V.
VI.
VII.
VIII.
IX.
EXECUTIVE SUMMARY
INTRODUCTION
STUDY GOALS AND OBJECTIVES
SELECTION OF ITS USER SERVICES
ASSESSMENT OF BENEFITS OF ITS USER SERVICES
INVENTORY OF EXISTING AND PROGRAMMED ITS PROJECTS
OPTIONS FOR DELIVERY OF ITS USER SERVICES
RECOMMENDED ITS PROJECT CONCEPTS
FUNDING AND IMPLEMENTATION
TABLES
Table 1: Summary of Transportation Problems
Table 2: Required Agency Data Exchange: Foothills and North County Area
Table 3: Required Agency Data Exchange: Urban Area
Table 4: Required Agency Data Exchange: Transit Providers
Table 5: Mapping of User Services to Agencies/Entities
Table 6: Functional Capabilities Required to Deliver User Services
Table 7: Functional Capabilities Required of Agencies to Support User Services
Table 8: Proposed Single Agency ITS Projects
Table 9: Proposed Multi Agency ITS Projects
Table 10: Existing and Programmed ITS Projects
Table 11: . Proposed Funding Source by ITS Project Type
Page
1
7
13
21
25
35
53
85
93 .
I4
62
63
64
77
79
81
94
98
100
103

TABLE OF CONTENTS
Page
Figures
Figure 1: Traffic Management/Operations Centers
Figure 2: Changeable Message Signs Highway Advisory Radio
Figure 3: Ramp Meters
Figure 4: Traffic Monitoring Stations
Figure 5: Closed Circuit Television/Call Boxes
Figure 6: Freeway Service Patrol
Figure 7: Development of the User Service Delivery System
Figure 8: Concept Delivery System
Figure 9: Candidate Delivery System
Figure 10: Service Delivery in the Urban Area
Figure 11.: Delivery of Regional Services
Figure 12: Service Delivery in the Foothills Area
Figure 13: Delivery of Transit Services
Figure 14: Providing Information to the Public
Figure 15: Relationship of Projects to Delivery System
Figure 16: Relationship of Project Initiation Dates
REFERENCES
37
39
41
43
47
49
56
60.
67
69
70
71
73
74
89
91
109
APPENDICESA: List of EDPS ParticipantsB: ITS User Service DescriptionsC: Notes from First ITS WorkshopD: Relationship of ITS Functional Areas to User Services

I. EXECUTIVE SUMMARY
Studv Goals
Intelligent Transportation Systems (ITS) refer to innovative approaches to solving transportation problemsand providing services to travelers. ITS solutions are typically based on a user’s view of the transportationsystem, and rely on partnerships among transportation system operators and service providers in both thepublic and private sector for implementation of projects. The Early Deployment Planning Study (EDPS) isintended to identify Intelligent Transportation Systems (ITS) strategies which address transportationproblems occurring in the Sacramento region, and recommend a blueprint for implementing thesestrategies.
The EDPS started with a workshop of study participants, which identified a listing of transportationproblems facing the region. Six goals for ITS implementation which addressed these problems weredeveloped, using input from the workshop group, and the SACOG Regional Planning Partnership:
. Reduce Roadway Traffic Congestion
. Reduce Pollution from On Road Sources
. Improve Traveler Safety
. Improve Transit Service Utilization
. Facilitate Commercial Vehicle Travell Minimize the Impacts of Through and Inter-Regional Travel
Inventory Existing and Programmed ITS Projects
One of the guidelines used throughout the EDPS was to build on existing systems, and to take advantageof current ITS initiatives in the Sacramento region. This guideline was especially important in definingnew ITS project concepts which will be needed to provide the selected ITS user services.
In total, over $15 million in existing or programmed ITS projects were identified, covering a wide range ofITS user services. These existing and programmed projects provide building blocks for futureimplementation of ITS in the region.
Traffic Operations Systems (TOSs) on the Freeway System. TOS’s include a wide range of monitoringand management tools, such as traffic monitoring stations, ramp meters, close circuit television cameras,changeable message signs, and highway advisory radios. These facilities are monitored and controlledfrom a Transportation Management Center (TMC), jointly staffed and operated by Caltrans District 3 andthe California Highway Patrol Valley Division. These systems fall into the incident management, trafficcontrol, and en-route traveler information user services.
Traffic Operations Centers (TOC’s) for Sacramento City and County. Both the City of Sacramento, andthe County of Sacramento, have made significant investments in TOC’s, which are functionally similar to
Final Report Sacramento ITS Early Deployment Planning Study
-1-
the Caltrans/CHP TMC described above. The major difference is that the TOC’s are primarily intended tocentralize management and coordination of surface street traffic signal systems in each jurisdiction, whilethe TMC is primarily focused on incident management and response. These facilities fall into the trafficcontrol user service area.
Public Transit Management Systems. The major example of this is Paratransit, Inc.‘s “PASS” system.This system is used to streamline routing and dispatch of Paratransit passenger vehicles, and has greatlyimproved the flexibility and reliability of this service. This system falls into the public transit managementuser service area.
Freeway Service Patrol (FSP). The Sacramento Transportation Authority operates the FSP in SacramentoCounty. This service falls into the incident management user service area.
SAFE Call Boxes. The Capitol Valley Regional Safe Authority operates the call box program in Sutter,Yuba, Sacramento, Yolo and San Joaquin Counties. The call boxes provide a limited degree of incidentmanagement user service, as well as traveler safety and security.
Demonstrations and Field Operation Tests (FOT’s). In addition to these ITS projects, three significant ITSdemonstration projects are currently going on in the Sacramento region. As demonstrations, all areprojects which are funded for limited operational periods. However, opportunities for full implementationof the successful portions of each demonstration are being explored by the project sponsors and lead .agencies.
. California Smart Traveler - This program includes two elements applicable to the Sacramentoregion: the “l-800-COMMUTE” service, and the Smart Traveler Internet Site. Both provide thepublic with direct access to roadway condition information, transit schedules, and services such asride matching. The project is currently sponsored by Caltrans, and other project sponsors andfunding is being sought.
. TransCal - This project focuses on integration of travel information and services for the SanFrancisco Bay Area-Sacramento-Sierra Foothills-Tahoe-Reno travel corridor, and provision of thisinformation and services directly to travelers through a variety of media: local radio and TVbroadcasts; electronic kiosks; a dial-up telephone advisory; in-vehicle displays; and hand-helddigital displays. TransCal also includes an ambitious transit information and incentive project forthe Reno-Tahoe area. The TransCal partnership is primarily interested in developing test versionsof these services, and will be working with local agencies and organizations to develop approachesfor sustained operation of the successful elements of the demonstration.
Sutter County ITS Program - This is a demonstration of four ITS project elements: “smart” callboxes, which also serve as fog-detectors and traffic monitors; emergency vehicle traffic signalpreemption systems; forward-looking infra-red (FLIR) collision avoidance systems for emergencyvehicles operating in foggy conditions; and public transit management systems.
Information on existing and programmed projects was collected by SACOG, and verified by projectsponsors. Listings were circulated for review in special ITS workshops, and at meetings of the Partnership.In some cases, cost information was not available.
Final Report Sacramento ITS Early Deployment Planning Study
-2-

Selection of Candidate ITS User Services
For planning purposes, “ITS” was defined as a set of 29 “user services”. The ITS users services aredefined not according to particular technologies or products, but rather, in terms of services which directlyor indirectly benefit travelers in the Sacramento region. Starting from the goals identified above, the listingof 29 user services was examined in a workshop of study participants and at the Partnership, and reducedto a subset of 14 user services which have unique applicability in the Sacramento region. This subsetincluded five users services which were determined to be of general applicability in the region, due to thenumber and cross-section of travelers benefitted, the number of transportation problems addressed, andother criteria.
. Traffic Control (e.g. traffic signal coordination, ramp metering, and coordination of traffic controlsacross jurisdictional boundaries)
. Incident Management (e.g. monitoring and surveillance systems, and coordination of agenciesresponding to incidents)
. En-Route Driver Information (e.g. changeable message signs and highway advisory radio)
. Emissions Testing and Mitigation (e.g. monitoring of air quality “hot spots”)
. Public Transportation Management (e.g. GPS-based dispatching and monitoring of transitvehicles)
An additional eight user services were determined to be applicable in the region, but limited in terms of thepotential beneficiaries or the number of transportation problems addressed.
All of the study findings and recommendations outlined above were summarized in the “Interim Report:Goals, Objectives and User Services Selection” (5/9/95), which was reviewed by the Partnership andaccepted by the SACOG Board of Directors in May 1995. This report summarized the major policydirections for ITS implementation in the Sacramento region, which were the subject of the followingphases of the EDPS.
Delivery of Selected User Services
The tasks outlined-above were completed by SACOG staff, working in concert with EDPS participantagencies and organizations. Identifying options for delivery of the selected user services was primarily theresponsibility of the technical consultant for the EDPS, JHK Associates. JHK Associates participated inthe workshops referenced above, and did additional Interviews and focus groups of study participants indeveloping an approach for delivering the selected user services. The user services delivery systemincluded recommendations for a set of eleven collaborative, interagency projects, in concert with existingand programmed projects, and with other ITS projects proposed by single agencies. Listed below are someof the major interagency projects, which were recommended to be considered for early deployment (i.e. in5 years or less).
Urban Area Traffic Control Network. This project involves roadway and transit systems in the urbanizedarea of Sacramento, and would provide a computer and communications network for exchange of trafficoperations and incident data. This would provide tools for system operators such as Caltrans, City andCounty government agencies, to better manage and coordinate traffic signals and incident managementacross jurisdictional boundaries. This project concept is dependent on the development of various traffic
Final Report Sacramento ITS Early Deployment Planning Study
-3-

and incident management projects currently planned or programmed by participating agencies, such as theSacramento Downtown Mastercontroller Project and the Sacramento County Traffic Operations Center. Afunding proposal for a portion of this project concept was advanced by Caltrans District 3, CaliforniaHighway Patrol, County of Sacramento, City of Sacramento, Regional Transit, and several private travelerservices companies, for the Federal Highway Administration “ITS Model Deployment Initiative (MDI)Program”.
Transit Services Network. This project would provide a computer and communications network forexchange of schedule, ride request’ and other information among transit operators in the region. Thiswould be a system operator’s network, which supplement existing customer services provided by theoperating agencies. It would also provide a basis for developing interactive transit trip planning servicesfor individual travelers. This project is dependent on various public transit management projects plannedand programmed by the participating agencies. A transit trip planning system for Sacramento RegionalTransit District was also a part of the Sacramento MDI Proposal.
Traveler Information Database. This project would establish an integrated database of real-timeinformation on all modes of travel, which could be disseminated to travelers through a variety of means,including the local broadcast media’ the Internet, dial-up telephone advisories, information kiosks, andother more advanced devices. Many examples of this type of database exist around the country. Theclosest thing which Sacramento has is the Smart Traveler program, which provides a limited amount ofreal-time travel data through the Internet and through the “1-800-COMMUTE” service. While theestablishment of the database is proposed to be a public agency initiative, the dissemination of theinformation to the public is expected to be a private sector role. El Dorado and Placer Counties aredeveloping plans for a traveler information system to deal with tourist and local travel needs during theGold Rush Sesquicentennial and other attractions in the area. A traveler information database for theSacramento urbanized area’ plus public access to the database via the local broadcast media’ the Internet,and other means was also a part of the Sacramento MDI Proposal.
In concert with these projects, JHK Associates recommended a number of interagency coordinationprojects: developing standardized information and data exchange protocols, regional incident managementprocedures, and demand management and operations. These coordination efforts would be undertaken inconcert with the above-mentioned project efforts.
In total, the recommended interagency projects, combined with projects proposed by single agencies, total$55 million dollars for projects with known costs. However, because many of the proposed projects areconceptually defined at this point’ and because the technologies and products which would be used arechanging rapidly, this total cost estimate should be considered as very preliminary. (For comparison,agencies in the Atlanta region have spent approximately $190 million to develop a fully integratedadvanced traffic management system, public transit management system, and traveler information systemin preparation for the Olympics in Summer 1996.)
This proposal for ITS user services delivery was detailed by JHK Associates in the “Project Summariesand Technology Assessment” binder (10/11/95) and in the “Summary Analysis Report” (10/11/95). Thesedocuments were circulated to all EDPS participants, and presented for review and comment at an ITSworkshop, and to the Partnership.
Final Report Sacramento ITS Early Deployment Planning Study
-4- . .

Expected Traveler Benefits
Estimates of benefits of ITS projects are based on research by JHK Associates on ITS projectsimplemented in other parts of the country. Because the ITS projects recommended in this study areconceptual, the benefits are expressed as ranges, with the low end of the range corresponding to low-levelproject implementation with a minimum level of interagency coordination, and the high end of the rangecorresponding to high-level project implementation, with the maximum level of interagency coordination.Also, for some project types, initial implementation efforts have already been made, and implementationof future elements may provide lower incremental benefits. Again, these estimates are based on actual,measured results achieved in other parts of the country, and not on simulations.
Freeway and Incident Management Systems. These systems include the various TOS projects sponsoredby Caltrans District 3, the proposed Caltrans/CHP Regional TMC, and elements of the proposed UrbanArea Traffic Control Network. In other areas, the range of measured benefits have been:
. Travel time decreases of 20 to 48 percent;
. Travel speed increases of 16 to 62 percent;
. Freeway capacity increases of 17 to 25 percent; and
. Significant decreases in average response time to incidents.
Traffic Signal Systems. These systems include surface street traffic signal coordination projects, andadvanced traffic management projects such as the City of Sacramento Downtown MasterController Project and the County of Sacramento TOC Project. The range of measures benefitshave been:
. Travel time decreases of 8 to 15 percent;
. Travel speed increases of 14 to 22 percent;
. Decreases in the number of vehicle stops of up to 35 percent; and
. Decreases. in average driver delay of 17 to 37 percent.
Additional benefits of video surveillance included in the City of Sacramento and County of SacramentoTOC projects arereduced maintenance and field operations costs.
Transit Management Systems. These systems include automated vehicle location (AVL) systems,advanced communications and dispatch systems, and transit vehicle signal preemption. The range ofmeasures benefits for these projects have been:
. Decreases in transit travel time of 5 to 8 percent;
. Increases in on-time performance of 12 to 23 percent; and
. Decreases in response time to incidents such as transit vehicle breakdowns and security calls.
Benefits for other ITS projects, such-as traveler information systems, have not been well documented.However, some local data on user acceptance and impact of travel behavior will be generated as part of theTransCal project and the Smart Traveler program.
Funding and Implementation Plan
Final Report Sacramento ITS Early Deployment Planning Study
-5-
For the purposes of funding, ITS projects break down into three general categories: multi-agencycollaborative projects, single agency projects, and showcase or demonstration projects. Six sources offunding are available for these project types: local agency/operator budgets; regionally-allocatedtransportation funding programs; state transportation funding programs; direct Federal ITS fundingprograms; private sector participation; and dedicated public funding programs. Other than special FederalITS funding programs, no discretionary funding source is dedicated for ITS projects. ITS projects willhave to compete with other types of projects for limited public funding.
For single-agency projects, the primary funding source should be local agency and operator budgets, withregionally allocated funding or state sources as a secondary funding source for projects with a broad areaof benefit.
For multi-agency, collaborative projects, regionally-allocated and state funding sources should beconsidered as primary sources, with supplemental and matching funds from local agency and operatorbudgets, and private sector participation.
For showcase or demonstration projects, Federal funding sources should be considered primary, withsupplemental funding from state, regionally-allocated, and private sector sources.
Three project concepts are proposed for implementation in the Sacramento region in the short range (i.e.next five years).
. Urban Area Traffic Control Network.
. Transit Services Network
. Traveler Information Database
An ITS Coordination Group, including any local agency operator interested in working towardimplementation of these project concepts, should be established. The Coordination Group would be taskedwith information sharing, project coordination, and development of funding for multi-agency ITS projects.In the coming year, specific action items for the group will be:
. Follow up on the Sacramento Model Deployment Initiative proposal,
. Investigation and development of private sector partnerships.
. Coordination with ongoing ITS demonstration projects in the region, and with other ITS planningand project development efforts in the region and in adjacent regions.
The funding and implementation strategy is detailed in the “Task 9 Technical Memorandum: Funding andImplementation Strategy”, and was presented for review and comment to EDPS participants at a specialworkshop, and later to the Partnership.
Final Report Sacramento ITS Early Deployment Planning Study
-6-
II. INTRODUCTION
The Sacramento ITS Early Deployment Planning Study (EDPS) is co-sponsored by SACOG, CaltransDistrict 3, and the California Highway Patrol Valley Division, with SACOG serving as the lead agency. Athree-member Coordination Team, with representatives of the study sponsors, is directing the study. Eachof the Congestion Management Agencies in the study area’ which include El Dorado, Placer, Sacramento,Sutter, Yolo, and Yuba counties are serving as ex-officio members of the Coordination Team, whichprovided management oversight for the project. .
JHK Associates served as the technical consultant for the project. JHK Associates has experience inplanning, design, and operation of ITS systems nationwide, and also served a key advisory role to FederalHighway Administration (FHWA) in development of the ITS Early Deployment Planning Program. JHKassisted in evaluation of the benefits of ITS, development of a concept for delivering key ITS user services,and identifying project concepts necessary for implementing these use services in the Sacramento region.
The EDPS was funded through an FHWA Early Deployment Planning grant’ with matching fundsprovided by SACOG and Caltrans District 3.
Study Participants
When the EDPS scope of work was defined, it was decided that the project would be supported by existingSACOG Advisory Committees, with no special technical advisory committee established. Input for theEDPS came from several sources: .
ITS Workshops. The main input came from a series of five workshops, which ranged from two hours toone-and-one-half days in length, the workshops were attended by representatives of 18 local agencies. Onthe average, eight to ten agencies were represented at each workshop. Topics which were coveredincluded: identifying transportation problems; rating the applicability of ITS user services for eachtransportation problem; preliminary review of the “system architecture” for delivery of ITS user services;and review of the conceptual ITS projects recommended by the JHK Associates; and . The workshopswere supplemented by a series of focus group meetings and interviews conducted by JHK Associates.
.SACOG Advisory Committees. Additional input came from the SACOG Advisory Committees. Themajor source of input was from the Regional Planning Partnership. Eight items related to this projectwere presented for discussion at the Partnership, and all the technical memorandums and interim reportswere presented for review and comment. Presentations were also made to the Freight AdvisoryCommittee, the Transit Coordinating and Productivity Committee, and the Bicycle and Pedestrian TaskForce.
Final Report Sacramento ITS Early Deployment Planning Study
-7-
Finally, presentations on the project were made to the Yolo County Transportation Authority, the Bi-County Transportation Authority, and to the technical advisory committees of the SacramentoTransportation Authority and the Placer County Transportation Authority.
A log of all meetings, workshops, and SACOG advisory committees at which discussions on the EDPS,and a listing of study participants by agency, is provided in Appendix A.
National ITS Program Overview
The Ititermodal Surface Transportation Efficiency Act (ISTEA) was enacted in 1991, and established the“Intelligent Vehicle-Highway Systems” program (now referred to as the Intelligent Transportation Systemsor “ITS” program). ISTEA also set forth ITS goals, specified planning, implementation, and reportingrequirements, and authorized funding through fiscal year 1997.
In the past, response to increased traffic demands resulted in the construction of new transportationfacilities. ISTEA changes this by encouraging improved efficiency in managing existing facilities. Theemphasis has been shifted from facility construction to the provision of user services, where users includetravelers, transportation providers, and all others impacted by the transportation system.
The ITS Program, as an explicit component of ISTEA, provides flexibility to state and local governmentsto fund projects that have the greatest potential to benefit users and the transportation system. Byproviding a framework for planning, the ITS program promotes coordination between governmentagencies and the private sector in the development and deployment of user services. The ITS Program hasalso outlined a deployment vision aimed at smoothing intermodal linkages and creating a coordinatednational transportation system.
The Federal Highway Administration (FHWA) has funded projects in 75 of the nation’s largestmetropolitan areas, to investigate ITS applications at the local level. The Sacramento area was selected asone of the regions to be included in the national Early Deployment Program. Through the completion ofthe EDPS, the Sacramento region will be in a better position to compete for and receive implementationfunding, which may be forthcoming from FHWA and other sources. Since economic and political supportfor the construction of new facilities is increasingly limited, the vitality of the region’s transportationnetwork is dependent upon maximizing the benefits of the existing infrastructure. ITS offers some uniqueapproaches to doing this.
In addition to funding the Early Deployment Planning Program, FHWA and the Federal TransitAdministration (FTA) have provided funding for various ITS demonstration projects, field operation tests
(FOT’s) and “model deployment” projects. Two examples of these projects funded through this programin the Sacramento region will be discussed later.
More recently, the U.S. Department of Transportation announced “Operation Timesaver”, which is a majorprogram oriented to implementing key ITS elements across the nation by 2001. As part of this effort, .FHWA and FTA sponsored the “ITS Model Deployment Initiative Program” (MDI). The MDI Programwas allocated $20 million dollars for 1996, and will provide matching funds for implementation of fully-integrated, intermodal ITS programs in two or three metropolitan areas. Several agencies in theSacramento area recently submitted a proposal for this Program.
Final Report Sacramento ITS Early Deployment Planning Study
-8-

ITS User Services
For planning purposes, “ITS” was defined as a set of 29 “user services”. The ITS users services aredefined not according to particular technologies or products, but rather, in terms of services which directlyor indirectly benefit travelers in the Sacramento region. This explicit reference to services which providetangible benefits to travelers reflects the user perspective which is part of ITS planning. Technologies andproducts are changing and evolving very quickly, and any reference to a specific technology today may beobsolete in a year or two. The needs of traveler for information, services, and benefits of more efficientlymanaged transportation systems are less likely to change in the short range, and are a better reference pointfor ITS planning. Additionally, the user service concept, since it is not dependent on technical expertise,allowed for non-technically trained individuals to participate in the study, especially in the early phases(definition of goal, objectives and selection of user services).
The 29 ITS user services are grouped into seven “bundles”, and are listed below. A more detaileddescription of the user services is provided in Appendix B.
Travel and Transportation Management.
En-Route Driver Information - Provides accurate, real-time travel advisories to drivers at theroadside (e.g. through changeable message signs) and inside the vehicle (through the radio or
‘special in-vehicle graphic displays) for convenience and safety.Route Guidance - Provides travelers with simple instructions on how to reach their destinations,after the traveler has started the trip.Traveler Services Information - Provides a business directory, or “yellow pages” of serviceinformation, specially tailored to the needs of specific traveler groups (e.g. to tourists, commuters,etc.).Traffic Control - Manages the movement of traffic on streets and highways (e.g. coordinatedtraffic signals, ramp meters, etc.)Incident Management - Helps public and private organizations quickly identify incidents andrespond and effectively to return roadway facilities to normal flow (e.g. video surveillance,coordinated dispatch, etc.).Emissions Testing and Mitigation - Provides information for monitoring air quality and developingair quality improvement strategies at “hot spots” of vehicle emissions (e.g. the Bureau of AutoRepair tailpipe monitoring program).
Travel Demand Management
. Pre-Trip Travel Information - Provides information for selecting the best departure time,transportation modes and routes, before a traveler begins a trip (e.g. radio traffic reports, “on-line”traveler information systems).
. Ride Matching and Reservation - Makes ride sharing more convenient by providing tools forfinding rideshare partners (e.g. Sacramento Rideshare’s automated ridematching system on “1-800-COMMUTE”).
. Demand Management and Operations - Supports policies and regulations designed to mitigate the
Final Report Sacramento ITS Early Deployment Planning Study
-9- .
environmental and social impacts of traffic congestion (e.g. HOV lanes, HOV bypass lanes atramp meters).
Electronic Payment
. Electronic Payment Services - Allows travelers to pay for transportation services electronically(e.g. automated debit account payment for privatized roadway facilities, like State Route 91 inSouthern California).
Public Transit Operations
. Public Transportation Management - Automates operations, planning, and management functionsof public transit systems (e.g. Paratransit, Inc.‘s ride request and dispatch system).
. En-Route Transit Information - Provides information to travelers using public transportation (e.g.real-time information kiosks and changeable message signs at transit stations, like those being builtin Atlanta for the Summer Olympics).
. Personalized Public Transit - Provide flexibly routed transit vehicles for more convenient serviceto customers.
. Public Travel Security - Creates a secure environment for public transportation patrons andoperators (e.g. video monitors on transit vehicles or stations).
Commercial Vehicle Ooerations
. Commercial Vehicle Electronic Clearance - Facilitates domestic and international borderclearance, minimizing stops (e.g. HELP, Inc.‘s weigh-in-motion systems at weigh stations inWestern states).
. Automated Roadside Safety Inspection - Facilitates roadside inspections.
. On-Board Safety Monitoring - Senses the Safety status of a commercial vehicle, cargo, and driver.
. Commercial Vehicle Administrative Processes - Provides electronic purchasing of credentials andautomated mileage and fuel reporting and auditing.
. Hazardous Material Incident Response - Provides immediate description of hazardous materials toemergency responders.
. Commercial Fleet Management - Provides communications between drivers, dispatchers, andintermodal transportation providers.
Advanced Vehicle Control and Safety Systems
. Longitudinal Collision Avoidance : Helps prevent head-on and rear-end collisions betweenvehicles, or between vehicles and other objects or pedestrians.
. Lateral Collision Avoidance - Helps prevent collisions when vehicles leave their lane of travel.
. Intersection Collision Avoidance - Helps prevent collisions at intersections.
. Vision Enhancement for Crash Avoidance - Improves the driver’s ability to see the roadway andobjects that are on or along the roadway.
Final Report Sacramento ITS Early Deployment Planning Study
-10-

. Safety Readiness - Provides warnings about the condition of the driver, the vehicle, and theroadway.
. Pre-Crash Restraint Deployment - Anticipates an imminent collision and activates passengersafety systems before the collision occurs.
. Automated Highway Systems - Provides a fully automated, “hands-off,” operating environment.
Emergency Management
. Emergency Notification and Personal Security - Provides immediate notification of an incident and an immediate request for assistance.
. Emergency Vehicle Management - Reduces the time it takes emergency vehicles to respond to anincident.
Final Report Sacramento ITS Early Deployment Planning Study
-11-

III. STUDY GOALS AND OBJECTIVES
The recommendations of the EDPS were targeted to address a specific set of transportation problems.This section describes those problems which were identified most frequently by the agencies responsiblefor planning and operating the region’s transportation infrastructure. The problem set has been limited tothose problems which local agencies believe can be addressed in whole or in part by ITS programs.
Problem Definition
A workshop for EDPS participants was held at the beginning of the study, in order to develop a “long list”of transportation problems to be addressed in later phases of the study (see Appendix C for results of theworkshop). This long list was consolidated by SACOG staff and JHK Associates to a set of six majorproblem areas, and detailed in the “Task 1 Technical Memorandum: Problem Definition” /1/. A summarytable from this memorandum is shown in Table 1. The technical memorandum was presented at a laterworkshop, and to the Regional Planning Partnership. The six problem areas are discussed below.
.Congestion. “Recurrent congestion” is generally caused when higher traffic volumes exceed roadwaycapacity along certain segments, and typically occurs during commute periods and on weekends during skiseason. “Incident congestion” is caused by an accident, vehicle breakdown, or other event which causes adisruption in normal traffic flow. A recent study of incident congestion in the Sacramento region suggeststhat incident-related freeway congestion represents as much as 77 percent of total freeway delay /2/.Between 1986 and 1993, vehicle hours of delay more than tripled. Caltrans now estimates that overone-half million vehicle hours are lost each year due to congestion on the freeway system alone. SACOGforecasts that the average amount of congestion and delay experienced by drivers and passengers in theregion will triple between 1995 and 2015 /3/.
Congestion affects a broad population of travelers. Although the extent of congestion is greatest duringcommute hours, truckers, shoppers, transit passengers on buses, and recreational travelers, are affected.Because of its inherent unpredictability, incident-related congestion affects an even broader cross-sectionof travelers than recurrent congestion.
Air Pollution. The Sacramento region is classified as a non-attainment area for Federal and State ozonestandards. In 1994, measured levels of ozone exceeded the Federal standard 9 days and the State standard47 days. Unlike congestion, which directly affects only travelers on the region’s transportation system, air
. pollution affects virtually all residents in the region.
The three major causes of vehicle emissions identified for this study include: the number of vehicle trips,the characteristics of the vehicles, and the length and speed characteristics of their trips.
The number of engine starts correlates directly with the number of vehicle trips.’ Approximately one-thirdof all emissions result from starting and stopping the engine, and have nothing to do with of the length ofthe trip, or any other trip characteristic. Therefore, strategies which reduce the number of vehicle trips willbe effective in reducing the total emissions in the region.
Final Report Sacramento ITS Early Deployment Planning Study
- 13 -

Automobiles are the largest single source of on-road emissions, with 20 percent of total ROG and 22percent of total NOx emissions /4/.. There are special concerns about the extent of “dirty vehicles” withineach class, which emit at rates much higher than average. Statewide programs such as the Department ofMotor Vehicles emissions testing program do not fully address this concern since many vehicles are notregistered or are exempt from emissions testing.
The characteristics of the vehicle trips themselves are also factors in determining emissions. The minimumrate of NOx emission occur at- moderate speeds, between 30 and 40 miles per hour (MPH), and increasesdramatically at speeds above and below this range. For ROG, the minimum emission rate occurs at speedsof about 50 MPH, and increases dramatically at speeds over 55 MPH and below 15 MPH.
Safety. Concerns about traveler safety include traffic safety and transit security. Traffic safety includesconcerns about the risk of injury or death due to accidents on the regions roadway system.Problems related to vehicle burglaries and vandalism at park-and-ride stations, and incidents involvingpassengers in transit vehicles and at stops, were frequently mentioned as reasons transit ridership isavoided.
The Sacramento region experienced over 26,000 reported traffic accidents, 231 of which resulted infatalities, in 1993. Those most directly affected were travelers involved in accidents, and their families,however, all travelers were indirectly affected through costs of automobile and health insurance.
In the Sacramento region, fatality and injury rates per vehicle mile have steadily decreased since 1986.Many factors have contributed to this decrease, including improved vehicle safety systems, seat belt andhelmet laws, stricter laws and enforcement regarding drunk driving, and other factors.
Transit Productivity. Three problems were cited by many sources related to transit productivity. First,transit mode share has slipped in the last ten years in the face of tremendous increases in overall travel inthe region. Between 1980 and 1990, the transit share of work trips declined by 50 percent, from aboutthree percent to two percent of commuters. Second, the need for better route, fare and schedulecoordination across operators was identified as a specific functional problem in the region. The thirdmajor problem cited was the lack of a seamless, user-friendly system for providing transit information topotential passengers.
Transit operators also expressed concern regarding additional service requirements and lack of funding forlegislative and regulatory mandates such as the Americans with Disabilities Act (ADA) and the Clean AirAct 1990 amendments (CAA). Another problem identified was decreasing operating revenues in the faceof increasing service costs. Most transit operators specifically identified paratransit and
”demand-responsive transit services such as dial-a-ride as particularly difficult services to provide in acost-effective manner.
Because current transit passengers have managed to overcome these problems, future improvements mustspecifically target travelers for whom transit may be a viable alternative to driving.
Freight Transportation. Problems related to freight transportation include regulation of truck activity,increasingly strict emissions requirements for truck engines, and inconsistencies in designation and
Final Report Sacramento ITS Early Deployment Planning Study
-15-

enforcement of truck routes. Administrative requirements associated with truck weighing, safetyinspections, registrations, and licensing were cited as factors affecting the efficiency of trucking in theregion. One example of the level of regulatory activity which affects truckers in the region is the number ofvehicles stopped and weighed at the Antelope scales on I-80: 450,000 vehicles are processed annually atthis facility. This does not include seasonal activity and spot-checks at other temporary and random scalesand/or inspection sites.
Another problem area includes problems that the public perceives to be caused by freight movements inthe region. Significant among these problems are the congestion impacts of trucks during peak hours, theair quality impacts of truck operations, and the impacts of truck traffic on surface streets. Traffic and noiseimpacts of truck distribution facilities and other generators of truck traffic in residential areas have alsobeen cited. As with total vehicle miles traveled, growth in truck travel has outpaced population growth inthe last decade. Between 1983 and 1992, truck travel increased by 67 percent, while population increased36 percent.
For rail movements, safety problems associated with a significant number of at-grade crossings were citedas serious concerns. Increased Pacific Rim trading activity has led to concerns about the impact of thisactivity on intermodal freight terminals. Like all California ports, the Port of Sacramento has seen steadygrowth in containerized shipments which are processed through adjacent truck and rail terminals.
Interregional and Through Travel. The most frequent problem related to interregional and through travel isthe impact of recreational travel bound fdr the Sierra-Tahoe region. This problem is most often expressedin terms of the recurrent congestion impacts of this traffic in the urbanized areas, and incident and weatherrelated congestion in the mountain areas. Difficulties in getting current information about upstreamweather and roadway conditions (e.g. chain requirements) to travelers in advance of a point of no returnwere also mentioned. I-80 and US-50 are the routes most severely impacted. These impacts occur onFriday nights in the eastbound directions, with less severe impacts on Sunday nights in the westbounddirections.
To a certain extent, interregional travel is likely to increase with population within the region. However,through traffic depends as much on the supply of recreational facilities in the Sierra-Tahoe region, demandfor goods in the Central and Western states, and population growth and demand for recreation in otherregions, such as the Bay Area.
Goals and Objectives
Six goals were developed in direct response to the problems defined above. Each of these goals is capableof being addressed in varying degrees by implementation of one or more of the ITS user services. In thefollowing pages, several objectives are also identified which would contribute toward meeting each of thegoals.
Goal # 1: Reduce Congestion. Congestion occurs when demand exceeds capacity. Therefore, the .objectives which will support this goal are aimed at reducing demand and/or improving the “effective”capacity of facilities through traffic management strategies. The following specific objectives support thisg o a l :
Final Report Sacramento ITS Early Deployment Planning Study
- 16-

a)
b)
c)
d)
Reduce peak vehicle demand in congested corridors - Studies have shown that auto occupancies inthe peak periods currently range from 1.17 to 1.26. The abundance of single occupant travelclearly contributes to congestion in capacity limited corridors. SOV demand can be reduced bymode shift or shifts to HOV travel.
Provide real-time information on travel routes, modes and travel times - Travelers may be able toalter the origination time of trips or postpone discretionary trips if they know such trips would bemade under congested conditions. If travelers can be alerted to alternate routes and modes,demand may be reduced in critical sections of the network.
Reduce number and duration of incidents - Studies indicate that the congestion resulting fromincidents can last three to five times as long as the incident itself. Therefore, if the incidents canbe cleared in less time, the resulting congestion will be reduced dramatically.
Implement traffic management strategies to reduce delay on major facilities - Congestion’occurswhere demand exceeds capacity. In many cases, the effective capacity of a given segment is notconstrained by physical dimensions, but rather the traffic controls at the location. Delay andcongestion may be reduced by reducing the number of stops and starts that occur in the system.
Goal #2: Reduce Pollution. A considerable portion of the air quality problem is related to vehicleemissions. Objectives which will support this goal will reduce the number of vehicles and targetexceptionally “dirty” vehicles for clean up. The following objectives support the goals of reducingpollution.
a)
b)
c)
d)
Reduce number of “dirty” vehicles - A disproportionate share of the vehicle emissions in the areais caused by a specific set of “dirty” vehicles. Therefore, a disproportionate amount of benefit maybe realized by removing such vehicles from the system or identifying and targeting such vehiclesfor clean up.
Make transportation operations responsive to prevailing air quality - A number of traffic controlstrategies may be used to facilitate traffic movements in certain areas, or discourage travel in otherareas. If such strategies were selected based on prevailing air quality, air pollution could beminimized in certain hot spots or subareas on a given day.
Implement traffic management strategies to minimize emissions - A large portion of vehicularemissions occurs during the start up and acceleration of vehicles. By providing a consistent travelspeed and minimizing vehicle stops, such emissions would be reduced.
Reduce total vehicle trips - Vehicle starts are a significant contributor to the prevailing airpollution. By promoting modal shifts away from single occupant autos, and reducing the amountof discretionary travel, such emissions could be reduced.
Improve Travel Safety. Travel safety will be improved through improvements in vehicle technologies anddriver awareness to potentially hazardous situations. The following objectives support the goal of
improving travel safety.
a) Warn travelers of adverse weather and roadway conditions - The Sacramento region experiences
Final Report Sacramento ITS Early Deployment Planning Study
-17-
b)
c)
d)
e)
f)
a variety of weather conditions which can significantly impair driver visibility, cause slippery roadconditions, or even road closures. Advance warning of fog, snow, and ice conditions wouldenable drivers to exercise caution.when needed and to be alert to potential hazards.
Promote advances in transportation safety technologies - When accidents occur, the severity ofinjury and property damage is related to a number of factors. Advances in safety technologieswithin the vehicle and in the roadway and rail networks can significantly reduce the severity ofaccidents. In-vehicle restraint systems, warning systems, and braking systems have madesignificant improvements over the past several years. These systems as well as improvements intraffic control devices have the potential to further improve travel safety.
Increase security of public transportation systems - Improvements in safety can occur in all travelmodes. Public transportation providers are increasingly concerned about passenger safety atstations, parking lots, and on the vehicles themselves. There are a number of opportunities withinthe ITS program to enhance safety in these areas.
Enhance emergency response capabilities - In many accidents, the severity of injury is related tothe time between the accident occurrence and the time that medical attention is provided. Studieshave shown that the fatality rate can be decreased when medical response times are reduced.Response times can be reduced through improved notification and dispatch systems.
Facilitate consistent travel speeds on freeway and local streets to reduce accidents - Many vehicleaccidents result from congested travel conditions in which drivers are repeatedly accelerating andstopping. Improving the consistency of travel speeds would reduce the frequency of this type ofaccident.
Manage primary incidents to reduce the number of secondary incidents. When an incident createsstop and go traffic and standing queues, a large number of secondary accidents often result. ITSsystems which alert motorists to downstream incidents can heighten awareness and decrease thenumber of secondary accidents.
Goal #4: Improve Transit Service Utilization. There is a considerable investment in public transportationinfrastructure which is not being utilized to its fullest extent. Objectives supporting this goal will attemptto increase the public’s return on this investment through increasing its role as a viable transportationservice in the region. The following objectives support the goal of improving transit service utilization.
a) Improve continuity of transit services - There are currently 12 transit service providers in theSacramento region. The operations of each service are not coordinated with respect to scheduling,routing, or fare structure. As a result, travelers are implicitly discouraged from traveling via transitacross jurisdictional boundaries. Coordination of schedules and routes among service providerswill enhance transits position as a regional travel option.
b) Provide timely distribution of transit information - Many potential transit riders cite a lack o finformation as an impediment for their use of the system. There are many avenues to improve thecontent, timeliness, and availability of transit service information. As the general public has betteraccess to such information, potential benefits of transit service will be easier to market.
Final Report Sacramento ITS Early Deployment Planning Study
-18- .
c)
d)
e)
f)
g)
Improve accessibility to transit - Transit service utilization is fundamentally tied to theaccessibility of such service from trip origins. ITS programs which provide flexibility in routingwill improve accessibility and in turn, utilization.
Increase frequency and quality of transit service - The competitiveness of transit service as alegitimate travel option depends upon its ability to offer flexible frequent service. ITS programswhich improve on-time performance and quality of service and provide opportunities for morefrequent service will increase utilization.
Improve coordination between transit operators - Movement toward seamless operations andadministration of transit services has the potential to reduce confusion among travelers and in turn,make transit easier to use.
Improve competitiveness of transit - Improvements in transit service utilization will require suchservices to be more competitive with the automobile. Specifically, such services must becompetitive in travel times and in flexibility for routing and scheduling.
Provide management tools to better utilize operations resources - Transit utilization willfundamentally be improved if the services are provided in the most efficient way possible. ITSsystems which allow providers to track vehicle locations, driver work schedules, and vehiclemaintenance records all contribute to better operating performance.
Goal #5: Facilitate Commercial Vehicle Movements in the Region. The Sacramento area is strategicallylocated with respect to goods movement in Northern California and the Western U.S. The economicvitality of the region is dependent upon efficient movement of commercial freight through the area. Thefollowing objectives support the goal of facilitating commercial vehicle movement in the region.
a)
b)
c)
d)
Reduce truck volumes on non-designated truck routes - A number of local agencies haveexperienced increased volumes of trucks which are believed to be related to a lack of informationon designated truck routes. Improved identification of truck routes could concentrate suchmovements toward facilities and adjacent land uses more conducive to such travel.
Decrease regulatory delays for commercial vehicle operators - Commercial vehicle movementscan be facilitated by reducing delays due to regulation (weighing, inspection, etc.) as well ascongestion.
Provide real-time information on alternative conditions - When congestion is caused by highdemand, or reduced capacity associated with incidents, the magnitude of the delays can be reducedif travelers upstream are notified of the conditions ahead. Commercial vehicles have a vestedeconomic interest in travel times. Information concerning alternate routes to avoid congestion will .facilitate their operation in the region.
Streamline administration of commercial vehicle operations - Commercial vehicle operators arenot only regulated on the roadway, but in their administrative procedures as well. ITS programswhich ease the administration associated with such regulation will improve the ability ofcommercial vehicles to operate in the region.
Final Report Sacramento ITS Early Deployment Planning Study
-19- . .
Goal #6: Minimize the Impact of Through and Inter-Regional Travel. The Sacramento area is both abeneficiary and victim of impacts related to through travel. Objectives within the ITS program willattempt to maximize the benefits that come from these travelers, while minimizing their negativecontributions to congestion in the region. The following objectives support the goal of minimizing theimpacts of through and inter-regional travel.
a) Provide general travel information on available routes and modes - The impacts of through travelcan be fundamentally reduced by altering the travel modes used by such travelers, and bydiscouraging such travel during peak periods. Greater distribution of information on travel optionsthrough Sacramento has the opportunity to alter the behavior of trips originating in the Bay Area orin the Sierras.
b) Provide real-time information on alternative modes and travel times - Congestion on I-80 and US 50may be eased by providing information to through travelers who may be unfamiliar with the localnetwork and alternative routes.
c) Warn travelers of adverse weather and roadway conditions - The Sacramento area experiences avariety of weather conditions which can impair driver visibility. Warning devices which can alertdrivers to fog or slippery roadways can reduce weather related accidents that contribute tocongestion.
d) Improve distribution of real-time route closure and vehicle restriction information - Congestion isoften exacerbated by the presence of snow or fog which can cause road closures and strandmotorists traveling through the region. Distribution of information on adverse travel conditionsenables through travelers to adjust trip times through the region, or make better informed locations onwhere to stop while waiting for weather to pass.
Final Report Sacramento ITS Early Deployment Planning Study
-20-

IV. SELECTION OF USER SERVICES
Using the results of the problem definition process, and the goals and objectives summarized above, theseuser services can be screened to determine which ones are potentially the most effective in the Sacramentoarea.
This report section describes the user service selection process for the Sacramento region, and identifiesthe areas of benefit that may be realized from the user services with the greatest applicability for the region.The selection process categorizes each of the user services based on their utility for general application,orientation toward specific groups of travelers, and private sector orientation. The user services selectionprocess was detailed in the “Task 2 Technical Memorandum: Prioritize ITS User Services” /5/, which wasbased on input from an ITS workshop, and presented for review and comment to the Regional PlanningPartnership. The user services selection, along with the problems, goals and objectives reported in SectionIII of this Report, were summarized and presented to the SACOG Board for review in an Interim Reportfor the EDPS /6/.
The remainder of the EDPS was focused on the 14 user services with the EDPS participants determined tohave general applicability in the Sacramento region, or were applicable to a specific traveler group. Theremaining 15 user services were determined to have very limited applicability in the Sacramento region, orwere not likely to be implementation responsibilities for the EDPS participants.
Selection Criteria
The selection of user services took into account several primary criteria.
Users Affected. User services which directly address problems of a general nature (i.e., problems whichaffect most residents or travelers) were more likely to be selected for further study.
Problem Coverage. This criteria refers to the range of problems identified in the previous section which aparticular user service could address, either directly or indirectly. User services which addressed a broadrange of problems were selected for further study.
Functional Commonality.. Some user services require functions that provide a basis for the deployment ofother user services. User services which were necessary in terms of providing functions for other userservices were selected for further study. .
Three secondary criteria were also considered.
Likely Deployment Responsibility. For some user services, the major deployment agents are likely to benational or international (i.e., many of the advanced vehicle control and safety systems), and not within the
Final Report Sacramento ITS Early Deployment Planning Study
-2l-

purview of any public or private regional entity. User services likely to be deployed at a scale above thisregion were given lower priority. Many of the vehicle systems user services fell into this category.
Current Deployment Status. Several user services have already been partially deployed in the region. Thisfact was considered where the existing deployed service provided a building block for enhancements or afunctional commonality with other user services. These user services were given higher priority.However, unless a particular user service met the criteria related to users affected, problem coverage, orprovided a basis for deployment of other services, the current deployment status was not considered to berelevant.
Likely Deployment Timeframe. Some user services include applications whose benefits have been provenin this region or in other areas. Others are based on applications whose benefits are unproven, or are stillin the development stage. User services for which applications and benefits have been proven either in theregion or elsewhere were given higher priority. .
User Services with General Applicability in the Region
The following ITS user services were determined to be generally applicable in the region, because of thenumber of users affected, the potential geographic coverage, and the commonality each had with other ITSuser service. For example, many of them are necessary building blocks for generating travel information .for other purposes.’ Also, for each of these user services, considerable progress has already been made interms of planning, programming and implementing systems.
Traffic Control. This user service possesses functional commonality with many other user services. Giventhe amount of travel which is done on roadways, either in automobiles, commercial vehicles or transitvehicles, the number of users affected is large. Additionally, various agencies have already begundeployment of basic elements of this user service in the form of coordinated traffic signal systems, transitvehicle signal pre-emption, ramp meters, HOV bypass lanes, traffic monitoring stations, and surveillanceequipment. These systems provide a solid base for early implementation efforts.
Incident Management. By quickly returning a roadway to normal function after accidents or other moreminor incidents, and by reducing the potential for secondary accidents, incident management affects abroad range of travelers on the region’s roadways. These travelers include commuters, transit passengers,freight transporters, recreational travelers, and others. Incident management also addresses a range ofproblems, such as congestion, safety, and inter-regional and through traffic. Various agencies in the regionhave already deployed key incident management elements, such as Freeway Service Patrol, TrafficManagement Teams, and others, which provide a basis for future deployment and improvements.
En-Route Driver Information. The ability to communicate key information to travelers during their tripwas cited by many sources as a useful service to travelers. In addition to the potential for affecting routechoice, en-route driver information can also improve operations in incident areas by giving drivers advancenotice of the need to merge away from a blocked lane. This service effects a broad range of travelers onthe region’s roadways, and certain basic elements have already been deployed.
Emissions Testing and Mitigation. As a transportation problem, air pollution is unique in that it directlyaffects the health of all residents of the region, and not just travelers. Clearly, many ITS services address
Final Report Sacramento ITS Early Deployment Planning Study
-22-

concerns about air pollution in various ways. However, without better tools to evaluate their effects on airquality, the impact of these strategies on air quality may not be known. This is true not only of ITSapplications, but other transportation strategies as well.
Public Transportation Management. Systems supporting this user service generate the real-time transitsystem information which is the basis of other user services such as en-route transit information and pre-trip travel information. This user service also addresses a range of problems such as: the need for betterschedule, route and fare coordination; increasing operating costs; and recurrent congestion problems andvehicle emissions problems.
User Services with Applicability to Specific Traveler Groups
The following user services were determined to be applicable in the region, but are more focused onspecific traveler groups and area residents.
Route Guidance. This user service has the potential to address problems related to congestion, especiallyfor travelers who are unfamiliar with the region and can be guided to routes that avoid congestion.However, until more travelers have in-vehicle systems, or personal digital assistants (PDAs), the benefitfrom this user service is likely to be limited.
. Pre-Trip Travel Information. This user service has the potential to modify route and time of departure oftravelers, based on congestion, incident, and weather conditions. Travelers who could derive the greatestbenefits from this service are those making discretionary trips, which can be scheduled or routed moreflexibly than commuter trips.
Ride Matching and Reservation This user service is targeted at commuters, and has been extensivelydeployed in the region by Rideshare, various TMAs and employers. By reducing the number of vehicletrips, this user service can contribute to reduction of congestion and emissions. Rideshare is currentlydeploying a computer-based ridematching system which will have the potential for real-time ridematching.
Demand Management and Operations. Some aspects of this user service overlap with ride matching andreservation, and with traffic control. Unique elements of this service are related to reducing travel demandthrough compressed work weeks, telecommuting, and other strategies. These unique elements should bethe focus of applications of this user service. However, many of these applications involve complexmanagement and labor issues which fall outside the scope of this study.
Personalized Public Transit. This user service has the potential of providing better service to lower density. areas, at a lower cost than traditional fixed route service. Additionally, this service has applications for
providing paratransit and ADA-compliant services, which are a great concern to transit operators andmobility-impaired persons. For this reason, this service merits further consideration.
Public Travel Security. This user service addresses concerns related to personal safety of transit riders andemployees. Deployment of this user service may make transit more attractive to some potential riders.Priority should be given to development of transit management tools, and traffic control strategies toimprove transit service.
Final Report Sacramento ITS Early Deployment Planning Study
-23-

Commercial Fleet Management. This user service provides direct benefit to freight operators, by allowingfor more efficient routing and dispatch of trucks. This service also benefits travelers in general, byminimizing the impact of trucks in congested segments of the roadway system. Generation of the real-timeinformation on roadway system performance, which would provide crucial information needed forimplementation of this service.
dous Material Incident Response and Emergency Vehicle Management. These user services provideimportant special-purpose incident management applications, which improve response to major incidents.These are important user service, which are both provided using a variety of ITS and non-ITS applicationsby various agencies which provide emergency response.
User Services with Limited Applicability for Public Sector Deployment
The following ITS user services were determined to be of limited applicability in the region, based on thelikelihood of early implementation, or involvement in implementation by the study participants.
Traveler Information Service. This was given a low priority for this region because the service wasexpected to provide benefits for a relatively small number of travelers.
En-Route Transit Information. This service should be considered after transit operators have developedthe capability of generating real-time information on transit operations.
Electronic Payment Services. The lack of toll facilities and of proposals for congestion pricing limits theutility of this user service to transit fare collection. If toll facilities or congestion pricing are considered inthe future, this user service would merit higher priority.
Commercial Vehicle Electronic Clearance. Automated Roadside Safety Inspection. and CommercialVehicle Administrative Processes. These user services directly address only problems related to the impactof regulation on freight operators. Additionally, opportunities for deployment of these services in theregion are limited, and not directly in control of agencies within the region.
On-Board Safety Monitoring. Deployment of this user service is likely to be initiated by vehiclemanufacturers, and/or freight operators on their own initiative.
Emergency Notification and Personal Security. This user service is extensively deployed through cellularphones and call boxes. Other applications, such as mayday systems in vehicles, are potentially beneficial,but are likely to be deployed by vehicle manufacturers or owners on their own initiative.
Advanced Vehicle Control and Safety Systems User Services. These user services largely focus on in-vehicle systems which will be deployed by vehicle manufacturers. One exception to this may beintersection collision avoidance, whieh may be deployed locally. Until specific applications of this userservice are available, traffic control, incident management, and emergency response user services shouldbe given higher priority.
Final Report . Sacramento ITS Early Deployment Planning Study
-24-

V.. ASSESSMENT OF BENEFITS OF ITS USER SERVICES
The purpose of this section is to determine potential areas of benefit that could be realized fromimplementation of the selected ITS user services, discussed in the previous section, in the Sacramentoregion. .
At this point in the ITS program development process it is only possible (and necessary) to identify thetopical areas of benefit. The specific level of benefit that may be achieved in the Sacramento area will besensitive to a number of project specific factors. Some of the project specific factors that will influence thelevel of benefit include the demographics of travelers, the configuration of the transportation network, theseverity of the problem being addressed, the number of stakeholders directly influenced by the project, andthe level of implementation of the user services.
In assessing the potential areas of benefit that may result from ITS deployment, it is necessary to makeassumptions on the areas of application and the stakeholders who may benefit from each user service. Theimplementation scenarios given in the following pages are made for the purposes of the benefitsassessment only. The scenarios should not be construed as a precursor for the project developmentpriorities or descriptions that may be produced in subsequent tasks.
In reviewing this section, it should be noted that many of these benefits are already being realized bySacramento area ITS stakeholders. These benefits are occurring where the strategies have been partiallyimplemented through the projects identified at the end of this section. Because many of the services arealready being provided to some extent, the magnitude of “additional” benefit will not be as high as thefigures identified in this section. The specific figures quoted in this section are applicable for initialimplementation of the services.
Traffic Control
Objective. The traffic control user service manages the movement of traffic on streets and highways.
Area of Application. This user service will be provided in areas with a network or corridor of trafficsignals and on the urban freeway system.
Stakeholders Who Benefit. Traffic control will help to ensure the safe and efficient movement of all usersof the surface transportation system, including private automobiles, commercial and transit vehicles, aswell as non-vehicular travelers such as bicyclists and pedestrians.
Potential Benefit. In its early stages, the primary benefits of the traffic control user service will take theform of reduced stops and delays. The traffic signal coordination element of traffic control has proven tobenefit motorists significantly. A recent study of the City of San Jose’s traffic signal coordination programreported that motorist travel times were reduced by 16%, delays declined by 38%, and vehicle stops dipped
Final Report Sacramento ITS Early Deployment Planning Study
-25-
39% /7/. Other studies of traffic signal coordination have produced similar results /8,9/. These programshave shown benefit/cost ratios of up to 62% /10/. The freeway traffic management element (primarilydemand management through ramp entry control) of traffic control also results in significant user benefits.A review of freeway traffic management systems throughout the country revealed that ramp entry controlhas the potential to increase mainline speeds by 8 to 20% while reducing overall system delay by 16%/1 1,12/. Freeway accident rates have decreased by 40 to 50% as a result of ramp metering.
In addition to these initial quantifiable benefits, the underlying surveillance, data processing, andcommunications technologies that are a part of the traffic control user service will contribute to other ITSservices such as in-vehicle navigation systems, trip planning and routing systems, and publictransportation, emergency vehicle and commercial fleet management systems. The ultimate benefitsexpected to be derived from these user services include increased productivity, savings in travel time,delays, and driver frustration. Traffic control will also help to mitigate the environmental and energyimpacts of surface transportation by reducing harmful vehicle emissions and fuel wasted by congestion andnavigational inefficiencies. Because the general public will be the beneficiary of these energy andenvironmental improvements, the total benefits are expected to be significant.
Incident Management
Objective. The incident management user service enhances existing capabilities for detecting incidentsand taking the appropriate actions to restore the roadway to a normal function as quickly as possible.
Area of Application. This service will be provided throughout the state highway system and on majorarterial roadways.
Stakeholders Who Benefit. The traveling public benefits from reduced incident related delay. Accidentvictims benefit from reduced response times to incidents. Emergency response fleets, enforcementagencies, the private towing and recovery industry, and those that operate and maintain the transportationsystem also benefit by being able to conduct their operations more effectively..Potential Benefit: Studies conducted on Los Angeles highways by the California Department ofTransportation during off-peak periods have shown that for each additional minute required to clear a lane-blocking incident, an additional four or five minutes of congestion result. The resulting congestion is oftenmuch greater during peak periods /13/. Thus, it stands to reason that prompt incident removal can have asignificant impact on reducing non-recurrent congestion. The Orange County IVHS Study reports thatincident management can reduce non-recurrent congestion on the freeway system by 37% /14/. Theimplementation of an incident management system in metropolitan Toronto has reduced average incidentduration from 86 minutes to 30 minutes, a decrease of 65% /15/. This has resulted in a reduction in non-recurrent vehicular delay of 77%.
The Minnesota Highway Helper Program has reduced the duration of a stall (the most frequent type ofincident, representing 84% of service calls) by eight minutes /16/. Using representative numbers, annualbenefit through reduced delay totals $1.4 million for a program that costs $0.6 million to operate.
The Maryland CHART program started as an “Eyes and Ears” program and now is in the process ofexpanding to more automated surveillance with lane sensors and video cameras. This program is expected
Final Report Sacramento ITS Early Deployment Planning Study
-26-

to return about a ten-to-one benefit-to-cost according to draft analyses /17/.
Public Transportation Management
Objective. The public transportation management user service applies advanced vehicle electronic systemsto various public transportation modes and uses the data generated by these modes to improve service tothe public.
Area of Application. This service would be provided to all public transportation systems in theSacramento region.
Stakeholders Who Benefit. Direct users of this service are the public transportation operators, however alltransit riders benefit from the service.
Potential Benefit. Public transportation management will benefit both the transportation provider and thepassenger. The benefits of public transportation management will accrue to the customer in the form ofimproved service reliability, schedule information accuracy, on-time performance and reduced cost (cost inthese terms is inferred from reduced wait times, and is not meant to imply lower fares).. An evaluation ofthe public transportation management system (consisting of an automatic vehicle monitoring andcommunications system) in Dublin, Ireland indicated that passengers experienced a 24% reduction inexcess wait times and that the frequency distributions of buses more closely matched the schedules /18/. Aproductivity improvement reported in Portland was the use of a bus priority system integrated with thetraffic signal system on major arteries /19/.. By allowing buses to either extend green time or shorten redtime by only a few seconds, the bus travel time was reduced by between five to eight percent. This willresult in faster service for the customer and would allow the use of fewer vehicles to serve that route.
The first phase of the PASS system, new dispatching software implemented by Paratransit in early 1995,has allowed rider boardings to be scheduled within a 30 minute period instead of the previous 90 minuteperiod. The second phase, on board terminals on busses, will be followed by a third phase, installing aGPS locating system on buses.
Transportation service providers will also benefit from better operational control over their vehicles andthrough lower costs derived from better utilization of and greater productivity from employees. Resultsfrom a study of the public transportation management system (also consisting of an automatic vehiclemonitoring and communications system) in Cincinnati indicated that weekday bus miles of travel werereduced 7.2% and platform hours reduced by 8.2% /20/. Furthermore, many of the labor intensiverepetitive tasks now manually performed can be automated. The employee can be greatly assisted withthese technologies, thus creating less stress and increasing job satisfaction.
Emissions Testing and Mitigation
Objective.The emissions testing and mitigation user service is used to provide area-wide pollutioninformation for use in monitoring air quality conditions and framing air quality improvement strategies.
Area of Application. It is anticipated that this service would be provided at locations of vehicular air
Final Report Sacramento ITS Early Deployment Planning Study
-27-

pollution, including the freeway system and intersections.
Stakeholders Who Benefit. Direct users of this service are not just air quality and traffic managementpersonnel, but all residents of the Sacramento region benefit.
Potential Benefit. Environmental benefits are expected to be modest in size, unless congestion pricingbecomes reality. Typical travel demand management benefits are on the order of two to four percentreductions in overall vehicle miles traveled (VMT), as well as hydrocarbon (HC) andcarbon monoxide(CO) mobile source emissions /21/. Reducing oxides of nitrogen (NOx) by even this amount is moreuncommon in the benefits analysis. Similar magnitude results accrue from flow improvements via TMC’son freeways. Benefits of this magnitude are unfortunately similar in magnitude to a single year’s growth inVMT. Signal coordination and optimization claim emission benefits in the range of 10%, in addition totravel time improvements. This size of benefit contrasts with vehicle improvements leading to a reductionin vehicle sources of 39% for HC and 40% for CO while VMT increased 41% in the decade from 1982 to1991. In a report produced for the Illinois DOT, planners basically pass traffic flow improvements off as ashort term benefit rather than a longer term building block for emissions reductions, saying that flowimprovements simply allow more dispersed land use patterns /22/. Small benefits are also expected fromelectronic toll collection and commercial vehicle operations (CVO) border crossing/weigh station bypass.
En-Route Driver Information
Objective. The en-route driver information user service provides travel-related information to drivers aftertheir trips have begun.
Area of Application. It is anticipated that this information will be provided to travelers on all statehighways (both urban and rural) as well as major urban arterials.
Stakeholders Who Benefit. Users of this service include the drivers of private, commercial, and transitvehicles.
Potential Benefit. Direct benefits associated with en-route advisory information were quantified in theOrange County IVHS Study /14/. The study indicated that en-route driver information (changeablemessage signs, highway advisory radio, and In-vehicle display devices) has the potential to reduce by 23%delay associated with non-recurrent congestion on the freeway. Recurrent freeway delay was reduced fourpercent. Congestion on surface streets was reduced by 11% as a result of en-route driver information.
In addition to these direct reductions in delay, other benefits of driver advisory information will occur. Forexample, measurable reductions in traffic congestion presents obvious advantages for the traveler, but theindirect consequences are also significant. These include reduction of “secondary” or congestion-relatedaccidents, improved transit service, and reduced fuel consumption and emissions from idling engines.Productivity gains result not only from workers who waste less time commuting, but also from loweroperating costs to fleet operators and greater returns on capital investment in public transportation. .
Public perception of information accuracy is also of importance. The INFORM project found that 29% ofsurvey respondents rate the information as very useful and 75% as moderately useful or better, 63% ratedthe information as usually or always accurate, and 45% said that they sometimes changed their routes
Final Report Sacramento ITS Early Deployment Planning Study
-28-

based on the information /23/ .
Increased collection and creative use of information will assist drivers in making informed decisions to usetransit and other ride-sharing arrangements. Less vehicle-miles of travel will result, with associatedenvironmental and energy conservation benefits. Personal mobility will be enhanced by making transitservices better understood and more accessible, especially to the transportation-disadvantaged, includingthe elderly and disabled, and residents or visitors in geographically remote communities.
Public Travel Security
Obiective. The public travel security user service supports innovative applications of technology toimprove the security of public transportation systems.
Area of Application. This service will be provided by all transit agencies in the Sacramento region.
Stakeholders Who Benefit. Users of this service include transit customers and employees, transitoperators, law enforcement agencies, and the general public.
Potential Benefit. Concerns related to safety and security are often cited by potential transit passengers asdisincentives to using public transit. These concerns include both personal safety (e.g. safety of passengersfrom crime or harassment on board a transit vehicle or at a stop) as well as the security of property (e.g. anautomobile parked at a LRT station parking lot). Unfortunately, statistics on the actual occurrence ofincidents of this type are not consistently tracked and tabulated, so the actual magnitude of risk forpassengers is not known. Two things are known, largely from anecdotal evidence: (a) that many potentialtransit passengers do perceive a risk to traveling by public transit, which is greater than the risk of travelingby private automobile; and (b) that some incidents, both on transit vehicles and at stops and parking lots,do occur which fuel this perception. Any measured increase the actual security, or the perceived securityof transit passengers, would encourage higher transit ridership. This would help transit operators byincreasing ridership and revenues, and would benefit the region generally by decreasing the number ofvehicle trips.
Personalized Public Transit
Objective. The personalized public transit user service involves the use of flexibly routed vehicles offeringmore convenient service to customers.
Area of Application. This service will be provided in low population density areas where conventionalfixed route transit is prohibitively expensive and cost inefficient.
Stakeholders Who Benefit. Users of this service include travelers in lesser populated localities andneighborhoods wishing to use public transit. Transit providers also benefit by improved efficiency in .allocating operating resources.
Potential Benefit. From the users’ perspective, time savings when making trip requests, reducing waitingtime for the bus to arrive, and increased confidence that the requested service will be delivered. The
Final Report Sacramento ITS Early Deployment Planning Study
-29- .

availability of this service in suburban areas might allow a family to have only one car, a significanteconomic benefit. From the transportation operator perspective, better vehicle utilization, increasedridership and revenues, increased system capacity with no additional vehicles, increased average vehicleoccupancy, increased average speed due to reduced dwell times, and increased productivity of.employees.From the community perspective, there may be benefits from fewer adverse environmental impacts.
Ride Matching and Reservation
Objective. The ride matching and reservation user service develops and encourages ridesharing byproviding real-time ridematching information along with reservations and vehicle assignments.
Area of Application. The only limits placed on this users service are based on the number of travelers withaccess to the information.
Stakeholders Who Benefit. Users of this service include daily commuters as well as occasional travelers orvisitors to the area who are not familiar with local travel options.
Potential Benefit. Benefits for the ride matching and reservation user service include increased publicaccess to shared ride modes, decreased congestion, reduced harmful environmental effects, more flexible,user-friendly ridesharing service (often at less cost to the user than driving alone). Sacramento Rideshare’sOracle database implementation in mid-I994 has improved ridematching services considerably. Thedatabase now accommodates students with varying day-to-day schedules. Users can also request theirschedule to be “inactive”, then later updated, eliminating the need to purge and re-enter certain static userinformation. The system is user-friendly and flexible, allowing users to update their own records in somecases.
Demand Management and Operations
Obiective. The demand management and operations user service generates and communicates operational,management, and control strategies that will support and facilitate the implementation of programs,policies, and regulations designed to reduce the number of single occupant vehicles (SOV), affect modeshifts from SOV’s to HOV’s, and provide mobility options for those who wish to travel more efficiently, ata different time, or to a different location.
Area of Application. This service will be provided for all travelers in the Sacramento region.
Stakeholders Who Benefit. Users of this service are Travel Demand Management (TDM) programs,however all travelers benefit from their implementation.
Potential Benefit. Travel demand management has the potential to produce significant benefits in thefollowing areas: reduction of vehicle trips by 20 to 40 percent at employment locations; reduction ofcongestion by 5 to 10 percent along congested corridors; reduction of peak hour vehicle use ofapproximately 5 percent on area-wide basis, can be achieved through an aggressive TDM programsupported by ITS /24/ . TDM also can reduce the need for additional parking facilities, increase transitridership, and improve employee morale and productivity.
Final Report Sacramento ITS Early Deployment Pianning Study
-30-
Route Guidance
Objective. The route guidance user service provides travelers with instructions on turns and othermaneuvers to reach their destinations.
Area of Application. This service would be available to all travelers that choose to purchase an in-vehicledevice, or other personal portable or hand-held devices.
Stakeholders Who Benefit. Users of this service include drivers of private automobiles, High OccupancyVehicles (HOV) and van pools, commercial operators, and public transit drivers, especially for non-routespecific services such as paratransit and demand responsive transit.
Potential Benefit. The greatest benefit associated with route guidance is the reduction of navigationalwaste for both personal and business travel. Navigational waste includes excess vehicle miles of travel,time selecting a route, and time subsequently following the route. Systems with access to real-time trafficinformation can provide motorists with the least-congested route, further reducing travel time. Numerousstudies have been conducted to evaluate the benefits of in-vehicle route guidance devices/25,26,27,28,29,30/.. While results of these studies vary somewhat, with travel time reductions in the rangeof three to eleven percent, all indicate the potential for increased travel efftciency. Field studies performedduring the TravTek project in Orlando Florida showed that vehicles with an active TravTek deviceexperienced a decrease in travel time of 19% if the route is followed properly, a 20% decrease in traveltime if turns are missed (i.e., when turns are missed by both TravTek and the unequipped control vehicle)/31/. TravTek was also demonstrated to provide time savings in regaining the desired route, and decreasedthe probability of missing a given turn from 5.4% to 3.6%.
In addition to reducing overall travel time, personal stress can be reduced by not having to search forlandmarks or signs for routing directions.
Pre-Trip Travel Information
Objective. The pre-trip travel information user service provides travelers with information prior to theirdeparture and before a mode choice decision is made.
Area Of Applications. The only limits placed on this user service are based on the number of travelers withaccess to the information.
Stakeholders Who Benefit. Users of the service include all travelers, including commercial vehicleoperators, as well as providers who will develop and market pre-trip information services.
Potential Benefit. Potential benefits of pre-trip travel information have not been quantified. However, it isanticipated that pre-trip travel information services will result in more efficient use of congested corridorsby encouraging mode changes and changes in departure times and routes. Pre-trip travel information willalso enhance the efftciency and safety of recreational travel.
Surveys performed in Seattle and Boston indicate that providing travelers with pre-trip information results
Final Report Sacramento ITS Early Deployment Planning Study
-31-
in an even split between travelers who change route of travel and travelers who change time of travel. Anadditional five to ten percent change in travel mode was forecast based on the information /32/.
Commercial Vehicle Fleet Management
Objective. The commercial vehicle fleet management user service provides real-time communications forvehicle location, dispatching, and tracking to reduce delays resulting from congestion and incidents.
Area of Application. This service will be provided by private fleet operators choosing to invest in therequired equipment.
Stakeholders Who Benefit. Users of this service include commercial vehicle drivers, dispatchers, andintermodal transportation providers. .
Potential Benefit. The primary benefits of this service involve increases in economic productivity. FleetManagement techniques have the potential to enhance just-in-time deliveries, thus reducing costs to fleetoperators and transportation-dependent industries. Substantial secondary benefits could be realizedthrough commercial carrier routing to avoid congestion which may help reduce delay-related emissions andfuel waste. Commercial carrier mobility could be enhanced as travel times become more predictable. Inaddition, transport capacity could effectively increase as intermodal transport becomes a more effective .tool for moving commercial goods.
Productivity improvements reported by motor carriers (in a 1992 study) using advanced vehicle monitoringand communications technology provide an indication of the magnitude of benefits. For intercity irregular-route trucking, Telesat Canada estimates use of its system increased loaded mileage 9% to 16% andreduced operating costs from 12 to 20 cents per truck mile /33/. Schneider Co. of Green Bay, Wisconsinreported a 20% increase in loaded miles and the elimination of check calls saves approximately two hoursper day resulting in a driver salary increase of $.50 per week, but that the primary benefit is improvedcustomer service. Trans-Western Ltd. of Lemer, Colorado credited their system for improved driverrelations, noting that drivers are able to drive 50 to 100 additional miles per day, and driver turn-over hasdecreased from 100% to 30%. Frederick Transport of Dundas, Ontario, estimates an increase of 20% inloaded miles, a reduction of $30 from $150 per month in telephone charges, 0.7% greater load factor and9% increase in total miles. North American Van Lines of Fort Wayne, IN reports 16.9% additionalshipments, 5.7% fewer deadhead miles, 3.8% fewer cancellations and 24.5% expedited pickups anddeliveries. Best Line of Minneapolis, Minnesota estimates a $10,000 a month savings since 300 driverspreviously lost about 15 minutes each day waiting to talk with dispatchers. Mets of Indianapolis, Indianaperformed tests that showed vehicle utilization increased by 13%. In addition, United Van Lines ofFenton, Missouri claims that the ability to track and recover stolen vehicles is expected to reduce theftinsurance premiums.
Hazardous Materials Incident Response
Objective. The hazardous material incident response user service applies advanced technologies toenhance the safety of incident response procedures.
Final Report Sacramento ITS Early Deployment Planning Study
-32-
Area Of Application. This service will be provided on all transportation facilities in the Sacramento region.
Stakeholders Who Benefit. Users of this service include not only emergency response personnel, but alsothe general public.
Potential Benefit. To the consumer, the benefits of this service include improved traffic safety, reduceddelays, and decreased risk. The improved information would potentially reduce adverse impacts ofincidents such as: injuries, property damage, evacuations, traffic delays, and non-optimal emergencyresponse resources
Emergency Vehicle Management
Objective. The emergency vehicle management user service reduces incident response times by providingemergency response agencies with emergency vehicle fleet management, route guidance, and signalpriority. .
Area of Application. All emergency response agencies in the Sacramento region will have access to thisuser service.
Stakeholders Who Benefit. This user service has three primary users: law enforcement services,emergency medical services, and fue services. Accident victims and those in need of aid will benefit fromimproved emergency response times. Research has demonstrated that prompt, appropriate medical care isan important factor in reducing the severity of injuries received in a crash, and indeed the survival rate ofthose requiring resuscitation.
Potential Benefit. Emergency vehicle fleet management will assist service providers in managing theirfleets and assigning appropriate vehicles to emergency calls. Route guidance systems, already in use byEMS providers in some regions, assist response teams in locating crash sites, and transporting victims to amedical facility. EMS providers will also be able to take advantage of improvements in route guidance.Signal priority at intersections for EMS vehicles would provide additional protection for EMS vehiclescrossing intersections by providing warning to drivers on opposing routes.
Final Report . Sacramento ITS Early Deployment Pianning Study
-33-
VI. INVENTORY OF EXISTING AND PROGRAMMED ITSPROJECTS
The section provides a description of the ITS systems which are existing or already programmed (i.e.funded and scheduled for construction) in the region. These systems represent the steps taken to date inmeeting the user service needs of the area. To best illustrate how these past efforts fit into the overall ITSprogram needs, each existing or planned system is discussed relative to the user service it provides. Themapping of existing and planned elements to the overall program needs is the first step in defining adelivery scheme for the user services.
The delivery system development that will be described in the following section of this report willconcentrate on integrating the existing and programmed elements, broadening them to address the fullneeds of the user services they are only partially fulfilling, and adding the provisions for those user serviceswhich have not yet been addressed in the region.
Travel and Transportation Management
.Transportation Management Center (TMC). Caltrans District 3 and the California Highway Patrol (CHP)operate a TMC, located in the CHP Sacramento Communications Center. The TMC monitors CHP officercommunications, television media, call box calls, cellular 911 calls, Freeway Service Patrols and videocameras (Figure 1). The TMC is supported by a Computer Assisted Dispatch (CAD) system. The TMCalso has a small media center, where CI-IP staff prepares traffic reports for local broadcast media. TheCaltrans TMC Master Plan has designated Sacramento as one of three planned Regional TransportationManagement Centers (RTMC) in California. Caltrans submitted an application for TSM funding for theSacramento RTMC, and was allocated $7.98 million by the CTC.
The Caltrans/CHP TMC currently delivers the following ITS users services for segments of the StateHighway system:
. Incident Management through the surveillance, monitoring and dispatch functions which the TMCfills.
. En-Route Traveler Information through the messages communicated to drivers via the changeablemessage signs and highway advisory radio stations.
. Pre-Trip Traveler Information through the media interface and traffic reports produces on site.
. Traffic Control through the monitoring of traffic volumes and densities, and control of the rampmeters.
Traffic Operations Centers (TOC’s). TOC’s are similar in some respects the Caltrans/CHP TMC, in thatthey are centralized facilities for the management of primarily roadway transportation systems. TOC’sdiffer in that they focus on local surface streets, as opposed to the State Highway system for the TMC, and
Final Report Sacramento ITS Early Deployment Planning Study
-35-
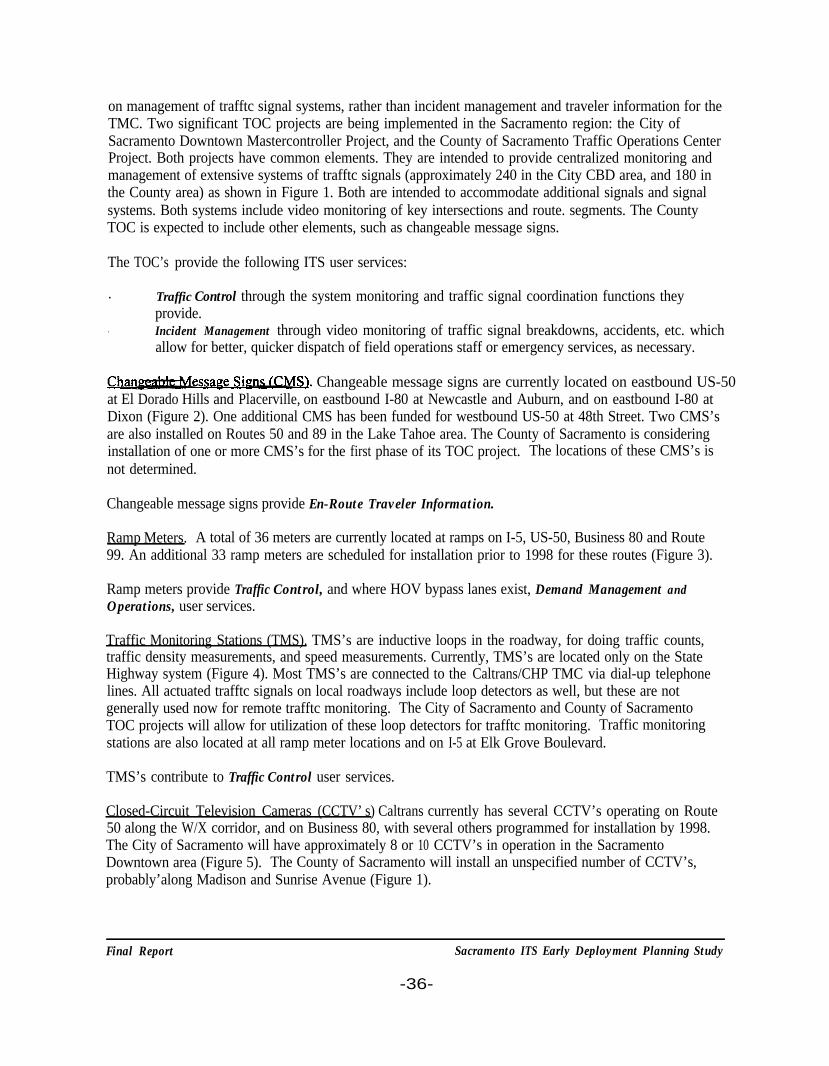
on management of trafftc signal systems, rather than incident management and traveler information for theTMC. Two significant TOC projects are being implemented in the Sacramento region: the City ofSacramento Downtown Mastercontroller Project, and the County of Sacramento Traffic Operations CenterProject. Both projects have common elements. They are intended to provide centralized monitoring andmanagement of extensive systems of trafftc signals (approximately 240 in the City CBD area, and 180 inthe County area) as shown in Figure 1. Both are intended to accommodate additional signals and signalsystems. Both systems include video monitoring of key intersections and route. segments. The CountyTOC is expected to include other elements, such as changeable message signs.
The TOC’s provide the following ITS user services:
. Traffic Control through the system monitoring and traffic signal coordination functions theyprovide.
. Incident Management through video monitoring of traffic signal breakdowns, accidents, etc. whichallow for better, quicker dispatch of field operations staff or emergency services, as necessary.
Changeable message signs are currently located on eastbound US-50at El Dorado Hills and Placerville, on eastbound I-80 at Newcastle and Auburn, and on eastbound I-80 atDixon (Figure 2). One additional CMS has been funded for westbound US-50 at 48th Street. Two CMS’sare also installed on Routes 50 and 89 in the Lake Tahoe area. The County of Sacramento is consideringinstallation of one or more CMS’s for the first phase of its TOC project. The locations of these CMS’s isnot determined.
Changeable message signs provide En-Route Traveler Information.
Ramp Meters. A total of 36 meters are currently located at ramps on I-5, US-50, Business 80 and Route99. An additional 33 ramp meters are scheduled for installation prior to 1998 for these routes (Figure 3).
Ramp meters provide Traffic Control, and where HOV bypass lanes exist, Demand Management andOperations, user services.
Traffic Monitoring Stations (TMS). TMS’s are inductive loops in the roadway, for doing traffic counts,traffic density measurements, and speed measurements. Currently, TMS’s are located only on the StateHighway system (Figure 4). Most TMS’s are connected to the Caltrans/CHP TMC via dial-up telephonelines. All actuated trafftc signals on local roadways include loop detectors as well, but these are notgenerally used now for remote trafftc monitoring. The City of Sacramento and County of SacramentoTOC projects will allow for utilization of these loop detectors for trafftc monitoring. Traffic monitoringstations are also located at all ramp meter locations and on I-5 at Elk Grove Boulevard.
TMS’s contribute to Traffic Control user services.
Closed-Circuit Television Cameras (CCTV’s) Caltrans currently has several CCTV’s operating on Route50 along the W/X corridor, and on Business 80, with several others programmed for installation by 1998.The City of Sacramento will have approximately 8 or 10 CCTV’s in operation in the SacramentoDowntown area (Figure 5). The County of Sacramento will install an unspecified number of CCTV’s,probably’along Madison and Sunrise Avenue (Figure 1).
Final Report Sacramento ITS Early Deployment Planning Study
-36-


Highway Advisory Radio (HAR). Highway advisory radios exist at four locations along US-50 betweenPlacerville and Lake Tahoe, one location on I-80 at Dixon, and at six locations on I-80 between Newcastleand Lake Tahoe. One additional HAR is programmed for installation on I-80 at Greenback Lane near thetruck scales (Figure 2). An additional HAR operates near Sacramento Metro Airport, broadcasting airportinformation. Caltrans and the airport are exploring alternatives for broadcast of travel information at thissite. Broadcast messages for the Caltrans HAR’s will be controlled from the Caltrans/CHP TMC.
HAR’s provide En-Route Traveler Information user services on limited segments of the State Highwaysystem.
Freeway Service Patrol (FSP). A total of ten tow trucks currently serve the urban portions of Business 80,US-50, and SR-99 (Figure 6). The FSP program may be expanded to include portions of i-5, and I-80from the Yolo Causeway County.
The FSP provides Incident Management user services. .
Traffic Signal Coordination. The City of Sacramento and County of Sacramento traffic signal coordinationsystems are discussed above, in the context of their TOC projects. The City of Roseville, County ofPlacer, City of Davis, and City of Woodland operate or have programmed closed loop systems on majorarterials.
Traffic signal coordination provides Traffic Control user services for affected roadways.
Air Quality Monitoring and Emissions Testing. The Sacramento Air Quality Management Districtoperates 10 air monitoring stations in Sacramento County. Data is downloaded on a daily basis, via phonelines, to a computer at the SMAQMD offices.. The Bureau of Automotive Repair conducted a pilot projectin 1994 to detect and quantify emissions from passing vehicles. Gross emitters were identified andcontacted.
Traveler Information Systems. The major fully operational traveler information system in the Sacramentoregion is the SmartTraveler Internet Site and the “1-800-COMMUTE” service.
The SmartTraveler Internet Site provides a single collecting point for various single-mode or singleoperator sources of traveler information: the Caltrans California Highway Information Network (CHIN);Sacramento Regional Transit route information; Amtrak information; and telephone numbers for variousother van, shuttle, and taxi services. The Internet Site also provides an on-line version of the SacramentoRideshare automated ridematching services.
The “1-800-COMMUTE” service is a telephone advisory system analogous to the SmartTraveler InternetSite. Instead of links to other on-line services, though, “1-800-COMMUTE” uses hook-flash transfers toother telephone advisory services in the Sacramento region.
These projects provide Pre-Trip Travel Information user services.
In addition to these projects, which are fully operational now, TransCal is a three-year federally sponsoredField Operational Test (FOT) that will deploy a comprehensive Interregional Traveler Information System(IRTIS) that integrates road, traffic, transit, weather, and value-added services information from sources
Final Report Sacramento ITS Early Deployment Planning Study
-45-
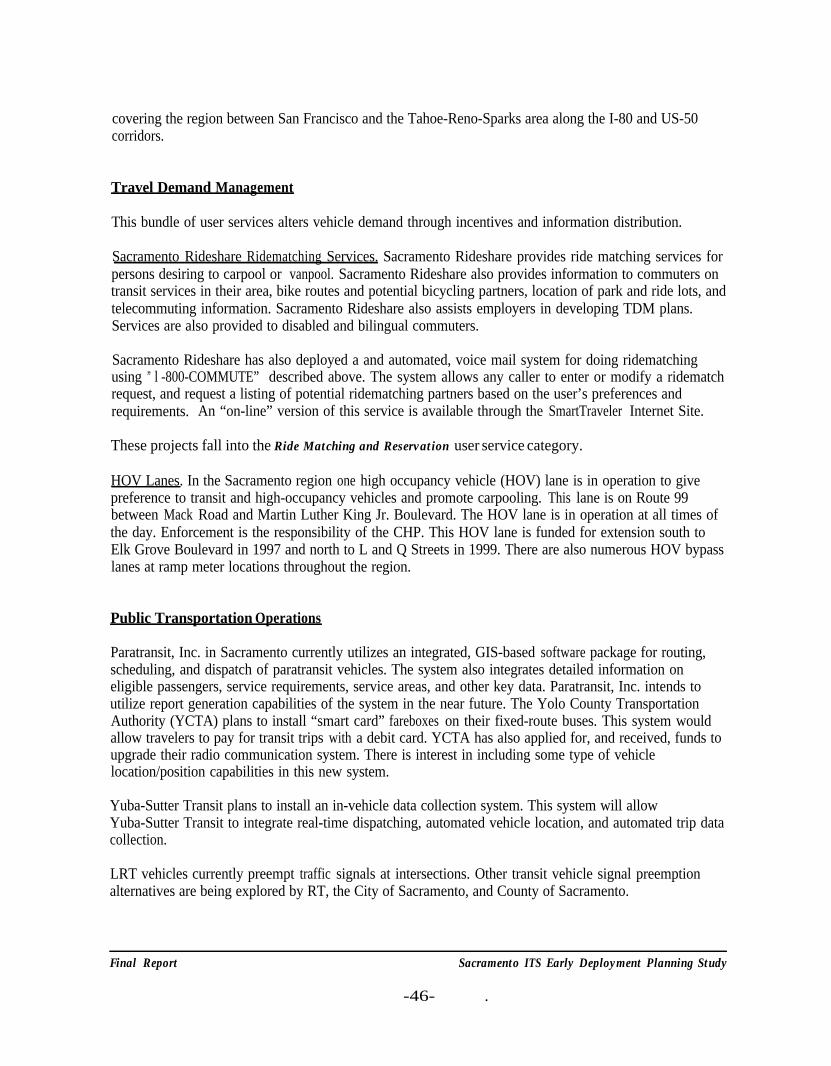
covering the region between San Francisco and the Tahoe-Reno-Sparks area along the I-80 and US-50corridors.
Travel Demand Management
This bundle of user services alters vehicle demand through incentives and information distribution.
Sacramento Rideshare Ridematching Services. Sacramento Rideshare provides ride matching services forpersons desiring to carpool or vanpool. Sacramento Rideshare also provides information to commuters ontransit services in their area, bike routes and potential bicycling partners, location of park and ride lots, andtelecommuting information. Sacramento Rideshare also assists employers in developing TDM plans.Services are also provided to disabled and bilingual commuters.
Sacramento Rideshare has also deployed a and automated, voice mail system for doing ridematchingusing ” l -800-COMMUTE” described above. The system allows any caller to enter or modify a ridematchrequest, and request a listing of potential ridematching partners based on the user’s preferences andrequirements. An “on-line” version of this service is available through the SmartTraveler Internet Site.
These projects fall into the Ride Matching and Reservation user service category.
HOV Lanes. In the Sacramento region one high occupancy vehicle (HOV) lane is in operation to givepreference to transit and high-occupancy vehicles and promote carpooling. This lane is on Route 99between Mack Road and Martin Luther King Jr. Boulevard. The HOV lane is in operation at all times ofthe day. Enforcement is the responsibility of the CHP. This HOV lane is funded for extension south toElk Grove Boulevard in 1997 and north to L and Q Streets in 1999. There are also numerous HOV bypasslanes at ramp meter locations throughout the region.
Public Transportation Operations
Paratransit, Inc. in Sacramento currently utilizes an integrated, GIS-based software package for routing,scheduling, and dispatch of paratransit vehicles. The system also integrates detailed information oneligible passengers, service requirements, service areas, and other key data. Paratransit, Inc. intends toutilize report generation capabilities of the system in the near future. The Yolo County TransportationAuthority (YCTA) plans to install “smart card” fareboxes on their fixed-route buses. This system wouldallow travelers to pay for transit trips with a debit card. YCTA has also applied for, and received, funds toupgrade their radio communication system. There is interest in including some type of vehiclelocation/position capabilities in this new system.
Yuba-Sutter Transit plans to install an in-vehicle data collection system. This system will allowYuba-Sutter Transit to integrate real-time dispatching, automated vehicle location, and automated trip datacollection.
LRT vehicles currently preempt traffic signals at intersections. Other transit vehicle signal preemptionalternatives are being explored by RT, the City of Sacramento, and County of Sacramento.
Final Report Sacramento ITS Early Deployment Planning Study
-46- .


Commercial Vehicle Operations
Fleet Dispatch. Many private trucking drivers have constant radio communication with dispatchers andcan report, or be notified of, congestion or adverse conditions.
Mayday. Many private companies also operate in-vehicle radios that are equipped with “mayday” typedevices to use in case of hijacking or other problems requiring driver aid.
Commercial Vehicle Electronic Clearance. The HELP, Inc. (Heavy Vehicle Electronic License Plate)system will equip participating vehicles with an automatic vehicle identification (AVI) transponder. Atdesignated “pre-pass” sites the truck will be weighed and classified. If the information matches theinformation in the database, the driver will be notified to continue without stopping at the approachinginspection station. Pre-pass sites along Interstate 5 in California are currently operating at DunsmuirGrade, Cottonwood, Santa Nella, Grapevine, Castaic, and San Onofre. Additional sites are to be deployedalong Interstate 80, including Cordelia in 1997, and Antelope and Donner Pass in 1998/1999.
Weigh-In-Motion. Weigh-In-Motion sites are currently located in the east and west bound lanes of I-80 atAntelope, in the southbound lanes of I-5 at Del Paso, on Route 49 near Auburn, and in the westboundlanes of US 50 in West Sacramento.
Emergency Management
Motorist Aid Call Boxes. Approximately 700 solar-powered, cellular call boxes are located at one-half-to-one-mile intervals on all state routes and interstates in Sacramento, Yolo, and Yuba counties (Figure 6).Call boxes are linked directly to a California Highway Patrol dispatcher who will send necessary aid. It isanticipated that call boxes will be installed on highways in Sutter County during Summer 1996. Thecommunications capability within these call boxes will support traffic census stations, fog detectors, andCMS’s.
Emergency Vehicle Traffic Signal Preemption. Many jurisdictions have installed emergency vehicletraffic signal preemption equipment. In most cases, emitters have been installed in fire departmentvehicles.
Advanced Vehicle Control and Safety Systems
These systems are being developed by the private sector and offered directly to consumers. Examplesinclude anti-lock braking systems and air bag restraint systems. Additionally, the Greyhound company hasimplemented a longitudinal collision avoidance system on many of their buses.
Sutter County plans to equip county fire trucks with infrared locators that can be used in collisionavoidance and in locating crash victims during inclement weather.
Final Report Sacramento ITS Early Deployment Planning Study
-51-
VII.. OPTIONS FOR DELIVER OF ITS USERS SERVICES
This section of the report describes the development of a delivery system or “system architecture” for theuser services that can meet the requirements for the user services. Existing and programmed projects inthe region have been used as one reference point in development of a recommended user services deliverysystem. However, the user service delivery system must not be based on specific projects or technologies,since these change and evolve quickly. The major reference points in development of the recommendeduser services delivery system are the stated desires of the EDPS participants, and the functionalrequirements for delivering users services as defined in national ITS standards reports /34,35/.
The reader is referred to “Project Summaries and Technology Assessment” for complete documentationof the technology assessment /36/.. This document details technologies available at the time of writing.Again, these technologies change very rapidly.
The Concept of a User Service Delivery System or “System Architecture”
The user service delivery system or “system architecture” should not be confused with a technical designor specification. “User service delivery system” or “system architecture” can be defined by analogy to acommon household item which exhibits good, flexible system architecture: home stereo equipment.Home stereos are made up of several basic components, with standard functions and relationships to othercomponents (amplifiers, tuners, CD players, cassette decks, record players, speakers, etc). As anyone whohas visited a stereo dealer well knows, the range of quality, features, and price is mind-boggling, offeringthe consumer an almost infinite number of choices for systems within a given price range. However, aconsumer can purchase components from different manufacturers with relatively little fear that thecomponents will not function together, as long as the system purchased includes the basic functionalcomponents. Additionally, even consumers with limited knowledge of electronics can successfully set up afunctional system with little or no difficulty.. The agreements regarding basic system components, therelationships between the components, and the standards which govern the interconnection of componentsconstitutes the “system architecture” for home stereo equipment.
Within the ITS, there are multiple layers of system architectures. In this context, architecture refers to theorganization or structure of a series of components or elements. The organization of ITS elements can beexamined at several levels, including:
. . Individual system elements (e.g. a loop detector in a roadway, a traffic signal controller, or a GPSreceiver in a vehicle)
. Subsystems (assemblages of system elements to perform basic ITS functions such as 2-waycommunications)
. Systems (assemblages of subsystems, e.g. a system of coordinated traffic signals, or a video ..surveillance system on a transit vehicle)
. Regional (Linkages between systems to expand areas of benefit to all travelers)
. National (Standards for system components and common elements of regional architectures)
Final Report Sacramento ITS Early Deployment Planning Study
-53-
The regional level is the focus of this project.
The development of a user services delivery system for the Sacramento area followed a structured processstarting with problem definition, proceeding through a definition of requirements, and identifying therequired ITS functions to be provided within individual systems and regional elements of the system.Once the ITS functions and inter-system data flows were defined, the characteristics of alternative deliverysystems were described. As presented, the alternatives were intended to stimulate local discussionconcerning which configuration was best suited to the requirements of each user service. The outcome ofthis section was a “Candidate User Service Delivery System” which can be described in both technical andinstitutional terms.
On the national level, the U.S. Department of Transportation has initiated the development of a NationalITS system architecture that will describe how ITS components interact and work together. During thefirst phase, completed in early 1995, four teams led by Hughes Aircraft, Westinghouse Electric, RockwellInternational, and Local Federal Systems, examined four alternative approaches to a national architecture.Two teams, led by Rockwell International and Loral Federal Systems, emerged from this process tocooperatively develop a consensus National ITS Architecture that will be completed 1996.
Need for a Coordinated User Services Deliverv Svstem
The method by which each user service can be delivered is described by a high level flow chart describingwhat the system does, and what functions are required to do it. (The actual flow charts are included inAppendix D.) The selection of the delivery system is driven by user service requirements and how they areallocated to subsystems. If the delivery system is not properly organized, agencies will be unable to sharedata, or cooperate in carrying out a process which requires field devices to interact across jurisdictionalrights of way.
The delivery system also implies agency responsibilities for the development and provision of each userservice function. Without such a structured approach, individual agencies are destined to redundantlydevelop systems which provide overlapping functions.
It should be noted that the user services delivery system is a tool which facilitates implementation. It is ameans to an end, but not the end itself. There will be considerable flexibility afforded to local agencieswithin this architecture. One way in which this flexibility will be “built in” is by employing a modularapproach.
A modular design allows system elements to evolve with advances in technology, and allows the programto be developed in stages. In so doing, the individual components of the program can be built to plateausdefined by the current level of proven technology. Staged implementation allows individual agencies andthe region as a whole to match incremental implementation needs or upgrades with funding opportunitiesas they present themselves. It is unlikely that a single funding source will fund the implementation of theentire program, or even one agency’s involvement in the program. Therefore, it is important for theprogram to be developed in such a way that it can be implemented in logical pieces that are technologicallysound. The modular delivery scheme is what allows this to happen.
Final Report Sacramento ITS Early Deployment Planning Study
- 54 -

The development of an organized delivery system can be relatively complex in that it deals with very highlevel administrative and ownership issues and very detailed technical issues. As a result, there is greatpotential to become caught up in various analyses and debates along the way and lose sight of the needs orobjective of the function under discussion. In order to structure this process, a framework was establishedwhich would enable each element of the program to be traced to a goal, objective or guiding principle.Figure 7 indicates that the user services and guiding principles are the key inputs to the process. Theguiding principles are the ground rules that were applied when making trade-off decisions during thisprocess. The user services themselves have been defined in earlier sections of this document.
With the user services and guiding principles as background, a conceptual organization or structure isestablished. The concept identifies the elements (agencies, travelers, vehicles, etc.) that must be addressed,and indicates what type of information or data needs to flow between each element. This task is initiallycarried out without regard to the physical locations of such elements, or the frequency in which suchinformation must be passed. The structure is easily presented in graphical form, and provides a basis fordiscussion among potential system operators.
Once a general structure has been established, the functions, or requirements for the user services can beexplored in technical detail. The appropriate functions are mapped to the agencies responsible for deliveryof a given service. With the functions defined for a given agency, technology assessments can beconducted for specific applications. A generalized view of the technology assessment process is presentedat the end of this chapter.
. .
Guiding Principles
The development of a user service delivery system can be a very complex process. The process is complexbecause it deals with a wide variety of broad institutional issues and detailed technical issues thatinherently involve many people. Definition of a structure which will be the framework for short-term andlong-term deployment requires individual agencies, departments within single agencies, and the region as awhole to make certain commitments which have potential implications for their organizational structureand operating procedures. In many cases, these commitments will require changes, which do not comeabout easily.
The guiding principles listed below were developed to guide the architectural development by establishingground rules for the process. Generally, the principles are intended to ease concerns about the autonomyof local agencies, potential requirements that would limit operational flexibility, and the nature ofcommitments being made in this process. These principles are objective statements describingcharacteristics that will be exhibited in the Sacramento area’s ITS structure:
. Expandability - The user services delivery system must be open, modular, adaptable, andexpandable. As other agencies, system operators, and private sector companies develop ITSfunctional capabilities, and choose to participate in ITS implementation, the basic framework foruser services delivery should be flexible enough to accommodate them.
. Interagency Coordination - Coordination starts with communications, and the ability to share acommon set of information regarding system performance. With this information as a basis, andwith tools necessary for implementation of coordinated operational strategies, agencies and system
Final Report Sacramento ITS Early Deployment Planning Study
-55-
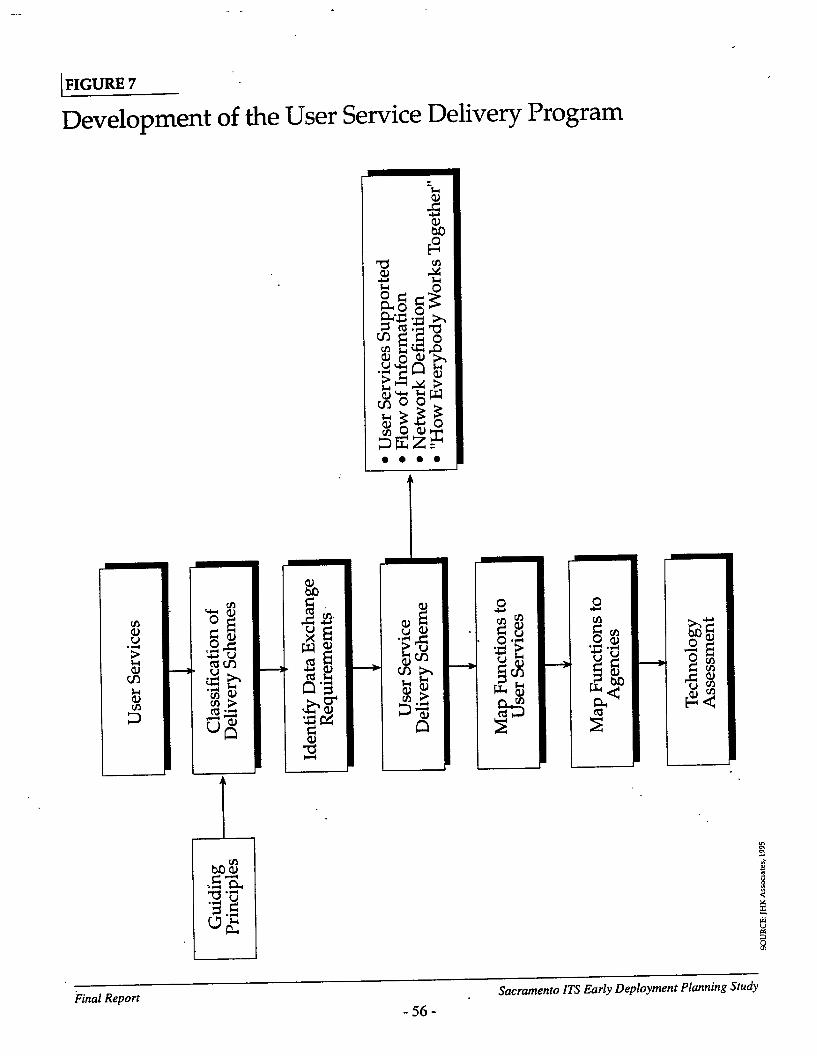

operators can provide better system performance and user services to the traveling public. Theuser services delivery system must include adequate data exchange to support interagencycoordination efforts.
. Common Interfaces - Data exchange is achieved via common standards and interfaces. Commonstandards allow interoperable systems to be developed by independent parties.
. Build on Existing and Near-Term Technologies - To the extent that the ultimate goal of the EDPSis a framework for “early deployment”, short range project concepts included in the user servicesdelivery system should be based on currently available technologies.
. Build on Existing Initiatives - The user services delivery system must take advantage of existinginfrastructure, and build on these initiative where possible.
User Service Delivery Options
There are two basic ways to deliver any individual user service, or all services in the ITS program:Delivery of each user service can be approached by individual agencies acting alone, (autonomousdelivery), or groups of two or more agencies in collaboration (collaborative delivery). Seldom is onemethod used for all user services. Some are best delivered autonomously, others in collaboration.
In considering the alternative configurations presented here, it should be understood that the Sacramentoarea’s ITS program will include some services which will be delivered by individual agencies actingautonomously, and some services which will be delivered by multiple agencies acting collaboratively.
Characteristics of Collaborative Delivery. Services which are delivered on a collaborative, wide-area basishave several distinguishing characteristics. The more significant characteristics can be summarized asfollows:
. Oversight of implementation and operational procedures provided by single body with multi-jurisdictional representation - Through the collaborative efforts of multiple agencies from theregion, a single body takes responsibility for the delivery of the service throughout the entireregion.
Note: the “single body” is normally a multi-agency partnership, governed by an agreement whichoutlines areas of collaboration. In no case in this report should collaboration be taken to imply lossof a specific agency’s control over the operations of systems in its jurisdiction.
. Uniform approach to system development in all jurisdictions and sub-regions - With thisapproach, the technologies and strategies for delivering a given user service are consistent amongall participating agencies and system operators. Operational procedures and specific hardwareneed not be identical, but rather, may be based on compatible hardware and software systems. Thegoal is to provide user services in ways that appear “seamless” (i.e. without major noticeablechanges at jurisdiction or service area boundaries) to travelers.
Final Report Sacramento ITS Early Deployment Planning Study
-57-
. Single source responsible for data collection, analysis, and control functions - A single task-force representing the agencies of the region, and governed by a common agreement amongparticipating agencies and system operators, carries out all technical tasks, including datacollection, analysis, control, and distribution.
. Economy of design and scale - Because a single, multi-agency entity is responsible, and thetechnologies and systems are compatible among participating agencies and system operators, thisconfiguration naturally benefits from economies of design and scale. Such benefits are realized incapital costs, as well as in maintenance and operations.
Characteristics of Autonomous Delivery Systems. In a purely autonomous approach, each individualagency would be responsible for delivering all user services within their respective jurisdictions. Thecharacteristics of this configuration can be summarized as follows:
. Individual agencies operate autonomously establishing agency-specific implementation prioritiesand operationalprocedures - Because individual agencies maintain complete responsibility for alldesign, program development, and operational decisions, they maintain complete autonomy. Assuch, they are unaffected by, and have no influence over decisions made by agencies in adjacentjurisdictions, and can tailor the system to meet unique needs within their service areas.
. Individual systems provide data gathering, analysis and control functions within jurisdictionboundaries - Each agency operates its own system which gathers the data, and performs theanalyses needed to support the mission of the given agency. Exchange of data with other agenciesor system operators is done on an “as needed” basis, within the constraints of the data collection,formatting, and distribution systems available.
. Each agency develops individual agreements/linkages to other agencies when they need/want tointeract - In instances where agencies identify the need to coordinate operations or shareinformation with another agency, the two agencies form a relationship for that purpose. A separaterelationship, be it a formal Memorandum of Understanding or a simple informal request forinformation, occurs with each other agency on an individual basis. There is no necessaryrequirement for consistency of these agreements among different agencies.
“Combined” Delivery Systems. In some ways, the “autonomous” and “collaborative” system definitionscan be looked at as ends of a continuum. In practice, no delivery system is fully autonomous norcollaborative for all user services. Some user services are delivered more autonomously, and others morecollaboratively. Additionally, the level of collaboration for a given user service can be tailored to the needsof the participating agencies and system operators. For example, all data gathering and informationsharing functions could be collaboratively provided, with actual management control provided on anautonomous basis.The characteristics of "combined” configurations can be summarized as follows:
. Individual agencies provide data gathering, analysis and control functions - Systems designed,constructed and operated by individual agencies are responsible for collecting data andinformation from within their own jurisdictions. Oftentimes, the individual agency will then alsobe responsible for analysis of that data and oversight of those systems which provide traffic control
Final Report Sacramento ITS Early DepIoyment Planning Study
-58-
in their jurisdiction.
. Agencies are linked to central distribution mechanism for automated data exchange - The dataand information gathered within the individual agency systems is distributed to a central database,where it is available for access by other agencies, the general public, or value added private sectorentities.
. Centralized management of services/functions that make sense. It was noted earlier that theoverall ITS delivery system for the Sacramento area will include autonomous and collaborativedelivery systems. The challenge in developing the overall relationships is to identify thoseServices which best serve area stakeholders, and are most efficient, when they are delivered andmanaged collaboratively.
Shown on Figure 8 is a concept delivery system for the Sacramento region, which is a “combined” deliverysystem. The diagram includes five high level “networks”, indicated by the boxes. The networks are of twobasic types: “operator” and “user” networks.
(Note: the term “network” is used, because these basic system components are likely to be built oncommunications and computer networks among the participating agencies and system operators. However,it is not meant to suggest that each “network” shown in the diagram translates to one discrete project.Rather, a collection of projects which are functionally related and build toward the system shown must beundertaken by the participants in each network.)
.
.
Operator Networks are designed to provide system operators with management and control tools,to allow them to monitor and improve the performance of the systems they control. An importantpart of this is the ability to share information about system boundaries (e.g. a “gap” between twocoordinated traffic signal systems, or a transit stop where transfer between two transit systems ispossible). In addition to providing tools for the operators, operator networks create new sources ofreal time information which may be of great interest to travelers, and to private sector companieswhich provide information and services to travelers. The key operator networks shown in the flowchart are an Urban Area Network, a Regional Network, a Sierra Foothills network, and a TransitAgencies Network. At this stage these networks are very generalized and “high level”. Moredetail will be provided later in the report.
User Networks are intended to provide information and services to travelers, either directly or via“value added resellers” (VAR’s). VAR’s are generally private companies which provide travelerinformation and services to the general public. Some examples of VAR’s: traffic reportingcompanies, which provide traffic reports to local broadcast media; auto clubs, which provide travelinformation, insurance, etc. to members; and “on-line” vendors, which provide travel. informationto the public, along with commercial travel information (such as tourist destinations andattractions). The range and type of VAR’s specializing in traveler information, services, andproducts is expanding rapidly. The key “user network” shown is a Regional Traveler InformationDatabase. One function of this network is to provide some basic roadway and transit informationdirectly to the public, similar to the SmartTraveler Internet Site and similar systems now beingdeveloped in many regions around the country. Another function will be to provide formattedtravel data to VAR’s, for secondary distribution to travelers.
Final Report Sacramento ITS Early Deployment Planning Study
-59-

Individual agencies maintain autonomy for control functions with their jurisdictions, but data andinformation of interest to others is exported to some form of collaborative distribution mechanism. Thesedata may include real-time parameters, or historical information that is logged within the individualagencies and passed to the collaborative system on a regular interval. It is important to note that even witha centralized information source shown in the diagram, agencies participating in each network stillmaintain capabilities of providing information directly to users (e.g. Caltrans messages broadcast to driversvia changeable message signs and highway advisory radio stations, Sacramento Regional Transit CustomerServices delivered via their own telephone advisory system, etc.).
The remainder of this report section will provide additional detail to the very generic, high-level flow chartshown in Figure 8.
Interagency Data Flows
The conceptual view of collaborative and autonomous delivery systems can be considered in theSacramento area’s context by examining Figure 8. Information on traffic volumes, levels of congestion,and travel options are provided on a regional basis through a central location (the Traveler InformationDatabase). Traffic control functions and operation of transit systems are retained at the local level withmultiple agencies providing these services.
The next step in the development of the system is to consider the needs of individual agencies. Individualagencies have needs related to delivering their local services and will also be required to provideinformation to agencies or systems responsible for collaborative delivery of services.
Interviews and meetings were held with local agencies to identify types and sources of information thatwould be helpful to them in carrying out their missions. At the same time, consideration was given to theneeds of a regional traveler information database.
The matrices shown in Tables 2 to 4 identity the information/data needs of the various agencies, and thedesired sources of that information. The large number of agencies involved prevented the use of a singlematrix to describe the information/data needs and sources for all the agencies. In order to facilitate thedefinition of the agency-to-agency relationships, the region was divided into three subgroups: Foothillsand North Counties (Table 2); Sacramento Urban Area (Table 3);and Transit Providers (Table 4).
The division into three sub-groups is not meant to imply that there would be separate systems or that thesesubgroups would be independent. This organization also does not mean that agencies shown in one matrixwill be unable to exchange data or information with an agency listed in a different subarea. To embellishthis point, several agencies/entities are shown in each of the subareas. These agencies/entities includeCaltrans, CHP, local police and fue services, and the Traveler Information Database. The Traveler .Information Database was included in the matrices to facilitate identification of information these agenciescould provide to the database. .
The agencies grouped in the Foothills and North Counties area include Placer County agencies, El DoradoCounty agencies, Folsom, Sutter County, Yuba County, Marysville, and Yuba City. For the purposes ofthis matrix, transit providers are grouped into a single category. This simplifying consolidation was madesince no single transit agency had unique information requirements for itself, nor was any transit service
Final Report . Sacramento ITS Early Deployment Planning Study
-61- . .
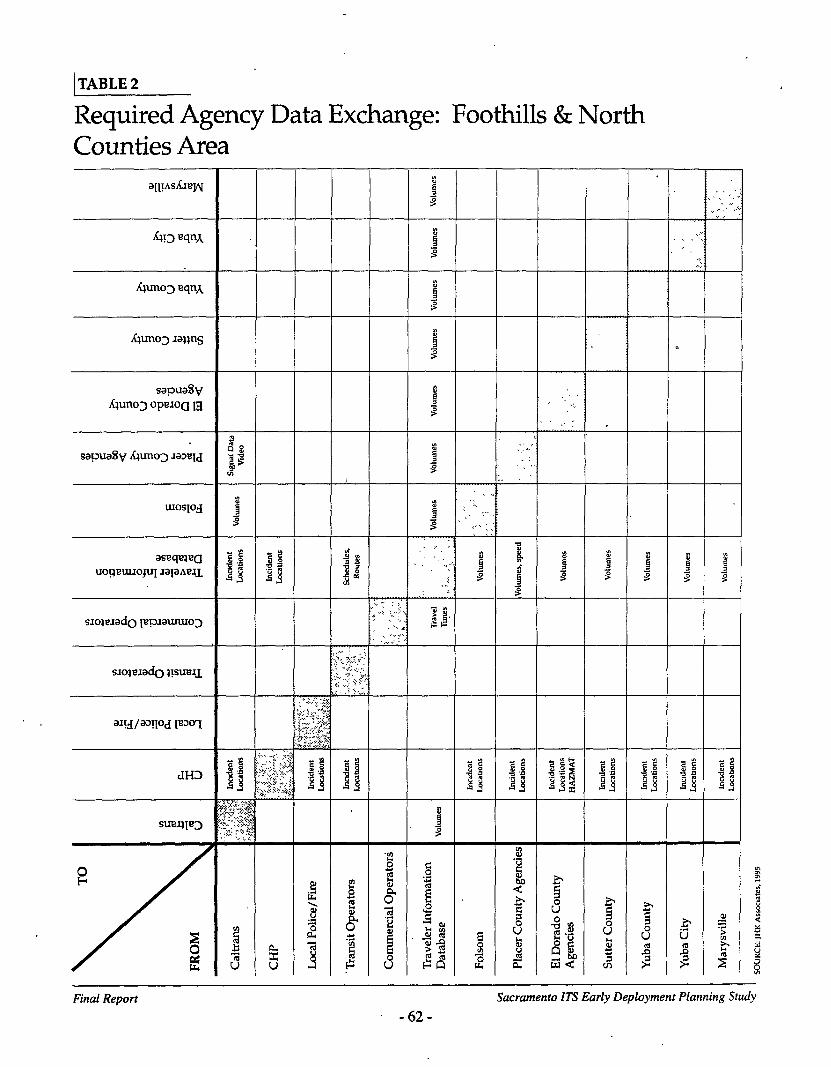


provider in this sub-region identified by another agency as being a unique source of information.
The primary types of information being exchanged include traffic volumes, speeds, and incident locations,as well as road closure information. The traffic volumes will be organized within the traveler informationdatabase, where it can be drawn upon to assist in decision support for area planning and congestionmanagement agencies. Speed data can be used by the traveler information database to calculate traveltimes that will be used in user services such as Pre-Trip Travel Information and Route Guidance.
The agencies grouped into the Urban Area category include Regional Transit, Sacramento Rideshare,Sacramento County, Yolo County, the City of Sacramento, Davis, Woodland, the City of WestSacramento, and SMAQMD.
The information exchanged among urban area agencies will go beyond historical volumes and real-timespeed data. Additional requirements include access‘to freeway and surface street video, and real-timequeuing information at freeway ramps.
.The transit providers indicated i n the matrix were invited to a meeting to discuss data exchange needsspecific to their missions. This meeting revealed that the primary area of interest lies in schedulecoordination.
The Yolo County Transit Authority is also interested in exchanging signal pre-emption data with signal controllers in West Sacramento to give signal priority to approaching buses.
Candidate User Services Delivery System
Based on the information yielded through the agency data requirements, it was possible to refine the flowchart shown in Figure 8, to show all of the required data flows and more detail on the key networksincluded. The results of this refinement is the “Candidate User Services Delivery System”, shown inFigure 9. A series of arrows are shown between various agencies and groups of agencies. These arrowsrepresent data or information that must be exchanged in order for:
. collaborative services to be provided
. local agencies to improve the quality of their services at jurisdiction boundaries
. the traveling public and private sector to have a single point of access for information they need orwant.
The information flows can be refined as indicated in this graphic to illustrate the nature of the communication between networks and agencies. Data in the various databases will be continuouslyavailable to users. However, the update frequency for the stored data will vary with each type of data.Data that rarely changes (updated no more often than once a month) is considered “static”, more frequentlyupdated data is defined as “periodic”, and data that is constantly being updated (updated at least once perminute) is called “real-tune.”
Examples of “static” data include the configuration of the freeway and light rail systems. “Periodic” dataincludes updates to transit schedules and locations of construction zones. “Real-time” requirementsinclude coordinated traffic signal operation, where cycle timing parameters are exchanged.
Final Report Sacramento ITS Early Deployment Planning Study
-65-

The frequency of data updates does not imply that “real-time” data is fresher, or somehow better, than lessfrequently updated data. Instead, the distinction is made to correspond with the user’s update requirements.The update interval is critical to the database designer because it drives the type of technology that will beselected to process the data.
Individual components of the “Candidate User Service Delivery System” are shown in greater detail inFigures 10 to 14, and discussed below. (Note: The parenthetical acronyms in the upper portion of eachbox are network designations that are referenced on later diagrams).
Urban Network (Figure 10). The urban area would be served through a computer and communicationsnetwork that facilitates efficient, coordinated operations among all the participating agencies and systemoperators. Signal timing parameters would be exchanged between the City and County to reduce delay attheir mutual boundaries. Real-time video and ramp meter queue data would be exchanged betweenCaltrans and the City and County to reduce delay at surface street/freeway connections. Regional Transit’slight rail system could provide signal pre-emption data to the City and County through this network. Thesignal pre-emption data may be used by the City and County to modify signal timing in response to trainmovements in order to reduce delay caused by trains as they travel through the signal network. Thenetwork would also provide link condition and incident location information to the Traveler InformationDatabase to encourage travelers to avoid congestion and plan fewer vehicle trips.
Regional Network (Figure 11). This network is assumed to be centered in the Caltrans/CHP TMC. TheTMC can exchange data with the other sub-regional networks to reduce delay and improve air quality.This network would provide the most important communications links to furnish current and reliableinformation on State Highway system route conditions and incidents to the en-route driver and the TravelerInformation Database. Various air quality agencies could monitor emissions levels at certain “hot spots”and background ambient air quality levels in the region. The monitoring system would be linked withtraffic control system operators via this network to convey notifications that air quality thresholds havebeen exceeded. The Regional Network may also provide communications infrastructure to servecommercial vehicle fleet operations, if desired.
Ramp metering systems, en-route traveler information systems, and the Traveler Information Database canalso utilize the communications links of this network to orchestrate a regional demand management andoperations strategy to reduce or spread demand at critical locations in the roadway network.
El Dorado County Transportation Commission and Placer County Transportation Planning Agency ITSPrograms (Figure 12). The planning process for this study has been open to any agency interested inparticipating. Several agencies in El Dorado and Placer Counties have elected to participate in the variousworkshops, meetings, and document review as part of this study, and the “Candidate User Service DeliverySystem” reflects the input of these agencies. However, in both El Dorado and Placer Counties, theRegional Transportation Planning Agencies (RTPAs) have initiated separate ITS oriented planninginitiatives. One key initiative that these agencies are jointly pursuing is a traveler information system,which is intended to be fully operational by the time of the Gold Rush Sesquicentennial Celebrationevents.
The expectation is that the input from agencies in both counties through this study would provide somebuilding blocks for their independent ITS planning efforts. Their ITS planning initiatives would need to
Final Report Sacramento ITS Early Deployment Planning Study
-66- . ,

FIGURE 9
Candidate Delivery System
Final Report Sacramento ITS Early Deployment Planning Study- 67-


be coordinated if exchange of data is desired with the other systems which deliver regional, transit, andpublic information services to the surrounding region.
Study participants from both counties expressed interest in providing tourist information, link conditions,. and incident locations to travelers in the region.
Placer County participants indicated an interest in exchanging signal timing parameters between Caltrans,Placer County, and the Cities of Roseville and Rocklin to reduce delay at signalized intersections in theregion.
Transit Network (Figure 13). The transit providers network would provide communications infrastructureto receive ride requests and information queries from the Traveler Information Database, and, in turn, sendride confirmations and coordinated schedule information back to the traveler. Ride requests for carpools,Vanpools, taxicabs, and other demand responsive transit providers would be processed through thisnetwork. The network would also enable individual providers to electronically access schedule and routeinformation of other trip providers in the region. The network would provide a communications linkbetween Yolo County Transit Authority and the City of West Sacramento to provide transit preferentialsignal pre-emption. Transit vehicle incident information would be provided to CHP via this network.Also, Sacramento Regional Transit indicated a desire to support transit trip planning services for theirCustomer Services Center, and possibly for an on-line transit services web-site.
. . Traveler Information Database (Figure 14). The Traveler Information Database would be the single point .of access for some travelers, transportation agency staff, and commercial fleet operators as they seekinformation on travel data or conditions. The “user” who is interested in pre-trip traveler informationwould be able to access link conditions and incident reports from the Region-Wide, Urban Area, andFoothills Networks through one interface. The “user” who is considering a trip by transit would be able tosend ride requests to the Transit Network and receive schedule information in return.
The Traveler Information Database would be developed incrementally. During the various stages of itsdevelopment, existing sources of traveler information would invariably continue to function. For example,the transit providers would continue to operate their telephone based information service redundantly untilthere is a clear indication that transit patrons can be served as well or better by the Traveler InformationDatabase. While the database could ultimately be the most complete and reliable source of travelinformation from various sources, the gradual implementation of the database would require a transitionalperiod when existing agency interfaces would remain until they are no longer needed.
The SmartTraveler Internet Site and 1-800-COMMUTE projects represents an initial step towards the development of the Traveler Information Database shown. The main feature of the project is a real-timeridematching service for commuters. The system also provides a telephone transfer referral to the CaltransHighway Information Network (CHIN), rail service providers, and local transit providers. Statictelecommute information is also provided to those who live or work in Placer or Nevada Counties.
Final Report Sacramento ITS Early Deployment Planning Study
-72-


The delivery system just illustrated described technical relationships between agencies. Thoserelationships are needed to permit multiple agencies to cooperatively improve the quality of serviceprovided to inter-jurisdictional travelers, and to improve the quality of service being delivered byindividual agencies.
Autonomous and Collaborative Delivery. The matrix shown in Table 5 illustrates how the specific userservices are delivered within individual agencies. The letter “A” indicates that the agency listed providesthe service autonomously within their jurisdictional boundaries. The letter “C” indicates that the service isdelivered to the region through collaboration between multiple agencies. Services delivered throughcollaboration require a listed agency to cooperate (administratively and/or technically) with other agencies,to ensure that the service provided meets the needs of the travelers they intend to serve. This “clientsatisfaction” is only achieved by providing a consistently high quality of service throughout the region.
User Service Requirements
The next step in developing the ITS program is to define the specific requirements or features that will beprovided by each service. These requirements or functions will lead to identification of the technologiesthat will be used in carrying out the services. Functional requirements for user services are reported indetail in U.S. Department of Transportation (US DOT) publications /34,35/.
Functional Areas. The requirements for each user service are met in technical terms by a number of“functions”. The US DOT National Program -Plan identifies 17 “functional areas” which can beconsidered as sub-components of the overall ITS system. “Functional areas” are basically groupings oftechnologies, which are intended to accomplish particular required functions in support of user services. Inthis way, the technical requirements for each user services can be determined, without specifying a specifictechnology or product. This allows for flexibility to adjust to new technologies and products as theyevolve, without losing site of the essential function which is required to deliver a user service. SeeAppendix D for an excerpt from the US DOT National Program Plan.
These functions must be reflected within the Sacramento area’s ITS projects in order for the ITS system tobe effective in addressing the problems identified previously.
Following is a brief description of each functional area, with examples of the types of technologies thatwould fall under the given area.
. Traffic Surveillance - Technologies that collect information about the status of the traffic stream.Possible technologies include loop detectors, infrared sensors, radar and microwave sensors,
. machine vision, aerial surveillance, closed circuit television, acoustic, in-pavement magnetic, andvehicle probes.
. Vehicle Surveillance - Technologies that collect a variety of information about specific vehicles.These technologies include weigh-in-motion devices, vehicle identification, vehicle classification,and vehicle location.
. Inter-Agency Coordination - Technologies that connect travel-related facilities to other agenciessuch as police, emergency services providers, weather forecasters and observers, and among
Final Report Sacramento ITS Early Deployment Planning Study
-75-

Traffic Management Centers (TMC), transit operators, etc.
. 1- Way Mobile Communications - Any communication technology that transmits information topotentially mobile reception sites but cannot receive information back from those sites. Possibletechnologies providing this function include Highway Advisory Radio, FM subcarrier, spreadspectrum, microwave, infrared, commercial broadcasts, and infrared or microwave beacons.
. 2-Way Mobile Communications - Any communication technology that transmits information topotentially mobile reception sites and allows receipt of information from those same sites.Possible technologies include cellular telephones, 2-way radio, spread spectrum, microwave,infrared, and 2-way satellite.
0 Stationary Communications - Any communication technology that connects stationary sites.Technologies include fiber optics, microwave, radio, land lines.
.. Individual Traveler Interface - Devices that provide information flow to a specific traveler.
Technologies meeting this function include touch screens, keypads, graphics displays andcomputer voices at kiosks; keypads, computer voice, and head-up displays in vehicles; personalcommunications devices carried with the traveler; and audiotex from any phone.
. Payment Systems - Technologies that enable electronic fund transfer between the traveler and theservice provider. The technology areas include Automated Vehicle Identification (AVI), smartcards, and electronic funds management systems.
. Variable Message Displays ,- Technologies that allow centrally controlled messages to bedisplayed or announced audibly to multiple users at a common location such as a roadside displayor display board in a transit terminal. These technologies would typically be applied to provideinformation on highway conditions, traffic restrictions, and transit status.
* Signalized Traffic Control - Technologies, that allow for real-time control of traffic flow. Possibletechnologies include optimized traffic signals, ramp metering, reversible lane designation, andramp/lane closures.
. Restrictions Traffic Control - Operational techniques that restrict the use of roadways according toregional goals. Techniques include HOV restrictions, parking restrictions, and road use(congestion) pricing.
. Navigation - Technologies that determine vehicle position in real time. Technologies that providethis function include GPS, LORAN, dead reckoning, localized beacons, map database matching,and cellular triangulation.
. Database Processing - Technologies that manipulate and configure or format transportation-related data for sharing on various platforms. General purpose data base software currently existsand is currently being adapted to transportation needs such as data fusion, maps, and travelservices.
. Traffic Prediction Data Processing - Data prodessing relating to prediction of future traffic
Final Report Sacramento ITS Early Deployment Planning Study
-76-

.
situations. Algorithms with potential applications include real-time traffic prediction, and trafficassignment.
. Traffic Control Data Processing - Data processing related to the real-time control of traffic.Algorithms with potential applications include optimal control and incident detection, and theinteraction of route selection and traffic control.
. Routing Data Processing - Data processing related to routing of vehicles including the generationof step-by-step driving instructions to a specified destination. Algorithms under developmentinclude the scheduling of drivers, vehicles, and cargo; route selection; commercial vehiclescheduling, and route guidance.
. In- Vehicle Sensors/Devices - Technologies providing a range of sensing functions to be locatedwithin vehicles. Functions addressed by these technologies include monitoring of vehicleperformance and driver performance; determination of vehicle position relative to the roadway,other vehicles, and obstacles; improvement of vision in adverse conditions; and on-board securitymonitoring.
Also included in Appendix D are a series of flow charts illustrating what functional areas are required foreach user service.
Mapping of Functional Areas to User Services
The matrix shown in Table 6 identifies the relationship between user services and the functional areas.This matrix reveals the “depth” to which the user services must be delivered in order to meet the needs ofthe Sacramento area. Previous work on this project inventoried existing and planned ITS projects andcategorized them according to which user service or user service bundle they belong. At that point, it wasonly possible to determine that the user service was being provided in some measure, but it was unclearfrom a technical perspective, as to how completely the user service requirements were being satisfied.With the functional areas identified here, the full technical requirements of those user services are nowclear.
Circles in the matrix indicate the functional areas are needed to provide a selected user service. The filledcircles indicate where functions are being provided to some degree, either by existing or by programmedprojects. Two important observations should be made.
. Most of the deployment efforts to date have been directed toward field based infrastructureindicated by the circles near the top of the chart. Little has been done to automate the inputs,outputs, or processing functions as indicated by the circles at the bottom of the chart. This lowerportion of the chart is the focus of the user service delivery system.
. A filled circle does not indicate that the function has been fully deployed by all agencies. Rather,filled circles only indicate that one or more agencies have deployed the function.
The last step in the. development of the delivery scheme identifies which capabilities that each agency orentity must have in order to support the regional user services. To aid in this process the 17 Functional
Final Report Sacramento ITS Early Deployment Planning Study
-78- .

Areas were refined in some categories to produce a list of 22 functions. The functions were then mappedto individual agencies through the matrix shown on Table 7. This matrix indicates those functions whichmust be provided by each agency in order for them to participate in the candidate user service deliverysystem.
The association of these functions to each agency/entity begins to provide an understanding of the extent ofeach agency’s participation in the overall ITS program. Those agencies who have functions to performmust next examine the technologies available to serve those functions. The mapping contained in theabove matrix represents the functionality required for deployment of a given user service. These usersservices are defined by functionality rather than technology to allow selection of the appropriatetechnology that satisfies functional requirements at the time of detailed design. As a result, each of thesefunctional areas can currently be provided in numerous ways by a wide range of available or evolvingtechnologies.
A separate document technical assessment has been produced for this project to define the current state-of-the-art/practice of ITS technologies in North America, Europe, and Japan /36/. This document is arrangedaround the functional areas shown in the above matrix., Applications, issues, and systems are discussed foreach functional area. However, it is not possible to draw definitive conclusions on the technologies mostappropriate for the Sacramento region.
The technology appropriate for a given function may differ from agency to agency and application toapplication. Technology assessments must be on-going to consider changes in technology and areas ofapplication.
As subsequent projects develop detailed user service delivery systems and move closer toward deploymentof an ITS system, it will be appropriate to select specific technologies. However, based on experiencefrom other ITS systems currently being deployed, in some cases it is possible at this time to suggest certaintechnologies as likely candidates for use in the Sacramento region.
Technologies identified below satisfy their respective functional requirements but they should be viewedonly as potential candidates for providing the selected user services. As each of the projects identified inChapter 5 moves through detailed design stages toward deployment, a more definitive technology selectioncan be made.
. Traffic Surveillance - The inductive loop detector has been the dominant form of in-pavementsurveillance used in the Sacramento region. Inductive loop detectors function by changinginductance when a vehicle stops or passes over the loop. This presence indication is processed toprovide measurements of volume and occupancy. Speed and classification information may also
be provided by connecting the loops in pairs.
Overhead mounted detectors installed to the side of the roadway permit maintenance activities tobe performed with minimal disruption to the traffic flow. Microwave radar detectors are thefavored method of providing overhead mounted detection. These detectors direct low power .energy toward the roadway. As vehicles pass through the beam, a portion of the energy isreflected back toward the detector where presence and speed can be measured.
Weather and environmental sensors will also be necessary for ITS deployment in the Sacramento
Final Report Sacramento ITS Early Deployment Planning Study
-8O-

region. These technologies are still in an early state of development. Recommendation of weatherand environment sensor technologies is not possible until specific ITS applications are identifiedduring detailed design.
Closed-circuit television (CCTV) has been used extensively in traffic management systems forroadway surveillance and incident verification. Specific applications of CCTV to be used in theSacramento region (i.e., monitoring or verification) will determine the appropriate technologies fora given project.
Video image processing uses a computer with signal processing algorithms to interpret theroadway images and extract the information needed for traffic surveillance and control.Innovations in this area are causing the state-of-the art to change very rapidly. If video imageprocessing is to be used in the Sacramento region, the specific technology chosen should beselected during the detailed design phase.
. Vehicle Surveillance - Automated vehicle classification systems count the number of vehicle axlesand record the information continually at a location. Based on cost and installation requirements,Piezo sensors are likely to be used in the Sacramento region. Piezo sensors are mounted flush withthe surrounding pavement, and produce an electronic signal on deformation by passing vehicletires.
Automatic Vehicle Identification (AVI) provides electronic reading and recording of a vehicle’sidentity as it passes specific points without requiring any action by the driver or an observer.Microwave/RF/UHF technology has a high resistance to environmental elements and is highlyreliable and flexible. For these reasons, this technology is likely to be used in meeting theSacramento region’s AVI needs.
Weigh-In-Motion (WIM) systems collect and record individual axle weights and gross vehicleweights for vehicles passing over equipment embedded in the pavement. WIM technology is usedmainly for truck weight enforcement and data collection, and is often used in conjunction withvehicle classification and AVI systems.
. Vehicle Location - Automatic vehicle location (AVL) systems provide real-time informationregarding vehicle position and progress. A number of technologies exist for providing thisinformation, but the most likely technology for application in the Sacramento region is GlobalPositioning.
. Interagency Coordination - The inter-agency coordination function is not a “true” technology.This function depends on consensus-building processes, agreements, memorandums ofunderstanding, etc. between agencies involved in ITS deployment and will be achieved duringdetailed design phases.
. Mobile Communications - Mobile communications technologies for public ITS elements will beselected during the detailed architecture design. Technologies for applications involving privatevehicles will likely be selected based on marketing decisions by private companies.
. Stationary Communications - Stationary communications technologies, much like that of mobile
Final Report Sacramento ITS Early Deployment Planning Study
- 82 -

communications, will be selected during actual ITS design. To date, stationary communicationshave relied predominantly on leased telephone lines and a limited amount of agency-owned cable.The various technologies are highly dependent on the user service delivery system. Until adetailed delivery system has been’developed, it will not be possible to determine which technologywill be employed.
. Individual Traveler Interface - The traveler interface at trip origin is expected to use a number ofdifferent technologies to provide potential travelers with information. Television, personalcomputer, radio, traveler advisory telephone, and kiosk are all expected to be viable technologiesfor traveler interface in the Sacramento region.
Because in-vehicle and on-person traveler interface systems are expected to be developed in theprivate sector, it is not appropriate to speculate on technology selection. The important factor isthat these technologies remain compatible with the traveler information database.
. Payment Systems - Public transit electronic fare collection systems allows passengers fast andconvenient access to the transit system. In a region-wide application, passengers could use a singlecard for their intermodal traveling needs without the need to keep track of transfer slips or tomaintain exact change. It is likely that a system for the Sacramento region would come from oneof the following vendors: AT&T IVHS Communications Systems, Cubic Precision Systems,Datafare, and GFI Genfare.
A potential road pricing scheme for the Sacramento region is smog fees; These fees would chargeindividual motorists for the harm caused by the emissions their vehicles dump into theenvironment. Emissions would be estimated as the product of miles driven by the vehicle, and thevehicle’s per-mile pollution emission rates.
.
. Variable Message Displays - Variable message signs (VMS) provide motorists with real-timeinformation pertinent to freeway travel. Selection of a VMS technology is likely to be influencedby the current Caltrans VMS practice. Currently Caltrans uses a Model 500 bulb matrix sign. It isexpected that Caltrans will continue to use this sign on freeways for ITS applications.
. Signalized Traffic Control - Traffic signal systems further developed under the Sacramento areaITS will be coordinated and will provide some degree of traffic responsive operation.Coordination will reduce travel time and required stops, while traffic responsive operation willallow for signal plans to adapt to changing local traffic conditions.
. Restrictions Traffic Control - Ramp metering systems will operate on a region-wide basis. Region-wide metering allows meters to respond to congestion by modifying metering rates throughout acorridor rather than only at on-ramps directly affected by the congestion.
Demand balancing is often needed to direct traffic away from areas of congestion to reduce trafficdemand approaching the location. Regional demand balancing typically shifts traffic from onefreeway to another freeway, or from one mode to another. Traveler information and rampmetering will be used to implement demand balancing.
. Navigation - Because navigation systems are expected to be developed in the private sector, it is
Final Report Sacramento ITS Early Deployment Planning Study
-83- . .

not appropriate to speculate on technology selection. What is important is that these systems areautonomous and remain compatible with the traveler information database.
. Data Processing - Numerous technological decisions will be made with respect to data processing.However, these are highly dependent on the outcome of the detailed user service delivery systemdesign phase. The Transcal field operational test (FOT) project is slated to demonstrate“TRANSVIEW” software for its traveler information system.
. In-Vehicle Sensor/Devices - It is likely that in-vehicle sensors and devices will be employed in theSacramento ITS. These may include hazard warning systems, bad weather driving assistancesystems, and collision warning systems. It is not possible at this time to speculate on specifictechnologies for these systems. However, it is important that whatever technologies are eventuallychosen be compatible with the user service delivery system.
Final Report Sacramento ITS Early Deployment Planning Study
-84-
VIII. RECOMMENDED ITS PROJECT CONCEPTS
The development of ITS projects in the Sacramento region currently takes place in an environment whichrelies on individual agencies to conceive projects, select technologies, and prioritize deployment withintheir respective jurisdictional boundaries. This environment maximizes agency autonomy and allows thoseindividuals most knowledgeable of local problems to develop and implement solutions. However, there aremany problems in the region which transcend jurisdiction boundaries, and whose solutions are beyond themeans or charter of an individual agency. In these instances, a higher level of multi-agency coordination isneeded to develop and carry out strategies for the mutual benefit of the respective agencies’ constituents.This coordination is needed on many levels ranging from the very technical to the policy or procedurallevels.
The ITS program developed under the Early Deployment Planning Study has been structured to 1)maintain the current autonomy of individual agencies for ITS development within their boundaries, 2) toidentify those program elements which benefit most from multi-agency coordination and regionalperspective, and 3) identify those projects which may “fall between the cracks” if system developmentcontinues on its current course within the various entities of the region.
The projects in the latter two categories can be considered as the “glue” which ties the program togetherand ensures that agencies can share information and resources, and that the individual systems withinagencies are used to their fullest potential for the benefit of all travelers in the region. No single agencycan serve as the leader for these types of projects, since no single agency has the authority over the entiretransportation network of state highways, local streets and transit systems. This functional segregation ofagency responsibilities over the various components and/or areas of the transportation system means thatno single agency fully represents the inter-jurisdictional or regional traveler as their constituent. Also,there currently is not a consistent technical framework for exchanging information between agencies.
To ensure that these program elements are addressed in an organized, comprehensive manner, a series ofproject descriptions has been developed which describe the work required, the agencies that must worktogether in their implementation, and the initial implementation cost. A rudimentary implementationsequence was also developed for these projects in order to identify project dependencies and likelydeployment timeframes.
The intent of these descriptions is to provide sufficient detail such that potential sponsors and fundingsources can be identified. It should be noted that the initial costs identified for the projects do not includeon-going operations and maintenance costs of hardware and software, or the agency staff time that may benecessary to oversee the acquisition of system elements from commercial vendors.
As noted earlier, it is not the intent of this ITS program to identify needs or dictate priorities within theindividual jurisdictions. Local agencies will maintain their full authority to conceive and implement ITSprojects to serve their respective residents, and are encouraged to do so. However, where possible, such
Final Report Sacramento ITS Early Deployment Planning Study
-85-

projects should be designed to be technically compatible with the region’s technical standards for dataexchange, as developed in the following projects.
The reader is referred to a separate document titled, “Project Summaries and Technology Assessment”, formore detailed information on the ITS project summaries /36/. Project costs will be presented in the nextsection of the report.
. Project Number 1: Traveler Information Database - This project would develop a database andhost software to gather and distribute information gathered through the regional user servicedelivery system. Database development would address input, storage, and output (retrieval)processes. Information placed in the database would be received from various agencies andentities in accordance with data exchange policies and protocols established by other projects.This data would then be stored and updated as needed to serve travelers, system operators, andtransportation planners. Traveler information would include incident locations, route linkconditions, carpool information, transit schedules and routes, and other specialized information.
. Project Number 2: Regional En-Route Traveler Information and Route Guidance Services - Thisproject would develop a system for providing current and reliable information on route conditionsto the en-route traveler. The system would process and prioritize data from Caltrans, CHP, localenforcement agencies, and the traveler information database. Advisory messages would bedisseminated through technologies such as changeable message signs, highway advisory radios(HAR), and the commercial media.
. Project Number 3: Regional Demand Management and Operations Services - This project woulddevelop policy and strategies to use the ITS infrastructure to manage demand in the urban area.Project sponsors would: develop demand management policy for air pollution non-attainmentdays, special event congestion, and targeted recurrent congestion; determine informationexchanges required to facilitate policy; develop specific demand management strategies based oninformation to be exchanged.
. Project Number 4: Regional Incident Management/Hazardous Materials Incident ResponseServices - This project would develop a regional incident management program which minimizesthe time necessary to detect, respond to, and clear incidents occurring in the transportationnetwork. Interagency agreements would be required to establish communications flows andoperational strategies to respond to incidents of various types and geographic locations. Thesystem configuration would address the need to minimize response time while deploying theappropriate level and type of response.
. Project Number 5: Regional Emissions Testing and Mitigation Services - This project woulddevelop a system to: a) link existing area-wide air quality monitoring and public outreach effortssuch as the “Spare-the-Air” campaign to the Traveler Information Database (Project 1); and b)install additional air quality monitoring station at “hot spots” of congestion, to provide a source ofair quality data which can be linked to transportation operating strategies.
. Project Number 6: Sacramento Urban Area Traffic Control Network - The agencies listed woulddevelop a data exchange network to facilitate operation of the urban transportation system nearjurisdiction boundaries. Signal timing parameters would be exchanged between the City and
Final Report Sacramento ITS Early Deployment Planning Study
-86-
County. Real-time video and ramp meter queue data would be exchanged between Caltrans andthe City and County. Regional Transit’s light rail system would provide signal pre-emption data tothe City and County through this network. This network would also provide link condition andincident location information to the Traveler Information Database.
. Project Number 7: Placer County Traffic Control Network - This project would develop a dataexchange network to facilitate coordinated operation of traffic signals in the jurisdiction of theparticipating agencies. The network would exchange incident locations, volume and speed data,and, to the extent available, signal timing and video data. This network would provide theparticipating agencies better information to operate traffic signals in their jurisdiction, and torespond to operating conditions outside their jurisdiction. The network would also provide linkand incident location information to the Traveler Information Database described in Project 1.
. Project Number 8: Sierra Counties Traveler Information System - El Dorado CountyTransportation Commission and Placer County Transportation Planning Agency, along with otheragencies, have entered into an agreement to develop an traveler information system to serve theneeds of travelers and tourists in the region. Specific strategies for informing tourists of localattractions, events (e.g. the Gold Discovery Sesquicentennial), and travel restrictions (e.g. localroad closures due to snow) would be developed through inter-agency consensus. Touristinformation, link conditions, and incident locations would be provided to the traveler informationdatabase through this network.
. Project Number 9: Transit Services Network - This project would develop a network to receiveride requests and information queries from the Traveler Information Database and, in turn, sendride confirmations and coordinated schedule information back to the traveler. The network wouldalso enable individual providers to electronically access schedule and route information of othertrip providers in the region.
. Project Number 10:: Stundurdized Network Information Exchange Protocols - Specificcommunications protocols would be established to govern the exchange of data between sub areanetworks. The protocols and interfaces would be defined under the guidance of a technicalcommittee representing the affected jurisdictions. The protocols would conform with nationalstandards *here practical and would not be bound by proprietary requirements that may beassociated with an individual network. The products of this work would be a technicalspecification detailing communication protocols and interfaces at each network connection withinthe regional architecture. The project would also produce a procedural document describing anapproach for ensuring the security of the data, and identifying technical contacts and areas ofresponsibility for each agency. Procedures would also address maintenance responsibilities forinter-network links.
. Project Number II: Regional Decision Support and Data Collection System - This project woulddevelop a system to gather data which describe link conditions on key segments of thetransportation network. Volume and other historical information from these key segments would .then be used to support on-going planning functions and congestion monitoring required byFederal and State programs. These key segments are prioritized into groups of 20, based on theseverity of congestion. This system would also provide link condition information to the TravelerInformation Database (Project 1).
Final Report Sacramento ITS Early Deployment Planning Study
-87-
Figure 15 illustrates the relationship of the individual projects to the overall “Candidate User ServiceDelivery System.” The project numbers listed in the lower right are color coded to various portions of thegraphic.
The graphic reinforces the fact that the individual projects defined in this document address the regionallydelivered services and provisions for inter-agency data transfer.
The graphic indicates implementation timeframes for the ITS regional program elements. The timelineshown in Figure 16 the initial phase of an ongoing project that would continue to expand on this originaleffort. As such, each project contains the initial portions of hardware and software needed to initially servetravelers in the region to some minimum level. Beyond these initial projects, subsequent expansion wouldcontinue into the indefinite future.. The pace of further expansion would be driven by the level of successachieved by the initial projects. The ending dates, then, do not signify an ultimate completion of ITSprojects, but merely completion dates for a base level of service provided to travelers in the region.
Final Report Sacramento ITS Early Deployment Planning Study
- 8 8 - . _
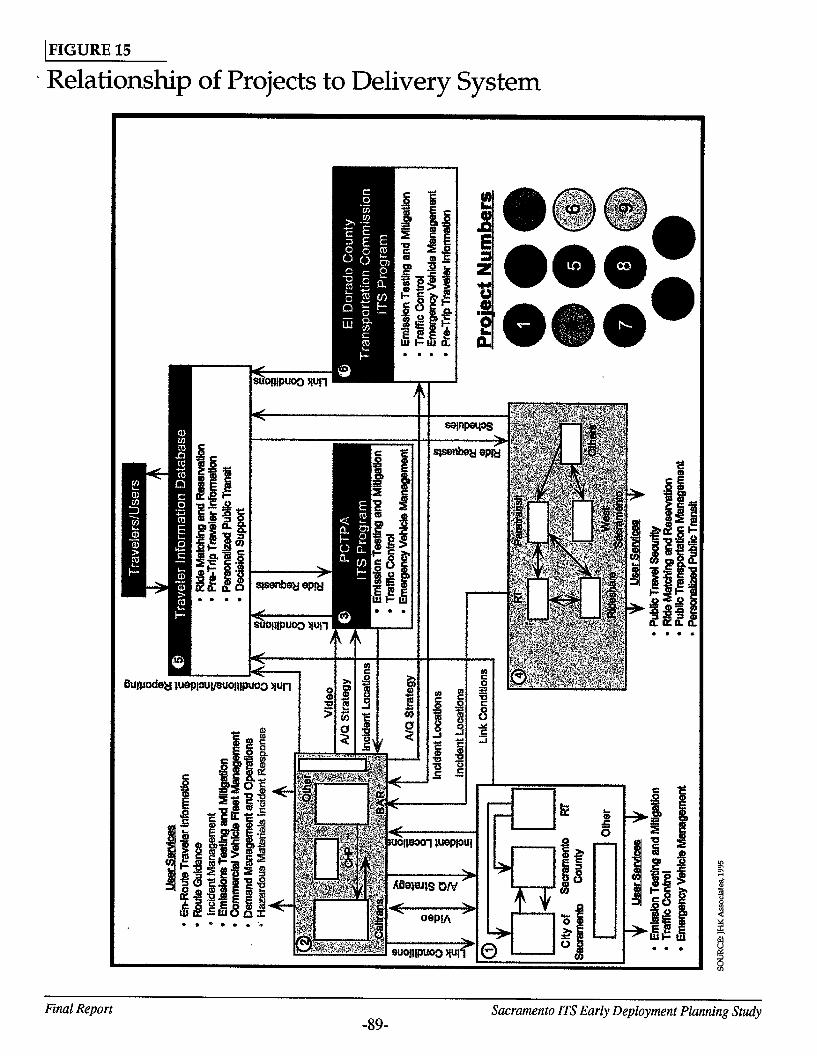
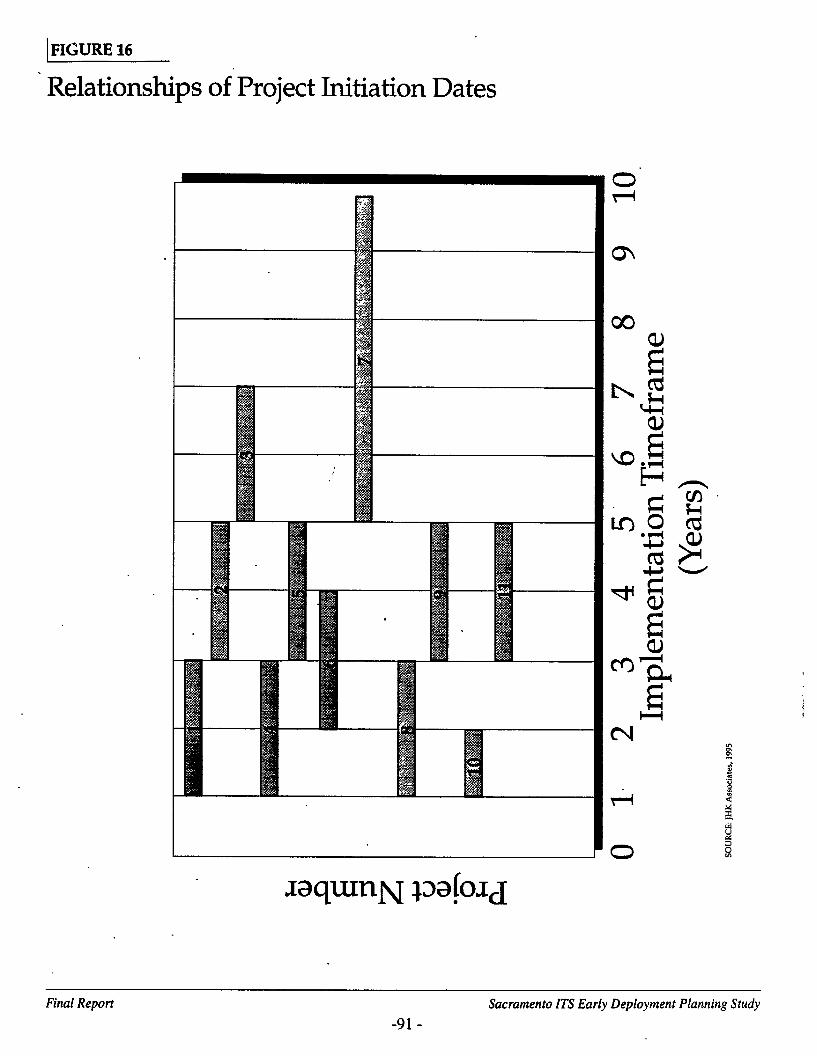
IX. FUNDING AND IMPLEMENTATION STRATEGY
Project Types
Projects required to implement the EDPS as described in Section VIII of this report fall into three generalcategories, based on the organization(s) which will ultimately be responsible for implementation, listed below.
Single Agency/Organization Projects. These are projects which are initiated and sponsored by a single agency,and provide benefit to travelers in the sponsoring jurisdiction. In many cases, single agency projects arerequired in order to participate in later, multi-agency ITS project efforts. One example of this is AdvancedTraffic Management Systems: In order to provide and regional coordination, individual local agencies musthave implemented traffic signal coordination, and ideally centralized all distributed signal systems at a TrafficOperations Center (TOC). Another example: in order to provide accurate, up-to-date transit information andservices on a traveler information database, individual transit operators must have implemented someinformation and management systems. These necessary local “functional capabilities” are identified in Section4 of the “Summary Analysis Report”. Most of the projects or improvements which fall into this categorywould ultimately be the responsibility of the sponsoring agency to conceive, fund, design, build and operate.Some design guidelines would come out of national, state, or regional standards and protocols, whereapplicable. However, implementation would not depend on partnerships with other. agencies, and theimplementing agency and travelers in the agencies jurisdictions would benefit from these improvements, withor without participation in a larger, multi-agency ITS system.
Based on known ITS projects which fall into this category, the total non-recurring cost is $37.9 million (Table8). However, only a portion of the total projects in this category are known, total cost of these projects couldbe significantly higher. The annual operating costs of projects in this category are impossible to estimate,because many of the projects would be included in agency operating budgets. In some cases, there would beno incremental agency operating cost, because the new projects would be operated and maintained by existingagency staff. For other projects, there is a potential for operating cost savings due to increased efficiency.
Multi-Agency/Operator. Collaborative Projects. These twelve projects are described in Section 5 of the“Summary Analysis Report”. These projects require coordination and participation of several agencies andorganizations for implementation. In general, these projects are not ground-breaking projects eithertechnologically or institutionally. Projects of similar types have successfully been implemented in other partsof the country. However, implementation in this region would require a high level of interagency coordination.
Based on known ITS projects in this category, the total non-recurring cost is $16.6 million (Table 9).However, three of the projects in this category are planning/design projects, which may have follow-up capitalprojects associated with them later. The cost of installation of communications equipment to several of theinformation network projects is not included in the cost estimates. The cost of ITS programs in Placer Countyand El Dorado County are not known at this time. For these reasons, the total implementation cost will behigher.
Final Report Sacramento ITS Early Deployment Planning Study
-93 -


Potential Showcase Projects. These are projects which could be considered to be “ground-breaking” in somesense, either in terms of the technology being used or applied, or in terms of the institutional relationships onwhich the projects are based. Some of the projects listed in Table 9 may fall into this category, if they wereambitiously applied, or integrated with some of the existing “field operation tests” (FOT’s) and demonstrationsin the region.
. TransCal - TransCal is a FHWA-sponsored FOT of three advanced travel services: 1) an Inter-Regional Traveler Information System (IRTIS); 2) an “mayday” Emergency Notification System(ENS); and 3) a Transit Frequent Passenger Program (TFPP). The TransCal project administered bythe Caltrans Office of New Technology, at the direction of a multi-agency, public/private managementboard. Unique features of TransCal are its inter-regional, two-state scope (including public andprivate partners from the Bay Area, Sacramento, Sierra/Foothill counties, and the Tahoe/Rena Basin),and the involvement of the private sector as active partners, bringing their own resources to theproject. The IRTIS design is being completed, and an RFP has been released for operation of theIRTIS system during the test period. The test period was budgeted for 5 months, starting this summer.It is expected that the successful bidder for operation of IRTIS will significantly extend thisoperational period. The TFPP portion of the project is still being defined, and the ENS portion willbe the subject of later stages of the project.
. 1-800-COMMUTE - The “1-800-COMMUTE” project is a Caltrans-sponsored traveler informationsystem, which allows callers to access a variety of travel information and services from a single phonenumber. “l-800-COMMUTE"” includes a menu of options for: 1) local transit information; 2) Amtrak
information; 3) rideshare services; 4) state highway road conditions; and 5) telecommute information. .The local transit, Amtrak, state highway, and telecommute information options are “pointers” to other,existing services which are also accessible through separate, direct dial numbers. For these services,“l-800-COMMUTE"V provides the user with toll-free, single number access. The rideshare servicesitem is unique, in that it allows the user to interactively enter ridematching information and requesta ridematch list by phone, a service which is only available through “l-800-COMMUTE”.(Ridematching services are also available by dialing Sacramento Rideshare directly, throughparticipating employers, and through various rideshare and transportation management agencies in theregion). The “1-800-COMMUTE” project is funded for one-year of operations by Caltrans NewTechnology and Research Program. The future operating cost of the program (the majority of whichis the cost of the “1-800” phone calls, transfers of calls from “1-800-COMMUTE” to other phonenumbers, marketing, and operation and maintenance of the voice processing system) are expected tobe assumed by Caltrans or the participating agencies and organizations.
. California Smart Traveler Internet Site - The Smart Traveler Internet Site is a statewide source fortraveler information and services. The Sacramento portion of the site includes: periodically updatedtransit information for Sacramento Regional Transit and CSU Shuttles; directories of telephonenumbers for other transit, shuttle, and alternative mode operators; links to the California HighwayInformation Number (CHIN), Amtrak, airport information, and other web sites with travelerinformation and services; The Smart Traveler Internet Site is partially supported by private funding.
. For other regions, such as Los Angeles, Orange County, and San Diego, real time traffic and.othertravel information are available.
. Sutter County ITS Program - The Sutter County ITS Program is a federally funded FOT of ITStechnologies in Sutter County, and is a cooperative effort between the County, Caltrans, Yuba-Sutter
Final Report Sacramento ITS Early Deployment Planning Study
-97-
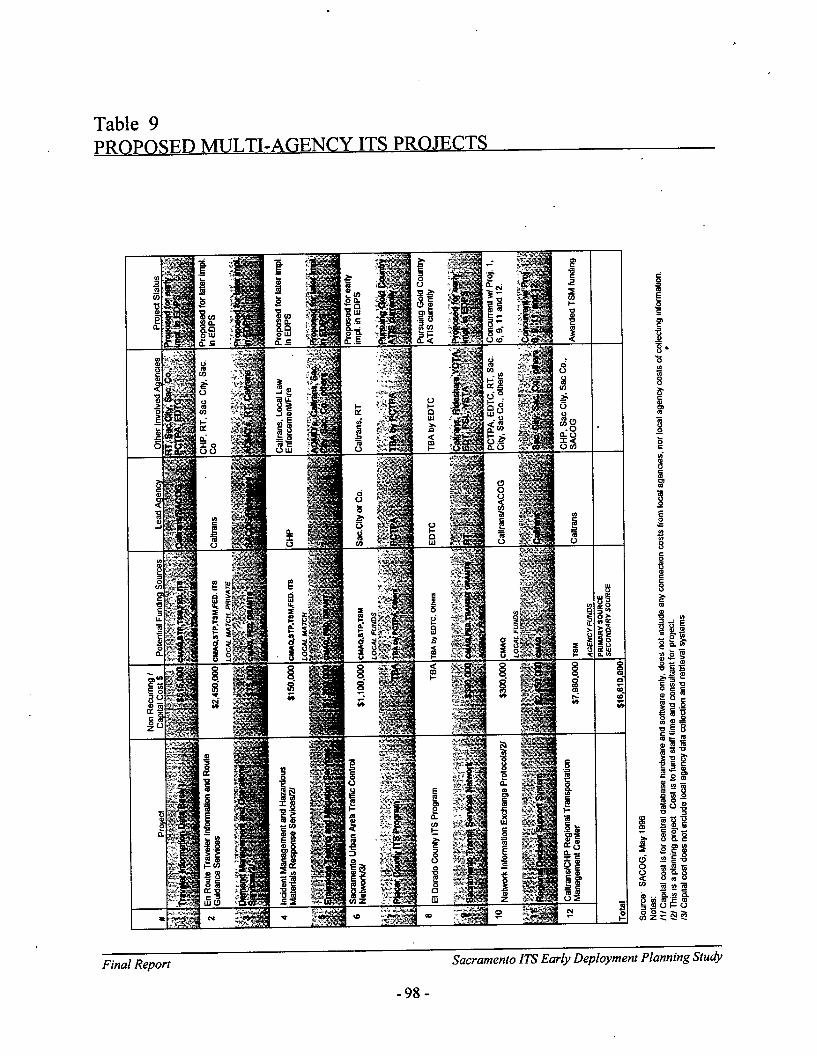

Transit, five local fue districts, and the Capitol Valley Regional SAFE. The program includes theinstallation, test period operation, and evaluation of: 1) “smart” call box technology; 2) emergencyvehicle signal preemption; 3) forward-looking, infrared collision avoidance systems for emergencyvehicles; and 4) advanced public transit management system. The smart call boxes are expected tobe installed in late 1996.
Examination of existing and programmed ITS projects shows that in the past, single agency projects have beenthe most prevalent. Table 10 lists existing and programmed ITS projects in the region.
Funding Types
No locally allocated funding source is explicitly set aside for ITS implementation. Some federal funding forITS field operation tests (FOT’s), demonstration projects, and implementation have been made available ona competitive basis. ITS projects will have to compete with other transportation projects for the limited anddiminishing pool of public funds, and demonstrate clear benefits to travelers and residents of the region to’compete with other types of projects for limited funding. However, it is believed by many that certain ITSapplications may be candidates for innovative funding, especially from private sector sources. Funding forITS projects will come from six general sources:
Local Agency/Operator Budgets. For transportation projects; this funding includes gas tax subventions, LocalTransportation Funds, transit fares, and other local contributions including development impact fees. SACOGhas estimated that over the next five years, these sources will generate a total of about $1.0 billion /38/.However, this figure includes Measure A funds (which are fully allocated to projects), and other sources whichare committed to system maintenance and operation.
All public agencies program funds from their own revenue sources for new projects, operationalimprovements, maintenance, and other investments in infrastructure. These revenues are also used to matchfunding from other sources where required. Many agencies have made ITS investments in their infrastructureusing these funds, especially for traffic signal improvements, emergency vehicle signal preemption, andcommunications equipment. The EDPS will provide guidance to local agency staff in making investments intransportation infrastructure which supports delivery of selected ITS user services.
Regionally Allocated Transportation Funds. These fund sources include Surface Transportation Program/Congestion Management Air Quality (STP/CMAQ), Transportation Enhancement Activities (TEA), andvarious transit operating revenues. SACOG estimates that the total amount in this pool over the next five yearsfor this region is about $370 million. However, no “earmark” or “set aside” has been made for ITS projectsout of this fund source, and the actual amount of funding available will depend on legislative issues such asthe ISTEA reauthorization, Historically, only a small portion of these funds have been used for ITS projects.
ITS projects were proposed for about $16 million of the total pool of $35.5 million for the last round ofregional STP and CMAQ funds. Only $3.2 million (just over 9 percent) was allocated to ITS projects. ITSprojects recommended for funding included a Traffic Operations Center (TOC) from Sacramento County, andcontinued operation of the Freeway Service Patrol.
State Transportation Funds. These fund sources include State Transportation Improvement Program (STIP)funding, State/Local Partnership, Transportation System Management (TSM), Transit Capital Improvement
Final Report Sacramento ITS Early Deployment Planning Study
-99-
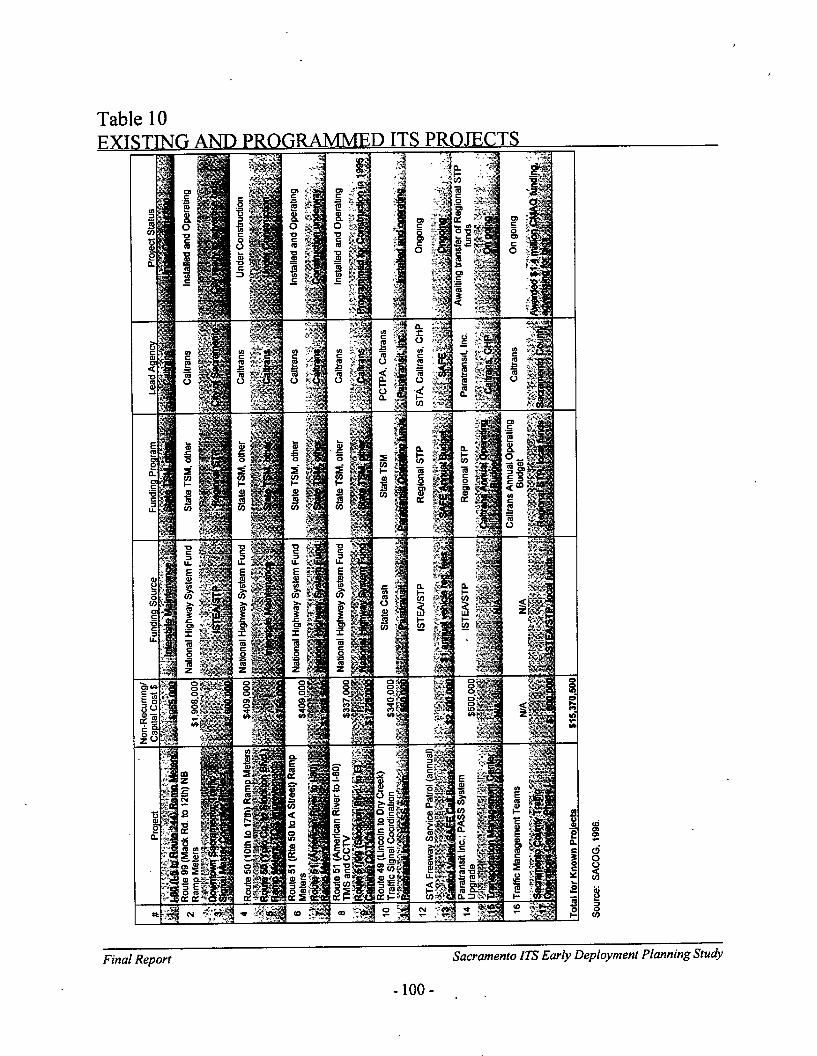

(TCI), and other programs. SACOG has estimated that the regional share of this source over the next fiveyears is about $375 million. A large portion of this funding is allocated on a formula basis, and has beenprogrammed for specific projects. For some large roadway improvement projects, ITS elements can beintegrated with the other improvements. Other funds, such as TSM, are awarded on a competitive, statewidebasis. TSM funds have been used by Caltrans for some of the existing Traffic Operations Systems (TOS)infrastructure on the freeway system. The Caltrans/CHP Regional Transportation Management Center hasbeen allocated $7.98 million in TSM funding.
Direct Federal ITS Funds. The Federal Highway Administration (FHWA) has administered an ambitiousprogram of funding for ITS research and development, testing, planning and other projects. In the last fiscalyear, a total of $114.5 million for ITS activities was included in the overall ISTEA budget. The ITS budgetfor FY 1996 $223 million, including $41 million in “earmarked” ITS projects. Additionally, $20 million wasallocated for the “Model Deployment Initiative” program, to fully fund two or three integrated ITS projectsin metropolitan areas around the nation. (Note: Several agencies in Sacramento collaborated on an applicationfor this, program. Future efforts of this type would be coordinated through the proposed ITS coordinationgroup). It is not known what level of funding will be made available for project implementation (as opposedto research and technology demonstrations), but FHWA staff have indicated that they intend to propose someadditional funding for project implementation in the coming federal budget negotiation.
Private Sector Participation. Several Federally-funded “field operation tests” (FOT’s ) have includedsignificant representation and financial participation by private sector companies and organizations. Examplesof these FOT’s in Central and Northern California are TransCal (mentioned above), TravInfo in the Bay Area,and the Yosemite Area Traveler Information (YATI) project. These FOT’s are publicly funded to operate for.a limited demonstration period only. Each FOT partnership includes private sector contributions during thedemonstration period. Additionally, each also expects or includes private sector participation in the sustainedoperation of the systems, after the test periods are over. Different options for private sector participation arebuild into each FOT. .
. Yosemite Area Travel Information (YATI) Project - YATI is a Advanced Traveler Information System(ATIS) for Yosemite National Park and the surrounding area. YATI includes several components.One is en-route traveler information, which is built on changeable message signs and highwayadvisory’radio. Information regarding Yosemite National Park, and the roadways providing accessto it, is communicated directly to drivers en-route to the Park. YATI also includes an Internet site,telephone advisory system, and information kiosks. These services provide information on the Parkand roadway conditions, but also include point-of-interest (POI) information for the surrounding areain addition to the Park. YATI is sustained by a joint powers agreement, which allows area Chambersof Commerce access to the kiosks and Internet site for the purposes of selling advertising for POIoperators around the Park. Part of the YATI operating costs are expected to be paid by theseadvertising revenues.
. San Francisco Bay Area TravInfo Project - TravInfo is an ATIS system for the San Francisco BayArea. TravInfo includes a central travel information database, which compiles real time traffic datafrom Caltrans District 4 TOS’s, incident reports from participating cities, counties, and transitoperators, and Metropolitan Transportation Commission’s (MTC’s) transit information database(routes, schedules, stop locations, and fares). TravInfo integrates data from these sources at a TravelerInformation Center (TIC), which will be operated on a contract basis by a private sector operator.Direct access to TravInfo information is provided through a dial-up advisory system. However,
Final Report Sacramento ITS Early Deployment Planning Study
-101-

TravInfo information will also be made available to private traveler information companies, such astraffic reporting companies, via leased telephone lines. The TIC operations for the demonstrationperiod will be financed in large part through a federal ITS grant. MTC, in partnership with a numberof public agencies and private companies in the Bay Area, is planning to convert the TIC to a self-sustaining operation, whereby the TIC is operated at no cost to public agencies, by a private sectorcompany which resells TravInfo-generated information.
. TransCal Field Operations Test - The IRTIS portion of TransCal is an ATIS for the San FranciscoBay Area-Sacramento-Rena-Tahoe travel corridor (Interstates 80 and 50), which was described above.TransCaI includes private sector partner participation in the IRTIS demonstration period, through
contribution of professional and technical labor, contribution of products, and contributions of otherservices (such as broadcast time by an FM sub-carrier, for example), as do the other FOT’s describedabove. The TransCal partnership has not yet adopted a model for continued private sectorparticipation in the sustained operation of TransCal components after the demonstration period.Because of the significant amount of tourism and recreational travel in the Corridor, the YATI privateparticipation model may be appropriate.
Dedicated Public Funding. An example of this source is the vehicle registration fee which funds the CapitalValley SAFE program. To the extent that ITS projects may advance objectives of the SAFE program, thissource may be relevant to the EDPS projects. One example of a project of this type is the Sutter County ITSproject, which includes call-box-based traffic monitoring and fog detection. The Capital Valley SAFE Boardrecently agreed to participate in a proposal for matching funding for a project which would close a major gapin call box coverage in the region, by installing TOS monitoring components.
SACOG has recently undertaken a project to assess the voter willingness to approve new, regional fundingsources dedicated to transportation improvements. The preliminary results of the survey work from this projectare that: a) additional sales taxes are unlikely to garner voter support, irrespective of the transportation projectsfunded; and b) additional gas taxes may be feasible, if the taxes are spent on important transportation projects,and if the revenues returned to the source county. Some ITS-oriented project-types finished high on the listof stated preferences for transportation projects among those voters surveyed. Specifically, two ITS items wererated by significant percentages likely voters to be "very important” transportation improvements:synchronized traffic signals and’electronic warning signs for congestion. (Synchronized traffic signals finishedat the top of this list, with 67 percent of likely voters rating it “very important”). While this may indicatepotential support for a new funding source for ITS projects, development of a new source of funds would takea number of years and may not be relevant for early implementation.
Funding Strategy
Table 11 summarizes a funding strategy for the ITS projects, based on the funding categories outlined above.
Single Agency Projects. For single agency projects, the primary funding source should be agency capital andoperating funds. For projects which are technically single agency, but cover a large geographic area, a widecross-section of travelers, or fund a single agency project which is critical to the success of a larger, regionallevel project, other regional funding sources may be appropriate. Based on past history of federal funding ofITS, single agency projects are unlikely to compete well. Very limited opportunities exist for public/private
Final Report Sacramento ITS Early Deployment Planning Study
-102-

Table 11PROPOSED FUNDING SOURCE BY ITS PROJECT TYPE
Limited Potential
Source: SACOG, 1996.
Notes:“Local Agency” funds include local agency revenues expended for transportation capital and operating improvements.“Regional” funds include regionally allocated transportation funds (STP, CMAQ, TEA, etc.).“State” funds include STIP, SHOPP, State TSM, TCI, and other statewide fund sources.“Federal ITS” funds include money set aside for ITS projects in ISTEA.“Dedicated” funds include special revenue sources dedicated to specific transportation projects and/or uses.
“Single Agency Initiative” projects include transportation captial and operating improvements which can be undertaken by asingle agency, and operating within their jurisdiction or service area.
“Multi-Agency Collaborative” projects include ITS projects involving participation by and coordination among a number ofoperator agencies, generally using existing, “off the shelf technologies.
“Showcase” projects include those which apply or demonstrate a ground-breaking new technology or institutional arrangement.
“Primary” means the most likely source of funds. .“Secondary” means supplementary funds.“Limited Potential” means that funding would be highly dependent on specifics of a proposed project.“Potential Matching Funds” means that funding source may provide seed or match money.
Final Report Sacramento ITS Early Deployment Planning Study
-103-
partnerships for single agency projects. Exceptions may be private sector funding of specific data collectiondevices, such as video cameras at critical intersections, or installation of transmission lines or otherinfrastructure in concert with privately financed roadway improvements.
Single agency projects, funded through agency-controlled revenues and supplemented with other, outsidesources, have represented the major category of ITS project implemented in the Sacramento region (see Table10). Information in Table 8 suggests that this category of project is likely to remain the largest public agencyinvestment in terms of numbers and total costs of projects. In fact, participation by any ITS project or systemwhich delivers services on a larger scale to regional and inter-regional travelers will depend on a minimumlevel of functional capability on the part of each participating agency, as mentioned earlier. However, eventhough these investments may be made on a single agency basis, significant added value and flexibility canbe achieved by ensuring that these single agency projects are compatible with those being made in otheradjacent jurisdictions, and that the potential for sharing of information and coordinated management offacilities is realized.
Multi-Agency Projects. For multi-agency projects, local agency funds would be appropriate to match fundingprovided from other sources. Regional and State transportation funding should be viewed as a primary fundingsource, since multi-agency projects are likely to provide large-area or region-wide services to travelers. Recentfunding history for ITS projects for this funding source demonstrates that greater understanding and comfortlevel among local jurisdictions for ITS projects must be developed, or funding of multi-agency projects willbe hit-or-miss at best. Because of the increased coverage of multi-agency projects, they are more likely’ tocompete well for Federal ITS funding. Again, because of the potential for wide geographic coverage, thepotential for involving private sector partners in development or operation costs of multi-agency projects isgreater than for single agency projects. Also, for multi-agency projects, the possibility of development of adedicated source of funding is somewhat greater, since the “audience” of potential beneficiaries is larger.
One major report has recently been published on the benefits of integrated ITS strategies for solvingtransportation problems and improving system performance /39/. Listed below are some of the key findingsrelevant to the Sacramento region.
Q Freeway and Incident Management Systems - This includes video surveillance, traffic monitoringstations, ramp metering, changeable message signs, highway advisory radio, and other tools formonitoring‘and managing traffic on freeways and ramps. Range of measured benefits: travel timedecreases of 20 to 48 percent; travel speed increases of 16 to 62 percent; freeway capacity increasesof 17 to 25 percent; and significant decreases in average response times to incidents.
. Traffic Signal Systems - This includes computerized traffic signal coordination and monitoring onsurface streets. Range of measured benefits: travel time decreases of 8 to 15 percent; travel speedincreases of 14 to 22 percent; decreases in number of vehicle stops of up to 3 5 percent; and decreasesin delay of 17 to 37 percent.
. Transit Management Systems - This includes automated vehicle location (AVL) systems,communications systems, and transit vehicle signal preemption. The range of measures benefits:decreases in travel time of 5 to 8 percent; increases in on-time performance by 12 to 23 percent; andreductions in incident response times.
Benefits for other ITS strategies are currently based on simulations or survey extrapolations. Some concrete
Final Report Sacramento ITS Early Deployment Planning Study
-104-

benefits of ATIS for the Sacramento region should be demonstrated by the TransCal FOT and the SmartTraveler projects in the region.
Showcase or Demonstration Projects. For showcase projects, the primary source of funding should be Federal.Showcase projects by definition go beyond current practice in terms of implementation of ITS technology, ordemonstrates a new technology. Because of the benefit provided to other regions around the country inlearning from these showcase applications, a large Federal role in funding them, at least for a demonstrationperiod, is appropriate. Local and regional sources should be secondary sources, for matching purposes, forthese projects. Because of the stated goals of the Federal ITS program, and because of the broad geographicarea which has been covered in previous showcase projects, private sector participation in at least the FOT’shas been strong.
Current indications are that technology demonstrations may be given less priority in terms of future Federalfunding, in favor or integrated deployment of ITS projects. Potential showcase projects in this region willbuild upon, extend the operation period, or expand the scope of the existing FOT’s. An important componentof developing a viable proposal is local agency and private sector involvement and support.
Implementation Strategy
The goals of ITS implementation in the region are: reduce congestion, reduce pollution, improve travel safety,improve transit utilization, facilitate movement of commercial vehicles, and minimize the impacts of throughand inter-regional travel.
To meet these goals, a listing of 14 ITS user services were selected for implementation in the region: 1) trafficcontrol; 2) incident management; 3) en-route driver information; 4) emissions testing and mitigation; 5) publictransportation management; 6) route guidance; 7) pre-trip travel information; 8) ride matching; 9) demandmanagement; 10) personalized public transit; 11) public transit security; 12) commercial vehicle fleetmanagement; 13) hazardous materials incident response; and 14) emergency vehicle management.
This report identified several project concepts, which would facilitate coordinated delivery of these selecteduser services to the region’s travelers. In this section, recommendations are made for which project conceptsshould be the focus of short range implementation efforts in this region.
Project Concepts for Short-Range Implementation. Based on existing and programmed ITS projectcommitments, and on ongoing ITS FOT’s and demonstration projects in the region, the following projectconcepts should be considered for short range implementation (Note: For the purposes of this study, “shortrange" means within three years; medium range means three to five years; and long range means beyond fiveyears):
. Sacramento Urban Area Traffic Control Network - The concept for this project is an informationexchange network, which would allow critical traffic operations and incident data among CaltransDistrict 3, California Highway Patrol, Sacramento City, and Sacramento County. This informationcould then be used to better coordinate traffic signal operations and responses to incidents. Further,-this project would provide a central, real-time traffic and incident information source which couldsupplement existing and proposed traveler information systems. Because of existing investmentsmade by the participating agencies in advanced traffic management systems, these agencies are in a
Final Report Sacramento ITS Early Deployment Planning Study
-105-
position to advance on this project. This project, with the working title “Sacramento AreaTransportation Network” (SATRN) was included in a proposal for funding through the federal “ITSModel Deployment Initiative Program” /40/.
A second project concept recommended in the “Summary Analysis Report” is complementary:development of standard data exchange protocols. In fact, this project would be implemented as partof the design process for the “Sacramento Urban Area Traffic Control Network”.
. Traveler Information Database - The concept for this project is a coordinated set of databases fortraveler information for the Sacramento region, which would be accessible to travelers in a variety ofways: Internet web-sites; a dial-up telephone advisory systems; personal digital assistants (PDA’s);in-vehicle displays; information kiosks; and local broadcast media. The project concept is to establishthe database, with the flexibility of formatting output for a variety of these output devices and modes.If the information database is established and accessible to traveler information and service companies,the provision of some of these output modes may be commercially supported. Existing Internet web-sites and local broadcast media outlets make these output modes the most promising for short rangeimplementation. However, FOT’s demonstrating information kiosks, PDA’s, in vehicle displays, andtelephone advisory systems also provide opportunities for short- to medium- range implementationof these output modes. Efforts are already underway to develop a traveler information system for theSierra Foothills area, in anticipation of the Sesquicentennial Anniversary of the California Gold Rush.
. Transit Services Network - This’ project is intended to develop integrated transit information andtransit trip planning capabilities for the participating transit agencies. In addition to supporting the-existing customer service functions for the participating agencies, this project would allow foradditional modes of accessing transit information and trip planning services. For example, theseservices could be incorporated into the traveler information database mentioned above, and providedvia the Internet or other output modes. This project would require development of additionalmanagement and information processing capabilities within each participating agency.
This project concept was listed-in Section VIII of this report for medium range implementation. Inthe interest of providing multi-modal transportation information and services in the travelerinformation database, this project concept is recommended for short range implementation.
These projects and preliminary cost estimates are listed in Table 8 and 9. Some of the functional capabilitiesneeded by participating agencies in order to implement these projects are listed in Table 7. More detailedproject descriptions are provided in other EDPS report documents /36,37/.
Implementation Guidelines. Based on input from study participants, several overall guidelines on ITSimplementation are recommended:
l Orientation to the Traveler - Travelers in the region are customers of agencies operating transportationsystems. Where benefits can be provided to travelers, coordinated, multi-agency projects should bepursued. All projects should include monitoring and evaluation to demonstrate the benefits providedto travelers.
. Operational Autonomy - Maintaining operational autonomy of transportation systems was a priority
Final Report Sacramento ITS Early Deployment Planning Study
-106-

for most of the agencies participating in this project. The multi-agency projects listed in Table 2 weredeveloped with this limitation in mind. This means that multi-agency projects are limited largely toinformation sharing among participating agencies. Delivery of benefits (either through improvedsystem performance, or better information) to travelers will require cooperative agreements among theparticipating operators.
. Open for Expansion - Any multi-agency project should be open to participation of other agencies inthe future. Integrated networks and systems should be based on “off-the-shelf’ software and hardwarewhenever possible, and should be scaled to allow for later expansion.
. Build on Existing Investments - Future ITS projects should focus on integration of existing systems,and take advantage of infrastructure, training, and other investments made by local agency operators.
ITS Coordination Group. In order to take advantage of opportunities for implementation of ITS projects in .the region, an ad hoc forum for coordinating ITS activities should be established. Some roles for the ITSCoordination group are: information sharing, coordination of ITS projects, and funding development for ITSprojects. SACOG can provide staffing support for this group.
An example of activities for this group for the 1996/97 fiscal year are:
. Follow-up on the Sacramento Model Deployment Initiative Proposal - Participants in the proposalhave indicated an interest in developing an agreement for the purposes of future funding proposals.
Some agencies which were unable to participate in the MDI proposal due to time constraints may be .interested in a future effort. Other funding sources may be appropriate for funding some or all of theproject proposal.
. Private Sector Role in ITS Implementation - So far, private sector participation in ITS in the regionhas been limited to FOT’s. However, many companies, especially in the traveler information andservices industry, are actively developing ITS products and services which may be deployed in theregion. Some outreach to these companies could be done, and potential partnerships in ITS projectimplementation could be explored and discussed.
. Coordination with Ongoing ITS FOT’s and Demonstrations - The FOT’s provide uniqueopportunities for ITS implementation, because the funded demonstration periods allow for the benefitsof ITS to be seen concretely. Additionally, each FOT actually provides system software and hardware,which may provide the basis for implementation of ITS on a wider scale in the region. Minimally, theITS coordination group could provide input to the FOT’s as they progress, and provide informationand assistance where appropriate. Potentially, the ITS coordination group could play an active role
. in discussions and actions needed to sustain successful and beneficial portions of the FOT’s beyondtheir demonstration periods.
. Coordination with ITS planning and project implementation in Placer and El Dorado Counties -Placer and El Dorado Counties have their own ITS planning and project implementation efforts underway. To date, coordination between Placer, El Dorado, Sacramento, Yolo, Yuba and Sutter Countieshas been informal, through the EDPS workshops and meetings. With the formation of an ITScoordination group, more explicit coordination on project planning, prioritization, funding, andimplementation should be established. The current MOU’s between SACOG, the Placer County
Final Report Sacramento ITS Early Deployment Planning Study
-107-
Transportation Commission (PCTC), and El Dorado County Transportation Commission (EDTC) layout roles and responsibilities of each agency, and are not expected to need revision to accommodateITS activities. However, some additional staff-level protocols for ITS projects will need to be agreedupon.
Final Report Sacramento ITS Early Deployment Planning Study
-108-

REFERENCES
/1/
/2/
/3/
/ 4 /
/ 5 /
/ 6 /
/7/
/ 8 /
/ 9 /
/10/
/11/
/12/
/13/
/ 1 4 /
SACOG, “Task 1 Technical Memorandum: Problem Definition”, Sacramento ITS Early DeploymentPlanning Study, Report # SACOG-95-008, January 13, 1995.
Epps, A, Cheng, J., and May, A., “Developing Methodologies for Quantifying Freeway CongestionDelay”, Institute of Transportation Studies Report #UCB-ITS-RR-94-2, Berkeley, June 1994.
SACOG, “1996 Draft Metropolitan Transportation Plan”, Report #SACOG-96-008, April 1996.
Sacramento Metropolitan Area Air Quality Management District, “Sacramento Area ProposedRegional Ozone Attainment Plan”, 1994.
SACOG, “Task 2 Technical Memorandum: Prioritize ITS User Services”, Sacramento ITS EarlyDeployment Planning Study, Report # SACOG-95-0 10, January 30,1995. . .
JHK Associates, “Interim Report: Goals, Objectives and User Service Selection”, Sacramento ITSEarly Deployment Planning Study, SACOG Report #95-034, May 9, 1995.
JHK & Associates, “Phase IV and V TSMP Evaluation: Draft”, prepared for the City of San JoseDepartment of Streets and Parks, December 1994.
Institute of Transportation Studies, University of California, “Fuel-Efficient Traffic SignalManagement: Three Years of Experience, 1983-1985”, Berkeley, California, 1986.
Los Angeles Department of Transportation, “Automated Traffic Surveillance and Control System:Evaluation Study”, Los Angeles, California, July 1987.
Texas Department of Transportation, “Benefits of Texas Light Synchronization Program I”, Austin,Texas, October 1992.
JHK & Associates, “Traffic Engineering Review”, prepared for the California Department ofTransportation, District IV, October 1991.
Henry, K., and Meyhan, O., “6 Year Flow Evaluation”, Washington DOT, District 1, January 1989.
Roper, D.H., “Incident Management,” California Department of Transportation, date unknown.
JHK & Associates, “Orange County Intelligent Vehicle/Highway Systems Study: Final Report”,prepared for the Orange County Transportation Authority, November 1993.
Final Report Sacramento ITS Early Deployment Planning Study
- 109-

/15/ Ministry of Transportation, Ontario, “Evaluation of the Highway 401 COMPASS Freeway TrafficManagement System: Summary Report”, Freeway Traffic Management Section, Traffic Managementand Engineering Office, January 1994.
/16/
/17 /
/18/
Minnesota DOT, “Highway Helper Summary Report - Twin Cities Metro Area”, July 1994.
Kuciemba, S., The Maryland State Highway Administration, March 1995.
Collins, Barry M., “Use of Computer-Aided Traffic Control Systems in Ireland”, Workshop onApplication of Computerized Systems for Public Transportation, Hanover, Germany, September 1989.
/19/ Kloos, W., Danaher, A., and Hunter-Zaworski, K., “Bus Priority at Traffic Signals in Portland”, ITSAnnual Meeting, March 1995.
/20/ DeLeuw, Cather, & Co . , “Evaluation of the Cincinnati Transit Information System (TIS)“,Transportation Systems Center, Cambridge, Massachusetts, 1979.
/21/ “Clean Air Through Transportation Challenges in Meeting Air Quality Standards,” Joint Report ofUSDOT and USEPA, August 1993.
/22/
/23/
Cleaning the Air, Choosing the Future.
Smith, S. and Perez, C., “Evaluation of INFORM-Lessons Learned and Application to OtherSystems”, 7 1 st TRB, January 1992.
/ 2 4 / Comsis Corporation, “Evaluation of Travel Demand Management Measures to Relieve Congestion,”February 1990.
/ 2 5 / Al-Deck, Haitham, et al., “Potential Benefits of In-Vehicle Information Systems in Real Life FreewayCorridor Under Recurring and Incident-Induced Congestion”, Institute of Transportation Studies,University of California, Berkeley, California, July 1988.
/26 / Al-Deek, Haitham, and Adolf D. May, “Potential Benefits of In-Vehicle Information Systems (IVIS):Demand and Incident Sensitivity Analysis”, Institute of Transportation Studies, University ofCalifornia, Berkeley, California, July 1988.
/27/ Al-Deek, Haitham, and Adib Kanafani, “Some Theoretical Aspects of the Benefits of En-RouteVehicle Guidance (ERVG)“, Institute of Transportation Studies, University of California, Berkeley,California, August 1989, revised March 1990.
/28 / Koutsopoulos, Haris N., and Tsippy Lotan, “Effectiveness of Motorist Information Systems inReducing Traffic Congestion”, New York, IEEE, June 1989.
/29/ JMP Consultants Ltd., “Study to Show the Benefits of Autoguide in London”, Contract Report 128,TRRL, Department of Transport, Crowthome, Berkshire, England, 1989.
/30 / Smith, J.C., and K. Russam, “Some Possible Effects of Autognide on Traffic in London”, Transport
Final Report Sacramento ITS Early Deployment Planning Study
-110-

and Road Research Laboratory, Crowthome, Berkshire, England, 1989.
/31/ Van Aerde, M., “Simulation-Based Estimates of Benefits to TravTek Drivers and Other NetworkUsers”, to be published.
/32/ Tech Environmental, Inc., “Air Quality Benefit Study of the SmarTraveler Advanced TravelerInformation Service”, July 1993.
/ 3 3 / Hallowell, S. and Morlok, E., “Estimating Cost Savings From Advanced Vehicle Monitoring andTelecommunications System in Intercity Irregular Route Trucking”, University of Pennsylvania,January 1992.
/ 3 4 / U.S. Department of Transportation, “User Services Requirements”, October 1993.
/35/ U.S. Department of Transportation, “National ITS Program Plan”, March 1995.
/36/ JHK Associates, “Project Summaries and Technology Assessment”, Sacramento ITS EarlyDeployment Planning Study, SACOG, October 1995.
/ 3 7 / JHK Associates, “Summary Analysis Report”, Sacramento ITS Early Deployment Planning Study,SACOG, October 11, 1995.
/ 3 8 / SACOG, “Metropolitan Transportation Plan Update Working Paper #2: Revenue Projections”,.SACOG Report # SACOG-95-013, June 1995.
/39/ U.S. Department of Transportation, “Intelligent Transportation Infrastructure Benefits: Experiencedand Expected”, January 1996.
/40/ SACOG, “Sacramento Model Deployment Initiative Proposal”, SACOG, April 30, 1996.
Final Report Sacramento ITS Early Deployment Planning Study
-111- .

APPENDlX A: LIST OF EDPS PARTICIPANTS
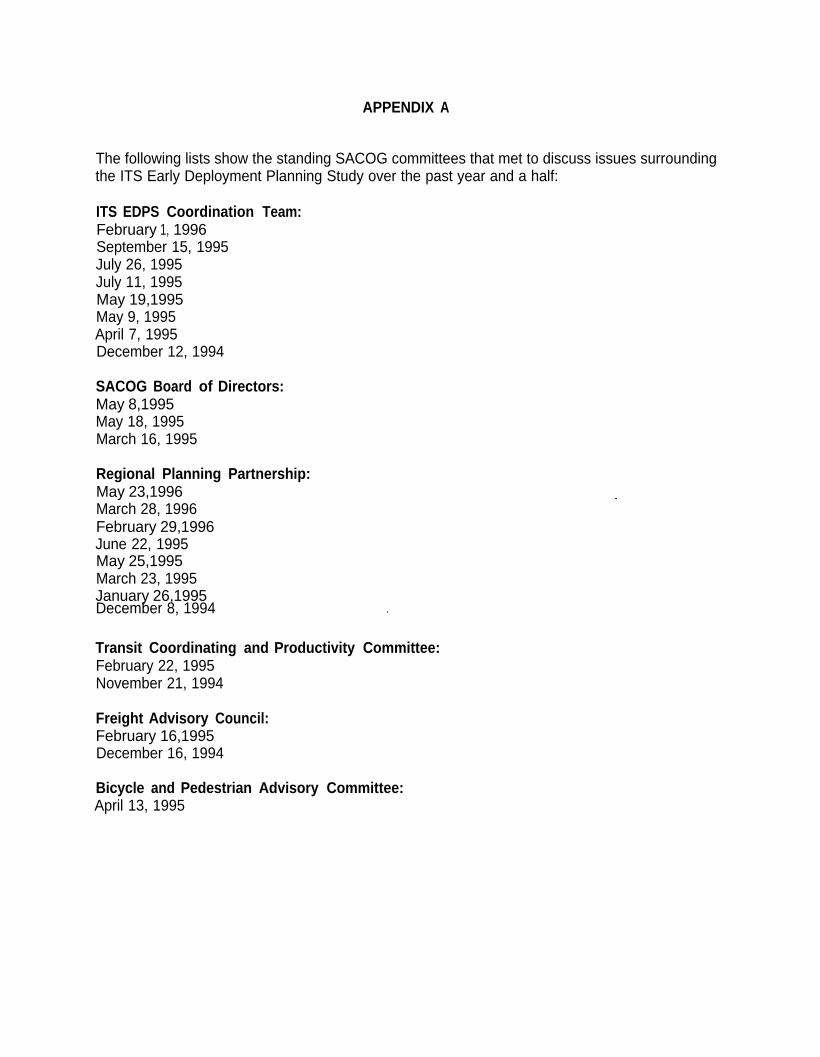
APPENDIX A
The following lists show the standing SACOG committees that met to discuss issues surroundingthe ITS Early Deployment Planning Study over the past year and a half:
ITS EDPS Coordination Team:February 1, 1996September 15, 1995July 26, 1995July 11, 1995May 19,1995May 9, 1995April 7, 1995December 12, 1994
SACOG Board of Directors:May 8,1995May 18, 1995March 16, 1995
Regional Planning Partnership:May 23,1996March 28, 1996February 29,1996June 22, 1995May 25,1995March 23, 1995January 26,1995December 8, 1994 .
Transit Coordinating and Productivity Committee:February 22, 1995November 21, 1994
Freight Advisory Council:February 16,1995December 16, 1994
Bicycle and Pedestrian Advisory Committee:April 13, 1995
The following list is of local agency staff that participated in the ITS Early Deployment PlanningStudy Workshops over the past year and a half:
Grieg AsherMichael BakerCameron BeebeTom BrinkmanPeter ChristiansenPaul CongiBob CooperMar-tie DoteTim DouglasDave DriscollBill DurantMike EvansJerry FitchJ o h n G e d n e yKevin GreenKay HansonSteve HetlandNorman HornDavid LiuVelma LuceroSteve LykinsLarry PagelAnthony PalmereAndy ParvinDavid PelzJeffery PulvermanBrian SimiMark SirokyDavid Yatabe
Placer County Transportation Planning AgencyCalifornia Air Resources BoardCity of West Sacramento Public WorksPlacer County Public WorksSacramento Metropolitan Air Quality Management DistrictCalifornia Highway PatrolCity of SacramentoYolo County Transit AuthorityPlacer County Transportation Planning AgencyCaltrans District 3Paratransit Inc.Caltrans District 3Sacramento County Public WorksEl Dorado County Department of TransportationCalifornia Highway PatrolCaltrans New TechnologiesSacramento County Public WorksSacramento Transportation AuthoritySutter County Department of Public WorksSacramento RideshareCalifornia Highway Patrol Valley DivisionCity of Roseville Public WorksSacramento Regional Transit DistrictEl Dorado County Transportation CommissionCity of Davis Public WorksCaltrans District 3Caltrans District 3City of Folsom Public WorksCity of Sacramento Public Work
ITS Early Deployment Planning Study Workshop Dates:May 9, 1996February 8,1996
‘August 15,1995February 24, 1995December 12,1994

APPENDlX B: ITS USER SERVICE DESCRIPTIONS
APPENDIX B
Intelligent VehicleHighway Systems
A Primer on User Services
Highway Patrol
November 15, 1994

work, transit schedules, etc.When fully deployed, routeguidance systems will providetravelers with directions to theirdestinations based on real-timeinformation about the transpor-tation system. The route guid-ance service will considertraffic conditions, status andschedule of transit systems,and road closures in develop-ing the best route. Users of theservice include not only drivers,but also non-vehicular travel-ers, such as pedestrians orbicyclists, who could get spe-cialized route guidance from ahand-held device.
Traveler ServicesInformation
Provides a business directory,or yellow pages of serviceinformation.
Traveler setices informa-tion provides quick access totravel related services andfacilities. Examples of infor-mation that might be includedare the location, operatinghours, and availability of food,parking, auto repair, hospitals,and police facilities. Travelerservices information would beaccessible in the home, officeor other public locations to helpplan trips, and might also beavailable en route. When fullydeployed, this service will con-nect users and providers inter-actively, to request and provideneeded information.
Traffic Control3
Manages the movement oftraffic on streets and highways.
This service will provide forthe integration and adaptivecontrol of the freeway andsurface street system to im-prove the flow of traffic, givepreference to transit and otherhigh occupancy vehicles, andminimize congestion whilemaximizing the movement ofpeople and goods. Throughappropriate traffic controls, theservice will also promote thesafety of non-vehicular travel-ers, such as pedestrians andbicyclists. This service requiresadvanced surveillance of trafficflows, sophisticated analysistechniques for determiningappropriate traffic signal andramp metering controls, andcommunication of these con-trols to the roadside infrastruc-ture.’ The real-time traffic in-formation collected by theTraffic Control service alsoprovides the foundation formany other user services.
Incident Management
Helps public and private or-ganizations quickly identifyincidents and implement aresponse to minimize theireffects on traffic.
This service enhancesexisting capabilities for detect-ing incidents and taking theappropriate actions in responseto them. The service usesadvanced sensors, informationmanagement, and communica-tions to improve the incidentmanagement and responsecapabilities of transportationand public safety officials, thetowing and recovery industry,and others involved in incidentresponse. The service helpsthese groups to quickly andaccurately identify a variety of
2
incidents, and to implement aresponse which minimizes theeffects of these incidents onthe movement of people andgoods.
Emissions Testing andMitigationProvides information for moni-toring air quality and developing air quality improvementstrategies.
This service uses advancedvehicle emissions testing sys-tems to identify environmental"hot spots” and implementstrategies to reroute trafficaround sensitive air qualityareas, or control access tosuch areas. Other technolegies provide in-vehicle orroadside identification of vehi-cles that are emitting levels ofpollutants that exceed state,local or regional standards, andprovide information to driversor fleet operators to enablethem to take corrective action.
Pre-Trip TravelInformation
Provides information for select-ing the best departure time,transportation modes androutes
Pre-trip travel informationallows travelers to access acomplete range of intermodaltransportation information athome, work, and other majorsites where trips originate. Forexample, timely information ontransit route, schedules, trans-

This service provides sys-tems that monitor the environ-ment in transit stations, parkinglots, bus stops, and on-boardtransit vehicles, and generatesalarms, either automatically ormanually, when necessary.This improves security for bothtransit riders and operators.
Electronic PaymentServices
Allows travelers to pay fortransportation services elec-tronically.
This service fosters inter-modal travel by providing acommon electronic paymentmedium for all transportationmodes and functions, includingtolls, transit fares, and parking.The service provides for acommon service fee and pay-ment structure using “smartcards” or other technologies.Such systems could be trulymulti-use, allowing personalfinancial transactions on thesame medium. The flexibilitythat electronic payment serv-ices offer also facilitates traveldemand management, if condi-tions warrant.
Commercial VehicleElectronic Clearance
Facilitates domestic and inter-n a t i o n a l border clearance,minimizing stops.
This service will enabletransponder-equipped trucksand buses to have their safetystatus, credentials, and weightchecked at mainline speeds.Vehicles that are safe and legaland have’ no outstanding out-of-service citations will beallowed to pass the inspec-tion/weigh facility without delay.
Automated RoadsideSafety Inspection
Facilitates roadside inspec-tions.
Automated roadsideinspections allow real-timeaccess at the roadside to thesafety performance record ofcarriers, vehicles and drivers.Such access helps determinewhich vehicle or driver shouldbe stopped for an inspection,as well as ensuring timelycorrection of previouslyidentified problems.
This service also automatesas many items as possible ofthe manual inspection process.Through the use of sensorsand diagnostics, it efficientlychecks vehicle systems anddriver requirements andultimately driver alertness andfitness for duty.
On-Board SafetyMonitoring
Senses the safety status of acommercial vehicle, cargo, anddriver.
On-board systems monitorthe safety status of a Vehicle,cargo, and driver at -mainlinespeeds. Vehicle monitoringincludes sensing and collectingdata on the condition of critical
vehicle components such asbrakes, tires, and lights, anddetermining thresholds forwarnings and countermea-sures. Cargo. monitoring in-volves sensing unsafe condi-tions relating to vehicle cargo,such as shifts in cargo whilethe vehicle is in operation.Driver monitoring is envisionedto include the monitoring ofdriving time and alertnessusing non-intrusive technologyand the development of warn-ing systems for the driver, thecarrier, and the enforcementofficial.
Commercial VehicleAdministrativeProcesses
Provides electronic purchasingof credentials and automatedmileage and fuel reporting andauditing.
Electronically purchasingcredentials provide the carrierwith the capability toelectronically purchase annualand temporary credentials viacomputer link It reducesburdensome paper work andprocessing time for both thestates and the motor carriers.
For automated mileage andfuel reporting and auditing, thisservice would enable participat-ing interstate carriers to elec-tronically capture mileage, fuelpurchased, trip, and vehicledata by state. This informationcan be used by the carrier inpreparing fuel tax andregistration reports to thestates.
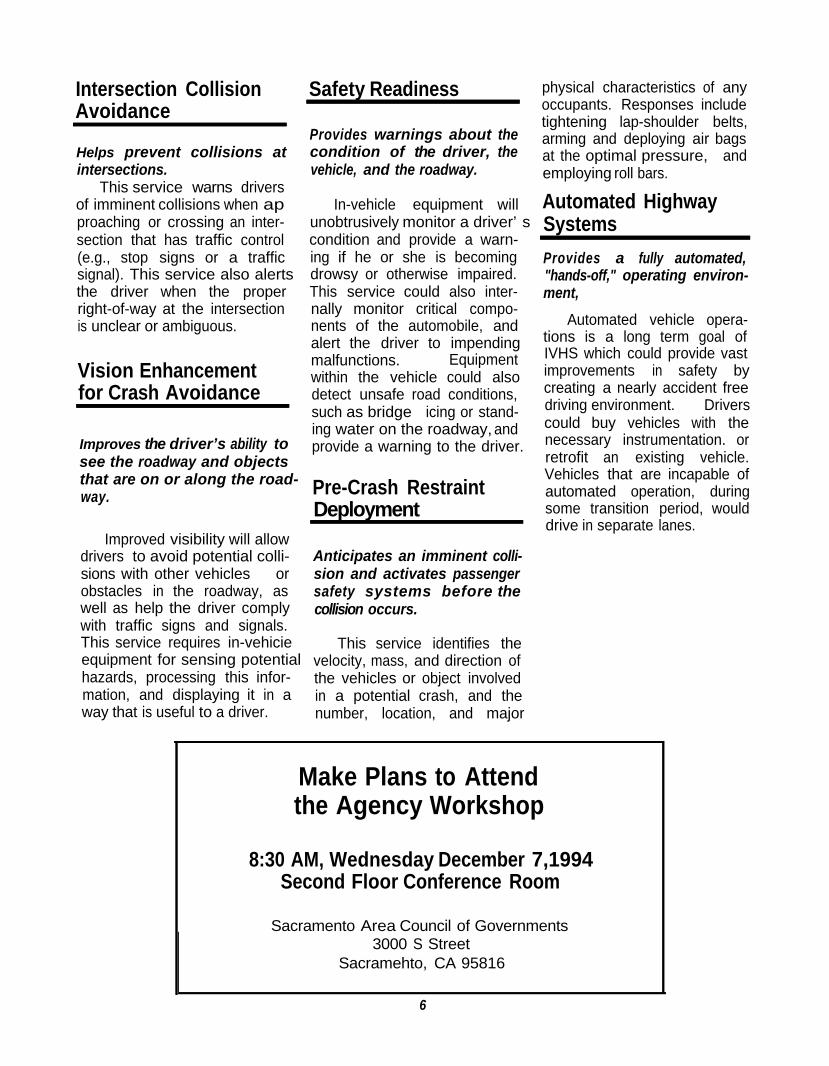
Intersection CollisionAvoidance Helps prevent collisions at
intersections.This service warns drivers
of imminent collisions when approaching or crossing an inter-section that has traffic control(e.g., stop signs or a trafficsignal). This service also alertsthe driver when the properright-of-way at the intersectionis unclear or ambiguous.
Vision Enhancementfor Crash Avoidance
Improves the driver’s ability tosee the roadway and objectsthat are on or along the road-way.
Improved visibility will allowdrivers to avoid potential colli-sions with other vehicles orobstacles in the roadway, aswell as help the driver complywith traffic signs and signals.This service requires in-vehicieequipment for sensing potentialhazards, processing this infor-mation, and displaying it in away that is useful to a driver.
Safety Readiness
Provides warnings about thecondition of the driver, thevehicle, and the roadway.
In-vehicle equipment willunobtrusively monitor a driver’scondition and provide a warn-ing if he or she is becomingdrowsy or otherwise impaired.This service could also inter-nally monitor critical compo-nents of the automobile, andalert the driver to impendingmalfunctions. Equipmentwithin the vehicle could alsodetect unsafe road conditions,such as bridge icing or stand-ing water on the roadway, andprovide a warning to the driver.
Pre-Crash RestraintDeployment
Anticipates an imminent colli-sion and activates passengersafety systems before thecollision occurs.
This service identifies thevelocity, mass, and direction ofthe vehicles or object involvedin a potential crash, and thenumber, location, and major
physical characteristics of anyoccupants. Responses includetightening lap-shoulder belts,arming and deploying air bagsat the optimal pressure, andemploying roll bars.
Automated HighwaySystemsProvides a fully automated,"hands-off," operating environ-ment,
Automated vehicle opera-tions is a long term goal ofIVHS which could provide vastimprovements in safety bycreating a nearly accident freedriving environment. Driverscould buy vehicles with thenecessary instrumentation. orretrofit an existing vehicle.Vehicles that are incapable ofautomated operation, duringsome transition period, woulddrive in separate lanes.
Make Plans to Attendthe Agency Workshop
8:30 AM, Wednesday December 7,1994Second Floor Conference Room
Sacramento Area Council of Governments3000 S Street
Sacramehto, CA 95816
6

APPENDIX C: NOTES FROM FIRST ITS WORKSHOP
APPENDIX C
SACOG ITS
Early Deployment Plan Study
Jurisdiction Workshop
Summary of
Working Group Sessions on
Problem Definition


APPENDIX D: RELATIONSHIP OF ITS FUNCTIONAL AREAS TOUSER SERVICES
APPENDIX D
NATIONAL ITS PROGRAM PLAN
VOLUME I
FIRST EDITIONMARCH 1995
Edited by:
Gary W: EulerJoint Program Office for ITSUnited States Department of Transportation
H. Douglas RobertsonPlans and ProgramsITS America

I NATIONAL ITS PROGRAM PLAN CHAPTER V - USER SERVICES INTEGRATION
Planning organizations should be aware of the benefits of integrating the user services in asystem.
3.1 Functional Relationships Among User Services
Each of the 29 user services discussed in Chapter III was analyzed to identify candidateenabling technologies. This analysis is based on a wide range of technologies capable ofsupporting robust, fully functioned user service implementations. This does not imply that auser service deployment must necessarily include all of the enabling technologies or thefunctions they provide.
In order to keep the number of technologies at a manageable level, they were grouped intofunctional areas. In general, each functional area is comprised of one or more separatetechnologies which can be used interchangeably in a system deployment that provides a userservice. For example, two-way mobile communications could be provided by either digitalcellular telephones or two-way satellite communications. The functional areas are defined inTable 5-l.
Table 5-1 Function Definitions
Function
TrafficSurveillance
Definition
Surveillance technologies that collect information about the status of the trafficstream. Possible technologies include loop detectors, infrared sensors, radarand microwave sensors, machine vision, aerial surveillance, closed circuittelevision, acoustic, in-pavement magnetic, and vehicle probes.
VehicleSurveillance
Surveillance technologies that collect a variety of information about specificvehicles. These technologies include weigh-in-motion devices, vehicleidentification, vehicle classification, and vehicle location.
Inter-AgencyCoordination
Technologies that connect travel-related facilities to other agencies such aspolice, emergency services providers, weather forecasters and observers, andamong Traffic Management Centers (TMC), transit operators, etc.
1-Way Mobile Any communication technology that transmits information to potentiallyCommunications mobile reception sites but cannot receive information back from those sites.
Possible technologies providing this function include Highway AdvisoryRadio, PM subcarrier, spread spectrum, microwave, infrared, commercialbroadcasts, and infrared or microwave beacons.
62

I - NATIONAL ITS PROGRAM PLAN CHAPTER V - USER SERVICES INTEGRATION
Table 5-l Function Definitions
Function
2-Way MobileCommunications
Definition
Any communication technology that transmits information to potentiallymobile reception sites and allows receipt of information from those same sites.Possible technologies include cellular telephones, 2-way radio, spreadspectrum, microwave, infrared, and 2-way satellite.
Stationary Any communication technology that connects stationary sites. TechnologiesCommunications include fiber optics, microwave, radio, land lines.
Individual Devices that ‘provide information flow to a specific traveler. TechnologiesTraveler Interface meeting this function include touch screens, keypads, graphics displays and
computer voices at kiosks; keypads, computer voice, and on-board displaysystems in vehicles; personal communications devices carried with thetraveler; audiotex from any phone; and TV in the office or home.
Payment Systems Technologies that enable electronic fund transfer between the traveler and theservice provider. The technology areas include Automated VehicleIdentification (AVI), smart cards, and electronic funds management systems.This function overlaps with the Electronic Payment user service.
Variable Message Technologies that allow centrally controlled messages to be displayed orDisplays announced audibly to multiple users at a common location such as a roadside
display or display board in a transit terminal. These technologies wouldtypically be applied to provide information on highway conditions, trafficrestrictions, and transit status.
Signalized Traffic Technologies that allow for real-time control of traffic flow. PossibleControl technologies include optimized traffic signals, tamp metering, reversible lane
designation, and ramp/lane closures.
RestrictionsTraffic Control
Operational techniques that restrict the use of roadways according to regionalgoals. Techniques include HOV restrictions, parking restrictions, and mad use(congestion) pricing.
Navigation Technologies that determine vehicle position in real time. Technologies thatprovide this function include GPS, LORAN, dead reckoning, localizedbeacons, map database matching, and cellular/radio triangulation.
DatabaseProcessing
Technologies that manipulate and configure or format transportation-relateddata for sharing on various p1atforms. General purpose data base softwarecurrently exists and is currently being adapted to transportation needs such asdata fusion, maps, and travel services.
63

I - NATIONAL ITS PROGRAM PLAN CHAPTER V - USER SERVICES INTEGRATION
Table 5-l Function Definitions
Function Definition
Traffic Prediction Data processing relating to prediction of future traffic situations. AlgorithmsData Processing under development include areas such as real-time traffic prediction, and
traffic assignment.
Traffic ControlData Processing
Data processing related to the real-time control of traffic. Algorithms underdevelopment include optimal control and incident detection, and the interactionof mute selection and traffic control.
Routing DataProcessing
Data processing related to routing of vehicles including the generation of step-by-step driving instructions to a specified destination. Algorithms underdevelopment include the scheduling of drivers, vehicles, and cargo; routeselection; commercial vehicle scheduling, route guidance and multimodaldispatching.
In-VehicleSensors/Devices
Technologies providing a range of sensing functions to be located withinvehicles. Functions addressed by these technologies include monitoring ofvehicle performance and driver performance; determination of vehicle positionrelative to the roadway, other vehicles, and obstacles; improvement of visionin adverse conditions; and on-board security monitoring.
The user service bundles, introduced in Chapter III, are the starting point for determining theinterrelationship of one user service to another. The bundles provide logical groupings andcombinations of the user services. By analyzing a user service’s relationship to other userservices, a system may be conceived over a period of years in a comprehensive and deliberatemanner. This approach makes it possible to optimize the use of funds and resources resultingin a more achievable and affordable system deployment.
The results of the analysis of functional commonalities are depicted in Figure 5-2. In thefigure, the user service bundle is identified in the upper left hand corner of the chart. The leftside of the chart lists the associated functions. The right of the figure lists the user servicesin the bundle. If a function supports full implementation of a user service, the intersection ofthe user service row and function column is marked. Note that in some applications it is notnecessary to implement all supporting functions to successfully deploy a system providing auser service.
64


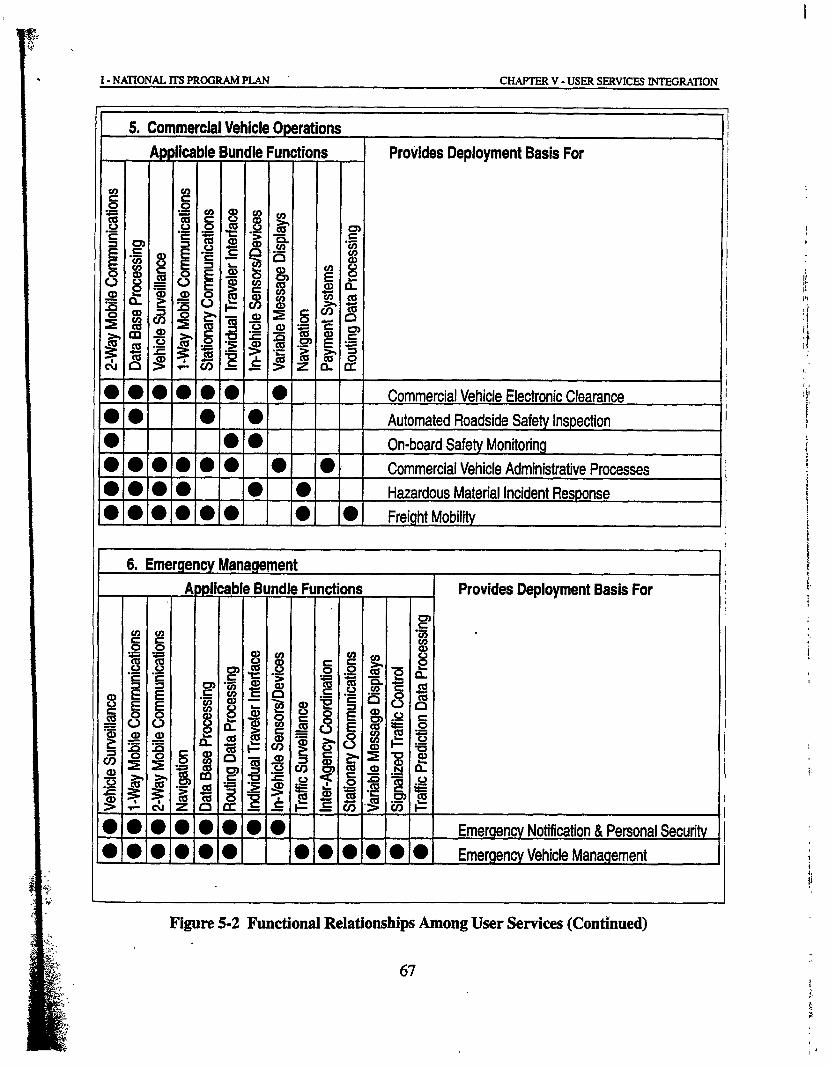
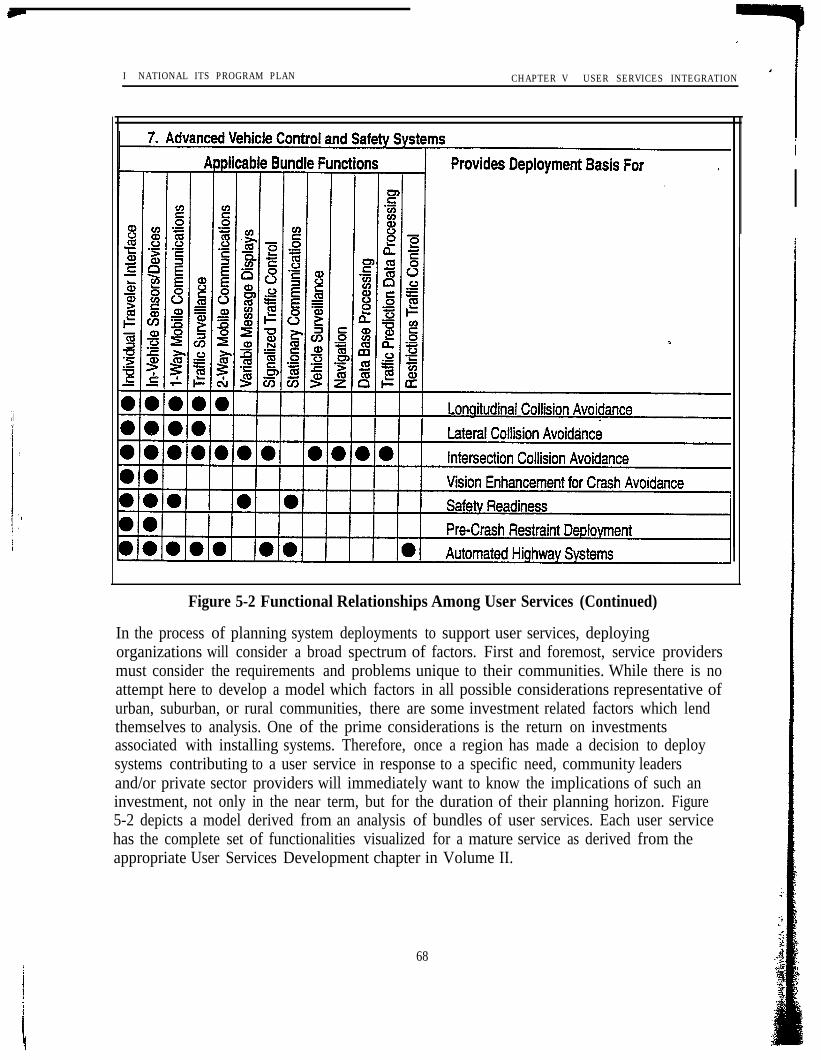
I NATIONAL ITS PROGRAM PLAN CHAPTER V USER SERVICES INTEGRATION
Figure 5-2 Functional Relationships Among User Services (Continued)
In the process of planning system deployments to support user services, deployingorganizations will consider a broad spectrum of factors. First and foremost, service providersmust consider the requirements and problems unique to their communities. While there is noattempt here to develop a model which factors in all possible considerations representative ofurban, suburban, or rural communities, there are some investment related factors which lendthemselves to analysis. One of the prime considerations is the return on investmentsassociated with installing systems. Therefore, once a region has made a decision to deploysystems contributing to a user service in response to a specific need, community leadersand/or private sector providers will immediately want to know the implications of such aninvestment, not only in the near term, but for the duration of their planning horizon. Figure5-2 depicts a model derived from an analysis of bundles of user services. Each user servicehas the complete set of functionalities visualized for a mature service as derived from theappropriate User Services Development chapter in Volume II.
68


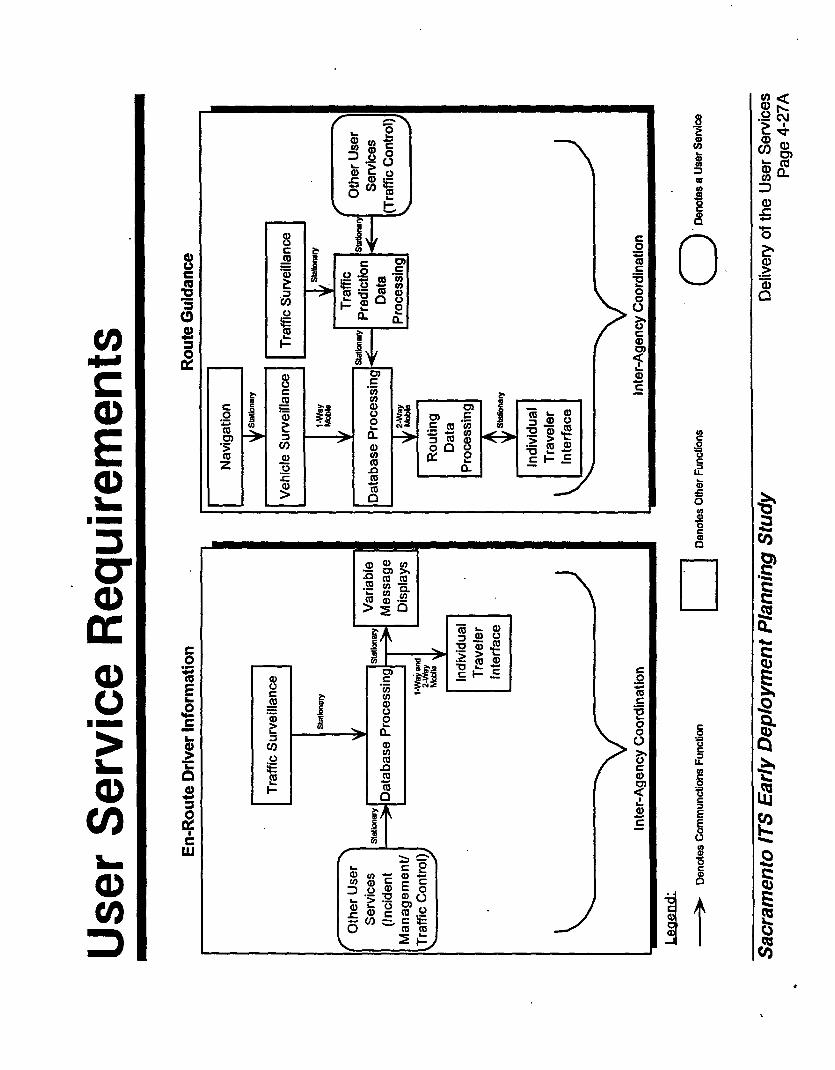
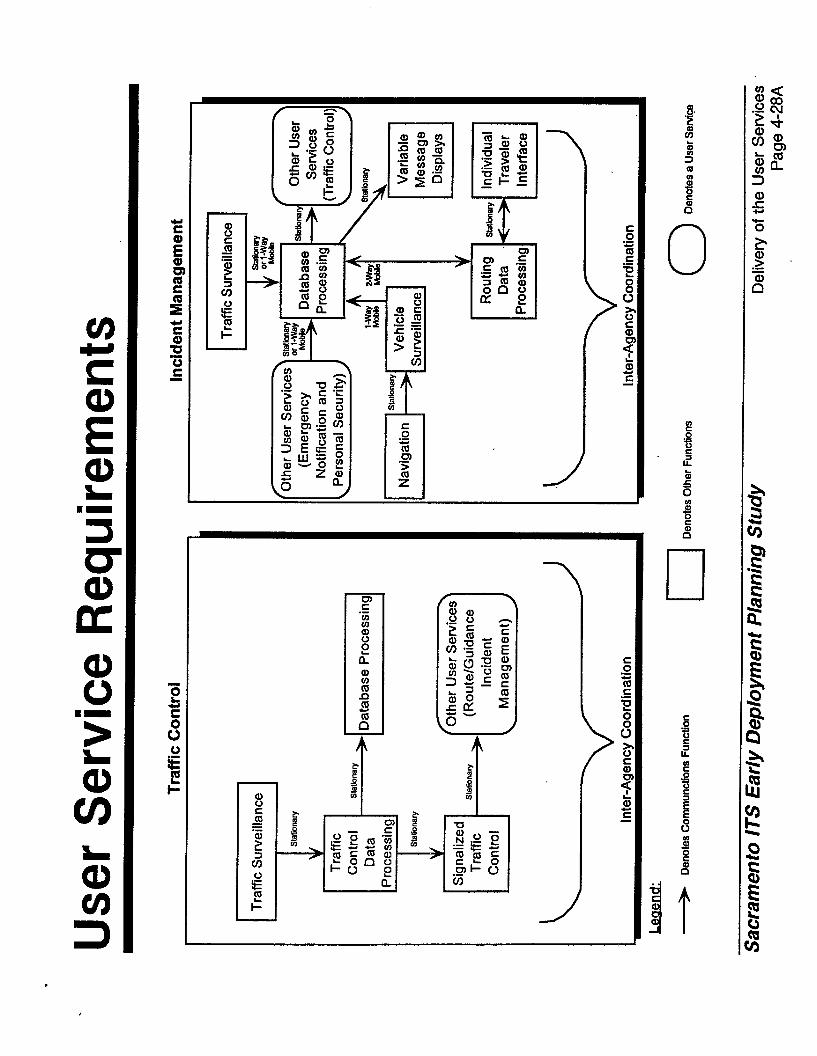

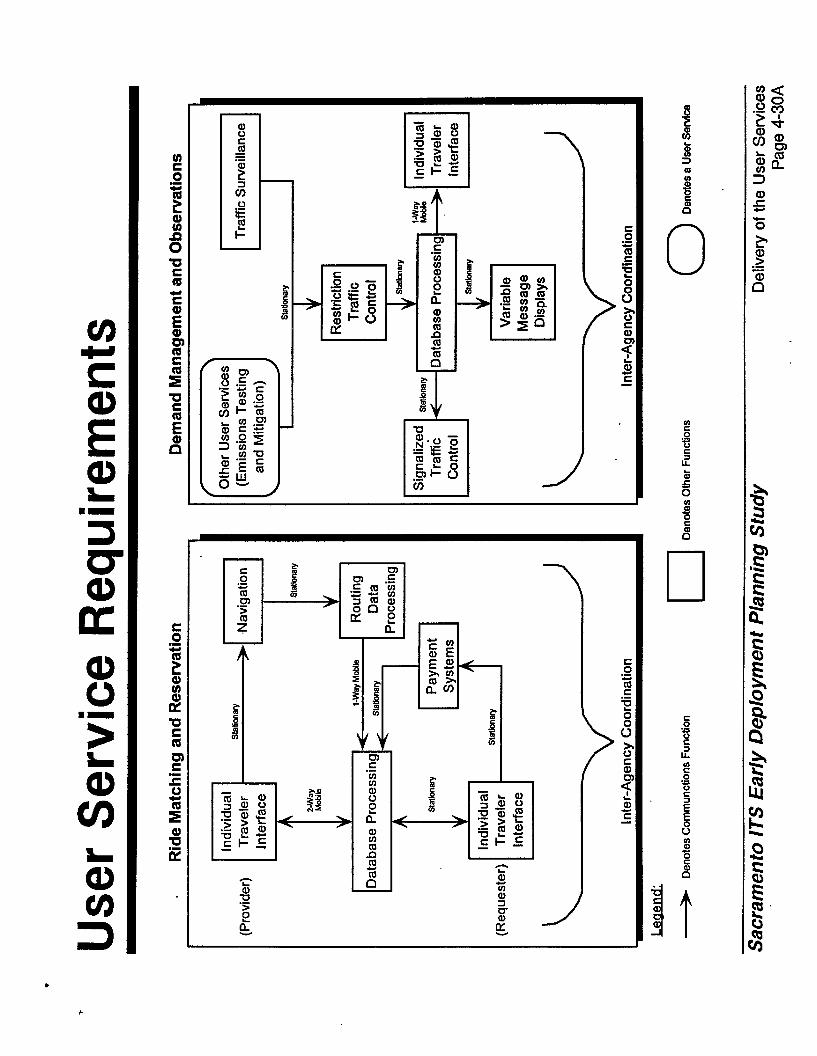
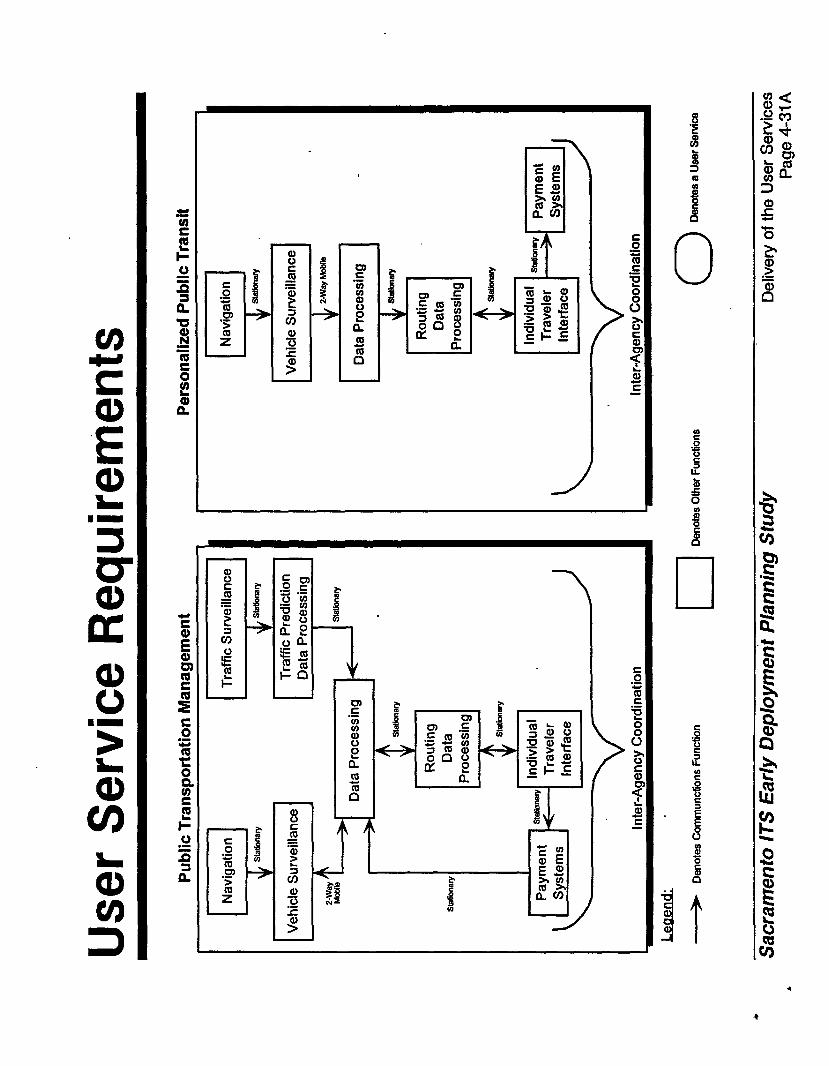
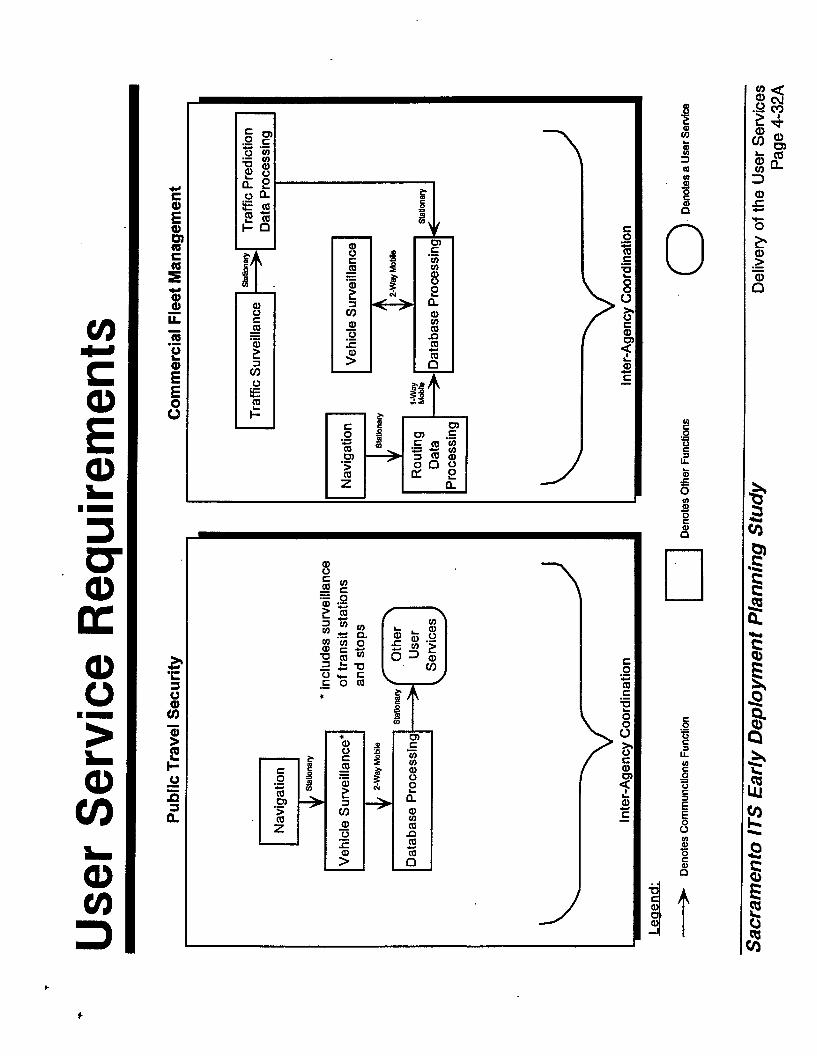
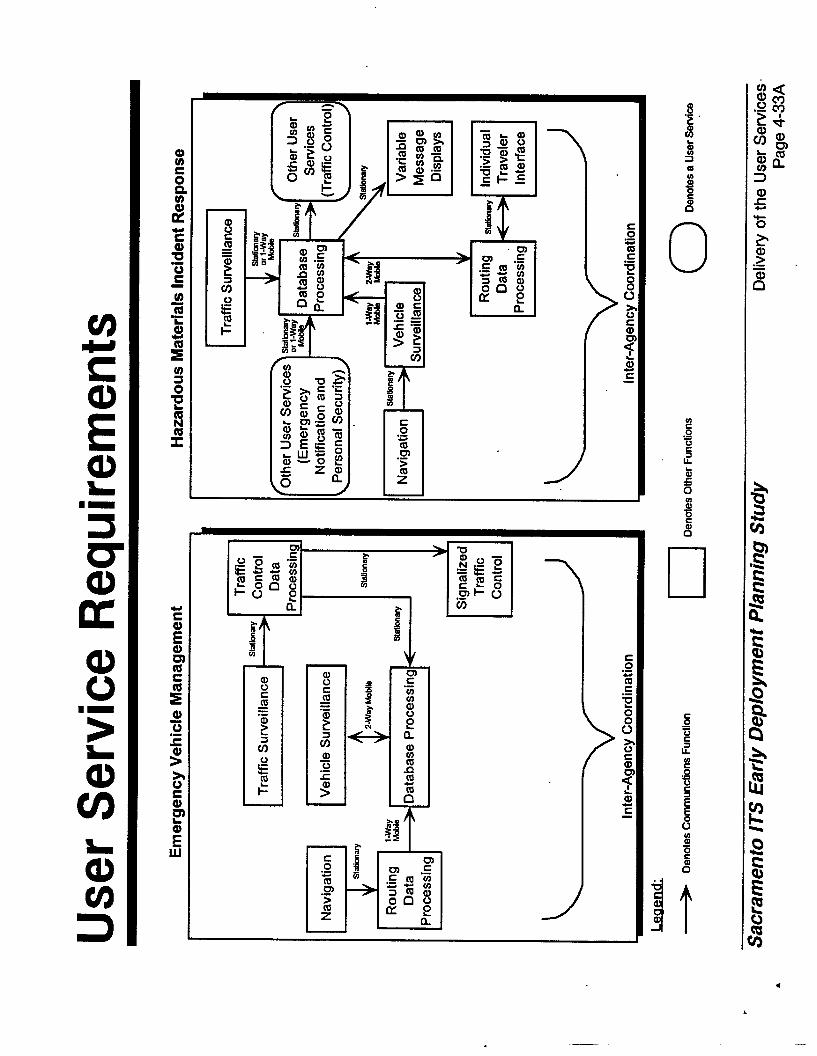

Sacramento Area Council of Governments
Michael Hoffacker, Executive Director CarI Kuhn, Deputy Executive Director
The Sacramento ITS Early Deployment Planning Study was co-sponsored by:
California Highway Patrol Valley DivisionCaltrans District 3Sacramento Area Council of Governments
The Project was funded, by a grant from the Federal Highway Administration, with matching fundsprovided by SACOG and Caltrans.
Coordination Team for the Project:
Kevin Green, Commander, Sacramento Communications Center, California Highway Patrol Valley DivisionMike Evans, District Division Chief, Operations, Caltrans District 3Joanne Koegel, Director of Transportation and Air Quality, Sacramento Area Council of Governments
SACOG Project Staff
Kenneth Hough, Planning Manager,*Bruce Griesenbeck, Senior Transportation AnalystDoug Reed, Transportation PlannerFedolia Harris, Transportation PlannerPatrice Van Dam, Graphics CoordinatorBev Budig, Secretary IVKelly Whitaker, Administrative ClerkMaria Colomy, Administrative Clerk
*Project Manager
The Technical Consultant for the Project was JHK Associates, Emeryville, CA
JHK Project Staff
James Schmidt, Associate Vice PresidentMike Holling, Senior AssociateRon Mikalson, Senior Transportation Engineer