2015 - Costs and Benefits of MDOT Intelligent Transportation System Deployments
1.1.1.1.1.1
Intelligent Transportation Systems Benefits, Costs, and Lessons Learned 2017 Update Report www.its.dot.gov/index.htm Final Report — March 2017 Publication Number: FHWA-JPO-17-500
Produced by Noblis, Inc. U.S. Department of Transportation ITS Joint Program Office
Cover Photo Credit:
Top Row (Left to right) – ThinkStock, U.S. DOT, ThinkStock Middle Row (Left to Right) – U.S. DOT, ThinkStock, ThinkStock Bottom Row (Left to Right) – U.S. DOT, ThinkStock, ThinkStock
Notice
This document is disseminated under the sponsorship of the Department of Transportation in the interest of information exchange. The United States Government assumes no liability for its contents or use thereof. The U.S. Government is not endorsing any manufacturers, products, or services cited herein and any trade name that may appear in the work has been included only because it is essential to the contents of the work.
Technical Report Documentation Page
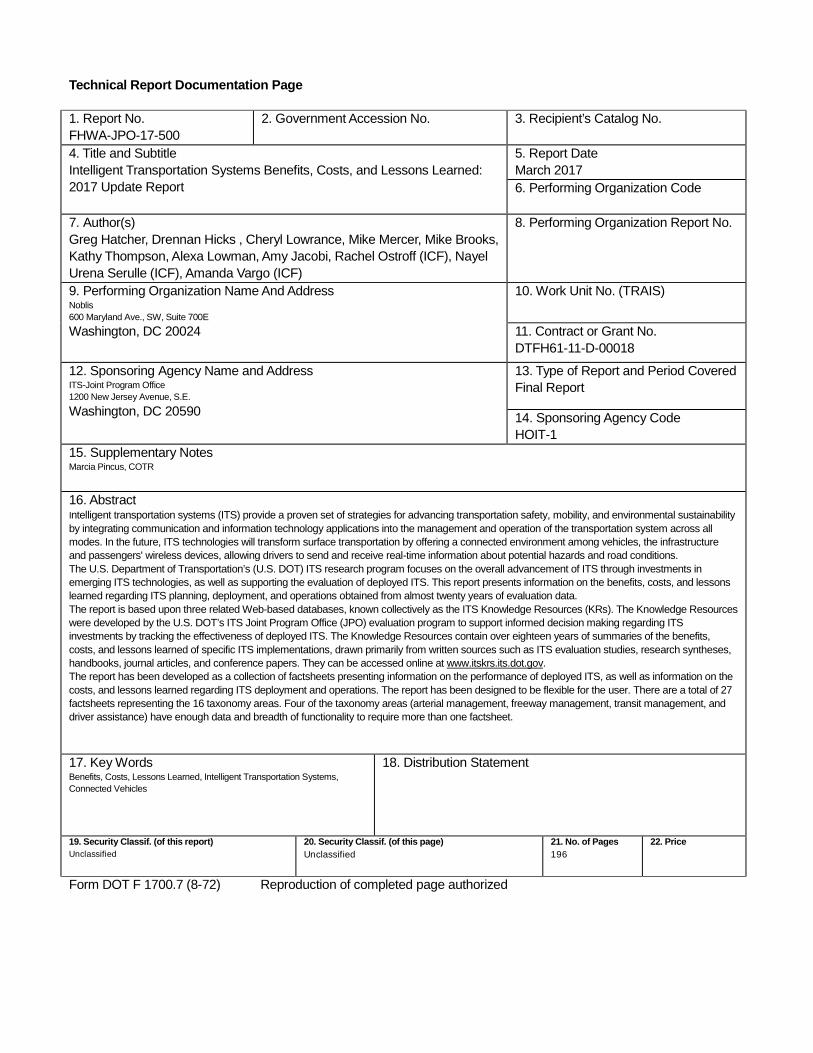
1. Report No. FHWA-JPO-17-500
2. Government Accession No.
3. Recipient’s Catalog No.
4. Title and Subtitle Intelligent Transportation Systems Benefits, Costs, and Lessons Learned: 2017 Update Report
5. Report Date March 2017 6. Performing Organization Code
7. Author(s) Greg Hatcher, Drennan Hicks , Cheryl Lowrance, Mike Mercer, Mike Brooks, Kathy Thompson, Alexa Lowman, Amy Jacobi, Rachel Ostroff (ICF), Nayel Urena Serulle (ICF), Amanda Vargo (ICF)
8. Performing Organization Report No.
9. Performing Organization Name And Address Noblis 600 Maryland Ave., SW, Suite 700E
Washington, DC 20024
10. Work Unit No. (TRAIS)
11. Contract or Grant No. DTFH61-11-D-00018
12. Sponsoring Agency Name and Address ITS-Joint Program Office 1200 New Jersey Avenue, S.E.
Washington, DC 20590
13. Type of Report and Period Covered Final Report
14. Sponsoring Agency Code HOIT-1
15. Supplementary Notes Marcia Pincus, COTR
16. Abstract Intelligent transportation systems (ITS) provide a proven set of strategies for advancing transportation safety, mobility, and environmental sustainability by integrating communication and information technology applications into the management and operation of the transportation system across all modes. In the future, ITS technologies will transform surface transportation by offering a connected environment among vehicles, the infrastructure and passengers' wireless devices, allowing drivers to send and receive real-time information about potential hazards and road conditions. The U.S. Department of Transportation’s (U.S. DOT) ITS research program focuses on the overall advancement of ITS through investments in emerging ITS technologies, as well as supporting the evaluation of deployed ITS. This report presents information on the benefits, costs, and lessons learned regarding ITS planning, deployment, and operations obtained from almost twenty years of evaluation data. The report is based upon three related Web-based databases, known collectively as the ITS Knowledge Resources (KRs). The Knowledge Resources were developed by the U.S. DOT’s ITS Joint Program Office (JPO) evaluation program to support informed decision making regarding ITS investments by tracking the effectiveness of deployed ITS. The Knowledge Resources contain over eighteen years of summaries of the benefits, costs, and lessons learned of specific ITS implementations, drawn primarily from written sources such as ITS evaluation studies, research syntheses, handbooks, journal articles, and conference papers. They can be accessed online at www.itskrs.its.dot.gov. The report has been developed as a collection of factsheets presenting information on the performance of deployed ITS, as well as information on the costs, and lessons learned regarding ITS deployment and operations. The report has been designed to be flexible for the user. There are a total of 27 factsheets representing the 16 taxonomy areas. Four of the taxonomy areas (arterial management, freeway management, transit management, and driver assistance) have enough data and breadth of functionality to require more than one factsheet.
17. Key Words Benefits, Costs, Lessons Learned, Intelligent Transportation Systems, Connected Vehicles
18. Distribution Statement
19. Security Classif. (of this report) Unclassified
20. Security Classif. (of this page) Unclassified
21. No. of Pages 196
22. Price
Form DOT F 1700.7 (8-72) Reproduction of completed page authorized

U.S. Department of Transportation Intelligent Transportation System Joint Program Office
ITS Benefits, Costs, and Lessons Learned: 2017 Update Report – Final | i
Preface/Acknowledgements
This report was produced as an outcome of work performed by Noblis for United States Department of Transportation (U.S. DOT) Intelligent Transportation Systems Joint Program Office (ITS JPO) under contract DTFH61-11-D-00018, as part of the ITS Evaluation program. The authors wish to thank Marcia Pincus of the U.S. DOT for her expertise and support, as well as the many transportation industry personnel who contributed evaluation findings to the ITS Knowledge Resources.
Joint Program Office U.S. Department of Transportation, Research and Innovative Technology Administration
ITS Benefits, Costs, and Lessons Learned: Update Report - Final | 1
Table of Contents Executive Summary ................................................................................................................ 1
FINDINGS ........................................................................................................................................1 ITS EVALUATION HIGHLIGHTS .........................................................................................................3
1 Introduction ..................................................................................................................... 9 1.1 ITS LEADS THE WAY ...............................................................................................................9 1.2 THE 2017 ITS BENEFITS, COSTS AND LESSONS LEARNED FACTSHEETS ................................9 1.3 MEASURING ITS PERFORMANCE .......................................................................................... 10 1.4 ITS KNOWLEDGE RESOURCES ............................................................................................. 10 1.5 ITS TAXONOMY ..................................................................................................................... 11 1.6 REPORT ORGANIZATION ........................................................................................................ 11 1.7 NEW TOPICS ........................................................................................................................ 12
2 Connected Vehicle – Safety ......................................................................................... 15 2.1 INTRODUCTION ..................................................................................................................... 15 2.2 BENEFITS ............................................................................................................................. 17 2.3 COSTS .................................................................................................................................. 19 2.4 CASE STUDY / LESSONS LEARNED – SAFETY PILOT MODEL DEPLOYMENT (ANN ARBOR)/USDOT ......................................................................................................................... 19
3 Connected Vehicle – Mobility ...................................................................................... 21 3.1 INTRODUCTION ..................................................................................................................... 21 3.2 BENEFITS ............................................................................................................................. 24 3.4 CASE STUDY ........................................................................................................................ 26
4 Connected Vehicle – Environment.............................................................................. 27 4.1 INTRODUCTION ..................................................................................................................... 27 4.2 BENEFITS ............................................................................................................................. 29 4.3 CASE STUDY - GLIDEPATH – ECO-APPROACH AND DEPARTURE AT SIGNALIZED INTERSECTIONS ........................................................................................................................... 31
5 Automated Vehicles ...................................................................................................... 33 5.1 INTRODUCTION ..................................................................................................................... 33 5.2 BENEFITS ............................................................................................................................. 36 5.3 COSTS .................................................................................................................................. 36 5.4 CASE STUDY – PREPARING A NATION FOR AUTONOMOUS VEHICLES (2015-00977) ............ 37
6 Smart Cities ................................................................................................................... 40 6.1 INTRODUCTION ..................................................................................................................... 40 6.2 BENEFITS ............................................................................................................................. 41 6.3 COSTS .................................................................................................................................. 41 6.4 LESSONS LEARNED .............................................................................................................. 42 6.5 CASE STUDY ........................................................................................................................ 42
7 Accessible Transportation ........................................................................................... 44 7.1 INTRODUCTION ..................................................................................................................... 44 7.2 BENEFITS ............................................................................................................................. 44 7.3 CASE STUDY ........................................................................................................................ 45
8 Mobility on Demand (MOD) .......................................................................................... 48
Table of Contents
U.S. Department of Transportation Intelligent Transportation System Joint Program Office
ITS Benefits, Costs, and Lessons Learned: 2017 Update Report – Final | 2
8.1 INTRODUCTION ..................................................................................................................... 48 8.2 BENEFITS ............................................................................................................................. 50 8.3 COSTS .................................................................................................................................. 51 8.4 LESSONS LEARNED .............................................................................................................. 51 8.5 CASE STUDY – UBIGO (GOTHENBURG, SWEDEN) ................................................................ 52
9 Arterial Management .................................................................................................... 54 9.1 OVERVIEW ............................................................................................................................ 54
Introduction ....................................................................................... 54 Benefits ............................................................................................. 55 Costs ................................................................................................. 57 Lessons Learned .............................................................................. 58
Case Study – Utah DOT Weather Responsive Traffic Signal Timing 59
9.2 TRAFFIC CONTROL ............................................................................................................... 61 Introduction ....................................................................................... 61 Benefits ............................................................................................. 62 Costs ................................................................................................. 64 Lessons Learned .............................................................................. 65 Case Study - Eco-Traffic Signal Timing: Preliminary Modeling
Results .......................................................................................................... 66 10 Freeway Management .................................................................................................. 68
10.1 OVERVIEW ................................................................................................................... 68 Introduction ....................................................................................... 68 Benefits ............................................................................................. 68 Costs ................................................................................................. 71 Lessons Learned .............................................................................. 73 Case Study - Kansas City Ramp Metering Implementation ............ 74
10.2 INTEGRATED CORRIDOR MANAGEMENT ....................................................................... 76 Introduction ....................................................................................... 76 Benefits ............................................................................................. 76 Costs ................................................................................................. 77 Lessons Learned .............................................................................. 80 Case Study - ICM Control of the I-394 and TH 55 corridor in
Minneapolis, Minnesota (2013-00868) .......................................................... 82 11 Roadway Operations and Maintenance ..................................................................... 84
11.1 INTRODUCTION ............................................................................................................. 84 11.2 BENEFITS ..................................................................................................................... 84 11.3 COSTS ......................................................................................................................... 87 11.4 LESSONS LEARNED ...................................................................................................... 87 11.5 CASE STUDY - SAFETRIP 21 INITIATIVE ........................................................................ 88
12 Crash Prevention and Safety ....................................................................................... 90 12.1 INTRODUCTION ............................................................................................................. 90 12.2 BENEFITS ..................................................................................................................... 91 12.3 COSTS ......................................................................................................................... 95
Table of Contents
U.S. Department of Transportation Intelligent Transportation System Joint Program Office
ITS Benefits, Costs, and Lessons Learned: 2017 Update Report – Final | 3
12.4 LESSONS LEARNED ...................................................................................................... 96 12.5 CASE STUDY - MINNESOTA’S COOPERATIVE INTERSECTION COLLISION AVOIDANCE SYSTEM – STOP SIGN ASSIST (CICAS-SSA) ............................................................................. 97
13 Road Weather Management......................................................................................... 99 13.1 INTRODUCTION ............................................................................................................. 99 13.2 BENEFITS ................................................................................................................... 100 13.3 COSTS ....................................................................................................................... 101 13.4 LESSONS LEARNED .................................................................................................... 103 13.5 CASE STUDY - AN EVALUATION OF WEATHER RESPONSIVE TRAFFIC MANAGEMENT (WRTM) STRATEGIES IN OGDEN, UTAH..................................................................................... 103
14 Transit Management ................................................................................................... 105 14.1 OPERATIONS AND FLEET MANAGEMENT ..................................................................... 105
Introduction ..................................................................................... 105 Benefits ........................................................................................... 105 Costs ............................................................................................... 107 Lessons Learned ............................................................................ 107 Case Study - Mobility Services for All-Americans (MSAA)
Coordination Simulation Study .................................................................... 107 14.2 INFORMATION DISSEMINATION .................................................................................... 108
Introduction ..................................................................................... 108 Benefits ........................................................................................... 108 Costs ............................................................................................... 110 Lessons Learned ............................................................................ 111 Case Study – TransitScreen .......................................................... 111
15 Transportation Management Center ......................................................................... 113 15.1 INTRODUCTION ............................................................................................................ 113 15.2 BENEFITS .................................................................................................................... 114 15.3 COSTS ........................................................................................................................ 115 15.4 LESSONS LEARNED ..................................................................................................... 116 15.5 CASE STUDY - TRANSCOM’S DFE-SPATEL DATA ANALYSIS TOOL ......................... 116
16 Alternative Fuels ......................................................................................................... 118 16.1 INTRODUCTION ............................................................................................................ 118 16.2 BENEFITS ................................................................................................................... 120 16.3 COSTS ....................................................................................................................... 121 16.4 LESSONS LEARNED .................................................................................................... 121 16.5 CASE STUDY - THE I-710 CORRIDOR PROJECT: ZERO EMISSIONS CORRIDOR .......... 121 16.6 CASE STUDY – FLASH-CHARGING ELECTRIC BUSES ................................................. 122
17 Traffic Incident Management ..................................................................................... 124 17.1 INTRODUCTION ........................................................................................................... 124 17.2 BENEFITS ................................................................................................................... 124 17.3 COSTS ....................................................................................................................... 128 17.4 LESSONS LEARNED .................................................................................................... 129 17.5 CASE STUDY - MOBILE FIELD REPORTING/ARIZONA PUBLIC SAFETY ......................... 130
18 Emergency Management ........................................................................................... 131 18.1 INTRODUCTION ........................................................................................................... 131
Table of Contents
U.S. Department of Transportation Intelligent Transportation System Joint Program Office
ITS Benefits, Costs, and Lessons Learned: 2017 Update Report – Final | 4
18.2 BENEFITS ................................................................................................................... 131 18.3 COSTS ....................................................................................................................... 132 18.4 LESSONS LEARNED .................................................................................................... 133 18.5 CASE STUDY – R.E.S.C.U.M.E. ................................................................................ 134
19 Traveler Information .................................................................................................... 136 19.1 INTRODUCTION ........................................................................................................... 136 19.2 BENEFITS ................................................................................................................... 136 19.3 COSTS ....................................................................................................................... 137 19.4 LESSONS LEARNED .................................................................................................... 138 19.5 CASE STUDY - I-64 FULL CLOSURE – ST. LOUIS COUNTY, MISSOURI ........................ 138
20 Driver Assistance ........................................................................................................ 140 20.1 CONNECTED ECO DRIVING, INTELLIGENT SPEED CONTROL, ADAPTIVE CRUISE CONTROL, PLATOONING ............................................................................................................ 140
Introduction ..................................................................................... 140 Benefits ........................................................................................... 141 Costs ............................................................................................... 142 Case Study - Safe Road Trains for the Environment (SARTRE)
(2013-00865) ............................................................................................... 142 20.2 NAVIGATION / ROUTE GUIDANCE, DRIVER COMMUNICATIONS, AND IN-VEHICLE MONITORING ............................................................................................................................. 143
Introduction ..................................................................................... 143 Benefits ........................................................................................... 144 Costs ............................................................................................... 146 Lessons Learned ............................................................................ 147 Case Study - Sampling of Driver Assistance Safety Applications . 147
21 Information Management ........................................................................................... 150 21.1 INTRODUCTION ........................................................................................................... 150 21.2 BENEFITS ................................................................................................................... 151 21.3 COSTS ....................................................................................................................... 152 21.4 LESSONS LEARNED .................................................................................................... 153 21.5 CASE STUDY – REGIONAL INTEGRATED TRANSPORTATION INFORMATION SYSTEM (RITIS) .................................................................................................................................. 154
22 Commercial Vehicle Operations ................................................................................ 155 22.1 INTRODUCTION ........................................................................................................... 155 22.2 BENEFITS ................................................................................................................... 155 22.3 COSTS ....................................................................................................................... 157 22.4 CASE STUDY - REGIONAL TRUCK PARKING INFORMATION AND MANAGEMENT SYSTEM 158
23 Intermodal Freight ....................................................................................................... 161 23.1 INTRODUCTION ........................................................................................................... 161 23.2 BENEFITS ................................................................................................................... 161 23.3 COSTS ....................................................................................................................... 163 23.4 LESSONS LEARNED .................................................................................................... 165
24 Electronic Payment and Pricing ................................................................................ 168 24.1 INTRODUCTION ........................................................................................................... 168 24.2 BENEFITS ................................................................................................................... 168
Table of Contents
U.S. Department of Transportation Intelligent Transportation System Joint Program Office
ITS Benefits, Costs, and Lessons Learned: 2017 Update Report – Final | 5
24.3 COSTS ....................................................................................................................... 170 24.4 LESSONS LEARNED .................................................................................................... 172 24.5 CASE STUDY - MILEAGE-BASED USER FEE (MBUF) PILOT PROJECT ........................ 173
References ........................................................................................................................... 175 APPENDIX A. List of Acronyms .................................................................................... 182
Table of Contents
U.S. Department of Transportation Intelligent Transportation System Joint Program Office
ITS Benefits, Costs, and Lessons Learned: 2017 Update Report – Final | 6
List of Tables Table ES-1: Summaries in the Knowledge Resources Databases. ......................................... 2 Table ES-2: Summaries by Taxonomy/Application Area. ......................................................... 2 Table 2-1: CV Safety benefits .................................................................................................. 19 Table 3-1: Summary of DMA Bundle Prototype Benefits ........................................................ 25 Table 4-1: Summary of AERIS Modeling Results ................................................................... 29 Table 4-2: Relative Savings in Fuel Consumption (%) between Different Driving Modes for
the GlidePath Prototype Application ............................................................................... 32 Table 5-1: Benefits and Costs of Autonomous Vehicles with Increasing Market Share ......... 37 Table 8-1: MOD Sandbox Program Grantees and their Proposed Projects .......................... 49 Table 9-1: Benefits of Arterial Management. ........................................................................... 56 Table 9-2: Benefit-cost Ratios for selected Traffic Control Systems. ...................................... 64 Table 9-3 - Adaptive Signal Control Project Costs. ................................................................. 65 Table 10-1: Selected Benefits of Ramp Metering in Kansas City. .......................................... 69 Table 10-2: Selected Benefits of Variable Speed Limit Systems on Freeways. ..................... 70 Table 10-3: Selected Benefits of Freeway Management. ....................................................... 71 Table 10-4: I-70 Corridor ITS Project - Estimated Costs (2013-00287). ................................ 72 Table 10-5: Benefits of ICM. .................................................................................................... 77 Table 10-6: Cost Estimates for ICM Implementations. ........................................................... 77 Table 10-7: Combined ICM Strategies, I-880 Corridor Estimate (2009-00194). .................... 78 Table 10-8: Simulation with a 5 percent increase in freeway demand ................................... 83 Table 10-9: Simulation with a 5 percent decrease in freeway demand .................................. 83 Table 10-10: Summary of network performance over entire simulation period (7:00-9:00
AM) .................................................................................................................................. 83 Table 11-1: System Costs for Smart Work Zones. .................................................................. 87 Table 12-1: Selected Benefits for Crash Prevention and Safety Strategies. .......................... 92 Table 12-2: Selected Benefits for In-vehicle Safety Technologies. ......................................... 93 Table 12-3: System Costs for Crash Prevention Systems. ..................................................... 96 Table 13-1: Benefit-to-Cost Ratios of Road Weather Management Strategies. .................. 100 Table 13-2: Public Agency Consumers of Private Sector Data. ........................................... 102 Table 16-1: Alternative Fueling Stations in the United States (Source: U.S. DOE Alternative
Fuels Data Center). ....................................................................................................... 119 Table 17-1: Benefit-Cost Ratios for Incident Management Systems. ................................... 125 Table 17-2: Selected Benefits for Incident Management Strategies. ................................... 126 Table 17-3: Annual Operating Costs for Incident Management Systems............................. 128 Table 18-1: Virginia Crash Data System Costs. .................................................................... 132 Table 20-1: Benefits of Navigation/Route Guidance. ............................................................ 144 Table 20-2: Benefits of In-Vehicle Monitoring. ....................................................................... 145 Table 21-1: Benefits of Information Management. ................................................................ 151 Table 21-2: System Costs of Archived Data Management Systems. ................................... 152 Table 21-3: Selected Archived Data Management Costs. .................................................... 153 Table 22-1: TPIMS Deployment Corridors. ........................................................................... 159 • Table 22-2: TPIMS Benefits [5] ........................................ Error! Bookmark not defined. Table 22-3: TPIMS Costs [5] ................................................................................................. 160
Table of Contents
U.S. Department of Transportation Intelligent Transportation System Joint Program Office
ITS Benefits, Costs, and Lessons Learned: 2017 Update Report – Final | 7
Table 23-1: Estimated and Minimum Estimated Monthly Per Truck Benefits Derived Using Wireless Communications with GPS Vehicle Positioning System. .............................. 163
Table 23-2: Per Truck-Specific Technology Costs (Wireless Communications with GPS Tracking Capabilities). ................................................................................................... 163
Table 23-3: Costs, Benefits, Benefit-Cost Ratios, and Payback Periods by Industry Segment (Wireless Communications with GPS Tracking Capabilities). ...................................... 164
Table 24-1: Benefit-to-Cost Ratios of Congestion Pricing Strategies. .................................. 169 Table 24-2: Congestion Pricing Capital Costs. ...................................................................... 171 Table 24-3: Congestion Pricing Operating Costs. ................................................................. 172 Table 24-4: Fee Structure for the Mileage-based User Fee ................................................. 174
List of Figures Figure 2-1: CV Application with do not pass warning on the vehicle dashboard (Source:
USDOT) ........................................................................................................................... 17 Figure 2-2: Estimated Range of Benefits for V2I Safety Applications (Targeted Annual
Crashes in U.S.). ............................................................................................................. 18 Figure 3-1: Locations of DMA Prototype Demonstrations ...................................................... 24 Figure 4-1: Eco-Lanes Concept (Source: USDOT) ................................................................ 28 Figure 4-2: AERIS Benefits ..................................................................................................... 30 Figure 4-3: Vehicle Used for Testing at TFHRC (Source: USDOT) ........................................ 31 Figure 5-1: Integration of CV and AV Technologies and Potential Benefits of Automation
(Source: USDOT and ITS Knowledge Resources) ........................................................ 36 Figure 9-1: Safety Benefit Metrics Used in Studies of Speed Enforcement (Source: ITS
Knowledge Resources). .................................................................................................. 55 Figure 9-2: Range of Benefits for Automated Red Light Running Enforcement (Source: ITS
Knowledge Resources). .................................................................................................. 57 Figure 9-3: Advanced Signal Control benefits found in the Knowledge Resource database
from 2003 to 2016 (Source: ITS Knowledge Resources). ............................................. 62 Figure 9-4: Adaptive Signal Control benefits found in the knowledge resource database from
2003 to 2016 (Source: ITS Knowledge Resources). ...................................................... 63 Figure 9-5: Diagram of the AERIS Eco-Traffic Signal Timing Application (Source: USDOT) 66 Figure 10-1: VMS on OR217 ATM Corridor. (Source: Oregon DOT [2]) ................................ 74 Figure 11-1: Work Zone ITS Benefits (Source: ITS Knowledge Resources). ........................ 85 Figure 12-1: Range of Benefits for Crash Avoidance Technologies (Source: ITS Knowledge
Resources). ..................................................................................................................... 94 Figure 12-2: Range of Crash Reduction Benefits from Collision Warning Systems (Source:
ITS Knowledge Resources). ........................................................................................... 94 Figure 14-1: Benefits of Transit Signal Priority Systems (Source: ITS Knowledge
Resources). ................................................................................................................... 106 Figure 14-2: Benefits of Providing Transit Traveler Information (Source: ITS Knowledge
Resources). ................................................................................................................... 110 Figure 15-1: Range of Benefits for Transportation Management Centers (Source: ITS
Knowledge Resources). ................................................................................................ 114
Table of Contents
U.S. Department of Transportation Intelligent Transportation System Joint Program Office
ITS Benefits, Costs, and Lessons Learned: 2017 Update Report – Final | 8
Figure 15-2: Range of Costs for Transportation Management Centers (Source: ITS Knowledge Resources). ................................................................................................ 115
Figure 15-3: DFE-SPATEL Trip Map and Congestion Graphs ............................................. 117 Figure 16-1: Inductive Charging. Position marking for a wireless charging system with coils
integrated in the road surface (Source: Conductix-Wampfler). .................................... 119 Figure 16-2: Proposed Catenary System for I-710 Zero-Emissions Corridor (Source:
Siemens Mobility). ......................................................................................................... 122 Figure 16-3: The TOSA electric bus stopped at a charging station in Geneva (Source: Asea
Brown Bovery). .............................................................................................................. 123 Figure 17-1: Range of Benefits of Traffic Incident Management (Source: ITS Knowledge
Resources). ................................................................................................................... 127 Figure 17-2: Range of Vehicle Delay and Fuel Consumption Benefits (Source: ITS
Knowledge Resources) ................................................................................................. 128 Figure 19-1: I-64 Full Closure General Information (Source: MoDOT, 2011). ...................... 139 Figure 20-1: Range of Benefits for Connected Eco-Driving, Intelligent Speed Control,
Adaptive Cruise Control, and Platooning (Source: ITS Knowledge Resources). ........ 141 Figure 20-2: Percentage of fuel savings of each vehicle in the platoon at varying gaps
(SARTRE Final Report). ................................................................................................ 143 Figure 20-3: Range of Costs for Connected Vehicle Technologies In-Vehicle and at
Intersections (Source: ITS Knowledge Resources)...................................................... 147 Figure 21-1: RITIS System Overview (Source: Maryland CATT Lab). ................................. 154 Figure 22-1: Summary of Benefits for Core ITD Functions (Source: U.S. DOT, 2008 [1]) .. 156 Figure 22-2: Regional TPIMS Deployment ........................................................................... 158 Figure 24-1: Range of Benefits for Congestion Pricing (Source: ITS Knowledge
Resources). ................................................................................................................... 170
Joint Program Office U.S. Department of Transportation, Research and Innovative Technology Administration
ITS Benefits, Costs, and Lessons Learned: Update Report - Final | 1
Executive Summary
Intelligent transportation systems (ITS) provide a proven set of strategies for advancing transportation safety, mobility, and environmental sustainability by integrating communication and information technology applications into the management and operation of the transportation system across all modes. In the future, ITS technologies will transform surface transportation by offering a connected environment among vehicles, the infrastructure and passengers' wireless devices, allowing drivers to send and receive real-time information about potential hazards and road conditions.
The U.S. Department of Transportation’s (U.S. DOT) ITS research program focuses on the overall advancement of ITS through investments in emerging ITS technologies, as well as supporting the evaluation of deployed ITS. This report presents information on the benefits, costs, and lessons learned regarding ITS planning, deployment, and operations obtained from almost twenty years of evaluation data.
The report is based upon three related Web-based databases, known collectively as the ITS Knowledge Resources (KRs). The Knowledge Resources were developed by the U.S. DOT’s ITS Joint Program Office (JPO) evaluation program to support informed decision making regarding ITS investments by tracking the effectiveness of deployed ITS. The Knowledge Resources contain over eighteen years of summaries of the benefits, costs, and lessons learned of specific ITS implementations, drawn primarily from written sources such as ITS evaluation studies, research syntheses, handbooks, journal articles, and conference papers. They can be accessed online at www.itskrs.its.dot.gov.
The report has been developed as a collection of factsheets presenting information on the performance of deployed ITS, as well as information on the costs and lessons learned regarding ITS deployment and operations. The report has been designed to be flexible for the user. The purpose is to make the information readily available, whether by accessing it through the web, a mobile device or tablet, or by printing sections on one or more application areas. There are a total of 27 factsheets representing the 16 taxonomy areas, plus seven “hot topics”. Four of the taxonomy areas (arterial management, freeway management, transit management, and driver assistance) have enough data to require more than one factsheet.
Findings
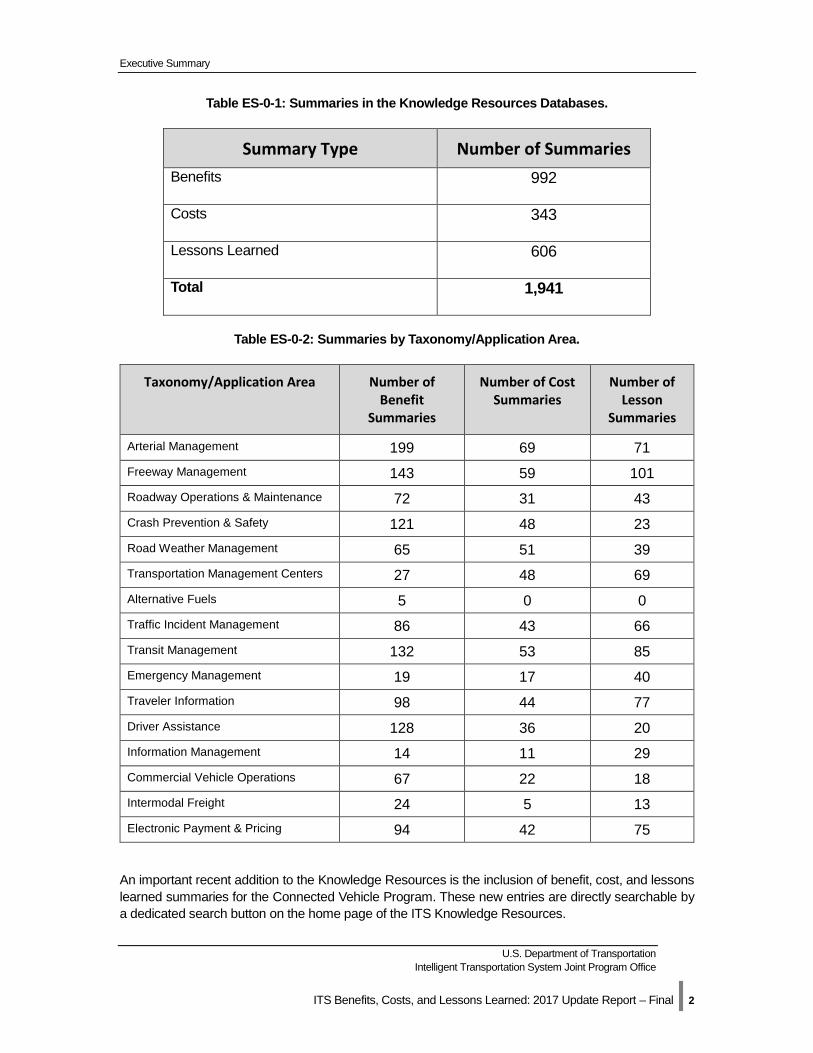
As of March 1, 2017, there were a total of 1,941 summaries of ITS benefits, costs, and lessons learned in the ITS Knowledge Resources databases from the United States and around the world, as shown in Table 1. Of the 1,941 summaries, 273 summaries have been added since the last report was completed in early 2014.
Executive Summary
U.S. Department of Transportation Intelligent Transportation System Joint Program Office
ITS Benefits, Costs, and Lessons Learned: 2017 Update Report – Final | 2
Table ES-0-1: Summaries in the Knowledge Resources Databases.
Summary Type Number of Summaries Benefits 992
Costs 343
Lessons Learned 606
Total 1,941
Table ES-0-2: Summaries by Taxonomy/Application Area.
Taxonomy/Application Area Number of Benefit
Summaries
Number of Cost Summaries
Number of Lesson
Summaries
Arterial Management 199 69 71 Freeway Management 143 59 101 Roadway Operations & Maintenance 72 31 43 Crash Prevention & Safety 121 48 23 Road Weather Management 65 51 39 Transportation Management Centers 27 48 69 Alternative Fuels 5 0 0 Traffic Incident Management 86 43 66 Transit Management 132 53 85 Emergency Management 19 17 40 Traveler Information 98 44 77 Driver Assistance 128 36 20 Information Management 14 11 29 Commercial Vehicle Operations 67 22 18 Intermodal Freight 24 5 13 Electronic Payment & Pricing 94 42 75
An important recent addition to the Knowledge Resources is the inclusion of benefit, cost, and lessons learned summaries for the Connected Vehicle Program. These new entries are directly searchable by a dedicated search button on the home page of the ITS Knowledge Resources.
Executive Summary
U.S. Department of Transportation Intelligent Transportation System Joint Program Office
ITS Benefits, Costs, and Lessons Learned: 2017 Update Report – Final | 3
ITS Evaluation Highlights In the 21 years that the ITS JPO has been tracking the evaluation of ITS technologies, there has been steady growth in the number of studies documenting the benefits, costs and lessons learned of ITS. Looking back over the last several years, the most recent additions to the ITS knowledge resources indicate the following evaluation highlights from each of the Application Areas and current hot topics:
Connected Vehicle – Safety
• NHTSA has released a notice of proposed rulemaking that would require auto manufacturers to begin installing V2V communications in their new vehicles, over a short implementation schedule.
• 70% of drivers in a large-scale field operational test (euroFOT) felt that forward collision warning systems increased safety.
• Lesson Learned: Clearly communicate requirements and testing procedures to connected vehicle device developers, and allow for industry input and iteration for less mature devices.
Connected Vehicle – Mobility
• The vision of the Dynamic Mobility Applications program is to expedite the development, testing, commercialization, and deployment of innovative mobility applications, fully leveraging both new technologies and federal investment to transform transportation system management, maximize the productivity of the system, and enhance the accessibility of individuals within the system.
• Six Dynamic Mobility Application bundles representing 17 connected vehicle applications concepts were developed, demonstrated and assessed to measure mobility impacts.
• During the small-scale demonstration of the INFLO DMA application bundle in Seattle, advanced in-vehicle queue warning messages reduced the need for participants to slow down or stop suddenly.
Connected Vehicle – Environment
• Employing a multi-modal approach, the AERIS Research Program aims to encourage the development of technologies and applications that support a more sustainable relationship between transportation and the environment chiefly through fuel use reductions and resulting emissions reductions.
• Together the Eco-Signal Operations applications provided up to 11% improvement in CO2 and fuel consumption reductions at full connected vehicle penetration.
Automated Vehicles
• Within the next 10 years it is likely that autonomous vehicles will be available to the general public.
• Automated vehicles can save more than 1000 lives annually with 10 percent market penetration.
• Autonomous vehicles, if fully deployed, can use intelligent intersections to manage approach speeds and reduce fuel consumption and emissions up to 50 percent.
• Self-driving capabilities will likely add several thousand dollars to a vehicle’s purchase price.
Executive Summary
U.S. Department of Transportation Intelligent Transportation System Joint Program Office
ITS Benefits, Costs, and Lessons Learned: 2017 Update Report – Final | 4
Smart Cities
• Smart Cities have the potential to integrate transportation, communications, environmental monitoring, utilities, public safety, and other city services by harnessing the power of data and communications technology.
• Deployments and pilot programs are commencing worldwide, with the essential aim of improving the daily lives and routines of residents.
Accessible Transportation
• The USDOT ATTRI Program is seeking to fund application development in four application areas: automation and robotics; safe intersection crossing; wayfinding and navigation; and pre-trip concierge and virtualization.
• Increased access to transportation options for people with disabilities helps not only people with disabilities but everyone as more people are able to gain access to jobs, healthcare, and participate in the economy.
Mobility on Demand
• Travel and mobility demands are evolving from an emphasis on private automobile ownership to more flexible, public and private options which incorporate shared-use and multimodal integration.
• A one-way carsharing impact study in the U.S and Canada found that participants were able to reduce GHG emissions by between 4 percent and 18 percent per household.
• Swedish start-up UbiGo offers subscribers everyday travel via public transport, car-sharing, rental car service, taxi and bicycle sharing, all integrated in one smartphone app and with a single invoice.
Arterial Management
• A Bay Area Rapid Transit (BART) smart parking system found that more efficient management of transit station parking lots improved parking space utilization rates and increased BART ridership.
• Automated enforcement continues to demonstrate that it is a successful, cost-effective means of reducing traffic accidents, injuries, and deaths.
• Adaptive Traffic Signal Systems coordinate control of traffic signals across a signal network, adjusting the lengths of signal phases based on prevailing traffic conditions.
• SPaT applications, used in the connected vehicle environment, have the potential to increase safety, mobility, and reduce environmental impact at traffic signals.
• Improved traffic signal control continues to be one of the most cost effective ways to improve safety and mobility in most jurisdictions.
Freeway Management
• ITS strategies and applications such as traffic surveillance systems, ramp meters, lane management applications, special event transportation management systems advanced communications, and automated speed limit enforcement are being used to actively manage traffic on our freeways today to influence traveler behavior in real-time improving safety, reducing emissions and improving system efficiency and reliability.
• Ramp Metering and variable speed limit (VSL) systems improve traffic flow and increase safety.
Executive Summary
U.S. Department of Transportation Intelligent Transportation System Joint Program Office
ITS Benefits, Costs, and Lessons Learned: 2017 Update Report – Final | 5
• Decision Support System scenarios modeled on the ICM Corridor in Dallas Texas show travel time savings of nine percent on arterials when vehicles divert from the freeway.
• Planning-level studies indicate that an effective combination of ICM strategies can be implemented for $7.5 million per year (annualized capital and O&M).
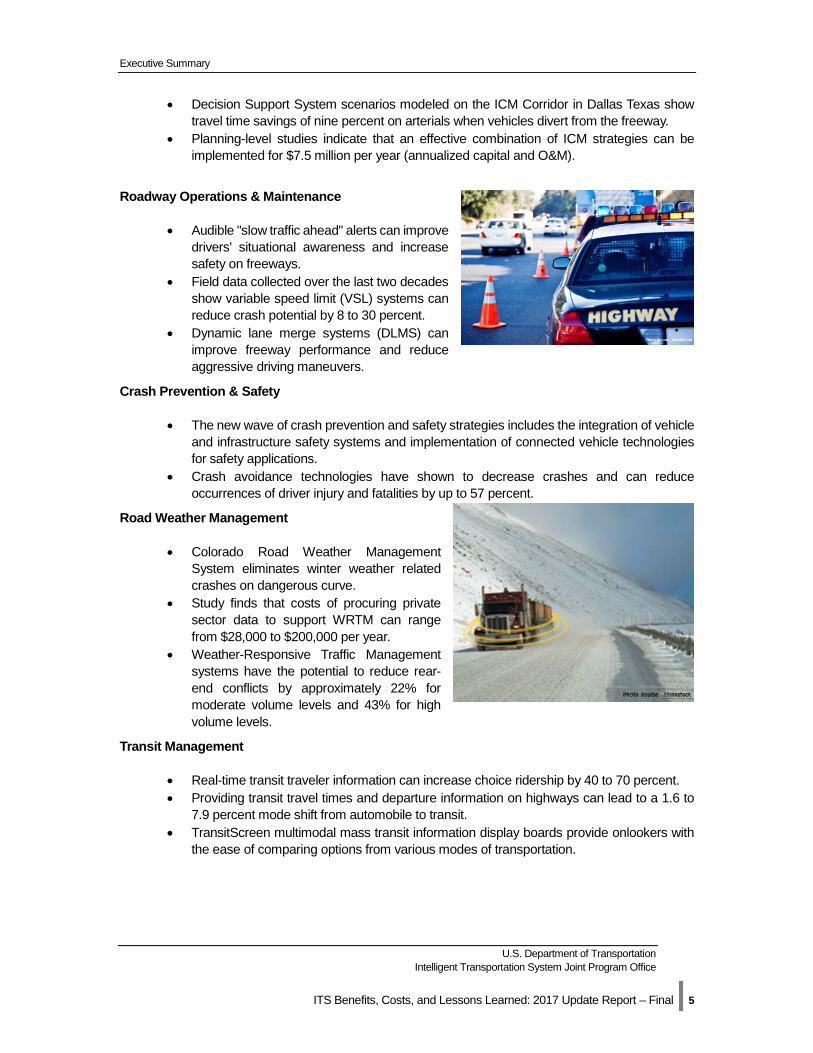
Roadway Operations & Maintenance
• Audible "slow traffic ahead" alerts can improve drivers' situational awareness and increase safety on freeways.
• Field data collected over the last two decades show variable speed limit (VSL) systems can reduce crash potential by 8 to 30 percent.
• Dynamic lane merge systems (DLMS) can improve freeway performance and reduce aggressive driving maneuvers.
Crash Prevention & Safety
• The new wave of crash prevention and safety strategies includes the integration of vehicle and infrastructure safety systems and implementation of connected vehicle technologies for safety applications.
• Crash avoidance technologies have shown to decrease crashes and can reduce occurrences of driver injury and fatalities by up to 57 percent.
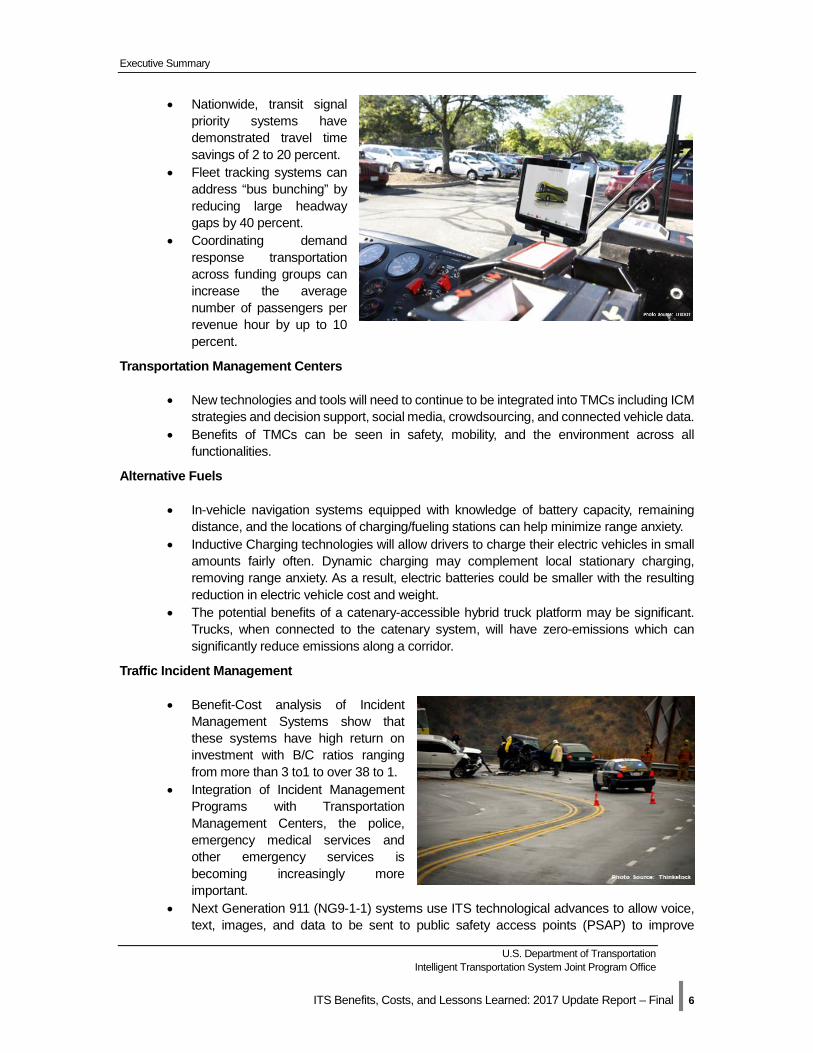
Road Weather Management
• Colorado Road Weather Management System eliminates winter weather related crashes on dangerous curve.
• Study finds that costs of procuring private sector data to support WRTM can range from $28,000 to $200,000 per year.
• Weather-Responsive Traffic Management systems have the potential to reduce rear-end conflicts by approximately 22% for moderate volume levels and 43% for high volume levels.
Transit Management
• Real-time transit traveler information can increase choice ridership by 40 to 70 percent. • Providing transit travel times and departure information on highways can lead to a 1.6 to
7.9 percent mode shift from automobile to transit. • TransitScreen multimodal mass transit information display boards provide onlookers with
the ease of comparing options from various modes of transportation.
Executive Summary
U.S. Department of Transportation Intelligent Transportation System Joint Program Office
ITS Benefits, Costs, and Lessons Learned: 2017 Update Report – Final | 6
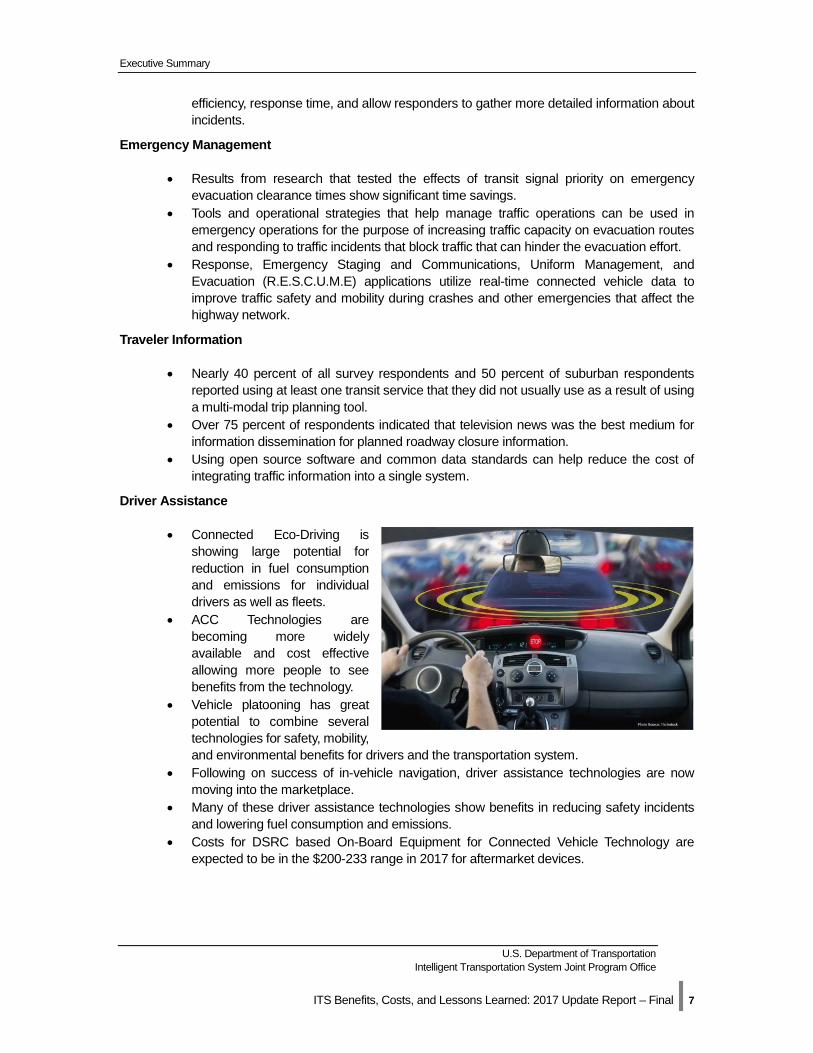
• Nationwide, transit signal priority systems have demonstrated travel time savings of 2 to 20 percent.
• Fleet tracking systems can address “bus bunching” by reducing large headway gaps by 40 percent.
• Coordinating demand response transportation across funding groups can increase the average number of passengers per revenue hour by up to 10 percent.
Transportation Management Centers
• New technologies and tools will need to continue to be integrated into TMCs including ICM strategies and decision support, social media, crowdsourcing, and connected vehicle data.
• Benefits of TMCs can be seen in safety, mobility, and the environment across all functionalities.
Alternative Fuels
• In-vehicle navigation systems equipped with knowledge of battery capacity, remaining distance, and the locations of charging/fueling stations can help minimize range anxiety.
• Inductive Charging technologies will allow drivers to charge their electric vehicles in small amounts fairly often. Dynamic charging may complement local stationary charging, removing range anxiety. As a result, electric batteries could be smaller with the resulting reduction in electric vehicle cost and weight.
• The potential benefits of a catenary-accessible hybrid truck platform may be significant. Trucks, when connected to the catenary system, will have zero-emissions which can significantly reduce emissions along a corridor.
Traffic Incident Management
• Benefit-Cost analysis of Incident Management Systems show that these systems have high return on investment with B/C ratios ranging from more than 3 to1 to over 38 to 1.
• Integration of Incident Management Programs with Transportation Management Centers, the police, emergency medical services and other emergency services is becoming increasingly more important.
• Next Generation 911 (NG9-1-1) systems use ITS technological advances to allow voice, text, images, and data to be sent to public safety access points (PSAP) to improve
Executive Summary
U.S. Department of Transportation Intelligent Transportation System Joint Program Office
ITS Benefits, Costs, and Lessons Learned: 2017 Update Report – Final | 7
efficiency, response time, and allow responders to gather more detailed information about incidents.
Emergency Management
• Results from research that tested the effects of transit signal priority on emergency evacuation clearance times show significant time savings.
• Tools and operational strategies that help manage traffic operations can be used in emergency operations for the purpose of increasing traffic capacity on evacuation routes and responding to traffic incidents that block traffic that can hinder the evacuation effort.
• Response, Emergency Staging and Communications, Uniform Management, and Evacuation (R.E.S.C.U.M.E) applications utilize real-time connected vehicle data to improve traffic safety and mobility during crashes and other emergencies that affect the highway network.
Traveler Information
• Nearly 40 percent of all survey respondents and 50 percent of suburban respondents reported using at least one transit service that they did not usually use as a result of using a multi-modal trip planning tool.
• Over 75 percent of respondents indicated that television news was the best medium for information dissemination for planned roadway closure information.
• Using open source software and common data standards can help reduce the cost of integrating traffic information into a single system.
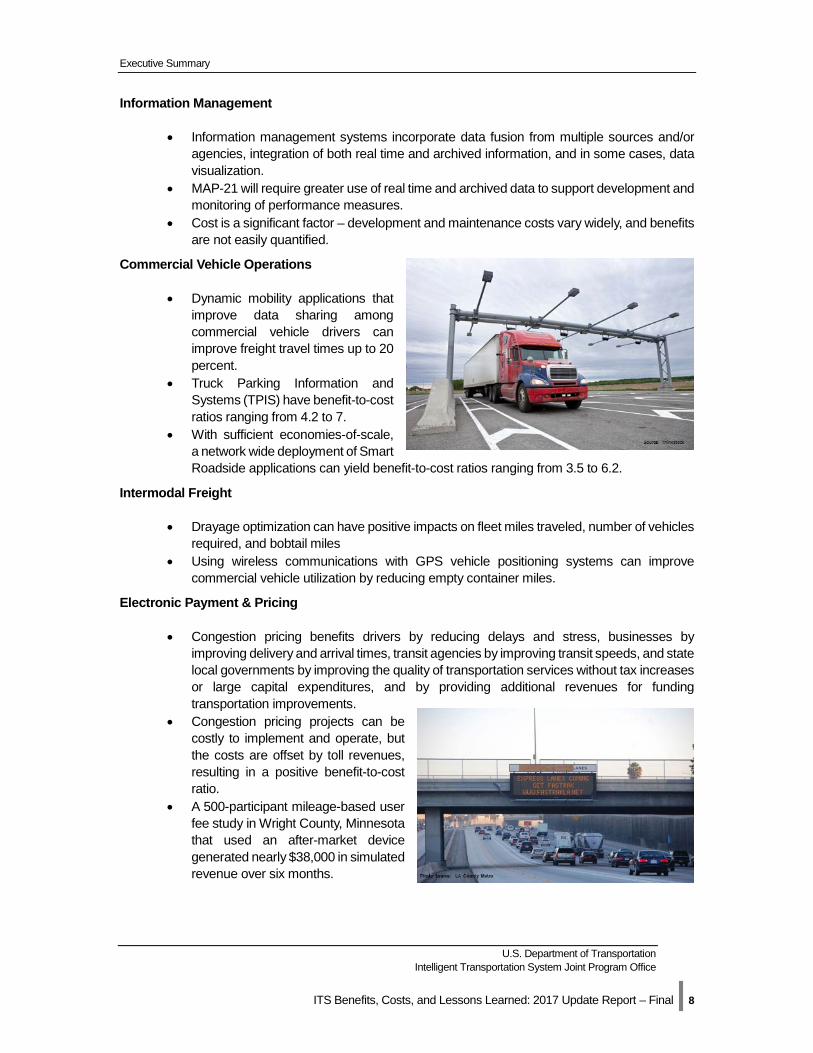
Driver Assistance
• Connected Eco-Driving is showing large potential for reduction in fuel consumption and emissions for individual drivers as well as fleets.
• ACC Technologies are becoming more widely available and cost effective allowing more people to see benefits from the technology.
• Vehicle platooning has great potential to combine several technologies for safety, mobility, and environmental benefits for drivers and the transportation system.
• Following on success of in-vehicle navigation, driver assistance technologies are now moving into the marketplace.
• Many of these driver assistance technologies show benefits in reducing safety incidents and lowering fuel consumption and emissions.
• Costs for DSRC based On-Board Equipment for Connected Vehicle Technology are expected to be in the $200-233 range in 2017 for aftermarket devices.
Executive Summary
U.S. Department of Transportation Intelligent Transportation System Joint Program Office
ITS Benefits, Costs, and Lessons Learned: 2017 Update Report – Final | 8
Information Management
• Information management systems incorporate data fusion from multiple sources and/or agencies, integration of both real time and archived information, and in some cases, data visualization.
• MAP-21 will require greater use of real time and archived data to support development and monitoring of performance measures.
• Cost is a significant factor – development and maintenance costs vary widely, and benefits are not easily quantified.
Commercial Vehicle Operations
• Dynamic mobility applications that improve data sharing among commercial vehicle drivers can improve freight travel times up to 20 percent.
• Truck Parking Information and Systems (TPIS) have benefit-to-cost ratios ranging from 4.2 to 7.
• With sufficient economies-of-scale, a network wide deployment of Smart Roadside applications can yield benefit-to-cost ratios ranging from 3.5 to 6.2.
Intermodal Freight
• Drayage optimization can have positive impacts on fleet miles traveled, number of vehicles required, and bobtail miles
• Using wireless communications with GPS vehicle positioning systems can improve commercial vehicle utilization by reducing empty container miles.
Electronic Payment & Pricing
• Congestion pricing benefits drivers by reducing delays and stress, businesses by improving delivery and arrival times, transit agencies by improving transit speeds, and state local governments by improving the quality of transportation services without tax increases or large capital expenditures, and by providing additional revenues for funding transportation improvements.
• Congestion pricing projects can be costly to implement and operate, but the costs are offset by toll revenues, resulting in a positive benefit-to-cost ratio.
• A 500-participant mileage-based user fee study in Wright County, Minnesota that used an after-market device generated nearly $38,000 in simulated revenue over six months.
Joint Program Office U.S. Department of Transportation, Research and Innovative Technology Administration
ITS Benefits, Costs, and Lessons Learned: Update Report - Final | 9
1 Introduction
In 2017, the U.S. transportation system continues to face the ongoing challenges of improving safety, meeting rising demand, and mitigating congestion and environmental impacts. Motor vehicle crashes continue to be a leading cause of death among Americans. Fatalities from motor vehicle crashes rose in 2015, the most recent year data is available. [1] With the continual challenges facing transportation and mobility new technologies are being applied to improve safety and mobility and reduce the impact on the environment. This update include new content for new important and emerging topics in the transportation sector including: accessible transportation, connected vehicles – safety, mobility, and environment, automation, smart cities, and mobility on demand.
1.1 ITS Leads the Way Over the past 30 years, the demand for the use of public roads has increased approximately 95 percent, as measured in vehicle miles traveled (VMT). Over this same period the number of lane miles on public roads has increased less than 9 percent. These statistics indicate a sharp rise in demand while capacity, in terms of the number of lane miles, has stayed relatively constant [2]. Recognizing that we can no longer build our way out of these problems, transportation professionals have turned to information and communications technology for solutions. Intelligent Transportation Systems (ITS) provide a proven set of strategies for advancing transportation safety, mobility, and environmental sustainability by integrating communication and information technology applications into the management and operation of the transportation system across all modes. Connected vehicle technology has the potential to enable many services provided by infrastructure or vehicle based ITS by benefiting from enhanced communication between vehicles and the infrastructure.
1.2 The 2017 ITS Benefits, Costs and Lessons Learned Factsheets
This collection of factsheets presents information on the performance of deployed ITS, as well as information on the costs, and lessons learned regarding ITS deployment and operations. The factsheets, and the collection of three Web-based resources upon which it is based, have been developed by the ITS Joint Program Office (JPO) of the U.S. Department of Transportation (U.S. DOT) to support informed decision making regarding ITS planning and deployment. The 2017 update builds off the 2014 factsheets. Where new information is available the factsheets have been updated and new factsheets have been added for new topics.
The ITS Knowledge Resources Database can
be accessed at http://www.ITSKnowledge
Resources.its.dot.gov
1 Introduction
U.S. Department of Transportation Intelligent Transportation System Joint Program Office
ITS Benefits, Costs, and Lessons Learned: 2017 Update Report – Final | 10
1.3 Measuring ITS Performance ITS deployment impacts transportation system performance in six key goal areas: safety, mobility, efficiency, productivity, energy and environment, and customer satisfaction, each with its own set of performance measures.
• Safety is measured through changes in crash rates or other surrogate measures such as vehicle speeds, traffic conflicts, or traffic law violations.
• Mobility improvements are measured in travel time or delay savings, as well as travel time savings, and on-time performance. Travel time reliability is emerging as a new measure of travel dependability.
• Efficiency is typically represented through increases in capacity or level of service within existing road networks or transit systems.
• Productivity improvements can be documented in cost savings to transportation providers, travelers, or shippers.
• Energy and Environment benefits are typically documented through fuel savings and reduced pollutant emissions.
• Customer Satisfaction findings document the perception of deployed ITS by the traveling public, usually in the form of survey results.
Each factsheet highlights recent benefits, costs and lessons learned for the ITS technologies used in a specific application area. The findings presented include reference information and short identification numbers that are hyperlinked directly to the ITS Knowledge Resource database source for the information. These links provide additional information on each finding cited, along with links to the original source documents, when available.
1.4 ITS Knowledge Resources The ITS Knowledge Resources (KR) database (www.ITSKnowledgeResources.its.dot.gov) contains summaries of the benefits, costs, and lessons learned regarding ITS deployment and operations. The Knowledge Resources organize eighteen years of information on specific ITS implementations, drawn primarily from written sources such as ITS evaluation studies, research syntheses, handbooks, journal articles, and conference papers. The database is maintained by the U.S. DOT’s ITS JPO Evaluation Program to support informed decision making regarding ITS investments by tracking the effectiveness of deployed ITS.
• The ITS Benefits Database provides measures of the effects of ITS on transportation operations according to the six goals identified by the U.S. DOT: safety, mobility, efficiency, productivity, energy and environmental impacts, and customer satisfaction. Each benefit summary includes a title in the form of a short statement of the evaluation finding, context narrative, and identifying information such as date, location, and source, as well as the evaluation details and methodologies that describe how the identified ITS benefit was determined.
• The ITS Costs Database contains estimates of ITS costs that can be used for developing project cost estimates during the planning process or preliminary design phase, and for policy studies and benefit-cost analyses. Both non-recurring (capital) and recurring or operations and maintenance (O&M) costs are provided where possible. Three types of cost data are available: unit costs, sample unit costs and system cost summaries.
1 Introduction
U.S. Department of Transportation Intelligent Transportation System Joint Program Office
ITS Benefits, Costs, and Lessons Learned: 2017 Update Report – Final | 11
• The ITS Lessons Learned Database provides access to the knowledge gained through the experience of deploying ITS experience primarily from case studies, best practice compendiums, planning and design reviews, and evaluation studies.
The ITS Knowledge Resources Home page integrates the Knowledge Resources databases described above, as well as provides a mapping application, help information, an upload feature to encourage the collection of new information sources, and comment and feedback mechanisms.
1.5 ITS Taxonomy The ITS Knowledge Resources are organized according to a taxonomy of 16 application areas, with sub-categories for each application area. With the emerging research in ITS technologies such as connected vehicles, the taxonomy was updated and reorganized just before the last ITS Benefits, Costs, Deployment, and Lessons Learned Update in 2014.
As ITS research continues to evolve, additional updates to the taxonomy, including new application areas and sub-categories, may be identified. With the addition of new factsheets and topic in the 2017 report, the evaluation program is exploring another update to the taxonomy to properly capture new emerging topics in transportation and ITS.
1.6 Report Organization This report has been designed to be flexible for the user. The purpose is to make the information readily available, whether by accessing it through the web, a mobile device or tablet, or by printing sections on one or more application areas. There are a total of 27 factsheets representing the 16 taxonomy areas. Four of the taxonomy areas (arterial management, freeway management, transit management, and driver assistance) have enough data to require more than one factsheet.
The factsheets include tables, charts, images, and case studies that are available to use in reports or briefings as needed to convey the advantages of using ITS technologies and applications in specific areas or regions. The citation for these resources is: U.S. DOT. ITS Benefits, Costs, and Lessons Learned: 2017 Update Report. 2017. Publication Number: FHWA-JPO-17-500.
The online versions of the factsheets feature interactive graphs that contain various metrics represented by the bars of the graphs. The bars represent a numeric range, indicating the range of impacts reported by sources in the databases. Each metric has a number after the text, representing the number of data points used to create the range; no number means only there was only one data point. When moused over and selected or clicked, the bar opens a ‘tooltip’ with more detailed information. The tooltip contains the sub-headline of each benefit or cost entry with the data point from the entry that is incorporated into the range of the bar. The text is hyperlinked to the entry on the ITS Knowledge Resource website (www.itsknowledgeresources.its.dot.gov). All data depicted is from 2003 to 2017 unless otherwise stated in the factsheet. To remove the tooltip from the screen, select or click the same bar a second time and the tooltip will disappear.
The findings presented in these factsheets include reference information and short identification numbers that are hyperlinked directly to the ITS Knowledge Resource database source. These links provide additional information on each finding cited, along with links to the original source documents, when available online.
1 Introduction
U.S. Department of Transportation Intelligent Transportation System Joint Program Office
ITS Benefits, Costs, and Lessons Learned: 2017 Update Report – Final | 12
1.7 New Topics Accessible Transportation
In 2010, the U.S. Census reported that approximately 56.7 million people in the U.S. (18.7 percent of the U.S. population) had some type of disability. This is an important consideration as transportation has long been thought to be instrumental in enhancing access to education, jobs, healthcare, and independent living within communities. Individuals with disabilities currently suffer a 63 percent unemployment rate, with half of the household income and three times the poverty rate of people without disabilities. Recently, a user needs assessment on transportation challenges faced by people with disabilities, veterans with disabilities, and older adults, conducted by the United States Department of Transportation’s Accessible Transportation Technology Research Initiative (ATTRI), concluded that needs and barriers vary by sub-population and type of disability. Specific barriers identified by ATTRI stakeholders included lack of or inaccessible signage, maps, and announcements; lack of information on arrival times, transfer times, and travel distance; and inconsistent accessible pathway infrastructure.
Automation
Autonomous vehicles also known as self-driving, driverless, or robotic vehicles are defined as computer-equipped vehicles that can be driven and operated without active control by a human driver. Using integrated sensor systems, complex algorithms, and automated vehicle (AV) technology, autonomous vehicles can plan routes, navigate through traffic, negotiate lane changes and turns, manage speeds, and assist with parking. With AV technology, a variety of new functions are expected over the next several years as connected vehicle (CV) applications are refined and implemented in accordance with governmental regulations and controls.
While not required for autonomous driving, CV applications are expected to enhance the operational capacity of autonomous vehicles networks and bring about a variety of benefits such as improved situational awareness for increased safety, improved fuel economy, reduced parking needs, and increased mobility for those unable to drive. To help realize these benefits, the United States Department of Transportation (USDOT) Intelligent Transportation Systems Joint Program Office (ITS JPO) has made Advancing Automation a key strategic priority.
Connected Vehicles
The U.S. Department of Transportation's (USDOT’s) Connected Vehicle program is working with state and local transportation agencies, vehicle and device makers, and the public to test and evaluate technology that will enable cars, buses, trucks, trains, roads and other infrastructure, and our smartphones and other devices to “talk” to one another. Cars on the highway, for example, would use short-range radio signals to communicate with each other so every vehicle on the road would be aware of where other nearby vehicles are. Drivers would receive notifications and alerts of dangerous situations, such as someone about to run a red light as they’re nearing an intersection or an oncoming car, out of sight beyond a curve, swerving into their lane to avoid an object on the road. Connected Vehicle technologies aim to tackle some of the biggest challenges in the surface transportation industry--in the areas of safety, mobility, and environment.
Safety
Safety applications center on the basic safety message (BSM), a packet of data that contains information about vehicle position, heading, speed, and other information relating to a vehicle’s
1 Introduction
U.S. Department of Transportation Intelligent Transportation System Joint Program Office
ITS Benefits, Costs, and Lessons Learned: 2017 Update Report – Final | 13
state and predicted path. Connected Vehicle safety applications will enable drivers to have 360-degree awareness of hazards and situations they cannot even see. Through in-car warnings, drivers will be alerted to imminent crash situations, such as merging trucks, cars in the driver's blind side, or when a vehicle ahead brakes suddenly. By communicating with roadside infrastructure, drivers will be alerted when they are entering a school zone, if workers are on the roadside, and if an upcoming traffic light is about to change.
Mobility
In the connected vehicle environment real-time data is captured from equipment located on board cars, trucks, and buses and from the network of connected vehicle field infrastructure. These data will be transmitted wirelessly and used by transportation managers in a wide range of applications to manage the transportation system for optimum performance. As a result of over five years of application prototyping, demonstration and assessment, six bundles representing 17 connected vehicle applications concepts were developed to measure mobility impacts.
Environment
Environmental applications developed through the Applications for the Environment: Real-time Information Synthesis (AERIS) program envisioned a transportation system in which all transportation users, regardless of mode, would have the information needed to make better and greener transportation choices, at any time and in any place. The environmental component of the ITS Joint Program Office’s (JPO’s) connected vehicle research program, AERIS, officially kicked off in 2009 with a vision of “Cleaner Air through Smarter Transportation”. Employing a multimodal approach, the AERIS Research Program aimed to encourage the development of technologies and applications that support a more sustainable relationship between transportation and the environment chiefly through fuel use reductions and resulting emissions reductions.
Smart Cities
With Intelligent Transportation Systems (ITS) laying the groundwork for innovative transportation solutions, many cities are currently serving as laboratories for new types of transportation services and cleaner transportation options leveraging those solutions. Smart Cities are emerging as a next-generation approach for city management by taking steps forward along the transportation technology continuum. Integrating ITS, connected vehicle technologies, automated vehicles, electric vehicles, and other advanced technologies – along with new mobility concepts that leverage the sharing economy – within the context of a city will provide enhanced travel experiences and make moving people and goods safer, more efficient, and more secure. By enhancing the effective management and operation of the transportation system, smart city solutions can leverage existing infrastructure investments, enhance mobility, sustainability, and livability for citizens and businesses, and greatly increase the attractiveness and competitiveness of cities and regions. The Smart City concept will connect transportation and non-transportation services to improve city services and the quality of life for residents.
1 Introduction
U.S. Department of Transportation Intelligent Transportation System Joint Program Office
ITS Benefits, Costs, and Lessons Learned: 2017 Update Report – Final | 14
Mobility on Demand
Mobility on Demand (MOD) is a multimodal, integrated, accessible, and connected transportation system in which personalized mobility is a key objective. MOD enables the use of on demand information, real-time data, and predictive analysis to provide individual travelers with transportation choices that best serve their specific needs and circumstances. Modes facilitated through MOD providers can include: carsharing, bikesharing, ridesharing, ridesourcing, microtransit, shuttle services, public transportation, and other emerging transportation solutions.
Joint Program Office U.S. Department of Transportation, Research and Innovative Technology Administration
ITS Benefits, Costs, and Lessons Learned: Update Report - Final | 15
2 Connected Vehicle – Safety
2.1 Introduction The U.S. Department of Transportation's (USDOT’s) Connected Vehicle program is working with state and local transportation agencies, vehicle and device makers, and the public to test and evaluate technology that will enable cars, buses, trucks, trains, roads and other infrastructure, and our smartphones and other devices to “talk” to one another. Cars on the highway, for example, would use short-range radio signals to communicate with each other so every vehicle on the road would be aware of where other nearby vehicles are. Drivers would receive notifications and alerts of dangerous situations, such as someone about to run a red light as they’re nearing an intersection or an oncoming car, out of sight beyond a curve, swerving into their lane to avoid an object on the road. Connected Vehicle technologies aim to tackle some of the biggest challenges in the surface transportation industry--in the areas of safety, mobility, and environment. Applications are being developed in each of these areas. Safety applications center on the basic safety message (BSM), a packet of data that contains information about vehicle position, heading, speed, and other information relating to a vehicle’s state and predicted path.
Connected Vehicle (CV) safety applications will enable drivers to have 360-degree awareness of hazards and situations they cannot even see. Through in-car warnings, drivers will be alerted to imminent crash situations, such as merging trucks, cars in the driver's blind side, or when a vehicle ahead brakes suddenly. By communicating with roadside infrastructure, drivers will be alerted when they are entering a school zone, if workers are on the roadside, and if an upcoming traffic light is about to change.
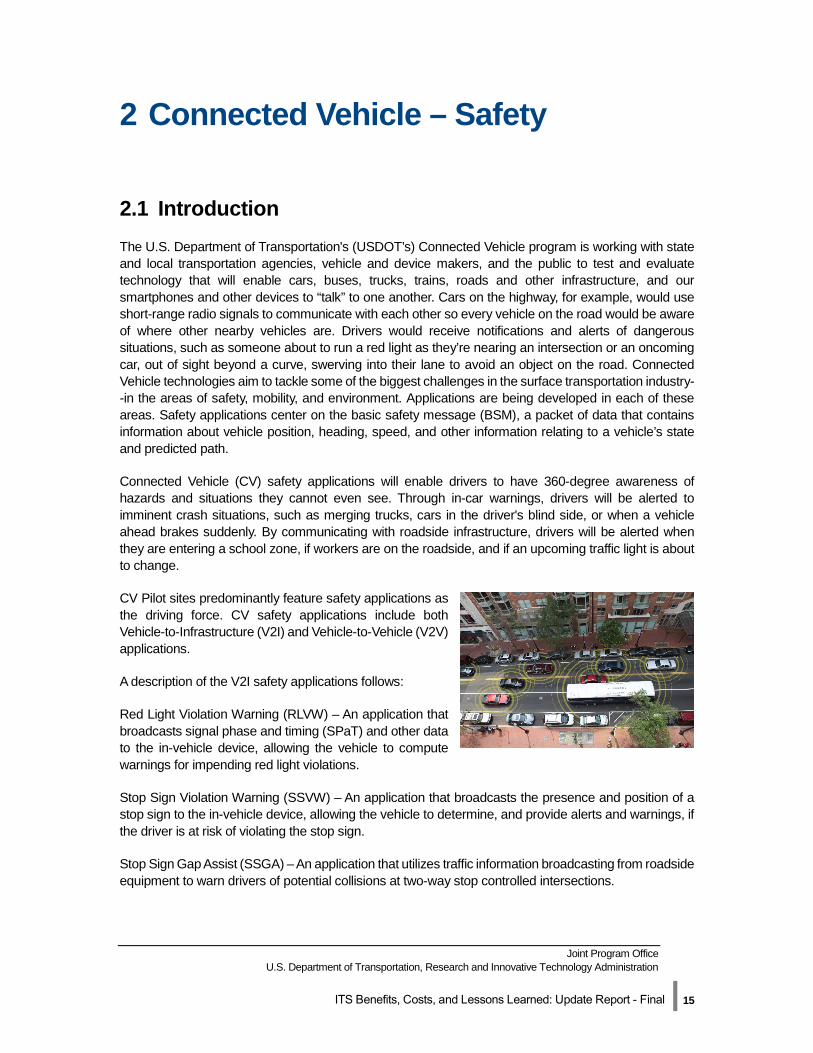
CV Pilot sites predominantly feature safety applications as the driving force. CV safety applications include both Vehicle-to-Infrastructure (V2I) and Vehicle-to-Vehicle (V2V) applications.
A description of the V2I safety applications follows:
Red Light Violation Warning (RLVW) – An application that broadcasts signal phase and timing (SPaT) and other data to the in-vehicle device, allowing the vehicle to compute warnings for impending red light violations.
Stop Sign Violation Warning (SSVW) – An application that broadcasts the presence and position of a stop sign to the in-vehicle device, allowing the vehicle to determine, and provide alerts and warnings, if the driver is at risk of violating the stop sign.
Stop Sign Gap Assist (SSGA) – An application that utilizes traffic information broadcasting from roadside equipment to warn drivers of potential collisions at two-way stop controlled intersections.
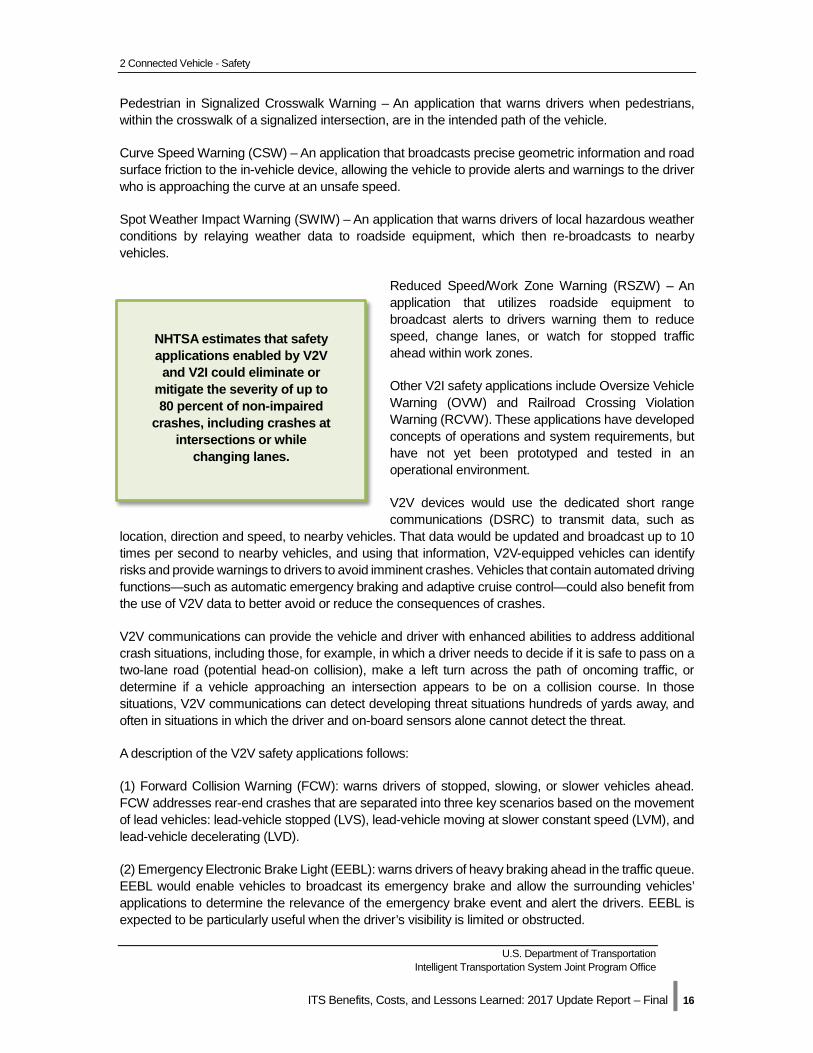
2 Connected Vehicle - Safety
U.S. Department of Transportation Intelligent Transportation System Joint Program Office
ITS Benefits, Costs, and Lessons Learned: 2017 Update Report – Final | 16
Pedestrian in Signalized Crosswalk Warning – An application that warns drivers when pedestrians, within the crosswalk of a signalized intersection, are in the intended path of the vehicle.
Curve Speed Warning (CSW) – An application that broadcasts precise geometric information and road surface friction to the in-vehicle device, allowing the vehicle to provide alerts and warnings to the driver who is approaching the curve at an unsafe speed.
Spot Weather Impact Warning (SWIW) – An application that warns drivers of local hazardous weather conditions by relaying weather data to roadside equipment, which then re-broadcasts to nearby vehicles.
Reduced Speed/Work Zone Warning (RSZW) – An application that utilizes roadside equipment to broadcast alerts to drivers warning them to reduce speed, change lanes, or watch for stopped traffic ahead within work zones.
Other V2I safety applications include Oversize Vehicle Warning (OVW) and Railroad Crossing Violation Warning (RCVW). These applications have developed concepts of operations and system requirements, but have not yet been prototyped and tested in an operational environment.
V2V devices would use the dedicated short range communications (DSRC) to transmit data, such as
location, direction and speed, to nearby vehicles. That data would be updated and broadcast up to 10 times per second to nearby vehicles, and using that information, V2V-equipped vehicles can identify risks and provide warnings to drivers to avoid imminent crashes. Vehicles that contain automated driving functions—such as automatic emergency braking and adaptive cruise control—could also benefit from the use of V2V data to better avoid or reduce the consequences of crashes.
V2V communications can provide the vehicle and driver with enhanced abilities to address additional crash situations, including those, for example, in which a driver needs to decide if it is safe to pass on a two-lane road (potential head-on collision), make a left turn across the path of oncoming traffic, or determine if a vehicle approaching an intersection appears to be on a collision course. In those situations, V2V communications can detect developing threat situations hundreds of yards away, and often in situations in which the driver and on-board sensors alone cannot detect the threat.
A description of the V2V safety applications follows:
(1) Forward Collision Warning (FCW): warns drivers of stopped, slowing, or slower vehicles ahead. FCW addresses rear-end crashes that are separated into three key scenarios based on the movement of lead vehicles: lead-vehicle stopped (LVS), lead-vehicle moving at slower constant speed (LVM), and lead-vehicle decelerating (LVD).
(2) Emergency Electronic Brake Light (EEBL): warns drivers of heavy braking ahead in the traffic queue. EEBL would enable vehicles to broadcast its emergency brake and allow the surrounding vehicles’ applications to determine the relevance of the emergency brake event and alert the drivers. EEBL is expected to be particularly useful when the driver’s visibility is limited or obstructed.
NHTSA estimates that safety applications enabled by V2V and V2I could eliminate or
mitigate the severity of up to 80 percent of non-impaired
crashes, including crashes at intersections or while
changing lanes.
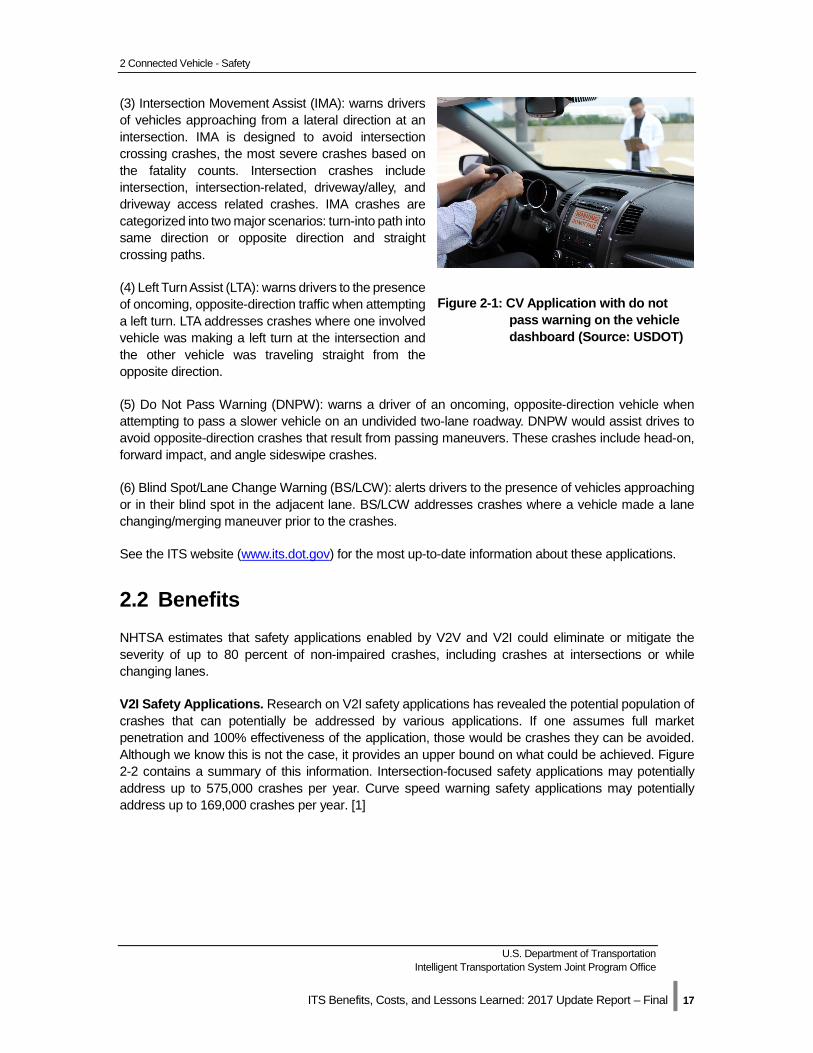
2 Connected Vehicle - Safety
U.S. Department of Transportation Intelligent Transportation System Joint Program Office
ITS Benefits, Costs, and Lessons Learned: 2017 Update Report – Final | 17
(3) Intersection Movement Assist (IMA): warns drivers of vehicles approaching from a lateral direction at an intersection. IMA is designed to avoid intersection crossing crashes, the most severe crashes based on the fatality counts. Intersection crashes include intersection, intersection-related, driveway/alley, and driveway access related crashes. IMA crashes are categorized into two major scenarios: turn-into path into same direction or opposite direction and straight crossing paths.
(4) Left Turn Assist (LTA): warns drivers to the presence of oncoming, opposite-direction traffic when attempting a left turn. LTA addresses crashes where one involved vehicle was making a left turn at the intersection and the other vehicle was traveling straight from the opposite direction.
(5) Do Not Pass Warning (DNPW): warns a driver of an oncoming, opposite-direction vehicle when attempting to pass a slower vehicle on an undivided two-lane roadway. DNPW would assist drives to avoid opposite-direction crashes that result from passing maneuvers. These crashes include head-on, forward impact, and angle sideswipe crashes.
(6) Blind Spot/Lane Change Warning (BS/LCW): alerts drivers to the presence of vehicles approaching or in their blind spot in the adjacent lane. BS/LCW addresses crashes where a vehicle made a lane changing/merging maneuver prior to the crashes.
See the ITS website (www.its.dot.gov) for the most up-to-date information about these applications.
2.2 Benefits NHTSA estimates that safety applications enabled by V2V and V2I could eliminate or mitigate the severity of up to 80 percent of non-impaired crashes, including crashes at intersections or while changing lanes.
V2I Safety Applications. Research on V2I safety applications has revealed the potential population of crashes that can potentially be addressed by various applications. If one assumes full market penetration and 100% effectiveness of the application, those would be crashes they can be avoided. Although we know this is not the case, it provides an upper bound on what could be achieved. Figure 2-2 contains a summary of this information. Intersection-focused safety applications may potentially address up to 575,000 crashes per year. Curve speed warning safety applications may potentially address up to 169,000 crashes per year. [1]
Figure 2-1: CV Application with do not pass warning on the vehicle dashboard (Source: USDOT)
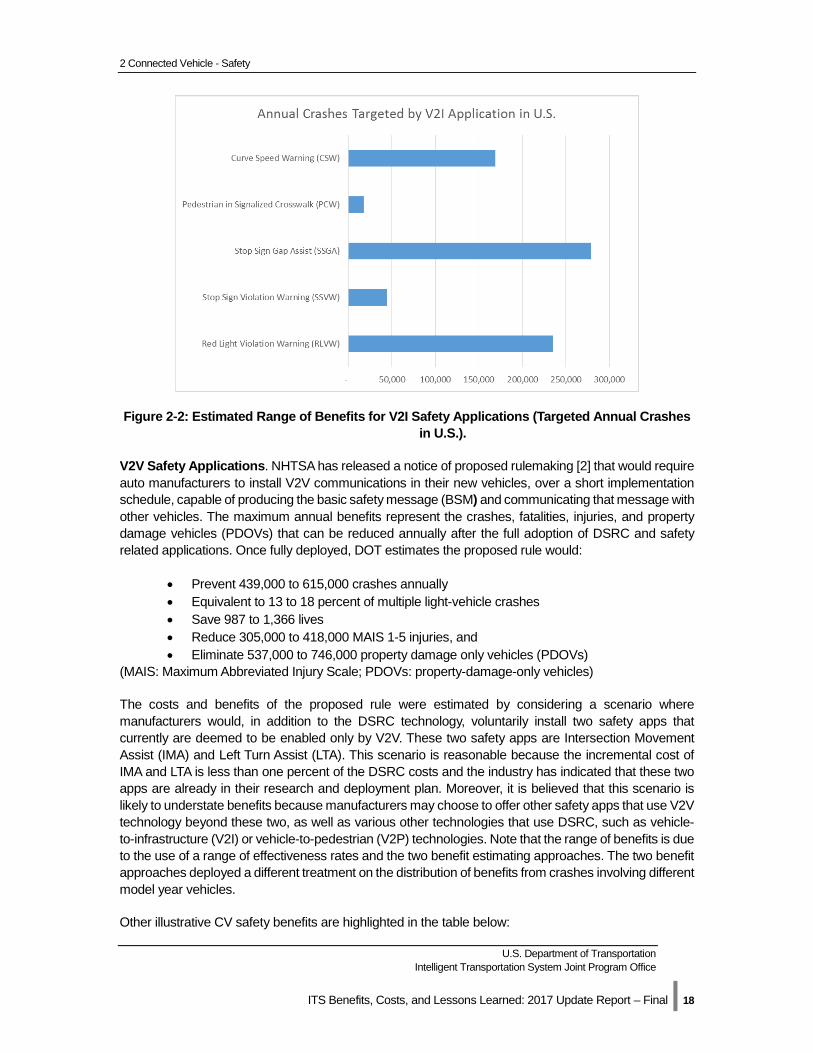
2 Connected Vehicle - Safety
U.S. Department of Transportation Intelligent Transportation System Joint Program Office
ITS Benefits, Costs, and Lessons Learned: 2017 Update Report – Final | 18
Figure 2-2: Estimated Range of Benefits for V2I Safety Applications (Targeted Annual Crashes in U.S.).
V2V Safety Applications. NHTSA has released a notice of proposed rulemaking [2] that would require auto manufacturers to install V2V communications in their new vehicles, over a short implementation schedule, capable of producing the basic safety message (BSM) and communicating that message with other vehicles. The maximum annual benefits represent the crashes, fatalities, injuries, and property damage vehicles (PDOVs) that can be reduced annually after the full adoption of DSRC and safety related applications. Once fully deployed, DOT estimates the proposed rule would:
• Prevent 439,000 to 615,000 crashes annually • Equivalent to 13 to 18 percent of multiple light-vehicle crashes • Save 987 to 1,366 lives • Reduce 305,000 to 418,000 MAIS 1-5 injuries, and • Eliminate 537,000 to 746,000 property damage only vehicles (PDOVs)
(MAIS: Maximum Abbreviated Injury Scale; PDOVs: property-damage-only vehicles)
The costs and benefits of the proposed rule were estimated by considering a scenario where manufacturers would, in addition to the DSRC technology, voluntarily install two safety apps that currently are deemed to be enabled only by V2V. These two safety apps are Intersection Movement Assist (IMA) and Left Turn Assist (LTA). This scenario is reasonable because the incremental cost of IMA and LTA is less than one percent of the DSRC costs and the industry has indicated that these two apps are already in their research and deployment plan. Moreover, it is believed that this scenario is likely to understate benefits because manufacturers may choose to offer other safety apps that use V2V technology beyond these two, as well as various other technologies that use DSRC, such as vehicle-to-infrastructure (V2I) or vehicle-to-pedestrian (V2P) technologies. Note that the range of benefits is due to the use of a range of effectiveness rates and the two benefit estimating approaches. The two benefit approaches deployed a different treatment on the distribution of benefits from crashes involving different model year vehicles.
Other illustrative CV safety benefits are highlighted in the table below:
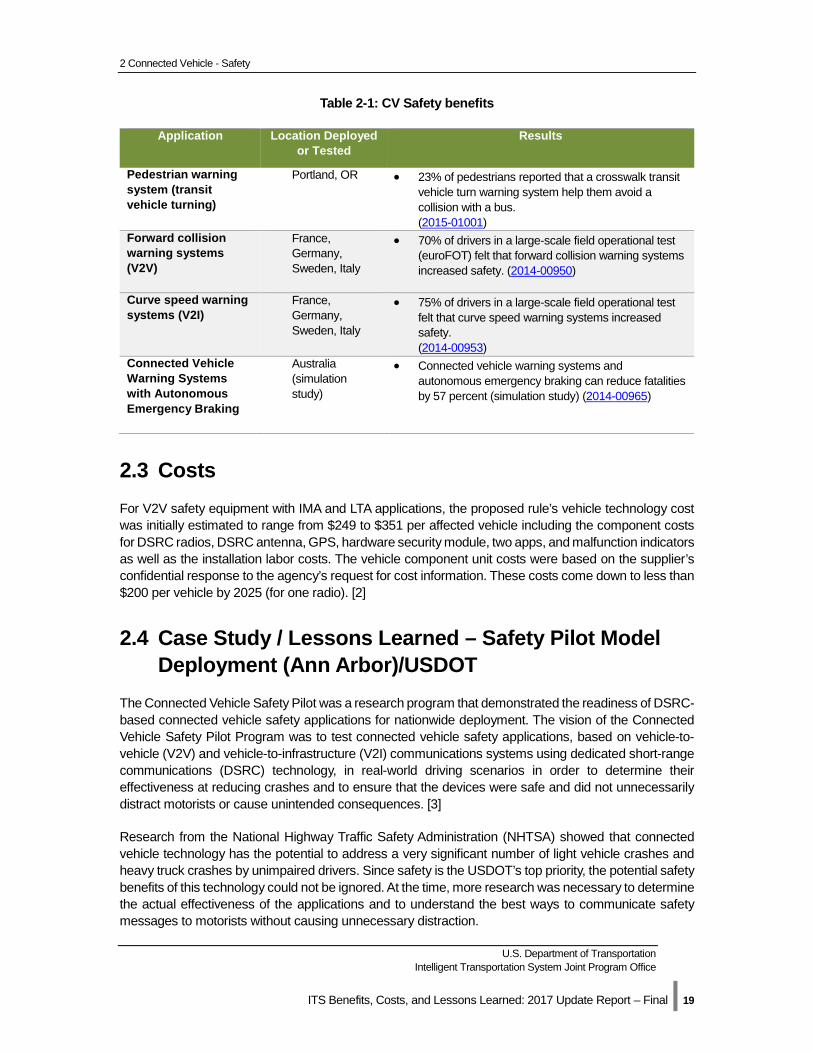
2 Connected Vehicle - Safety
U.S. Department of Transportation Intelligent Transportation System Joint Program Office
ITS Benefits, Costs, and Lessons Learned: 2017 Update Report – Final | 19
Table 2-1: CV Safety benefits
Application Location Deployed or Tested
Results
Pedestrian warning system (transit vehicle turning)
Portland, OR • 23% of pedestrians reported that a crosswalk transit vehicle turn warning system help them avoid a collision with a bus. (2015-01001)
Forward collision warning systems (V2V)
France, Germany, Sweden, Italy
• 70% of drivers in a large-scale field operational test (euroFOT) felt that forward collision warning systems increased safety. (2014-00950)
Curve speed warning systems (V2I)
France, Germany, Sweden, Italy
• 75% of drivers in a large-scale field operational test felt that curve speed warning systems increased safety. (2014-00953)
Connected Vehicle Warning Systems with Autonomous Emergency Braking
Australia (simulation study)
• Connected vehicle warning systems and autonomous emergency braking can reduce fatalities by 57 percent (simulation study) (2014-00965)
2.3 Costs For V2V safety equipment with IMA and LTA applications, the proposed rule’s vehicle technology cost was initially estimated to range from $249 to $351 per affected vehicle including the component costs for DSRC radios, DSRC antenna, GPS, hardware security module, two apps, and malfunction indicators as well as the installation labor costs. The vehicle component unit costs were based on the supplier’s confidential response to the agency’s request for cost information. These costs come down to less than $200 per vehicle by 2025 (for one radio). [2]
2.4 Case Study / Lessons Learned – Safety Pilot Model Deployment (Ann Arbor)/USDOT
The Connected Vehicle Safety Pilot was a research program that demonstrated the readiness of DSRC-based connected vehicle safety applications for nationwide deployment. The vision of the Connected Vehicle Safety Pilot Program was to test connected vehicle safety applications, based on vehicle-to-vehicle (V2V) and vehicle-to-infrastructure (V2I) communications systems using dedicated short-range communications (DSRC) technology, in real-world driving scenarios in order to determine their effectiveness at reducing crashes and to ensure that the devices were safe and did not unnecessarily distract motorists or cause unintended consequences. [3]
Research from the National Highway Traffic Safety Administration (NHTSA) showed that connected vehicle technology has the potential to address a very significant number of light vehicle crashes and heavy truck crashes by unimpaired drivers. Since safety is the USDOT’s top priority, the potential safety benefits of this technology could not be ignored. At the time, more research was necessary to determine the actual effectiveness of the applications and to understand the best ways to communicate safety messages to motorists without causing unnecessary distraction.
2 Connected Vehicle - Safety
U.S. Department of Transportation Intelligent Transportation System Joint Program Office
ITS Benefits, Costs, and Lessons Learned: 2017 Update Report – Final | 20
The Connected Vehicle Safety Pilot was part of a major scientific research program run jointly by the U.S. Department of Transportation (USDOT) and its research and development partners in private industry. This research initiative was a multi-modal effort led by the Intelligent Transportation Systems Joint Program Office (ITS JPO) and the National Highway Traffic Safety Administration (NHTSA), with research support from several agencies, including Federal Highway Administration (FHWA), Federal Motor Carrier Safety Administration (FMCSA), and Federal Transit Administration (FTA).
This one-year, real-world deployment was launched in August 2012 in Ann Arbor, Michigan. The deployment utilized connected vehicle technology in over 2,800 vehicles and at 29 infrastructure sites at a total cost of over $50 million dollars in order to test the effectiveness of the connected vehicle Key lessons from the Safety Pilot Model Deployment include:
• When deploying complex ITS projects such as those with Connected Vehicle technologies, use a modular project structure and focus on high priority objectives and project components.
• When embarking on a connected vehicle project, develop a focused outreach plan that identifies all stakeholders, the message appropriate for each stakeholder and the method in which you will reach the stakeholders.
• Perform a thorough and thoughtful analysis when scoping, sizing, and identifying the geographic location of connected vehicle projects, and ensure that the strategies used to recruit test subjects or drivers are consistent with these assumptions and those of the experimental plan.
• Clearly communicate requirements and testing procedures to connected vehicle device developers, and allow for industry input and iteration for less mature devices.
• Specify interoperability testing requirements and steps as part of the connected vehicle device requirements prior to starting multiple rounds of testing, feedback, reset, and retesting.
• Conduct a data collection pilot test to validate end-to-end data acquisition, transfer, processing, and quality assessment processes.
More details regarding these lessons can be found on-line at Safety Pilot Model Deployment: Lessons Learned.
Joint Program Office U.S. Department of Transportation, Research and Innovative Technology Administration
ITS Benefits, Costs, and Lessons Learned: Update Report - Final | 21
3 Connected Vehicle – Mobility
3.1 Introduction The U.S. Department of Transportation's (USDOT’s) Connected Vehicle program is working with state and local transportation agencies, vehicle and device makers, and the public to test and evaluate technology that will enable cars, buses, trucks, trains, roads and other infrastructure, and our smartphones and other devices to “talk” to one another. Cars on the highway, for example, would use short-range radio signals to communicate with each other so every vehicle on the road would be aware of where other nearby vehicles are. Drivers would receive notifications and alerts of dangerous situations, such as someone about to run a red light as they’re nearing an intersection or an oncoming car, out of sight beyond a curve, swerving into their lane to avoid an object on the road. Connected Vehicle technologies aim to tackle some of the biggest challenges in the surface transportation industry--in the areas of safety, mobility, and environment.
In the connected vehicle environment real-time data is captured from equipment located on board cars, trucks, and buses and from the network of connected vehicle field infrastructure. These data will be transmitted wirelessly and used by transportation managers in a wide range of applications to manage the transportation system for optimum performance.
The Dynamic Mobility Applications program is a multimodal initiative led by the Intelligent Transportation Systems Joint Program Office (ITS JPO) within the U.S. Department of Transportation (USDOT). The vision of the Dynamic Mobility Applications program is to expedite the development, testing, commercialization, and deployment of innovative mobility applications, fully leveraging both new technologies and federal investment to transform transportation system management, maximize the productivity of the system, and enhance the accessibility of individuals within the system.
After years of research, concepts for six Dynamic Mobility Application bundles representing 17 connected vehicle applications were developed. The operational concepts for each bundle and their comprising applications are described below:
Multimodal Intelligent Traffic Signal System (MMITSS)
The MMITSS application bundle seeks to develop a comprehensive traffic signal system that services all modes of transportation (passenger vehicles, transit, emergency vehicles, freight fleets, pedestrians, etc.)
MMITSS component applications include:
• I-SIG - Intelligent Traffic Signal System: An overarching system optimization applicationthat processes data and utilizes that data to prioritize different types of vehicles providingpriority entry through a signalized intersection. The purpose is to prioritize entry foremergency vehicles, transit and freight vehicles, and pedestrian movements.
• PREEMPT- Emergency Vehicle Preemption: An application that provides signalpreemption to emergency vehicles, and accommodates multiple emergency requests.
2 Connected Vehicle - Safety
U.S. Department of Transportation Intelligent Transportation System Joint Program Office
ITS Benefits, Costs, and Lessons Learned: 2017 Update Report – Final | 22
• TSP - Transit Signal Priority and FSP - Freight Signal Priority: Two applications that provide signal priority to transit at intersections and along arterial corridors as well as signal priority to freight vehicles along an arterial corridor near a freight facility.
• PED-SIG - Mobile Accessible Pedestrian Signal System: An application that allows for an automated call from the smartphone of a visually impaired pedestrian to the traffic signal, as well as audio cues to safely navigate the crosswalk
Intelligent Network Flow Optimization (INFLO)
INFLO applications aim to improve roadway throughput and reducing crashes through the use of frequently collected and rapidly disseminated data drawn from connected vehicles, travelers, and infrastructure.
INFLO component applications include:
• Dynamic Speed Harmonization (SPD-HARM): SPD-HARM allows the vehicle operator to dynamically adjust and coordinate maximum appropriate vehicle speed in response to downstream congestion, incidents, and weather or road conditions in order to maximize traffic throughput and reduce crashes.
• Queue Warning (Q-WARN): The objective Q-WARN is to provide a vehicle operator with sufficient warning of an impending queue backup in order to brake safely, change lanes, or modify the route such that secondary collisions can be minimized or even eliminated. Q-WARN uses connected vehicle technologies, including vehicle-to-infrastructure (V2I) and vehicle-to-vehicle (V2V) communications, to enable vehicles within the queue event to automatically broadcast their queued status information to nearby upstream vehicles and to the TMC.
• Cooperative Adaptive Cruise Control (CACC): The objective of CACC is to dynamically and automatically coordinate cruise control speeds among platooning vehicles in order to significantly increase traffic throughput. By tightly coordinating in-platoon vehicle movements, headways among vehicles can be significantly reduced, resulting in a smoothing of traffic flow and an improvement in traffic flow stability. CACC will require the use of DSRC by participating vehicles.
Response, Emergency Staging and Communications, Uniform Management, and Evaluation (R.E.S.C.U.M.E.)
R.E.S.C.U.M.E. is a bundle of applications that aim to transform the processes associated with incident management. They seek to quickly detect and assess incidents and their effects on traffic flow, model the evacuation flow, push information to evacuees, and help responders identify the best available resources and ways to allocate them in the timeliest manner.
The R.E.S.C.U.M.E. Bundle includes 3 applications:
• Incident Scene Pre-Arrival Staging Guidance for Emergency Responders (RESP-STG): This application provides situational awareness information to public safety responders while enroute to an incident. It can also help establish incident work zones that are safe for responders, travelers, and crash victims by providing input regarding routing, staging, and secondary dispatch decisions and staging plans.
• Incident Scene Work Zone Alerts for Drivers and Workers (INC-ZONE): This application bundle has two components, one that warns drivers that are approaching temporary work
2 Connected Vehicle - Safety
U.S. Department of Transportation Intelligent Transportation System Joint Program Office
ITS Benefits, Costs, and Lessons Learned: 2017 Update Report – Final | 23
zones at unsafe speeds, and or trajectory; and another that warns public safety personnel and other officials working in the zone through an audible warning system.
• Emergency Communications and Evacuation (EVAC): This application addresses the needs of two different evacuee groups:
For those using their own transportation, EVAC provides dynamic route guidance information, current traffic and road conditions, location of available lodging , and location of fuel, food, water, cash machines, and other necessities. For those requiring assistance, EVAC provides information to identify and locate people who are more likely to require guidance and assistance, and information to identify existing service providers and other available resources.
Integrated Dynamic Transit Operations (IDTO)
The IDTO application bundle aims to integrate passenger connection protection, dynamic scheduling, dispatching, and routing of transit vehicles, and dynamic ridesharing into a single system that benefits both travelers and operators.
The following applications comprise the IDTO bundle:
• T-Connect (Connection Protection): Increases the likelihood of making successful transfers by monitoring inbound and outbound vehicles, as well as travelers, determining if/how a connection can be preserved, and initiating the necessary notifications to these parties to support.
• T-DISP (Dynamic Transit Operations): For travelers, T-DISP provides an ability to access real-time information about available travel options in order to best manage their commutes. For an agency, T-DISP extends demand/response services to support dynamic routing and scheduling.
• D-Ride (Dynamic Rideshare): New, more efficient approach to rideshare concepts including real-time scheduling. Moving beyond the 24 advance notification typically required by paratransit.
Freight Advanced Traveler Information Systems (FRATIS)
The FRATIS application bundle seeks to provide freight-specific route guidance and optimize drayage operations so that load movements are coordinated between freight facilities to reduce empty-load trips.
FRATIS has two component applications:
• Freight-Specific Dynamic Travel Planning and Performance: This application seeks to aggregate traveler information, dynamic routing, and performance monitoring elements desired by freight operators. It is expected that this application will leverage existing data in the public domain, as well as emerging private sector applications, to provide benefits to both sectors. Other data includes real-time freeway and key arterial speeds and volumes, incident information, road closure information, route restrictions, bridge heights, truck parking availability, cell phone and/or Bluetooth movement/speed data, weather data, and real-time speed data from fleet management systems.
• Drayage Optimization: This application seeks to combine container load matching and freight information exchange systems to fully optimize drayage operations, thereby minimizing bobtails/dry runs and wasted miles, as well as dispersing truck arrivals at intermodal terminals throughout the day. With this application, the U.S. DOT and freight industry also have an opportunity to address some key industry gaps. To truly optimize a
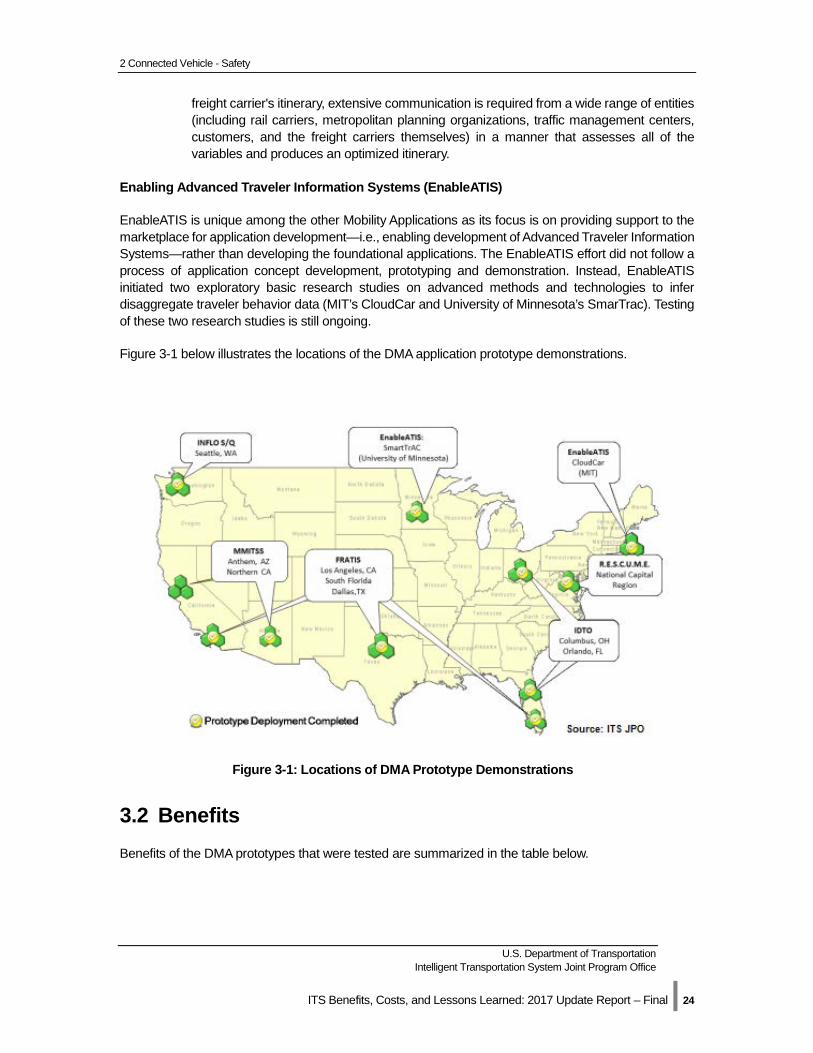
2 Connected Vehicle - Safety
U.S. Department of Transportation Intelligent Transportation System Joint Program Office
ITS Benefits, Costs, and Lessons Learned: 2017 Update Report – Final | 24
freight carrier's itinerary, extensive communication is required from a wide range of entities (including rail carriers, metropolitan planning organizations, traffic management centers, customers, and the freight carriers themselves) in a manner that assesses all of the variables and produces an optimized itinerary.
Enabling Advanced Traveler Information Systems (EnableATIS)
EnableATIS is unique among the other Mobility Applications as its focus is on providing support to the marketplace for application development—i.e., enabling development of Advanced Traveler Information Systems—rather than developing the foundational applications. The EnableATIS effort did not follow a process of application concept development, prototyping and demonstration. Instead, EnableATIS initiated two exploratory basic research studies on advanced methods and technologies to infer disaggregate traveler behavior data (MIT’s CloudCar and University of Minnesota’s SmarTrac). Testing of these two research studies is still ongoing.
Figure 3-1 below illustrates the locations of the DMA application prototype demonstrations.
3.2 Benefits Benefits of the DMA prototypes that were tested are summarized in the table below.
Figure 3-1: Locations of DMA Prototype Demonstrations
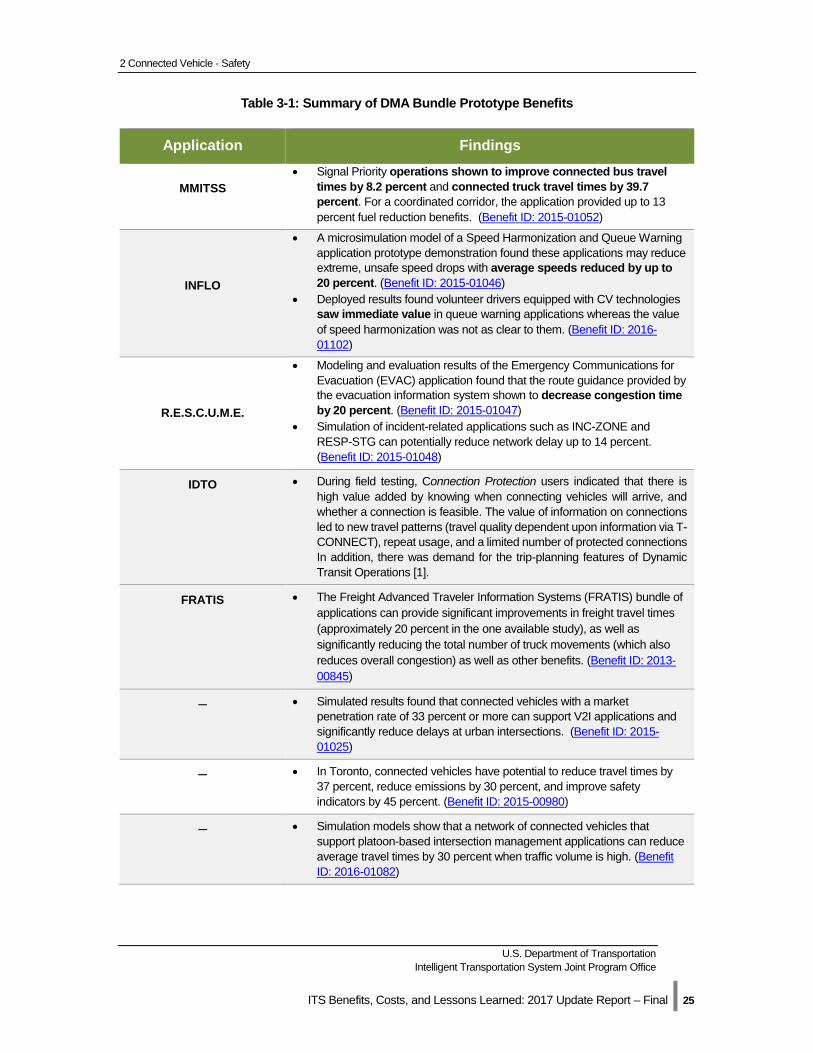
2 Connected Vehicle - Safety
U.S. Department of Transportation Intelligent Transportation System Joint Program Office
ITS Benefits, Costs, and Lessons Learned: 2017 Update Report – Final | 25
Table 3-1: Summary of DMA Bundle Prototype Benefits
Application Findings
MMITSS • Signal Priority operations shown to improve connected bus travel
times by 8.2 percent and connected truck travel times by 39.7 percent. For a coordinated corridor, the application provided up to 13 percent fuel reduction benefits. (Benefit ID: 2015-01052)
INFLO
• A microsimulation model of a Speed Harmonization and Queue Warning application prototype demonstration found these applications may reduce extreme, unsafe speed drops with average speeds reduced by up to 20 percent. (Benefit ID: 2015-01046)
• Deployed results found volunteer drivers equipped with CV technologies saw immediate value in queue warning applications whereas the value of speed harmonization was not as clear to them. (Benefit ID: 2016-01102)
R.E.S.C.U.M.E.
• Modeling and evaluation results of the Emergency Communications for Evacuation (EVAC) application found that the route guidance provided by the evacuation information system shown to decrease congestion time by 20 percent. (Benefit ID: 2015-01047)
• Simulation of incident-related applications such as INC-ZONE and RESP-STG can potentially reduce network delay up to 14 percent. (Benefit ID: 2015-01048)
IDTO • During field testing, Connection Protection users indicated that there is high value added by knowing when connecting vehicles will arrive, and whether a connection is feasible. The value of information on connections led to new travel patterns (travel quality dependent upon information via T-CONNECT), repeat usage, and a limited number of protected connections In addition, there was demand for the trip-planning features of Dynamic Transit Operations [1].
FRATIS • The Freight Advanced Traveler Information Systems (FRATIS) bundle of applications can provide significant improvements in freight travel times (approximately 20 percent in the one available study), as well as significantly reducing the total number of truck movements (which also reduces overall congestion) as well as other benefits. (Benefit ID: 2013-00845)
─ • Simulated results found that connected vehicles with a market penetration rate of 33 percent or more can support V2I applications and significantly reduce delays at urban intersections. (Benefit ID: 2015-01025)
─ • In Toronto, connected vehicles have potential to reduce travel times by 37 percent, reduce emissions by 30 percent, and improve safety indicators by 45 percent. (Benefit ID: 2015-00980)
─ • Simulation models show that a network of connected vehicles that support platoon-based intersection management applications can reduce average travel times by 30 percent when traffic volume is high. (Benefit ID: 2016-01082)
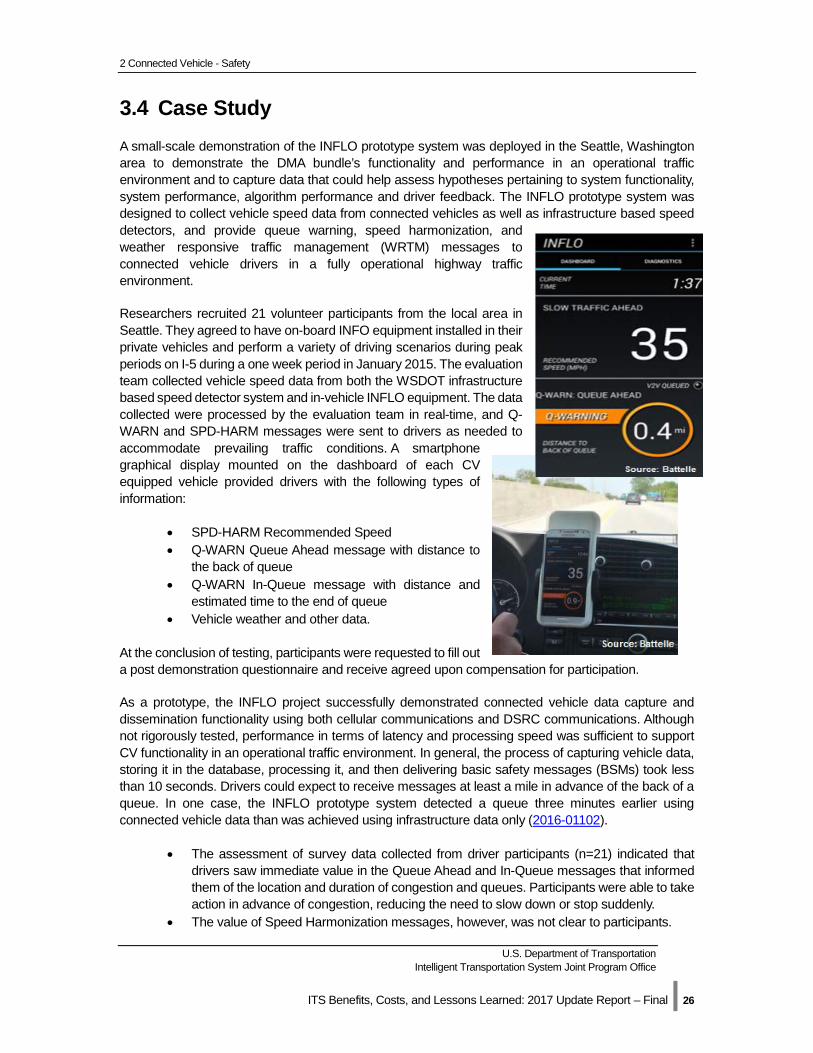
2 Connected Vehicle - Safety
U.S. Department of Transportation Intelligent Transportation System Joint Program Office
ITS Benefits, Costs, and Lessons Learned: 2017 Update Report – Final | 26
3.4 Case Study A small-scale demonstration of the INFLO prototype system was deployed in the Seattle, Washington area to demonstrate the DMA bundle’s functionality and performance in an operational traffic environment and to capture data that could help assess hypotheses pertaining to system functionality, system performance, algorithm performance and driver feedback. The INFLO prototype system was designed to collect vehicle speed data from connected vehicles as well as infrastructure based speed detectors, and provide queue warning, speed harmonization, and weather responsive traffic management (WRTM) messages to connected vehicle drivers in a fully operational highway traffic environment.
Researchers recruited 21 volunteer participants from the local area in Seattle. They agreed to have on-board INFO equipment installed in their private vehicles and perform a variety of driving scenarios during peak periods on I-5 during a one week period in January 2015. The evaluation team collected vehicle speed data from both the WSDOT infrastructure based speed detector system and in-vehicle INFLO equipment. The data collected were processed by the evaluation team in real-time, and Q-WARN and SPD-HARM messages were sent to drivers as needed to accommodate prevailing traffic conditions. A smartphone graphical display mounted on the dashboard of each CV equipped vehicle provided drivers with the following types of information:
• SPD-HARM Recommended Speed • Q-WARN Queue Ahead message with distance to
the back of queue • Q-WARN In-Queue message with distance and
estimated time to the end of queue • Vehicle weather and other data.
At the conclusion of testing, participants were requested to fill out a post demonstration questionnaire and receive agreed upon compensation for participation.
As a prototype, the INFLO project successfully demonstrated connected vehicle data capture and dissemination functionality using both cellular communications and DSRC communications. Although not rigorously tested, performance in terms of latency and processing speed was sufficient to support CV functionality in an operational traffic environment. In general, the process of capturing vehicle data, storing it in the database, processing it, and then delivering basic safety messages (BSMs) took less than 10 seconds. Drivers could expect to receive messages at least a mile in advance of the back of a queue. In one case, the INFLO prototype system detected a queue three minutes earlier using connected vehicle data than was achieved using infrastructure data only (2016-01102).
• The assessment of survey data collected from driver participants (n=21) indicated that drivers saw immediate value in the Queue Ahead and In-Queue messages that informed them of the location and duration of congestion and queues. Participants were able to take action in advance of congestion, reducing the need to slow down or stop suddenly.
• The value of Speed Harmonization messages, however, was not clear to participants.
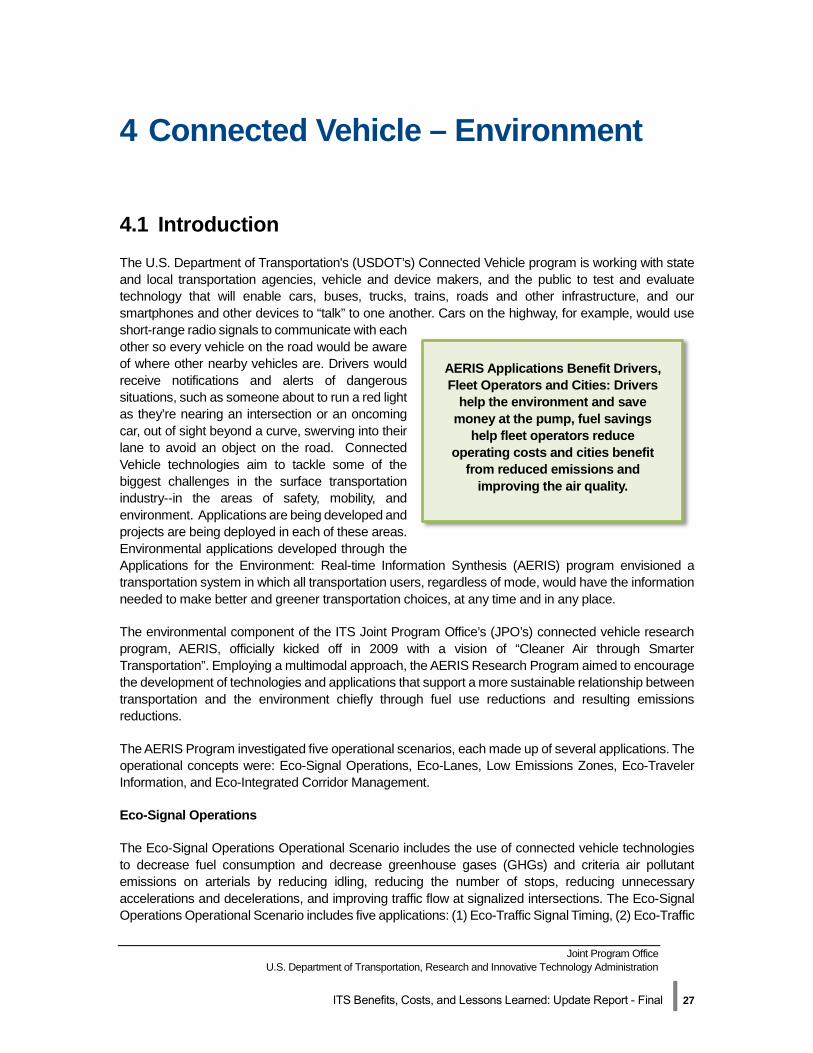
Joint Program Office U.S. Department of Transportation, Research and Innovative Technology Administration
ITS Benefits, Costs, and Lessons Learned: Update Report - Final | 27
4 Connected Vehicle – Environment
4.1 Introduction The U.S. Department of Transportation's (USDOT’s) Connected Vehicle program is working with state and local transportation agencies, vehicle and device makers, and the public to test and evaluate technology that will enable cars, buses, trucks, trains, roads and other infrastructure, and our smartphones and other devices to “talk” to one another. Cars on the highway, for example, would use short-range radio signals to communicate with each other so every vehicle on the road would be aware of where other nearby vehicles are. Drivers would receive notifications and alerts of dangerous situations, such as someone about to run a red light as they’re nearing an intersection or an oncoming car, out of sight beyond a curve, swerving into their lane to avoid an object on the road. Connected Vehicle technologies aim to tackle some of the biggest challenges in the surface transportation industry--in the areas of safety, mobility, and environment. Applications are being developed and projects are being deployed in each of these areas. Environmental applications developed through the Applications for the Environment: Real-time Information Synthesis (AERIS) program envisioned a transportation system in which all transportation users, regardless of mode, would have the information needed to make better and greener transportation choices, at any time and in any place.
The environmental component of the ITS Joint Program Office’s (JPO’s) connected vehicle research program, AERIS, officially kicked off in 2009 with a vision of “Cleaner Air through Smarter Transportation”. Employing a multimodal approach, the AERIS Research Program aimed to encourage the development of technologies and applications that support a more sustainable relationship between transportation and the environment chiefly through fuel use reductions and resulting emissions reductions.
The AERIS Program investigated five operational scenarios, each made up of several applications. The operational concepts were: Eco-Signal Operations, Eco-Lanes, Low Emissions Zones, Eco-Traveler Information, and Eco-Integrated Corridor Management.
Eco-Signal Operations
The Eco-Signal Operations Operational Scenario includes the use of connected vehicle technologies to decrease fuel consumption and decrease greenhouse gases (GHGs) and criteria air pollutant emissions on arterials by reducing idling, reducing the number of stops, reducing unnecessary accelerations and decelerations, and improving traffic flow at signalized intersections. The Eco-Signal Operations Operational Scenario includes five applications: (1) Eco-Traffic Signal Timing, (2) Eco-Traffic
AERIS Applications Benefit Drivers, Fleet Operators and Cities: Drivers
help the environment and save money at the pump, fuel savings
help fleet operators reduce operating costs and cities benefit
from reduced emissions and improving the air quality.
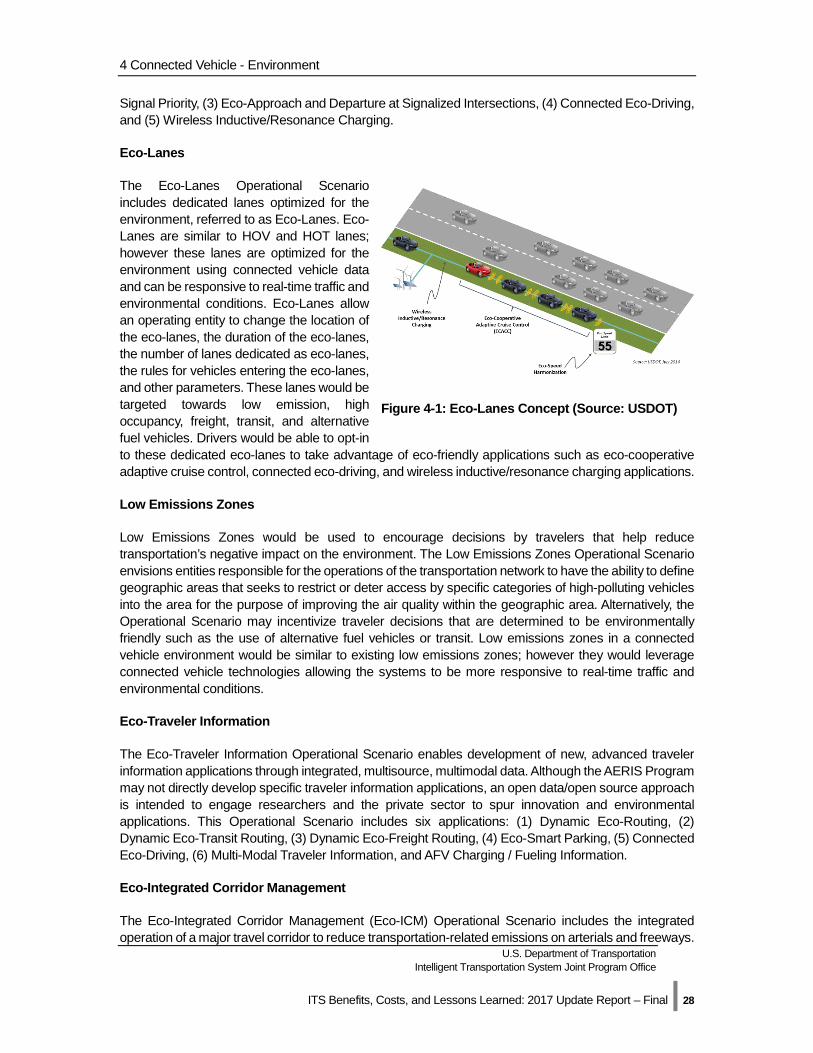
4 Connected Vehicle - Environment
U.S. Department of Transportation Intelligent Transportation System Joint Program Office
ITS Benefits, Costs, and Lessons Learned: 2017 Update Report – Final | 28
Signal Priority, (3) Eco-Approach and Departure at Signalized Intersections, (4) Connected Eco-Driving, and (5) Wireless Inductive/Resonance Charging.
Eco-Lanes
The Eco-Lanes Operational Scenario includes dedicated lanes optimized for the environment, referred to as Eco-Lanes. Eco-Lanes are similar to HOV and HOT lanes; however these lanes are optimized for the environment using connected vehicle data and can be responsive to real-time traffic and environmental conditions. Eco-Lanes allow an operating entity to change the location of the eco-lanes, the duration of the eco-lanes, the number of lanes dedicated as eco-lanes, the rules for vehicles entering the eco-lanes, and other parameters. These lanes would be targeted towards low emission, high occupancy, freight, transit, and alternative fuel vehicles. Drivers would be able to opt-in to these dedicated eco-lanes to take advantage of eco-friendly applications such as eco-cooperative adaptive cruise control, connected eco-driving, and wireless inductive/resonance charging applications.
Low Emissions Zones
Low Emissions Zones would be used to encourage decisions by travelers that help reduce transportation’s negative impact on the environment. The Low Emissions Zones Operational Scenario envisions entities responsible for the operations of the transportation network to have the ability to define geographic areas that seeks to restrict or deter access by specific categories of high-polluting vehicles into the area for the purpose of improving the air quality within the geographic area. Alternatively, the Operational Scenario may incentivize traveler decisions that are determined to be environmentally friendly such as the use of alternative fuel vehicles or transit. Low emissions zones in a connected vehicle environment would be similar to existing low emissions zones; however they would leverage connected vehicle technologies allowing the systems to be more responsive to real-time traffic and environmental conditions.
Eco-Traveler Information
The Eco-Traveler Information Operational Scenario enables development of new, advanced traveler information applications through integrated, multisource, multimodal data. Although the AERIS Program may not directly develop specific traveler information applications, an open data/open source approach is intended to engage researchers and the private sector to spur innovation and environmental applications. This Operational Scenario includes six applications: (1) Dynamic Eco-Routing, (2) Dynamic Eco-Transit Routing, (3) Dynamic Eco-Freight Routing, (4) Eco-Smart Parking, (5) Connected Eco-Driving, (6) Multi-Modal Traveler Information, and AFV Charging / Fueling Information.
Eco-Integrated Corridor Management
The Eco-Integrated Corridor Management (Eco-ICM) Operational Scenario includes the integrated operation of a major travel corridor to reduce transportation-related emissions on arterials and freeways.
Figure 4-1: Eco-Lanes Concept (Source: USDOT)
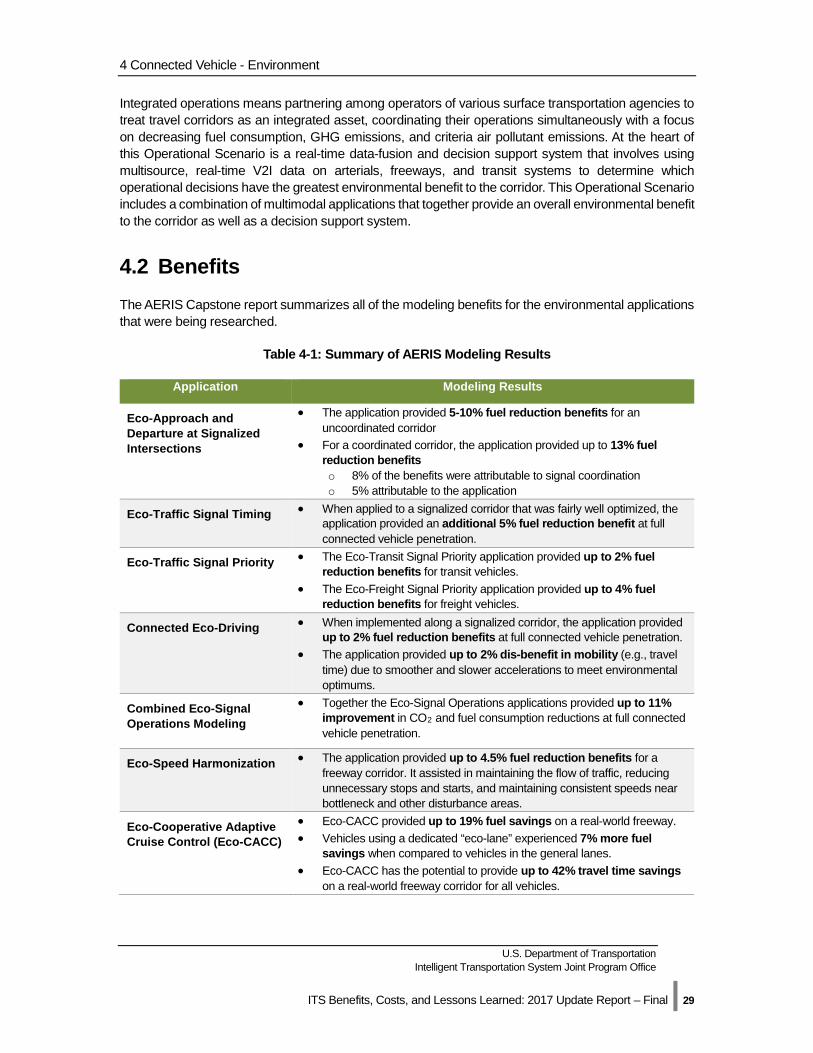
4 Connected Vehicle - Environment
U.S. Department of Transportation Intelligent Transportation System Joint Program Office
ITS Benefits, Costs, and Lessons Learned: 2017 Update Report – Final | 29
Integrated operations means partnering among operators of various surface transportation agencies to treat travel corridors as an integrated asset, coordinating their operations simultaneously with a focus on decreasing fuel consumption, GHG emissions, and criteria air pollutant emissions. At the heart of this Operational Scenario is a real-time data-fusion and decision support system that involves using multisource, real-time V2I data on arterials, freeways, and transit systems to determine which operational decisions have the greatest environmental benefit to the corridor. This Operational Scenario includes a combination of multimodal applications that together provide an overall environmental benefit to the corridor as well as a decision support system.
4.2 Benefits The AERIS Capstone report summarizes all of the modeling benefits for the environmental applications that were being researched.
Table 4-1: Summary of AERIS Modeling Results
Application Modeling Results
Eco-Approach and Departure at Signalized Intersections
• The application provided 5-10% fuel reduction benefits for an uncoordinated corridor
• For a coordinated corridor, the application provided up to 13% fuel reduction benefits o 8% of the benefits were attributable to signal coordination o 5% attributable to the application
Eco-Traffic Signal Timing • When applied to a signalized corridor that was fairly well optimized, the application provided an additional 5% fuel reduction benefit at full connected vehicle penetration.
Eco-Traffic Signal Priority • The Eco-Transit Signal Priority application provided up to 2% fuel reduction benefits for transit vehicles.
• The Eco-Freight Signal Priority application provided up to 4% fuel reduction benefits for freight vehicles.
Connected Eco-Driving • When implemented along a signalized corridor, the application provided up to 2% fuel reduction benefits at full connected vehicle penetration.
• The application provided up to 2% dis-benefit in mobility (e.g., travel time) due to smoother and slower accelerations to meet environmental optimums.
Combined Eco-Signal Operations Modeling
• Together the Eco-Signal Operations applications provided up to 11% improvement in CO2 and fuel consumption reductions at full connected vehicle penetration.
Eco-Speed Harmonization • The application provided up to 4.5% fuel reduction benefits for a freeway corridor. It assisted in maintaining the flow of traffic, reducing unnecessary stops and starts, and maintaining consistent speeds near bottleneck and other disturbance areas.
Eco-Cooperative Adaptive Cruise Control (Eco-CACC)
• Eco-CACC provided up to 19% fuel savings on a real-world freeway. • Vehicles using a dedicated “eco-lane” experienced 7% more fuel
savings when compared to vehicles in the general lanes. • Eco-CACC has the potential to provide up to 42% travel time savings
on a real-world freeway corridor for all vehicles.
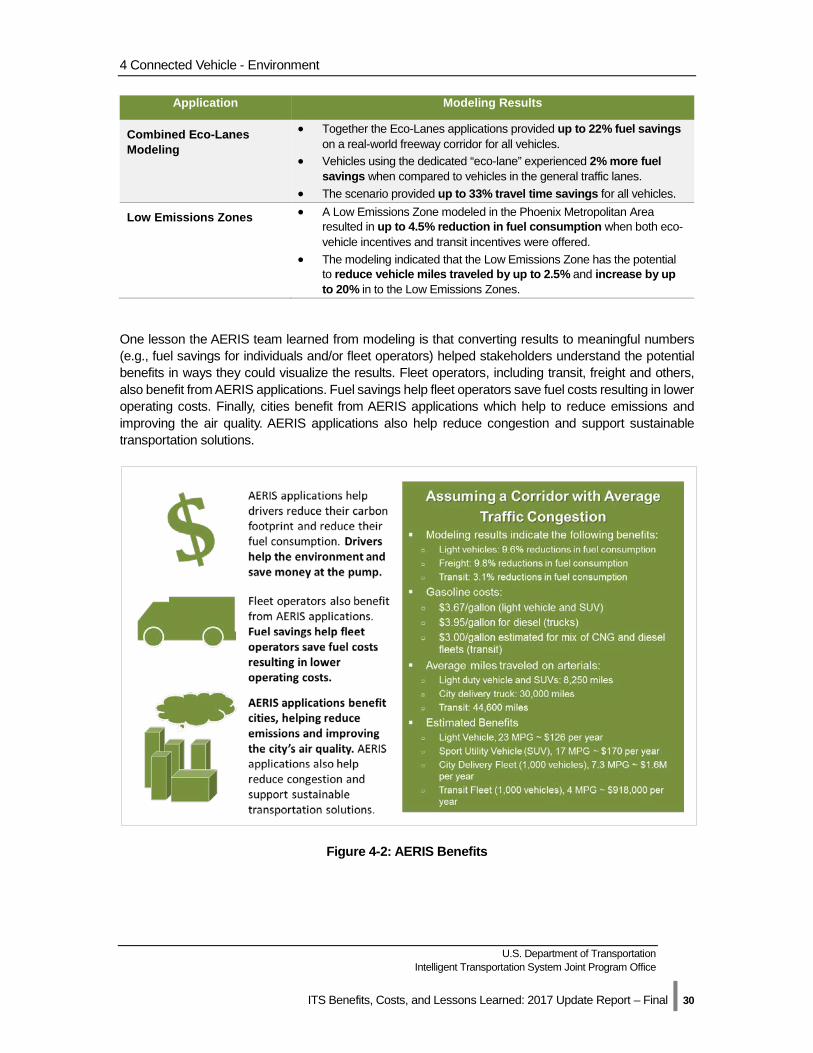
4 Connected Vehicle - Environment
U.S. Department of Transportation Intelligent Transportation System Joint Program Office
ITS Benefits, Costs, and Lessons Learned: 2017 Update Report – Final | 30
Application Modeling Results
Combined Eco-Lanes Modeling
• Together the Eco-Lanes applications provided up to 22% fuel savings on a real-world freeway corridor for all vehicles.
• Vehicles using the dedicated “eco-lane” experienced 2% more fuel savings when compared to vehicles in the general traffic lanes.
• The scenario provided up to 33% travel time savings for all vehicles.
Low Emissions Zones • A Low Emissions Zone modeled in the Phoenix Metropolitan Area resulted in up to 4.5% reduction in fuel consumption when both eco-vehicle incentives and transit incentives were offered.
• The modeling indicated that the Low Emissions Zone has the potential to reduce vehicle miles traveled by up to 2.5% and increase by up to 20% in to the Low Emissions Zones.
One lesson the AERIS team learned from modeling is that converting results to meaningful numbers (e.g., fuel savings for individuals and/or fleet operators) helped stakeholders understand the potential benefits in ways they could visualize the results. Fleet operators, including transit, freight and others, also benefit from AERIS applications. Fuel savings help fleet operators save fuel costs resulting in lower operating costs. Finally, cities benefit from AERIS applications which help to reduce emissions and improving the air quality. AERIS applications also help reduce congestion and support sustainable transportation solutions.
Figure 4-2: AERIS Benefits
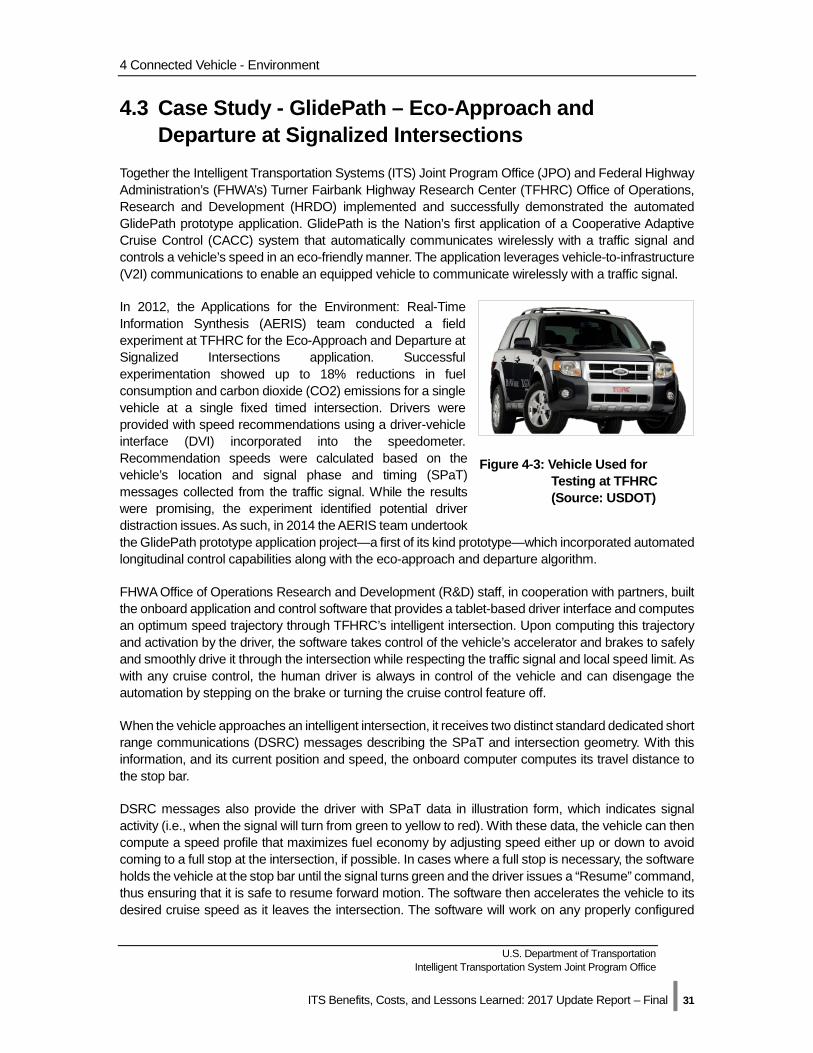
4 Connected Vehicle - Environment
U.S. Department of Transportation Intelligent Transportation System Joint Program Office
ITS Benefits, Costs, and Lessons Learned: 2017 Update Report – Final | 31
4.3 Case Study - GlidePath – Eco-Approach and Departure at Signalized Intersections
Together the Intelligent Transportation Systems (ITS) Joint Program Office (JPO) and Federal Highway Administration’s (FHWA’s) Turner Fairbank Highway Research Center (TFHRC) Office of Operations, Research and Development (HRDO) implemented and successfully demonstrated the automated GlidePath prototype application. GlidePath is the Nation’s first application of a Cooperative Adaptive Cruise Control (CACC) system that automatically communicates wirelessly with a traffic signal and controls a vehicle’s speed in an eco-friendly manner. The application leverages vehicle-to-infrastructure (V2I) communications to enable an equipped vehicle to communicate wirelessly with a traffic signal.
In 2012, the Applications for the Environment: Real-Time Information Synthesis (AERIS) team conducted a field experiment at TFHRC for the Eco-Approach and Departure at Signalized Intersections application. Successful experimentation showed up to 18% reductions in fuel consumption and carbon dioxide (CO2) emissions for a single vehicle at a single fixed timed intersection. Drivers were provided with speed recommendations using a driver-vehicle interface (DVI) incorporated into the speedometer. Recommendation speeds were calculated based on the vehicle’s location and signal phase and timing (SPaT) messages collected from the traffic signal. While the results were promising, the experiment identified potential driver distraction issues. As such, in 2014 the AERIS team undertook the GlidePath prototype application project—a first of its kind prototype—which incorporated automated longitudinal control capabilities along with the eco-approach and departure algorithm.
FHWA Office of Operations Research and Development (R&D) staff, in cooperation with partners, built the onboard application and control software that provides a tablet-based driver interface and computes an optimum speed trajectory through TFHRC’s intelligent intersection. Upon computing this trajectory and activation by the driver, the software takes control of the vehicle’s accelerator and brakes to safely and smoothly drive it through the intersection while respecting the traffic signal and local speed limit. As with any cruise control, the human driver is always in control of the vehicle and can disengage the automation by stepping on the brake or turning the cruise control feature off.
When the vehicle approaches an intelligent intersection, it receives two distinct standard dedicated short range communications (DSRC) messages describing the SPaT and intersection geometry. With this information, and its current position and speed, the onboard computer computes its travel distance to the stop bar.
DSRC messages also provide the driver with SPaT data in illustration form, which indicates signal activity (i.e., when the signal will turn from green to yellow to red). With these data, the vehicle can then compute a speed profile that maximizes fuel economy by adjusting speed either up or down to avoid coming to a full stop at the intersection, if possible. In cases where a full stop is necessary, the software holds the vehicle at the stop bar until the signal turns green and the driver issues a “Resume” command, thus ensuring that it is safe to resume forward motion. The software then accelerates the vehicle to its desired cruise speed as it leaves the intersection. The software will work on any properly configured
Figure 4-3: Vehicle Used for Testing at TFHRC (Source: USDOT)
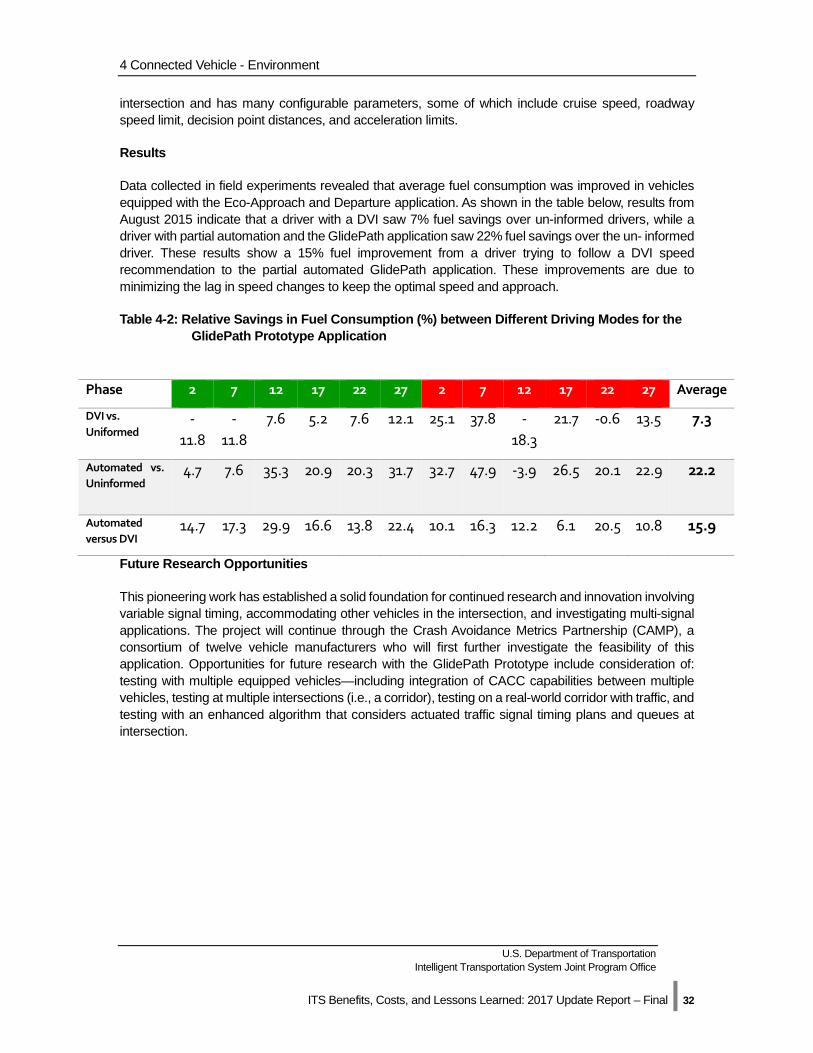
4 Connected Vehicle - Environment
U.S. Department of Transportation Intelligent Transportation System Joint Program Office
ITS Benefits, Costs, and Lessons Learned: 2017 Update Report – Final | 32
intersection and has many configurable parameters, some of which include cruise speed, roadway speed limit, decision point distances, and acceleration limits.
Results
Data collected in field experiments revealed that average fuel consumption was improved in vehicles equipped with the Eco-Approach and Departure application. As shown in the table below, results from August 2015 indicate that a driver with a DVI saw 7% fuel savings over un-informed drivers, while a driver with partial automation and the GlidePath application saw 22% fuel savings over the un- informed driver. These results show a 15% fuel improvement from a driver trying to follow a DVI speed recommendation to the partial automated GlidePath application. These improvements are due to minimizing the lag in speed changes to keep the optimal speed and approach.
Table 4-2: Relative Savings in Fuel Consumption (%) between Different Driving Modes for the GlidePath Prototype Application
Future Research Opportunities
This pioneering work has established a solid foundation for continued research and innovation involving variable signal timing, accommodating other vehicles in the intersection, and investigating multi-signal applications. The project will continue through the Crash Avoidance Metrics Partnership (CAMP), a consortium of twelve vehicle manufacturers who will first further investigate the feasibility of this application. Opportunities for future research with the GlidePath Prototype include consideration of: testing with multiple equipped vehicles—including integration of CACC capabilities between multiple vehicles, testing at multiple intersections (i.e., a corridor), testing on a real-world corridor with traffic, and testing with an enhanced algorithm that considers actuated traffic signal timing plans and queues at intersection.
Phase 2 7 12 17 22 27 2 7 12 17 22 27 Average
DVI vs. Uniformed
-11.8
-11.8
7.6 5.2 7.6 12.1 25.1 37.8 -18.3
21.7 -0.6 13.5 7.3
Automated vs. Uninformed
4.7 7.6 35.3 20.9 20.3 31.7 32.7 47.9 -3.9 26.5 20.1 22.9 22.2
Automated versus DVI
14.7 17.3 29.9 16.6 13.8 22.4 10.1 16.3 12.2 6.1 20.5 10.8 15.9
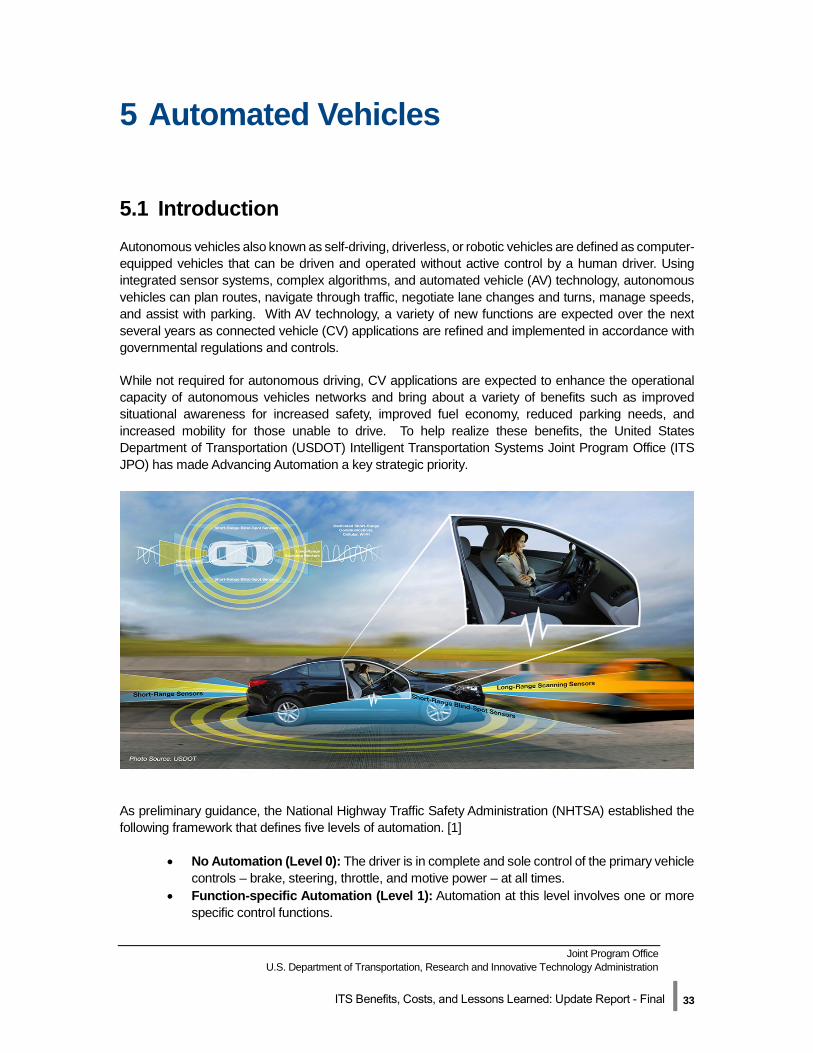
Joint Program Office U.S. Department of Transportation, Research and Innovative Technology Administration
ITS Benefits, Costs, and Lessons Learned: Update Report - Final | 33
5 Automated Vehicles
5.1 Introduction Autonomous vehicles also known as self-driving, driverless, or robotic vehicles are defined as computer-equipped vehicles that can be driven and operated without active control by a human driver. Using integrated sensor systems, complex algorithms, and automated vehicle (AV) technology, autonomous vehicles can plan routes, navigate through traffic, negotiate lane changes and turns, manage speeds, and assist with parking. With AV technology, a variety of new functions are expected over the next several years as connected vehicle (CV) applications are refined and implemented in accordance with governmental regulations and controls.
While not required for autonomous driving, CV applications are expected to enhance the operational capacity of autonomous vehicles networks and bring about a variety of benefits such as improved situational awareness for increased safety, improved fuel economy, reduced parking needs, and increased mobility for those unable to drive. To help realize these benefits, the United States Department of Transportation (USDOT) Intelligent Transportation Systems Joint Program Office (ITS JPO) has made Advancing Automation a key strategic priority.
As preliminary guidance, the National Highway Traffic Safety Administration (NHTSA) established the following framework that defines five levels of automation. [1]
• No Automation (Level 0): The driver is in complete and sole control of the primary vehiclecontrols – brake, steering, throttle, and motive power – at all times.
• Function-specific Automation (Level 1): Automation at this level involves one or morespecific control functions.
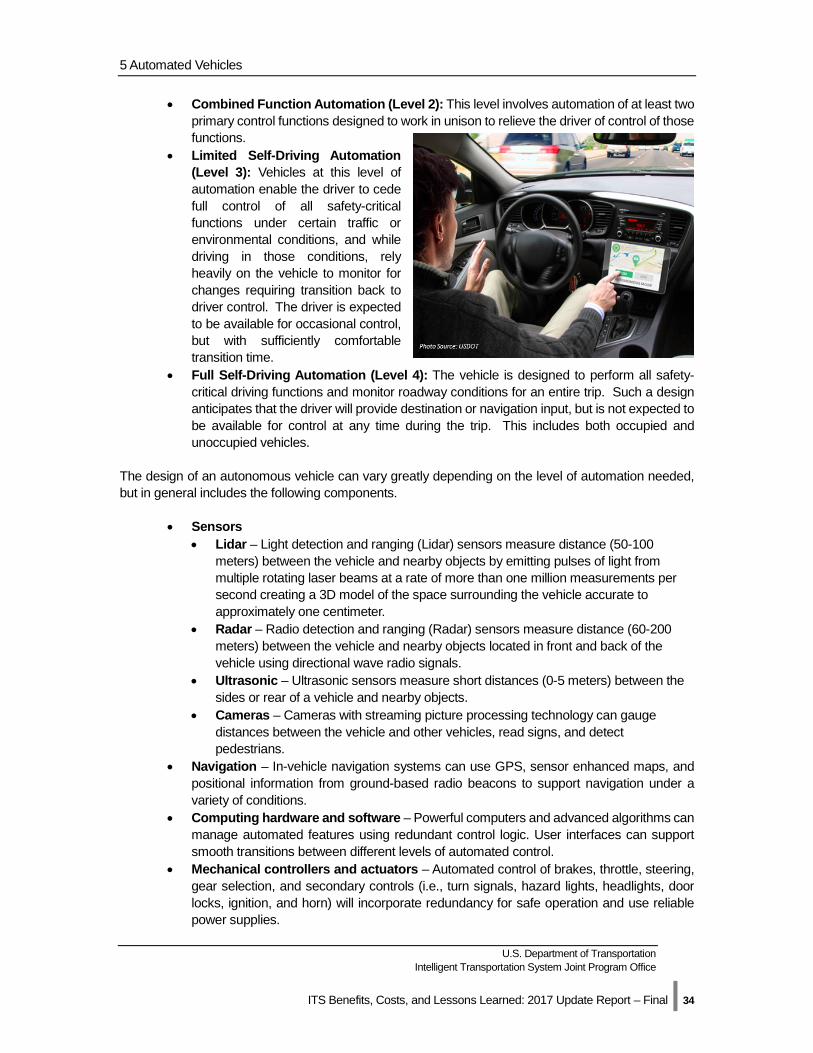
5 Automated Vehicles
U.S. Department of Transportation Intelligent Transportation System Joint Program Office
ITS Benefits, Costs, and Lessons Learned: 2017 Update Report – Final | 34
• Combined Function Automation (Level 2): This level involves automation of at least two primary control functions designed to work in unison to relieve the driver of control of those functions.
• Limited Self-Driving Automation (Level 3): Vehicles at this level of automat ion enable the driver to cede full control of all safety-critical functions under certain traffic or environmental conditions, and while driving in those conditions, rely heavily on the vehicle to monitor for changes requiring transition back to driver control. The driver is expected to be available for occasional control, but with sufficiently comfortable transition time.
• Full Self-Driving Automation (Level 4): The vehicle is designed to perform all safety-critical driving functions and monitor roadway conditions for an entire trip. Such a design anticipates that the driver will provide destination or navigation input, but is not expected to be available for control at any time during the trip. This includes both occupied and unoccupied vehicles.
The design of an autonomous vehicle can vary greatly depending on the level of automation needed, but in general includes the following components.
• Sensors • Lidar – Light detection and ranging (Lidar) sensors measure distance (50-100
meters) between the vehicle and nearby objects by emitting pulses of light from multiple rotating laser beams at a rate of more than one million measurements per second creating a 3D model of the space surrounding the vehicle accurate to approximately one centimeter.
• Radar – Radio detection and ranging (Radar) sensors measure distance (60-200 meters) between the vehicle and nearby objects located in front and back of the vehicle using directional wave radio signals.
• Ultrasonic – Ultrasonic sensors measure short distances (0-5 meters) between the sides or rear of a vehicle and nearby objects.
• Cameras – Cameras with streaming picture processing technology can gauge distances between the vehicle and other vehicles, read signs, and detect pedestrians.
• Navigation – In-vehicle navigation systems can use GPS, sensor enhanced maps, and positional information from ground-based radio beacons to support navigation under a variety of conditions.
• Computing hardware and software – Powerful computers and advanced algorithms can manage automated features using redundant control logic. User interfaces can support smooth transitions between different levels of automated control.
• Mechanical controllers and actuators – Automated control of brakes, throttle, steering, gear selection, and secondary controls (i.e., turn signals, hazard lights, headlights, door locks, ignition, and horn) will incorporate redundancy for safe operation and use reliable power supplies.
5 Automated Vehicles
U.S. Department of Transportation Intelligent Transportation System Joint Program Office
ITS Benefits, Costs, and Lessons Learned: 2017 Update Report – Final | 35
• Wireless communications – Dedicated Short Range Communications (DSRC) along with mobile communication networks, can support a wide variety of CV and AV applications.
Although autonomous vehicles do not require wireless connectivity to operate, transportation agencies will likely need CV applications to effectively manage operations in the future. Thus, over the past several years the federal government and industry have focused heavily on developing guidance and standards for developing CV systems to assure that future applications will be safe and interoperable. AV technology, however, has evolved outside the scope of government oversight. Driven by market forces automakers and industry have discovered new opportunities to expand into growing AV technology markets. Industry experts and government agencies now agree that within the next 10 years it is likely that autonomous vehicles will be available to the general public and industry standards will be in place to support CV applications nationwide.
Recent initiatives such as WAYMO (previously known as the Google self-driving car project) have shown substantial progress. Since 2009, 23 of its self-driving cars have driven over one million miles on public roads in Texas and California proving that autonomous vehicles can be safe if not safer than human drivers who on average cause a motor vehicle crash every 165,000 miles (assuming an average driver travels up to 16,500 miles per year and reports a crash claim every 10 years). [2, 3] Although autonomous vehicles will need to be driven hundreds of millions of miles or more to fully assess their reliability, there is great potential for positive safety impacts. Motor vehicle crashes in the United States have social and economic costs of about $800 billion per year, 70 to 90 percent of which are attributable to human error. [4, 5]
A number of automakers continue to develop and implement AV technology. In October 2015, Tesla released a prototype of its Autopilot system designed to automate control of both speed and steering functions. Autopilot is expected to be the first system with Level 2 automation made available to the general public in the United States.
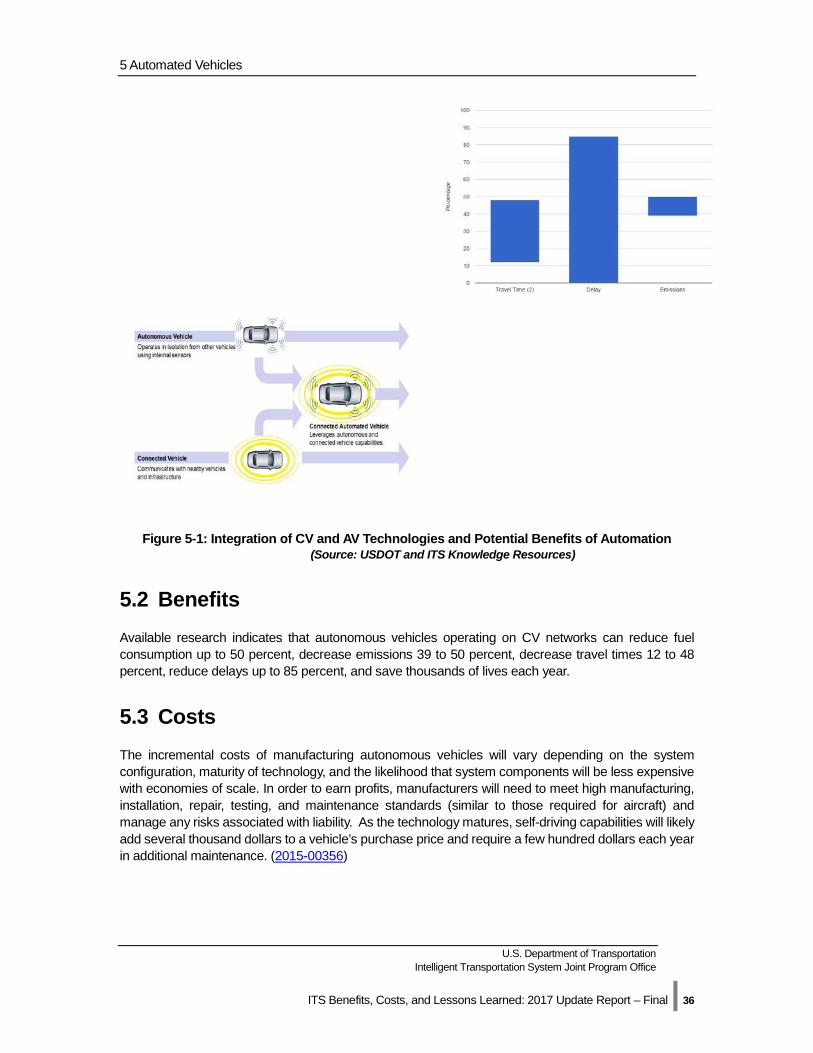
5 Automated Vehicles
U.S. Department of Transportation Intelligent Transportation System Joint Program Office
ITS Benefits, Costs, and Lessons Learned: 2017 Update Report – Final | 36
Figure 5-1: Integration of CV and AV Technologies and Potential Benefits of Automation (Source: USDOT and ITS Knowledge Resources)
5.2 Benefits Available research indicates that autonomous vehicles operating on CV networks can reduce fuel consumption up to 50 percent, decrease emissions 39 to 50 percent, decrease travel times 12 to 48 percent, reduce delays up to 85 percent, and save thousands of lives each year.
5.3 Costs The incremental costs of manufacturing autonomous vehicles will vary depending on the system configuration, maturity of technology, and the likelihood that system components will be less expensive with economies of scale. In order to earn profits, manufacturers will need to meet high manufacturing, installation, repair, testing, and maintenance standards (similar to those required for aircraft) and manage any risks associated with liability. As the technology matures, self-driving capabilities will likely add several thousand dollars to a vehicle’s purchase price and require a few hundred dollars each year in additional maintenance. (2015-00356)
Automated vehicles can save more than 1000 lives annually
with 10 percent market penetration.
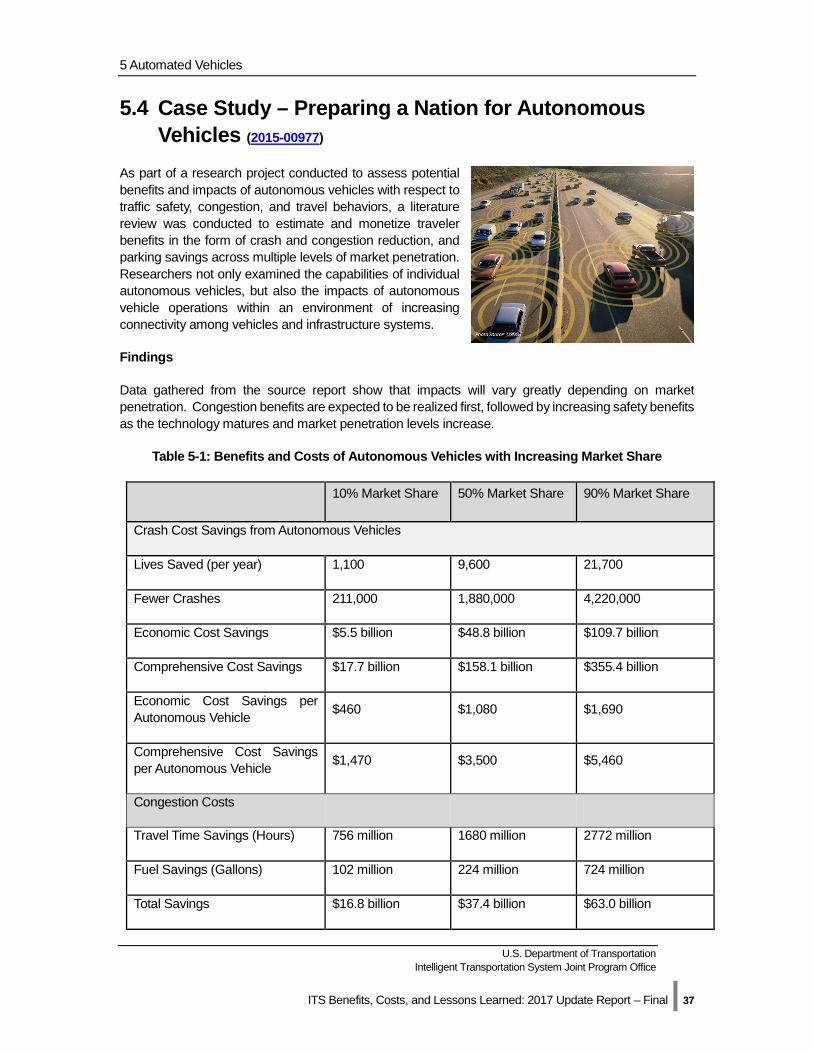
5 Automated Vehicles
U.S. Department of Transportation Intelligent Transportation System Joint Program Office
ITS Benefits, Costs, and Lessons Learned: 2017 Update Report – Final | 37
5.4 Case Study – Preparing a Nation for Autonomous Vehicles (2015-00977)
As part of a research project conducted to assess potential benefits and impacts of autonomous vehicles with respect to traffic safety, congestion, and travel behaviors, a literature review was conducted to estimate and monetize traveler benefits in the form of crash and congestion reduction, and parking savings across multiple levels of market penetration. Researchers not only examined the capabilities of individual autonomous vehicles, but also the impacts of autonomous vehicle operations within an environment of increasing connectivity among vehicles and infrastructure systems.
Findings
Data gathered from the source report show that impacts will vary greatly depending on market penetration. Congestion benefits are expected to be realized first, followed by increasing safety benefits as the technology matures and market penetration levels increase.
Table 5-1: Benefits and Costs of Autonomous Vehicles with Increasing Market Share
10% Market Share 50% Market Share 90% Market Share
Crash Cost Savings from Autonomous Vehicles
Lives Saved (per year) 1,100 9,600 21,700
Fewer Crashes 211,000 1,880,000 4,220,000
Economic Cost Savings $5.5 billion $48.8 billion $109.7 billion
Comprehensive Cost Savings $17.7 billion $158.1 billion $355.4 billion
Economic Cost Savings per Autonomous Vehicle $460 $1,080 $1,690
Comprehensive Cost Savings per Autonomous Vehicle $1,470 $3,500 $5,460
Congestion Costs
Travel Time Savings (Hours) 756 million 1680 million 2772 million
Fuel Savings (Gallons) 102 million 224 million 724 million
Total Savings $16.8 billion $37.4 billion $63.0 billion
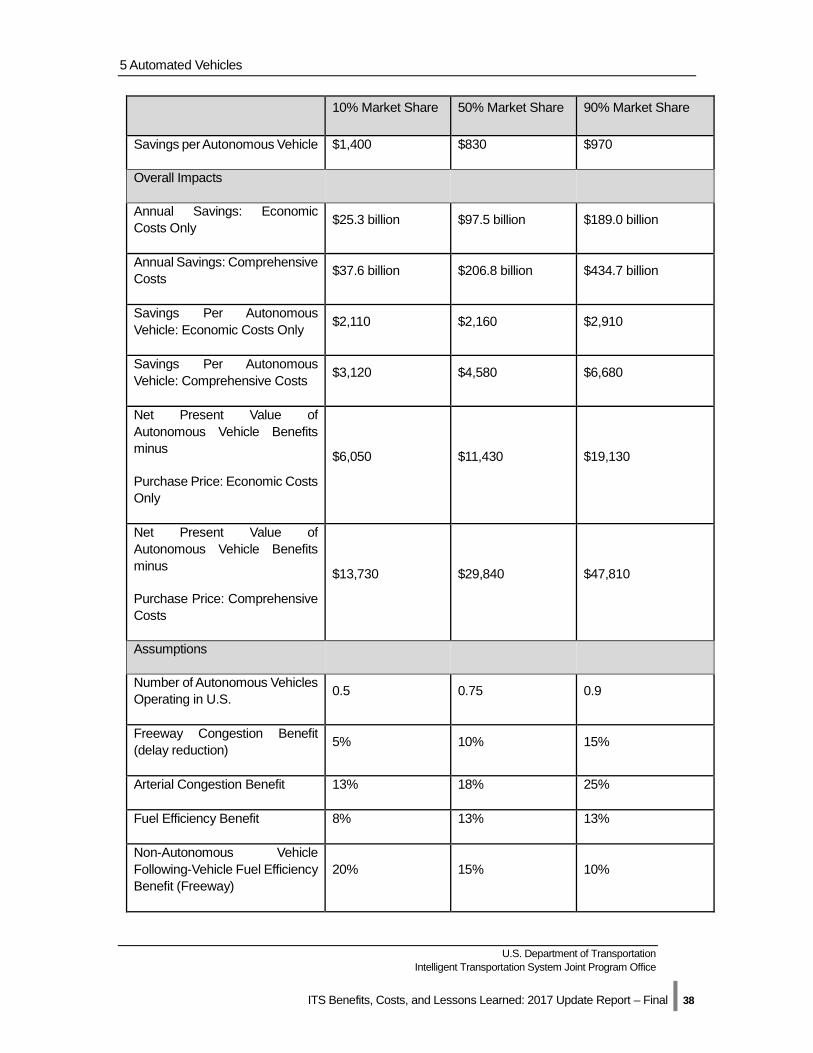
5 Automated Vehicles
U.S. Department of Transportation Intelligent Transportation System Joint Program Office
ITS Benefits, Costs, and Lessons Learned: 2017 Update Report – Final | 38
10% Market Share 50% Market Share 90% Market Share
Savings per Autonomous Vehicle $1,400 $830 $970
Overall Impacts
Annual Savings: Economic Costs Only $25.3 billion $97.5 billion $189.0 billion
Annual Savings: Comprehensive Costs $37.6 billion $206.8 billion $434.7 billion
Savings Per Autonomous Vehicle: Economic Costs Only $2,110 $2,160 $2,910
Savings Per Autonomous Vehicle: Comprehensive Costs $3,120 $4,580 $6,680
Net Present Value of Autonomous Vehicle Benefits minus
Purchase Price: Economic Costs Only
$6,050 $11,430 $19,130
Net Present Value of Autonomous Vehicle Benefits minus
Purchase Price: Comprehensive Costs
$13,730 $29,840 $47,810
Assumptions
Number of Autonomous Vehicles Operating in U.S. 0.5 0.75 0.9
Freeway Congestion Benefit (delay reduction) 5% 10% 15%
Arterial Congestion Benefit 13% 18% 25%
Fuel Efficiency Benefit 8% 13% 13%
Non-Autonomous Vehicle Following-Vehicle Fuel Efficiency Benefit (Freeway)
20% 15% 10%
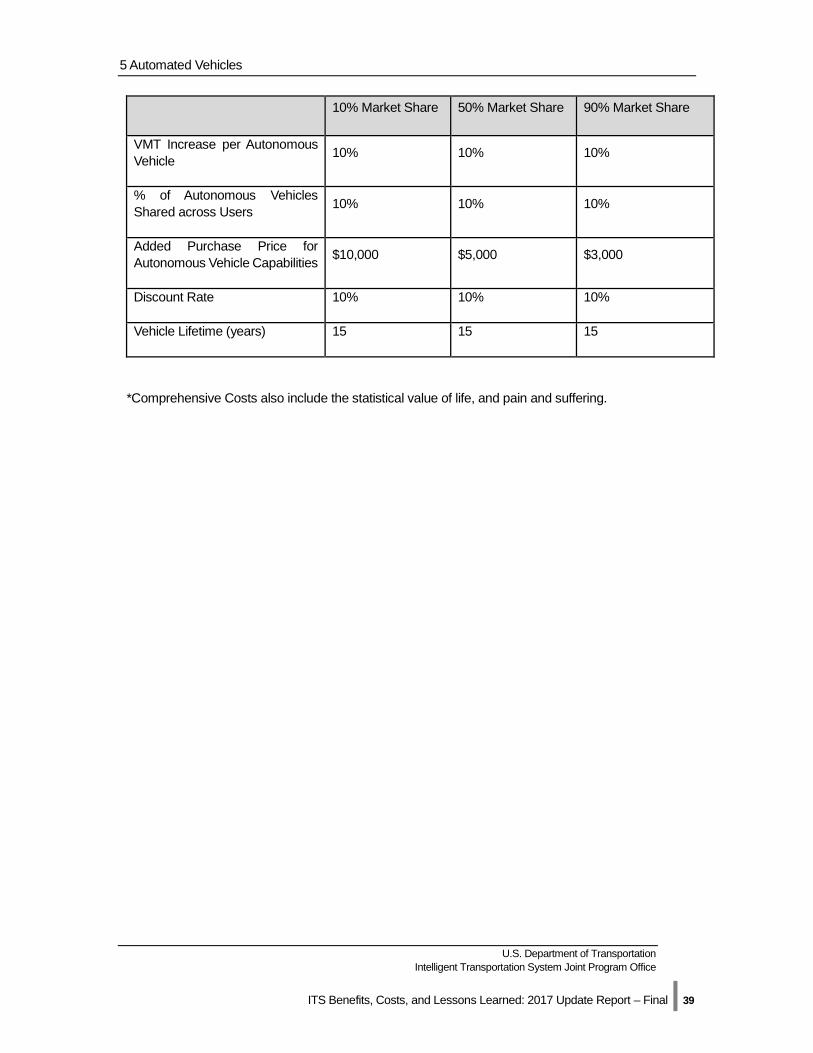
5 Automated Vehicles
U.S. Department of Transportation Intelligent Transportation System Joint Program Office
ITS Benefits, Costs, and Lessons Learned: 2017 Update Report – Final | 39
10% Market Share 50% Market Share 90% Market Share
VMT Increase per Autonomous Vehicle 10% 10% 10%
% of Autonomous Vehicles Shared across Users 10% 10% 10%
Added Purchase Price for Autonomous Vehicle Capabilities $10,000 $5,000 $3,000
Discount Rate 10% 10% 10%
Vehicle Lifetime (years) 15 15 15
*Comprehensive Costs also include the statistical value of life, and pain and suffering.
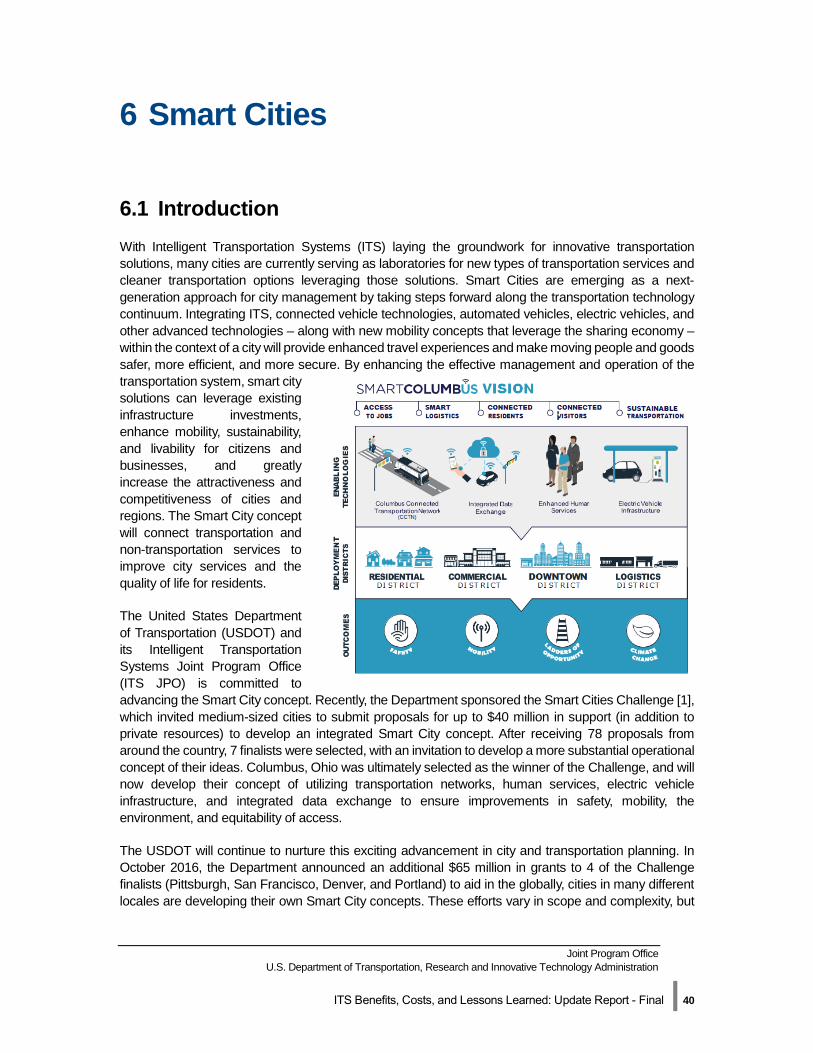
Joint Program Office U.S. Department of Transportation, Research and Innovative Technology Administration
ITS Benefits, Costs, and Lessons Learned: Update Report - Final | 40
6 Smart Cities
6.1 Introduction With Intelligent Transportation Systems (ITS) laying the groundwork for innovative transportation solutions, many cities are currently serving as laboratories for new types of transportation services and cleaner transportation options leveraging those solutions. Smart Cities are emerging as a next-generation approach for city management by taking steps forward along the transportation technology continuum. Integrating ITS, connected vehicle technologies, automated vehicles, electric vehicles, and other advanced technologies – along with new mobility concepts that leverage the sharing economy – within the context of a city will provide enhanced travel experiences and make moving people and goods safer, more efficient, and more secure. By enhancing the effective management and operation of the transportation system, smart city solutions can leverage existing infrastructure investments, enhance mobility, sustainability, and livability for citizens and businesses, and greatly increase the attractiveness and competitiveness of cities and regions. The Smart City concept will connect transportation and non-transportation services to improve city services and the quality of life for residents.
The United States Department of Transportation (USDOT) and its Intelligent Transportation Systems Joint Program Office (ITS JPO) is committed to advancing the Smart City concept. Recently, the Department sponsored the Smart Cities Challenge [1], which invited medium-sized cities to submit proposals for up to $40 million in support (in addition to private resources) to develop an integrated Smart City concept. After receiving 78 proposals from around the country, 7 finalists were selected, with an invitation to develop a more substantial operational concept of their ideas. Columbus, Ohio was ultimately selected as the winner of the Challenge, and will now develop their concept of utilizing transportation networks, human services, electric vehicle infrastructure, and integrated data exchange to ensure improvements in safety, mobility, the environment, and equitability of access.
The USDOT will continue to nurture this exciting advancement in city and transportation planning. In October 2016, the Department announced an additional $65 million in grants to 4 of the Challenge finalists (Pittsburgh, San Francisco, Denver, and Portland) to aid in the globally, cities in many different locales are developing their own Smart City concepts. These efforts vary in scope and complexity, but
6 Smart Cities
U.S. Department of Transportation Intelligent Transportation System Joint Program Office
ITS Benefits, Costs, and Lessons Learned: 2017 Update Report – Final | 41
share the USDOT’s vision of improving mobility, connectivity, responsiveness, and concern for the environment and social equity. Notable deployments are currently underway in:
• Barcelona, Spain • The Songdo International Business District (Seoul, South Korea) • Singapore • Vienna, Austria • Milton Keynes, United Kingdom
6.2 Benefits The USDOT expects Smart City deployments to realize several important benefits, including:
• Improved Safety: by using advanced technologies, including connected vehicle technologies, to reduce the number of collisions, fatalities, and injuries for both vehicle occupants and non-vehicle occupants.
• Enhanced Mobility: by providing real-time traveler information and emerging mobility services to improve personal mobility for all citizens including people with lower incomes, people with disabilities, and older adults.
• Enhanced Ladders of Opportunity: by providing access to advanced technology and its benefits for underserved areas and residents, increasing connectivity to employment, education and other services, and contributing to revitalization by incentivize reinvestment in underserved communities.
• Climate Change/Environmental Mitigation: by implementing advanced technologies and policies that support a more sustainable and cost-effective relationship between transportation and the environment through more efficient fuel use and emissions reductions.
The Smart Cities Council’s Readiness Guide [2] provides a similar explanation of expected benefits, as well as advice for practitioners considering or moving towards deployment.
6.3 Costs As a new planning concept that is still in its formative stages, definitive cost information for Smart City deployments is currently difficult to accurately ascertain. A recent Fortune article [3] has found that the Barcelona, Spain Smart City Deployment, a large-scale citywide initiative, was funded through $230 million of taxpayer funding. Private and industry partners are expected to contribute funding and expertise for most deployments.
The Smart Cities Challenge received 78 applications from mid-
sized cities, further evaluated 7 finalists, and selected Columbus, Ohio for deployment support.
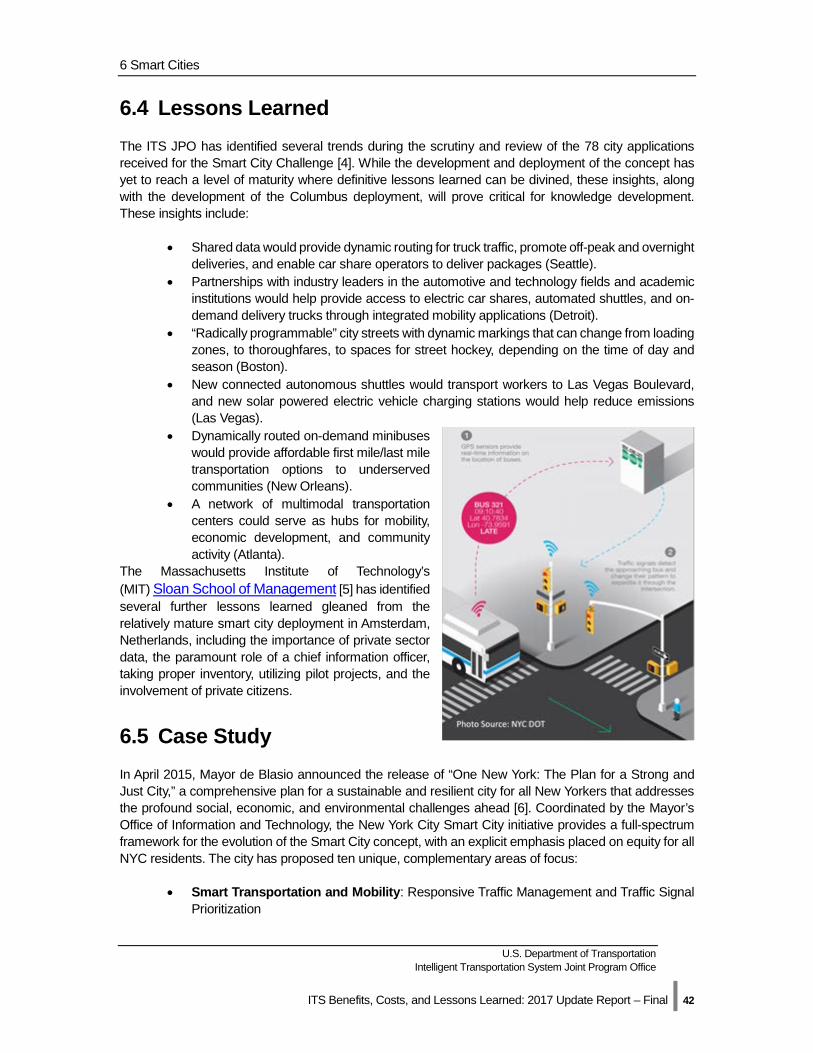
6 Smart Cities
U.S. Department of Transportation Intelligent Transportation System Joint Program Office
ITS Benefits, Costs, and Lessons Learned: 2017 Update Report – Final | 42
6.4 Lessons Learned The ITS JPO has identified several trends during the scrutiny and review of the 78 city applications received for the Smart City Challenge [4]. While the development and deployment of the concept has yet to reach a level of maturity where definitive lessons learned can be divined, these insights, along with the development of the Columbus deployment, will prove critical for knowledge development. These insights include:
• Shared data would provide dynamic routing for truck traffic, promote off-peak and overnight deliveries, and enable car share operators to deliver packages (Seattle).
• Partnerships with industry leaders in the automotive and technology fields and academic institutions would help provide access to electric car shares, automated shuttles, and on-demand delivery trucks through integrated mobility applications (Detroit).
• “Radically programmable” city streets with dynamic markings that can change from loading zones, to thoroughfares, to spaces for street hockey, depending on the time of day and season (Boston).
• New connected autonomous shuttles would transport workers to Las Vegas Boulevard, and new solar powered electric vehicle charging stations would help reduce emissions (Las Vegas).
• Dynamically routed on-demand minibuses would provide affordable first mile/last mile transportation options to underserved communities (New Orleans).
• A network of multimodal transportation centers could serve as hubs for mobility, economic development, and community activity (Atlanta).
The Massachusetts Institute of Technology’s (MIT) Sloan School of Management [5] has identified several further lessons learned gleaned from the relatively mature smart city deployment in Amsterdam, Netherlands, including the importance of private sector data, the paramount role of a chief information officer, taking proper inventory, utilizing pilot projects, and the involvement of private citizens.
6.5 Case Study In April 2015, Mayor de Blasio announced the release of “One New York: The Plan for a Strong and Just City,” a comprehensive plan for a sustainable and resilient city for all New Yorkers that addresses the profound social, economic, and environmental challenges ahead [6]. Coordinated by the Mayor’s Office of Information and Technology, the New York City Smart City initiative provides a full-spectrum framework for the evolution of the Smart City concept, with an explicit emphasis placed on equity for all NYC residents. The city has proposed ten unique, complementary areas of focus:
• Smart Transportation and Mobility: Responsive Traffic Management and Traffic Signal Prioritization
6 Smart Cities
U.S. Department of Transportation Intelligent Transportation System Joint Program Office
ITS Benefits, Costs, and Lessons Learned: 2017 Update Report – Final | 43
• Smart Buildings and Infrastructure: Smart Indoor Lighting and Wireless Water Meters
• Smart Energy and Environment: Smart Waste Management and Water Quality Monitoring
• Smart Public Health and Safety: Air Quality Monitoring and Real-time Gunshot Detection
• Smart Government and Community: Snow Plow Tracking and 24/7 Service Requests
The transportation elements of New York City’s plan will provide mobility and environment benefits for residents. The Midtown in Motion traffic management system uses real-time traffic flow information gathered from a variety of sources, including microwave sensors, traffic cameras, and EZPass transponders. This information is transmitted wirelessly to the NYCDOT’s TMC (traffic management center), where staff is alerted to congestion issues and alters signal timing to mitigate congestion. This system has resulted in a 10% improvement in travel times, with additional environmental benefits from reduced idling. Due to this initial success, Midtown in Motion has expanded in size and has recently been introduced to the Flushing area of Queens. In addition, the City’s use of the Transit Signal Priority (TSP) system has improved the efficiency and reliability of bus transit services. A bus equipped with TSP can “hold” a green signal as it approaches an intersection, or accelerate the cycle if the signal is currently red. Equipped buses utilize GPS and location-based traffic software to communicate with the TMC using the City’s NYCWin secure wireless network. This technology has resulted in a 20% reduction in bus transit delays along routes in Manhattan, Staten Island, and the Bronx. These and other Smart City efforts have been facilitated by the City’s DataBridge data sharing platform, which incorporates data from 50 source systems across approximately 20 City and other organizations.
New York City’s transportation initiatives have resulted in a 10%
reduction in travel times and a 20% reduction in transit bus delays along
selected routes.
Joint Program Office U.S. Department of Transportation, Research and Innovative Technology Administration
ITS Benefits, Costs, and Lessons Learned: Update Report - Final | 44
7 Accessible Transportation
7.1 Introduction In 2010, the U.S. Census reported that approximately 56.7 million people in the U.S. (18.7 percent of the U.S. population) had some type of disability. One study found that over 6 million people with disabilities have difficulties obtaining the transportation they need [1]; nearly one-third of people with disabilities reported having inadequate access to transportation [2]. This is an important consideration as transportation has long been thought to be instrumental in enhancing access to education, jobs, healthcare, and independent living within communities. Individuals with disabilities currently suffer a 63 percent unemployment rate, with half of the household income and three times the poverty rate of people without disabilities. Recently, a user needs assessment on transportation challenges faced by people with disabilities, veterans with disabilities, and older adults, conducted by the United States Department of Transportation’s Accessible Transportation Technology Research Initiative (ATTRI), concluded that needs and barriers vary by sub-population and type of disability. The assessment identified mobility concerns as barriers to employment, recreational and retail opportunities, and other meaningful lifetime activities [3]. “Independent mobility” refers to the ability of an individual to travel to a destination without being accompanied by a family member or caregiver, regardless of functional ability. Specific barriers identified by ATTRI stakeholders included lack of or inaccessible signage, maps, and announcements; lack of information on arrival times, transfer times, and travel distance; and inconsistent accessible pathway infrastructure. Users asked for amenity information; real-time transportation information; and safety, security, and emergency information.
The USDOT ATTRI program is currently seeking to fund application development in the 4 application areas defined by the program. The Federal Transit Administration and Intelligent Transportation Systems Joint Program Office (ITS JPO) are jointly funding work in the Smart Wayfinding and Navigation, Pre-trip Concierge and Virtualization, and Smart Intersection Crossing applications areas. The USDOT is collaborating with the National Institute on Disability, Independent Living, and Rehabilitation Research (NIDILRR) to fund the Robotics and Automation application area.
7.2 Benefits Many research project across the country and world are applying advanced technology to improve independent mobility for people with disabilities. Access to mobility-improving technologies will increase with further testing, prototyping, and declining costs. Currently, most accessible transportation projects deployed and in use are focused on providing information in different formats (audio, visual, and other languages), which can improve accessibility for many people.
7 Accessible Transportation
U.S. Department of Transportation Intelligent Transportation System Joint Program Office
ITS Benefits, Costs, and Lessons Learned: 2017 Update Report – Final | 45
The ITS Knowledge resource database contains several examples of successful accessibility-enhancing deployments. Located in Williamsport, PA, River Valley Transit (RVT) provides real-time customer information at its transit center. River Valley Transit uses a combination of automatic vehicle location (AVL) and mobile data terminals (MDT) technology to provide real-time in-terminal customer information. The Traveler Information System (TIS) informs customers both visually and audibly as to which of the 10 loading bays buses will arrive at and depart from. It also gives customers a 20-second notification before buses depart on their next trip. The system even notifies drivers when they have pulled into the wrong bus bay.
The successful implementation of the TIS demonstrated a number of benefits for customers. The transit agency increased accessibility for persons with disabilities including to the customer information systems that include visual and audio announcements are especially helpful to people with disabilities. In addition to these technology-specific benefits, the research team identified a number of benefits.
• Increased community confidence – ITS deployments have the potential to increase community confidence in the agency’s ability to operate an efficient, effective transportation system.
• Potential for increased ridership and revenue – ITS increases the attractiveness of the transit service, which could potentially increase ridership and farebox revenues.
This factsheet will serve as a repository for costs and benefits that are found from the current ATTRI work, as well as other efforts outside of the USDOT.
7.3 Case Study The Federal Highway Administration’s (FHWA) Office of Operations Research and Development (R&D), with the Exploratory Advanced Research (EAR) Program, intends to examine current and future advancements in ITS and other technologies that could provide broad safety and mobility benefits for pedestrians, and targeted assistive technology to improve accessible transportation for people with disabilities.
FHWA’s EAR Program focuses on long-term, high-risk research with high benefit potential. The program addresses underlying gaps faced by applied highway research programs, anticipates emerging issues with national implications, and reflects broad transportation industry goals and objectives. It also aims to identify opportunities and share knowledge and experience on how various technologies, such as mobile computing, computer vision, artificial intelligence, and robotics could be integrated to assist people with disabilities to be more mobile and independent. Three EAR projects are introduced below that are either completed or ongoing and related specifically to advanced technologies for individuals with disabilities.
Enhancing Situation Awareness
Exploring and developing situation awareness and assistive navigation technologies is the goal of the EAR Program project “Intelligent Situation Awareness and Navigation Aid for Visually Impaired Persons.” The first phase, conducted by City College of the City University of New York, involves the exploration and development of situation awareness and assistive navigation technologies that can provide visually impaired persons with obstacle avoidance and intelligent wayfinding capabilities in indoor environments. The second phase of this project will refine this technology and extend the research to outdoor pedestrian environments. The aim is to provide blind users with waypoint
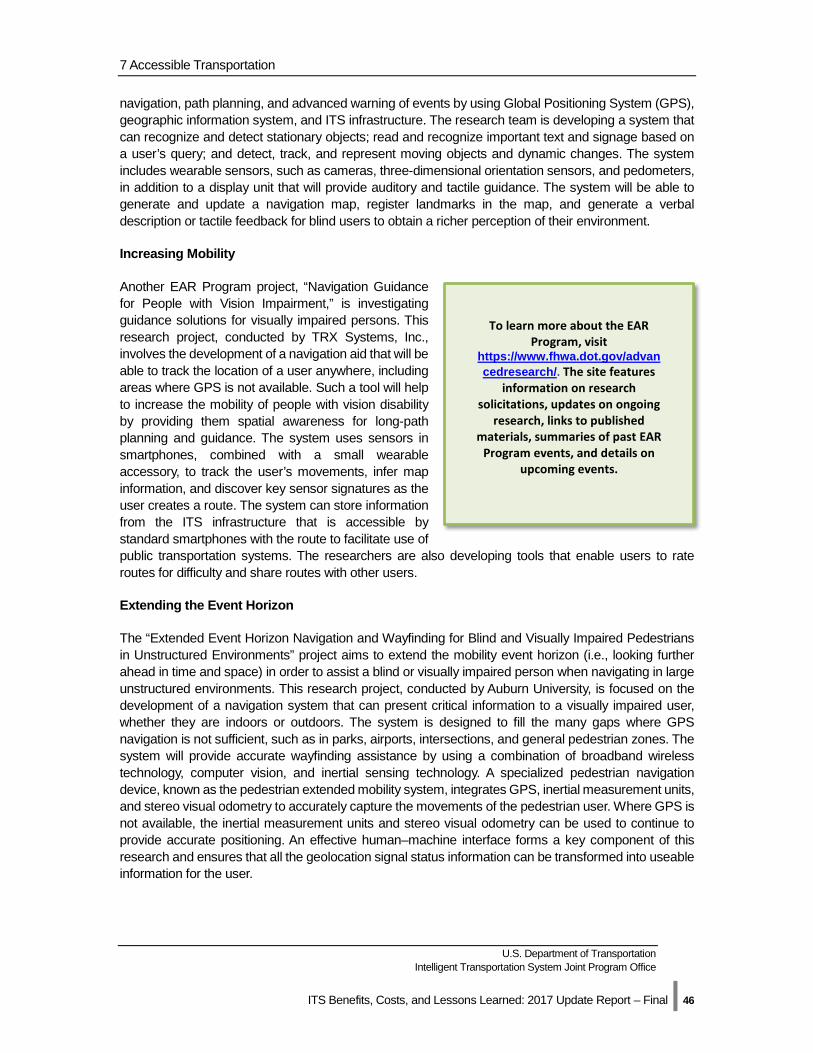
7 Accessible Transportation
U.S. Department of Transportation Intelligent Transportation System Joint Program Office
ITS Benefits, Costs, and Lessons Learned: 2017 Update Report – Final | 46
navigation, path planning, and advanced warning of events by using Global Positioning System (GPS), geographic information system, and ITS infrastructure. The research team is developing a system that can recognize and detect stationary objects; read and recognize important text and signage based on a user’s query; and detect, track, and represent moving objects and dynamic changes. The system includes wearable sensors, such as cameras, three-dimensional orientation sensors, and pedometers, in addition to a display unit that will provide auditory and tactile guidance. The system will be able to generate and update a navigation map, register landmarks in the map, and generate a verbal description or tactile feedback for blind users to obtain a richer perception of their environment.
Increasing Mobility
Another EAR Program project, “Navigation Guidance for People with Vision Impairment,” is investigating guidance solutions for visually impaired persons. This research project, conducted by TRX Systems, Inc., involves the development of a navigation aid that will be able to track the location of a user anywhere, including areas where GPS is not available. Such a tool will help to increase the mobility of people with vision disability by providing them spatial awareness for long-path planning and guidance. The system uses sensors in smartphones, combined with a small wearable accessory, to track the user’s movements, infer map information, and discover key sensor signatures as the user creates a route. The system can store information from the ITS infrastructure that is accessible by standard smartphones with the route to facilitate use of public transportation systems. The researchers are also developing tools that enable users to rate routes for difficulty and share routes with other users.
Extending the Event Horizon
The “Extended Event Horizon Navigation and Wayfinding for Blind and Visually Impaired Pedestrians in Unstructured Environments” project aims to extend the mobility event horizon (i.e., looking further ahead in time and space) in order to assist a blind or visually impaired person when navigating in large unstructured environments. This research project, conducted by Auburn University, is focused on the development of a navigation system that can present critical information to a visually impaired user, whether they are indoors or outdoors. The system is designed to fill the many gaps where GPS navigation is not sufficient, such as in parks, airports, intersections, and general pedestrian zones. The system will provide accurate wayfinding assistance by using a combination of broadband wireless technology, computer vision, and inertial sensing technology. A specialized pedestrian navigation device, known as the pedestrian extended mobility system, integrates GPS, inertial measurement units, and stereo visual odometry to accurately capture the movements of the pedestrian user. Where GPS is not available, the inertial measurement units and stereo visual odometry can be used to continue to provide accurate positioning. An effective human–machine interface forms a key component of this research and ensures that all the geolocation signal status information can be transformed into useable information for the user.
To learn more about the EAR Program, visit
https://www.fhwa.dot.gov/advancedresearch/. The site features
information on research solicitations, updates on ongoing
research, links to published materials, summaries of past EAR
Program events, and details on upcoming events.
7 Accessible Transportation
U.S. Department of Transportation Intelligent Transportation System Joint Program Office
ITS Benefits, Costs, and Lessons Learned: 2017 Update Report – Final | 47
Expected Impacts
The EAR Program plans to continue support for these projects and expects to demonstrate the potential benefits of prototype systems. Moreover, additional investment could result in the development of commercially available systems comprising a combination of software for smartphones and accessory devices similar to those currently sold for self-monitoring or exercise and physical activity. In addition, the integration of local low-cost sensors, such as those found on smartphones, wireless data, and strong algorithms could provide safety and convenience benefits for a range of travelers. New methods for conveying situational awareness that limit distraction from the task of maneuvering through dynamic environments will provide fundamental benefits across a range of travelers, whether on foot, on a bicycle, driving a motorcycle or car, or operating a commercial vehicle.
Joint Program Office U.S. Department of Transportation, Research and Innovative Technology Administration
ITS Benefits, Costs, and Lessons Learned: Update Report - Final | 48
8 Mobility on Demand (MOD)
8.1 Introduction Mobility on Demand (MOD) is a multimodal, integrated, accessible, and connected transportation system in which personalized mobility is a key objective. MOD enables the use of on demand information, real-time data, and predictive analysis to provide individual travelers with transportation choices that best serve their specific needs and circumstances. Modes facilitated through MOD providers can include: carsharing, bikesharing, ridesharing, ridesourcing, microtransit, shuttle services, public transportation, and other emerging transportation solutions.
A number of key trends are laying the foundation for MOD [1]. These include:
• Increasing population. Over the next 30 years, the U.S. population is expected to growby about 70 million, with most of this growth occurring in cities. Growing urbanization willcontinue to put significant strain on city infrastructure and transportation networks.
• Aging population. By 2045, the number of Americans over the age of 65 will increase by77 percent. Older Americans require mobility choices allowing them to age in place.
• 1 in 5 Americans are disabled. Persons with disabilities comprise nearly 20 percent ofthe U.S. population. About one-third of people over age 65 have a disability that limitsmobility.
• Rise of mobile devices. Ninety (90) percent of American adults own a mobile phoneallowing them to access everything from traffic data to transit schedules to inform travelchoices. In addition, 20 percent of adults use their phones for up-to-the-minute traffic ortransit data and smartphones are regularly used for turn-by-turn navigation.
• Millennials waning interest in car ownership. Millennials are becoming less and lessreliant on car ownership compared to previous generations. By the end of the 2000’s, theydrove over 20 percent fewer miles than at the start of the decade. Millennials are the firstgeneration to have access to internet during their formative years and are often earlyadopters of technology solutions including shared-use mobility services.
• Growing popularity of shared mobility and modes. There is growing popularity ofshared mobility and shared modes, such as bikesharing and ridesourcing. The sharingeconomy and new transportation services are providing people with more options, helpingto overcome barriers to the use of non-driving forms of transportation, and shiftingindividuals’ travel choices.
• Big Data era. The transportation sector is increasingly relying on data to drive decisions.Data is projected to grow by 40 percent annually. Data enables innovative transportationoptions such as carsharing, ridesharing, and pop-up bus services.
• Rise of connected vehicles and infrastructure. Data derived from connected vehiclesprovide insights to transportation operators helping to understand demand and assist inpredicting and responding to movements around a city.
The needs of travelers are shifting with these current trends, with travel and mobility demands evolving from an emphasis on private automobile ownership to more flexible, public and private options which
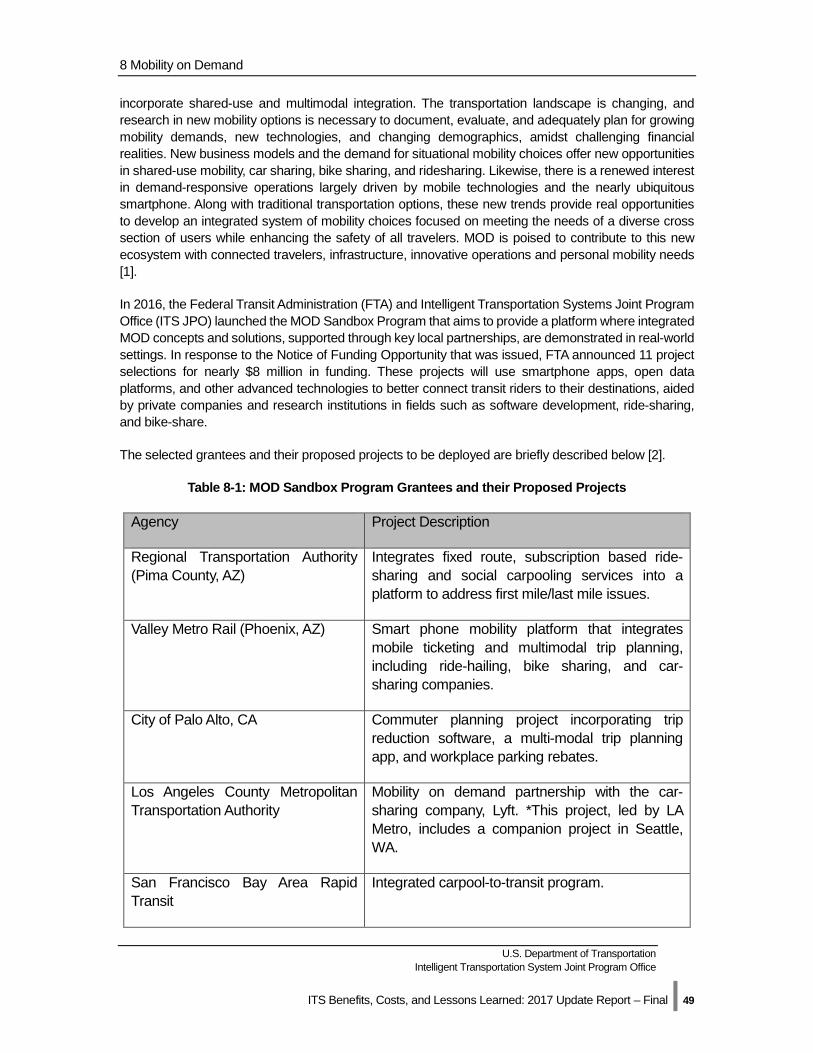
8 Mobility on Demand
U.S. Department of Transportation Intelligent Transportation System Joint Program Office
ITS Benefits, Costs, and Lessons Learned: 2017 Update Report – Final | 49
incorporate shared-use and multimodal integration. The transportation landscape is changing, and research in new mobility options is necessary to document, evaluate, and adequately plan for growing mobility demands, new technologies, and changing demographics, amidst challenging financial realities. New business models and the demand for situational mobility choices offer new opportunities in shared-use mobility, car sharing, bike sharing, and ridesharing. Likewise, there is a renewed interest in demand-responsive operations largely driven by mobile technologies and the nearly ubiquitous smartphone. Along with traditional transportation options, these new trends provide real opportunities to develop an integrated system of mobility choices focused on meeting the needs of a diverse cross section of users while enhancing the safety of all travelers. MOD is poised to contribute to this new ecosystem with connected travelers, infrastructure, innovative operations and personal mobility needs [1].
In 2016, the Federal Transit Administration (FTA) and Intelligent Transportation Systems Joint Program Office (ITS JPO) launched the MOD Sandbox Program that aims to provide a platform where integrated MOD concepts and solutions, supported through key local partnerships, are demonstrated in real-world settings. In response to the Notice of Funding Opportunity that was issued, FTA announced 11 project selections for nearly $8 million in funding. These projects will use smartphone apps, open data platforms, and other advanced technologies to better connect transit riders to their destinations, aided by private companies and research institutions in fields such as software development, ride-sharing, and bike-share.
The selected grantees and their proposed projects to be deployed are briefly described below [2].
Table 8-1: MOD Sandbox Program Grantees and their Proposed Projects
Agency Project Description
Regional Transportation Authority (Pima County, AZ)
Integrates fixed route, subscription based ride-sharing and social carpooling services into a platform to address first mile/last mile issues.
Valley Metro Rail (Phoenix, AZ) Smart phone mobility platform that integrates mobile ticketing and multimodal trip planning, including ride-hailing, bike sharing, and car-sharing companies.
City of Palo Alto, CA Commuter planning project incorporating trip reduction software, a multi-modal trip planning app, and workplace parking rebates.
Los Angeles County Metropolitan Transportation Authority
Mobility on demand partnership with the car-sharing company, Lyft. *This project, led by LA Metro, includes a companion project in Seattle, WA.
San Francisco Bay Area Rapid Transit
Integrated carpool-to-transit program.
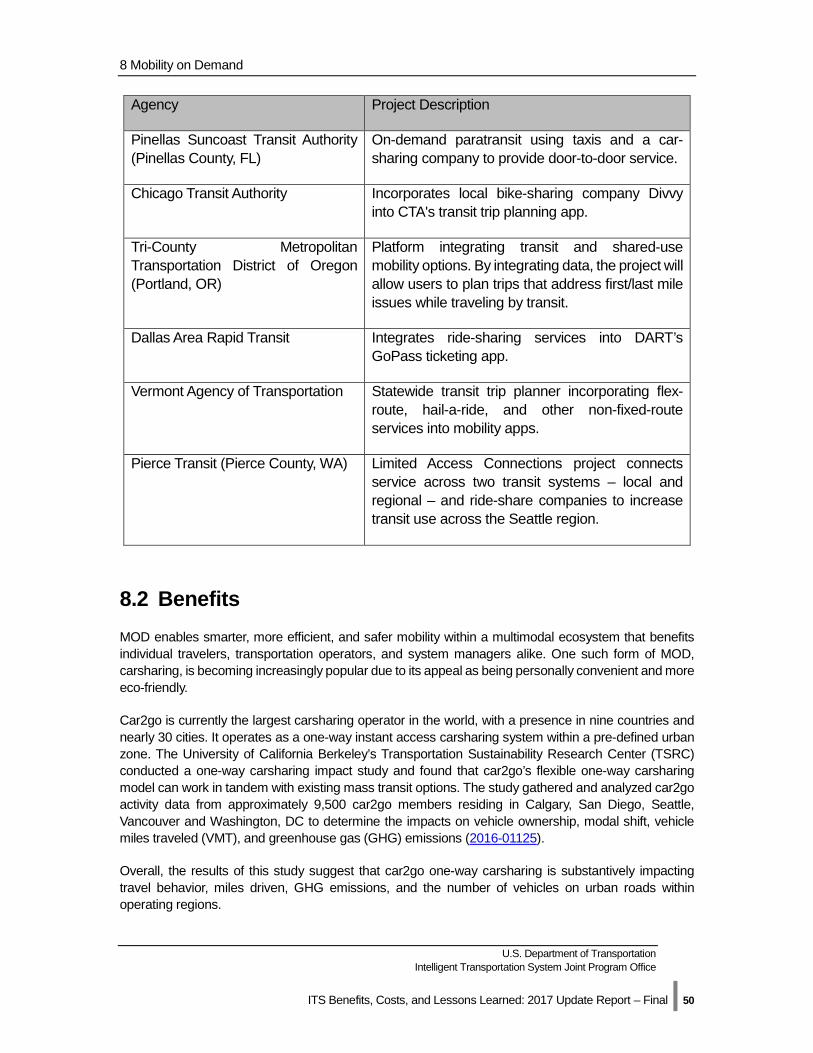
8 Mobility on Demand
U.S. Department of Transportation Intelligent Transportation System Joint Program Office
ITS Benefits, Costs, and Lessons Learned: 2017 Update Report – Final | 50
Agency Project Description
Pinellas Suncoast Transit Authority (Pinellas County, FL)
On-demand paratransit using taxis and a car-sharing company to provide door-to-door service.
Chicago Transit Authority Incorporates local bike-sharing company Divvy into CTA's transit trip planning app.
Tri-County Metropolitan Transportation District of Oregon (Portland, OR)
Platform integrating transit and shared-use mobility options. By integrating data, the project will allow users to plan trips that address first/last mile issues while traveling by transit.
Dallas Area Rapid Transit Integrates ride-sharing services into DART’s GoPass ticketing app.
Vermont Agency of Transportation Statewide transit trip planner incorporating flex-route, hail-a-ride, and other non-fixed-route services into mobility apps.
Pierce Transit (Pierce County, WA) Limited Access Connections project connects service across two transit systems – local and regional – and ride-share companies to increase transit use across the Seattle region.
8.2 Benefits MOD enables smarter, more efficient, and safer mobility within a multimodal ecosystem that benefits individual travelers, transportation operators, and system managers alike. One such form of MOD, carsharing, is becoming increasingly popular due to its appeal as being personally convenient and more eco-friendly.
Car2go is currently the largest carsharing operator in the world, with a presence in nine countries and nearly 30 cities. It operates as a one-way instant access carsharing system within a pre-defined urban zone. The University of California Berkeley’s Transportation Sustainability Research Center (TSRC) conducted a one-way carsharing impact study and found that car2go’s flexible one-way carsharing model can work in tandem with existing mass transit options. The study gathered and analyzed car2go activity data from approximately 9,500 car2go members residing in Calgary, San Diego, Seattle, Vancouver and Washington, DC to determine the impacts on vehicle ownership, modal shift, vehicle miles traveled (VMT), and greenhouse gas (GHG) emissions (2016-01125).
Overall, the results of this study suggest that car2go one-way carsharing is substantively impacting travel behavior, miles driven, GHG emissions, and the number of vehicles on urban roads within operating regions.
8 Mobility on Demand
U.S. Department of Transportation Intelligent Transportation System Joint Program Office
ITS Benefits, Costs, and Lessons Learned: 2017 Update Report – Final | 51
Across the five study cities, it is estimated that:
• Car2go members sold between 1 to 3 vehicles per car2go vehicle (on average) • Car2go members suppressed the need for between 4 to 9 vehicles per car2go vehicle (on
average) • Overall, when considering both effects together, each car2go vehicle removed between 7
to 11 vehicles from the road of the five cities studied (on average) • On balance car2go reduced VMT by 6 percent to 16 percent, per car2go household • GHG emissions were reduced by 4 percent to 18 percent per car2go household
Autonomous mobility on demand (AMOD) is also emerging as a promising solution for the future. As a demonstration case study, preliminary simulations were designed to evaluate the effect of a new policy restricting private vehicle usage within in the high-traffic Central Business District (CBD) in Singapore, with AMOD being introduced as an alternative mode of transportation. The study explored the effects of different fleet sizes on customer waiting times for two models: 1) a station-based model where cars self-drive back to stations, and 2) a free-floating model where cars self-park at drop-off locations. The results found that the free-floating model was able to serve 90 percent of the demand, while the station-based model was only able to serve 68 percent of the requested trips. In addition, the average travel time in the free-floating model was 30 percent less than the station-based model, indicating that unnecessary or empty trips contributing to congestion can be minimized by free-floating AMOD systems (2016-01124).
8.3 Costs A limited number of ITS applications have been deployed to support MOD systems. At the time of this report, cost data were not available for these applications.
8.4 Lessons Learned In 2012, Santa Barbara County Association of Governments (SBCAG) Traffic Solutions and the Community Environmental Council in Santa Barbara County launched the Dynamic Rideshare project, an FHWA Value Pricing Pilot Program project. The project focused on increasing rideshare participation in the Santa Barbara California region by implementing a dynamic ridesharing program through the use of a smartphone application (branded as Carma) that provided near real time carpool matching for individual trips. Riders could open the app and instantly find drivers nearby who wanted to carpool. The system matched drivers and passengers up, allowed users to text or call to meet and facilitated a cashless payment based on mileage. The app also provided the ability to incentivize carpooling through micro payments from Traffic Solutions to the riders and drivers. Similar to Uber or Lyft, users could rate other users from one to five stars, and could leave comments, which helped to add safety and community to the system. Through GPS enabled mobile devices, actual trip data was tracked for all trips within the app.
The pilot was originally planned to be an 18 month pilot, but due to extensive beta testing of multiple versions of the app, as well as limited staff resources, the pilot was extended to three years. Overall, the pilot was unsuccessful at launching Real Time Ridesharing in Santa Barbara County as the Carma application failed to garner as much of a user-base as hoped. Over the three year pilot program, a total of 755 individuals downloaded the app, of which only 122 users made a trip and only a quarter of those users made more than one trip. In total, 274 trips were made which resulted in 3,325 miles of
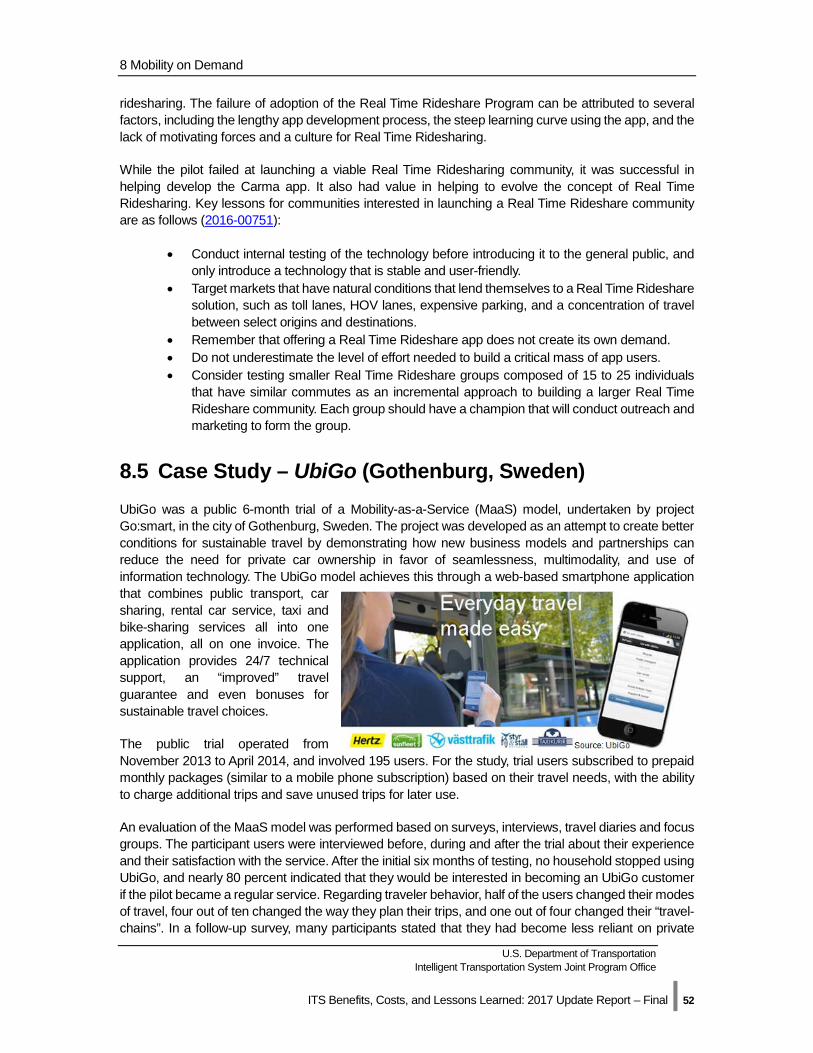
8 Mobility on Demand
U.S. Department of Transportation Intelligent Transportation System Joint Program Office
ITS Benefits, Costs, and Lessons Learned: 2017 Update Report – Final | 52
ridesharing. The failure of adoption of the Real Time Rideshare Program can be attributed to several factors, including the lengthy app development process, the steep learning curve using the app, and the lack of motivating forces and a culture for Real Time Ridesharing.
While the pilot failed at launching a viable Real Time Ridesharing community, it was successful in helping develop the Carma app. It also had value in helping to evolve the concept of Real Time Ridesharing. Key lessons for communities interested in launching a Real Time Rideshare community are as follows (2016-00751):
• Conduct internal testing of the technology before introducing it to the general public, and only introduce a technology that is stable and user-friendly.
• Target markets that have natural conditions that lend themselves to a Real Time Rideshare solution, such as toll lanes, HOV lanes, expensive parking, and a concentration of travel between select origins and destinations.
• Remember that offering a Real Time Rideshare app does not create its own demand. • Do not underestimate the level of effort needed to build a critical mass of app users. • Consider testing smaller Real Time Rideshare groups composed of 15 to 25 individuals
that have similar commutes as an incremental approach to building a larger Real Time Rideshare community. Each group should have a champion that will conduct outreach and marketing to form the group.
8.5 Case Study – UbiGo (Gothenburg, Sweden) UbiGo was a public 6-month trial of a Mobility-as-a-Service (MaaS) model, undertaken by project Go:smart, in the city of Gothenburg, Sweden. The project was developed as an attempt to create better conditions for sustainable travel by demonstrating how new business models and partnerships can reduce the need for private car ownership in favor of seamlessness, multimodality, and use of information technology. The UbiGo model achieves this through a web-based smartphone application that combines public transport, car sharing, rental car service, taxi and bike-sharing services all into one application, all on one invoice. The application provides 24/7 technical support, an “improved” travel guarantee and even bonuses for sustainable travel choices.
The public trial operated from November 2013 to April 2014, and involved 195 users. For the study, trial users subscribed to prepaid monthly packages (similar to a mobile phone subscription) based on their travel needs, with the ability to charge additional trips and save unused trips for later use.
An evaluation of the MaaS model was performed based on surveys, interviews, travel diaries and focus groups. The participant users were interviewed before, during and after the trial about their experience and their satisfaction with the service. After the initial six months of testing, no household stopped using UbiGo, and nearly 80 percent indicated that they would be interested in becoming an UbiGo customer if the pilot became a regular service. Regarding traveler behavior, half of the users changed their modes of travel, four out of ten changed the way they plan their trips, and one out of four changed their “travel-chains”. In a follow-up survey, many participants stated that they had become less reliant on private

8 Mobility on Demand
U.S. Department of Transportation Intelligent Transportation System Joint Program Office
ITS Benefits, Costs, and Lessons Learned: 2017 Update Report – Final | 53
cars and were more likely to use other forms of transportation such as public transit, walking and cycling after their participation in the pilot. Additionally, users stated UbiGo made it easier to pay for travel and gave them better control of expenditures [3].
The total cost of the project was £1.5 million and overall perceived benefits of the project included greater efficiency to transportation services and a reduction in greenhouse gas emissions.
Joint Program Office U.S. Department of Transportation, Research and Innovative Technology Administration
ITS Benefits, Costs, and Lessons Learned: Update Report - Final | 54
9 Arterial Management
9.1 Overview
Introduction Arterial management systems manage traffic along arterial roadways, employing vehicle detectors, traffic signals, and various means of communicating information to travelers. These systems make use of information collected by traffic surveillance and detection technologies such as microwave or video imaging detector systems (VIDS) to smooth the flow of traffic along travel corridors. They also disseminate important information about travel conditions to travelers via technologies such as dynamic message signs (DMS), highway advisory radio (HAR), or mobile devices. Traffic sensors and surveillance devices may also be used to monitor critical transportation infrastructure for security purposes.
A variety of techniques are available to manage the travel lanes available on arterial roadways, and ITS applications can support many of these strategies. Examples include dynamic posting of high-occupancy vehicle restrictions and the use of reversible flow lanes allowing more lanes of travel in the peak direction of travel during peak periods. Variable speed limits (VSL) can be used to adjust speed limits in real-time based on changing traffic conditions, adverse weather, and work zone activities. Parking management systems, most commonly deployed in urban centers or at modal transfer points such as airports and outlying transit stations, monitor the availability of parking and disseminate the information to drivers, reducing traveler frustration and congestion associated with searching for parking spaces. Transportation agencies can share information collected by arterial management systems with road users through technologies within the arterial network, such as DMS and HAR. They may also share this information with travelers via broader traveler information programs such as 511, the Internet, and most recently with smartphone applications. Arterial management systems may also include automated enforcement programs that increase compliance with speed limits, traffic signals, or other traffic control devices. Arterial management systems can also apply unique operating schemes for traffic signals, portable or dedicated DMS, and other ITS components to smooth traffic flow during special events.
Information sharing between agencies operating arterial roadways and those operating other portions of the transportation network can also have a positive impact on the operation of the transportation system. Examples include coordinating operations with a freeway management system, or providing arterial information to a traveler information system covering multiple roadways and public transit facilities.
The most prevalent ITS technologies used along arterials are traffic signal systems. There are many different applications for traffic signals including advanced systems, adaptive systems, and different types of preemption and priority. The arterial management taxonomy has been divided into two chapters: one addressing the benefits, costs and lessons of traffic control technologies and this chapter
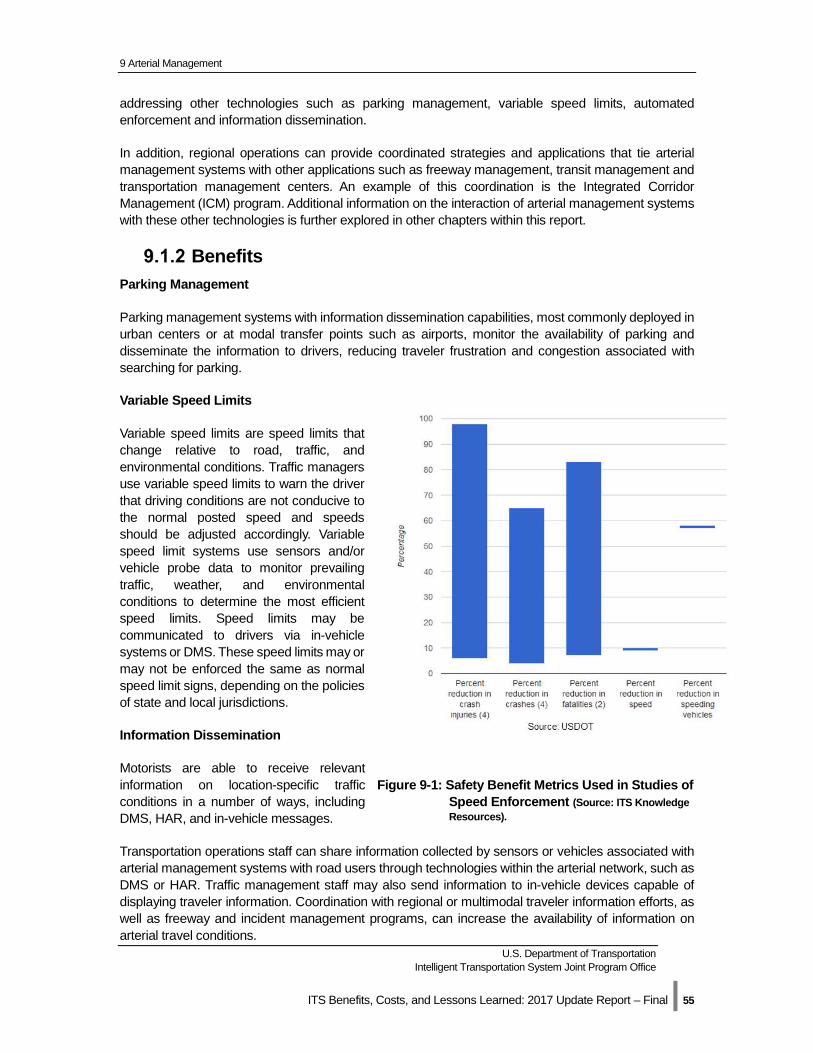
9 Arterial Management
U.S. Department of Transportation Intelligent Transportation System Joint Program Office
ITS Benefits, Costs, and Lessons Learned: 2017 Update Report – Final | 55
addressing other technologies such as parking management, variable speed limits, automated enforcement and information dissemination.
In addition, regional operations can provide coordinated strategies and applications that tie arterial management systems with other applications such as freeway management, transit management and transportation management centers. An example of this coordination is the Integrated Corridor Management (ICM) program. Additional information on the interaction of arterial management systems with these other technologies is further explored in other chapters within this report.
Benefits Parking Management
Parking management systems with information dissemination capabilities, most commonly deployed in urban centers or at modal transfer points such as airports, monitor the availability of parking and disseminate the information to drivers, reducing traveler frustration and congestion associated with searching for parking.
Variable Speed Limits
Variable speed limits are speed limits that change relative to road, traffic, and environmental conditions. Traffic managers use variable speed limits to warn the driver that driving conditions are not conducive to the normal posted speed and speeds should be adjusted accordingly. Variable speed limit systems use sensors and/or vehicle probe data to monitor prevailing traffic, weather, and environmental conditions to determine the most efficient speed limits. Speed limits may be communicated to drivers via in-vehicle systems or DMS. These speed limits may or may not be enforced the same as normal speed limit signs, depending on the policies of state and local jurisdictions.
Information Dissemination
Motorists are able to receive relevant information on location-specific traffic conditions in a number of ways, including DMS, HAR, and in-vehicle messages.
Transportation operations staff can share information collected by sensors or vehicles associated with arterial management systems with road users through technologies within the arterial network, such as DMS or HAR. Traffic management staff may also send information to in-vehicle devices capable of displaying traveler information. Coordination with regional or multimodal traveler information efforts, as well as freeway and incident management programs, can increase the availability of information on arterial travel conditions.
Figure 9-1: Safety Benefit Metrics Used in Studies of Speed Enforcement (Source: ITS Knowledge Resources).
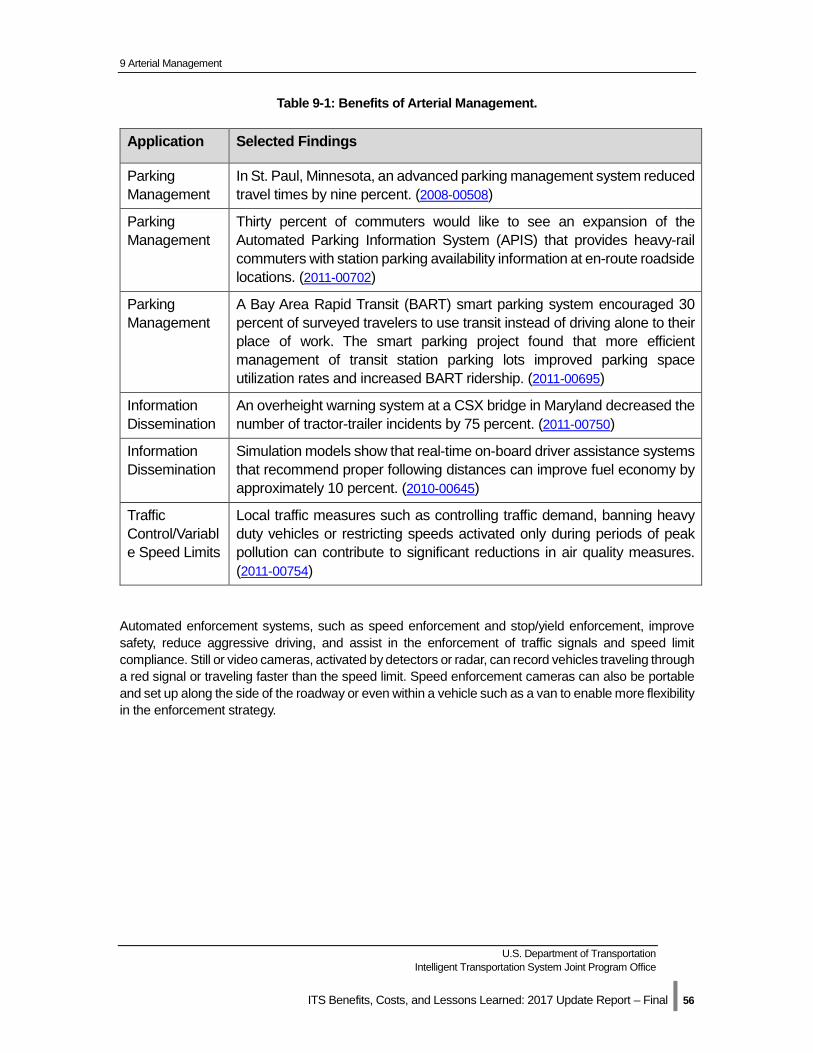
9 Arterial Management
U.S. Department of Transportation Intelligent Transportation System Joint Program Office
ITS Benefits, Costs, and Lessons Learned: 2017 Update Report – Final | 56
Table 9-1: Benefits of Arterial Management.
Application Selected Findings
Parking Management
In St. Paul, Minnesota, an advanced parking management system reduced travel times by nine percent. (2008-00508)
Parking Management
Thirty percent of commuters would like to see an expansion of the Automated Parking Information System (APIS) that provides heavy-rail commuters with station parking availability information at en-route roadside locations. (2011-00702)
Parking Management
A Bay Area Rapid Transit (BART) smart parking system encouraged 30 percent of surveyed travelers to use transit instead of driving alone to their place of work. The smart parking project found that more efficient management of transit station parking lots improved parking space utilization rates and increased BART ridership. (2011-00695)
Information Dissemination
An overheight warning system at a CSX bridge in Maryland decreased the number of tractor-trailer incidents by 75 percent. (2011-00750)
Information Dissemination
Simulation models show that real-time on-board driver assistance systems that recommend proper following distances can improve fuel economy by approximately 10 percent. (2010-00645)
Traffic Control/Variable Speed Limits
Local traffic measures such as controlling traffic demand, banning heavy duty vehicles or restricting speeds activated only during periods of peak pollution can contribute to significant reductions in air quality measures. (2011-00754)
Automated enforcement systems, such as speed enforcement and stop/yield enforcement, improve safety, reduce aggressive driving, and assist in the enforcement of traffic signals and speed limit compliance. Still or video cameras, activated by detectors or radar, can record vehicles traveling through a red signal or traveling faster than the speed limit. Speed enforcement cameras can also be portable and set up along the side of the roadway or even within a vehicle such as a van to enable more flexibility in the enforcement strategy.
9 Arterial Management
U.S. Department of Transportation Intelligent Transportation System Joint Program Office
ITS Benefits, Costs, and Lessons Learned: 2017 Update Report – Final | 57
Figure 9-2: Range of Benefits for Automated Red Light Running Enforcement (Source: ITS Knowledge Resources).
The Governors Highway Safety Association strongly supports the use of automated enforcement to enforce red light running and speeding violations. Education and engineering solutions continue to be important in combatting red light running and reducing speeding; however, automated enforcement is another effective tool [1].
Automated enforcement continues to demonstrate that it is a successful, cost-effective means of reducing traffic accidents, injuries, and deaths.
Costs A smart parking field test conducted for the California Department of Transportation and the Bay Area Rapid Transit estimated capital cost at $150 to $250 per space; O&M costs were estimated at $40 to $60 per space. The smart parking system permitted pre-trip as well as en-route trip planning. Motorists could reserve a parking space at the Rockridge BART station up to two weeks in advance. While en-route and faced with congestion on Highway 24, motorists could see the display of real-time parking availability at the station lot and decide to use transit. Key passenger-interface technologies used in the field test were:
• Two portable DMSs, located on Highway 24, which displayed parking availability information to motorists.
• A centralized intelligent reservation system that enabled commuters to check the availability of parking spaces and then to reserve a space via telephone, mobile phone, Internet, or personal digital assistant (PDA). The intelligent reservation system used the up-to-the-minute counts of parking availability obtained through the vehicle count data from the entrance and exit sensors at the BART station parking lot.
Fifty (50) parking spaces, of the 920 total, were made available for the smart parking field test – 15 for advance reservations and the remaining for same-day reservations by commuters who, upon seeing the DMSs on Highway 24, opted to take BART (2008-00134).
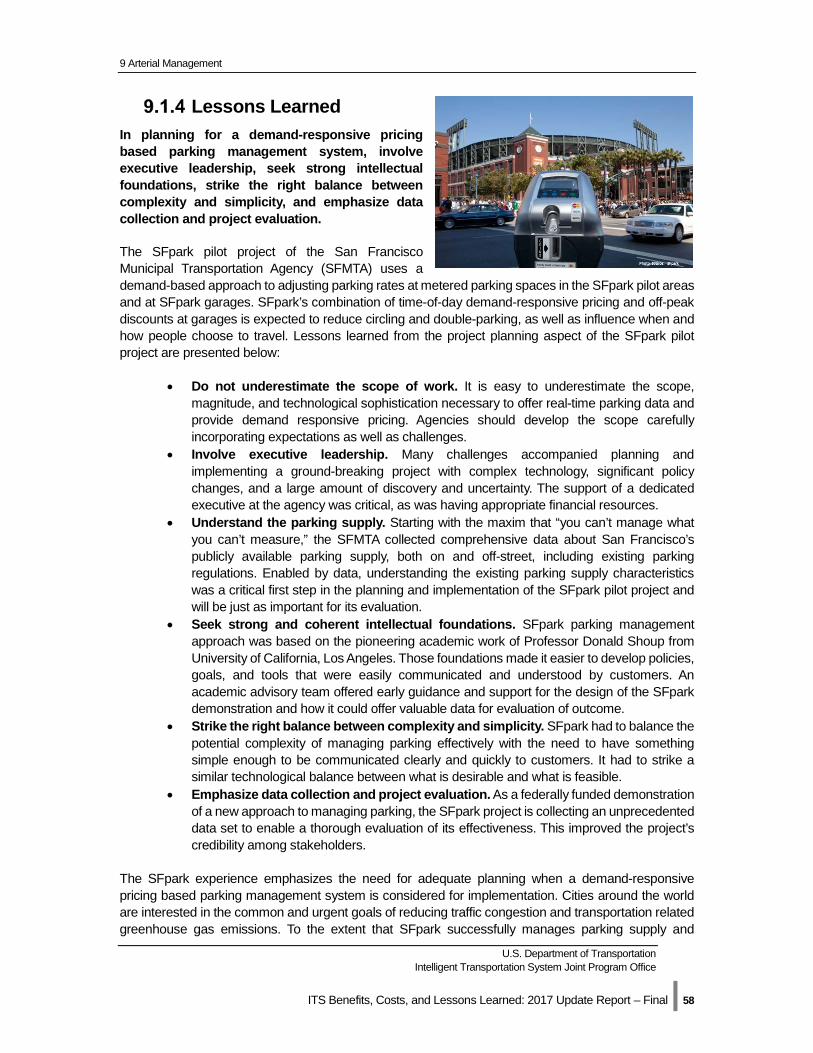
9 Arterial Management
U.S. Department of Transportation Intelligent Transportation System Joint Program Office
ITS Benefits, Costs, and Lessons Learned: 2017 Update Report – Final | 58
Lessons Learned In planning for a demand-responsive pricing based parking management system, involve executive leadership, seek strong intellectual foundations, strike the right balance between complexity and simplicity, and emphasize data collection and project evaluation.
The SFpark pilot project of the San Francisco Municipal Transportation Agency (SFMTA) uses a demand-based approach to adjusting parking rates at metered parking spaces in the SFpark pilot areas and at SFpark garages. SFpark’s combination of time-of-day demand-responsive pricing and off-peak discounts at garages is expected to reduce circling and double-parking, as well as influence when and how people choose to travel. Lessons learned from the project planning aspect of the SFpark pilot project are presented below:
• Do not underestimate the scope of work. It is easy to underestimate the scope, magnitude, and technological sophistication necessary to offer real-time parking data and provide demand responsive pricing. Agencies should develop the scope carefully incorporating expectations as well as challenges.
• Involve executive leadership. Many challenges accompanied planning and implementing a ground-breaking project with complex technology, significant policy changes, and a large amount of discovery and uncertainty. The support of a dedicated executive at the agency was critical, as was having appropriate financial resources.
• Understand the parking supply. Starting with the maxim that “you can’t manage what you can’t measure,” the SFMTA collected comprehensive data about San Francisco’s publicly available parking supply, both on and off-street, including existing parking regulations. Enabled by data, understanding the existing parking supply characteristics was a critical first step in the planning and implementation of the SFpark pilot project and will be just as important for its evaluation.
• Seek strong and coherent intellectual foundations. SFpark parking management approach was based on the pioneering academic work of Professor Donald Shoup from University of California, Los Angeles. Those foundations made it easier to develop policies, goals, and tools that were easily communicated and understood by customers. An academic advisory team offered early guidance and support for the design of the SFpark demonstration and how it could offer valuable data for evaluation of outcome.
• Strike the right balance between complexity and simplicity. SFpark had to balance the potential complexity of managing parking effectively with the need to have something simple enough to be communicated clearly and quickly to customers. It had to strike a similar technological balance between what is desirable and what is feasible.
• Emphasize data collection and project evaluation. As a federally funded demonstration of a new approach to managing parking, the SFpark project is collecting an unprecedented data set to enable a thorough evaluation of its effectiveness. This improved the project’s credibility among stakeholders.
The SFpark experience emphasizes the need for adequate planning when a demand-responsive pricing based parking management system is considered for implementation. Cities around the world are interested in the common and urgent goals of reducing traffic congestion and transportation related greenhouse gas emissions. To the extent that SFpark successfully manages parking supply and
9 Arterial Management
U.S. Department of Transportation Intelligent Transportation System Joint Program Office
ITS Benefits, Costs, and Lessons Learned: 2017 Update Report – Final | 59
demand, rates, and reduces congestion and emissions, the project is relevant to other cities as well because it is easily replicable. SFpark is expected to improve traffic flow, reduce congestion and greenhouse gas emissions, increase safety for all road users, and enhance quality of life (2012-00621).
Install message signs at strategic locations to provide commuters en route with real-time information of the parking availability status at a major transit station.
An evaluation of automated parking information system in the vicinity of the WMATA Glenmont Metro parking facility shows that the signs displayed at Georgia Avenue, Norbeck Road, and Glenallen Avenue are an effective tool to inform commuters about the parking availability at the Glenmont Metro Station parking facility. The system helps reduce congestion and improve mobility around the parking facility, and increases customer satisfaction. The automated parking information system at Glenmont Metro Station is intended to provide real-time information to commuters about the availability of parking spaces at the Glenmont Metro Station parking facility. If spaces are not available at the Glenmont facility, commuters are directed to use other lots with available spaces, especially the underutilized Norbeck Road park-and-ride lot and the Wheaton Metro Station parking facility (2011-00597).
Case Study – Utah DOT Weather Responsive Traffic Signal Timing
Utah DOT (UDOT) is among one of the first DOTs in the country to use real-time traffic signal performance metrics to optimize traffic signal coordination. In 2011, the Federal Highway Administration’s (FHWA) Road Weather Management Program (RWMP) initiated a project to document existing strategies for Weather Responsive Traffic Management (WRTM), identify improvements to the strategies, and develop implementable Concepts of Operations (ConOps) for the improved strategies. UDOT was selected as the partner to implement a traffic signal timing strategy.
In this deployment, UDOT developed and tested an advanced concept for expanding operations of weather responsive signal operations to corridors outside of the Salt Lake City area. The intent of the project was to make UDOT’s traffic signal systems more responsive to changes in traffic demands and travel speeds during severe winter conditions. UDOT examined how the weather responsive signal system, coupled with additional detection technology, could be used to better monitor and operate traffic signals during significant weather events in the Riverdale Road corridor. Riverdale Road is a northeast-southwest oriented road that carries traffic between I-84 and US-89 in Ogden, Utah. This segment is primarily a 6-lane road with 11 traffic signals [2]. It carries about 30,000 vehicles on an average weekday. Signal spacing ranges from 700 feet to over 3,000 feet.
UDOT tested the system through the corridor, allowing traffic signal operators to anticipate when weather conditions deteriorate to the point of impacting travel speeds in the corridor. Once aware of the impending deterioration, the system allows the operators to deploy traffic signal timing plans that best match the prevailing travel conditions in the corridor. For this, UDOT used a traffic signal performance monitoring system based on near real-time speed metrics and the Purdue Coordination Diagrams (PCD’s) to measure and fine-tune the signal timing plans
An evaluation of the project found that UDOT was able to maintain near non-weather levels of progression, or higher, during inclement weather events by implementing weather responsive traffic signal timings along Riverdale Road [4]. The evaluation showed that total travel times and corridor-level travel times were less when the weather responsive timing plans were deployed in the corridor during inclement weather compared to normal time-of-day timing plans under the same weather and traffic conditions. A summary of the benefits is presented below, grouped by performance category:
9 Arterial Management
U.S. Department of Transportation Intelligent Transportation System Joint Program Office
ITS Benefits, Costs, and Lessons Learned: 2017 Update Report – Final | 60
Improving responsiveness to different inclement weather conditions:
• The UDOT Traffic Signal Manager rated the overall operation of the deployed signal plans during the weather events to be average or above average in eight of the thirteen events where weather responsive signal timing plans were implemented.
• UDOT operators commented that the system reduced the number of “stuck intersections” during adverse weather as maintenance personnel did not have to respond to malfunctioning detectors not detecting vehicles.
Maintaining a high quality of progression during inclement weather:
• When aggregated over all the intersections, implementing a weather responsive timing plan where recalls were not used provided the main-street the same level of performance (if not slightly better) as the normal, time-of-day control during non-weather events.
• Except in a few situations, the quality of progression provided by the weather responsive timing plans were similar or better than that provided by the normal (non-weather) traffic signal timing plans.
Maximizing signal system performance during different types of weather conditions:
• Cumulative travel time reduced 4.3 percent by deploying the weather responsive timing plans.
• Cumulative stopped time reduced 11.2 percent when compared to using the current time-of-day plans during the snow event.
Maintaining equitable service to the cross-streets during different weather conditions:
• While cross-street data was not collected as part of the observed data, Modeled results showed improvements for all impacted vehicles including cross-street traffic. Cumulative travel times improved by 3 percent and overall stopped times by 14.45 percent.
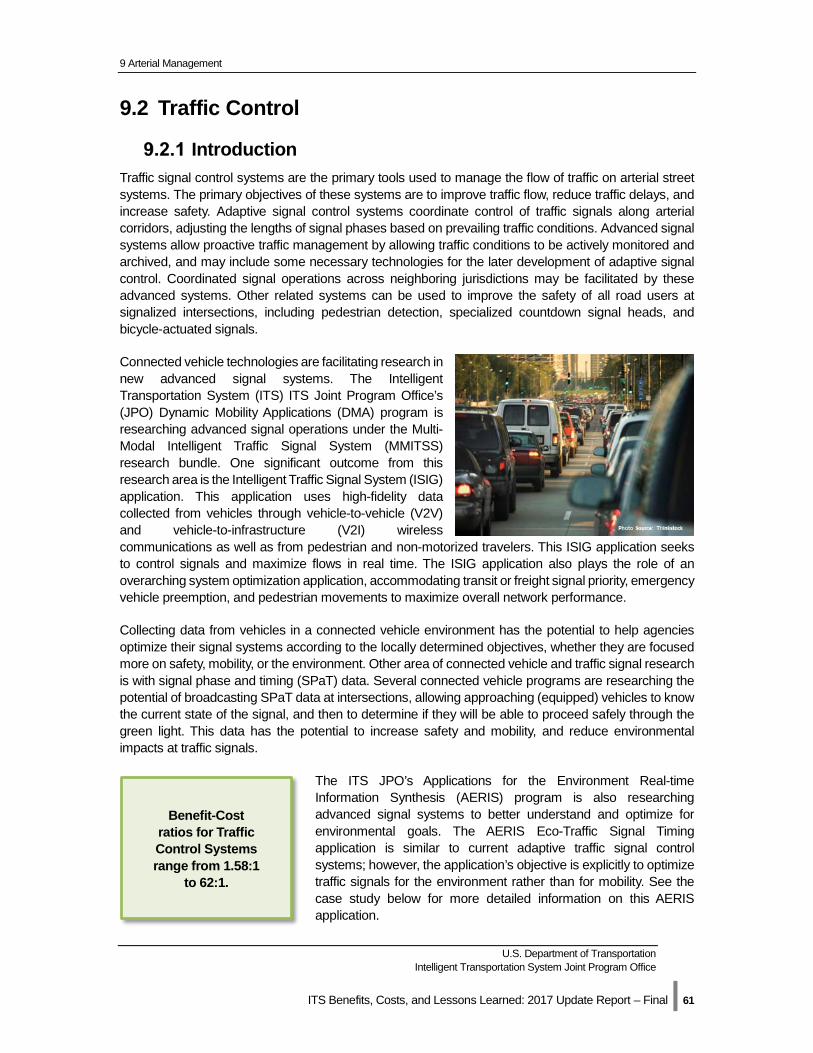
9 Arterial Management
U.S. Department of Transportation Intelligent Transportation System Joint Program Office
ITS Benefits, Costs, and Lessons Learned: 2017 Update Report – Final | 61
9.2 Traffic Control
Introduction Traffic signal control systems are the primary tools used to manage the flow of traffic on arterial street systems. The primary objectives of these systems are to improve traffic flow, reduce traffic delays, and increase safety. Adaptive signal control systems coordinate control of traffic signals along arterial corridors, adjusting the lengths of signal phases based on prevailing traffic conditions. Advanced signal systems allow proactive traffic management by allowing traffic conditions to be actively monitored and archived, and may include some necessary technologies for the later development of adaptive signal control. Coordinated signal operations across neighboring jurisdictions may be facilitated by these advanced systems. Other related systems can be used to improve the safety of all road users at signalized intersections, including pedestrian detection, specialized countdown signal heads, and bicycle-actuated signals.
Connected vehicle technologies are facilitating research in new advanced signal systems. The Intelligent Transportation System (ITS) ITS Joint Program Office’s (JPO) Dynamic Mobility Applications (DMA) program is researching advanced signal operations under the Multi-Modal Intelligent Traffic Signal System (MMITSS) research bundle. One significant outcome from this research area is the Intelligent Traffic Signal System (ISIG) application. This application uses high-fidelity data collected from vehicles through vehicle-to-vehicle (V2V) and vehicle-to-infrastructure (V2I) wireless communications as well as from pedestrian and non-motorized travelers. This ISIG application seeks to control signals and maximize flows in real time. The ISIG application also plays the role of an overarching system optimization application, accommodating transit or freight signal priority, emergency vehicle preemption, and pedestrian movements to maximize overall network performance.
Collecting data from vehicles in a connected vehicle environment has the potential to help agencies optimize their signal systems according to the locally determined objectives, whether they are focused more on safety, mobility, or the environment. Other area of connected vehicle and traffic signal research is with signal phase and timing (SPaT) data. Several connected vehicle programs are researching the potential of broadcasting SPaT data at intersections, allowing approaching (equipped) vehicles to know the current state of the signal, and then to determine if they will be able to proceed safely through the green light. This data has the potential to increase safety and mobility, and reduce environmental impacts at traffic signals.
The ITS JPO’s Applications for the Environment Real-time Information Synthesis (AERIS) program is also researching advanced signal systems to better understand and optimize for environmental goals. The AERIS Eco-Traffic Signal Timing application is similar to current adaptive traffic signal control systems; however, the application’s objective is explicitly to optimize traffic signals for the environment rather than for mobility. See the case study below for more detailed information on this AERIS application.
Benefit-Cost ratios for Traffic Control Systems range from 1.58:1
to 62:1.
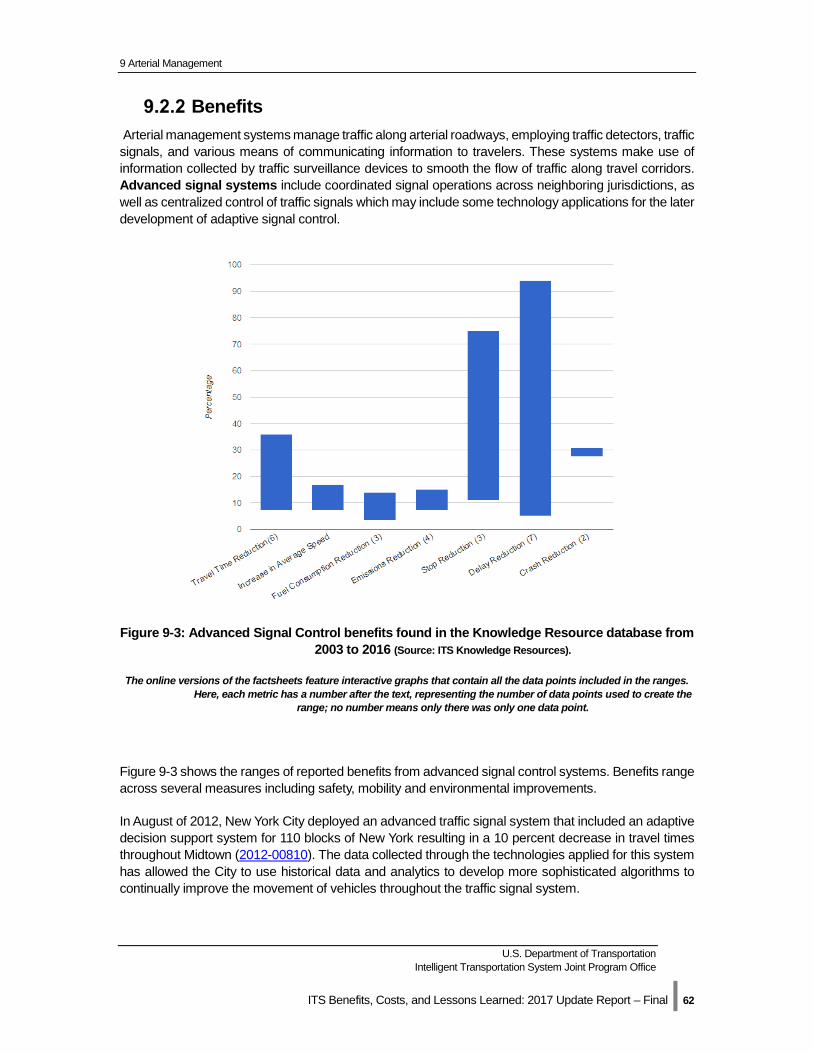
9 Arterial Management
U.S. Department of Transportation Intelligent Transportation System Joint Program Office
ITS Benefits, Costs, and Lessons Learned: 2017 Update Report – Final | 62
Benefits Arterial management systems manage traffic along arterial roadways, employing traffic detectors, traffic signals, and various means of communicating information to travelers. These systems make use of information collected by traffic surveillance devices to smooth the flow of traffic along travel corridors. Advanced signal systems include coordinated signal operations across neighboring jurisdictions, as well as centralized control of traffic signals which may include some technology applications for the later development of adaptive signal control.
Figure 9-3: Advanced Signal Control benefits found in the Knowledge Resource database from 2003 to 2016 (Source: ITS Knowledge Resources).
The online versions of the factsheets feature interactive graphs that contain all the data points included in the ranges. Here, each metric has a number after the text, representing the number of data points used to create the
range; no number means only there was only one data point.
Figure 9-3 shows the ranges of reported benefits from advanced signal control systems. Benefits range across several measures including safety, mobility and environmental improvements.
In August of 2012, New York City deployed an advanced traffic signal system that included an adaptive decision support system for 110 blocks of New York resulting in a 10 percent decrease in travel times throughout Midtown (2012-00810). The data collected through the technologies applied for this system has allowed the City to use historical data and analytics to develop more sophisticated algorithms to continually improve the movement of vehicles throughout the traffic signal system.
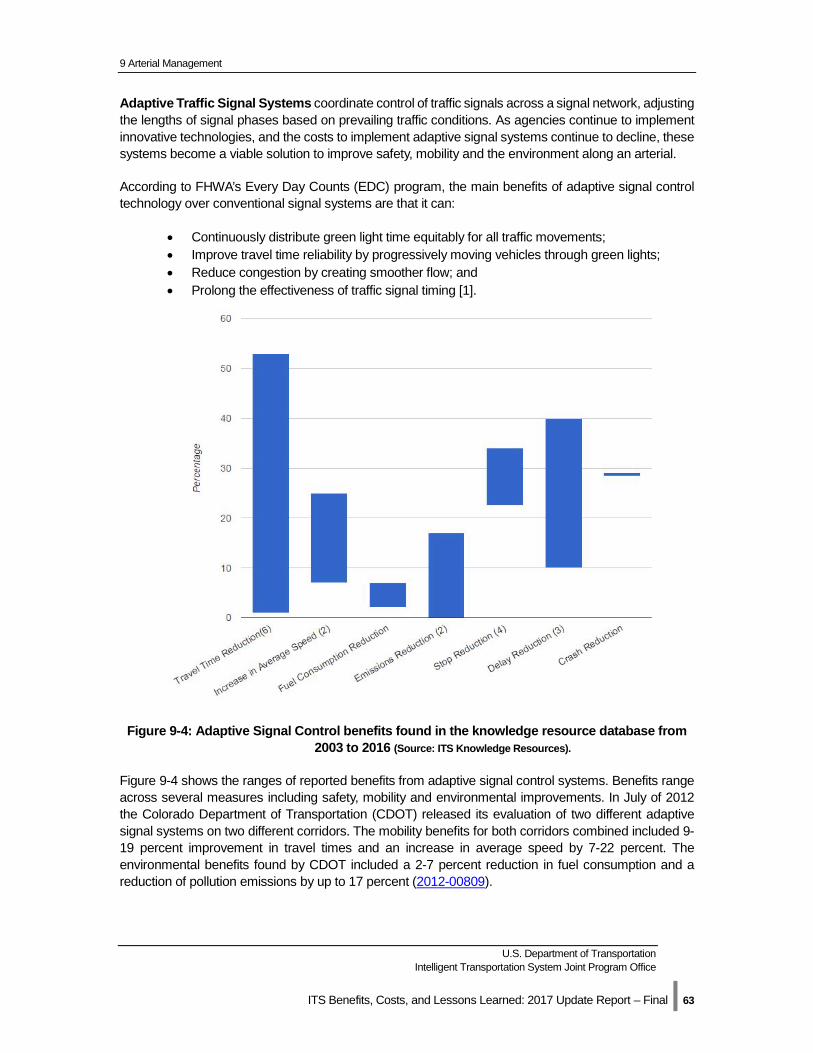
9 Arterial Management
U.S. Department of Transportation Intelligent Transportation System Joint Program Office
ITS Benefits, Costs, and Lessons Learned: 2017 Update Report – Final | 63
Adaptive Traffic Signal Systems coordinate control of traffic signals across a signal network, adjusting the lengths of signal phases based on prevailing traffic conditions. As agencies continue to implement innovative technologies, and the costs to implement adaptive signal systems continue to decline, these systems become a viable solution to improve safety, mobility and the environment along an arterial.
According to FHWA’s Every Day Counts (EDC) program, the main benefits of adaptive signal control technology over conventional signal systems are that it can:
• Continuously distribute green light time equitably for all traffic movements; • Improve travel time reliability by progressively moving vehicles through green lights; • Reduce congestion by creating smoother flow; and • Prolong the effectiveness of traffic signal timing [1].
Figure 9-4: Adaptive Signal Control benefits found in the knowledge resource database from 2003 to 2016 (Source: ITS Knowledge Resources).
Figure 9-4 shows the ranges of reported benefits from adaptive signal control systems. Benefits range across several measures including safety, mobility and environmental improvements. In July of 2012 the Colorado Department of Transportation (CDOT) released its evaluation of two different adaptive signal systems on two different corridors. The mobility benefits for both corridors combined included 9-19 percent improvement in travel times and an increase in average speed by 7-22 percent. The environmental benefits found by CDOT included a 2-7 percent reduction in fuel consumption and a reduction of pollution emissions by up to 17 percent (2012-00809).
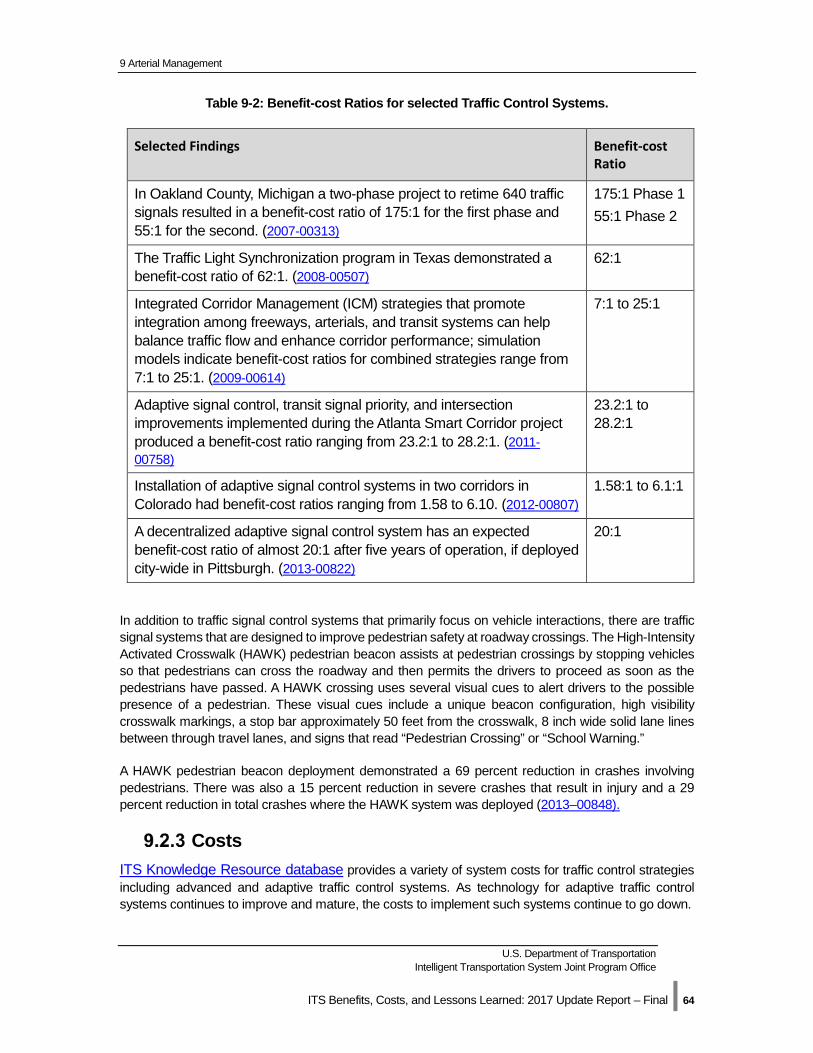
9 Arterial Management
U.S. Department of Transportation Intelligent Transportation System Joint Program Office
ITS Benefits, Costs, and Lessons Learned: 2017 Update Report – Final | 64
Table 9-2: Benefit-cost Ratios for selected Traffic Control Systems.
Selected Findings Benefit-cost Ratio
In Oakland County, Michigan a two-phase project to retime 640 traffic signals resulted in a benefit-cost ratio of 175:1 for the first phase and 55:1 for the second. (2007-00313)
175:1 Phase 1 55:1 Phase 2
The Traffic Light Synchronization program in Texas demonstrated a benefit-cost ratio of 62:1. (2008-00507)
62:1
Integrated Corridor Management (ICM) strategies that promote integration among freeways, arterials, and transit systems can help balance traffic flow and enhance corridor performance; simulation models indicate benefit-cost ratios for combined strategies range from 7:1 to 25:1. (2009-00614)
7:1 to 25:1
Adaptive signal control, transit signal priority, and intersection improvements implemented during the Atlanta Smart Corridor project produced a benefit-cost ratio ranging from 23.2:1 to 28.2:1. (2011-00758)
23.2:1 to 28.2:1
Installation of adaptive signal control systems in two corridors in Colorado had benefit-cost ratios ranging from 1.58 to 6.10. (2012-00807)
1.58:1 to 6.1:1
A decentralized adaptive signal control system has an expected benefit-cost ratio of almost 20:1 after five years of operation, if deployed city-wide in Pittsburgh. (2013-00822)
20:1
In addition to traffic signal control systems that primarily focus on vehicle interactions, there are traffic signal systems that are designed to improve pedestrian safety at roadway crossings. The High-Intensity Activated Crosswalk (HAWK) pedestrian beacon assists at pedestrian crossings by stopping vehicles so that pedestrians can cross the roadway and then permits the drivers to proceed as soon as the pedestrians have passed. A HAWK crossing uses several visual cues to alert drivers to the possible presence of a pedestrian. These visual cues include a unique beacon configuration, high visibility crosswalk markings, a stop bar approximately 50 feet from the crosswalk, 8 inch wide solid lane lines between through travel lanes, and signs that read “Pedestrian Crossing” or “School Warning.”
A HAWK pedestrian beacon deployment demonstrated a 69 percent reduction in crashes involving pedestrians. There was also a 15 percent reduction in severe crashes that result in injury and a 29 percent reduction in total crashes where the HAWK system was deployed (2013–00848).
Costs ITS Knowledge Resource database provides a variety of system costs for traffic control strategies including advanced and adaptive traffic control systems. As technology for adaptive traffic control systems continues to improve and mature, the costs to implement such systems continue to go down.
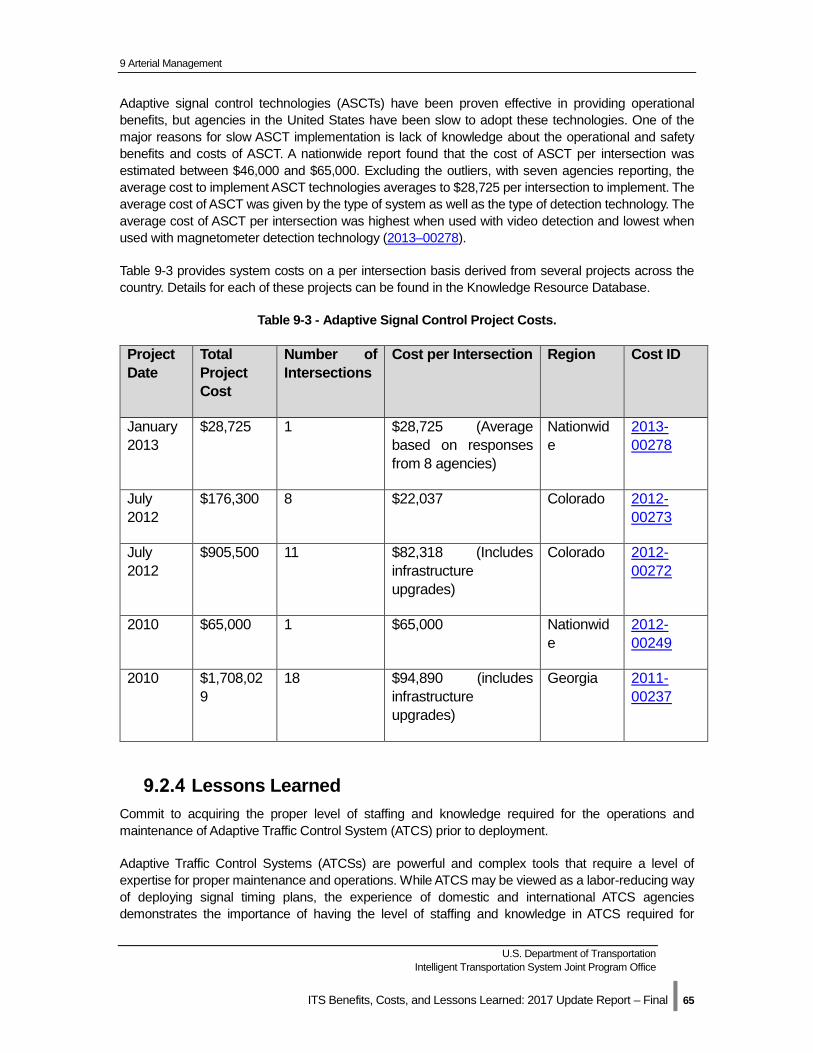
9 Arterial Management
U.S. Department of Transportation Intelligent Transportation System Joint Program Office
ITS Benefits, Costs, and Lessons Learned: 2017 Update Report – Final | 65
Adaptive signal control technologies (ASCTs) have been proven effective in providing operational benefits, but agencies in the United States have been slow to adopt these technologies. One of the major reasons for slow ASCT implementation is lack of knowledge about the operational and safety benefits and costs of ASCT. A nationwide report found that the cost of ASCT per intersection was estimated between $46,000 and $65,000. Excluding the outliers, with seven agencies reporting, the average cost to implement ASCT technologies averages to $28,725 per intersection to implement. The average cost of ASCT was given by the type of system as well as the type of detection technology. The average cost of ASCT per intersection was highest when used with video detection and lowest when used with magnetometer detection technology (2013–00278).
Table 9-3 provides system costs on a per intersection basis derived from several projects across the country. Details for each of these projects can be found in the Knowledge Resource Database.
Table 9-3 - Adaptive Signal Control Project Costs.
Project Date
Total Project Cost
Number of Intersections
Cost per Intersection Region Cost ID
January 2013
$28,725 1 $28,725 (Average based on responses from 8 agencies)
Nationwide
2013-00278
July 2012
$176,300 8 $22,037 Colorado 2012-00273
July 2012
$905,500 11 $82,318 (Includes infrastructure upgrades)
Colorado 2012-00272
2010 $65,000 1 $65,000 Nationwide
2012-00249
2010 $1,708,029
18 $94,890 (includes infrastructure upgrades)
Georgia 2011-00237
Lessons Learned Commit to acquiring the proper level of staffing and knowledge required for the operations and maintenance of Adaptive Traffic Control System (ATCS) prior to deployment.
Adaptive Traffic Control Systems (ATCSs) are powerful and complex tools that require a level of expertise for proper maintenance and operations. While ATCS may be viewed as a labor-reducing way of deploying signal timing plans, the experience of domestic and international ATCS agencies demonstrates the importance of having the level of staffing and knowledge in ATCS required for
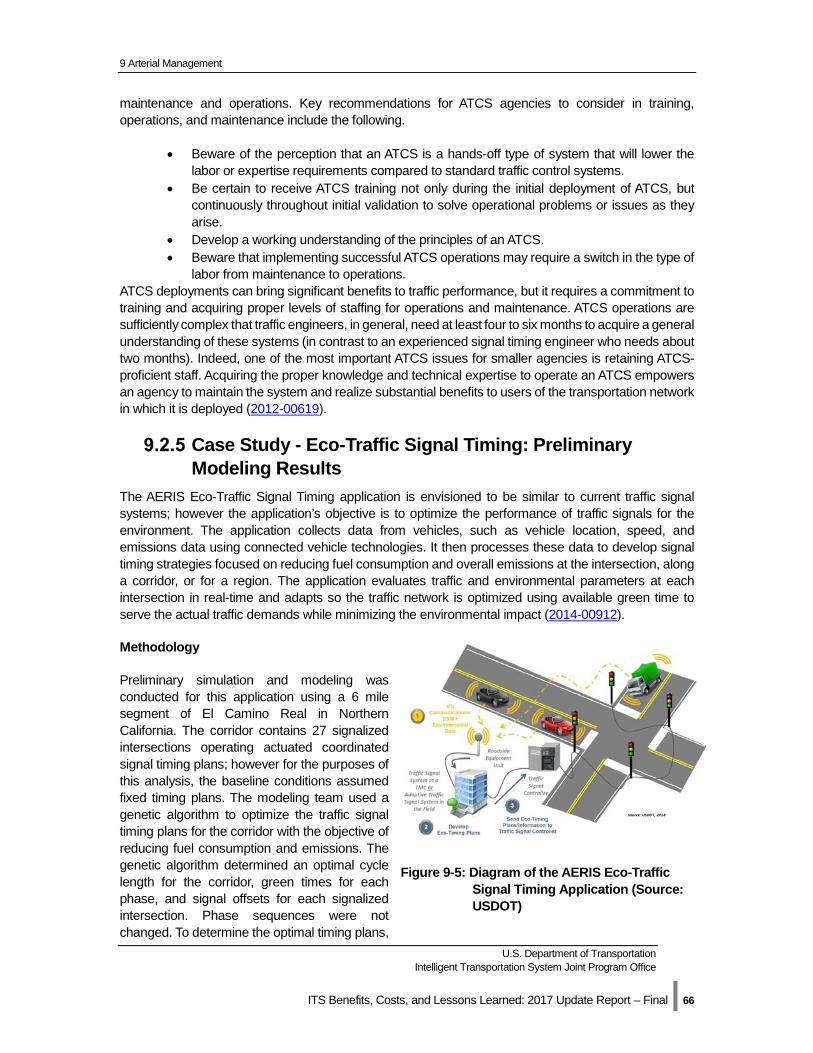
9 Arterial Management
U.S. Department of Transportation Intelligent Transportation System Joint Program Office
ITS Benefits, Costs, and Lessons Learned: 2017 Update Report – Final | 66
maintenance and operations. Key recommendations for ATCS agencies to consider in training, operations, and maintenance include the following.
• Beware of the perception that an ATCS is a hands-off type of system that will lower the labor or expertise requirements compared to standard traffic control systems.
• Be certain to receive ATCS training not only during the initial deployment of ATCS, but continuously throughout initial validation to solve operational problems or issues as they arise.
• Develop a working understanding of the principles of an ATCS. • Beware that implementing successful ATCS operations may require a switch in the type of
labor from maintenance to operations. ATCS deployments can bring significant benefits to traffic performance, but it requires a commitment to training and acquiring proper levels of staffing for operations and maintenance. ATCS operations are sufficiently complex that traffic engineers, in general, need at least four to six months to acquire a general understanding of these systems (in contrast to an experienced signal timing engineer who needs about two months). Indeed, one of the most important ATCS issues for smaller agencies is retaining ATCS-proficient staff. Acquiring the proper knowledge and technical expertise to operate an ATCS empowers an agency to maintain the system and realize substantial benefits to users of the transportation network in which it is deployed (2012-00619).
Case Study - Eco-Traffic Signal Timing: Preliminary Modeling Results
The AERIS Eco-Traffic Signal Timing application is envisioned to be similar to current traffic signal systems; however the application’s objective is to optimize the performance of traffic signals for the environment. The application collects data from vehicles, such as vehicle location, speed, and emissions data using connected vehicle technologies. It then processes these data to develop signal timing strategies focused on reducing fuel consumption and overall emissions at the intersection, along a corridor, or for a region. The application evaluates traffic and environmental parameters at each intersection in real-time and adapts so the traffic network is optimized using available green time to serve the actual traffic demands while minimizing the environmental impact (2014-00912).
Methodology
Preliminary simulation and modeling was conducted for this application using a 6 mile segment of El Camino Real in Northern California. The corridor contains 27 signalized intersections operating actuated coordinated signal timing plans; however for the purposes of this analysis, the baseline conditions assumed fixed timing plans. The modeling team used a genetic algorithm to optimize the traffic signal timing plans for the corridor with the objective of reducing fuel consumption and emissions. The genetic algorithm determined an optimal cycle length for the corridor, green times for each phase, and signal offsets for each signalized intersection. Phase sequences were not changed. To determine the optimal timing plans,
Figure 9-5: Diagram of the AERIS Eco-Traffic Signal Timing Application (Source: USDOT)
9 Arterial Management
U.S. Department of Transportation Intelligent Transportation System Joint Program Office
ITS Benefits, Costs, and Lessons Learned: 2017 Update Report – Final | 67
outputs from the Paramics microsimulation model were sent to an Application Programming Interface (API) that interfaced with the Environmental Protection Agency’s MOtor Vehicle Emissions Simulator (MOVES) model. Traffic and emissions outputs from Paramics and MOVES, respectively, were then sent to the genetic algorithm which developed new timing plans. These new timing plans were then sent back to Paramics and the process continued for numerous iterations until the genetic algorithm determined an optimal timing plan that reduced CO2 emissions for the entire corridor. Sensitivity analysis included varying the following parameters: penetration rate of connected vehicles, congestion levels, percentage of trucks, and optimizing for emissions versus delay. The method used to determine optimized timing plans for this study considered an offline optimization approach. More advanced connected vehicle applications and algorithms may perform the optimization online, similar to adaptive signal control systems but leveraging connected vehicle data and technologies.
Conclusions
• There is up to 5 percent improvement in fuel consumption and environmental measures at full connected vehicle penetration, with a 1 to 4 percent improvement at partial connected vehicle penetration in a fully coordinated network.
• Optimizing for the environment resulted in a 5 percent fuel consumption reduction, whereas optimizing for mobility resulted in 2 percent reductions in fuel consumption.
• Driving a typical vehicle 8,000 miles per year on arterials equates to $70 of savings per year per vehicle.
• SUV (lower MPG) savings are $110 per year per driver. • A fleet operator with 150 vehicles would save $16,500 per year.
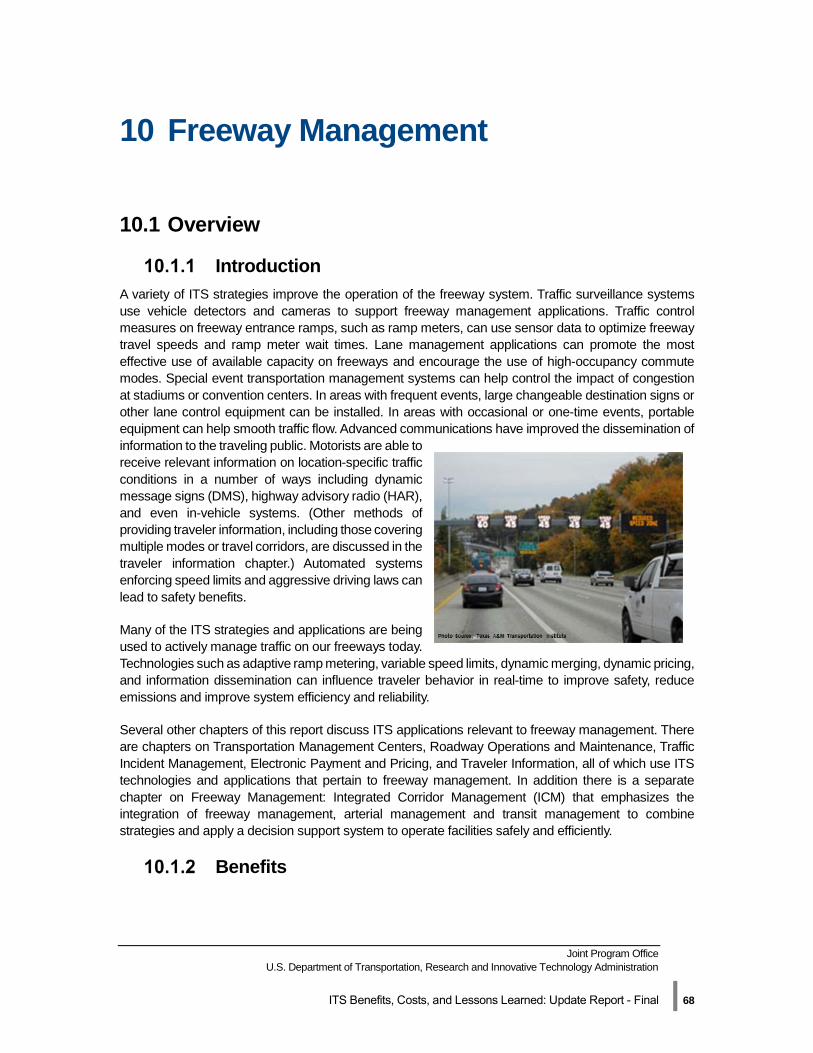
Joint Program Office U.S. Department of Transportation, Research and Innovative Technology Administration
ITS Benefits, Costs, and Lessons Learned: Update Report - Final | 68
10 Freeway Management
10.1 Overview
Introduction A variety of ITS strategies improve the operation of the freeway system. Traffic surveillance systems use vehicle detectors and cameras to support freeway management applications. Traffic control measures on freeway entrance ramps, such as ramp meters, can use sensor data to optimize freeway travel speeds and ramp meter wait times. Lane management applications can promote the most effective use of available capacity on freeways and encourage the use of high-occupancy commute modes. Special event transportation management systems can help control the impact of congestion at stadiums or convention centers. In areas with frequent events, large changeable destination signs or other lane control equipment can be installed. In areas with occasional or one-time events, portable equipment can help smooth traffic flow. Advanced communications have improved the dissemination of information to the traveling public. Motorists are able to receive relevant information on location-specific traffic conditions in a number of ways including dynamic message signs (DMS), highway advisory radio (HAR), and even in-vehicle systems. (Other methods of providing traveler information, including those covering multiple modes or travel corridors, are discussed in the traveler information chapter.) Automated systems enforcing speed limits and aggressive driving laws can lead to safety benefits.
Many of the ITS strategies and applications are being used to actively manage traffic on our freeways today. Technologies such as adaptive ramp metering, variable speed limits, dynamic merging, dynamic pricing, and information dissemination can influence traveler behavior in real-time to improve safety, reduce emissions and improve system efficiency and reliability.
Several other chapters of this report discuss ITS applications relevant to freeway management. There are chapters on Transportation Management Centers, Roadway Operations and Maintenance, Traffic Incident Management, Electronic Payment and Pricing, and Traveler Information, all of which use ITS technologies and applications that pertain to freeway management. In addition there is a separate chapter on Freeway Management: Integrated Corridor Management (ICM) that emphasizes the integration of freeway management, arterial management and transit management to combine strategies and apply a decision support system to operate facilities safely and efficiently.
Benefits
10 Freeway Management
U.S. Department of Transportation Intelligent Transportation System Joint Program Office
ITS Benefits, Costs, and Lessons Learned: 2017 Update Report – Final | 69
Ramp Control
Traffic signals on freeway ramps alternate between red and green signals to control the flow of vehicles entering the freeway. Metering rates may be altered based on freeway traffic conditions, ramp or local arterial traffic, or real-time vehicle emissions data. The Kansas City Scout program has implemented and evaluated ramp metering over the past few years. Selected results from these evaluations are listed in Table 10-1.
Table 10-1: Selected Benefits of Ramp Metering in Kansas City.
Selected Findings
Initial findings from a ramp meter evaluation in Kansas City were consistent with findings in other cities that show ramp metering can reduce crashes by 26 to 50 percent. (2012-00795)
The Kansas City Scout program used ramp meters to improve safety on a seven mile section of I-435; before and after data indicated that ramp meters decreased crashes by 64 percent. (2012-00799)
Initial findings from a ramp meter evaluation in Kansas City show that ramp meters make it easier for drivers to merge and reduce overall travel times. (2012-00796)
The implementation of ramp metering in Kansas City increased corridor throughput by as much as 20 percent and improved incident clearance by an average of four minutes, with these benefits remaining consistent in the long term. (2013-00852)
The Kansas City Scout program used ramp meters to improve traffic flow and reduce overall peak period travel times on a seven mile section of I-435 by 1 to 4 percent. (2012-00800)
Lane Management - Variable Speed Limits (VSL)
VSL systems have been used in a number of countries, particularly in Europe, as a method to improve flow and increase safety. VSL systems use detectors to collect data on current traffic and/or weather conditions. Posted speed limits are then dynamically updated to reflect the conditions that motorists are actually experiencing. Presenting drivers with speed limits that are appropriate for current conditions may reduce speed variance, a concept sometimes called speed harmonization. If properly designed, VSL systems have been shown to reduce crash occurrence and can also reduce system travel time and vehicle emissions through increased uniformity in traffic speeds.
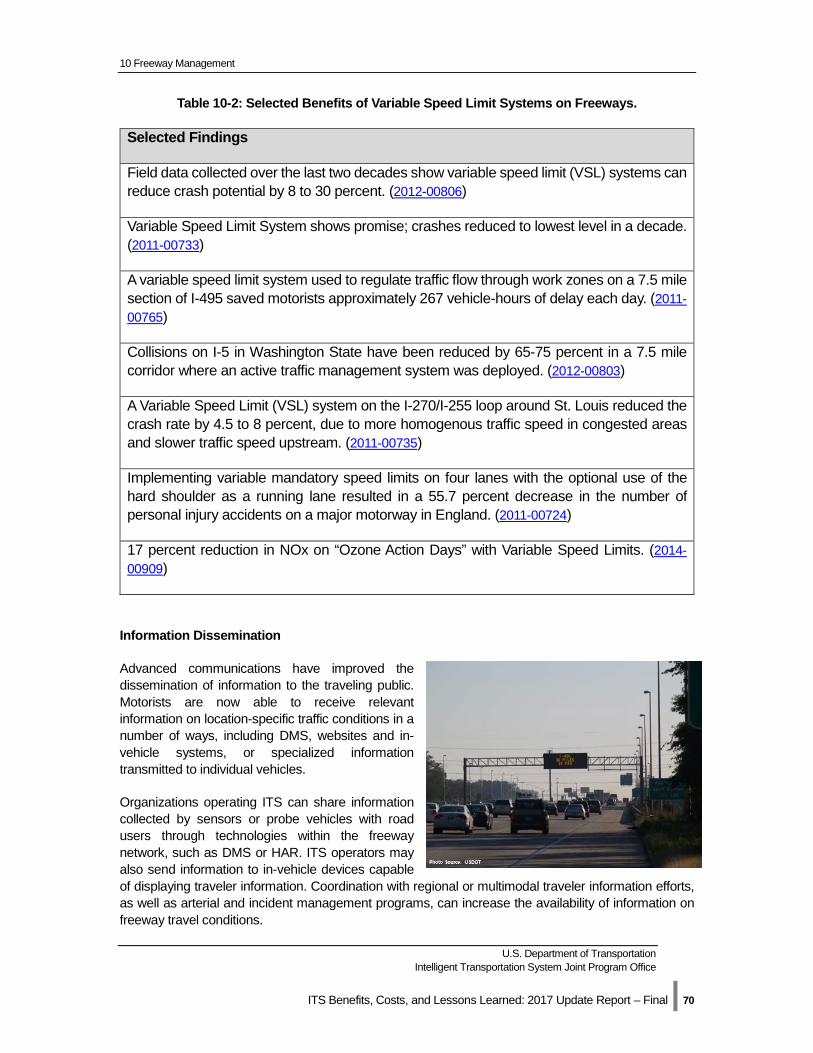
10 Freeway Management
U.S. Department of Transportation Intelligent Transportation System Joint Program Office
ITS Benefits, Costs, and Lessons Learned: 2017 Update Report – Final | 70
Table 10-2: Selected Benefits of Variable Speed Limit Systems on Freeways.
Selected Findings
Field data collected over the last two decades show variable speed limit (VSL) systems can reduce crash potential by 8 to 30 percent. (2012-00806)
Variable Speed Limit System shows promise; crashes reduced to lowest level in a decade. (2011-00733)
A variable speed limit system used to regulate traffic flow through work zones on a 7.5 mile section of I-495 saved motorists approximately 267 vehicle-hours of delay each day. (2011-00765)
Collisions on I-5 in Washington State have been reduced by 65-75 percent in a 7.5 mile corridor where an active traffic management system was deployed. (2012-00803)
A Variable Speed Limit (VSL) system on the I-270/I-255 loop around St. Louis reduced the crash rate by 4.5 to 8 percent, due to more homogenous traffic speed in congested areas and slower traffic speed upstream. (2011-00735)
Implementing variable mandatory speed limits on four lanes with the optional use of the hard shoulder as a running lane resulted in a 55.7 percent decrease in the number of personal injury accidents on a major motorway in England. (2011-00724)
17 percent reduction in NOx on “Ozone Action Days” with Variable Speed Limits. (2014-00909)
Information Dissemination
Advanced communications have improved the dissemination of information to the traveling public. Motorists are now able to receive relevant information on location-specific traffic conditions in a number of ways, including DMS, websites and in-vehicle systems, or specialized information transmitted to individual vehicles.
Organizations operating ITS can share information collected by sensors or probe vehicles with road users through technologies within the freeway network, such as DMS or HAR. ITS operators may also send information to in-vehicle devices capable of displaying traveler information. Coordination with regional or multimodal traveler information efforts, as well as arterial and incident management programs, can increase the availability of information on freeway travel conditions.
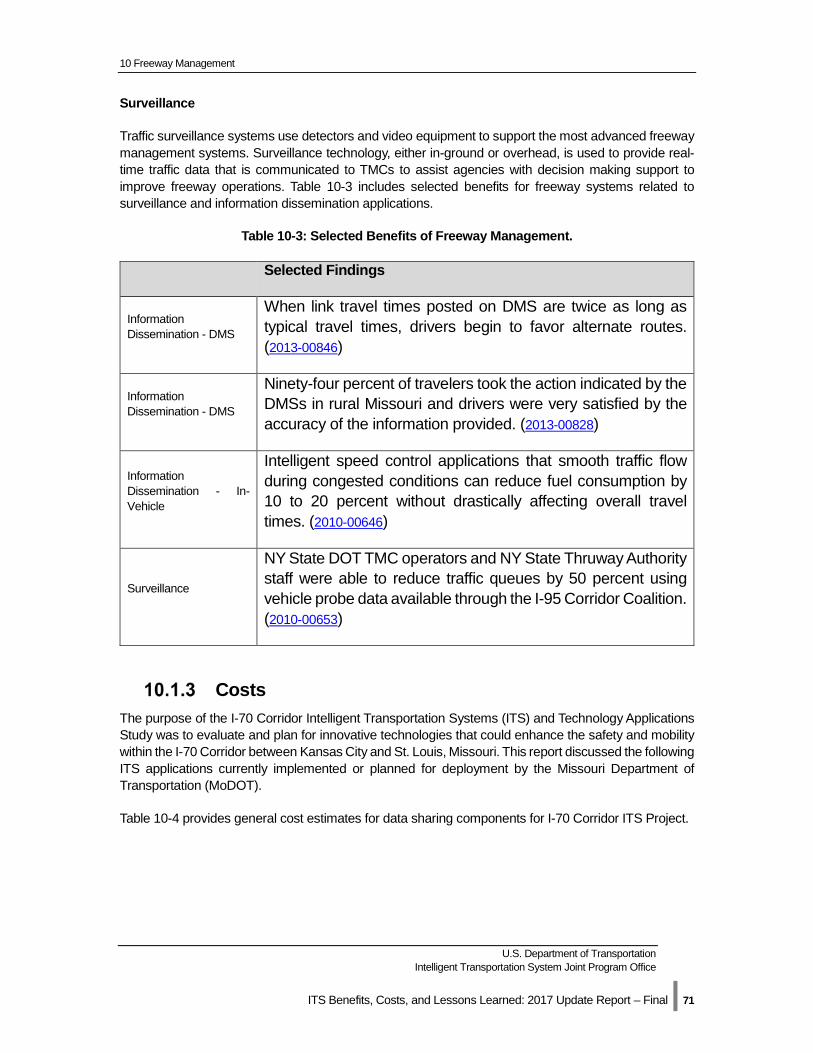
10 Freeway Management
U.S. Department of Transportation Intelligent Transportation System Joint Program Office
ITS Benefits, Costs, and Lessons Learned: 2017 Update Report – Final | 71
Surveillance
Traffic surveillance systems use detectors and video equipment to support the most advanced freeway management systems. Surveillance technology, either in-ground or overhead, is used to provide real-time traffic data that is communicated to TMCs to assist agencies with decision making support to improve freeway operations. Table 10-3 includes selected benefits for freeway systems related to surveillance and information dissemination applications.
Table 10-3: Selected Benefits of Freeway Management.
Selected Findings
Information Dissemination - DMS
When link travel times posted on DMS are twice as long as typical travel times, drivers begin to favor alternate routes. (2013-00846)
Information Dissemination - DMS
Ninety-four percent of travelers took the action indicated by the DMSs in rural Missouri and drivers were very satisfied by the accuracy of the information provided. (2013-00828)
Information Dissemination - In-Vehicle
Intelligent speed control applications that smooth traffic flow during congested conditions can reduce fuel consumption by 10 to 20 percent without drastically affecting overall travel times. (2010-00646)
Surveillance
NY State DOT TMC operators and NY State Thruway Authority staff were able to reduce traffic queues by 50 percent using vehicle probe data available through the I-95 Corridor Coalition. (2010-00653)
Costs The purpose of the I-70 Corridor Intelligent Transportation Systems (ITS) and Technology Applications Study was to evaluate and plan for innovative technologies that could enhance the safety and mobility within the I-70 Corridor between Kansas City and St. Louis, Missouri. This report discussed the following ITS applications currently implemented or planned for deployment by the Missouri Department of Transportation (MoDOT).
Table 10-4 provides general cost estimates for data sharing components for I-70 Corridor ITS Project.
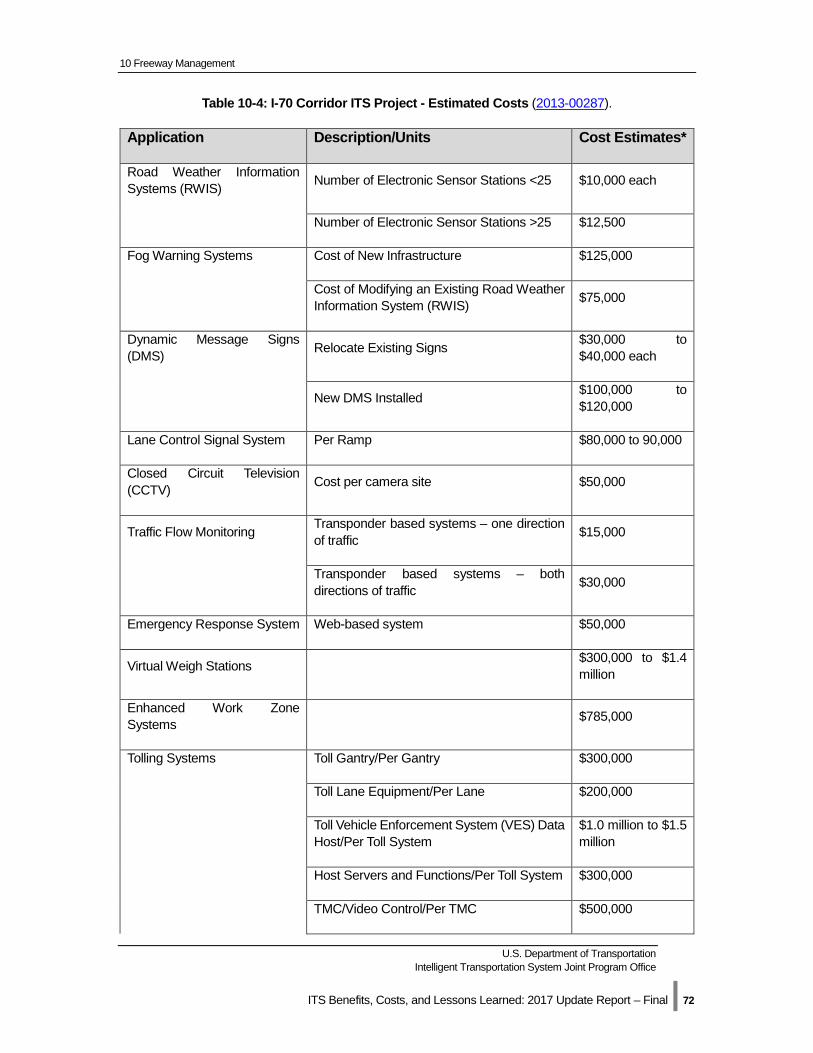
10 Freeway Management
U.S. Department of Transportation Intelligent Transportation System Joint Program Office
ITS Benefits, Costs, and Lessons Learned: 2017 Update Report – Final | 72
Table 10-4: I-70 Corridor ITS Project - Estimated Costs (2013-00287).
Application Description/Units Cost Estimates*
Road Weather Information Systems (RWIS) Number of Electronic Sensor Stations <25 $10,000 each
Number of Electronic Sensor Stations >25 $12,500
Fog Warning Systems Cost of New Infrastructure $125,000
Cost of Modifying an Existing Road Weather Information System (RWIS) $75,000
Dynamic Message Signs (DMS) Relocate Existing Signs $30,000 to
$40,000 each
New DMS Installed $100,000 to $120,000
Lane Control Signal System Per Ramp $80,000 to 90,000
Closed Circuit Television (CCTV) Cost per camera site $50,000
Traffic Flow Monitoring Transponder based systems – one direction of traffic $15,000
Transponder based systems – both directions of traffic $30,000
Emergency Response System Web-based system $50,000
Virtual Weigh Stations $300,000 to $1.4 million
Enhanced Work Zone Systems $785,000
Tolling Systems Toll Gantry/Per Gantry $300,000
Toll Lane Equipment/Per Lane $200,000
Toll Vehicle Enforcement System (VES) Data Host/Per Toll System
$1.0 million to $1.5 million
Host Servers and Functions/Per Toll System $300,000
TMC/Video Control/Per TMC $500,000
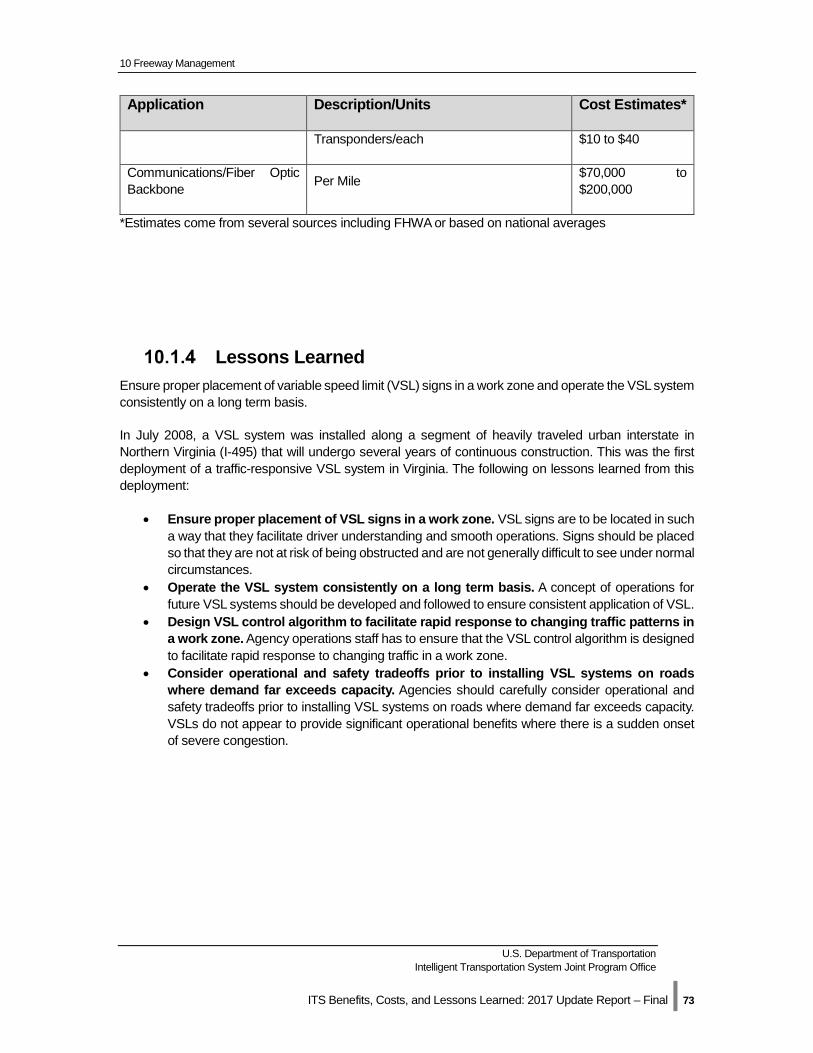
10 Freeway Management
U.S. Department of Transportation Intelligent Transportation System Joint Program Office
ITS Benefits, Costs, and Lessons Learned: 2017 Update Report – Final | 73
Application Description/Units Cost Estimates*
Transponders/each $10 to $40
Communications/Fiber Optic Backbone Per Mile $70,000 to
$200,000
*Estimates come from several sources including FHWA or based on national averages
Lessons Learned Ensure proper placement of variable speed limit (VSL) signs in a work zone and operate the VSL system consistently on a long term basis.
In July 2008, a VSL system was installed along a segment of heavily traveled urban interstate in Northern Virginia (I-495) that will undergo several years of continuous construction. This was the first deployment of a traffic-responsive VSL system in Virginia. The following on lessons learned from this deployment:
• Ensure proper placement of VSL signs in a work zone. VSL signs are to be located in such a way that they facilitate driver understanding and smooth operations. Signs should be placed so that they are not at risk of being obstructed and are not generally difficult to see under normal circumstances.
• Operate the VSL system consistently on a long term basis. A concept of operations for future VSL systems should be developed and followed to ensure consistent application of VSL.
• Design VSL control algorithm to facilitate rapid response to changing traffic patterns in a work zone. Agency operations staff has to ensure that the VSL control algorithm is designed to facilitate rapid response to changing traffic in a work zone.
• Consider operational and safety tradeoffs prior to installing VSL systems on roads where demand far exceeds capacity. Agencies should carefully consider operational and safety tradeoffs prior to installing VSL systems on roads where demand far exceeds capacity. VSLs do not appear to provide significant operational benefits where there is a sudden onset of severe congestion.
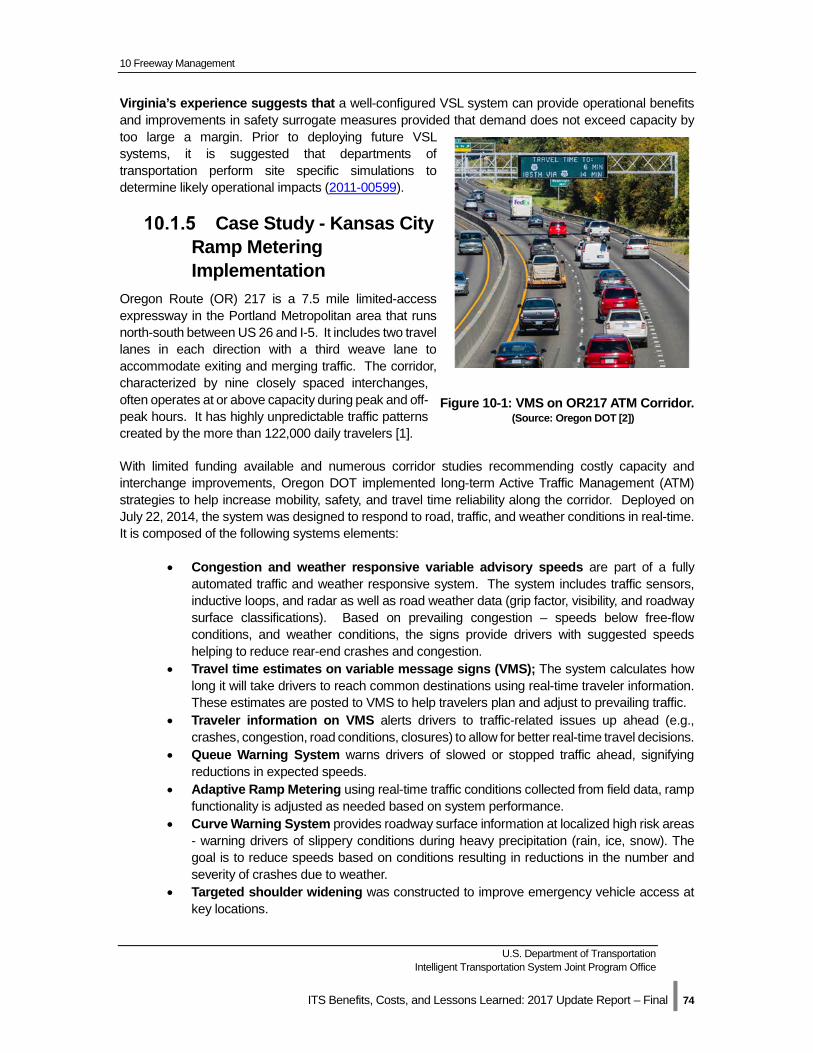
10 Freeway Management
U.S. Department of Transportation Intelligent Transportation System Joint Program Office
ITS Benefits, Costs, and Lessons Learned: 2017 Update Report – Final | 74
Virginia’s experience suggests that a well-configured VSL system can provide operational benefits and improvements in safety surrogate measures provided that demand does not exceed capacity by too large a margin. Prior to deploying future VSL systems, it is suggested that departments of transportation perform site specific simulations to determine likely operational impacts (2011-00599).
Case Study - Kansas City Ramp Metering Implementation
Oregon Route (OR) 217 is a 7.5 mile limited-access expressway in the Portland Metropolitan area that runs north-south between US 26 and I-5. It includes two travel lanes in each direction with a third weave lane to accommodate exiting and merging traffic. The corridor, characterized by nine closely spaced interchanges, often operates at or above capacity during peak and off-peak hours. It has highly unpredictable traffic patterns created by the more than 122,000 daily travelers [1].
With limited funding available and numerous corridor studies recommending costly capacity and interchange improvements, Oregon DOT implemented long-term Active Traffic Management (ATM) strategies to help increase mobility, safety, and travel time reliability along the corridor. Deployed on July 22, 2014, the system was designed to respond to road, traffic, and weather conditions in real-time. It is composed of the following systems elements:
• Congestion and weather responsive variable advisory speeds are part of a fully automated traffic and weather responsive system. The system includes traffic sensors, inductive loops, and radar as well as road weather data (grip factor, visibility, and roadway surface classifications). Based on prevailing congestion – speeds below free-flow conditions, and weather conditions, the signs provide drivers with suggested speeds helping to reduce rear-end crashes and congestion.
• Travel time estimates on variable message signs (VMS); The system calculates how long it will take drivers to reach common destinations using real-time traveler information. These estimates are posted to VMS to help travelers plan and adjust to prevailing traffic.
• Traveler information on VMS alerts drivers to traffic-related issues up ahead (e.g., crashes, congestion, road conditions, closures) to allow for better real-time travel decisions.
• Queue Warning System warns drivers of slowed or stopped traffic ahead, signifying reductions in expected speeds.
• Adaptive Ramp Metering using real-time traffic conditions collected from field data, ramp functionality is adjusted as needed based on system performance.
• Curve Warning System provides roadway surface information at localized high risk areas - warning drivers of slippery conditions during heavy precipitation (rain, ice, snow). The goal is to reduce speeds based on conditions resulting in reductions in the number and severity of crashes due to weather.
• Targeted shoulder widening was constructed to improve emergency vehicle access at key locations.
Figure 10-1: VMS on OR217 ATM Corridor. (Source: Oregon DOT [2])
10 Freeway Management
U.S. Department of Transportation Intelligent Transportation System Joint Program Office
ITS Benefits, Costs, and Lessons Learned: 2017 Update Report – Final | 75
To evaluate system performance (i.e., determine operational and safety improvements), key metrics were assessed before and one-year after system deployment. Results showed: (1) a significant reduction in crashes and crash severity, (2) improvements in reliability, and (3) an increase in peak period vehicles per lane per hour (VPLPH).
Evaluation Results
• Crash data was collected from several independent sources. Data from one source indicates a reduction in total crashes with a significant reduction in severity (60%) and targeted crash types, rear-end and side-swipe overtaking, (18.6%) associated with congestion. This data source shows a reduction of nearly 21% of total crashes, whereas another data source yielded a reduction of 13.5%.
• Volume data was collected through the system using two week samples of hourly peak period weekday volumes for the months of August, November, February and May. This data indicates a 5.8% combined increase in vehicles per lane per hour (VPLPH). The NB corridor saw the largest increases in volume with PM peak seeing increases of over 9.3%.
• Using HERE travel time data, overall average travel times along the OR217 corridor changed by less than 1% while the vehicles per lane per hour values increased by over 5%.
• HERE data was evaluated on the OR217 corridor using a SB route from MP1.11 to MP6.19 and NB route from MP6.51 to MP1.24. The results indicate that, with the steadily increasing traffic volumes, the corridor was able to maintain overall average travel times while the 95% travel times were reduced by over 5%.
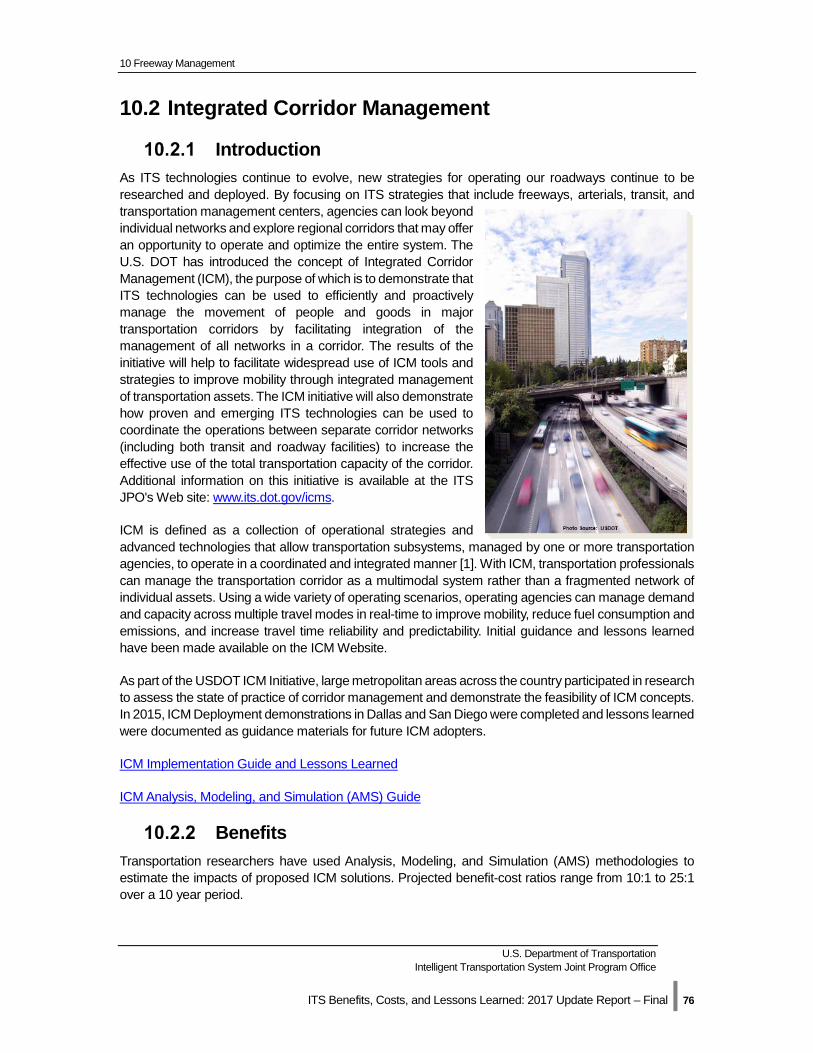
10 Freeway Management
U.S. Department of Transportation Intelligent Transportation System Joint Program Office
ITS Benefits, Costs, and Lessons Learned: 2017 Update Report – Final | 76
10.2 Integrated Corridor Management
Introduction As ITS technologies continue to evolve, new strategies for operating our roadways continue to be researched and deployed. By focusing on ITS strategies that include freeways, arterials, transit, and transportation management centers, agencies can look beyond individual networks and explore regional corridors that may offer an opportunity to operate and optimize the entire system. The U.S. DOT has introduced the concept of Integrated Corridor Management (ICM), the purpose of which is to demonstrate that ITS technologies can be used to efficiently and proactively manage the movement of people and goods in major transportation corridors by facilitating integration of the management of all networks in a corridor. The results of the initiative will help to facilitate widespread use of ICM tools and strategies to improve mobility through integrated management of transportation assets. The ICM initiative will also demonstrate how proven and emerging ITS technologies can be used to coordinate the operations between separate corridor networks (including both transit and roadway facilities) to increase the effective use of the total transportation capacity of the corridor. Additional information on this initiative is available at the ITS JPO's Web site: www.its.dot.gov/icms.
ICM is defined as a collection of operational strategies and advanced technologies that allow transportation subsystems, managed by one or more transportation agencies, to operate in a coordinated and integrated manner [1]. With ICM, transportation professionals can manage the transportation corridor as a multimodal system rather than a fragmented network of individual assets. Using a wide variety of operating scenarios, operating agencies can manage demand and capacity across multiple travel modes in real-time to improve mobility, reduce fuel consumption and emissions, and increase travel time reliability and predictability. Initial guidance and lessons learned have been made available on the ICM Website.
As part of the USDOT ICM Initiative, large metropolitan areas across the country participated in research to assess the state of practice of corridor management and demonstrate the feasibility of ICM concepts. In 2015, ICM Deployment demonstrations in Dallas and San Diego were completed and lessons learned were documented as guidance materials for future ICM adopters.
ICM Implementation Guide and Lessons Learned
ICM Analysis, Modeling, and Simulation (AMS) Guide
Benefits Transportation researchers have used Analysis, Modeling, and Simulation (AMS) methodologies to estimate the impacts of proposed ICM solutions. Projected benefit-cost ratios range from 10:1 to 25:1 over a 10 year period.
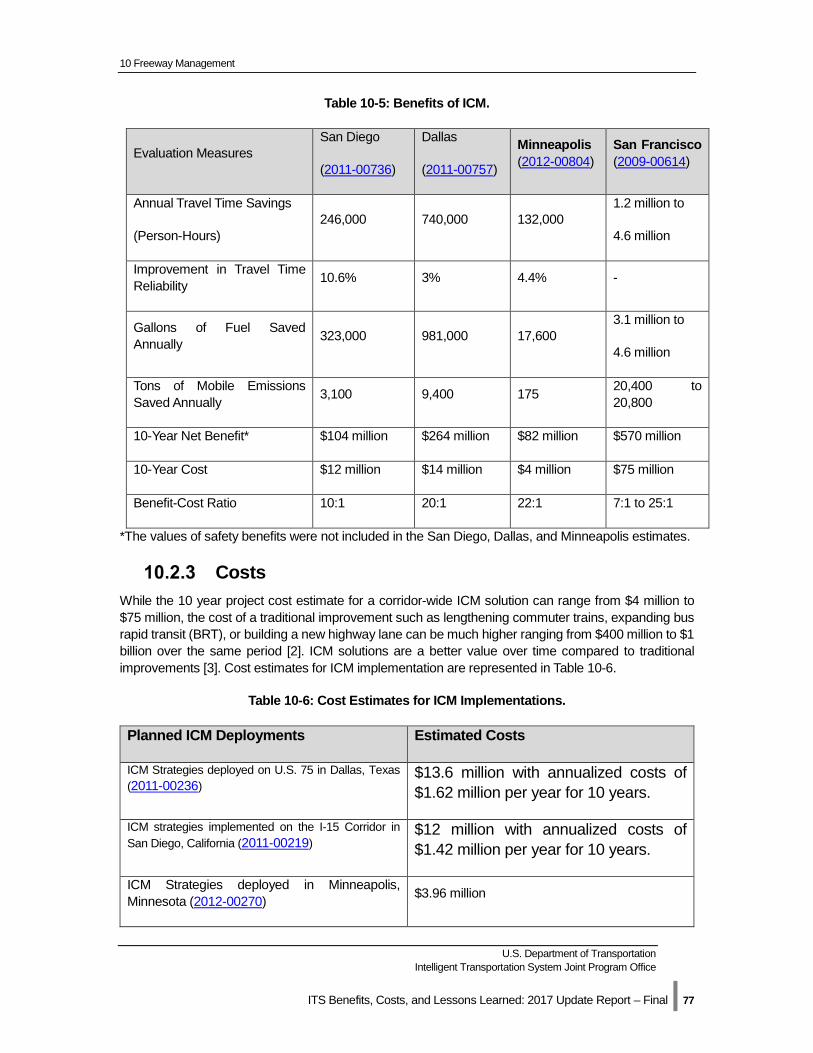
10 Freeway Management
U.S. Department of Transportation Intelligent Transportation System Joint Program Office
ITS Benefits, Costs, and Lessons Learned: 2017 Update Report – Final | 77
Table 10-5: Benefits of ICM.
Evaluation Measures San Diego
(2011-00736)
Dallas
(2011-00757)
Minneapolis (2012-00804)
San Francisco (2009-00614)
Annual Travel Time Savings
(Person-Hours) 246,000 740,000 132,000
1.2 million to
4.6 million
Improvement in Travel Time Reliability 10.6% 3% 4.4% -
Gallons of Fuel Saved Annually 323,000 981,000 17,600
3.1 million to
4.6 million
Tons of Mobile Emissions Saved Annually 3,100 9,400 175 20,400 to
20,800
10-Year Net Benefit* $104 million $264 million $82 million $570 million
10-Year Cost $12 million $14 million $4 million $75 million
Benefit-Cost Ratio 10:1 20:1 22:1 7:1 to 25:1
*The values of safety benefits were not included in the San Diego, Dallas, and Minneapolis estimates.
Costs While the 10 year project cost estimate for a corridor-wide ICM solution can range from $4 million to $75 million, the cost of a traditional improvement such as lengthening commuter trains, expanding bus rapid transit (BRT), or building a new highway lane can be much higher ranging from $400 million to $1 billion over the same period [2]. ICM solutions are a better value over time compared to traditional improvements [3]. Cost estimates for ICM implementation are represented in Table 10-6.
Table 10-6: Cost Estimates for ICM Implementations.
Planned ICM Deployments Estimated Costs
ICM Strategies deployed on U.S. 75 in Dallas, Texas (2011-00236)
$13.6 million with annualized costs of $1.62 million per year for 10 years.
ICM strategies implemented on the I-15 Corridor in San Diego, California (2011-00219)
$12 million with annualized costs of $1.42 million per year for 10 years.
ICM Strategies deployed in Minneapolis, Minnesota (2012-00270) $3.96 million
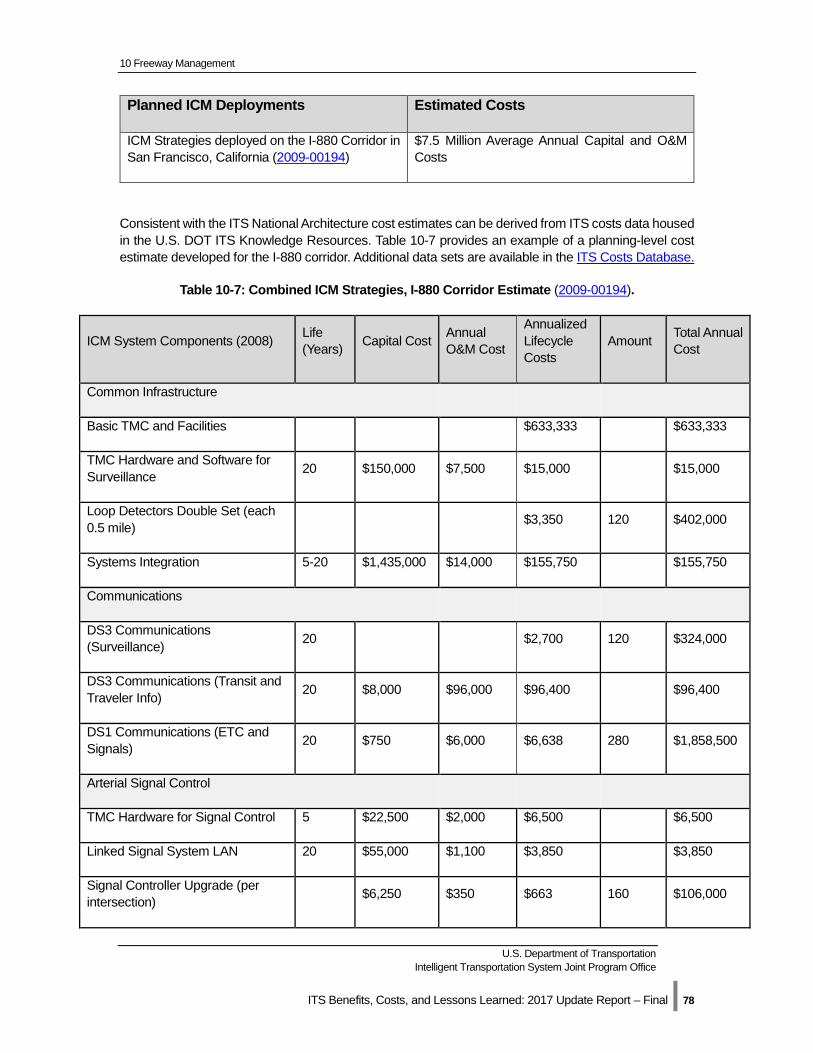
10 Freeway Management
U.S. Department of Transportation Intelligent Transportation System Joint Program Office
ITS Benefits, Costs, and Lessons Learned: 2017 Update Report – Final | 78
Planned ICM Deployments Estimated Costs
ICM Strategies deployed on the I-880 Corridor in San Francisco, California (2009-00194)
$7.5 Million Average Annual Capital and O&M Costs
Consistent with the ITS National Architecture cost estimates can be derived from ITS costs data housed in the U.S. DOT ITS Knowledge Resources. Table 10-7 provides an example of a planning-level cost estimate developed for the I-880 corridor. Additional data sets are available in the ITS Costs Database.
Table 10-7: Combined ICM Strategies, I-880 Corridor Estimate (2009-00194).
ICM System Components (2008) Life (Years) Capital Cost Annual
O&M Cost
Annualized Lifecycle Costs
Amount Total Annual Cost
Common Infrastructure
Basic TMC and Facilities $633,333 $633,333
TMC Hardware and Software for Surveillance 20 $150,000 $7,500 $15,000 $15,000
Loop Detectors Double Set (each 0.5 mile) $3,350 120 $402,000
Systems Integration 5-20 $1,435,000 $14,000 $155,750 $155,750
Communications
DS3 Communications (Surveillance) 20 $2,700 120 $324,000
DS3 Communications (Transit and Traveler Info) 20 $8,000 $96,000 $96,400 $96,400
DS1 Communications (ETC and Signals) 20 $750 $6,000 $6,638 280 $1,858,500
Arterial Signal Control
TMC Hardware for Signal Control 5 $22,500 $2,000 $6,500 $6,500
Linked Signal System LAN 20 $55,000 $1,100 $3,850 $3,850
Signal Controller Upgrade (per intersection) $6,250 $350 $663 160 $106,000
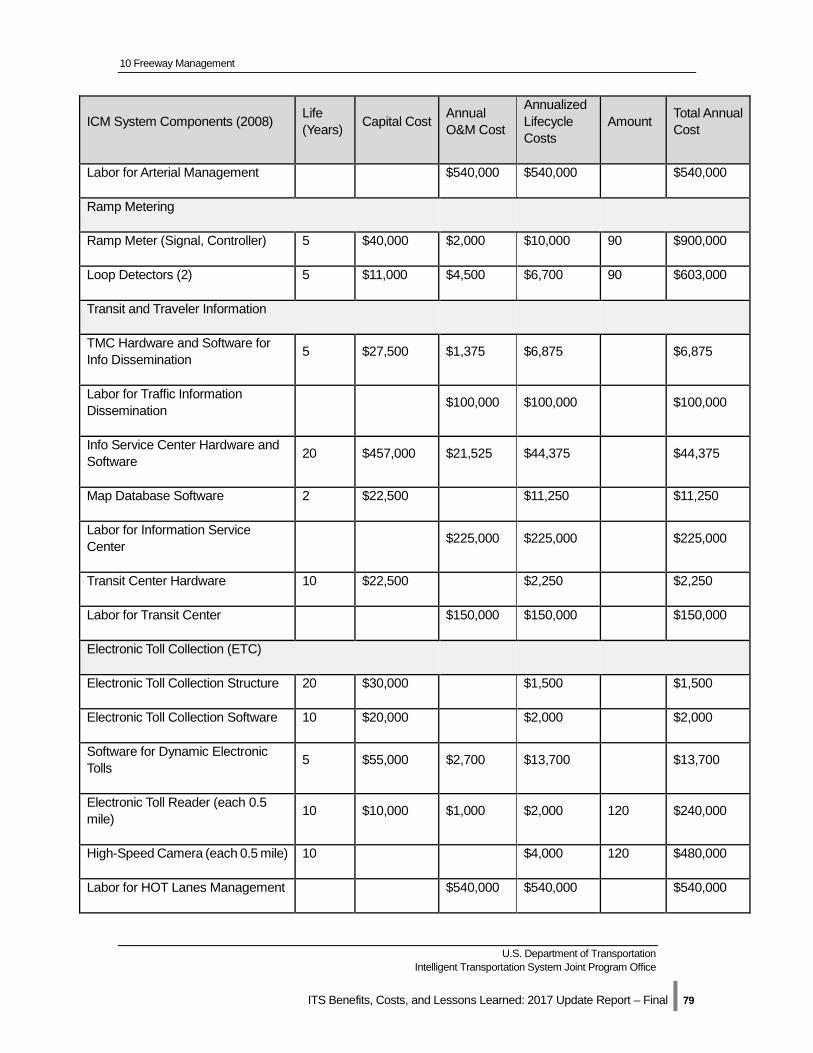
10 Freeway Management
U.S. Department of Transportation Intelligent Transportation System Joint Program Office
ITS Benefits, Costs, and Lessons Learned: 2017 Update Report – Final | 79
ICM System Components (2008) Life (Years) Capital Cost Annual
O&M Cost
Annualized Lifecycle Costs
Amount Total Annual Cost
Labor for Arterial Management $540,000 $540,000 $540,000
Ramp Metering
Ramp Meter (Signal, Controller) 5 $40,000 $2,000 $10,000 90 $900,000
Loop Detectors (2) 5 $11,000 $4,500 $6,700 90 $603,000
Transit and Traveler Information
TMC Hardware and Software for Info Dissemination 5 $27,500 $1,375 $6,875 $6,875
Labor for Traffic Information Dissemination $100,000 $100,000 $100,000
Info Service Center Hardware and Software 20 $457,000 $21,525 $44,375 $44,375
Map Database Software 2 $22,500 $11,250 $11,250
Labor for Information Service Center $225,000 $225,000 $225,000
Transit Center Hardware 10 $22,500 $2,250 $2,250
Labor for Transit Center $150,000 $150,000 $150,000
Electronic Toll Collection (ETC)
Electronic Toll Collection Structure 20 $30,000 $1,500 $1,500
Electronic Toll Collection Software 10 $20,000 $2,000 $2,000
Software for Dynamic Electronic Tolls 5 $55,000 $2,700 $13,700 $13,700
Electronic Toll Reader (each 0.5 mile) 10 $10,000 $1,000 $2,000 120 $240,000
High-Speed Camera (each 0.5 mile) 10 $4,000 120 $480,000
Labor for HOT Lanes Management $540,000 $540,000 $540,000
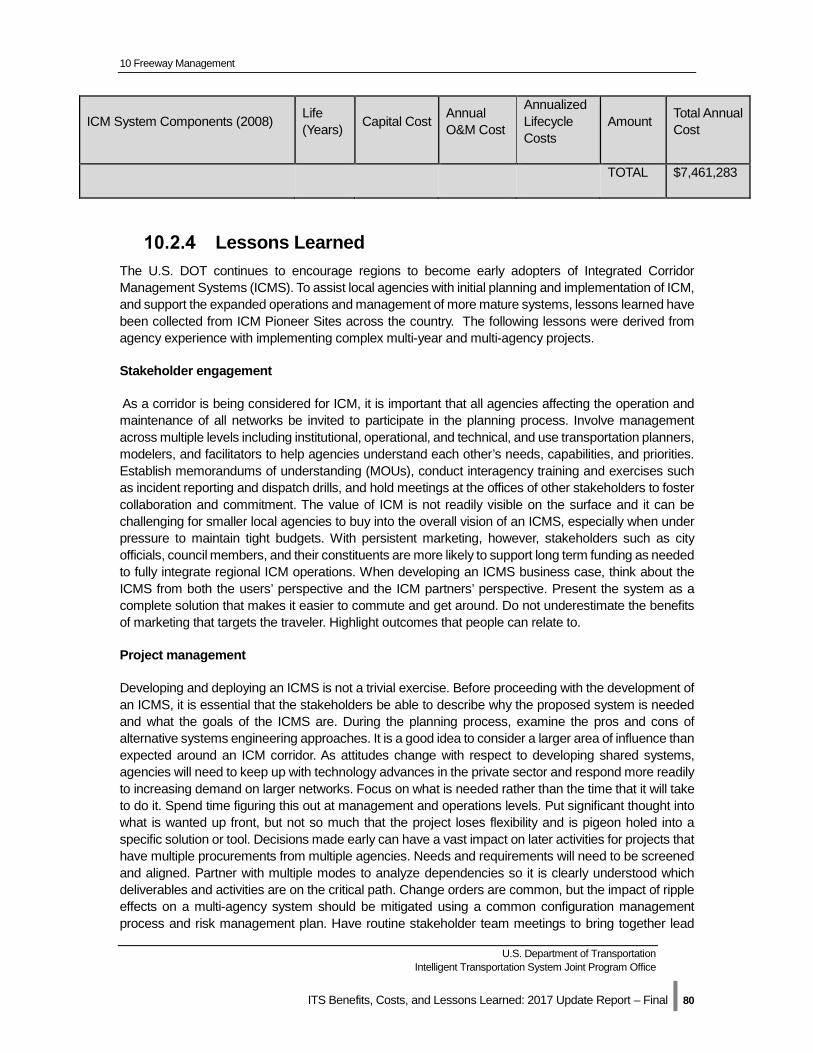
10 Freeway Management
U.S. Department of Transportation Intelligent Transportation System Joint Program Office
ITS Benefits, Costs, and Lessons Learned: 2017 Update Report – Final | 80
ICM System Components (2008) Life (Years) Capital Cost Annual
O&M Cost
Annualized Lifecycle Costs
Amount Total Annual Cost
TOTAL $7,461,283
Lessons Learned The U.S. DOT continues to encourage regions to become early adopters of Integrated Corridor Management Systems (ICMS). To assist local agencies with initial planning and implementation of ICM, and support the expanded operations and management of more mature systems, lessons learned have been collected from ICM Pioneer Sites across the country. The following lessons were derived from agency experience with implementing complex multi-year and multi-agency projects.
Stakeholder engagement
As a corridor is being considered for ICM, it is important that all agencies affecting the operation and maintenance of all networks be invited to participate in the planning process. Involve management across multiple levels including institutional, operational, and technical, and use transportation planners, modelers, and facilitators to help agencies understand each other’s needs, capabilities, and priorities. Establish memorandums of understanding (MOUs), conduct interagency training and exercises such as incident reporting and dispatch drills, and hold meetings at the offices of other stakeholders to foster collaboration and commitment. The value of ICM is not readily visible on the surface and it can be challenging for smaller local agencies to buy into the overall vision of an ICMS, especially when under pressure to maintain tight budgets. With persistent marketing, however, stakeholders such as city officials, council members, and their constituents are more likely to support long term funding as needed to fully integrate regional ICM operations. When developing an ICMS business case, think about the ICMS from both the users’ perspective and the ICM partners’ perspective. Present the system as a complete solution that makes it easier to commute and get around. Do not underestimate the benefits of marketing that targets the traveler. Highlight outcomes that people can relate to.
Project management
Developing and deploying an ICMS is not a trivial exercise. Before proceeding with the development of an ICMS, it is essential that the stakeholders be able to describe why the proposed system is needed and what the goals of the ICMS are. During the planning process, examine the pros and cons of alternative systems engineering approaches. It is a good idea to consider a larger area of influence than expected around an ICM corridor. As attitudes change with respect to developing shared systems, agencies will need to keep up with technology advances in the private sector and respond more readily to increasing demand on larger networks. Focus on what is needed rather than the time that it will take to do it. Spend time figuring this out at management and operations levels. Put significant thought into what is wanted up front, but not so much that the project loses flexibility and is pigeon holed into a specific solution or tool. Decisions made early can have a vast impact on later activities for projects that have multiple procurements from multiple agencies. Needs and requirements will need to be screened and aligned. Partner with multiple modes to analyze dependencies so it is clearly understood which deliverables and activities are on the critical path. Change orders are common, but the impact of ripple effects on a multi-agency system should be mitigated using a common configuration management process and risk management plan. Have routine stakeholder team meetings to bring together lead
10 Freeway Management
U.S. Department of Transportation Intelligent Transportation System Joint Program Office
ITS Benefits, Costs, and Lessons Learned: 2017 Update Report – Final | 81
members of each organization/committee, settle on common project terminology, and discuss progress with the project champion. This is a great way to help team members take ownership of their work and assess project resources. It is difficult to estimate resource needs for an ICMS well into the future, but this can be a key component of success. Future ICMS projects will require new technical skill sets in the areas of communications, fiber optics, traffic signals, and operations. Project managers will need to understand transportation policy, planning, local context, information technology, systems engineering, telecommunications, people, and meeting dynamics.
Project processes
As part of a Federal initiative to advance the state of practice of ICM, systems engineering was used to facilitate deployment at ICM demonstration projects in Dallas and San Diego. Example project documentation developed at each site included a concept of operations (Conops), project management plan (PMP), systems engineering management plan (SEMP), system requirements specifications (SRS), design documents (SDD), and the testing documentation used to verify and validate the system. At the conclusion of each project, researchers highlighted the following lessons learned to assist other cities considering similar projects.
• Concept of operations – Develop a Conops early in the project life cycle to allow stakeholders to clearly understand why the ICMS is needed, what the proposed system intends to do, and how they may be involved in the system’s operations. (2016-00728)
• Project planning – Examine the pros and cons of alternative systems engineering approaches and understand the level of effort required to develop and maintain documentation for each alternative. Balance system engineering rigor with risk tolerance. Develop a SEMP to achieve quality in project development and ultimately produce a successful ICMS. (2014-00668) The SEMP details the requirements documentation and management methodology that will be used, the traceability mechanisms that will be used, how needs elicitation will be conducted, how walkthroughs will be conducted, and how testing will be conducted. (2016-00728)
• Requirements definition and analysis – Develop a logical architecture as one key resource for describing what the ICMS will do. (2014-00670) The logical architecture and requirements should be developed iteratively. Write well-formed requirements from the perspective of the system and not the system user. They should be concise and include data elements that are uniquely identifiable. (2014-00671)
• System design – Develop initial ICMS designs that are robust enough to accept additional strategies. Enable each individual element to improve on its own without being constrained by the overall umbrella system. Early testing with a prototype may be useful when building a user interface. This could be done earlier at stakeholder meetings to help facilitate collection of stakeholder feedback and buy-in on the design.
• Analysis, modeling, and simulation – AMS tools can be used to assess operational strategies before they are implemented and to continuously monitor changing conditions and operational effectiveness. Analyze individual design possibilities to determine which are feasible, which provide the best performance, and which would be the most cost effective methods of system implementation. (2014-00672)
• Build and test – Consider using an iterative build process for new components of a system. For example, a decision support system can be developed in multiple ways using multiple strategies. It may be that several options need to be explored to fulfill stakeholder expectations. Iteration can help to take development in a piece by piece process when there is uncertainty in using new tools. When using a systems engineering approach such as Agile it is especially important to review increments of progress to keep velocity high even though the cost of maintaining documentation may be high. Conduct verification and validation activities at every
10 Freeway Management
U.S. Department of Transportation Intelligent Transportation System Joint Program Office
ITS Benefits, Costs, and Lessons Learned: 2017 Update Report – Final | 82
stage of system implementation. Conduct multiple dry runs prior to acceptance testing. This will help personnel that need to participate remotely to confirm use of command and control functions at their regular workstations. If live testing is conducted, it is good to have a dead-man switch to end live testing quickly.
• Operate and maintain – A carefully planned, methodical transition plan can add to the efficiency of changing-over from old to new equipment. It is important to have good communications between stakeholders and maintenance staff during the transition processes. Bring this to the attention of stakeholders. A decision database should be maintained to inform new staff of decisions made early in the project. Identify system dependencies since the source of lost performance is not always immediately apparent. For example, a problem may present itself as a delay in a response plan; however, finding the problem would be very difficult without knowing all the system dependencies. It is a good idea to have a software support agreement. This makes it easier to identify what needs to be updated, replaced, and repaired, and the specific elements of system enhancements. When planning an ICMS estimate that maintenance costs will be about 10 percent of the design-build costs for the first year, and then about five percent per year thereafter
• Training – Adequately train all operations and maintenance (O&M) personnel and conduct regularly scheduled team meetings to continually improve processes and procedures as ICMS operations mature. (2014-00674) Provide a few weeks of classroom training as well as hands-on and practical training. Three months of practical training may be appropriate for a regional ICMS. Develop cliff-notes for O&M documentation and conduct refresher training every 8 to 12 months.
• Retirement/Replacement – Develop a list of factors and metrics to analyze system performance to determine when system replacement or retirement may become necessary. (2014-00675)
Case Study - ICM Control of the I-394 and TH 55 corridor in Minneapolis, Minnesota (2013-00868)
A model used to simulate ICM control on a 3.5 mile section of I-394 and TH 55 corridor in Minneapolis, Minnesota indicated that diversion control used to fully utilize available capacity along parallel routes can significantly reduce network congestion. The diversion control system design included 10 intersections equipped with SMART-Signal systems and decision support logic that used 30-second traffic data sets from freeway surveillance systems and traffic demand profiles recorded at equipped intersections.
To simulate traffic conditions with and without ICM, a microscopic traffic simulation model (VISSIM) was built and calibrated using field data collected during morning peak hours (7:00-9:00 AM) from June 6-9, 2009. The model compared the results of two scenarios: a base scenario (independent control strategy) and an ICM control scenario (integrated control strategy).
To compare performance during an incident, a freeway car crash was introduced to each scenario decreasing freeway travel speeds to 10 mi/h along an 800 ft section of eastbound I-394 from 7:30-8:00 AM. Metrics included: average delay per vehicle, average number of stops per vehicle, and average vehicle speeds on the freeway and diversion route. The diversion control logic for the ICMS was set up to remain active until the diversion route travel time became longer than the freeway route travel time.
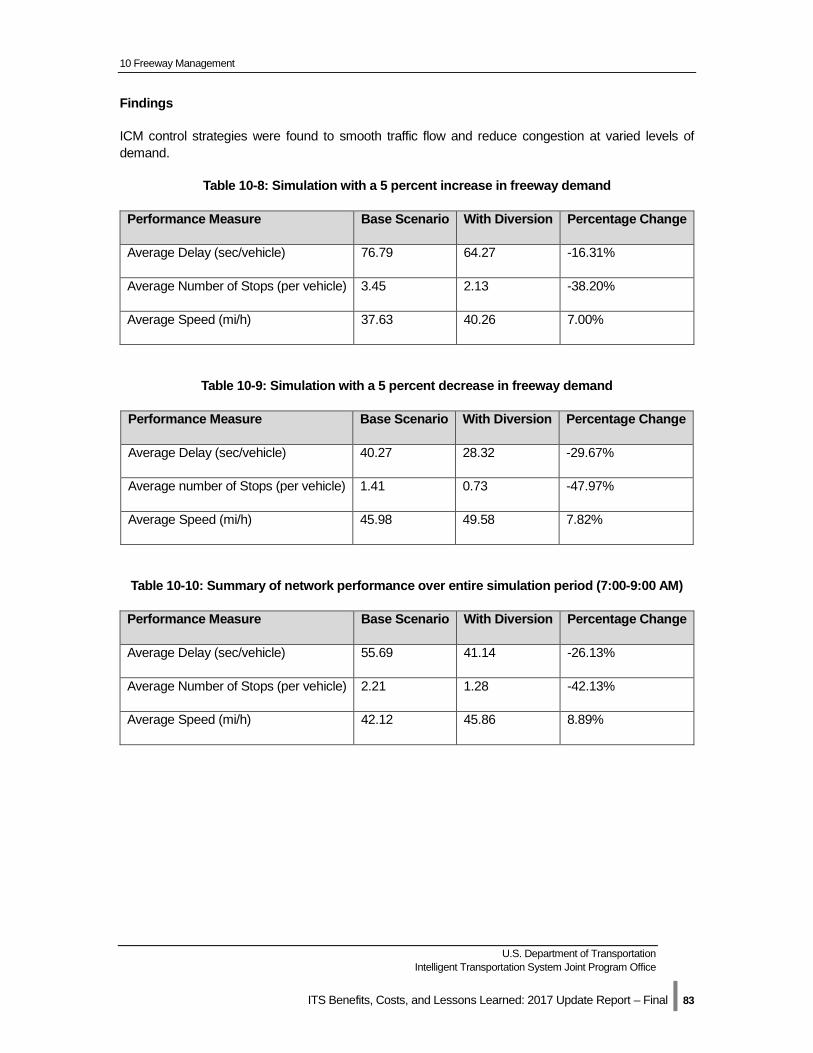
10 Freeway Management
U.S. Department of Transportation Intelligent Transportation System Joint Program Office
ITS Benefits, Costs, and Lessons Learned: 2017 Update Report – Final | 83
Findings
ICM control strategies were found to smooth traffic flow and reduce congestion at varied levels of demand.
Table 10-8: Simulation with a 5 percent increase in freeway demand
Performance Measure Base Scenario With Diversion Percentage Change
Average Delay (sec/vehicle) 76.79 64.27 -16.31%
Average Number of Stops (per vehicle) 3.45 2.13 -38.20%
Average Speed (mi/h) 37.63 40.26 7.00%
Table 10-9: Simulation with a 5 percent decrease in freeway demand
Performance Measure Base Scenario With Diversion Percentage Change
Average Delay (sec/vehicle) 40.27 28.32 -29.67%
Average number of Stops (per vehicle) 1.41 0.73 -47.97%
Average Speed (mi/h) 45.98 49.58 7.82%
Table 10-10: Summary of network performance over entire simulation period (7:00-9:00 AM)
Performance Measure Base Scenario With Diversion Percentage Change
Average Delay (sec/vehicle) 55.69 41.14 -26.13%
Average Number of Stops (per vehicle) 2.21 1.28 -42.13%
Average Speed (mi/h) 42.12 45.86 8.89%
Joint Program Office U.S. Department of Transportation, Research and Innovative Technology Administration
ITS Benefits, Costs, and Lessons Learned: Update Report - Final | 84
11 Roadway Operations and Maintenance
11.1 Introduction ITS applications for operations and maintenance can improve planning for roadway maintenance, enhance safety, and facilitate traffic movement through and around construction work zones. Smart work zones, automated enforcement, traveler information systems, and operations planning tools are a few of the most widely deployed solutions. Evaluation data clearly show these technologies can improve performance; however, with limited budgets and growing demand that exceeds capacity in most metropolitan areas, transportation agencies have adopted new more practical measures to increase benefits and justify costs. Mitigation strategies have shifted from a capacity-oriented approach that relies on increasing capacity to reduce travel times, to a reliability-oriented approach focused on maintaining existing capacity while minimizing disruptions to improve travel time reliability. Using work zone ITS, agencies can better plan and actively manage work zones, increase driver awareness, and improve quality of service.
Both portable and permanent work zone ITS solutions are in use today. Portable Traffic Management Systems (PTMS) can be rapidly deployed to improve safety and mobility regardless of work zone location. Using queue sensors, dynamic message signs (DMS), video cameras, communication equipment, and other hardware and software components, these systems can automatically monitor traffic conditions and communicate with vehicles and drivers to improve situational awareness, harmonize traffic flow, and lessen the impacts of reduced capacity at work zones. More permanent solutions can be implemented for longer term projects or where ITS can be integrated into initial construction. Permanent work zone solutions are generally used as freeway or arterial management systems during time periods without construction activities. These systems often provide broader coverage and use traveler information networks such as 511 services, DMS systems, traffic detection networks, and agency websites to improve system operations, trip-planning and traveler behavior.
11.2 Benefits Work zone ITS can have a wide range of benefits and costs. Benefit-cost ratios can exceed 2:1 depending on the work zone design and technologies used. Specific benefits include construction schedule compression; reductions in traffic volumes, vehicle speeds, queue lengths, and crashes; and fewer and shorter periods of congestion and unexpected delay. Tools such as the Work Zone Impacts and Strategies Estimator (WISE) software package, developed through the Second Strategic Highway Research Program (SHRP 2), provide impact evaluation and decision-making support for state and local engineers and planning professionals.
Figure 11-1 below highlights benefit ranges for several ITS work zone technologies based on entries in the ITS Knowledge Resource database at: http://www.itsknowledgeresources.its.dot.gov/. Benefits can be seen with many different measures across multiple goal areas including mobility, safety, and the environment. Dynamic Lane Merge Systems have demonstrated their ability to reduce the number of
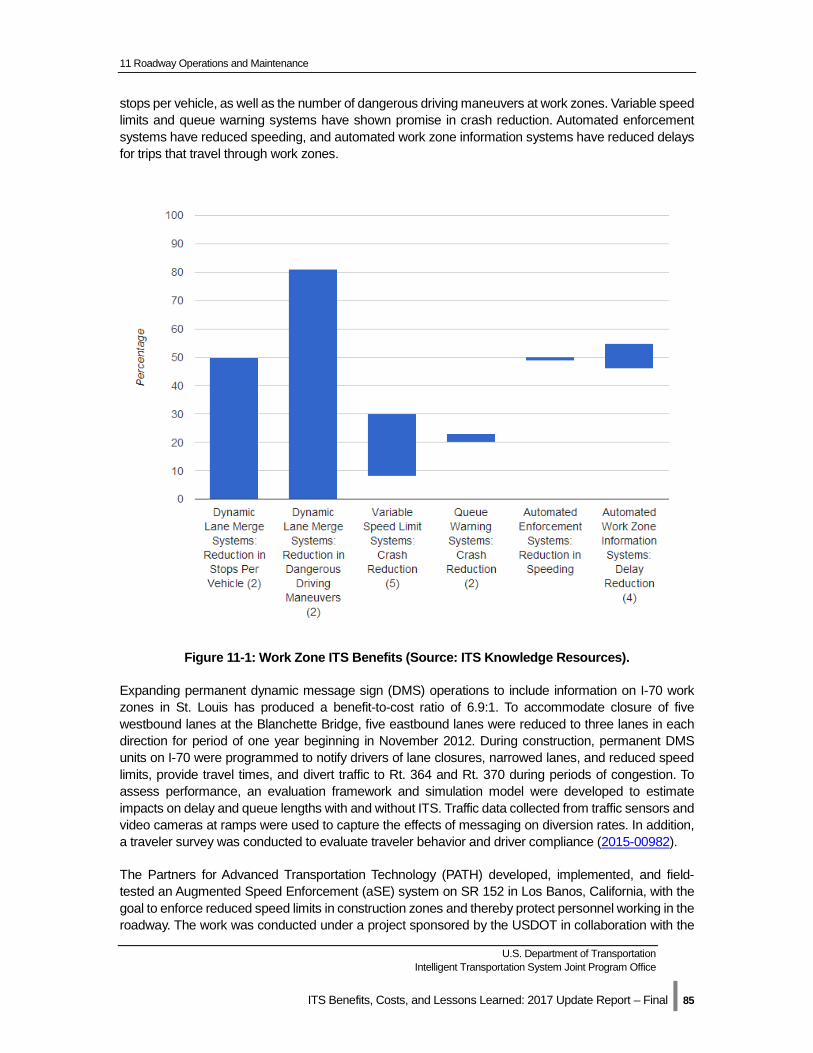
11 Roadway Operations and Maintenance
U.S. Department of Transportation Intelligent Transportation System Joint Program Office
ITS Benefits, Costs, and Lessons Learned: 2017 Update Report – Final | 85
stops per vehicle, as well as the number of dangerous driving maneuvers at work zones. Variable speed limits and queue warning systems have shown promise in crash reduction. Automated enforcement systems have reduced speeding, and automated work zone information systems have reduced delays for trips that travel through work zones.
Figure 11-1: Work Zone ITS Benefits (Source: ITS Knowledge Resources).
Expanding permanent dynamic message sign (DMS) operations to include information on I-70 work zones in St. Louis has produced a benefit-to-cost ratio of 6.9:1. To accommodate closure of five westbound lanes at the Blanchette Bridge, five eastbound lanes were reduced to three lanes in each direction for period of one year beginning in November 2012. During construction, permanent DMS units on I-70 were programmed to notify drivers of lane closures, narrowed lanes, and reduced speed limits, provide travel times, and divert traffic to Rt. 364 and Rt. 370 during periods of congestion. To assess performance, an evaluation framework and simulation model were developed to estimate impacts on delay and queue lengths with and without ITS. Traffic data collected from traffic sensors and video cameras at ramps were used to capture the effects of messaging on diversion rates. In addition, a traveler survey was conducted to evaluate traveler behavior and driver compliance (2015-00982).
The Partners for Advanced Transportation Technology (PATH) developed, implemented, and field-tested an Augmented Speed Enforcement (aSE) system on SR 152 in Los Banos, California, with the goal to enforce reduced speed limits in construction zones and thereby protect personnel working in the roadway. The work was conducted under a project sponsored by the USDOT in collaboration with the
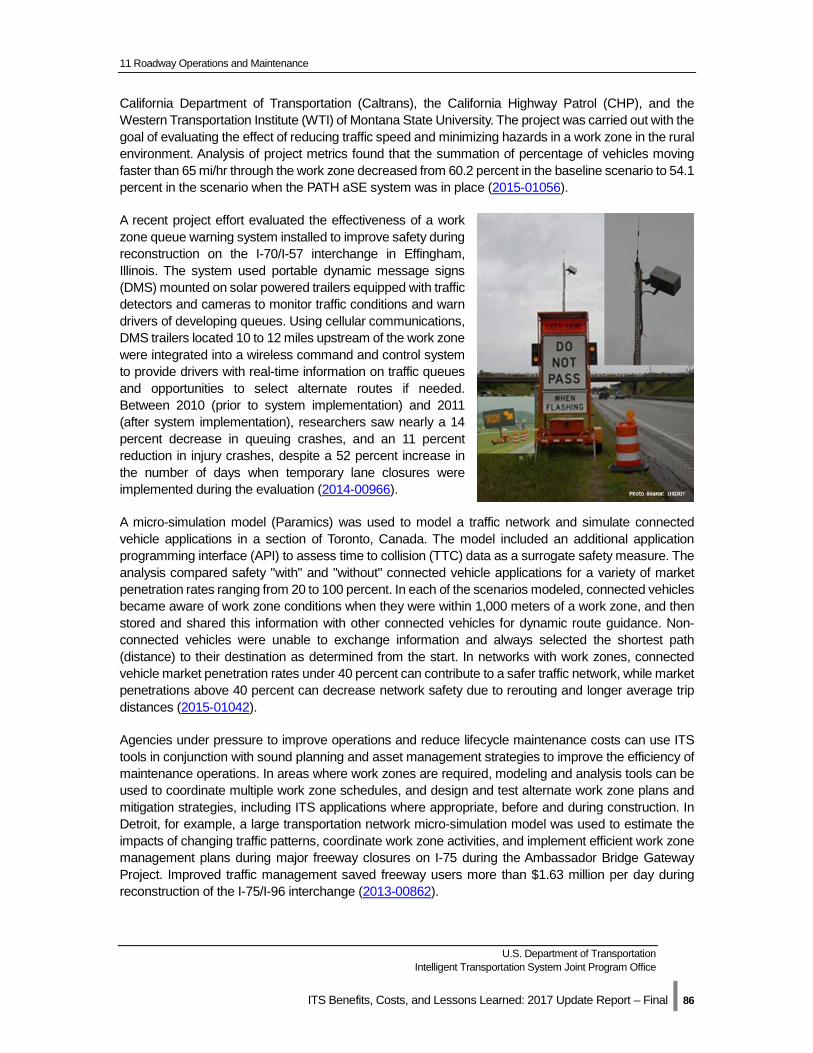
11 Roadway Operations and Maintenance
U.S. Department of Transportation Intelligent Transportation System Joint Program Office
ITS Benefits, Costs, and Lessons Learned: 2017 Update Report – Final | 86
California Department of Transportation (Caltrans), the California Highway Patrol (CHP), and the Western Transportation Institute (WTI) of Montana State University. The project was carried out with the goal of evaluating the effect of reducing traffic speed and minimizing hazards in a work zone in the rural environment. Analysis of project metrics found that the summation of percentage of vehicles moving faster than 65 mi/hr through the work zone decreased from 60.2 percent in the baseline scenario to 54.1 percent in the scenario when the PATH aSE system was in place (2015-01056).
A recent project effort evaluated the effectiveness of a work zone queue warning system installed to improve safety during reconstruction on the I-70/I-57 interchange in Effingham, Illinois. The system used portable dynamic message signs (DMS) mounted on solar powered trailers equipped with traffic detectors and cameras to monitor traffic conditions and warn drivers of developing queues. Using cellular communications, DMS trailers located 10 to 12 miles upstream of the work zone were integrated into a wireless command and control system to provide drivers with real-time information on traffic queues and opportunities to select alternate routes if needed. Between 2010 (prior to system implementation) and 2011 (after system implementation), researchers saw nearly a 14 percent decrease in queuing crashes, and an 11 percent reduction in injury crashes, despite a 52 percent increase in the number of days when temporary lane closures were implemented during the evaluation (2014-00966).
A micro-simulation model (Paramics) was used to model a traffic network and simulate connected vehicle applications in a section of Toronto, Canada. The model included an additional application programming interface (API) to assess time to collision (TTC) data as a surrogate safety measure. The analysis compared safety "with" and "without" connected vehicle applications for a variety of market penetration rates ranging from 20 to 100 percent. In each of the scenarios modeled, connected vehicles became aware of work zone conditions when they were within 1,000 meters of a work zone, and then stored and shared this information with other connected vehicles for dynamic route guidance. Non-connected vehicles were unable to exchange information and always selected the shortest path (distance) to their destination as determined from the start. In networks with work zones, connected vehicle market penetration rates under 40 percent can contribute to a safer traffic network, while market penetrations above 40 percent can decrease network safety due to rerouting and longer average trip distances (2015-01042).
Agencies under pressure to improve operations and reduce lifecycle maintenance costs can use ITS tools in conjunction with sound planning and asset management strategies to improve the efficiency of maintenance operations. In areas where work zones are required, modeling and analysis tools can be used to coordinate multiple work zone schedules, and design and test alternate work zone plans and mitigation strategies, including ITS applications where appropriate, before and during construction. In Detroit, for example, a large transportation network micro-simulation model was used to estimate the impacts of changing traffic patterns, coordinate work zone activities, and implement efficient work zone management plans during major freeway closures on I-75 during the Ambassador Bridge Gateway Project. Improved traffic management saved freeway users more than $1.63 million per day during reconstruction of the I-75/I-96 interchange (2013-00862).
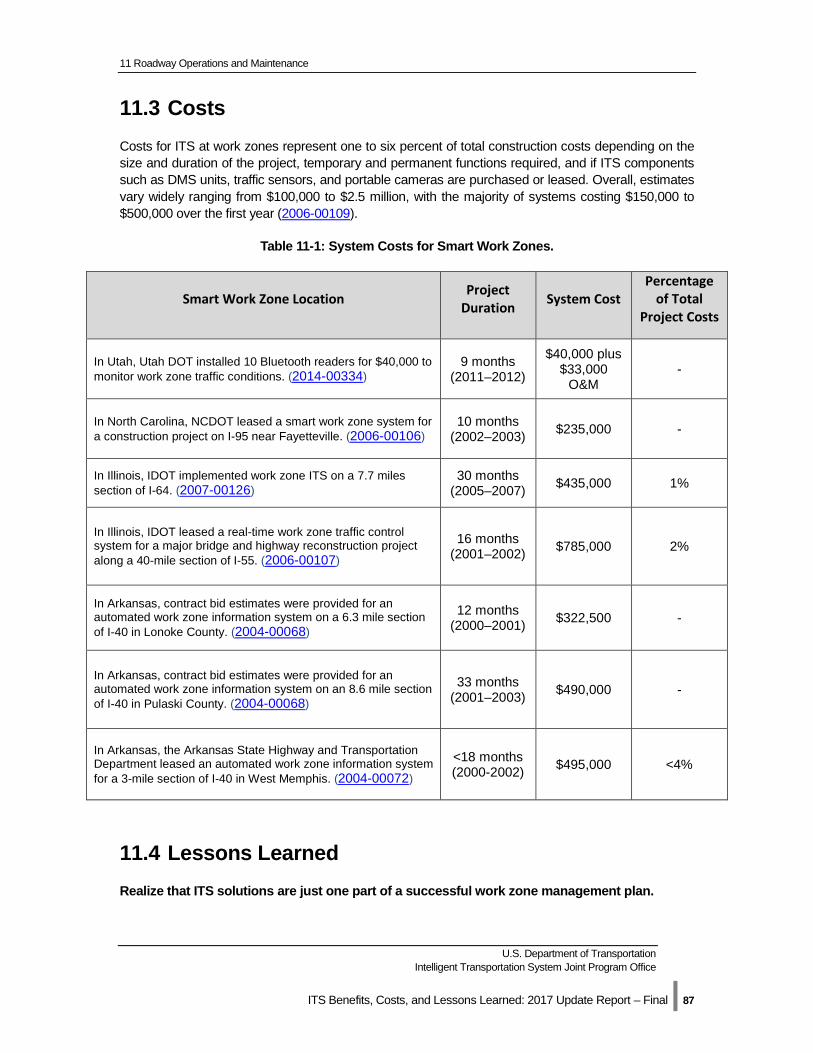
11 Roadway Operations and Maintenance
U.S. Department of Transportation Intelligent Transportation System Joint Program Office
ITS Benefits, Costs, and Lessons Learned: 2017 Update Report – Final | 87
11.3 Costs Costs for ITS at work zones represent one to six percent of total construction costs depending on the size and duration of the project, temporary and permanent functions required, and if ITS components such as DMS units, traffic sensors, and portable cameras are purchased or leased. Overall, estimates vary widely ranging from $100,000 to $2.5 million, with the majority of systems costing $150,000 to $500,000 over the first year (2006-00109).
Table 11-1: System Costs for Smart Work Zones.
Smart Work Zone Location Project Duration System Cost
Percentage of Total
Project Costs
In Utah, Utah DOT installed 10 Bluetooth readers for $40,000 to monitor work zone traffic conditions. (2014-00334)
9 months (2011–2012)
$40,000 plus $33,000
O&M -
In North Carolina, NCDOT leased a smart work zone system for a construction project on I-95 near Fayetteville. (2006-00106)
10 months (2002–2003) $235,000 -
In Illinois, IDOT implemented work zone ITS on a 7.7 miles section of I-64. (2007-00126)
30 months (2005–2007) $435,000 1%
In Illinois, IDOT leased a real-time work zone traffic control system for a major bridge and highway reconstruction project along a 40-mile section of I-55. (2006-00107)
16 months (2001–2002) $785,000 2%
In Arkansas, contract bid estimates were provided for an automated work zone information system on a 6.3 mile section of I-40 in Lonoke County. (2004-00068)
12 months (2000–2001) $322,500 -
In Arkansas, contract bid estimates were provided for an automated work zone information system on an 8.6 mile section of I-40 in Pulaski County. (2004-00068)
33 months (2001–2003) $490,000 -
In Arkansas, the Arkansas State Highway and Transportation Department leased an automated work zone information system for a 3-mile section of I-40 in West Memphis. (2004-00072)
<18 months (2000-2002) $495,000 <4%
11.4 Lessons Learned Realize that ITS solutions are just one part of a successful work zone management plan.
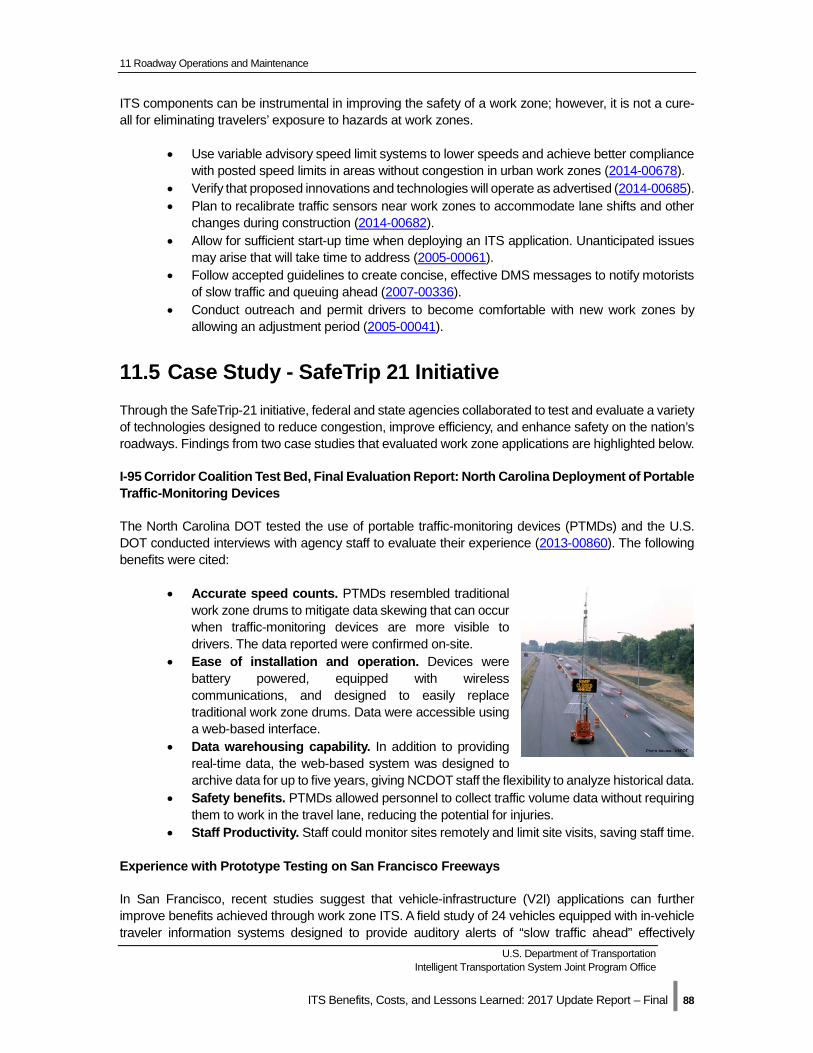
11 Roadway Operations and Maintenance
U.S. Department of Transportation Intelligent Transportation System Joint Program Office
ITS Benefits, Costs, and Lessons Learned: 2017 Update Report – Final | 88
ITS components can be instrumental in improving the safety of a work zone; however, it is not a cure-all for eliminating travelers’ exposure to hazards at work zones.
• Use variable advisory speed limit systems to lower speeds and achieve better compliance with posted speed limits in areas without congestion in urban work zones (2014-00678).
• Verify that proposed innovations and technologies will operate as advertised (2014-00685). • Plan to recalibrate traffic sensors near work zones to accommodate lane shifts and other
changes during construction (2014-00682). • Allow for sufficient start-up time when deploying an ITS application. Unanticipated issues
may arise that will take time to address (2005-00061). • Follow accepted guidelines to create concise, effective DMS messages to notify motorists
of slow traffic and queuing ahead (2007-00336). • Conduct outreach and permit drivers to become comfortable with new work zones by
allowing an adjustment period (2005-00041).
11.5 Case Study - SafeTrip 21 Initiative Through the SafeTrip-21 initiative, federal and state agencies collaborated to test and evaluate a variety of technologies designed to reduce congestion, improve efficiency, and enhance safety on the nation’s roadways. Findings from two case studies that evaluated work zone applications are highlighted below.
I-95 Corridor Coalition Test Bed, Final Evaluation Report: North Carolina Deployment of Portable Traffic-Monitoring Devices
The North Carolina DOT tested the use of portable traffic-monitoring devices (PTMDs) and the U.S. DOT conducted interviews with agency staff to evaluate their experience (2013-00860). The following benefits were cited:
• Accurate speed counts. PTMDs resembled traditional work zone drums to mitigate data skewing that can occur when traffic-monitoring devices are more visible to drivers. The data reported were confirmed on-site.
• Ease of installation and operation. Devices were battery powered, equipped with wireless communications, and designed to easily replace traditional work zone drums. Data were accessible using a web-based interface.
• Data warehousing capability. In addition to providing real-time data, the web-based system was designed to archive data for up to five years, giving NCDOT staff the flexibility to analyze historical data.
• Safety benefits. PTMDs allowed personnel to collect traffic volume data without requiring them to work in the travel lane, reducing the potential for injuries.
• Staff Productivity. Staff could monitor sites remotely and limit site visits, saving staff time.
Experience with Prototype Testing on San Francisco Freeways
In San Francisco, recent studies suggest that vehicle-infrastructure (V2I) applications can further improve benefits achieved through work zone ITS. A field study of 24 vehicles equipped with in-vehicle traveler information systems designed to provide auditory alerts of “slow traffic ahead” effectively
11 Roadway Operations and Maintenance
U.S. Department of Transportation Intelligent Transportation System Joint Program Office
ITS Benefits, Costs, and Lessons Learned: 2017 Update Report – Final | 89
smoothed the driving profiles of drivers approaching end-of-queue traffic on a congested freeway (2013-00823). These data agree with previous research in Minneapolis where portable traffic management systems were found to reduce speed variability by 70 percent and slow speeds of approaching vehicles by 9 mph (2007-00411). Considering evidence that suggests an 8.4 percent increase in crash risk for each 1 mph increase in the standard deviation in speed, variable speed limit (VSL) systems that produce smoother driving profiles may have significant safety benefits [1]. The information provided to drivers, however, must be accurate, reliable, and delivered at the right time. Studies show that when drivers are directed to change speeds at 2-minute intervals, crash potential increases; however, when recommendations are made at 5- or 10-minute intervals, crash potential is reduced [2].
Joint Program Office U.S. Department of Transportation, Research and Innovative Technology Administration
ITS Benefits, Costs, and Lessons Learned: Update Report - Final | 90
12 Crash Prevention and Safety
12.1 Introduction A major goal of the ITS program is to improve safety and reduce risk for road users including pedestrians, cyclists, operators, and occupants of all vehicles who travel along our roadways. After many years of declining motor vehicle crashes and fatalities on the Nation’s roadways, 2012 showed a 4 percent increase in fatalities. Since then, there been slight decreases in fatalities, although the number of fatalities per hundred million vehicle miles of travel (VMT) has stayed relatively constant. A statistical projection of traffic fatalities for the first 9 months of 2016 shows an estimated 27,875 people died in motor vehicle traffic crashes. This represents an increase of about 8% as compared to the 25,808 fatalities that were reported to have occurred in the first 9 months of 2015. [1]
Crash prevention and safety systems detect unsafe conditions and provide warnings to travelers to take action to avoid crashes. These systems provide alerts for traffic approaching dangerous curves, off ramps, restricted overpasses, highway-rail crossings, high-volume intersections, work zones, adverse weather conditions, and also provide warnings of the presence of pedestrians, bicyclists, and even animals on the roadway. Crash prevention and safety systems typically employ sensors to monitor the speed and characteristics of approaching vehicles and frequently also include environmental sensors to monitor roadway conditions and visibility. These systems may be either permanent or temporary. Some systems provide a general warning of the recommended speed for prevailing roadway conditions. Other systems provide a specific warning by taking into account the particular vehicles characteristics (truck or car) and a calculation of the recommended speed for the particular vehicle based on conditions. In some cases, manual systems are employed, where pedestrians or bicyclists manually set the system to provide warnings of their presence to travelers; however these systems are being replaced with automated systems with the increasing implementation of connected vehicle technologies. With the introduction of connected vehicle safety applications, crash prevention and safety systems are also moving from passive driver warning systems, to active driver assistance systems where the vehicle can automatically react to other vehicles or road sensors during hazardous conditions.
Intersection Collision Warning Systems: Intersection collision warning systems use sensors to monitor traffic approaching dangerous intersections and warn vehicles of approaching cross traffic, using roadside infrastructure, in-vehicle systems, or some combination of the two. The newer approaches to intersection collision warning systems provide information to drivers on proper maneuvers (gap acceptance assistance) and warn drivers of right-of-way violations at intersections. The warnings may include the driver’s vehicle violating traffic control signs or signals or of another vehicle violating, or about to violate, the subject vehicle’s right-of-way. Specific examples are provided below:
• Left Turn Assist: Warnings given to driver via an in-vehicle system when trying to make aleft turn that may be visually blocked by another car or object. Warnings can alert the driverthat a left turn should not be attempted.
• Traffic Control Violation Warning: Warnings given to drivers via in-vehicle systems if itis determined the driver may violate a red light or other traffic control device.
12 Crash Prevention and Safety
U.S. Department of Transportation Intelligent Transportation System Joint Program Office
ITS Benefits, Costs, and Lessons Learned: 2017 Update Report – Final | 91
• Stop Sign Gap Assist: Information provided to drivers while stopped at a stop sign where only the minor road has stop signs. The driver receives information of any danger to the vehicle proceeding through the intersection from vehicles approaching on the cross street.
Collision Avoidance Systems: To improve the ability of drivers to avoid accidents, vehicle-mounted collision warning systems (CWS) continue to be tested and deployed. These applications use a variety of sensors to monitor the vehicles surroundings and alert the driver of conditions that could lead to a collision. Examples include forward collision warning, obstacle detection systems, rear impact collision warning, “do not pass” warnings, and road departure warning systems.
Collision Notification: In an effort to improve response times and save lives, collision notification systems have been designed to detect and report the location and severity of incidents to agencies and services responsible for coordinating appropriate emergency response actions. These systems can be activated manually (Mayday), or automatically with automatic collision notification (ACN), and advanced systems may transmit information on the type of crash, number of passengers, and the likelihood of injuries.
12.2 Benefits Crash Prevention and Safety strategies include collision avoidance systems and systems that warn drivers of potential road hazards. These systems have demonstrated success in detecting potential conflicts and warning motorists of crash potential. Evaluations of these systems find reduction in road crashes, injuries and fatalities as summarized in Table 12-1.
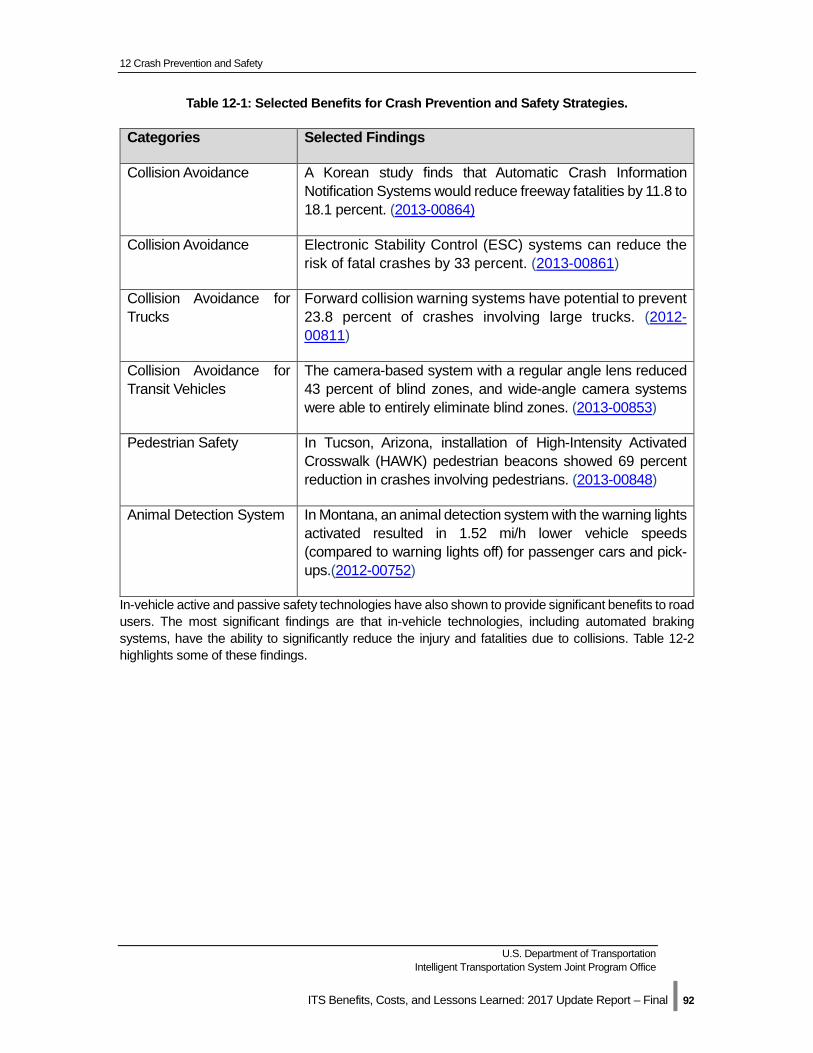
12 Crash Prevention and Safety
U.S. Department of Transportation Intelligent Transportation System Joint Program Office
ITS Benefits, Costs, and Lessons Learned: 2017 Update Report – Final | 92
Table 12-1: Selected Benefits for Crash Prevention and Safety Strategies.
Categories Selected Findings
Collision Avoidance A Korean study finds that Automatic Crash Information Notification Systems would reduce freeway fatalities by 11.8 to 18.1 percent. (2013-00864)
Collision Avoidance Electronic Stability Control (ESC) systems can reduce the risk of fatal crashes by 33 percent. (2013-00861)
Collision Avoidance for Trucks
Forward collision warning systems have potential to prevent 23.8 percent of crashes involving large trucks. (2012-00811)
Collision Avoidance for Transit Vehicles
The camera-based system with a regular angle lens reduced 43 percent of blind zones, and wide-angle camera systems were able to entirely eliminate blind zones. (2013-00853)
Pedestrian Safety In Tucson, Arizona, installation of High-Intensity Activated Crosswalk (HAWK) pedestrian beacons showed 69 percent reduction in crashes involving pedestrians. (2013-00848)
Animal Detection System In Montana, an animal detection system with the warning lights activated resulted in 1.52 mi/h lower vehicle speeds (compared to warning lights off) for passenger cars and pick-ups.(2012-00752)
In-vehicle active and passive safety technologies have also shown to provide significant benefits to road users. The most significant findings are that in-vehicle technologies, including automated braking systems, have the ability to significantly reduce the injury and fatalities due to collisions. Table 12-2 highlights some of these findings.
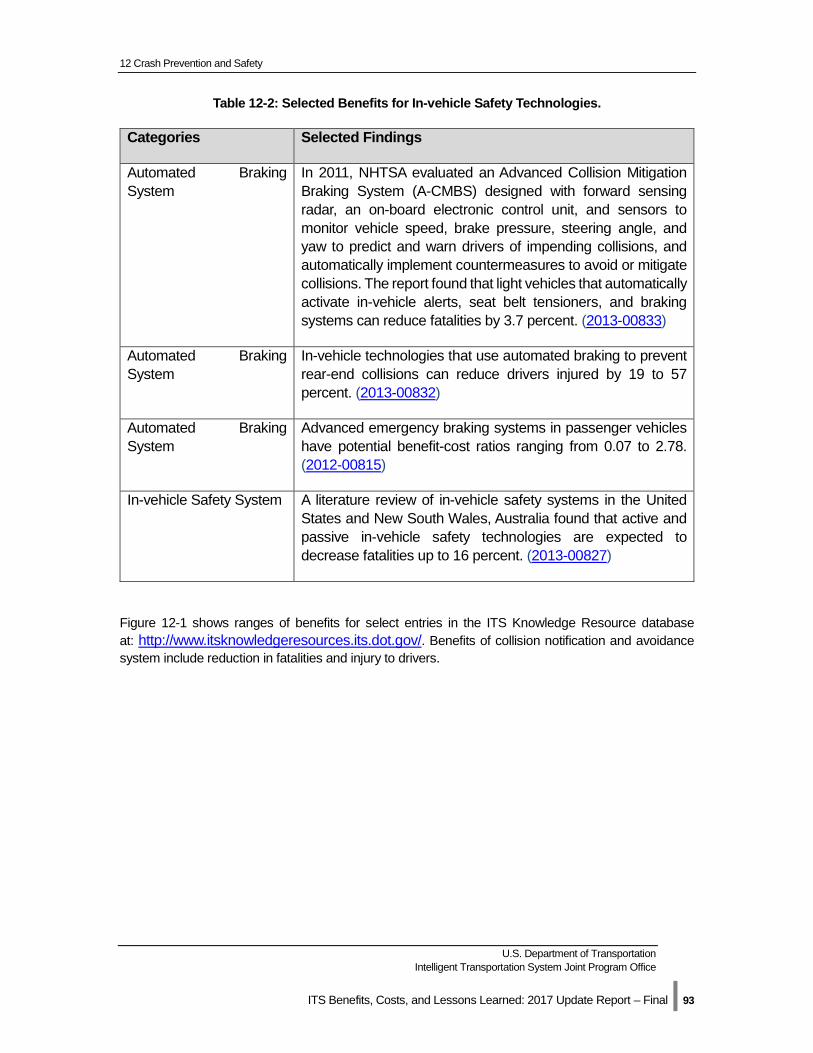
12 Crash Prevention and Safety
U.S. Department of Transportation Intelligent Transportation System Joint Program Office
ITS Benefits, Costs, and Lessons Learned: 2017 Update Report – Final | 93
Table 12-2: Selected Benefits for In-vehicle Safety Technologies.
Categories Selected Findings
Automated Braking System
In 2011, NHTSA evaluated an Advanced Collision Mitigation Braking System (A-CMBS) designed with forward sensing radar, an on-board electronic control unit, and sensors to monitor vehicle speed, brake pressure, steering angle, and yaw to predict and warn drivers of impending collisions, and automatically implement countermeasures to avoid or mitigate collisions. The report found that light vehicles that automatically activate in-vehicle alerts, seat belt tensioners, and braking systems can reduce fatalities by 3.7 percent. (2013-00833)
Automated Braking System
In-vehicle technologies that use automated braking to prevent rear-end collisions can reduce drivers injured by 19 to 57 percent. (2013-00832)
Automated Braking System
Advanced emergency braking systems in passenger vehicles have potential benefit-cost ratios ranging from 0.07 to 2.78. (2012-00815)
In-vehicle Safety System A literature review of in-vehicle safety systems in the United States and New South Wales, Australia found that active and passive in-vehicle safety technologies are expected to decrease fatalities up to 16 percent. (2013-00827)
Figure 12-1 shows ranges of benefits for select entries in the ITS Knowledge Resource database at: http://www.itsknowledgeresources.its.dot.gov/. Benefits of collision notification and avoidance system include reduction in fatalities and injury to drivers.
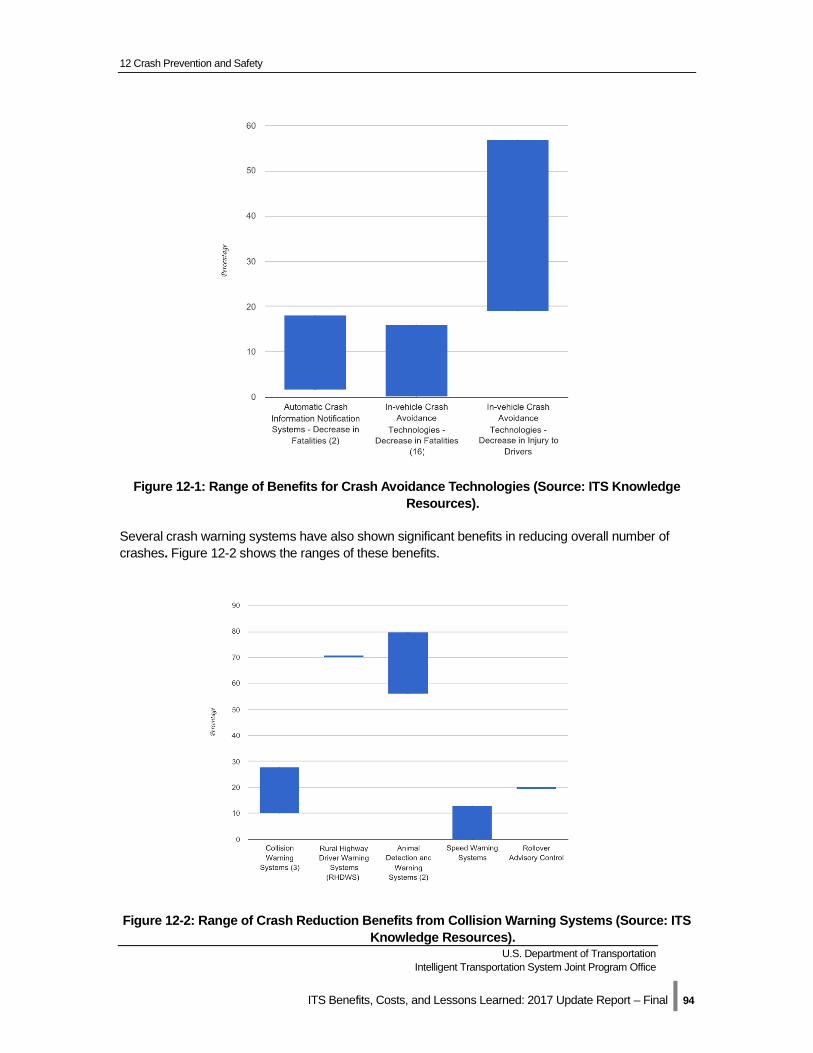
12 Crash Prevention and Safety
U.S. Department of Transportation Intelligent Transportation System Joint Program Office
ITS Benefits, Costs, and Lessons Learned: 2017 Update Report – Final | 94
Figure 12-1: Range of Benefits for Crash Avoidance Technologies (Source: ITS Knowledge Resources).
Several crash warning systems have also shown significant benefits in reducing overall number of crashes. Figure 12-2 shows the ranges of these benefits.
Figure 12-2: Range of Crash Reduction Benefits from Collision Warning Systems (Source: ITS Knowledge Resources).
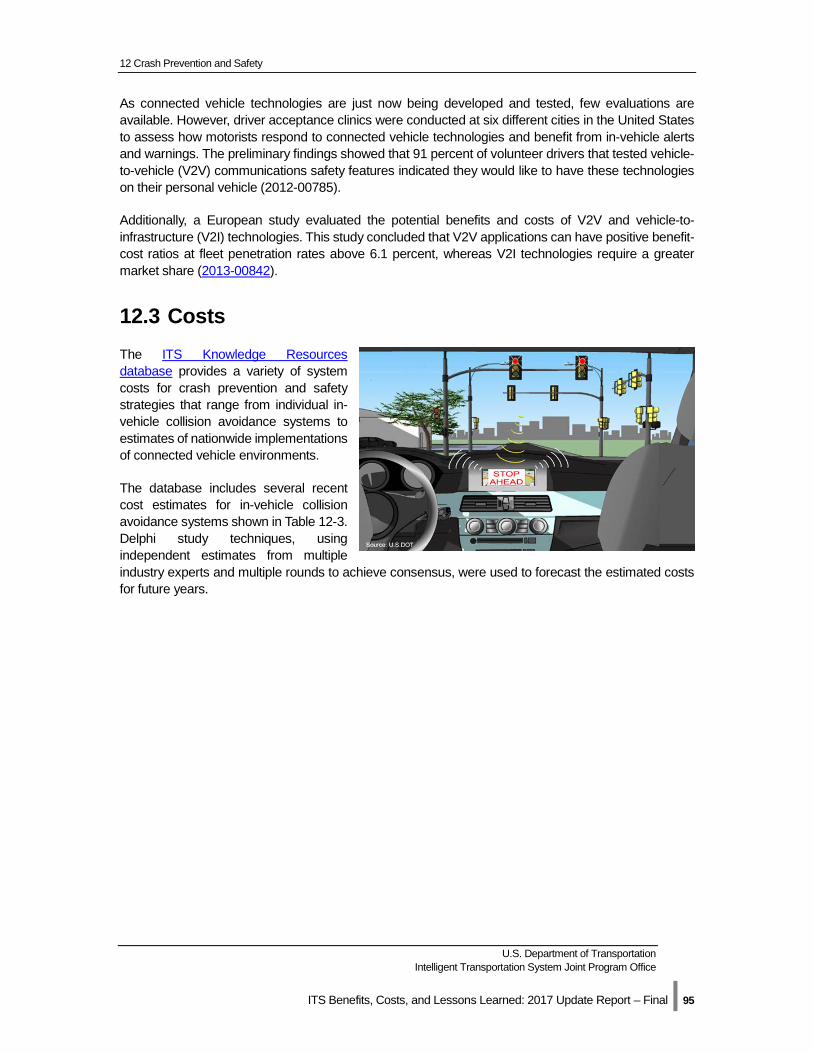
12 Crash Prevention and Safety
U.S. Department of Transportation Intelligent Transportation System Joint Program Office
ITS Benefits, Costs, and Lessons Learned: 2017 Update Report – Final | 95
As connected vehicle technologies are just now being developed and tested, few evaluations are available. However, driver acceptance clinics were conducted at six different cities in the United States to assess how motorists respond to connected vehicle technologies and benefit from in-vehicle alerts and warnings. The preliminary findings showed that 91 percent of volunteer drivers that tested vehicle-to-vehicle (V2V) communications safety features indicated they would like to have these technologies on their personal vehicle (2012-00785).
Additionally, a European study evaluated the potential benefits and costs of V2V and vehicle-to-infrastructure (V2I) technologies. This study concluded that V2V applications can have positive benefit-cost ratios at fleet penetration rates above 6.1 percent, whereas V2I technologies require a greater market share (2013-00842).
12.3 Costs The ITS Knowledge Resources database provides a variety of system costs for crash prevention and safety strategies that range from individual in-vehicle collision avoidance systems to estimates of nationwide implementations of connected vehicle environments.
The database includes several recent cost estimates for in-vehicle collision avoidance systems shown in Table 12-3. Delphi study techniques, using independent estimates from multiple industry experts and multiple rounds to achieve consensus, were used to forecast the estimated costs for future years.
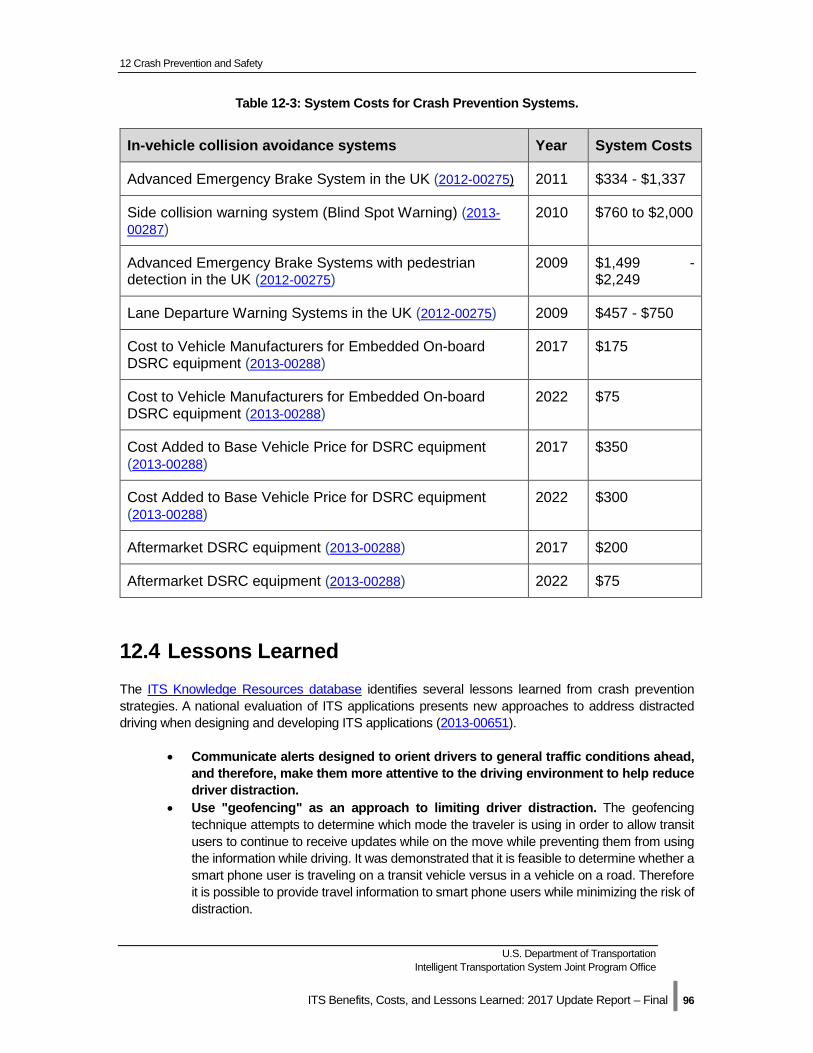
12 Crash Prevention and Safety
U.S. Department of Transportation Intelligent Transportation System Joint Program Office
ITS Benefits, Costs, and Lessons Learned: 2017 Update Report – Final | 96
Table 12-3: System Costs for Crash Prevention Systems.
In-vehicle collision avoidance systems Year System Costs
Advanced Emergency Brake System in the UK (2012-00275) 2011 $334 - $1,337
Side collision warning system (Blind Spot Warning) (2013-00287)
2010 $760 to $2,000
Advanced Emergency Brake Systems with pedestrian detection in the UK (2012-00275)
2009 $1,499 - $2,249
Lane Departure Warning Systems in the UK (2012-00275) 2009 $457 - $750
Cost to Vehicle Manufacturers for Embedded On-board DSRC equipment (2013-00288)
2017 $175
Cost to Vehicle Manufacturers for Embedded On-board DSRC equipment (2013-00288)
2022 $75
Cost Added to Base Vehicle Price for DSRC equipment (2013-00288)
2017 $350
Cost Added to Base Vehicle Price for DSRC equipment (2013-00288)
2022 $300
Aftermarket DSRC equipment (2013-00288) 2017 $200
Aftermarket DSRC equipment (2013-00288) 2022 $75
12.4 Lessons Learned The ITS Knowledge Resources database identifies several lessons learned from crash prevention strategies. A national evaluation of ITS applications presents new approaches to address distracted driving when designing and developing ITS applications (2013-00651).
• Communicate alerts designed to orient drivers to general traffic conditions ahead, and therefore, make them more attentive to the driving environment to help reduce driver distraction.
• Use "geofencing" as an approach to limiting driver distraction. The geofencing technique attempts to determine which mode the traveler is using in order to allow transit users to continue to receive updates while on the move while preventing them from using the information while driving. It was demonstrated that it is feasible to determine whether a smart phone user is traveling on a transit vehicle versus in a vehicle on a road. Therefore it is possible to provide travel information to smart phone users while minimizing the risk of distraction.
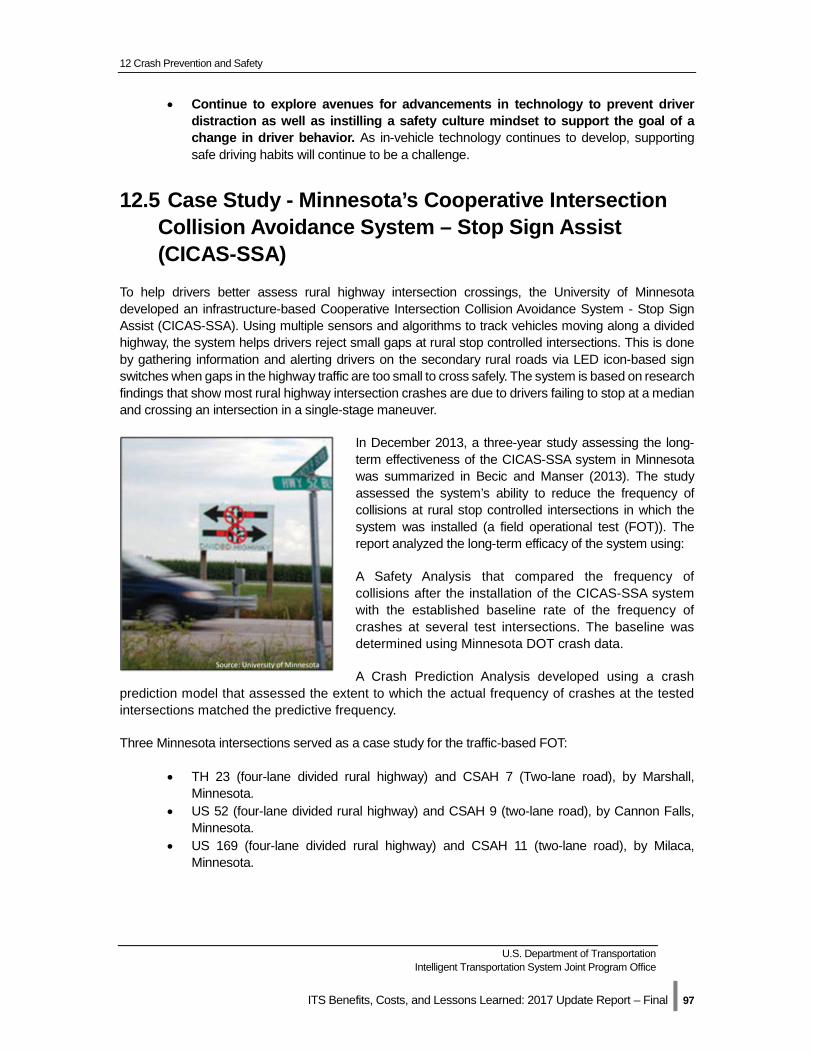
12 Crash Prevention and Safety
U.S. Department of Transportation Intelligent Transportation System Joint Program Office
ITS Benefits, Costs, and Lessons Learned: 2017 Update Report – Final | 97
• Continue to explore avenues for advancements in technology to prevent driver distraction as well as instilling a safety culture mindset to support the goal of a change in driver behavior. As in-vehicle technology continues to develop, supporting safe driving habits will continue to be a challenge.
12.5 Case Study - Minnesota’s Cooperative Intersection Collision Avoidance System – Stop Sign Assist (CICAS-SSA)
To help drivers better assess rural highway intersection crossings, the University of Minnesota developed an infrastructure-based Cooperative Intersection Collision Avoidance System - Stop Sign Assist (CICAS-SSA). Using multiple sensors and algorithms to track vehicles moving along a divided highway, the system helps drivers reject small gaps at rural stop controlled intersections. This is done by gathering information and alerting drivers on the secondary rural roads via LED icon-based sign switches when gaps in the highway traffic are too small to cross safely. The system is based on research findings that show most rural highway intersection crashes are due to drivers failing to stop at a median and crossing an intersection in a single-stage maneuver.
In December 2013, a three-year study assessing the long-term effectiveness of the CICAS-SSA system in Minnesota was summarized in Becic and Manser (2013). The study assessed the system’s ability to reduce the frequency of collisions at rural stop controlled intersections in which the system was installed (a field operational test (FOT)). The report analyzed the long-term efficacy of the system using:
A Safety Analysis that compared the frequency of collisions after the installation of the CICAS-SSA system with the established baseline rate of the frequency of crashes at several test intersections. The baseline was determined using Minnesota DOT crash data.
A Crash Prediction Analysis developed using a crash prediction model that assessed the extent to which the actual frequency of crashes at the tested intersections matched the predictive frequency.
Three Minnesota intersections served as a case study for the traffic-based FOT:
• TH 23 (four-lane divided rural highway) and CSAH 7 (Two-lane road), by Marshall, Minnesota.
• US 52 (four-lane divided rural highway) and CSAH 9 (two-lane road), by Cannon Falls, Minnesota.
• US 169 (four-lane divided rural highway) and CSAH 11 (two-lane road), by Milaca, Minnesota.
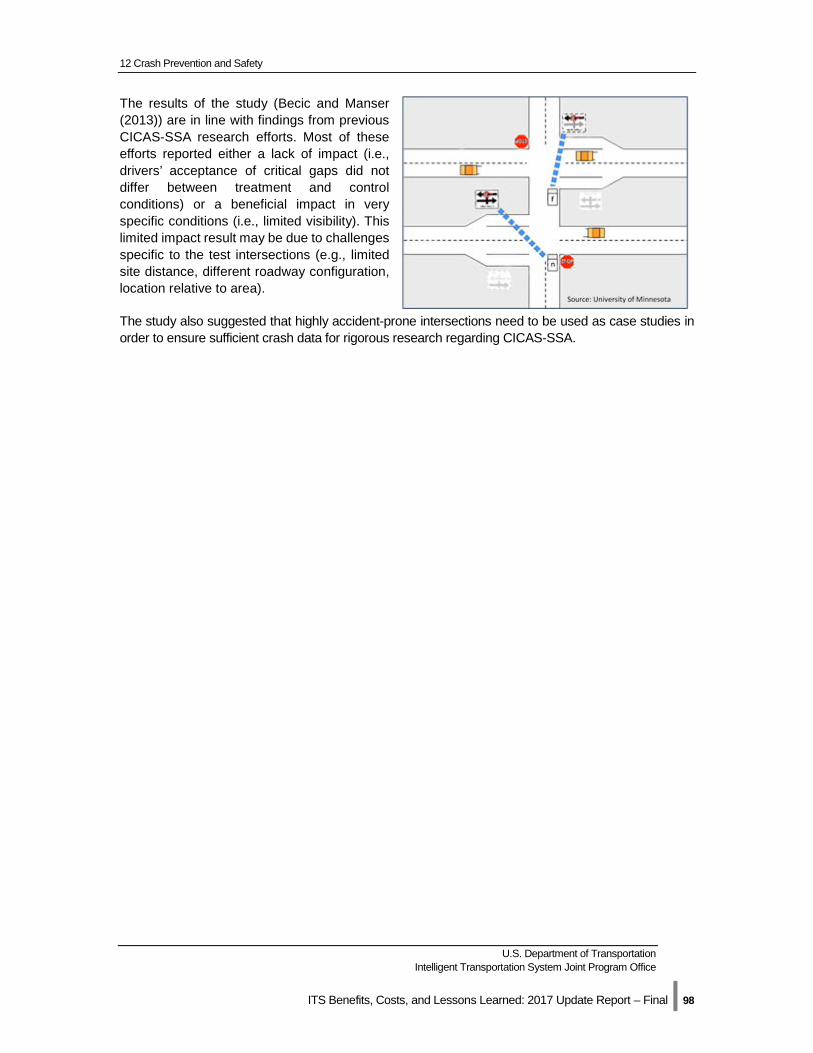
12 Crash Prevention and Safety
U.S. Department of Transportation Intelligent Transportation System Joint Program Office
ITS Benefits, Costs, and Lessons Learned: 2017 Update Report – Final | 98
The results of the study (Becic and Manser (2013)) are in line with findings from previous CICAS-SSA research efforts. Most of these efforts reported either a lack of impact (i.e., drivers’ acceptance of critical gaps did not differ between treatment and control conditions) or a beneficial impact in very specific conditions (i.e., limited visibility). This limited impact result may be due to challenges specific to the test intersections (e.g., limited site distance, different roadway configuration, location relative to area).
The study also suggested that highly accident-prone intersections need to be used as case studies in order to ensure sufficient crash data for rigorous research regarding CICAS-SSA.
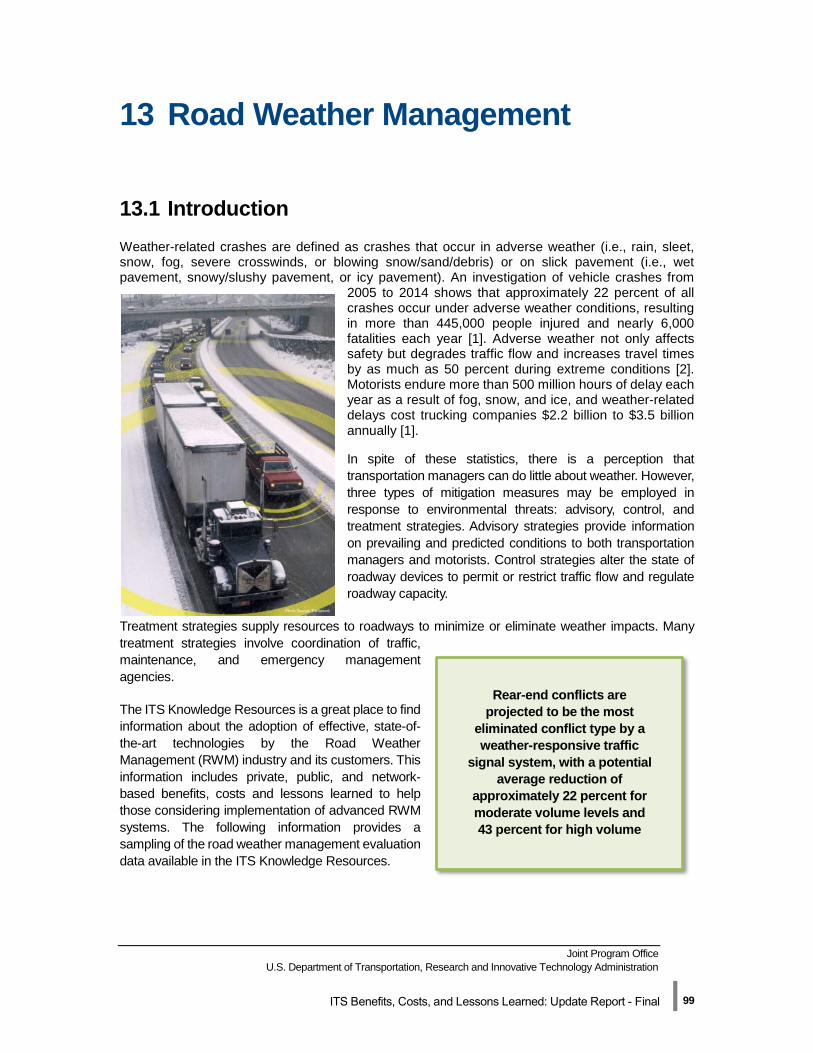
Joint Program Office U.S. Department of Transportation, Research and Innovative Technology Administration
ITS Benefits, Costs, and Lessons Learned: Update Report - Final | 99
13 Road Weather Management
13.1 Introduction Weather-related crashes are defined as crashes that occur in adverse weather (i.e., rain, sleet, snow, fog, severe crosswinds, or blowing snow/sand/debris) or on slick pavement (i.e., wet pavement, snowy/slushy pavement, or icy pavement). An investigation of vehicle crashes from
2005 to 2014 shows that approximately 22 percent of all crashes occur under adverse weather conditions, resulting in more than 445,000 people injured and nearly 6,000 fatalities each year [1]. Adverse weather not only affects safety but degrades traffic flow and increases travel times by as much as 50 percent during extreme conditions [2]. Motorists endure more than 500 million hours of delay each year as a result of fog, snow, and ice, and weather-related delays cost trucking companies $2.2 billion to $3.5 billion annually [1].
In spite of these statistics, there is a perception that transportation managers can do little about weather. However, three types of mitigation measures may be employed in response to environmental threats: advisory, control, and treatment strategies. Advisory strategies provide information on prevailing and predicted conditions to both transportation managers and motorists. Control strategies alter the state of roadway devices to permit or restrict traffic flow and regulate roadway capacity.
Treatment strategies supply resources to roadways to minimize or eliminate weather impacts. Many treatment strategies involve coordination of traffic, maintenance, and emergency management agencies.
The ITS Knowledge Resources is a great place to find information about the adoption of effective, state-of-the-art technologies by the Road Weather Management (RWM) industry and its customers. This information includes private, public, and network-based benefits, costs and lessons learned to help those considering implementation of advanced RWM systems. The following information provides a sampling of the road weather management evaluation data available in the ITS Knowledge Resources.
Rear-end conflicts are projected to be the most
eliminated conflict type by a weather-responsive traffic
signal system, with a potential average reduction of
approximately 22 percent for moderate volume levels and 43 percent for high volume
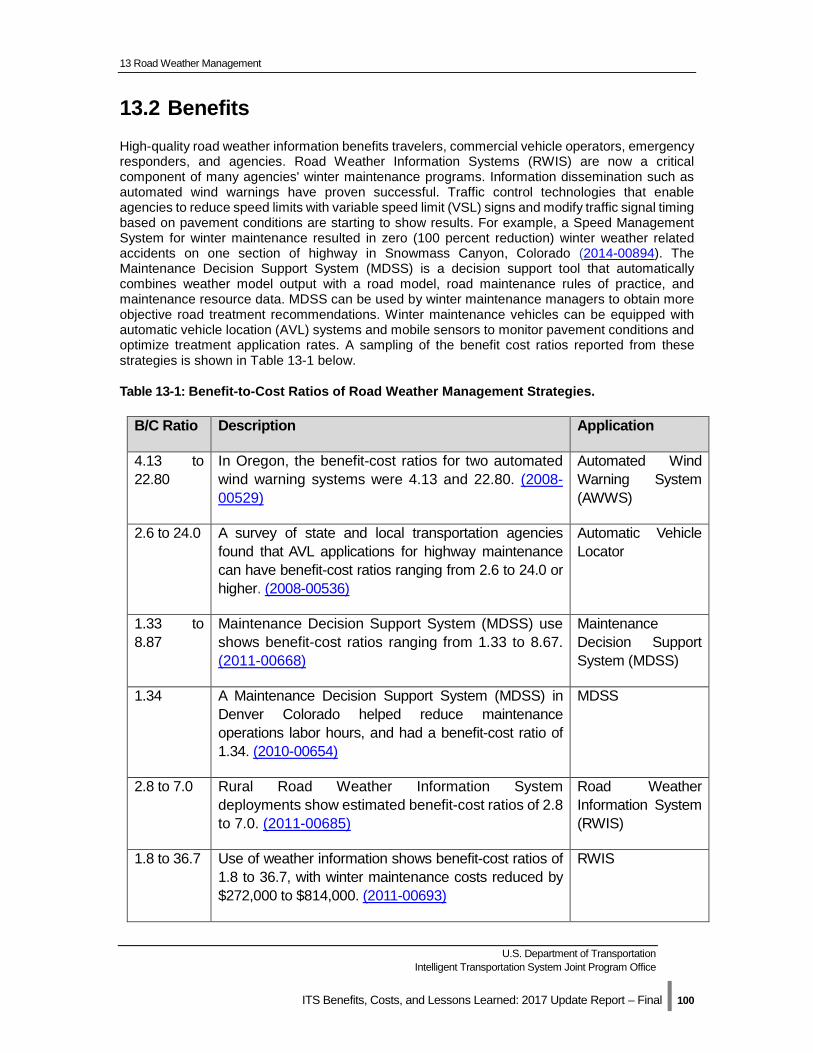
13 Road Weather Management
U.S. Department of Transportation Intelligent Transportation System Joint Program Office
ITS Benefits, Costs, and Lessons Learned: 2017 Update Report – Final | 100
13.2 Benefits High-quality road weather information benefits travelers, commercial vehicle operators, emergency responders, and agencies. Road Weather Information Systems (RWIS) are now a critical component of many agencies' winter maintenance programs. Information dissemination such as automated wind warnings have proven successful. Traffic control technologies that enable agencies to reduce speed limits with variable speed limit (VSL) signs and modify traffic signal timing based on pavement conditions are starting to show results. For example, a Speed Management System for winter maintenance resulted in zero (100 percent reduction) winter weather related accidents on one section of highway in Snowmass Canyon, Colorado (2014-00894). The Maintenance Decision Support System (MDSS) is a decision support tool that automatically combines weather model output with a road model, road maintenance rules of practice, and maintenance resource data. MDSS can be used by winter maintenance managers to obtain more objective road treatment recommendations. Winter maintenance vehicles can be equipped with automatic vehicle location (AVL) systems and mobile sensors to monitor pavement conditions and optimize treatment application rates. A sampling of the benefit cost ratios reported from these strategies is shown in Table 13-1 below.
Table 13-1: Benefit-to-Cost Ratios of Road Weather Management Strategies.
B/C Ratio Description Application
4.13 to 22.80
In Oregon, the benefit-cost ratios for two automated wind warning systems were 4.13 and 22.80. (2008-00529)
Automated Wind Warning System (AWWS)
2.6 to 24.0 A survey of state and local transportation agencies found that AVL applications for highway maintenance can have benefit-cost ratios ranging from 2.6 to 24.0 or higher. (2008-00536)
Automatic Vehicle Locator
1.33 to 8.87
Maintenance Decision Support System (MDSS) use shows benefit-cost ratios ranging from 1.33 to 8.67. (2011-00668)
Maintenance Decision Support System (MDSS)
1.34 A Maintenance Decision Support System (MDSS) in Denver Colorado helped reduce maintenance operations labor hours, and had a benefit-cost ratio of 1.34. (2010-00654)
MDSS
2.8 to 7.0 Rural Road Weather Information System deployments show estimated benefit-cost ratios of 2.8 to 7.0. (2011-00685)
Road Weather Information System (RWIS)
1.8 to 36.7 Use of weather information shows benefit-cost ratios of 1.8 to 36.7, with winter maintenance costs reduced by $272,000 to $814,000. (2011-00693)
RWIS
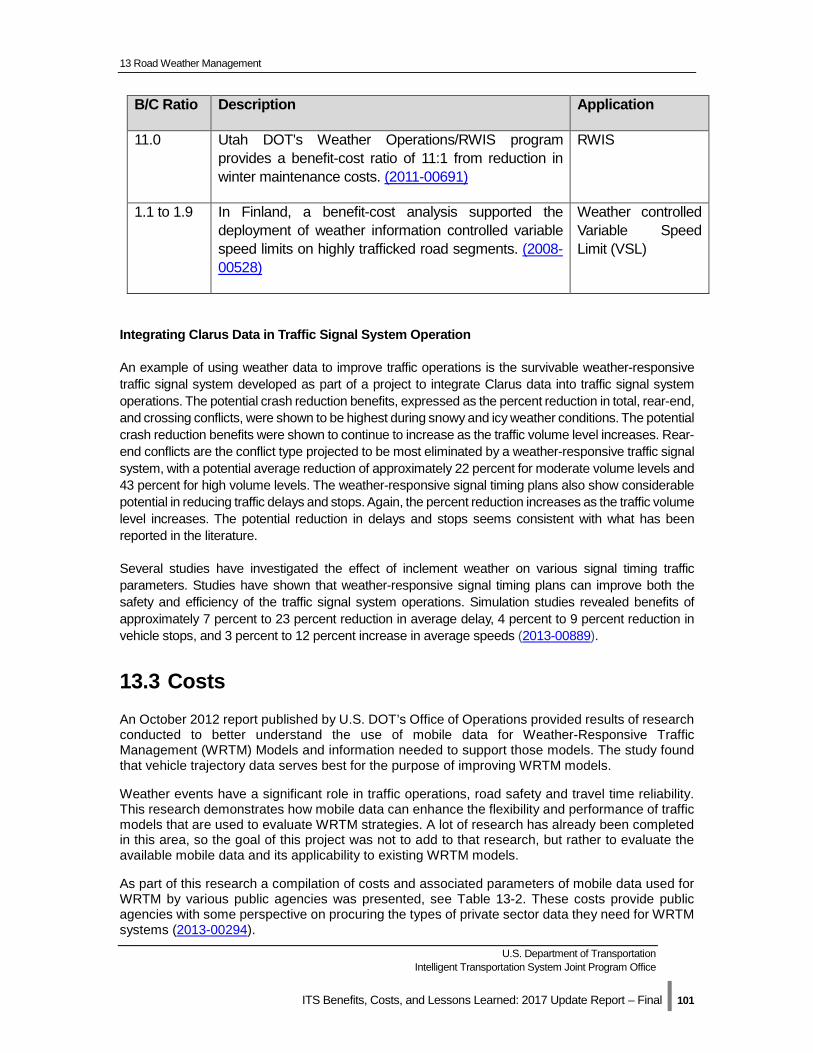
13 Road Weather Management
U.S. Department of Transportation Intelligent Transportation System Joint Program Office
ITS Benefits, Costs, and Lessons Learned: 2017 Update Report – Final | 101
B/C Ratio Description Application
11.0 Utah DOT's Weather Operations/RWIS program provides a benefit-cost ratio of 11:1 from reduction in winter maintenance costs. (2011-00691)
RWIS
1.1 to 1.9 In Finland, a benefit-cost analysis supported the deployment of weather information controlled variable speed limits on highly trafficked road segments. (2008-00528)
Weather controlled Variable Speed Limit (VSL)
Integrating Clarus Data in Traffic Signal System Operation
An example of using weather data to improve traffic operations is the survivable weather-responsive traffic signal system developed as part of a project to integrate Clarus data into traffic signal system operations. The potential crash reduction benefits, expressed as the percent reduction in total, rear-end, and crossing conflicts, were shown to be highest during snowy and icy weather conditions. The potential crash reduction benefits were shown to continue to increase as the traffic volume level increases. Rear-end conflicts are the conflict type projected to be most eliminated by a weather-responsive traffic signal system, with a potential average reduction of approximately 22 percent for moderate volume levels and 43 percent for high volume levels. The weather-responsive signal timing plans also show considerable potential in reducing traffic delays and stops. Again, the percent reduction increases as the traffic volume level increases. The potential reduction in delays and stops seems consistent with what has been reported in the literature.
Several studies have investigated the effect of inclement weather on various signal timing traffic parameters. Studies have shown that weather-responsive signal timing plans can improve both the safety and efficiency of the traffic signal system operations. Simulation studies revealed benefits of approximately 7 percent to 23 percent reduction in average delay, 4 percent to 9 percent reduction in vehicle stops, and 3 percent to 12 percent increase in average speeds (2013-00889).
13.3 Costs An October 2012 report published by U.S. DOT’s Office of Operations provided results of research conducted to better understand the use of mobile data for Weather-Responsive Traffic Management (WRTM) Models and information needed to support those models. The study found that vehicle trajectory data serves best for the purpose of improving WRTM models.
Weather events have a significant role in traffic operations, road safety and travel time reliability. This research demonstrates how mobile data can enhance the flexibility and performance of traffic models that are used to evaluate WRTM strategies. A lot of research has already been completed in this area, so the goal of this project was not to add to that research, but rather to evaluate the available mobile data and its applicability to existing WRTM models.
As part of this research a compilation of costs and associated parameters of mobile data used for WRTM by various public agencies was presented, see Table 13-2. These costs provide public agencies with some perspective on procuring the types of private sector data they need for WRTM systems (2013-00294).
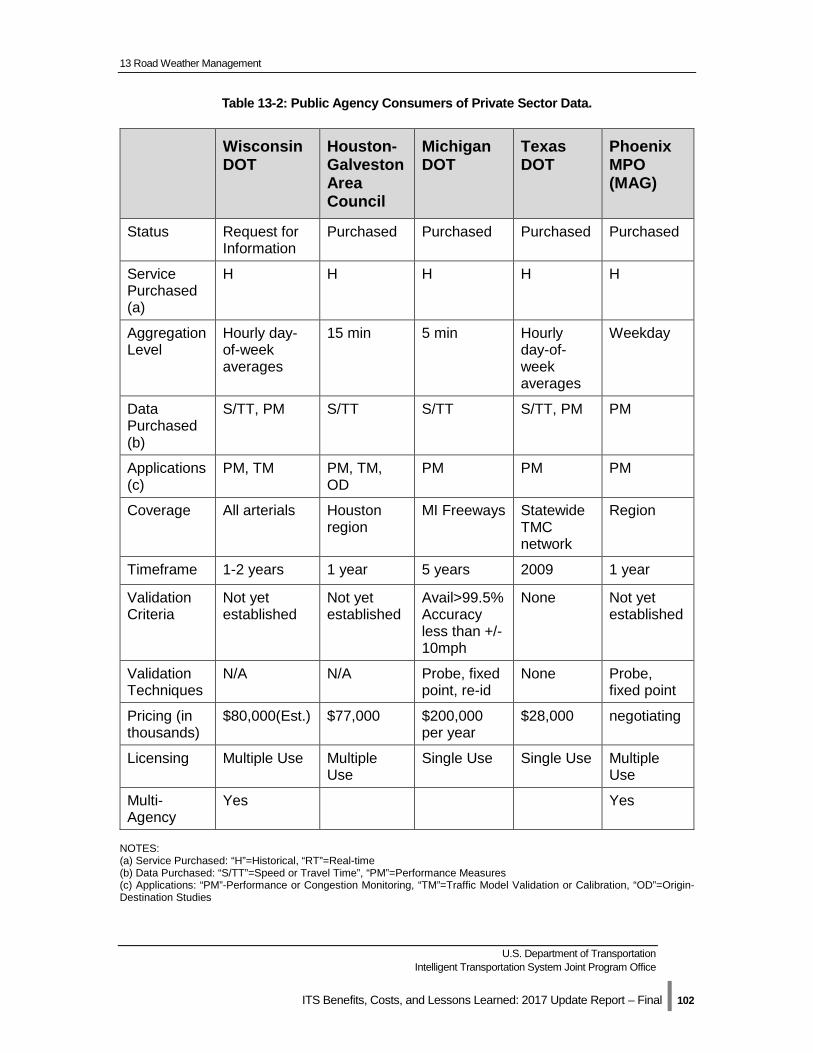
13 Road Weather Management
U.S. Department of Transportation Intelligent Transportation System Joint Program Office
ITS Benefits, Costs, and Lessons Learned: 2017 Update Report – Final | 102
Table 13-2: Public Agency Consumers of Private Sector Data.
Wisconsin DOT
Houston-Galveston Area Council
Michigan DOT
Texas DOT
Phoenix MPO (MAG)
Status Request for Information
Purchased Purchased Purchased Purchased
Service Purchased (a)
H H H H H
Aggregation Level
Hourly day-of-week averages
15 min 5 min Hourly day-of-week averages
Weekday
Data Purchased (b)
S/TT, PM S/TT S/TT S/TT, PM PM
Applications (c)
PM, TM PM, TM, OD
PM PM PM
Coverage All arterials Houston region
MI Freeways Statewide TMC network
Region
Timeframe 1-2 years 1 year 5 years 2009 1 year
Validation Criteria
Not yet established
Not yet established
Avail>99.5% Accuracy less than +/- 10mph
None Not yet established
Validation Techniques
N/A N/A Probe, fixed point, re-id
None Probe, fixed point
Pricing (in thousands)
$80,000(Est.) $77,000 $200,000 per year
$28,000 negotiating
Licensing Multiple Use Multiple Use
Single Use Single Use Multiple Use
Multi-Agency
Yes Yes
NOTES: (a) Service Purchased: “H”=Historical, “RT”=Real-time (b) Data Purchased: “S/TT”=Speed or Travel Time”, “PM”=Performance Measures (c) Applications: “PM”-Performance or Congestion Monitoring, “TM”=Traffic Model Validation or Calibration, “OD”=Origin-Destination Studies
13 Road Weather Management
U.S. Department of Transportation Intelligent Transportation System Joint Program Office
ITS Benefits, Costs, and Lessons Learned: 2017 Update Report – Final | 103
13.4 Lessons Learned The U.S. DOT FHWA partnered with the Wyoming DOT (WYDOT) to develop a Weather Responsive Traffic Management (WRTM) application to improve the way WYDOT maintenance personnel report road weather data, recommend variable speed limit (VSL) changes, and report traffic incidents. The new application designed to work with tablet computers enabled maintenance staff to connect to Wyoming’s statewide communication system backbone called WyoLink.
The initial implementation was evaluated from January through May 2015 to assess the effectiveness of the application installed on 20 tablets used by plow truck drivers and other staff operating on I-80 and I-25. The evaluation included quantitative and qualitative analysis including a “with-without” methodology. The methodology compared activities using the new application versus the traditional/standard method of using the radio for reporting. Quantitative analysis focused on time spent receiving, logging, and processing reports and actions between the two methods. Qualitative analysis focused on two surveys – one completed by TMC operators and the other by maintenance employees. The survey focused on perceptions, ease of use, overall impressions, and the benefits and shortcoming of the technology.
Key lessons learned are highlighted below.
• Fully define requirements for positional information. Positional information is very important for maintenance employees (particularly in a blinding snowstorm). A local SQL Lite database with positional data may be required if a GIS application program interface is too slow to support near real-time road condition reporting applications.
• Test communication systems early. Using the data channel of the WyoLink radio network proved to be more difficult than anticipated. Bugs in communications software not realized prior to the release of the application delayed the project by months.
• Plan for extensive outreach and training. Significant effort should be invested to inform the TMC operators and maintenance staff about the new system.
Although the deployment was technically complex and required intense management attention, the application improved the effectiveness and efficiency of WYDOT road condition reporting activities and TMC operations (2017-00759).
13.5 Case Study - An evaluation of Weather Responsive Traffic Management (WRTM) strategies in Ogden, Utah
The Utah DOT (UDOT) developed and tested an advanced weather-responsive traffic signal management system on a busy corridor between I-84 and US-89 in Ogden, Utah. The system, known as Wx-SIG, used road weather information, meteorological forecasts, and traffic data from UDOT’s traffic signal monitoring system to allow traffic signal operators to anticipate developing roadway and visibility issues, and decide when different weather-responsive traffic signal timing plans should be implemented to respond to severe winter weather events. Once aware of the impending deterioration, the system enabled operators to deploy traffic signal timing plans that best matched prevailing travel conditions.
Controller-based high-resolution detector data were used to automatically generate performance metrics that TMC operators could use to assess the effectiveness of different traffic signal timing strategies and the need to change signal timing plans for future events. Data were collected from
13 Road Weather Management
U.S. Department of Transportation Intelligent Transportation System Joint Program Office
ITS Benefits, Costs, and Lessons Learned: 2017 Update Report – Final | 104
road weather monitoring stations and additional traffic sensors were installed upstream of intersection stop bars. Intersection approach volume data and link speed data were used by TMC operators to determine when to activate and deactivate signal timing plans and fine-tune timing parameters. A Traffic Estimation and Prediction System (TrEPS) tool was used to forecast future traffic conditions and serve as a decision support tool for UDOT operators.
In order to evaluate system impacts, traffic volume and speed data were collected with and without the Wx-SIG system. The TrEPS model was used to calculate impacts on travel time and delay, and interviews were conducted with USDOT and UDOT traffic operators and managers to assess overall effectiveness and perceived benefits from improved traffic operations.
Based on data collected during 13 severe winter weather events, WRTM strategies were found to improve corridor travel times by three percent and decrease vehicle stop times by 14.5 percent (2014-00927).
Joint Program Office U.S. Department of Transportation, Research and Innovative Technology Administration
ITS Benefits, Costs, and Lessons Learned: Update Report - Final | 105
14 Transit Management
14.1 Operations and Fleet Management
Introduction In 2014, Americans took 10.8 billion trips on public transportation, which is the highest annual public transit ridership number in 58 years [1]. Though riders may be drawn to a public transportation for many reasons, they remain loyal to systems that are reliable and efficient. Transit operations and fleet management systems can help improve service reliability; decrease running time; reduce bus delays at intersections, missed trips, and emissions; and allow for increased service without additional staff or vehicles.
The utilization of ITS for improving operations and fleet management in the transit industry has become widespread, with automated vehicle location (AVL), computer-aided dispatching (CAD), and transit signal priority (TSP) all now mature technologies. In 2015, 92 percent of fixed-route buses in the United States had AVL systems installed, an increase from just 59 percent in 2008 [2]. AVL data now provides the input into real-time traveler information systems and archived AVL data are inputs into the service planning and scheduling processes. The use of CAD and scheduling software have improved efficiency and reliability for both fixed-route and paratransit service. These tools have also improved the ability for transit agencies to coordinate their services. Transit Signal Priority (TSP) is also gaining in popularity as cities begin to recognize that improved bus service can encourage mode shift away from personal vehicles to transit, without large negative impacts to traffic traveling in the cross direction of bus routes with TSP.
Benefits A comprehensive TCRP report from 2010 on TSP provides a set of benefit ranges that may be experienced by an agency deploying TSP based on case studies from a few dozen cities. Transit travel time savings experienced were between 2 and 18 percent, with Los Angeles and Chicago seeing 7.5 and 15 percent decreases, respectively. Decrease in bus delay is heavily dependent on the priority guidelines set by the agencies, and thus has a wider range experienced by the cities examined for the report. Overall, agencies indicated that bus delay was reduced between 15 and 80 percent. Los Angeles had a 35 percent decrease in bus delay at intersections, while Oakland had a decrease of 5 seconds per intersection (2013-00847). Similar results in transit travel time savings were also experienced on Staten Island in New York, where signal priority along a 2.3 mile corridor led to 17 percent transit travel time savings (2013-00856). As part of a pilot test in Minneapolis, Minnesota, the University of Minnesota demonstrated a new TSP algorithm that lead to travel time savings of between 2.6 and 6.4 percent (2012-00814).
In 2015, 92 percent of fixed-route buses in the United States had AVL systems installed, an increase from just 59
percent in 2008.
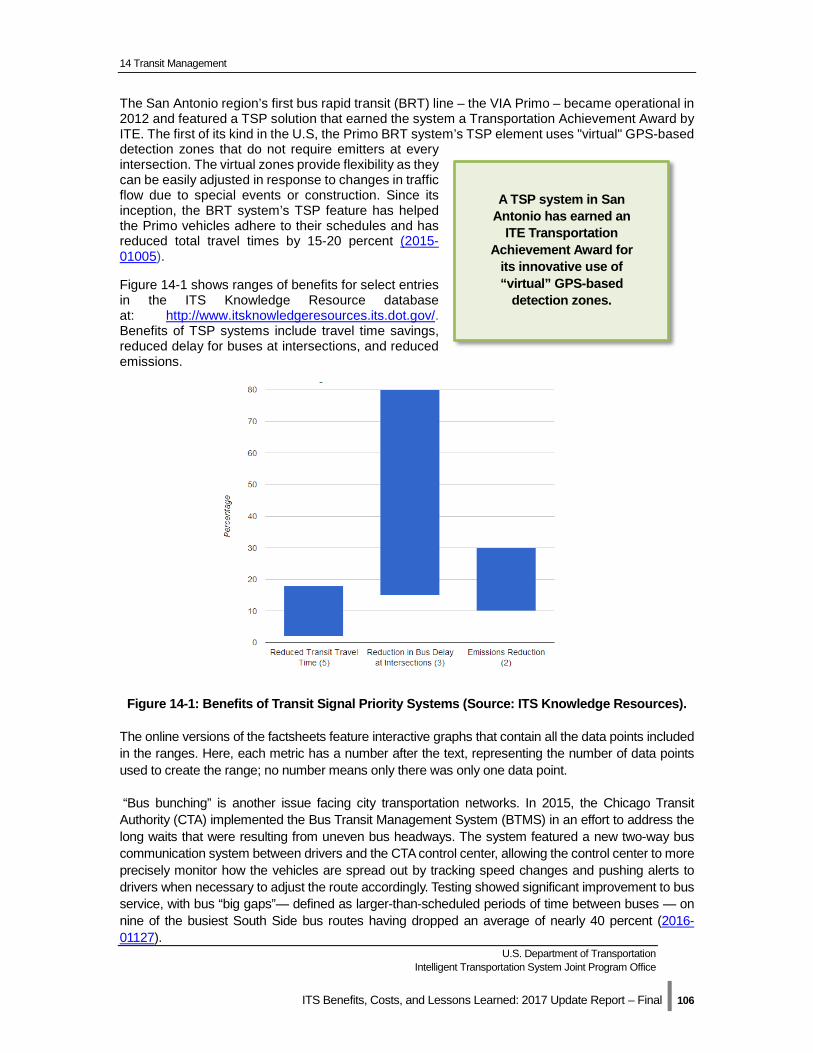
14 Transit Management
U.S. Department of Transportation Intelligent Transportation System Joint Program Office
ITS Benefits, Costs, and Lessons Learned: 2017 Update Report – Final | 106
The San Antonio region’s first bus rapid transit (BRT) line – the VIA Primo – became operational in 2012 and featured a TSP solution that earned the system a Transportation Achievement Award by ITE. The first of its kind in the U.S, the Primo BRT system’s TSP element uses "virtual" GPS-based detection zones that do not require emitters at every intersection. The virtual zones provide flexibility as they can be easily adjusted in response to changes in traffic flow due to special events or construction. Since its inception, the BRT system’s TSP feature has helped the Primo vehicles adhere to their schedules and has reduced total travel times by 15-20 percent (2015-01005).
Figure 14-1 shows ranges of benefits for select entries in the ITS Knowledge Resource database at: http://www.itsknowledgeresources.its.dot.gov/. Benefits of TSP systems include travel time savings, reduced delay for buses at intersections, and reduced emissions.
Figure 14-1: Benefits of Transit Signal Priority Systems (Source: ITS Knowledge Resources).
The online versions of the factsheets feature interactive graphs that contain all the data points included in the ranges. Here, each metric has a number after the text, representing the number of data points used to create the range; no number means only there was only one data point.
“Bus bunching” is another issue facing city transportation networks. In 2015, the Chicago Transit Authority (CTA) implemented the Bus Transit Management System (BTMS) in an effort to address the long waits that were resulting from uneven bus headways. The system featured a new two-way bus communication system between drivers and the CTA control center, allowing the control center to more precisely monitor how the vehicles are spread out by tracking speed changes and pushing alerts to drivers when necessary to adjust the route accordingly. Testing showed significant improvement to bus service, with bus “big gaps”— defined as larger-than-scheduled periods of time between buses — on nine of the busiest South Side bus routes having dropped an average of nearly 40 percent (2016-01127).
A TSP system in San Antonio has earned an
ITE Transportation Achievement Award for
its innovative use of “virtual” GPS-based
detection zones.
14 Transit Management
U.S. Department of Transportation Intelligent Transportation System Joint Program Office
ITS Benefits, Costs, and Lessons Learned: 2017 Update Report – Final | 107
Costs The cost of deploying an AVL system for a vehicle fleet ranges from $10,000 to $20,000 per vehicle (2009-00190). Cellular or radio communications costs also need to be considered when deploying AVL systems because it is used for location “polling”. TSP emitter costs can range from $50 to $2,500 per vehicle, with TSP detectors ranging from $2,500 to $40,000 depending on whether or not the existing signal controller is new enough to have TSP added or if new signal controllers need to be installed (2013-00286, 2008-00155).
Software and hardware costs for retrofitting the 1,800 CTA buses with the Bus Transit Management System mentioned in the previous section were estimated at $8.8 million (2016-00369).
Oakland, California’s AC Transit recently upgraded the District’s CAD/AVL system to replace an old system run on unsupported software and aging servers. In addition, the new system provides voice, data and text communications with the Operations Control Center (OCC), a real-time passenger information system, and a vehicle safety solution that permits the OCC to disable a coach in the event of unauthorized use or other incident. The system cost $21.1 million to implement for a fleet size of approximately 575 vehicles (2016-00368).
In a similar AVL system upgrade, the city of Markham, Canada proposed a system that included an in-house technology platform designed to communicate with the vehicles through a vehicle on-board computer, which has been further integrated to communicate with in-vehicle devices such as salt-spreaders, proximity switches, pressure sensors, RFID readers and more. The solution also included a back-end service with specialized reports to meet customer requirements. Hardware, software, and labor components for wireless data and voice communication functions totaled $164,058 for the first year for a fleet of 265 vehicles. The maintenance contract for the entire fleet was estimated to cost $64,719 per year (Canadian dollars) (2014-00303).
Lessons Learned In an NCHRP synthesis that documented the practice associated with designing, implementing, and operating ATM on arterials, the Utah DOT and the San Francisco Metro Transit Authority (SFMTA) detailed their experience with implementing TSP around Salt Lake City and in the Bay Area. While the transit industry tends to deploy customized solutions to meet each specific agency’s needs, the following lessons learned from Utah DOT and SMFTA can be generally applicable to the development and deployment of other TSP systems. (2016-00744)
• Placement of TSP activation detectors is important; ensure any priority maximizes benefit to transit vehicles while minimizing delay to others.
• Not all signals need the same amount of priority. A more balanced approach for all users could be allowing less priority at major intersections and more at minor intersections. The theory was that a little more delay for the transit vehicle at major intersections is fine if they will move faster through the minor ones.
• Do not neglect associated maintenance. There is more than the initial capital cost of the system. If a system is not maintained, it will not work.
Case Study - Mobility Services for All-Americans (MSAA) Coordination Simulation Study
The concept that coordinating demand-response services across agencies and funding sources results in better and more efficient services is widely accepted. However, quantitative analysis on the benefits of coordination was lacking. This study simulated three levels of coordination using actual trip data from two rural demand-response transit agencies in North Carolina and South
14 Transit Management
U.S. Department of Transportation Intelligent Transportation System Joint Program Office
ITS Benefits, Costs, and Lessons Learned: 2017 Update Report – Final | 108
Carolina (2013-00888). The authors utilized the funding sources to categorize trips into three groups: Medicaid, aging-related (Aging), and other.
The simulation tested three coordination scenarios: Some Coordination, More Coordination and Full Coordination. Some Coordination only coordinates trips within each of the three funding categories. Passengers with trips classified as “Aging” can only ride on vehicles assigned to the Aging group and with other Aging passengers. Passengers in the Medicaid and Other groups are assigned with similar restrictions. More Coordination simulates the effect of a Medicaid brokerage model, where Medicaid trips are scheduled separately from all other trips (Aging and Other trips and vehicles are combined). Full Coordination allows any trip from any funding category to be scheduled on any available vehicle.
The analysis used scheduling software to automatically optimize scheduling of trips. The results show a reduction in both total revenue distance and total revenue hours ranging from 7 to 13 percent when comparing the Some Coordination scenario to the Full Coordination scenario. Additionally, the average number of passengers served per revenue hour increased by approximately 10 percent. These efficiencies gained from greater coordination of trips would allow the agencies to serve a greater number of passengers without needing to increase their staff or number of vehicles.
14.2 Information Dissemination
Introduction In 2014, Americans took 10.8 billion trips on public transportation, which is the highest annual public transit ridership number in 58 years [1]. Even as gas prices have fallen in recent years, public transit ridership has remained strong as other concurrent trends have caused more people to ditch their personal vehicles and turn to public transit. Transit agencies are continually working to improve service reliability by providing customers with accurate service updates. As real-time information provides riders with increased predictability, less aggravation, and shorter wait times, agencies investing in real-time information systems increase rider satisfaction, and in turn help boost ridership.
Modern digital technology applications are changing the way we think about signage and information dissemination for the public transportation industry. The proliferation of mobile devices and real-time information have led to a shift over the past several years in the way transit agencies disseminate traveler information to their existing (and potential) passengers. Increased adoption of the General Transit Feed Specification (GTFS) by transit agencies has led to the development of transit traveler information mobile applications by third party developers in many cities, not just by the transit agencies themselves. Transit agencies continue to develop their own trip planning tools that are hosted on their agency webpages, but these trip planners only typically cover walking and transit directions. Map tools, such as Bing Maps and Google Maps, allow for a comparison between walking, transit and driving modes, but are still largely single-modal in nature.
Initiatives such as the U.S. DOT’s Integrated Corridor Management (ICM) program and the Mobility on Demand (MOD) program seek to remove the modal silos and provide multimodal traveler information en-route in addition to pre-trip information as travel conditions change.
Benefits
Real-time information provides riders with
increased predictability, less aggravation, and
shorter wait times.
14 Transit Management
U.S. Department of Transportation Intelligent Transportation System Joint Program Office
ITS Benefits, Costs, and Lessons Learned: 2017 Update Report – Final | 109
Increasing the pool of potential customers can be seen as a major benefit of improved information dissemination by the transit industry. The use of mobile trip information allows both visitors and infrequent system users to feel more confident in their ability to navigate that city’s transit systems, as well as expose individuals to transit options they may not have previously been aware of.
A controlled behavioral experiment was conducted by Hillsborough Regional Transit Authority (HART) to evaluate the benefits of providing real-time information to transit riders. To measure behavior, feeling, and satisfaction changes, a survey was implemented for participants. After a period of three months, those with access to real-time information were found to have shorter perceived wait times than those without access to the real-time information. Regarding behavioral changes, 64 percent of real-time information users reported that they spent less time waiting at the bus stop and 39 percent reported that they make HART bus trips more often with access to the information (2017-01130). In another initiative, Dublin City Council (DCC) partnered with IBM Research to track bus journey information utilizing GPS data and made bus location information available to the public via the agency's website. By releasing updated journey information every minute, passengers were able to find the quickest route to their destination via the dublinked website. Results showed that the buses were saving time at targeted junctions, reducing journey time variability and having positive effects for passengers as well (2014-00969).
As can be seen in Figure 14-2, the use of traveler information tools such as trip planners and station parking information encourages individuals who have never tried transit options to take them at least once and encourages existing riders to use the transit system more frequently.
Providing passengers with real-time arrival information has also improved customer satisfaction with system performance. A survey of users of London’s Countdown system (wayside real-time arrival information for buses) demonstrated that despite a decrease in on-time arrivals, 64 percent of customers perceived that on-time performance had improved after the installation of the system. Perceived waiting times also decreased from nearly 12 minutes to less than 9 minutes. This customer satisfaction is largely attributed to high system availability, as well as more than 75 percent of posted arrival times being accurate within two minutes of actual arrivals (2011-00737).
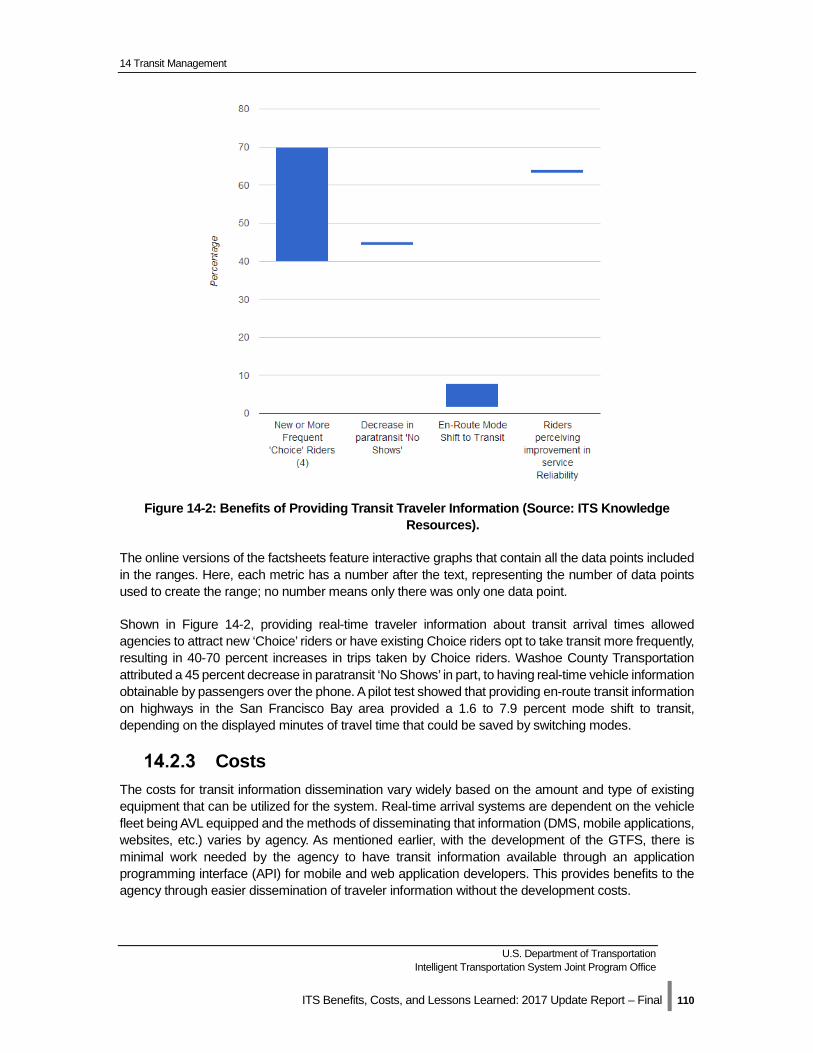
14 Transit Management
U.S. Department of Transportation Intelligent Transportation System Joint Program Office
ITS Benefits, Costs, and Lessons Learned: 2017 Update Report – Final | 110
Figure 14-2: Benefits of Providing Transit Traveler Information (Source: ITS Knowledge Resources).
The online versions of the factsheets feature interactive graphs that contain all the data points included in the ranges. Here, each metric has a number after the text, representing the number of data points used to create the range; no number means only there was only one data point.
Shown in Figure 14-2, providing real-time traveler information about transit arrival times allowed agencies to attract new ‘Choice’ riders or have existing Choice riders opt to take transit more frequently, resulting in 40-70 percent increases in trips taken by Choice riders. Washoe County Transportation attributed a 45 percent decrease in paratransit ‘No Shows’ in part, to having real-time vehicle information obtainable by passengers over the phone. A pilot test showed that providing en-route transit information on highways in the San Francisco Bay area provided a 1.6 to 7.9 percent mode shift to transit, depending on the displayed minutes of travel time that could be saved by switching modes.
Costs The costs for transit information dissemination vary widely based on the amount and type of existing equipment that can be utilized for the system. Real-time arrival systems are dependent on the vehicle fleet being AVL equipped and the methods of disseminating that information (DMS, mobile applications, websites, etc.) varies by agency. As mentioned earlier, with the development of the GTFS, there is minimal work needed by the agency to have transit information available through an application programming interface (API) for mobile and web application developers. This provides benefits to the agency through easier dissemination of traveler information without the development costs.
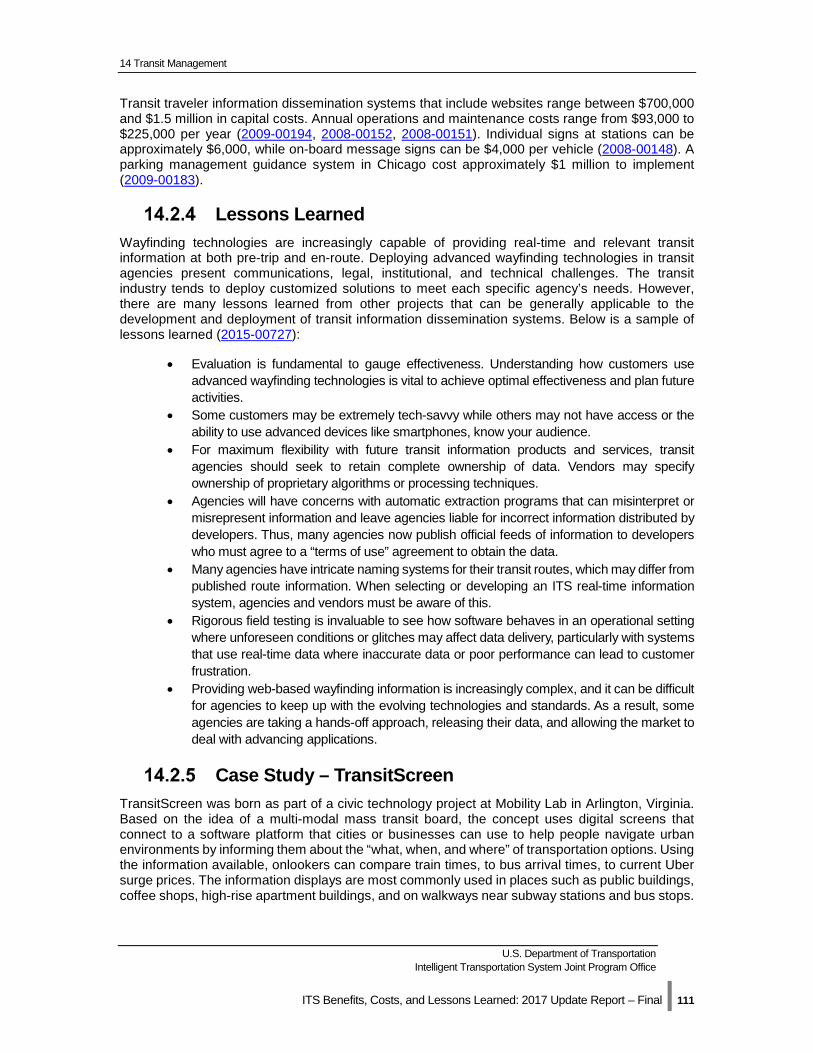
14 Transit Management
U.S. Department of Transportation Intelligent Transportation System Joint Program Office
ITS Benefits, Costs, and Lessons Learned: 2017 Update Report – Final | 111
Transit traveler information dissemination systems that include websites range between $700,000 and $1.5 million in capital costs. Annual operations and maintenance costs range from $93,000 to $225,000 per year (2009-00194, 2008-00152, 2008-00151). Individual signs at stations can be approximately $6,000, while on-board message signs can be $4,000 per vehicle (2008-00148). A parking management guidance system in Chicago cost approximately $1 million to implement (2009-00183).
Lessons Learned Wayfinding technologies are increasingly capable of providing real-time and relevant transit information at both pre-trip and en-route. Deploying advanced wayfinding technologies in transit agencies present communications, legal, institutional, and technical challenges. The transit industry tends to deploy customized solutions to meet each specific agency’s needs. However, there are many lessons learned from other projects that can be generally applicable to the development and deployment of transit information dissemination systems. Below is a sample of lessons learned (2015-00727):
• Evaluation is fundamental to gauge effectiveness. Understanding how customers use advanced wayfinding technologies is vital to achieve optimal effectiveness and plan future activities.
• Some customers may be extremely tech-savvy while others may not have access or the ability to use advanced devices like smartphones, know your audience.
• For maximum flexibility with future transit information products and services, transit agencies should seek to retain complete ownership of data. Vendors may specify ownership of proprietary algorithms or processing techniques.
• Agencies will have concerns with automatic extraction programs that can misinterpret or misrepresent information and leave agencies liable for incorrect information distributed by developers. Thus, many agencies now publish official feeds of information to developers who must agree to a “terms of use” agreement to obtain the data.
• Many agencies have intricate naming systems for their transit routes, which may differ from published route information. When selecting or developing an ITS real-time information system, agencies and vendors must be aware of this.
• Rigorous field testing is invaluable to see how software behaves in an operational setting where unforeseen conditions or glitches may affect data delivery, particularly with systems that use real-time data where inaccurate data or poor performance can lead to customer frustration.
• Providing web-based wayfinding information is increasingly complex, and it can be difficult for agencies to keep up with the evolving technologies and standards. As a result, some agencies are taking a hands-off approach, releasing their data, and allowing the market to deal with advancing applications.
Case Study – TransitScreen TransitScreen was born as part of a civic technology project at Mobility Lab in Arlington, Virginia. Based on the idea of a multi-modal mass transit board, the concept uses digital screens that connect to a software platform that cities or businesses can use to help people navigate urban environments by informing them about the “what, when, and where” of transportation options. Using the information available, onlookers can compare train times, to bus arrival times, to current Uber surge prices. The information displays are most commonly used in places such as public buildings, coffee shops, high-rise apartment buildings, and on walkways near subway stations and bus stops.
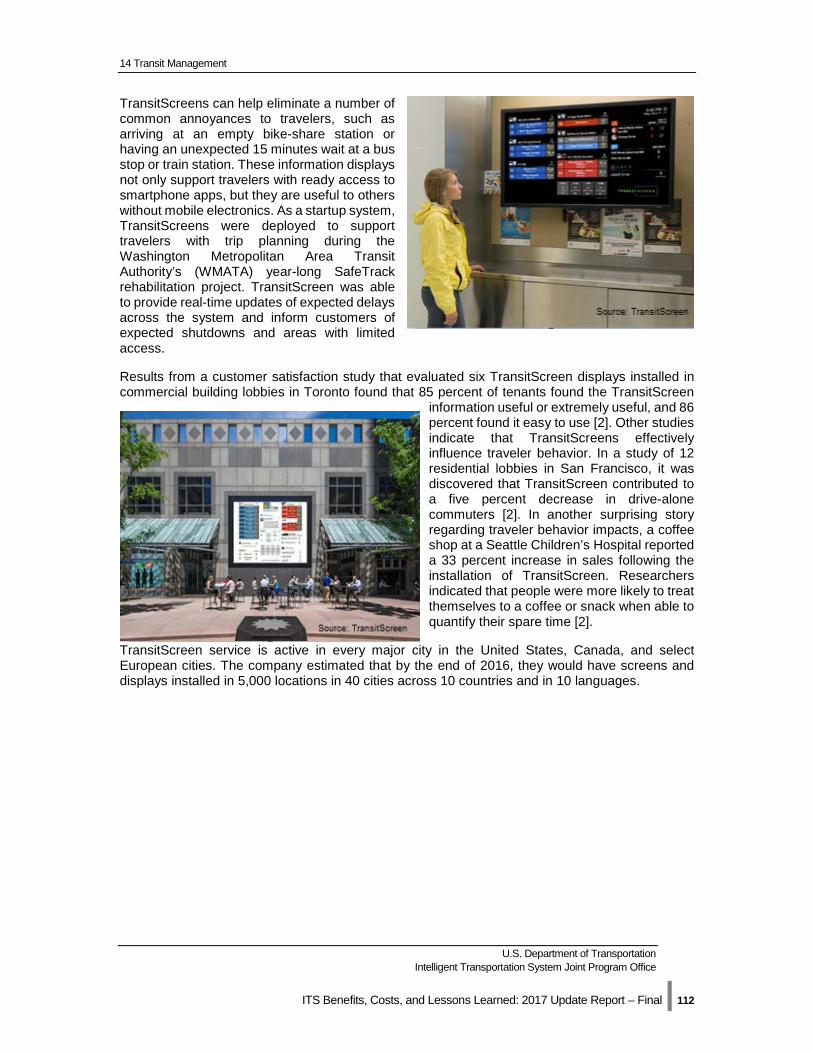
14 Transit Management
U.S. Department of Transportation Intelligent Transportation System Joint Program Office
ITS Benefits, Costs, and Lessons Learned: 2017 Update Report – Final | 112
TransitScreens can help eliminate a number of common annoyances to travelers, such as arriving at an empty bike-share station or having an unexpected 15 minutes wait at a bus stop or train station. These information displays not only support travelers with ready access to smartphone apps, but they are useful to others without mobile electronics. As a startup system, TransitScreens were deployed to support travelers with trip planning during the Washington Metropolitan Area Transit Authority’s (WMATA) year-long SafeTrack rehabilitation project. TransitScreen was able to provide real-time updates of expected delays across the system and inform customers of expected shutdowns and areas with limited access.
Results from a customer satisfaction study that evaluated six TransitScreen displays installed in commercial building lobbies in Toronto found that 85 percent of tenants found the TransitScreen
information useful or extremely useful, and 86 percent found it easy to use [2]. Other studies indicate that TransitScreens effectively influence traveler behavior. In a study of 12 residential lobbies in San Francisco, it was discovered that TransitScreen contributed to a five percent decrease in drive-alone commuters [2]. In another surprising story regarding traveler behavior impacts, a coffee shop at a Seattle Children’s Hospital reported a 33 percent increase in sales following the installation of TransitScreen. Researchers indicated that people were more likely to treat themselves to a coffee or snack when able to quantify their spare time [2].
TransitScreen service is active in every major city in the United States, Canada, and select European cities. The company estimated that by the end of 2016, they would have screens and displays installed in 5,000 locations in 40 cities across 10 countries and in 10 languages.
Joint Program Office U.S. Department of Transportation, Research and Innovative Technology Administration
ITS Benefits, Costs, and Lessons Learned: Update Report - Final | 113
15 Transportation Management Center
15.1 Introduction Transportation or traffic management centers (TMCs) or transportation operations centers (TOCs) are an integral part of a transportation system. TMCs are responsible for operating the latest Intelligent Transportation System (ITS) technology including data collection, command and control of ITS devices, incident response, and communication for transportation networks. As deployments of ITS have increased over the last decade, state DOTs are continuing to implement TMCs to focus on the operations of their systems. TMCs are the focal point for agencies as they look to operate their transportation systems as efficiently as possible with the existing ITS infrastructure. New concepts are leading to the more effective use of the conventional ITS devices in the field.
Recent initiatives and concepts such as Integrated Corridor Management (ICM) and Active Traffic and Demand Management (ATDM) integrate more functionality into a single center for more responsive or even predictive traffic operation strategies. TMCs will be at the center of operating and maintaining these new systems. At the heart of ICM is a decision support system which consists of the set of procedures, processes, data, information systems, and people that support transportation system managers in making coordinated decisions to improve the collective performance of all transportation networks within a corridor. ICM seeks to integrate freeway, arterial, and transit systems together to make the entire transportation network more efficient.
ATDM is the dynamic management, control, and influence of travel demand, traffic demand, and traffic flow of transportation facilities. Through the use of available tools and assets, traffic flow is managed and traveler behavior is influenced in real-time to achieve operational objectives, such as preventing or delaying breakdown conditions, improving safety, promoting sustainable travel modes, reducing emissions, or maximizing system efficiency.
Under an ATDM approach, the transportation system is continuously monitored. Using archived data and/or predictive methods, actions are performed in real-time to achieve or maintain system performance. Both ATDM and ICM are being deployed across the country. Two U.S. DOT ICM Pioneer Demonstration sites (Dallas and San Diego) went live with systems in early 2013.
Other technology trends that are impacting TMCs are big data, social media and crowdsourcing, and the continual growth of mobile and wireless communications. TMCs are collecting more and more data every day with the potential for data directly from vehicles in the near future. Social media is being used more and more for traveler information, while crowdsourced data is being used to gather data from drivers to obtain travel times, incidents, and other roadway information from driver reports [1].
Implementing Integrated Corridor Management (ICM) strategies on the
U.S. 75 corridor in Dallas, Texas produced an
estimated benefit-cost ratio of 20.4:1.
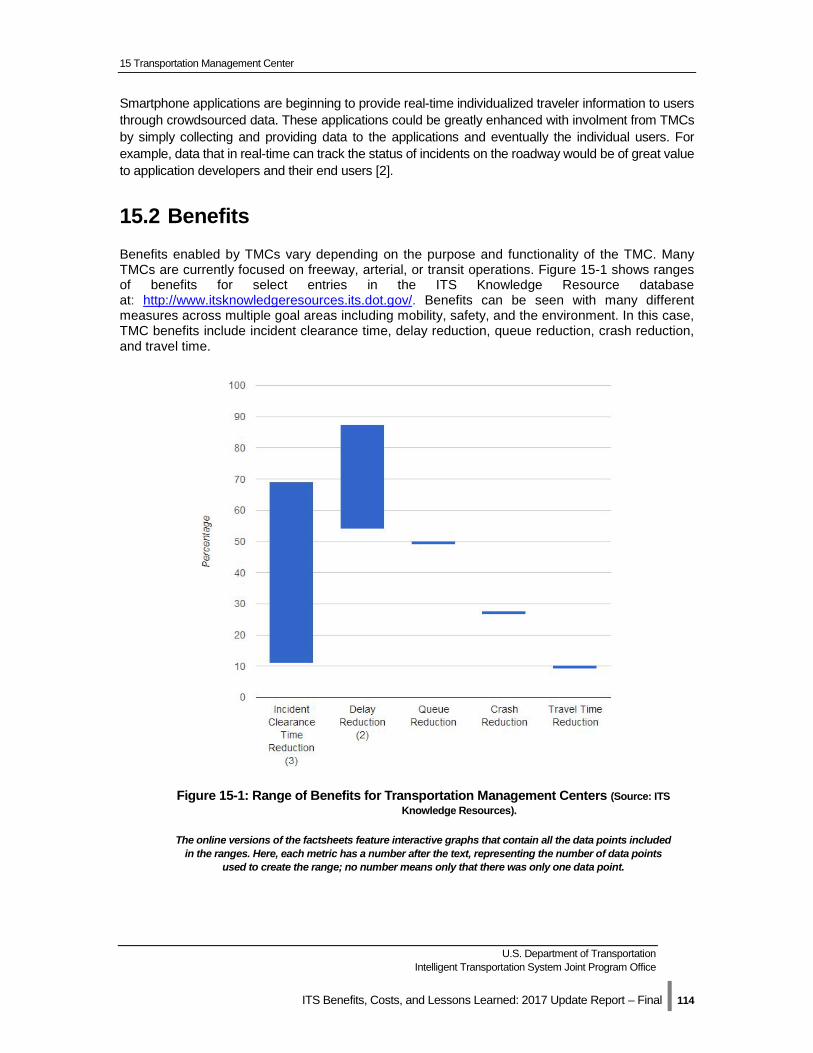
15 Transportation Management Center
U.S. Department of Transportation Intelligent Transportation System Joint Program Office
ITS Benefits, Costs, and Lessons Learned: 2017 Update Report – Final | 114
Smartphone applications are beginning to provide real-time individualized traveler information to users through crowdsourced data. These applications could be greatly enhanced with involment from TMCs by simply collecting and providing data to the applications and eventually the individual users. For example, data that in real-time can track the status of incidents on the roadway would be of great value to application developers and their end users [2].
15.2 Benefits Benefits enabled by TMCs vary depending on the purpose and functionality of the TMC. Many TMCs are currently focused on freeway, arterial, or transit operations. Figure 15-1 shows ranges of benefits for select entries in the ITS Knowledge Resource database at: http://www.itsknowledgeresources.its.dot.gov/. Benefits can be seen with many different measures across multiple goal areas including mobility, safety, and the environment. In this case, TMC benefits include incident clearance time, delay reduction, queue reduction, crash reduction, and travel time.
Figure 15-1: Range of Benefits for Transportation Management Centers (Source: ITS Knowledge Resources).
The online versions of the factsheets feature interactive graphs that contain all the data points included in the ranges. Here, each metric has a number after the text, representing the number of data points
used to create the range; no number means only that there was only one data point.
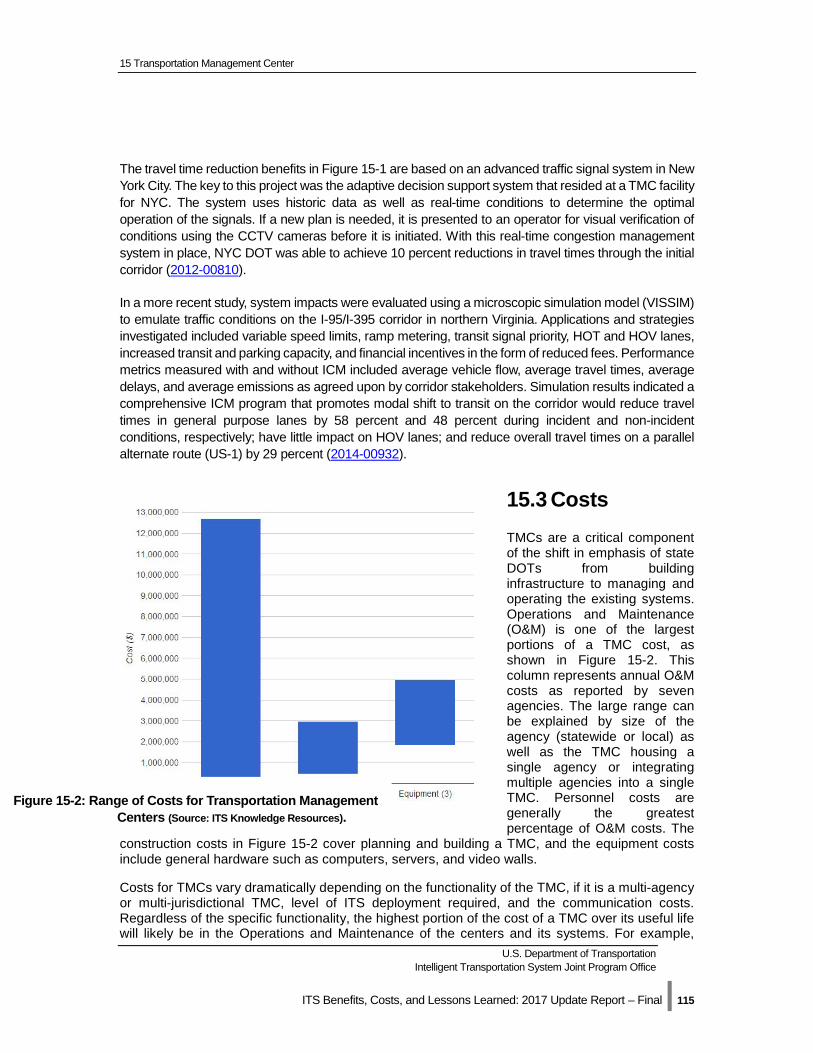
15 Transportation Management Center
U.S. Department of Transportation Intelligent Transportation System Joint Program Office
ITS Benefits, Costs, and Lessons Learned: 2017 Update Report – Final | 115
The travel time reduction benefits in Figure 15-1 are based on an advanced traffic signal system in New York City. The key to this project was the adaptive decision support system that resided at a TMC facility for NYC. The system uses historic data as well as real-time conditions to determine the optimal operation of the signals. If a new plan is needed, it is presented to an operator for visual verification of conditions using the CCTV cameras before it is initiated. With this real-time congestion management system in place, NYC DOT was able to achieve 10 percent reductions in travel times through the initial corridor (2012-00810).
In a more recent study, system impacts were evaluated using a microscopic simulation model (VISSIM) to emulate traffic conditions on the I-95/I-395 corridor in northern Virginia. Applications and strategies investigated included variable speed limits, ramp metering, transit signal priority, HOT and HOV lanes, increased transit and parking capacity, and financial incentives in the form of reduced fees. Performance metrics measured with and without ICM included average vehicle flow, average travel times, average delays, and average emissions as agreed upon by corridor stakeholders. Simulation results indicated a comprehensive ICM program that promotes modal shift to transit on the corridor would reduce travel times in general purpose lanes by 58 percent and 48 percent during incident and non-incident conditions, respectively; have little impact on HOV lanes; and reduce overall travel times on a parallel alternate route (US-1) by 29 percent (2014-00932).
15.3 Costs TMCs are a critical component of the shift in emphasis of state DOTs from building infrastructure to managing and operating the existing systems. Operations and Maintenance (O&M) is one of the largest portions of a TMC cost, as shown in Figure 15-2. This column represents annual O&M costs as reported by seven agencies. The large range can be explained by size of the agency (statewide or local) as well as the TMC housing a single agency or integrating multiple agencies into a single TMC. Personnel costs are generally the greatest percentage of O&M costs. The
construction costs in Figure 15-2 cover planning and building a TMC, and the equipment costs include general hardware such as computers, servers, and video walls.
Costs for TMCs vary dramatically depending on the functionality of the TMC, if it is a multi-agency or multi-jurisdictional TMC, level of ITS deployment required, and the communication costs. Regardless of the specific functionality, the highest portion of the cost of a TMC over its useful life will likely be in the Operations and Maintenance of the centers and its systems. For example,
Figure 15-2: Range of Costs for Transportation Management Centers (Source: ITS Knowledge Resources).
15 Transportation Management Center
U.S. Department of Transportation Intelligent Transportation System Joint Program Office
ITS Benefits, Costs, and Lessons Learned: 2017 Update Report – Final | 116
planners in Portland, Oregon have estimated the operational cost of a full-capacity regional transportation management center at approximately $36 million over a five-year period (2015-00339).
15.4 Lessons Learned The report titled Impacts of Technology Advancements on Transportation Management Center Operations identifies many of the trends discussed in this fact sheet in TMC operations. The report lists several lessons to help TMCs move forward with new technologies and tools (2013-00642):
• Develop a data fusion engine to merge data from multiple sources, such as travel time information coming from toll tag readers, Bluetooth sensors, and/or third party providers. An automated data fusion engine is designed to integrate multiple forms of raw data from different types of sensors, process and arrange the data into subsets, and present them in a way that provides a clear, more accurate picture for the operator to draw conclusions from, creating situational awareness.
• Develop procedures and protocols for use of social media. Develop a uniform policy for DOT use of social media, such as Facebook, Twitter, and video distribution platforms such as YouTube, among others. Social media can provide an important connection to users to disseminate travel warnings and alerts, as well as promote projects or public interest campaigns.
• Support two-way information exchange via social media. Social media can provide a valuable tool to reach out to travelers and residents, but also can provide an important source of data for the TMC.
• Utilize crowdsourcing for traffic information, incident information, and feedback on department performance, pavement roughness, etc. Crowdsourcing would enable real-time feedback from users on a variety of transportation issues and impacts, with an emphasis on crowdsourced information.
15.5 Case Study - TRANSCOM’s DFE-SPATEL Data Analysis Tool
TRANSCOM is a coalition of 16 transportation and public safety agencies in the New York, New Jersey, and Connecticut Tri-State region. It was created over thirty years ago to provide a cooperative, coordinated approach to regional transportation management in order to improve mobility and safety for the traveling public across the region. Through its Operations Information Center (OIC), TRANSCOM collects and disseminates construction and incident real-time information to and from 100 data centers across the region. Additionally, TRANSCOM’s OpenReach System incorporates data from all 16 member agencies (and many other affiliates) into a single platform to support coordination and enhanced operational and situational awareness. Information provided includes: highway and transit incidents, construction, and special events data; real-time travel times and speeds; closed circuit TV feeds; variable message sign (VMS) locations and messages; and highway advisory radio (HAR) locations. It is also the source of 511 traveler information.
The DFE/SPATEL tool generates a regional view
of roadway and transit conditions every 2
minutes and develops measures for reporting.
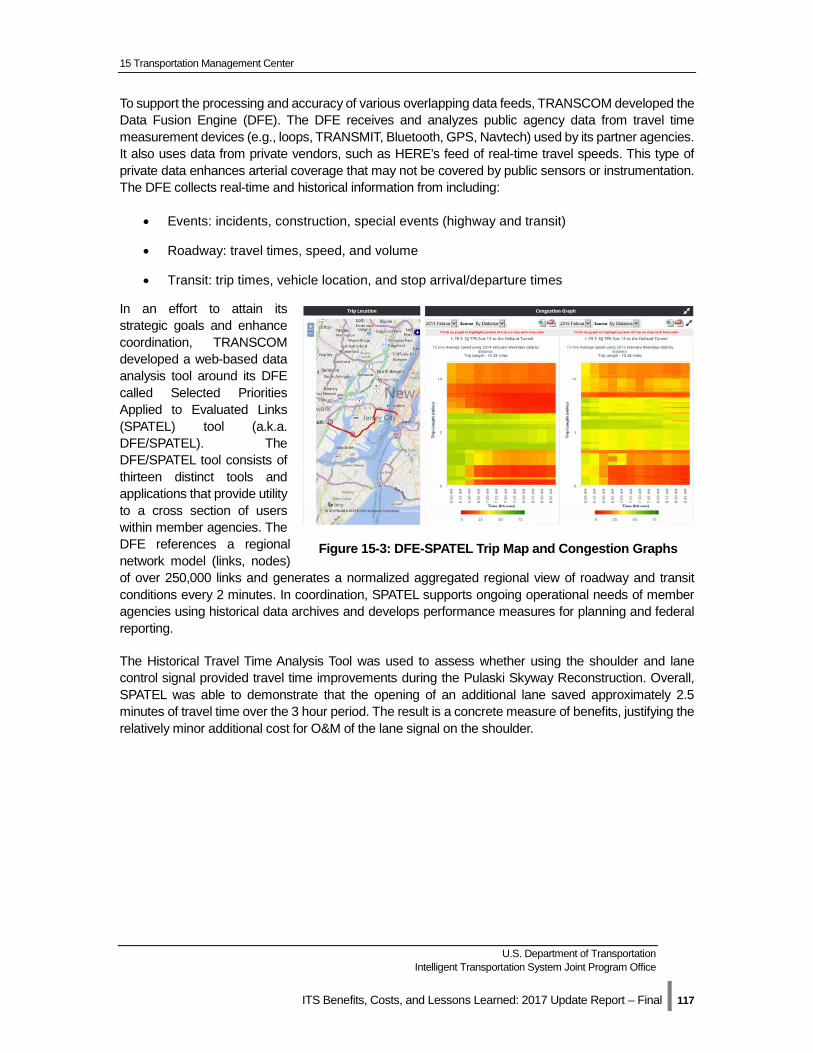
15 Transportation Management Center
U.S. Department of Transportation Intelligent Transportation System Joint Program Office
ITS Benefits, Costs, and Lessons Learned: 2017 Update Report – Final | 117
To support the processing and accuracy of various overlapping data feeds, TRANSCOM developed the Data Fusion Engine (DFE). The DFE receives and analyzes public agency data from travel time measurement devices (e.g., loops, TRANSMIT, Bluetooth, GPS, Navtech) used by its partner agencies. It also uses data from private vendors, such as HERE’s feed of real-time travel speeds. This type of private data enhances arterial coverage that may not be covered by public sensors or instrumentation. The DFE collects real-time and historical information from including:
• Events: incidents, construction, special events (highway and transit)
• Roadway: travel times, speed, and volume
• Transit: trip times, vehicle location, and stop arrival/departure times
In an effort to attain its strategic goals and enhance coordination, TRANSCOM developed a web-based data analysis tool around its DFE called Selected Priorities Applied to Evaluated Links (SPATEL) tool (a.k.a. DFE/SPATEL). The DFE/SPATEL tool consists of thirteen distinct tools and applications that provide utility to a cross section of users within member agencies. The DFE references a regional network model (links, nodes) of over 250,000 links and generates a normalized aggregated regional view of roadway and transit conditions every 2 minutes. In coordination, SPATEL supports ongoing operational needs of member agencies using historical data archives and develops performance measures for planning and federal reporting.
The Historical Travel Time Analysis Tool was used to assess whether using the shoulder and lane control signal provided travel time improvements during the Pulaski Skyway Reconstruction. Overall, SPATEL was able to demonstrate that the opening of an additional lane saved approximately 2.5 minutes of travel time over the 3 hour period. The result is a concrete measure of benefits, justifying the relatively minor additional cost for O&M of the lane signal on the shoulder.
Figure 15-3: DFE-SPATEL Trip Map and Congestion Graphs
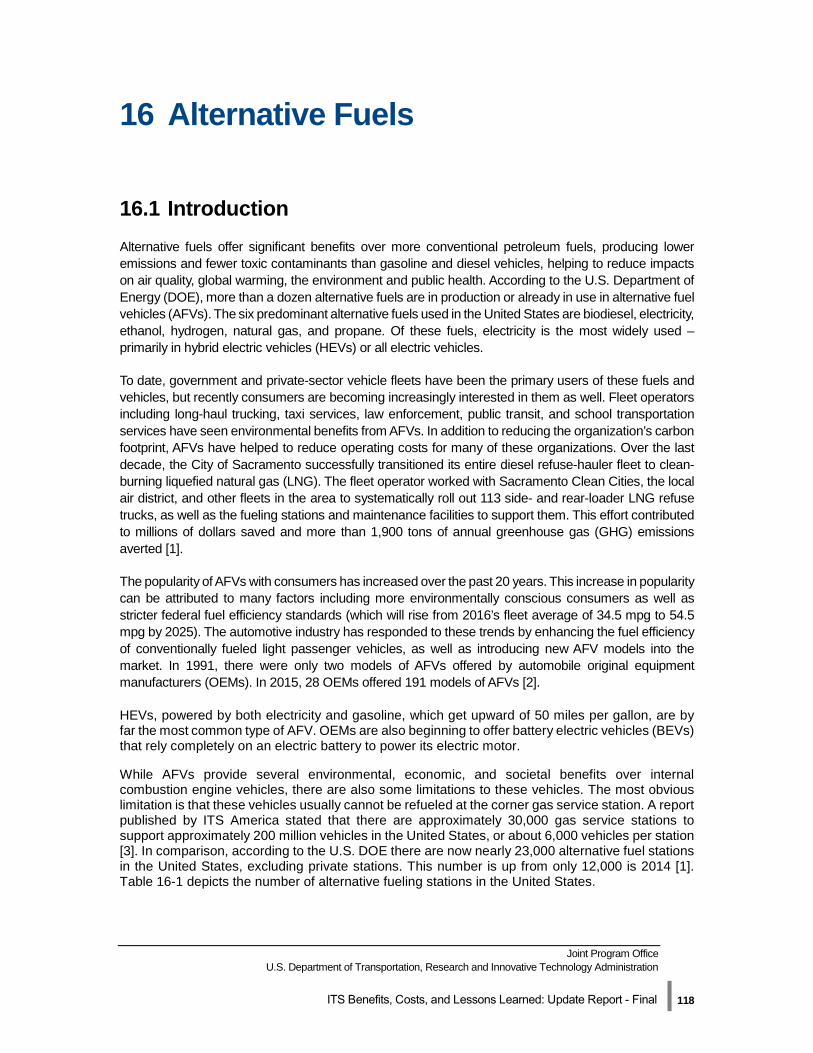
Joint Program Office U.S. Department of Transportation, Research and Innovative Technology Administration
ITS Benefits, Costs, and Lessons Learned: Update Report - Final | 118
16 Alternative Fuels
16.1 Introduction Alternative fuels offer significant benefits over more conventional petroleum fuels, producing lower emissions and fewer toxic contaminants than gasoline and diesel vehicles, helping to reduce impacts on air quality, global warming, the environment and public health. According to the U.S. Department of Energy (DOE), more than a dozen alternative fuels are in production or already in use in alternative fuel vehicles (AFVs). The six predominant alternative fuels used in the United States are biodiesel, electricity, ethanol, hydrogen, natural gas, and propane. Of these fuels, electricity is the most widely used – primarily in hybrid electric vehicles (HEVs) or all electric vehicles.
To date, government and private-sector vehicle fleets have been the primary users of these fuels and vehicles, but recently consumers are becoming increasingly interested in them as well. Fleet operators including long-haul trucking, taxi services, law enforcement, public transit, and school transportation services have seen environmental benefits from AFVs. In addition to reducing the organization’s carbon footprint, AFVs have helped to reduce operating costs for many of these organizations. Over the last decade, the City of Sacramento successfully transitioned its entire diesel refuse-hauler fleet to clean-burning liquefied natural gas (LNG). The fleet operator worked with Sacramento Clean Cities, the local air district, and other fleets in the area to systematically roll out 113 side- and rear-loader LNG refuse trucks, as well as the fueling stations and maintenance facilities to support them. This effort contributed to millions of dollars saved and more than 1,900 tons of annual greenhouse gas (GHG) emissions averted [1].
The popularity of AFVs with consumers has increased over the past 20 years. This increase in popularity can be attributed to many factors including more environmentally conscious consumers as well as stricter federal fuel efficiency standards (which will rise from 2016’s fleet average of 34.5 mpg to 54.5 mpg by 2025). The automotive industry has responded to these trends by enhancing the fuel efficiency of conventionally fueled light passenger vehicles, as well as introducing new AFV models into the market. In 1991, there were only two models of AFVs offered by automobile original equipment manufacturers (OEMs). In 2015, 28 OEMs offered 191 models of AFVs [2].
HEVs, powered by both electricity and gasoline, which get upward of 50 miles per gallon, are by far the most common type of AFV. OEMs are also beginning to offer battery electric vehicles (BEVs) that rely completely on an electric battery to power its electric motor.
While AFVs provide several environmental, economic, and societal benefits over internal combustion engine vehicles, there are also some limitations to these vehicles. The most obvious limitation is that these vehicles usually cannot be refueled at the corner gas service station. A report published by ITS America stated that there are approximately 30,000 gas service stations to support approximately 200 million vehicles in the United States, or about 6,000 vehicles per station [3]. In comparison, according to the U.S. DOE there are now nearly 23,000 alternative fuel stations in the United States, excluding private stations. This number is up from only 12,000 is 2014 [1]. Table 16-1 depicts the number of alternative fueling stations in the United States.
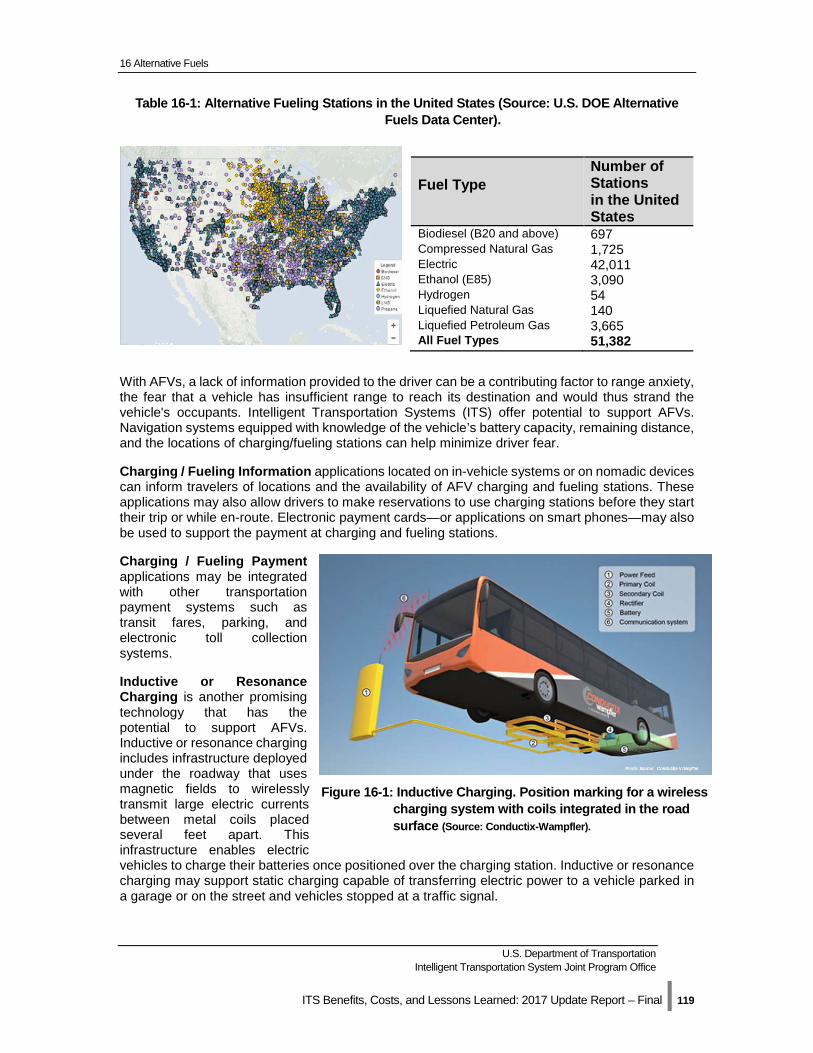
16 Alternative Fuels
U.S. Department of Transportation Intelligent Transportation System Joint Program Office
ITS Benefits, Costs, and Lessons Learned: 2017 Update Report – Final | 119
Table 16-1: Alternative Fueling Stations in the United States (Source: U.S. DOE Alternative Fuels Data Center).
With AFVs, a lack of information provided to the driver can be a contributing factor to range anxiety, the fear that a vehicle has insufficient range to reach its destination and would thus strand the vehicle's occupants. Intelligent Transportation Systems (ITS) offer potential to support AFVs. Navigation systems equipped with knowledge of the vehicle’s battery capacity, remaining distance, and the locations of charging/fueling stations can help minimize driver fear.
Charging / Fueling Information applications located on in-vehicle systems or on nomadic devices can inform travelers of locations and the availability of AFV charging and fueling stations. These applications may also allow drivers to make reservations to use charging stations before they start their trip or while en-route. Electronic payment cards—or applications on smart phones—may also be used to support the payment at charging and fueling stations.
Charging / Fueling Payment applications may be integrated with other transportation payment systems such as transit fares, parking, and electronic toll collection systems.
Inductive or Resonance Charging is another promising technology that has the potential to support AFVs. Inductive or resonance charging includes infrastructure deployed under the roadway that uses magnetic fields to wirelessly transmit large electric currents between metal coils placed several feet apart. This infrastructure enables electric vehicles to charge their batteries once positioned over the charging station. Inductive or resonance charging may support static charging capable of transferring electric power to a vehicle parked in a garage or on the street and vehicles stopped at a traffic signal.
Fuel Type Number of Stations in the United States
Biodiesel (B20 and above) 697 Compressed Natural Gas 1,725 Electric 42,011 Ethanol (E85) 3,090 Hydrogen 54 Liquefied Natural Gas 140 Liquefied Petroleum Gas 3,665 All Fuel Types 51,382
Figure 16-1: Inductive Charging. Position marking for a wireless charging system with coils integrated in the road surface (Source: Conductix-Wampfler).
16 Alternative Fuels
U.S. Department of Transportation Intelligent Transportation System Joint Program Office
ITS Benefits, Costs, and Lessons Learned: 2017 Update Report – Final | 120
A start-up at Utah State University (USU) named WAVE Inc. is commercializing Inductive Power Transfer (IPT) technology for electric buses after developing Wireless Advanced Electric Vehicles (WAVE) transit technology within its Electrodynamics Lab. Unveiled in 2012, the initial WAVE technology bus prototype was a USU campus shuttle, the Aggie Bus, which modified a 22-foot electric eBus to recharge its nickel cadmium battery (NiCd) for 5 minutes every 15 minutes. USU’s Aggie Bus has achieved several significant milestones including being the first bus developed and designed by a North American organization that is charged with Wireless Power Transfer (WPT) technology and being the world’s first electric bus with WPT combining a power level up to 25 kilowatts, greater than 90 percent efficiency from the power grid to the battery and a maximum misalignment of up to six inches (2016-01120).
Looking down the road a few years, wireless charging technology may be able to support charging vehicle batteries while the vehicle is moving at highway speeds, without having to stop at all. This capability – known as dynamic wireless charging – is currently being researched. In 2013, the Korea Advanced Institute of Science and Technology (KAIST) developed the Online Electric Vehicle (OLEV) charging platform that allowed two buses in Gumi to run a continuous 24 km inter-city loop powered by charging apparatuses installed beneath the street [5].
Catenary Systems that use overhead wires to provide electricity for heavy duty vehicles have been in use for well over 100 years. Today, catenary systems can be found on urban light rail vehicles, city buses, and mining equipment. A recent demonstration shows how these systems may be used along truck corridors as part of a catenary based system for zero-emission trucks. While catenary system technology is very mature, it is only recently that hybrid/electric drive technology has matured to the point that a cost-effective hybrid system could be developed that allows for zero-emission operation on and off the catenary line. In the proposed system, a diesel or natural gas hybrid truck is envisioned that can operate solely on electrical power from the catenary lines. Additionally, an onboard battery will allow the truck to operate in electric mode for a limited distance after disconnecting from the catenary system [4].
16.2 Benefits Transportation is the “fastest-growing source of U.S. GHG emissions, accounting for 47 percent of the net increase in total U.S. emissions since 1990, and is the largest end-use source of CO2, which is the most prevalent GHG” [6]. Transportation activities accounted for 27 percent of all GHG emissions in the United States, with on-road vehicles contributing 84 percent to that total. Nearly “97 percent of transportation GHG emissions came through direct combustion of fossil fuels.” Over 43 percent of surface transportation emissions are the result of passenger vehicles, 19 percent from light-duty trucks, and freight trucks account for another 22 percent. AFVs have the potential to reduce these numbers significantly and ITS is an enabling technology to make these vehicles more attractive to the traveling public.
To date, ITS technologies to support AFVs have not been widely deployed. As a result, there is limited data documenting the benefits of Charging/Fueling Information, Charging/Fueling Payment, Inductive or Resonance Charging, or Catenary Systems that support HEVs. While documentation of benefits is limited, ITS technologies relating to AFVs seem promising. Charging/Fueling information may help to reduce range anxiety which may result in more purchases or use of AFVs. Additionally, Inductive or Resonance Charging applications will allow drivers to charge their electric vehicles in small amounts fairly often. As a result, electric batteries could be smaller with the resulting reduction in electric vehicle cost and weight. These technologies will also make electric vehicles more attractive to consumers. Finally, the potential benefits of a catenary-accessible hybrid truck platform may be significant. Trucks, when connected to the catenary system, will have zero-emissions which can significantly reduce emissions along a corridor.
16 Alternative Fuels
U.S. Department of Transportation Intelligent Transportation System Joint Program Office
ITS Benefits, Costs, and Lessons Learned: 2017 Update Report – Final | 121
As these technologies mature and the number of AFVs on the roadway increase, it is expected that private and public agencies will begin deploying technologies to support the operations of these vehicles and more benefit data will become available.
16.3 Costs A limited number of ITS applications have been deployed to support alternative fuels. However, there is a lot of available data related to charging infrastructure for electric vehicles. The National Renewable Energy Laboratory’s handbook estimated that the costs involved in setting up the infrastructure and equipment for a charging station were between $15,000 and $18,000 for traditional public charging stations and between $65,000 and $70,000 for fast-charging stations [7].
16.4 Lessons Learned The following lessons learned are gathered from the U.S. DOE’s Office of Energy Efficiency and Renewable Energy:
Receive significant cost savings by driving AFVs instead of vehicles powered by internal combustion engines (ICEs). The U.S. DOE’s “Find a Car” tool allows consumers to compare fuel efficiency, costs, carbon footprints, and emissions of different vehicle makes and models (http://www.afdc.energy.gov/tools).
Convert petroleum-based fleet vehicles to AFVs to save operating costs and avert greenhouse gas (GHG) emissions. The U.S. DOE’s “Green Fleet Footprint Calculator” is a tool that can be used to estimate the potential savings for fleet operators (http://www.afdc.energy.gov/tools).
Minimize range anxiety with in-vehicle navigation systems equipped with knowledge of battery capacity, remaining distance, and the locations of charging/fueling stations. As a result, consumers may be more likely to purchase and use AFVs.
16.5 Case Study - The I-710 Corridor Project: Zero Emissions Corridor
The California Department of Transportation (Caltrans), in cooperation with the Los Angeles County Metropolitan Transportation Authority (Metro), the Gateway Cities Council of Governments, the Southern California Association of Governments and the Ports of Los Angeles and Long Beach recently proposed improvements to Interstate 710. Interstate 710 is a major north-south interstate freeway connecting the city of Long Beach to central Los Angeles. The corridor serves as the principal transportation connection for goods movement between the Port of Los Angeles and the Port of Long Beach, located at the southern terminus of I-710 and the Burlington Northern Santa Fe (BNSF)/Union Pacific (UP) Railroad rail yards in the cities of Commerce and Vernon. The existing I-710 Corridor has elevated levels of health risks related to high levels of diesel particulate emissions, traffic congestion, high truck volumes, high accident rates, and contains many design features in need of modernization. The U.S. Environmental Protection Agency (EPA) has designated the South Coast Air Basin (Basin), which includes the Study Area, as an extreme ozone non-attainment area and a non-attainment area for small airborne particulate matter less than 10 and 2.5 microns (PM10 and PM2.5).
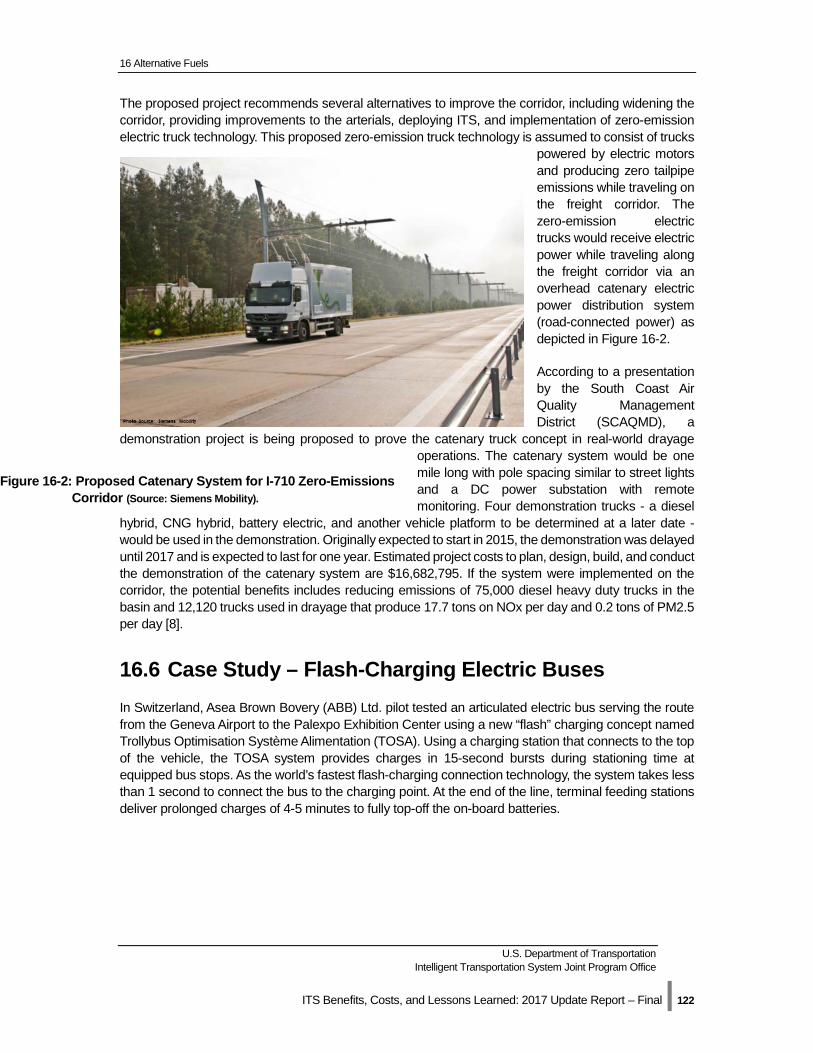
16 Alternative Fuels
U.S. Department of Transportation Intelligent Transportation System Joint Program Office
ITS Benefits, Costs, and Lessons Learned: 2017 Update Report – Final | 122
The proposed project recommends several alternatives to improve the corridor, including widening the corridor, providing improvements to the arterials, deploying ITS, and implementation of zero-emission electric truck technology. This proposed zero-emission truck technology is assumed to consist of trucks
powered by electric motors and producing zero tailpipe emissions while traveling on the freight corridor. The zero-emission electric trucks would receive electric power while traveling along the freight corridor via an overhead catenary electric power distribution system (road-connected power) as depicted in Figure 16-2.
According to a presentation by the South Coast Air Quality Management District (SCAQMD), a
demonstration project is being proposed to prove the catenary truck concept in real-world drayage operations. The catenary system would be one mile long with pole spacing similar to street lights and a DC power substation with remote monitoring. Four demonstration trucks - a diesel
hybrid, CNG hybrid, battery electric, and another vehicle platform to be determined at a later date - would be used in the demonstration. Originally expected to start in 2015, the demonstration was delayed until 2017 and is expected to last for one year. Estimated project costs to plan, design, build, and conduct the demonstration of the catenary system are $16,682,795. If the system were implemented on the corridor, the potential benefits includes reducing emissions of 75,000 diesel heavy duty trucks in the basin and 12,120 trucks used in drayage that produce 17.7 tons on NOx per day and 0.2 tons of PM2.5 per day [8].
16.6 Case Study – Flash-Charging Electric Buses In Switzerland, Asea Brown Bovery (ABB) Ltd. pilot tested an articulated electric bus serving the route from the Geneva Airport to the Palexpo Exhibition Center using a new “flash” charging concept named Trollybus Optimisation Système Alimentation (TOSA). Using a charging station that connects to the top of the vehicle, the TOSA system provides charges in 15-second bursts during stationing time at equipped bus stops. As the world’s fastest flash-charging connection technology, the system takes less than 1 second to connect the bus to the charging point. At the end of the line, terminal feeding stations deliver prolonged charges of 4-5 minutes to fully top-off the on-board batteries.
Figure 16-2: Proposed Catenary System for I-710 Zero-Emissions Corridor (Source: Siemens Mobility).
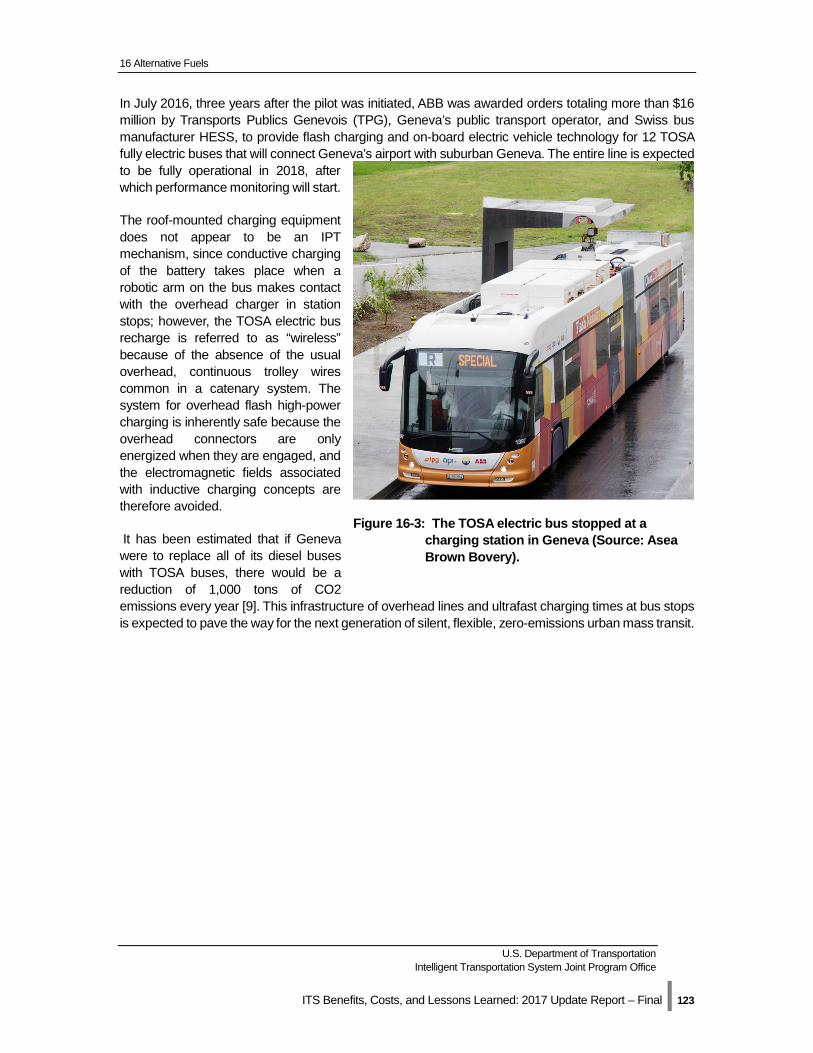
16 Alternative Fuels
U.S. Department of Transportation Intelligent Transportation System Joint Program Office
ITS Benefits, Costs, and Lessons Learned: 2017 Update Report – Final | 123
In July 2016, three years after the pilot was initiated, ABB was awarded orders totaling more than $16 million by Transports Publics Genevois (TPG), Geneva’s public transport operator, and Swiss bus manufacturer HESS, to provide flash charging and on-board electric vehicle technology for 12 TOSA fully electric buses that will connect Geneva’s airport with suburban Geneva. The entire line is expected to be fully operational in 2018, after which performance monitoring will start.
The roof-mounted charging equipment does not appear to be an IPT mechanism, since conductive charging of the battery takes place when a robotic arm on the bus makes contact with the overhead charger in station stops; however, the TOSA electric bus recharge is referred to as “wireless” because of the absence of the usual overhead, continuous trolley wires common in a catenary system. The system for overhead flash high-power charging is inherently safe because the overhead connectors are only energized when they are engaged, and the electromagnetic fields associated with inductive charging concepts are therefore avoided.
It has been estimated that if Geneva were to replace all of its diesel buses with TOSA buses, there would be a reduction of 1,000 tons of CO2 emissions every year [9]. This infrastructure of overhead lines and ultrafast charging times at bus stops is expected to pave the way for the next generation of silent, flexible, zero-emissions urban mass transit.
Figure 16-3: The TOSA electric bus stopped at a charging station in Geneva (Source: Asea Brown Bovery).
Joint Program Office U.S. Department of Transportation, Research and Innovative Technology Administration
ITS Benefits, Costs, and Lessons Learned: Update Report - Final | 124
17 Traffic Incident Management
17.1 Introduction Managing traffic incidents is a proven strategy for addressing significant portions of the Nation's traffic congestion problems. Approximately 25 percent of all delay is the result of incidents on roadways [1]. Traffic crashes are the most time-consuming of these incidents, but the more numerous cases of stalled vehicles, roadway debris, and other incidents also contribute significantly to the problem. Traffic incident management strategies have shown significant safety, mobility, efficiency, productivity, environmental, and customer satisfaction benefits.
Traffic incident management programs make use of a variety of ITS technologies to successfully detect, manage, and clear traffic incidents; improving safety for travelers by reducing the risk of secondary crashes; and reducing time lost and fuel wasted in traffic backups. These programs also utilize ITS deployed for traveler information, freeway management, and arterial roadway management, and increasingly coordinate their activities with Transportation Management Centers (TMCs), the police, emergency medical services and other emergency services.
A variety of surveillance and detection technologies can help detect incidents quickly including inductive loop, microwave, acoustic vehicle detectors, and camera systems providing video surveillance of roadways monitored by operators. Mobilization and response may include automated vehicle location (AVL) and computer-aided dispatch (CAD) systems, as well as response routing systems to help incident response teams arrive swiftly. Service patrols are now frequently incorporated into traffic incident management programs. The patrol vehicles and staff supported by an array of other ITS components, such as mobile field reporting, enable significant reductions in the time to respond to and clear incidents.
With the new mandates for performance reporting requirements through MAP-21, incident tracking has become a very important part of traffic incident management programs. Many ITS technologies can be used for both traffic measures as well as emergency response services, creating additional benefits to the traffic incident programs. For example, installing CCTV cameras for traffic monitoring also helps the police achieve more efficient incident response operations.
17.2 Benefits Traffic incident management programs have demonstrated success and shown high value through benefit-cost ratio analysis. Some sample benefit-cost ratios from incident management programs around the country are shown in Table 17-1.
The estimate for the total expected risk-adjusted
cost of implementing and operating a nationwide NG9-1-1 system ranges from $82 billion to $86.3 billion over the next 20
years.
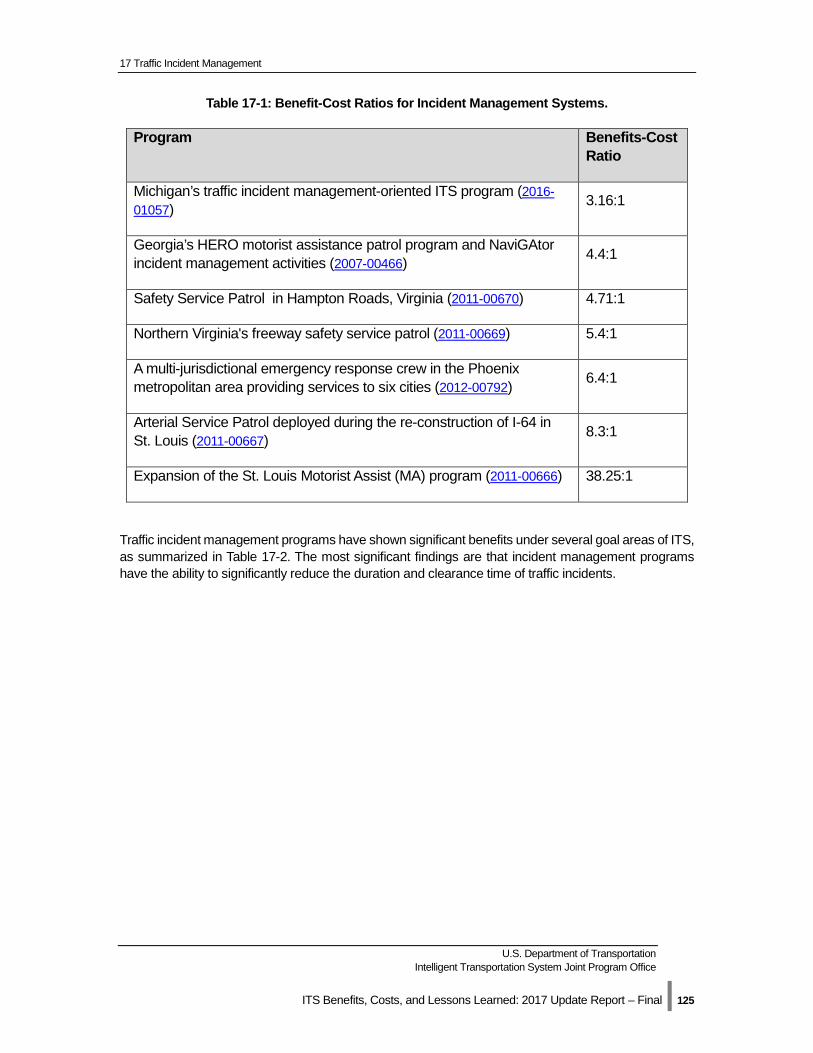
17 Traffic Incident Management
U.S. Department of Transportation Intelligent Transportation System Joint Program Office
ITS Benefits, Costs, and Lessons Learned: 2017 Update Report – Final | 125
Table 17-1: Benefit-Cost Ratios for Incident Management Systems.
Program Benefits-Cost Ratio
Michigan’s traffic incident management-oriented ITS program (2016-01057) 3.16:1
Georgia’s HERO motorist assistance patrol program and NaviGAtor incident management activities (2007-00466) 4.4:1
Safety Service Patrol in Hampton Roads, Virginia (2011-00670) 4.71:1
Northern Virginia's freeway safety service patrol (2011-00669) 5.4:1
A multi-jurisdictional emergency response crew in the Phoenix metropolitan area providing services to six cities (2012-00792) 6.4:1
Arterial Service Patrol deployed during the re-construction of I-64 in St. Louis (2011-00667) 8.3:1
Expansion of the St. Louis Motorist Assist (MA) program (2011-00666) 38.25:1
Traffic incident management programs have shown significant benefits under several goal areas of ITS, as summarized in Table 17-2. The most significant findings are that incident management programs have the ability to significantly reduce the duration and clearance time of traffic incidents.
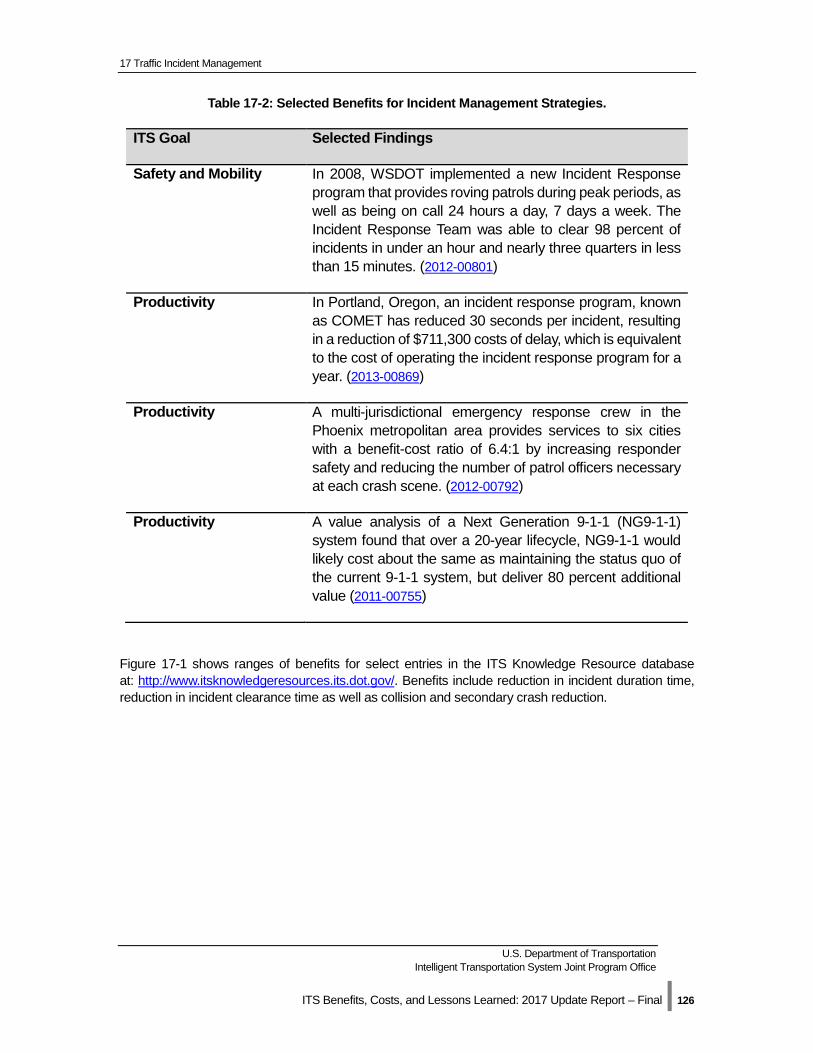
17 Traffic Incident Management
U.S. Department of Transportation Intelligent Transportation System Joint Program Office
ITS Benefits, Costs, and Lessons Learned: 2017 Update Report – Final | 126
Table 17-2: Selected Benefits for Incident Management Strategies.
ITS Goal Selected Findings
Safety and Mobility In 2008, WSDOT implemented a new Incident Response program that provides roving patrols during peak periods, as well as being on call 24 hours a day, 7 days a week. The Incident Response Team was able to clear 98 percent of incidents in under an hour and nearly three quarters in less than 15 minutes. (2012-00801)
Productivity In Portland, Oregon, an incident response program, known as COMET has reduced 30 seconds per incident, resulting in a reduction of $711,300 costs of delay, which is equivalent to the cost of operating the incident response program for a year. (2013-00869)
Productivity A multi-jurisdictional emergency response crew in the Phoenix metropolitan area provides services to six cities with a benefit-cost ratio of 6.4:1 by increasing responder safety and reducing the number of patrol officers necessary at each crash scene. (2012-00792)
Productivity A value analysis of a Next Generation 9-1-1 (NG9-1-1) system found that over a 20-year lifecycle, NG9-1-1 would likely cost about the same as maintaining the status quo of the current 9-1-1 system, but deliver 80 percent additional value (2011-00755)
Figure 17-1 shows ranges of benefits for select entries in the ITS Knowledge Resource database at: http://www.itsknowledgeresources.its.dot.gov/. Benefits include reduction in incident duration time, reduction in incident clearance time as well as collision and secondary crash reduction.
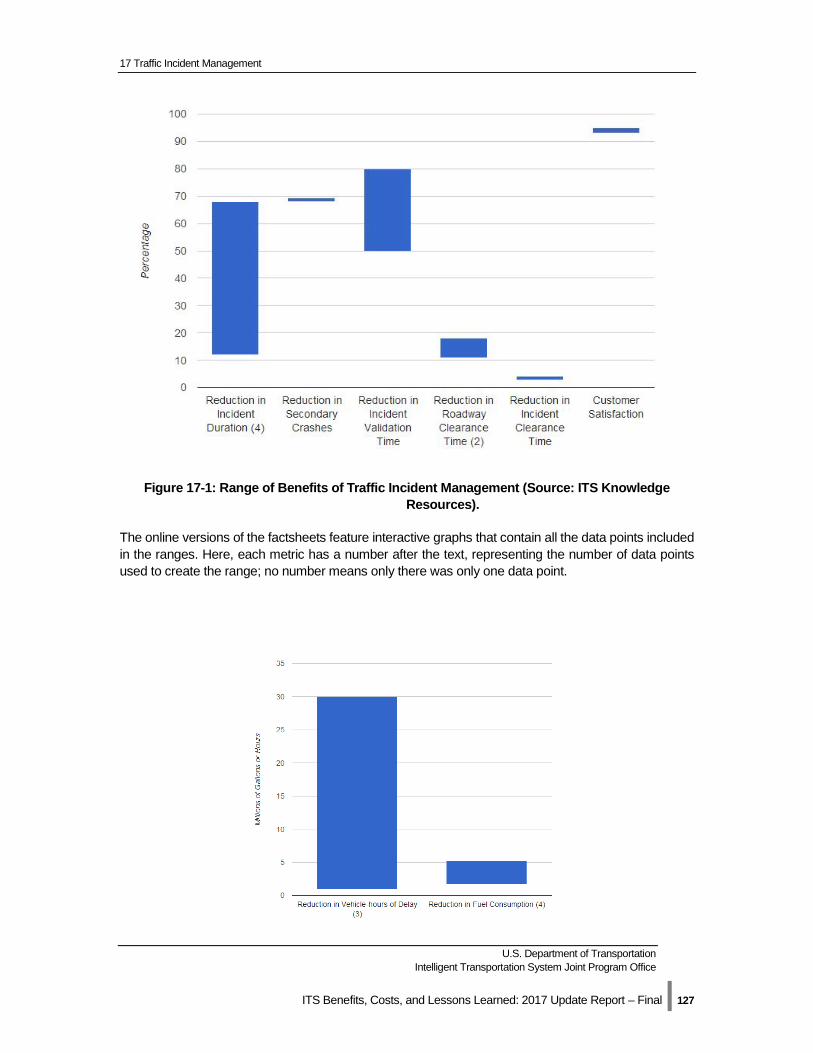
17 Traffic Incident Management
U.S. Department of Transportation Intelligent Transportation System Joint Program Office
ITS Benefits, Costs, and Lessons Learned: 2017 Update Report – Final | 127
Figure 17-1: Range of Benefits of Traffic Incident Management (Source: ITS Knowledge Resources).
The online versions of the factsheets feature interactive graphs that contain all the data points included in the ranges. Here, each metric has a number after the text, representing the number of data points used to create the range; no number means only there was only one data point.
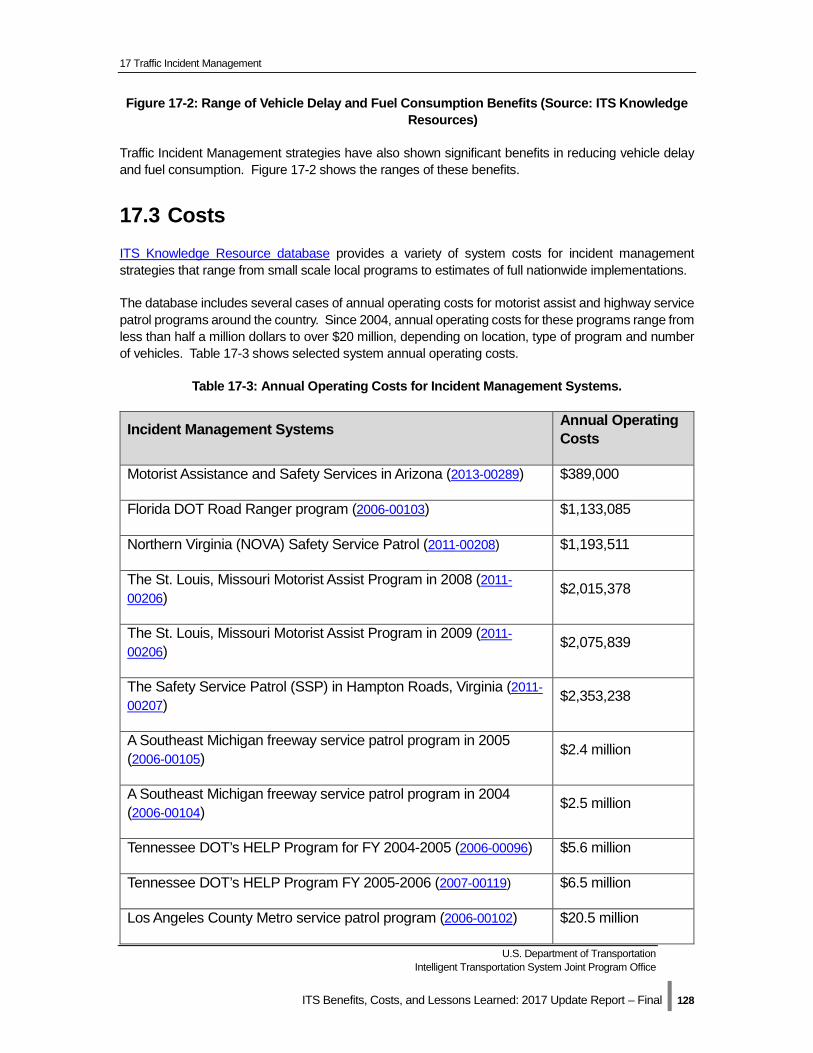
17 Traffic Incident Management
U.S. Department of Transportation Intelligent Transportation System Joint Program Office
ITS Benefits, Costs, and Lessons Learned: 2017 Update Report – Final | 128
Figure 17-2: Range of Vehicle Delay and Fuel Consumption Benefits (Source: ITS Knowledge Resources)
Traffic Incident Management strategies have also shown significant benefits in reducing vehicle delay and fuel consumption. Figure 17-2 shows the ranges of these benefits.
17.3 Costs ITS Knowledge Resource database provides a variety of system costs for incident management strategies that range from small scale local programs to estimates of full nationwide implementations.
The database includes several cases of annual operating costs for motorist assist and highway service patrol programs around the country. Since 2004, annual operating costs for these programs range from less than half a million dollars to over $20 million, depending on location, type of program and number of vehicles. Table 17-3 shows selected system annual operating costs.
Table 17-3: Annual Operating Costs for Incident Management Systems.
Incident Management Systems Annual Operating Costs
Motorist Assistance and Safety Services in Arizona (2013-00289) $389,000
Florida DOT Road Ranger program (2006-00103) $1,133,085
Northern Virginia (NOVA) Safety Service Patrol (2011-00208) $1,193,511
The St. Louis, Missouri Motorist Assist Program in 2008 (2011-00206) $2,015,378
The St. Louis, Missouri Motorist Assist Program in 2009 (2011-00206) $2,075,839
The Safety Service Patrol (SSP) in Hampton Roads, Virginia (2011-00207) $2,353,238
A Southeast Michigan freeway service patrol program in 2005 (2006-00105) $2.4 million
A Southeast Michigan freeway service patrol program in 2004 (2006-00104) $2.5 million
Tennessee DOT’s HELP Program for FY 2004-2005 (2006-00096) $5.6 million
Tennessee DOT’s HELP Program FY 2005-2006 (2007-00119) $6.5 million
Los Angeles County Metro service patrol program (2006-00102) $20.5 million
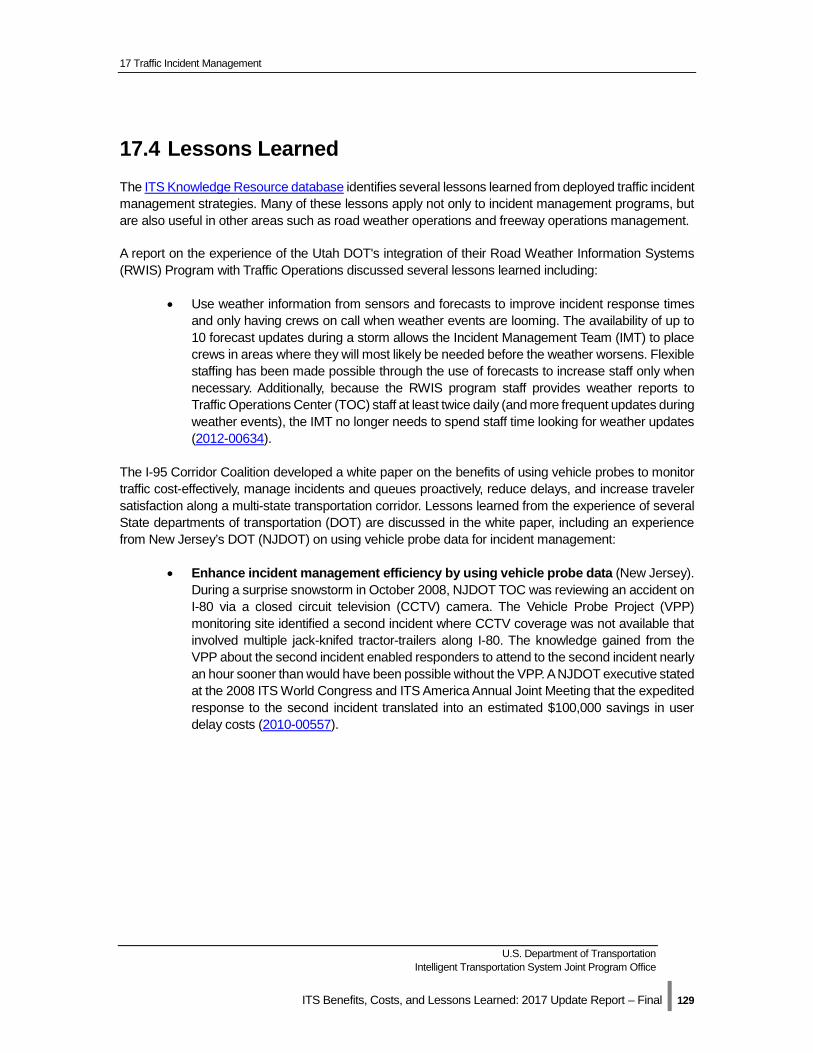
17 Traffic Incident Management
U.S. Department of Transportation Intelligent Transportation System Joint Program Office
ITS Benefits, Costs, and Lessons Learned: 2017 Update Report – Final | 129
17.4 Lessons Learned The ITS Knowledge Resource database identifies several lessons learned from deployed traffic incident management strategies. Many of these lessons apply not only to incident management programs, but are also useful in other areas such as road weather operations and freeway operations management.
A report on the experience of the Utah DOT's integration of their Road Weather Information Systems (RWIS) Program with Traffic Operations discussed several lessons learned including:
• Use weather information from sensors and forecasts to improve incident response times and only having crews on call when weather events are looming. The availability of up to 10 forecast updates during a storm allows the Incident Management Team (IMT) to place crews in areas where they will most likely be needed before the weather worsens. Flexible staffing has been made possible through the use of forecasts to increase staff only when necessary. Additionally, because the RWIS program staff provides weather reports to Traffic Operations Center (TOC) staff at least twice daily (and more frequent updates during weather events), the IMT no longer needs to spend staff time looking for weather updates (2012-00634).
The I-95 Corridor Coalition developed a white paper on the benefits of using vehicle probes to monitor traffic cost-effectively, manage incidents and queues proactively, reduce delays, and increase traveler satisfaction along a multi-state transportation corridor. Lessons learned from the experience of several State departments of transportation (DOT) are discussed in the white paper, including an experience from New Jersey’s DOT (NJDOT) on using vehicle probe data for incident management:
• Enhance incident management efficiency by using vehicle probe data (New Jersey). During a surprise snowstorm in October 2008, NJDOT TOC was reviewing an accident on I-80 via a closed circuit television (CCTV) camera. The Vehicle Probe Project (VPP) monitoring site identified a second incident where CCTV coverage was not available that involved multiple jack-knifed tractor-trailers along I-80. The knowledge gained from the VPP about the second incident enabled responders to attend to the second incident nearly an hour sooner than would have been possible without the VPP. A NJDOT executive stated at the 2008 ITS World Congress and ITS America Annual Joint Meeting that the expedited response to the second incident translated into an estimated $100,000 savings in user delay costs (2010-00557).
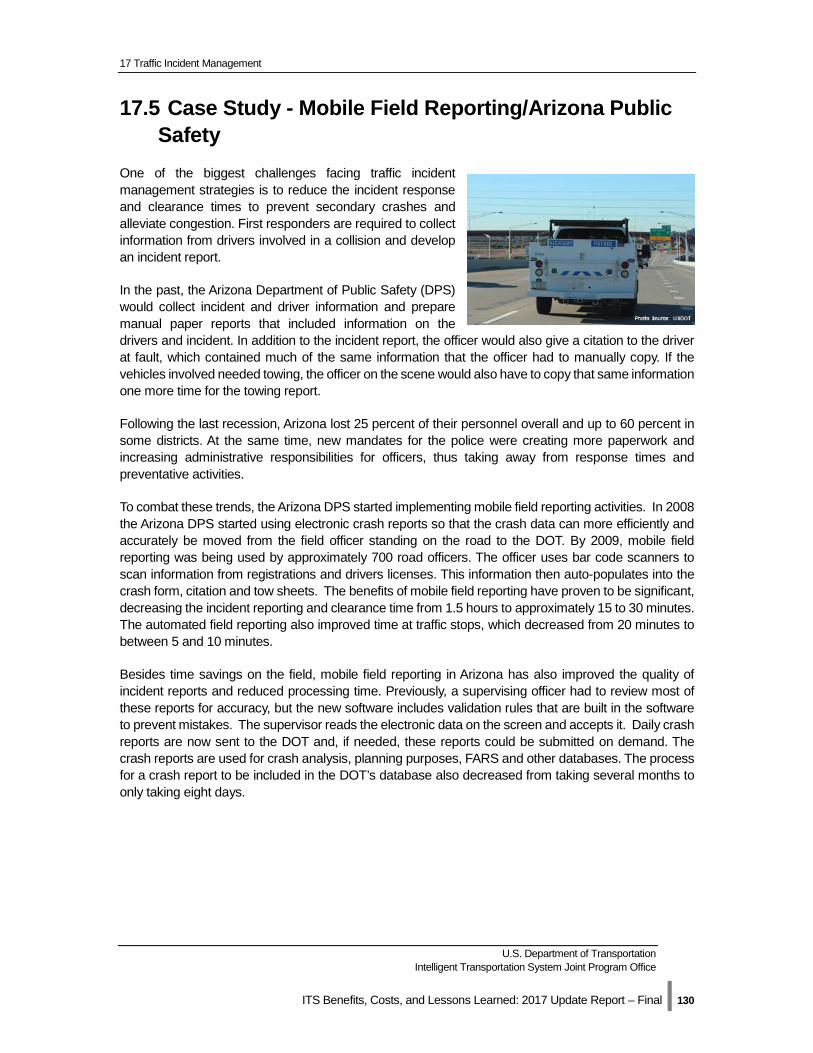
17 Traffic Incident Management
U.S. Department of Transportation Intelligent Transportation System Joint Program Office
ITS Benefits, Costs, and Lessons Learned: 2017 Update Report – Final | 130
17.5 Case Study - Mobile Field Reporting/Arizona Public Safety
One of the biggest challenges facing traffic incident management strategies is to reduce the incident response and clearance times to prevent secondary crashes and alleviate congestion. First responders are required to collect information from drivers involved in a collision and develop an incident report.
In the past, the Arizona Department of Public Safety (DPS) would collect incident and driver information and prepare manual paper reports that included information on the drivers and incident. In addition to the incident report, the officer would also give a citation to the driver at fault, which contained much of the same information that the officer had to manually copy. If the vehicles involved needed towing, the officer on the scene would also have to copy that same information one more time for the towing report.
Following the last recession, Arizona lost 25 percent of their personnel overall and up to 60 percent in some districts. At the same time, new mandates for the police were creating more paperwork and increasing administrative responsibilities for officers, thus taking away from response times and preventative activities.
To combat these trends, the Arizona DPS started implementing mobile field reporting activities. In 2008 the Arizona DPS started using electronic crash reports so that the crash data can more efficiently and accurately be moved from the field officer standing on the road to the DOT. By 2009, mobile field reporting was being used by approximately 700 road officers. The officer uses bar code scanners to scan information from registrations and drivers licenses. This information then auto-populates into the crash form, citation and tow sheets. The benefits of mobile field reporting have proven to be significant, decreasing the incident reporting and clearance time from 1.5 hours to approximately 15 to 30 minutes. The automated field reporting also improved time at traffic stops, which decreased from 20 minutes to between 5 and 10 minutes.
Besides time savings on the field, mobile field reporting in Arizona has also improved the quality of incident reports and reduced processing time. Previously, a supervising officer had to review most of these reports for accuracy, but the new software includes validation rules that are built in the software to prevent mistakes. The supervisor reads the electronic data on the screen and accepts it. Daily crash reports are now sent to the DOT and, if needed, these reports could be submitted on demand. The crash reports are used for crash analysis, planning purposes, FARS and other databases. The process for a crash report to be included in the DOT’s database also decreased from taking several months to only taking eight days.
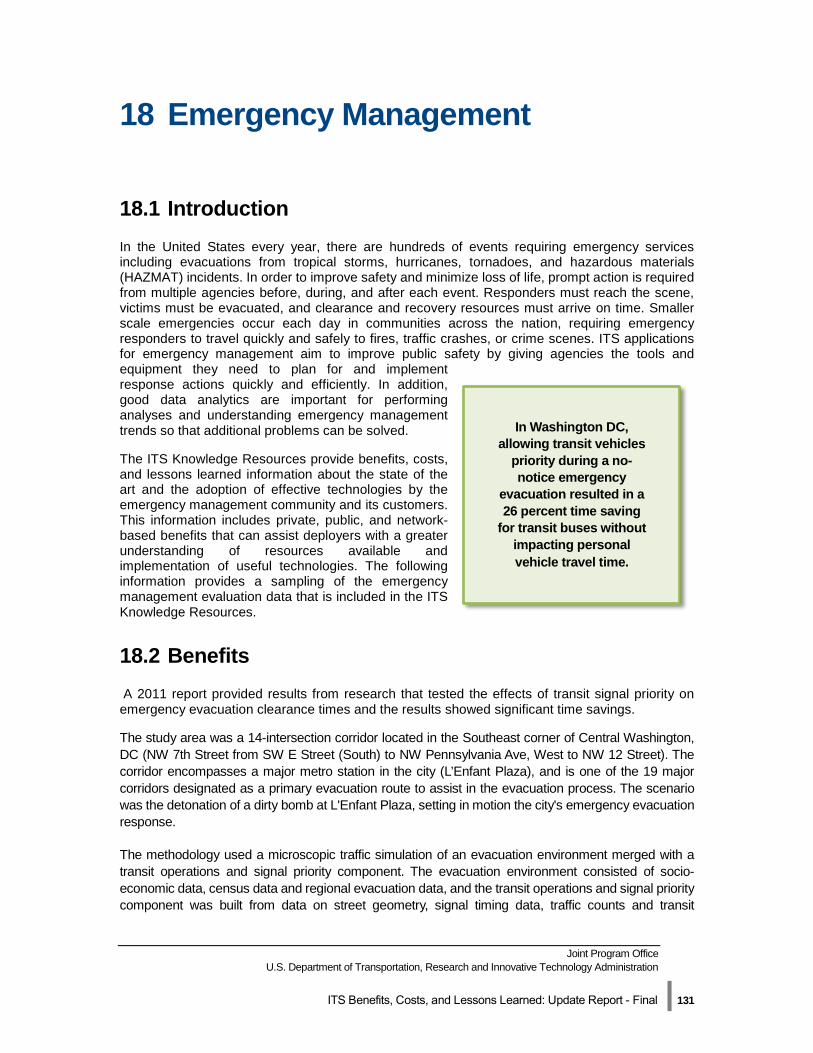
Joint Program Office U.S. Department of Transportation, Research and Innovative Technology Administration
ITS Benefits, Costs, and Lessons Learned: Update Report - Final | 131
18 Emergency Management
18.1 Introduction In the United States every year, there are hundreds of events requiring emergency services including evacuations from tropical storms, hurricanes, tornadoes, and hazardous materials (HAZMAT) incidents. In order to improve safety and minimize loss of life, prompt action is required from multiple agencies before, during, and after each event. Responders must reach the scene, victims must be evacuated, and clearance and recovery resources must arrive on time. Smaller scale emergencies occur each day in communities across the nation, requiring emergency responders to travel quickly and safely to fires, traffic crashes, or crime scenes. ITS applications for emergency management aim to improve public safety by giving agencies the tools and equipment they need to plan for and implement response actions quickly and efficiently. In addition, good data analytics are important for performing analyses and understanding emergency management trends so that additional problems can be solved.
The ITS Knowledge Resources provide benefits, costs, and lessons learned information about the state of the art and the adoption of effective technologies by the emergency management community and its customers. This information includes private, public, and network-based benefits that can assist deployers with a greater understanding of resources available and implementation of useful technologies. The following information provides a sampling of the emergency management evaluation data that is included in the ITS Knowledge Resources.
18.2 Benefits A 2011 report provided results from research that tested the effects of transit signal priority on emergency evacuation clearance times and the results showed significant time savings.
The study area was a 14-intersection corridor located in the Southeast corner of Central Washington, DC (NW 7th Street from SW E Street (South) to NW Pennsylvania Ave, West to NW 12 Street). The corridor encompasses a major metro station in the city (L’Enfant Plaza), and is one of the 19 major corridors designated as a primary evacuation route to assist in the evacuation process. The scenario was the detonation of a dirty bomb at L'Enfant Plaza, setting in motion the city's emergency evacuation response.
The methodology used a microscopic traffic simulation of an evacuation environment merged with a transit operations and signal priority component. The evacuation environment consisted of socio-economic data, census data and regional evacuation data, and the transit operations and signal priority component was built from data on street geometry, signal timing data, traffic counts and transit
In Washington DC, allowing transit vehicles
priority during a no-notice emergency
evacuation resulted in a 26 percent time saving
for transit buses without impacting personal vehicle travel time.
18 Emergency Management
U.S. Department of Transportation Intelligent Transportation System Joint Program Office
ITS Benefits, Costs, and Lessons Learned: 2017 Update Report – Final | 132
information (schedule, stop location, dwell time, etc.). These models generated an evacuation origin destination (O-D) matrix to create a realistic emergency evacuation traffic model with measures of effectiveness (MOEs) including travel time, evacuation clearance time, and delay time. The simulation network included 17 of the 34 bus lines within the borders of the study area. The bus lines not included were those that do not require priority (right hand turns only) or do not use more than one intersection within the study corridor.
Allowing transit signal priority during the evacuation resulted in a 26 percent time savings for transit buses, meaning that three prioritized vehicles accomplish the same as four would without priority. The 26 percent time savings enables more transit units to make additional trips, resulting in shorter evacuation times. The results also found that the time saving is achieved without having an impact on evacuation clearance times or evacuee travel times for non-transit vehicles. Moreover, when transit signal priority is restricted to operate only on evacuation routes, evacuee travel and delay time decreases (in contrast to previous studies that found transit priority results in delays to vehicular traffic during high roadway demand) (2012-00784).
18.3 Costs The I-95 Corridor Coalition of states in the northeastern U.S. work together on initiatives to improve highway travel. The Coalition published a report in 2010 documenting one initiative to improve the collection and accuracy of crash data because of the importance of this data to many agencies including departments of transportation, law enforcement, and emergency services for both planning and operations based decision making. The Crash Data Reporting Methods (Final Report) provides data on crash reporting practices for the 17 states in the coalition. One of many examples provided in the report is the implementation of a crash data system in Virginia with results shown below in Table 18-1 (2013-00280).
Table 18-1: Virginia Crash Data System Costs.
18 Emergency Management
U.S. Department of Transportation Intelligent Transportation System Joint Program Office
ITS Benefits, Costs, and Lessons Learned: 2017 Update Report – Final | 133
Component Cost
Fees for a consulting team to plan, design, develop and implement a new Traffic Records Electronic Data System (TREDS) (estimated 2006-2009)
$2 million
TREDS software, system maintenance, and training to begin the design of comprehensive traffic records automated system
$116,462
Cost to reduce the backlog of crash reports in the TREDS crash database and subsequently, its roadway database
$66,000
Cost to change, reprint, and distribute the Model Minimum Uniform Crash Criteria (MMUCC) compliant, scannable police crash form
$37,000
Provide statewide train-the-trainer training on the new FR300 Police Crash Report to over 400 local and state law enforcement trainers
$20,000
Staff to perform database programming modifications in the State's crash database and Centralized Accident Processing System (CAP) to enable collection of new fields and attributes from the new FR300P
$26,737
TOTAL $2.27 million
18.4 Lessons Learned Utilize transportation tools in communications, traffic control, and monitoring and prediction to maximize the ability of the highway network to support evacuation operations.
There are a multitude of transportation tools that can support evacuation operations in emergencies with advance notice. As the agency responsible for emergency management develops emergency response plans, it is useful to review the array of transportation tools available for support in emergencies. For example, transportation tools for communicating with the public can support emergency management’s effort in communicating evacuation orders to the public. Similarly, tools that help manage traffic operations can be used in emergency operations for the purpose of increasing traffic capacity on evacuation routes and responding to traffic incidents that can harm the evacuation effort by blocking traffic. As the evacuation is ongoing, emergency management can use monitoring/predicting tools for monitoring conditions and predicting outcomes. These tools can improve the response team’s situational awareness of the progress of the evacuation, help identify potential problem areas and determine optimal evacuation routes. Perhaps the most important message is that governments need a variety of tools at their disposal and the ability to choose which to use in an evacuation. The transportation tools listed below are identified by the FHWA as having potential to support emergency evacuations with advanced notices.
18 Emergency Management
U.S. Department of Transportation Intelligent Transportation System Joint Program Office
ITS Benefits, Costs, and Lessons Learned: 2017 Update Report – Final | 134
• Communication Tools. A critical element in emergency evacuations is the ability for emergency response officials to communicate to all segments of the population in the evacuation zone.
• Traffic Control Tools. The efficient and safe management of the highway network is a critical component of successful emergency evacuations. Traffic control tools can be used to manage highway operations in controlling traffic, assessing levels of congestion, responding and clearing incidents and optimizing traffic flow.
• Assessment Monitoring and Prediction Tools. The transportation community has generated advanced computerized modeling tools that can be used in evacuation planning and operations to predict weather, estimate losses and damages from weather events, evaluate evacuation plans and model traffic scenarios.
These tools can improve evacuation operations in communications, traffic control, and assessment and monitoring. They can be used in the readiness, activation and operations phase of the evacuation. To be used as effectively as possible, evacuation plans should identify which tools are available in the jurisdiction and how they can be used most effectively. By planning ahead, emergency management can use transportation tools to improve the safety, mobility, and efficiency of emergency evacuations with advance notice (2008-00461)
18.5 Case Study – R.E.S.C.U.M.E. Response, Emergency Staging and Communications, Uniform Management, and Evacuation (R.E.S.C.U.M.E) is a bundle of dynamic mobility applications (DMA) that utilizes real-time connected vehicle data to improve traffic safety and mobility during crashes and other emergencies that affect the highway network. The following component applications have been studied to assess the potential benefits of leveraging wireless connectivity, center-to-center communications, and center-to-field communications to solve problems faced by emergency management agencies, emergency medical services (EMS), public agencies, and emergency care givers and persons requiring assistance.
• Incident Scene Pre-Arrival Staging Guidance for Emergency Responders (RESP-STG) applications use real-time modeling outputs, satellite imagery, GIS data, and current weather data at dispatch centers to improve emergency responder routing, staging, and secondary dispatch decisions.
• Incident Scene Work Zone Alerts for Drivers and Workers (INC-ZONE) applications use portable roadside detection systems, wireless communications, and in-vehicle messaging systems to provide drivers with merging and speed guidance as they approach work zone control areas. Audible alarm systems can also be integrated into worker handset radios and maintenance vehicle horn systems to alert workers if a vehicle is detected approaching the work zone at an unsafe speed or trajectory.
• Emergency Communications and Evacuation (EVAC) applications use traveler information systems to provide travelers with information on traffic and road conditions and the location of available lodging, fuel, food, water, cash machines, and other necessities required to plan an evacuation. By providing this information, EVAC strives to enable evacuees to reach destinations faster, reduce overall congestion and delay, and reduce the number of stops required for refueling.
Key Findings
Simulation studies of RESP-STG and INC-ZONE applications performed on an 8.5-mile section of US 101 in San Mateo County, California showed that for long incident scenarios, incident scene guidance

18 Emergency Management
U.S. Department of Transportation Intelligent Transportation System Joint Program Office
ITS Benefits, Costs, and Lessons Learned: 2017 Update Report – Final | 135
alerts through connected vehicle applications can reduce network delay by up to 14 percent and decrease travel time for emergency vehicles by up to 23 percent (2015-01048).
A simulation study that evaluated EVAC operations as if connected vehicle systems were in place during the Katrina evacuation of New Orleans in 2005 revealed that EVAC has the potential to reduce congestion by approximately 20 percent during major evacuation operations that involve large metropolitan areas (2015-01047).
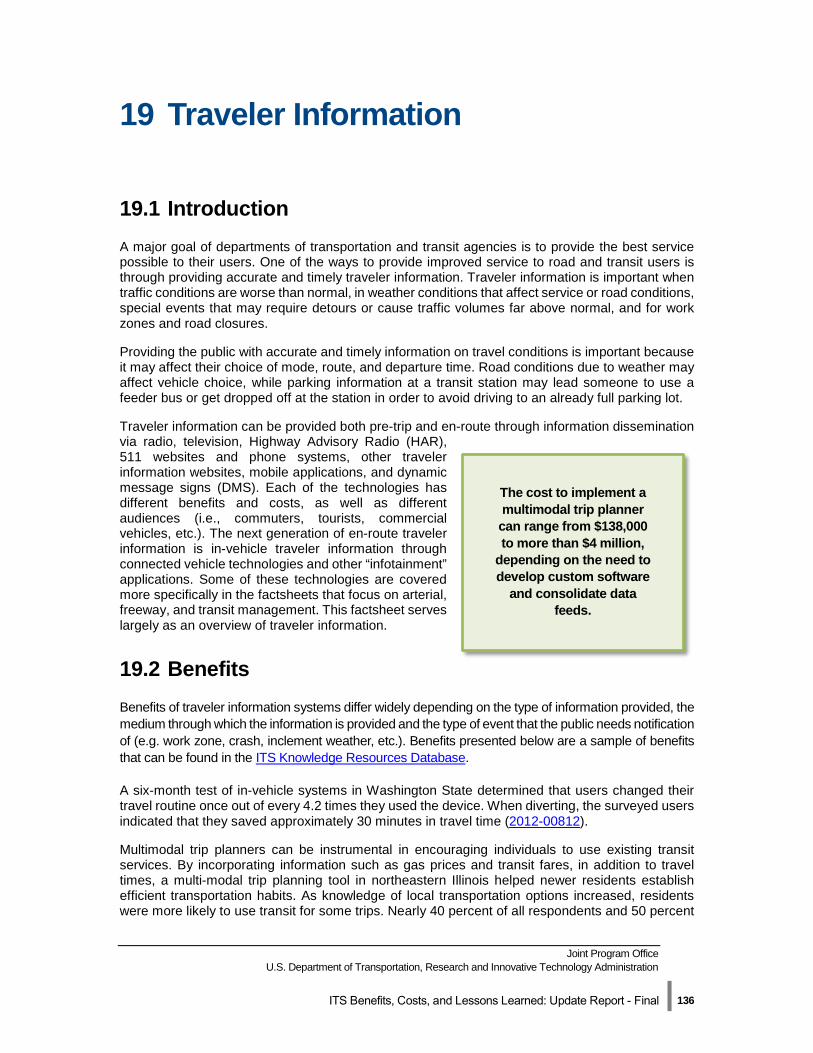
Joint Program Office U.S. Department of Transportation, Research and Innovative Technology Administration
ITS Benefits, Costs, and Lessons Learned: Update Report - Final | 136
19 Traveler Information
19.1 Introduction A major goal of departments of transportation and transit agencies is to provide the best service possible to their users. One of the ways to provide improved service to road and transit users is through providing accurate and timely traveler information. Traveler information is important when traffic conditions are worse than normal, in weather conditions that affect service or road conditions, special events that may require detours or cause traffic volumes far above normal, and for work zones and road closures.
Providing the public with accurate and timely information on travel conditions is important because it may affect their choice of mode, route, and departure time. Road conditions due to weather may affect vehicle choice, while parking information at a transit station may lead someone to use a feeder bus or get dropped off at the station in order to avoid driving to an already full parking lot.
Traveler information can be provided both pre-trip and en-route through information dissemination via radio, television, Highway Advisory Radio (HAR), 511 websites and phone systems, other traveler information websites, mobile applications, and dynamic message signs (DMS). Each of the technologies has different benefits and costs, as well as different audiences (i.e., commuters, tourists, commercial vehicles, etc.). The next generation of en-route traveler information is in-vehicle traveler information through connected vehicle technologies and other “infotainment” applications. Some of these technologies are covered more specifically in the factsheets that focus on arterial, freeway, and transit management. This factsheet serves largely as an overview of traveler information.
19.2 Benefits Benefits of traveler information systems differ widely depending on the type of information provided, the medium through which the information is provided and the type of event that the public needs notification of (e.g. work zone, crash, inclement weather, etc.). Benefits presented below are a sample of benefits that can be found in the ITS Knowledge Resources Database.
A six-month test of in-vehicle systems in Washington State determined that users changed their travel routine once out of every 4.2 times they used the device. When diverting, the surveyed users indicated that they saved approximately 30 minutes in travel time (2012-00812).
Multimodal trip planners can be instrumental in encouraging individuals to use existing transit services. By incorporating information such as gas prices and transit fares, in addition to travel times, a multi-modal trip planning tool in northeastern Illinois helped newer residents establish efficient transportation habits. As knowledge of local transportation options increased, residents were more likely to use transit for some trips. Nearly 40 percent of all respondents and 50 percent
The cost to implement a multimodal trip planner can range from $138,000 to more than $4 million,
depending on the need to develop custom software
and consolidate data feeds.
19 Traveler Information
U.S. Department of Transportation Intelligent Transportation System Joint Program Office
ITS Benefits, Costs, and Lessons Learned: 2017 Update Report – Final | 137
of suburban respondents reported using at least one transit service that they did not usually use as a result of using the trip planning tool (2012-00794).
The Washington State DOT (WSDOT) placed data collection devices on heavily-congested areas of SR 512 and I-5 in the Olympic Region. The data collected from those devices were displayed in two places on WSDOT's website, on the state's 511 system and through the mobile phone application that WSDOT supports. 84 percent of survey respondents found traveler information provided by WSDOT useful, with 95 percent saying it should continue to collect and distribute travel congestion information (2013-00851).
SFPark, a smart parking systems (SPS) pilot program, works to provide San Francisco drivers with real-time information about available parking spaces. Sensors installed in the surface of each parking spot communicated with radio receptors about which spots were occupied. The information was then displayed to drivers via LED screens located outside of each lot and through the downloadable SFPark mobile app. Evaluation of the pilot indicated a 43 percent decrease in time spent looking for parking, as well as a 30 percent decrease in CO2 emissions during the parking task (2015-00983).
First launched by the Iowa DOT in 2002, Iowa 511 provides real-time information on road traffic conditions, accidents, road closures, road construction, weather conditions, and other information of interest to the public. As of 2015, the Iowa 511 system disseminates information to the public via phone service, websites, social networks, and mobile applications (apps). A study carried out by the Center for Transportation Research at Iowa State University assessed the Iowa 511 Traveler Information System using survey results and usage data for the 511 phone, websites, and mobile apps maintained by the Iowa DOT. This survey indicated that 66 percent of drivers changed their route following information provided by Iowa 511 system (2015-01051).
19.3 Costs Costs for Traveler Information systems vary widely based on the technologies used, as well as the quantity of each component used. The costs presented here are a sample of the system and unit costs available through the ITS Knowledge Resources Costs Database.
The Maine DOT updated its variable speed limit (VSL) system to include travel time information on Interstates I-95 and I-295 and surrounding arterials for $776,850. The VSL system was not part of
an integrated system, but it used a tiered approach that involved radar, camera, and dispatcher information to verify incidents and reinforce traffic management decisions for the corridor (2014-00331).
Alaska developed NewGen 511 to replace a previous pooled fund 511 system they had been using. The public website uses a web-based interactive map interface that enables the user to zoom and pan to see symbolized alerts for construction, accidents, and weather advisories. The Alaska 511 system also has a mobile-version of the website with reduced features for use by mobile device and low
bandwidth Internet users. It also utilizes RSS feeds to send alerts; a Facebook page; a Twitter account; an iPhone app; GovDelivery; and the traditional phone system. The system was designed to be multi-modal and includes information on Alaska’s Marine Highways. The phone system has
84 percent of Washington survey respondents found
freeway traveler information useful.
19 Traveler Information
U.S. Department of Transportation Intelligent Transportation System Joint Program Office
ITS Benefits, Costs, and Lessons Learned: 2017 Update Report – Final | 138
nearly doubled in call traffic since 2003. The system cost $440,000 to develop and $140,000 annually to operate (2012-00263).
Multi-modal trip planners can cost upwards of $4 million to develop for a metropolitan area. However, if systems are already in consolidated standardized databases and have feed access, there will be significantly reduced costs for development. In Oregon, TriMet used OpenTripPlanner and open source software to minimize costs and were able to develop their system for less than $150,000 (2011-00228).
19.4 Lessons Learned Delivering traveler information to the public requires different solutions that depend on the types of alerts that need to be disseminated and the ways in which the public can access it. However, there are many lessons learned from other projects that can be generally applicable to the development and deployment of traveler information systems. Below is a sample of lessons learned:
• Avoid unnecessarily restrictive requirements and ambiguous terms in bid documents. Minnesota DOT (MnDOT) requirements for a traveler information procurement for the I-35 corridor focused more on performance outcomes rather than detailed design specifications. This gave the contractor more ability to innovate and optimize the system (2014-00682).
• Monitoring traffic with vehicle probe data and coordinating traffic redirection in adjacent states can help motorists change routes prior to reaching congestion. Vehicle probe data help manage traffic within a state, but also across state boundaries, accruing regional benefits along a multi-state corridor. North Carolina used probe data to identify building congestion on I-85 in Virginia and coordinated with Virginia to coordinate redirection onto less congested, parallel routes (2010-00558).
• Design a trip planning website to capture and convey real-world factors such as gas prices and congestion information. Market research reviewed during the project indicated that travel time information was important to travelers, but it was not the sole reason for mode choice. Researchers indicated that a well-designed trip planning website should be more than just an itinerary-trip planner; it should be able to effectively capture and convey real-world factors that make transit an increasingly attractive option. Researchers noted there was an increased desire for real-time vehicle location information, predictions, and disruption notification information, particularly when travelers were en-route and using mobile devices (2012-00638).
• Develop a robust electronic interface for obtaining comprehensive incident information data from the highway patrol police organizations. Obtaining information from local police can help to provide more complete incident information to the public. The Florida Highway Patrol CAD data served as a valuable source of information for the iFlorida’s statewide traveler information service (2010-00541).
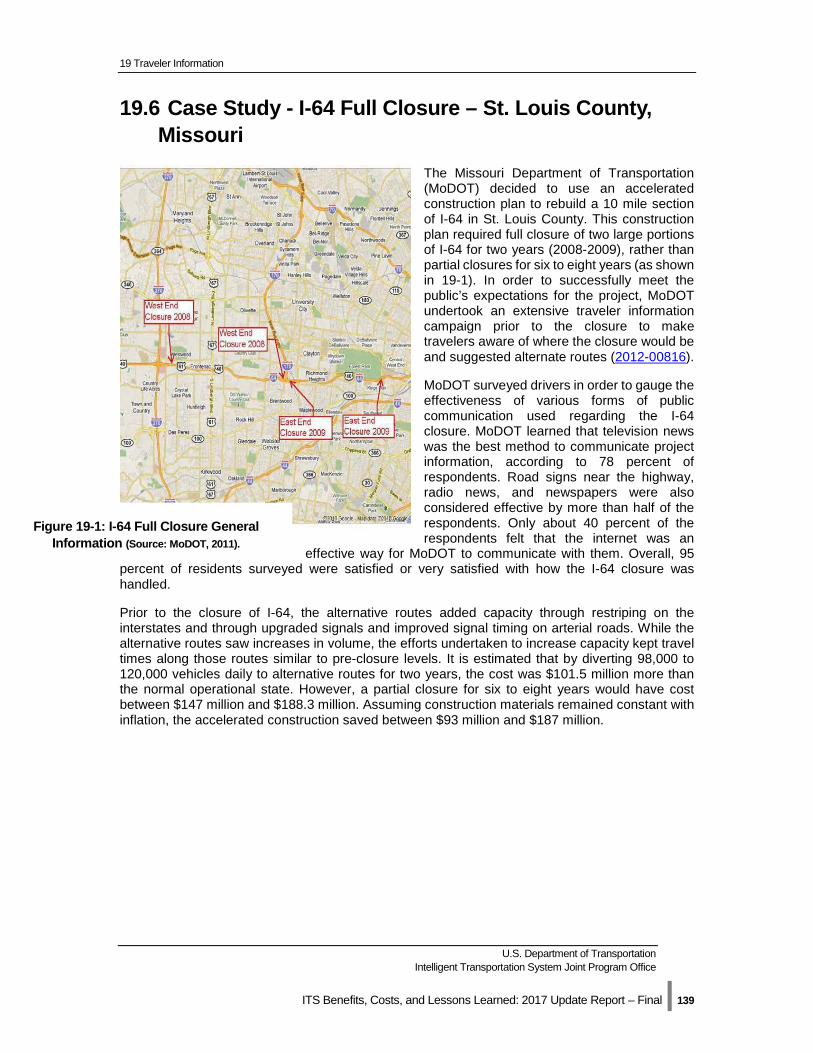
19 Traveler Information
U.S. Department of Transportation Intelligent Transportation System Joint Program Office
ITS Benefits, Costs, and Lessons Learned: 2017 Update Report – Final | 139
19.6 Case Study - I-64 Full Closure – St. Louis County, Missouri
The Missouri Department of Transportation (MoDOT) decided to use an accelerated construction plan to rebuild a 10 mile section of I-64 in St. Louis County. This construction plan required full closure of two large portions of I-64 for two years (2008-2009), rather than partial closures for six to eight years (as shown in 19-1). In order to successfully meet the public’s expectations for the project, MoDOT undertook an extensive traveler information campaign prior to the closure to make travelers aware of where the closure would be and suggested alternate routes (2012-00816).
MoDOT surveyed drivers in order to gauge the effectiveness of various forms of public communication used regarding the I-64 closure. MoDOT learned that television news was the best method to communicate project information, according to 78 percent of respondents. Road signs near the highway, radio news, and newspapers were also considered effective by more than half of the respondents. Only about 40 percent of the respondents felt that the internet was an
effective way for MoDOT to communicate with them. Overall, 95 percent of residents surveyed were satisfied or very satisfied with how the I-64 closure was handled.
Prior to the closure of I-64, the alternative routes added capacity through restriping on the interstates and through upgraded signals and improved signal timing on arterial roads. While the alternative routes saw increases in volume, the efforts undertaken to increase capacity kept travel times along those routes similar to pre-closure levels. It is estimated that by diverting 98,000 to 120,000 vehicles daily to alternative routes for two years, the cost was $101.5 million more than the normal operational state. However, a partial closure for six to eight years would have cost between $147 million and $188.3 million. Assuming construction materials remained constant with inflation, the accelerated construction saved between $93 million and $187 million.
Figure 19-1: I-64 Full Closure General Information (Source: MoDOT, 2011).
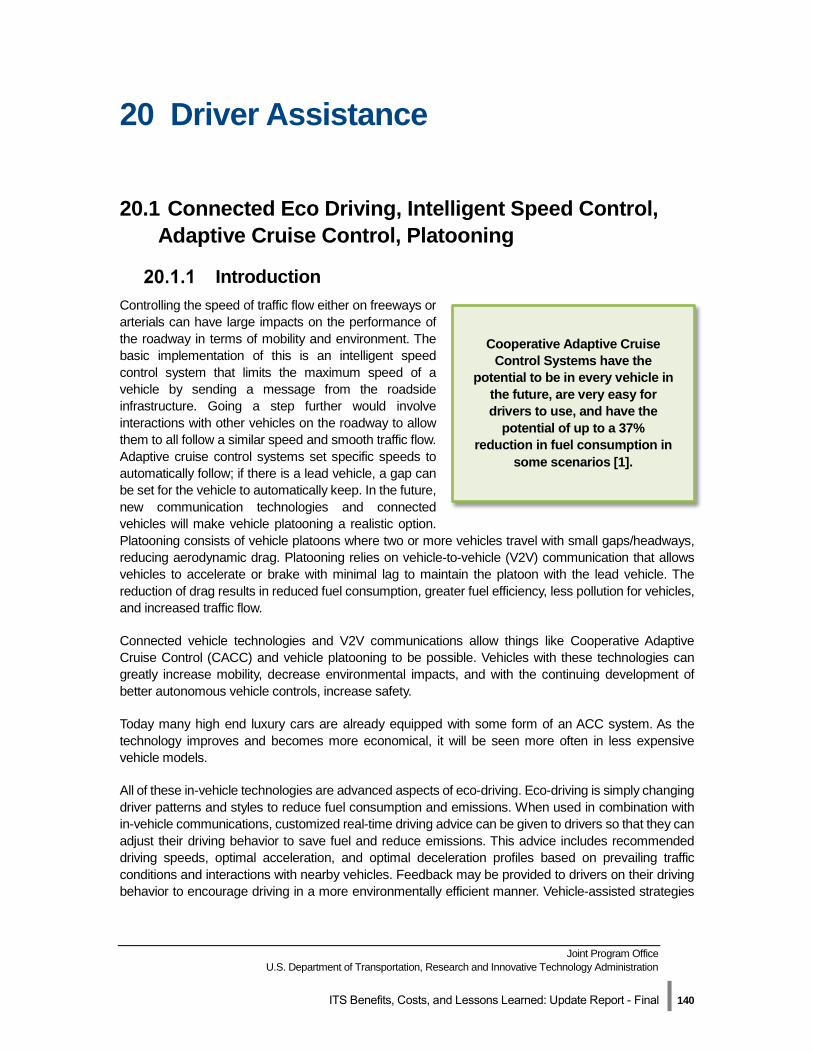
Joint Program Office U.S. Department of Transportation, Research and Innovative Technology Administration
ITS Benefits, Costs, and Lessons Learned: Update Report - Final | 140
20 Driver Assistance
20.1 Connected Eco Driving, Intelligent Speed Control, Adaptive Cruise Control, Platooning
Introduction Controlling the speed of traffic flow either on freeways or arterials can have large impacts on the performance of the roadway in terms of mobility and environment. The basic implementation of this is an intelligent speed control system that limits the maximum speed of a vehicle by sending a message from the roadside infrastructure. Going a step further would involve interactions with other vehicles on the roadway to allow them to all follow a similar speed and smooth traffic flow. Adaptive cruise control systems set specific speeds to automatically follow; if there is a lead vehicle, a gap can be set for the vehicle to automatically keep. In the future, new communication technologies and connected vehicles will make vehicle platooning a realistic option. Platooning consists of vehicle platoons where two or more vehicles travel with small gaps/headways, reducing aerodynamic drag. Platooning relies on vehicle-to-vehicle (V2V) communication that allows vehicles to accelerate or brake with minimal lag to maintain the platoon with the lead vehicle. The reduction of drag results in reduced fuel consumption, greater fuel efficiency, less pollution for vehicles, and increased traffic flow.
Connected vehicle technologies and V2V communications allow things like Cooperative Adaptive Cruise Control (CACC) and vehicle platooning to be possible. Vehicles with these technologies can greatly increase mobility, decrease environmental impacts, and with the continuing development of better autonomous vehicle controls, increase safety.
Today many high end luxury cars are already equipped with some form of an ACC system. As the technology improves and becomes more economical, it will be seen more often in less expensive vehicle models.
All of these in-vehicle technologies are advanced aspects of eco-driving. Eco-driving is simply changing driver patterns and styles to reduce fuel consumption and emissions. When used in combination with in-vehicle communications, customized real-time driving advice can be given to drivers so that they can adjust their driving behavior to save fuel and reduce emissions. This advice includes recommended driving speeds, optimal acceleration, and optimal deceleration profiles based on prevailing traffic conditions and interactions with nearby vehicles. Feedback may be provided to drivers on their driving behavior to encourage driving in a more environmentally efficient manner. Vehicle-assisted strategies
Cooperative Adaptive Cruise Control Systems have the
potential to be in every vehicle in the future, are very easy for drivers to use, and have the
potential of up to a 37% reduction in fuel consumption in
some scenarios [1].
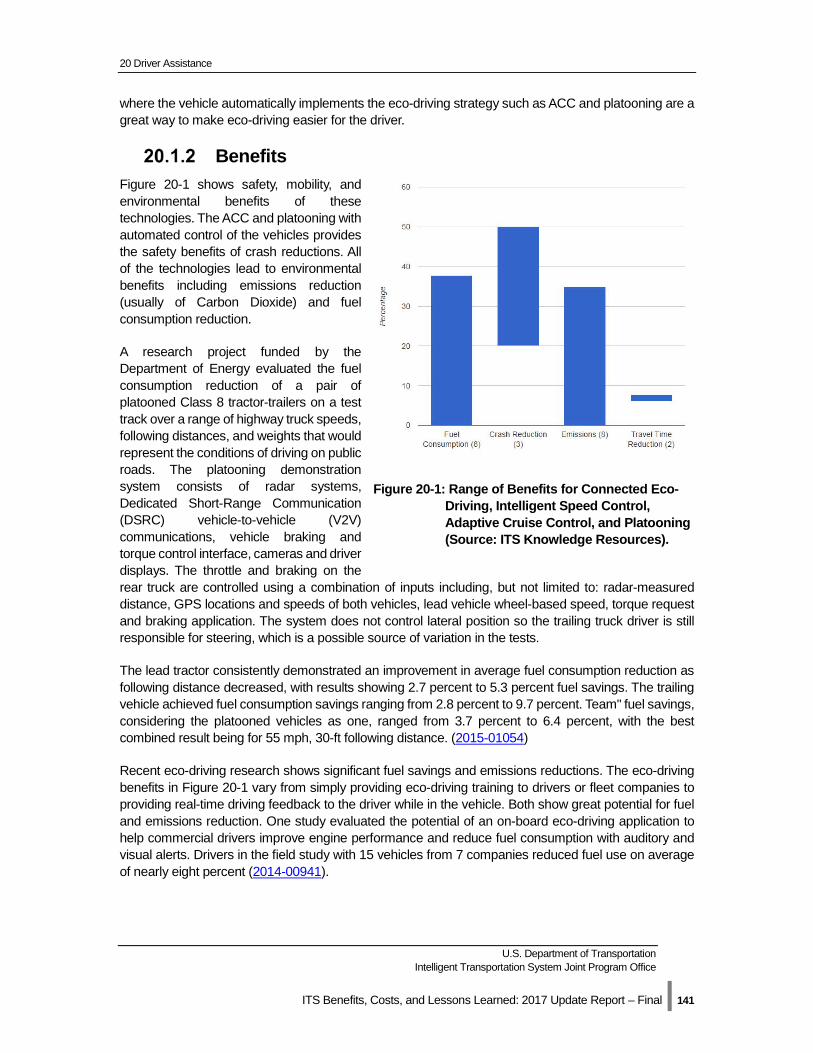
20 Driver Assistance
U.S. Department of Transportation Intelligent Transportation System Joint Program Office
ITS Benefits, Costs, and Lessons Learned: 2017 Update Report – Final | 141
where the vehicle automatically implements the eco-driving strategy such as ACC and platooning are a great way to make eco-driving easier for the driver.
Benefits Figure 20-1 shows safety, mobility, and environmental benefits of these technologies. The ACC and platooning with automated control of the vehicles provides the safety benefits of crash reductions. All of the technologies lead to environmental benefits including emissions reduction (usually of Carbon Dioxide) and fuel consumption reduction.
A research project funded by the Department of Energy evaluated the fuel consumption reduction of a pair of platooned Class 8 tractor-trailers on a test track over a range of highway truck speeds, following distances, and weights that would represent the conditions of driving on public roads. The platooning demonstration system consists of radar systems, Dedicated Short-Range Communication (DSRC) vehicle-to-vehicle (V2V) communications, vehicle braking and torque control interface, cameras and driver displays. The throttle and braking on the rear truck are controlled using a combination of inputs including, but not limited to: radar-measured distance, GPS locations and speeds of both vehicles, lead vehicle wheel-based speed, torque request and braking application. The system does not control lateral position so the trailing truck driver is still responsible for steering, which is a possible source of variation in the tests.
The lead tractor consistently demonstrated an improvement in average fuel consumption reduction as following distance decreased, with results showing 2.7 percent to 5.3 percent fuel savings. The trailing vehicle achieved fuel consumption savings ranging from 2.8 percent to 9.7 percent. Team" fuel savings, considering the platooned vehicles as one, ranged from 3.7 percent to 6.4 percent, with the best combined result being for 55 mph, 30-ft following distance. (2015-01054)
Recent eco-driving research shows significant fuel savings and emissions reductions. The eco-driving benefits in Figure 20-1 vary from simply providing eco-driving training to drivers or fleet companies to providing real-time driving feedback to the driver while in the vehicle. Both show great potential for fuel and emissions reduction. One study evaluated the potential of an on-board eco-driving application to help commercial drivers improve engine performance and reduce fuel consumption with auditory and visual alerts. Drivers in the field study with 15 vehicles from 7 companies reduced fuel use on average of nearly eight percent (2014-00941).
Figure 20-1: Range of Benefits for Connected Eco-Driving, Intelligent Speed Control, Adaptive Cruise Control, and Platooning (Source: ITS Knowledge Resources).
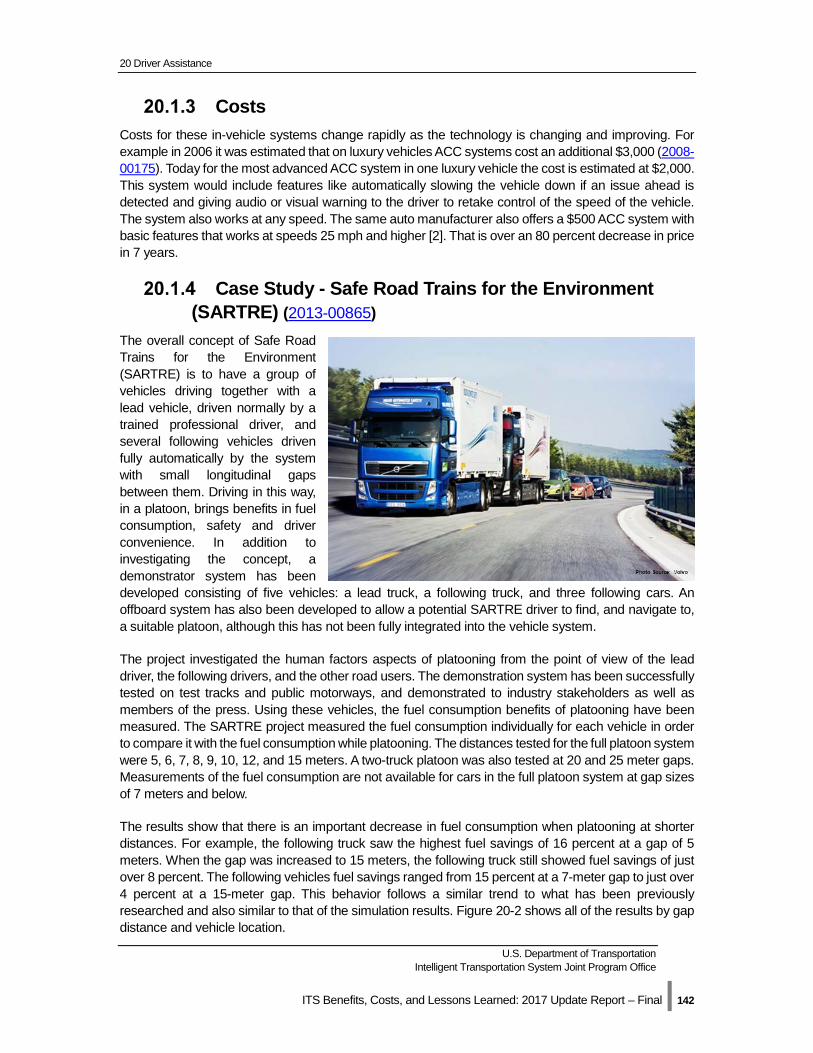
20 Driver Assistance
U.S. Department of Transportation Intelligent Transportation System Joint Program Office
ITS Benefits, Costs, and Lessons Learned: 2017 Update Report – Final | 142
Costs Costs for these in-vehicle systems change rapidly as the technology is changing and improving. For example in 2006 it was estimated that on luxury vehicles ACC systems cost an additional $3,000 (2008-00175). Today for the most advanced ACC system in one luxury vehicle the cost is estimated at $2,000. This system would include features like automatically slowing the vehicle down if an issue ahead is detected and giving audio or visual warning to the driver to retake control of the speed of the vehicle. The system also works at any speed. The same auto manufacturer also offers a $500 ACC system with basic features that works at speeds 25 mph and higher [2]. That is over an 80 percent decrease in price in 7 years.
Case Study - Safe Road Trains for the Environment (SARTRE) (2013-00865)
The overall concept of Safe Road Trains for the Environment (SARTRE) is to have a group of vehicles driving together with a lead vehicle, driven normally by a trained professional driver, and several following vehicles driven fully automatically by the system with small longitudinal gaps between them. Driving in this way, in a platoon, brings benefits in fuel consumption, safety and driver convenience. In addition to investigating the concept, a demonstrator system has been developed consisting of five vehicles: a lead truck, a following truck, and three following cars. An offboard system has also been developed to allow a potential SARTRE driver to find, and navigate to, a suitable platoon, although this has not been fully integrated into the vehicle system.
The project investigated the human factors aspects of platooning from the point of view of the lead driver, the following drivers, and the other road users. The demonstration system has been successfully tested on test tracks and public motorways, and demonstrated to industry stakeholders as well as members of the press. Using these vehicles, the fuel consumption benefits of platooning have been measured. The SARTRE project measured the fuel consumption individually for each vehicle in order to compare it with the fuel consumption while platooning. The distances tested for the full platoon system were 5, 6, 7, 8, 9, 10, 12, and 15 meters. A two-truck platoon was also tested at 20 and 25 meter gaps. Measurements of the fuel consumption are not available for cars in the full platoon system at gap sizes of 7 meters and below.
The results show that there is an important decrease in fuel consumption when platooning at shorter distances. For example, the following truck saw the highest fuel savings of 16 percent at a gap of 5 meters. When the gap was increased to 15 meters, the following truck still showed fuel savings of just over 8 percent. The following vehicles fuel savings ranged from 15 percent at a 7-meter gap to just over 4 percent at a 15-meter gap. This behavior follows a similar trend to what has been previously researched and also similar to that of the simulation results. Figure 20-2 shows all of the results by gap distance and vehicle location.
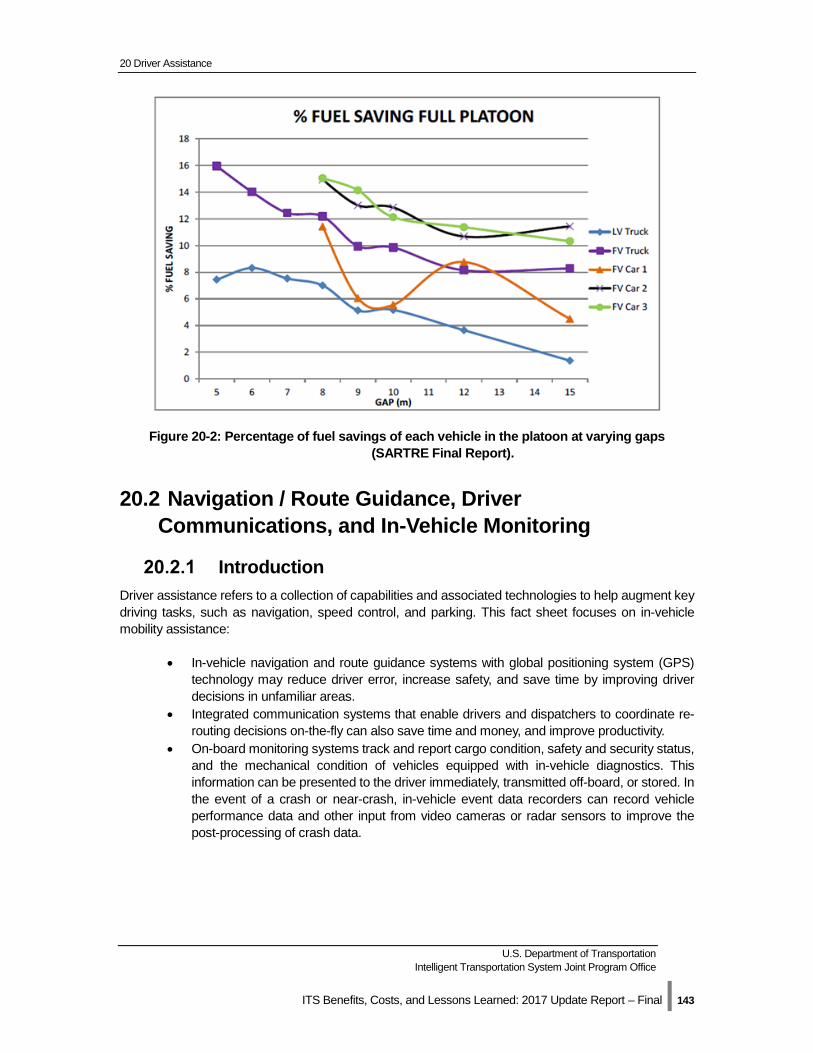
20 Driver Assistance
U.S. Department of Transportation Intelligent Transportation System Joint Program Office
ITS Benefits, Costs, and Lessons Learned: 2017 Update Report – Final | 143
Figure 20-2: Percentage of fuel savings of each vehicle in the platoon at varying gaps (SARTRE Final Report).
20.2 Navigation / Route Guidance, Driver Communications, and In-Vehicle Monitoring
Introduction Driver assistance refers to a collection of capabilities and associated technologies to help augment key driving tasks, such as navigation, speed control, and parking. This fact sheet focuses on in-vehicle mobility assistance:
• In-vehicle navigation and route guidance systems with global positioning system (GPS) technology may reduce driver error, increase safety, and save time by improving driver decisions in unfamiliar areas.
• Integrated communication systems that enable drivers and dispatchers to coordinate re-routing decisions on-the-fly can also save time and money, and improve productivity.
• On-board monitoring systems track and report cargo condition, safety and security status, and the mechanical condition of vehicles equipped with in-vehicle diagnostics. This information can be presented to the driver immediately, transmitted off-board, or stored. In the event of a crash or near-crash, in-vehicle event data recorders can record vehicle performance data and other input from video cameras or radar sensors to improve the post-processing of crash data.
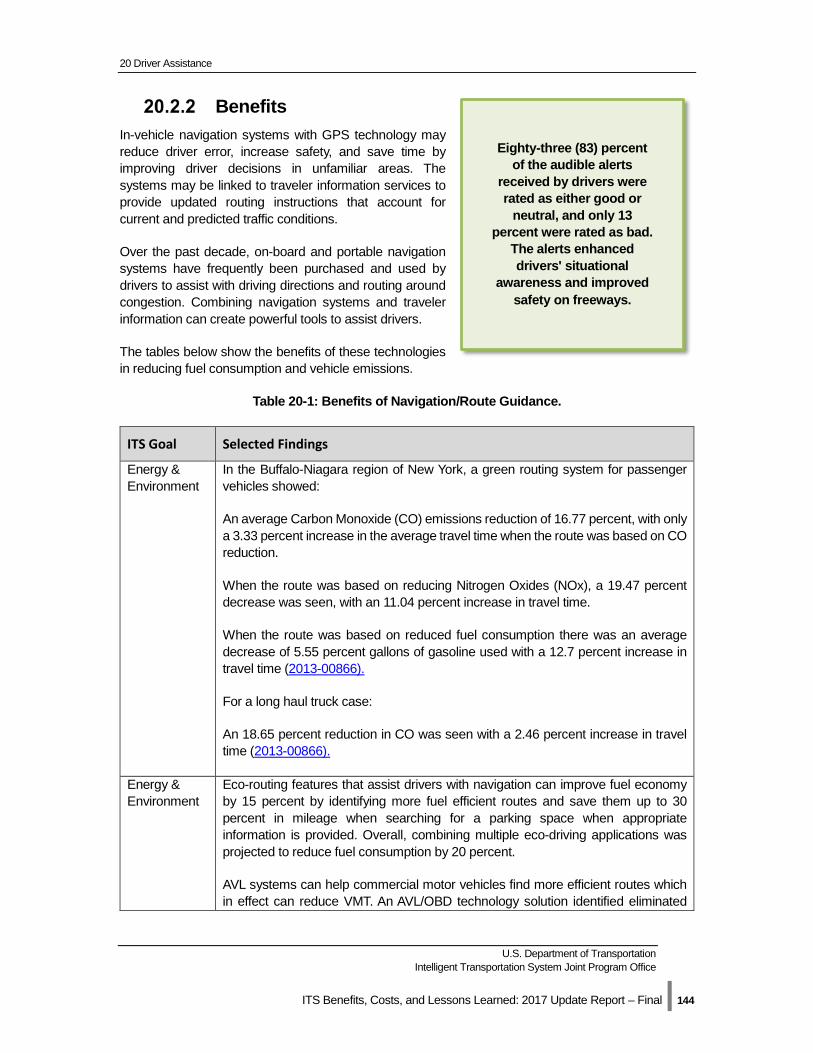
20 Driver Assistance
U.S. Department of Transportation Intelligent Transportation System Joint Program Office
ITS Benefits, Costs, and Lessons Learned: 2017 Update Report – Final | 144
Benefits In-vehicle navigation systems with GPS technology may reduce driver error, increase safety, and save time by improving driver decisions in unfamiliar areas. The systems may be linked to traveler information services to provide updated routing instructions that account for current and predicted traffic conditions.
Over the past decade, on-board and portable navigation systems have frequently been purchased and used by drivers to assist with driving directions and routing around congestion. Combining navigation systems and traveler information can create powerful tools to assist drivers.
The tables below show the benefits of these technologies in reducing fuel consumption and vehicle emissions.
Table 20-1: Benefits of Navigation/Route Guidance.
ITS Goal Selected Findings
Energy & Environment
In the Buffalo-Niagara region of New York, a green routing system for passenger vehicles showed:
An average Carbon Monoxide (CO) emissions reduction of 16.77 percent, with only a 3.33 percent increase in the average travel time when the route was based on CO reduction.
When the route was based on reducing Nitrogen Oxides (NOx), a 19.47 percent decrease was seen, with an 11.04 percent increase in travel time.
When the route was based on reduced fuel consumption there was an average decrease of 5.55 percent gallons of gasoline used with a 12.7 percent increase in travel time (2013-00866).
For a long haul truck case:
An 18.65 percent reduction in CO was seen with a 2.46 percent increase in travel time (2013-00866).
Energy & Environment
Eco-routing features that assist drivers with navigation can improve fuel economy by 15 percent by identifying more fuel efficient routes and save them up to 30 percent in mileage when searching for a parking space when appropriate information is provided. Overall, combining multiple eco-driving applications was projected to reduce fuel consumption by 20 percent.
AVL systems can help commercial motor vehicles find more efficient routes which in effect can reduce VMT. An AVL/OBD technology solution identified eliminated
Eighty-three (83) percent of the audible alerts
received by drivers were rated as either good or
neutral, and only 13 percent were rated as bad.
The alerts enhanced drivers' situational
awareness and improved safety on freeways.
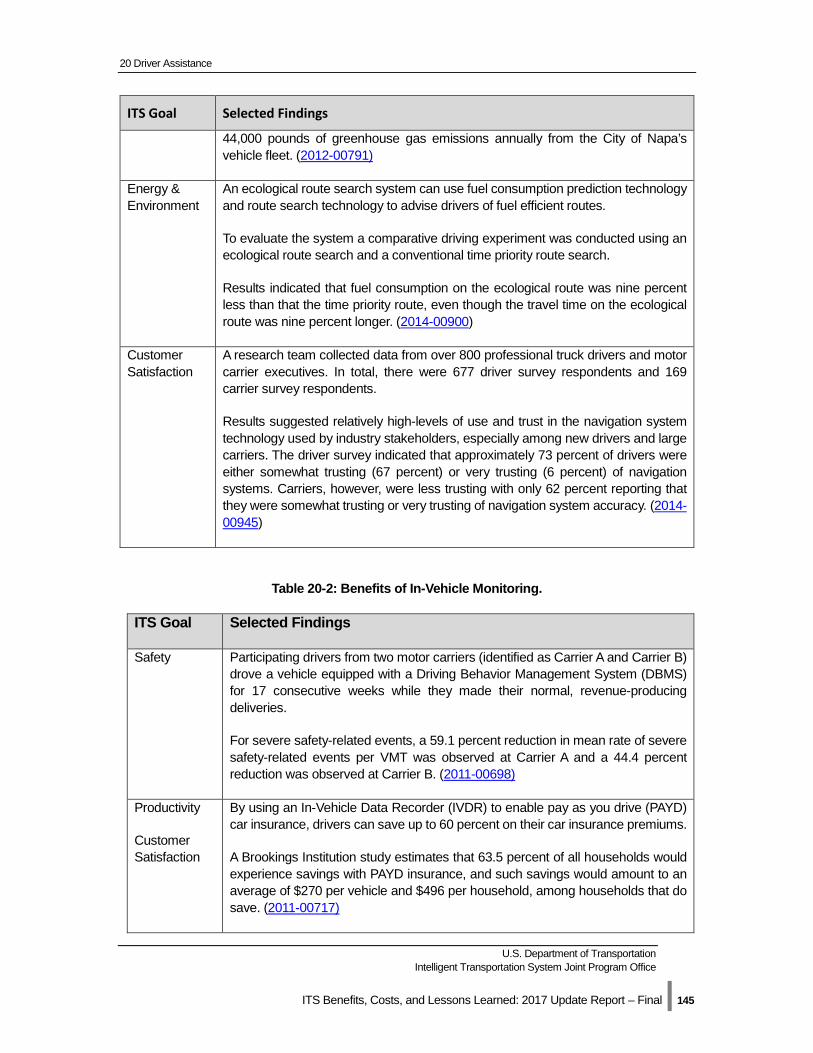
20 Driver Assistance
U.S. Department of Transportation Intelligent Transportation System Joint Program Office
ITS Benefits, Costs, and Lessons Learned: 2017 Update Report – Final | 145
ITS Goal Selected Findings
44,000 pounds of greenhouse gas emissions annually from the City of Napa’s vehicle fleet. (2012-00791)
Energy & Environment
An ecological route search system can use fuel consumption prediction technology and route search technology to advise drivers of fuel efficient routes.
To evaluate the system a comparative driving experiment was conducted using an ecological route search and a conventional time priority route search.
Results indicated that fuel consumption on the ecological route was nine percent less than that the time priority route, even though the travel time on the ecological route was nine percent longer. (2014-00900)
Customer Satisfaction
A research team collected data from over 800 professional truck drivers and motor carrier executives. In total, there were 677 driver survey respondents and 169 carrier survey respondents.
Results suggested relatively high-levels of use and trust in the navigation system technology used by industry stakeholders, especially among new drivers and large carriers. The driver survey indicated that approximately 73 percent of drivers were either somewhat trusting (67 percent) or very trusting (6 percent) of navigation systems. Carriers, however, were less trusting with only 62 percent reporting that they were somewhat trusting or very trusting of navigation system accuracy. (2014-00945)
Table 20-2: Benefits of In-Vehicle Monitoring.
ITS Goal Selected Findings
Safety Participating drivers from two motor carriers (identified as Carrier A and Carrier B) drove a vehicle equipped with a Driving Behavior Management System (DBMS) for 17 consecutive weeks while they made their normal, revenue-producing deliveries.
For severe safety-related events, a 59.1 percent reduction in mean rate of severe safety-related events per VMT was observed at Carrier A and a 44.4 percent reduction was observed at Carrier B. (2011-00698)
Productivity
Customer Satisfaction
By using an In-Vehicle Data Recorder (IVDR) to enable pay as you drive (PAYD) car insurance, drivers can save up to 60 percent on their car insurance premiums.
A Brookings Institution study estimates that 63.5 percent of all households would experience savings with PAYD insurance, and such savings would amount to an average of $270 per vehicle and $496 per household, among households that do save. (2011-00717)
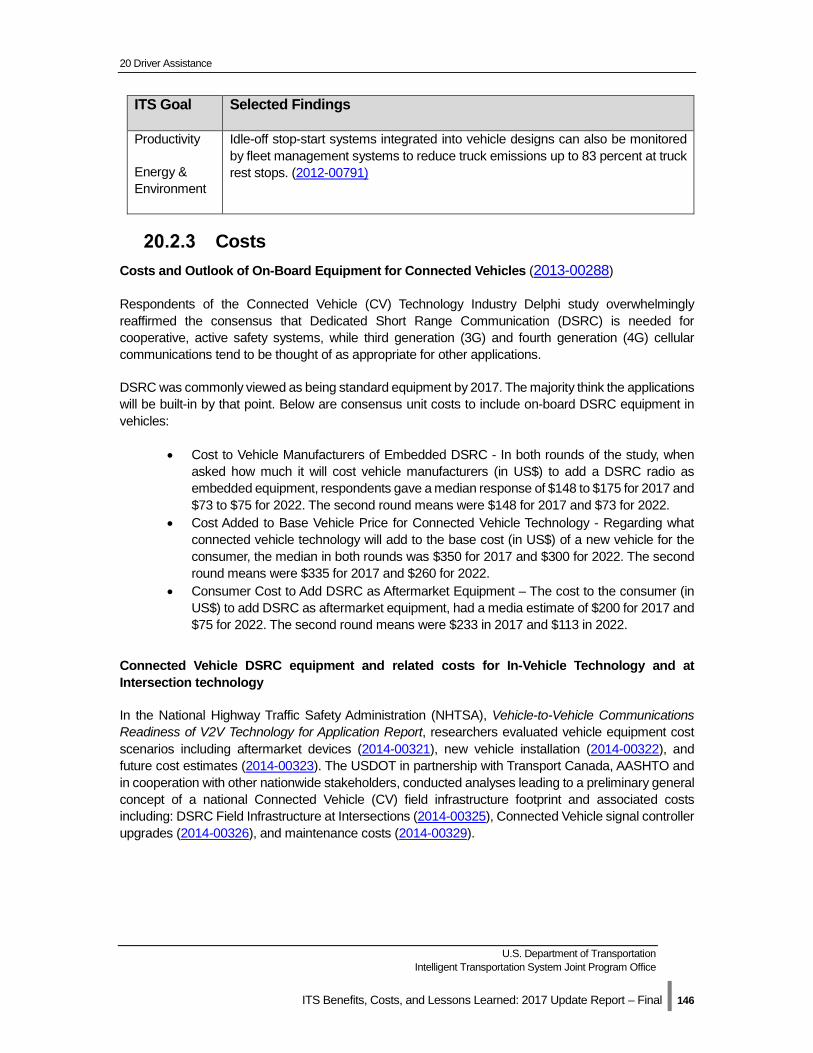
20 Driver Assistance
U.S. Department of Transportation Intelligent Transportation System Joint Program Office
ITS Benefits, Costs, and Lessons Learned: 2017 Update Report – Final | 146
ITS Goal Selected Findings
Productivity
Energy & Environment
Idle-off stop-start systems integrated into vehicle designs can also be monitored by fleet management systems to reduce truck emissions up to 83 percent at truck rest stops. (2012-00791)
Costs Costs and Outlook of On-Board Equipment for Connected Vehicles (2013-00288)
Respondents of the Connected Vehicle (CV) Technology Industry Delphi study overwhelmingly reaffirmed the consensus that Dedicated Short Range Communication (DSRC) is needed for cooperative, active safety systems, while third generation (3G) and fourth generation (4G) cellular communications tend to be thought of as appropriate for other applications.
DSRC was commonly viewed as being standard equipment by 2017. The majority think the applications will be built-in by that point. Below are consensus unit costs to include on-board DSRC equipment in vehicles:
• Cost to Vehicle Manufacturers of Embedded DSRC - In both rounds of the study, when asked how much it will cost vehicle manufacturers (in US$) to add a DSRC radio as embedded equipment, respondents gave a median response of $148 to $175 for 2017 and $73 to $75 for 2022. The second round means were $148 for 2017 and $73 for 2022.
• Cost Added to Base Vehicle Price for Connected Vehicle Technology - Regarding what connected vehicle technology will add to the base cost (in US$) of a new vehicle for the consumer, the median in both rounds was $350 for 2017 and $300 for 2022. The second round means were $335 for 2017 and $260 for 2022.
• Consumer Cost to Add DSRC as Aftermarket Equipment – The cost to the consumer (in US$) to add DSRC as aftermarket equipment, had a media estimate of $200 for 2017 and $75 for 2022. The second round means were $233 in 2017 and $113 in 2022.
Connected Vehicle DSRC equipment and related costs for In-Vehicle Technology and at Intersection technology
In the National Highway Traffic Safety Administration (NHTSA), Vehicle-to-Vehicle Communications Readiness of V2V Technology for Application Report, researchers evaluated vehicle equipment cost scenarios including aftermarket devices (2014-00321), new vehicle installation (2014-00322), and future cost estimates (2014-00323). The USDOT in partnership with Transport Canada, AASHTO and in cooperation with other nationwide stakeholders, conducted analyses leading to a preliminary general concept of a national Connected Vehicle (CV) field infrastructure footprint and associated costs including: DSRC Field Infrastructure at Intersections (2014-00325), Connected Vehicle signal controller upgrades (2014-00326), and maintenance costs (2014-00329).
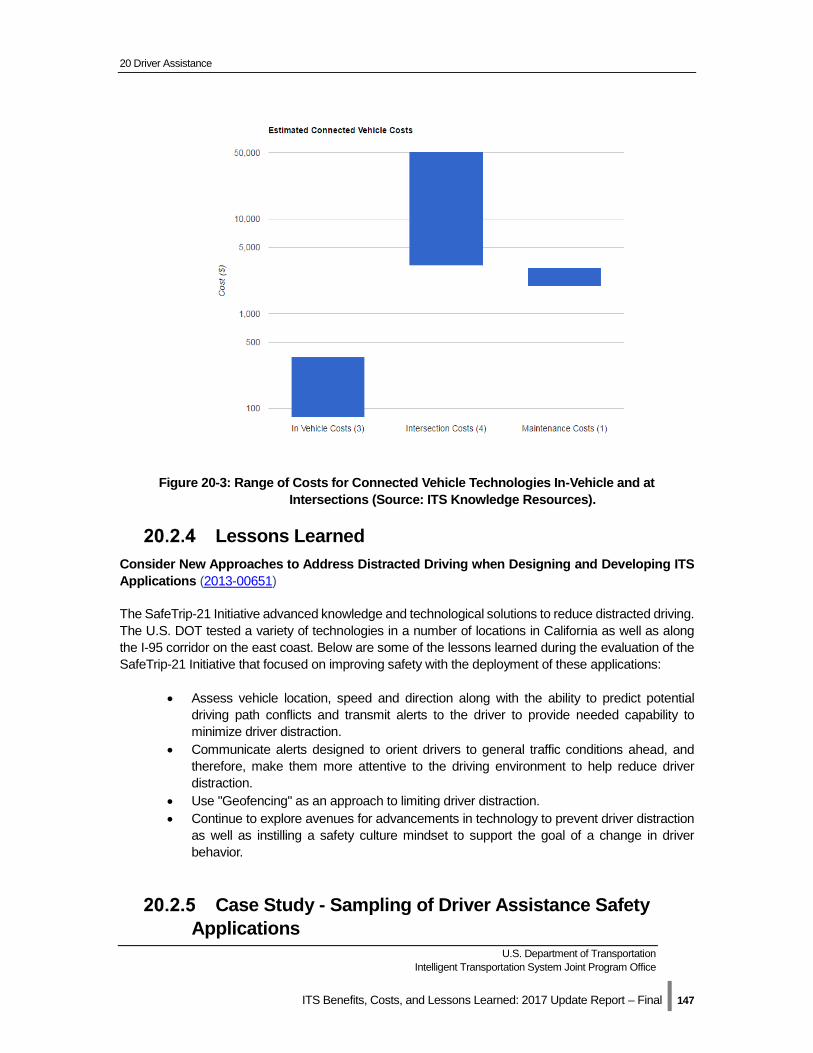
20 Driver Assistance
U.S. Department of Transportation Intelligent Transportation System Joint Program Office
ITS Benefits, Costs, and Lessons Learned: 2017 Update Report – Final | 147
Lessons Learned Consider New Approaches to Address Distracted Driving when Designing and Developing ITS Applications (2013-00651)
The SafeTrip-21 Initiative advanced knowledge and technological solutions to reduce distracted driving. The U.S. DOT tested a variety of technologies in a number of locations in California as well as along the I-95 corridor on the east coast. Below are some of the lessons learned during the evaluation of the SafeTrip-21 Initiative that focused on improving safety with the deployment of these applications:
• Assess vehicle location, speed and direction along with the ability to predict potential driving path conflicts and transmit alerts to the driver to provide needed capability to minimize driver distraction.
• Communicate alerts designed to orient drivers to general traffic conditions ahead, and therefore, make them more attentive to the driving environment to help reduce driver distraction.
• Use "Geofencing" as an approach to limiting driver distraction. • Continue to explore avenues for advancements in technology to prevent driver distraction
as well as instilling a safety culture mindset to support the goal of a change in driver behavior.
Case Study - Sampling of Driver Assistance Safety Applications
Figure 20-3: Range of Costs for Connected Vehicle Technologies In-Vehicle and at Intersections (Source: ITS Knowledge Resources).
20 Driver Assistance
U.S. Department of Transportation Intelligent Transportation System Joint Program Office
ITS Benefits, Costs, and Lessons Learned: 2017 Update Report – Final | 148
• Vision Enhancement, Object Detection - Rear-visibility systems are expected to prevent over one thousand backover injuries each year. The NHTSA submitted a final rule requiring more stringent rear-visibility standards in light vehicles. Effective June 6, 2014 the regulation requires automakers to phase-in the installation of rear-visibility technology in all light vehicles by May 2018. As part of the Kids Transportation Safety Act of 2007, NHTSA conducted research to evaluate backover crashes and the need for appropriate countermeasures. Research indicated that approximately 210 fatalities and 15,000 injuries are attributable to light vehicle backover crashes each year. Children under five years old accounted for 31 percent of fatalities and adults 70 years or older accounted for 26 percent. The effectiveness of rear-view video systems was estimated to range from 28 to 33 percent which is substantially better than alternative "sensor-only systems" currently available. Applying the estimated effectiveness to the target population, the aforementioned systems were projected to save 58 to 69 lives per year assuming full market penetration by 2054 (2014-00920).
• Lane Keeping Assistance - Electronic Stability Control (ESC) saved an estimated 1,144 lives among passenger vehicle occupants in 2012. ESC systems use automatic computer controlled braking to help the driver maintain control in risky driving situations in which the vehicle is beginning to lose directional stability at the rear or front wheels. The percentage of passenger vehicles equipped with ESC has increased significantly as a result of implementation of the Federal Motor Vehicle Safety Standard (FMVSS) No. 126. As of September 1, 2011, all new passenger cars and light trucks and vans must be equipped with ESC and comply with this standard. In 2014, NHTSA updated ESC effectiveness estimated for personal cars and light trucks and vans. The report, "Updated Estimates of Fatality Reduction by Electronic Stability Control," by Chuck Kahane, provides estimates of 37.8 percent ESC effectiveness for passenger cars occupants and 55.9 percent effectiveness for light truck and van occupants. In 2012, ESC saved an estimated 446 lives among passenger car occupants, and 698 lives among light truck and van occupants, for a total of 1,144 lives saved among passenger vehicle occupants (2014-00931).
• Lane Keeping Assistance - Driver Assist System improves bus operations, with bus speeds increasing by 3.5 mph. In November 2010 as part of its Urban Partnership Agreement for congestion reduction, the Minnesota Valley Transit Authority (MVTA) implemented a Driver Assist System (DAS) for bus shoulder operations on Cedar Avenue (Trunk Highway 77). The DAS is a GPS based technology suite that provides accurate lane position feedback to the bus driver. It includes a head-up display (HUD) mounted at eye level in front of the driver that digitally displays the shoulder boundaries under all weather conditions. The evaluation looked at six broad areas: efficiency/productivity, technical performance, bus driver satisfaction, customer satisfaction, safety, and maintenance. Data were collected with and without DAS features made available to the driver. Researchers reported the following findings. (2014-00916).
• All of the drivers drove faster when the DAS was in use, with an average increase of 3.5 mph (5.6 km/h).
• In the bus driver surveys, 62.5 percent agreed or strongly agreed that the DAS made driving in the shoulder safer.
• In the bus driver survey, 88 percent agreed or strongly agreed that the DAS was easy to use, and 64 percent agreed or strongly agreed that the DAS made driving in the shoulder less stressful.
20 Driver Assistance
U.S. Department of Transportation Intelligent Transportation System Joint Program Office
ITS Benefits, Costs, and Lessons Learned: 2017 Update Report – Final | 149
• Some drivers indicated that the HUD was distracting. In contrast, the vibrating seat was highly regarded in both the survey and the focus groups.
• A total of 32 percent of bus drivers said their level of confidence in driving in the shoulder was greater when using the DAS, and 60 percent said it was the same.
• Object Detection - Large trucks with blind spot warning systems have approximately 50 percent fewer safety-critical events. This study evaluated the effectiveness of blind spot warning (BSW) systems to improve commercial motor vehicle safety. Twenty (20) commercial motor vehicles (CMVs) equipped with BSW systems were evaluated over an 11 month period during normal revenue-producing operations in North Carolina. The BSW system used infrared technology and an array of lasers to create a 3-D detection zone on the driver and passenger sides of the vehicle. LEDs mounted on side-view mirrors were used to alert drivers of objects or vehicles in blind spots. Evaluation data were collected before and after system features were activated on each truck. Potential safety benefits were determined based on operator driving behavior as measured by the rate of involvement in safety-critical events and changes to lane change/merge behavior after the BSW system was introduced. The rate of lane change/merge safety-critical events identified during the baseline and intervention conditions was significantly different. The intervention phase had nearly 50 percent fewer safety-critical events compared to the baseline phase (2014-00913).
• Object Detection – Full deployment of collision warning systems that have pedestrian detection and full auto brake features have potential to reduce pedestrian fatalities by 24 percent. Crash data derived from German accident studies from 1999 to 2007 were used by a Volvo Cars Traffic Simulator (VCTS) to estimate the safety benefits of supplementing emergency brake assist (EBA) technology with collision warning systems that have full auto brake and pedestrian detection (CWAB-PD). Results indicated that the addition of CWAB-PD would reduce pedestrian fatalities by 24 percent and save roughly 400 lives each year. (2016-01086).
Joint Program Office U.S. Department of Transportation, Research and Innovative Technology Administration
ITS Benefits, Costs, and Lessons Learned: Update Report - Final | 150
21 Information Management
21.1 Introduction Intelligent transportation systems collect large amounts of data on the operational status of the transportation system. Archiving and analyzing this data can provide significant benefits to transportation agencies.
Archived data management systems (ADMS) collect data from ITS applications and assist in transportation administration, policy evaluation, safety, planning, program assessment, operations research, and other applications. Small-scale data archiving systems can support a single agency or operations center, while larger systems support multiple agencies and can act as a regional warehouse for ITS data.
The 2012 transportation reauthorization law Moving Ahead for Progress in the 21st Century (MAP-21) has set up new requirements for performance-based transportation decision making, including establishing performance measures and targets in seven national goal areas such as congestion reduction and system reliability. Public agencies are seeking real time and archived data to provide metrics and measurements of system performance.
Example uses of archived ITS data include:
• Incident management programs may review incident locations to schedule staging andpatrol routes, and frequencies for service patrol vehicles.
• Historical traffic information can be used to develop predictive travel times.• Transit agencies may review schedule performance data archived from automatic vehicle
location, computer-aided dispatch systems and/or automatic passenger counting systemsto design more effective schedules and route designs, or to manage operations moreefficiently.
As information management and data archiving systems evolve they are moving from archiving information from a single source or system to more complex implementations. In order to provide support for regional operations across jurisdictional and agency boundaries, data fusion from multiple sources and/or agencies, integration of both real time and archived information, and data visualization are being incorporated.
Information management and data archiving from both infrastructure and mobile sources in data environments are also the foundation of the Real-Time Data Capture and Management track of the ITS Research Program.
The collection and storage of data on transportation system performance often occurs at transportation management centers (TMCs). The transportation management centers chapter discusses TMCs in detail. In addition, the transit management chapter discusses the archiving and use of transit performance data.
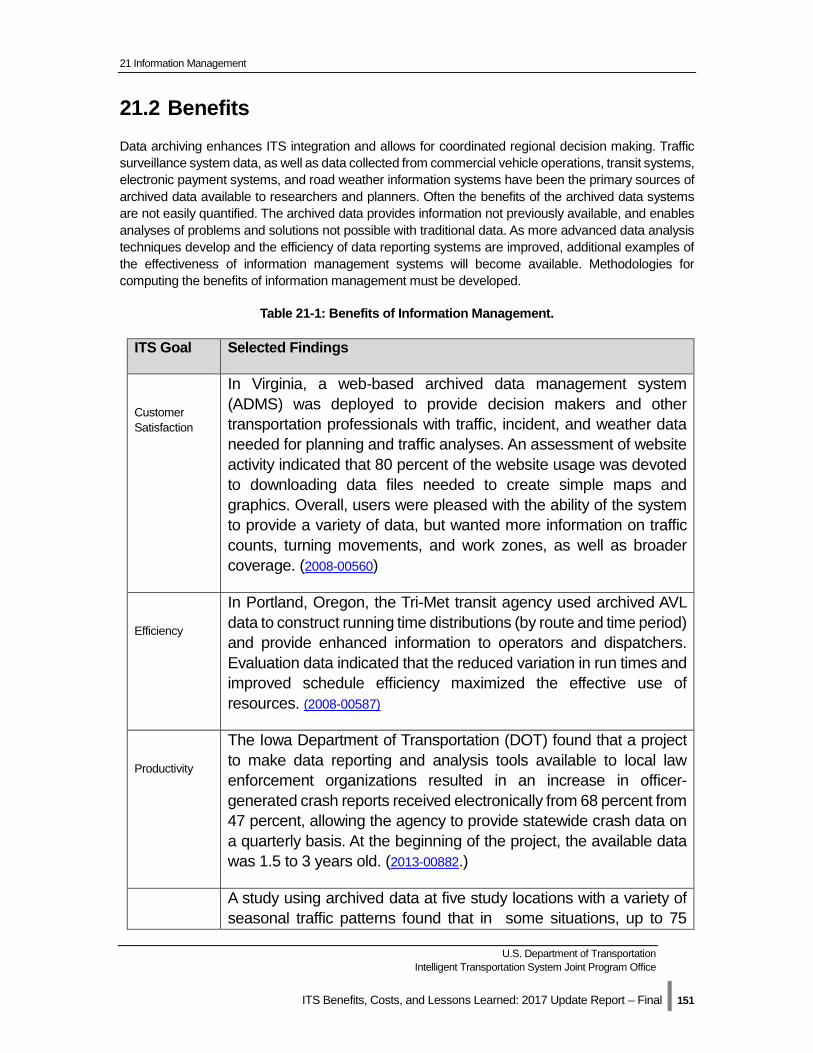
21 Information Management
U.S. Department of Transportation Intelligent Transportation System Joint Program Office
ITS Benefits, Costs, and Lessons Learned: 2017 Update Report – Final | 151
21.2 Benefits Data archiving enhances ITS integration and allows for coordinated regional decision making. Traffic surveillance system data, as well as data collected from commercial vehicle operations, transit systems, electronic payment systems, and road weather information systems have been the primary sources of archived data available to researchers and planners. Often the benefits of the archived data systems are not easily quantified. The archived data provides information not previously available, and enables analyses of problems and solutions not possible with traditional data. As more advanced data analysis techniques develop and the efficiency of data reporting systems are improved, additional examples of the effectiveness of information management systems will become available. Methodologies for computing the benefits of information management must be developed.
Table 21-1: Benefits of Information Management.
ITS Goal Selected Findings
Customer Satisfaction
In Virginia, a web-based archived data management system (ADMS) was deployed to provide decision makers and other transportation professionals with traffic, incident, and weather data needed for planning and traffic analyses. An assessment of website activity indicated that 80 percent of the website usage was devoted to downloading data files needed to create simple maps and graphics. Overall, users were pleased with the ability of the system to provide a variety of data, but wanted more information on traffic counts, turning movements, and work zones, as well as broader coverage. (2008-00560)
Efficiency
In Portland, Oregon, the Tri-Met transit agency used archived AVL data to construct running time distributions (by route and time period) and provide enhanced information to operators and dispatchers. Evaluation data indicated that the reduced variation in run times and improved schedule efficiency maximized the effective use of resources. (2008-00587)
Productivity
The Iowa Department of Transportation (DOT) found that a project to make data reporting and analysis tools available to local law enforcement organizations resulted in an increase in officer-generated crash reports received electronically from 68 percent from 47 percent, allowing the agency to provide statewide crash data on a quarterly basis. At the beginning of the project, the available data was 1.5 to 3 years old. (2013-00882.)
A study using archived data at five study locations with a variety of seasonal traffic patterns found that in some situations, up to 75
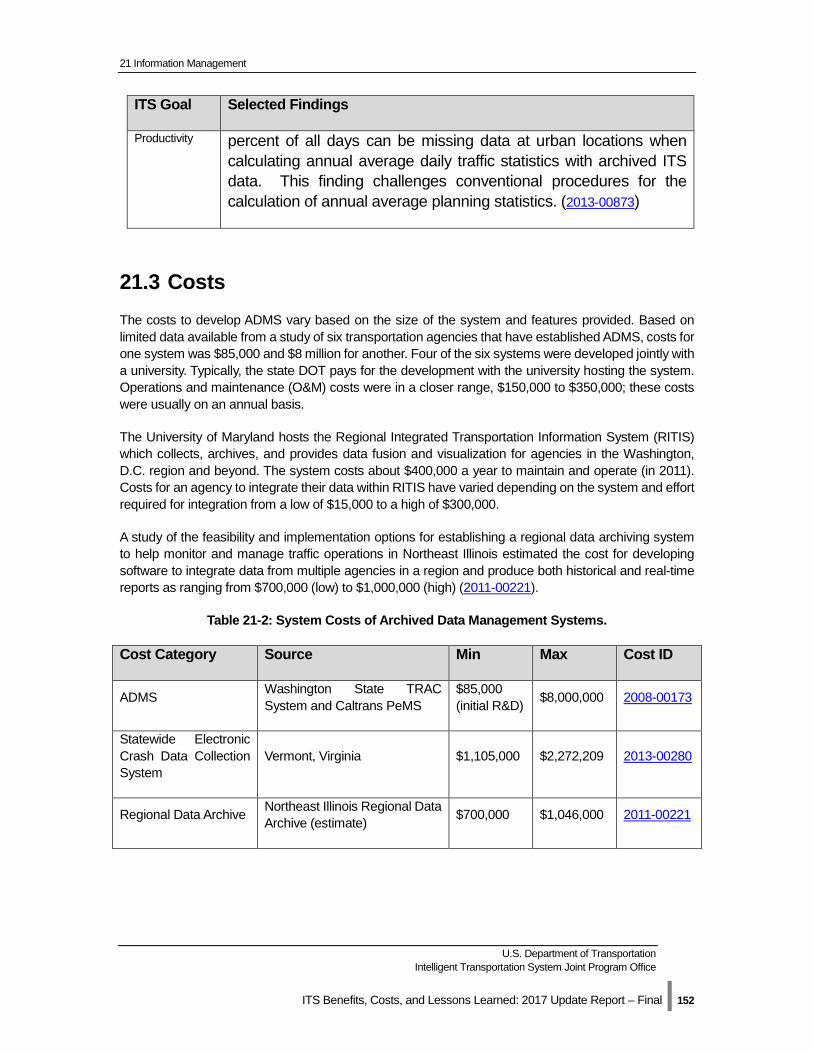
21 Information Management
U.S. Department of Transportation Intelligent Transportation System Joint Program Office
ITS Benefits, Costs, and Lessons Learned: 2017 Update Report – Final | 152
ITS Goal Selected Findings
Productivity percent of all days can be missing data at urban locations when calculating annual average daily traffic statistics with archived ITS data. This finding challenges conventional procedures for the calculation of annual average planning statistics. (2013-00873)
21.3 Costs The costs to develop ADMS vary based on the size of the system and features provided. Based on limited data available from a study of six transportation agencies that have established ADMS, costs for one system was $85,000 and $8 million for another. Four of the six systems were developed jointly with a university. Typically, the state DOT pays for the development with the university hosting the system. Operations and maintenance (O&M) costs were in a closer range, $150,000 to $350,000; these costs were usually on an annual basis.
The University of Maryland hosts the Regional Integrated Transportation Information System (RITIS) which collects, archives, and provides data fusion and visualization for agencies in the Washington, D.C. region and beyond. The system costs about $400,000 a year to maintain and operate (in 2011). Costs for an agency to integrate their data within RITIS have varied depending on the system and effort required for integration from a low of $15,000 to a high of $300,000.
A study of the feasibility and implementation options for establishing a regional data archiving system to help monitor and manage traffic operations in Northeast Illinois estimated the cost for developing software to integrate data from multiple agencies in a region and produce both historical and real-time reports as ranging from $700,000 (low) to $1,000,000 (high) (2011-00221).
Table 21-2: System Costs of Archived Data Management Systems.
Cost Category Source Min Max Cost ID
ADMS Washington State TRAC System and Caltrans PeMS
$85,000 (initial R&D) $8,000,000 2008-00173
Statewide Electronic Crash Data Collection System
Vermont, Virginia $1,105,000 $2,272,209 2013-00280
Regional Data Archive Northeast Illinois Regional Data Archive (estimate) $700,000 $1,046,000 2011-00221
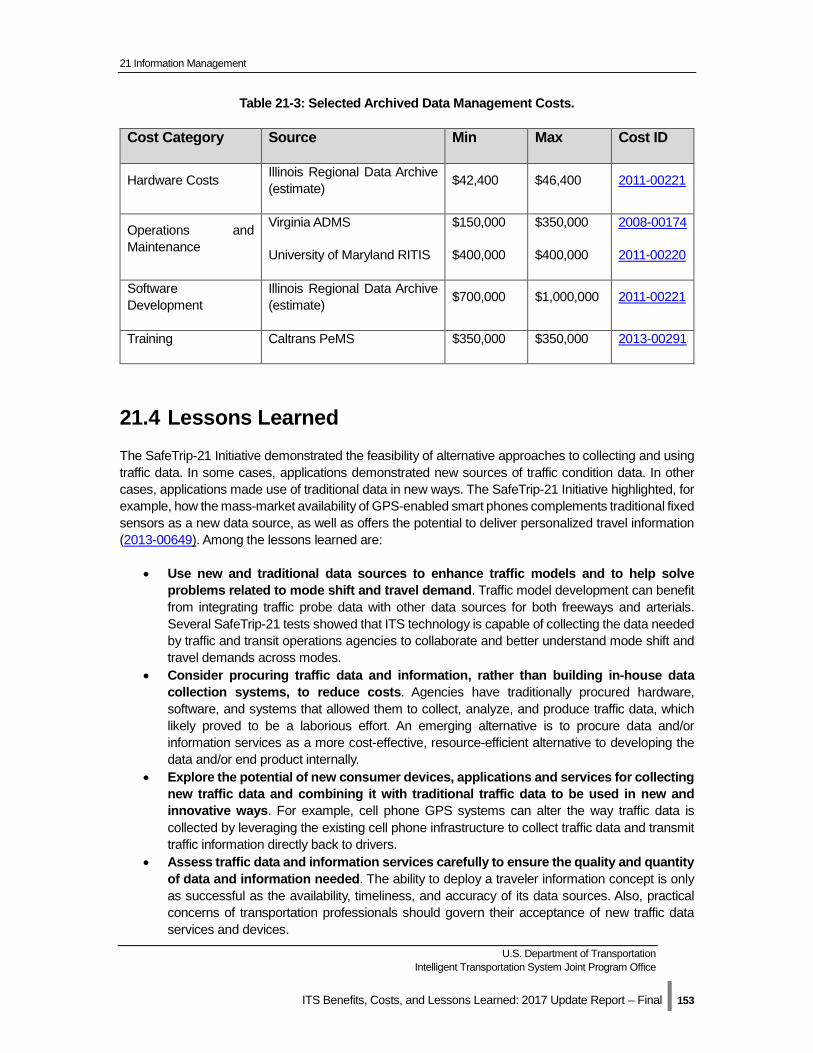
21 Information Management
U.S. Department of Transportation Intelligent Transportation System Joint Program Office
ITS Benefits, Costs, and Lessons Learned: 2017 Update Report – Final | 153
Table 21-3: Selected Archived Data Management Costs.
Cost Category Source Min Max Cost ID
Hardware Costs Illinois Regional Data Archive (estimate) $42,400 $46,400 2011-00221
Operations and Maintenance
Virginia ADMS
University of Maryland RITIS
$150,000
$400,000
$350,000
$400,000
2008-00174
2011-00220
Software Development
Illinois Regional Data Archive (estimate) $700,000 $1,000,000 2011-00221
Training Caltrans PeMS $350,000 $350,000 2013-00291
21.4 Lessons Learned The SafeTrip-21 Initiative demonstrated the feasibility of alternative approaches to collecting and using traffic data. In some cases, applications demonstrated new sources of traffic condition data. In other cases, applications made use of traditional data in new ways. The SafeTrip-21 Initiative highlighted, for example, how the mass-market availability of GPS-enabled smart phones complements traditional fixed sensors as a new data source, as well as offers the potential to deliver personalized travel information (2013-00649). Among the lessons learned are:
• Use new and traditional data sources to enhance traffic models and to help solve problems related to mode shift and travel demand. Traffic model development can benefit from integrating traffic probe data with other data sources for both freeways and arterials. Several SafeTrip-21 tests showed that ITS technology is capable of collecting the data needed by traffic and transit operations agencies to collaborate and better understand mode shift and travel demands across modes.
• Consider procuring traffic data and information, rather than building in-house data collection systems, to reduce costs. Agencies have traditionally procured hardware, software, and systems that allowed them to collect, analyze, and produce traffic data, which likely proved to be a laborious effort. An emerging alternative is to procure data and/or information services as a more cost-effective, resource-efficient alternative to developing the data and/or end product internally.
• Explore the potential of new consumer devices, applications and services for collecting new traffic data and combining it with traditional traffic data to be used in new and innovative ways. For example, cell phone GPS systems can alter the way traffic data is collected by leveraging the existing cell phone infrastructure to collect traffic data and transmit traffic information directly back to drivers.
• Assess traffic data and information services carefully to ensure the quality and quantity of data and information needed. The ability to deploy a traveler information concept is only as successful as the availability, timeliness, and accuracy of its data sources. Also, practical concerns of transportation professionals should govern their acceptance of new traffic data services and devices.
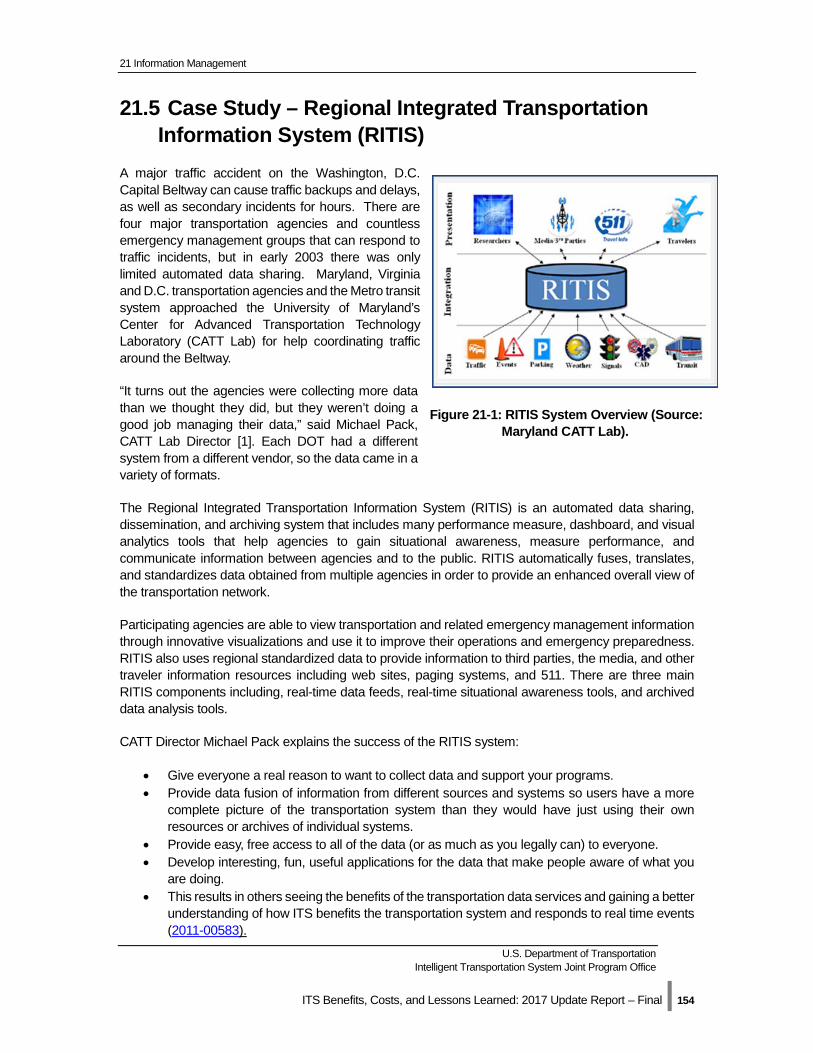
21 Information Management
U.S. Department of Transportation Intelligent Transportation System Joint Program Office
ITS Benefits, Costs, and Lessons Learned: 2017 Update Report – Final | 154
21.5 Case Study – Regional Integrated Transportation Information System (RITIS)
A major traffic accident on the Washington, D.C. Capital Beltway can cause traffic backups and delays, as well as secondary incidents for hours. There are four major transportation agencies and countless emergency management groups that can respond to traffic incidents, but in early 2003 there was only limited automated data sharing. Maryland, Virginia and D.C. transportation agencies and the Metro transit system approached the University of Maryland’s Center for Advanced Transportation Technology Laboratory (CATT Lab) for help coordinating traffic around the Beltway.
“It turns out the agencies were collecting more data than we thought they did, but they weren’t doing a good job managing their data,” said Michael Pack, CATT Lab Director [1]. Each DOT had a different system from a different vendor, so the data came in a variety of formats.
The Regional Integrated Transportation Information System (RITIS) is an automated data sharing, dissemination, and archiving system that includes many performance measure, dashboard, and visual analytics tools that help agencies to gain situational awareness, measure performance, and communicate information between agencies and to the public. RITIS automatically fuses, translates, and standardizes data obtained from multiple agencies in order to provide an enhanced overall view of the transportation network.
Participating agencies are able to view transportation and related emergency management information through innovative visualizations and use it to improve their operations and emergency preparedness. RITIS also uses regional standardized data to provide information to third parties, the media, and other traveler information resources including web sites, paging systems, and 511. There are three main RITIS components including, real-time data feeds, real-time situational awareness tools, and archived data analysis tools.
CATT Director Michael Pack explains the success of the RITIS system:
• Give everyone a real reason to want to collect data and support your programs. • Provide data fusion of information from different sources and systems so users have a more
complete picture of the transportation system than they would have just using their own resources or archives of individual systems.
• Provide easy, free access to all of the data (or as much as you legally can) to everyone. • Develop interesting, fun, useful applications for the data that make people aware of what you
are doing. • This results in others seeing the benefits of the transportation data services and gaining a better
understanding of how ITS benefits the transportation system and responds to real time events (2011-00583).
Figure 21-1: RITIS System Overview (Source: Maryland CATT Lab).
Joint Program Office U.S. Department of Transportation, Research and Innovative Technology Administration
ITS Benefits, Costs, and Lessons Learned: Update Report - Final | 155
22 Commercial Vehicle Operations
22.1 Introduction ITS applications for commercial vehicle operations (CVO) enhance communications between motor carriers and regulatory agencies, reduce administrative costs for public and private sector operations, and assure safe reliable movement of goods and services on the Nation’s roadways. As part of the Motor Carrier Safety Improvement Act of 1999, the U.S. DOT commissioned the Federal Motor Carrier Safety Administration (FMCSA) to advance these goals and implement the Commercial Vehicle Information Systems and Networks (CVISN) program to fund state participation. As part of the Fixing America’s Surface Transportation Act (FAST Act) of 2015, the CVISN Grant Program was restructured and renamed the Innovative Technology Deployment (ITD) Grant Program. The program continues to focus on “Core” and “Expanded” functions, where Core functions have priority for nationwide deployment.
Core ITD
• Electronic credentialing – Automates the application,processing, and issuance of motor carrier operatingcredentials.
• Safety information exchange – Facilitates the collection,distribution, and retrieval of motor carrier safetyinformation at the roadside.
• Electronic screening – Enables commercial vehicles withgood safety and legal status to bypass roadsideinspections and weigh stations.
Expanded ITD
• Expanded electronic credentialing – Enables authorized stakeholders to access current andaccurate credentials information.
• Smart roadside – Connects remote inspection sites and virtual weigh stations to ITD networks.
• Enhanced safety information sharing and data quality – Provides motor carrier access toFederal and state safety data and ITD updates.
• Driver information sharing – Enables enforcement personnel to access driver records andsafety data.
In 2015, the FMCSA in conjunction with state and local stakeholders identified 40 new capabilities to be integrated into the ITD Program. As of November 2016, 39 states were certified as Core ITD compliant and 36 states were deploying Expanded ITD functions.
22.2 Benefits Core ITD
The ITD Program (formerly known as CVISN) encourages
data sharing to improve motor carrier safety and
productivity
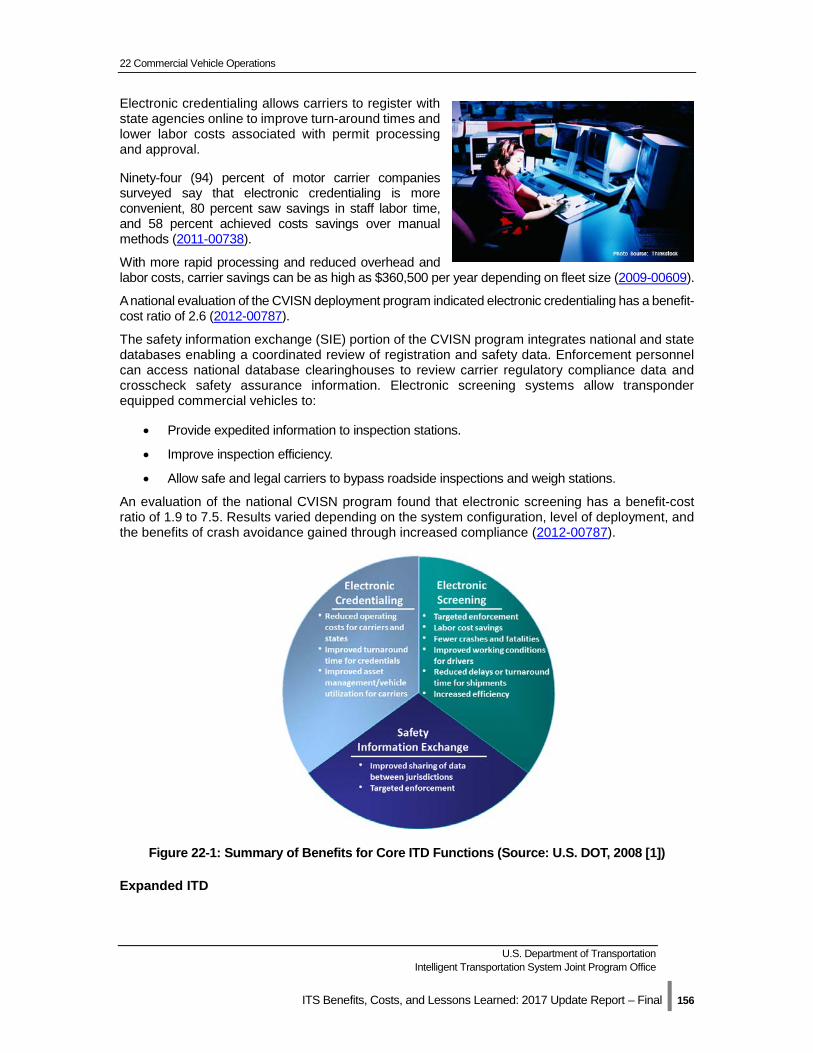
22 Commercial Vehicle Operations
U.S. Department of Transportation Intelligent Transportation System Joint Program Office
ITS Benefits, Costs, and Lessons Learned: 2017 Update Report – Final | 156
Electronic credentialing allows carriers to register with state agencies online to improve turn-around times and lower labor costs associated with permit processing and approval.
Ninety-four (94) percent of motor carrier companies surveyed say that electronic credentialing is more convenient, 80 percent saw savings in staff labor time, and 58 percent achieved costs savings over manual methods (2011-00738).
With more rapid processing and reduced overhead and labor costs, carrier savings can be as high as $360,500 per year depending on fleet size (2009-00609).
A national evaluation of the CVISN deployment program indicated electronic credentialing has a benefit-cost ratio of 2.6 (2012-00787).
The safety information exchange (SIE) portion of the CVISN program integrates national and state databases enabling a coordinated review of registration and safety data. Enforcement personnel can access national database clearinghouses to review carrier regulatory compliance data and crosscheck safety assurance information. Electronic screening systems allow transponder equipped commercial vehicles to:
• Provide expedited information to inspection stations.
• Improve inspection efficiency.
• Allow safe and legal carriers to bypass roadside inspections and weigh stations.
An evaluation of the national CVISN program found that electronic screening has a benefit-cost ratio of 1.9 to 7.5. Results varied depending on the system configuration, level of deployment, and the benefits of crash avoidance gained through increased compliance (2012-00787).
Figure 22-1: Summary of Benefits for Core ITD Functions (Source: U.S. DOT, 2008 [1])
Expanded ITD
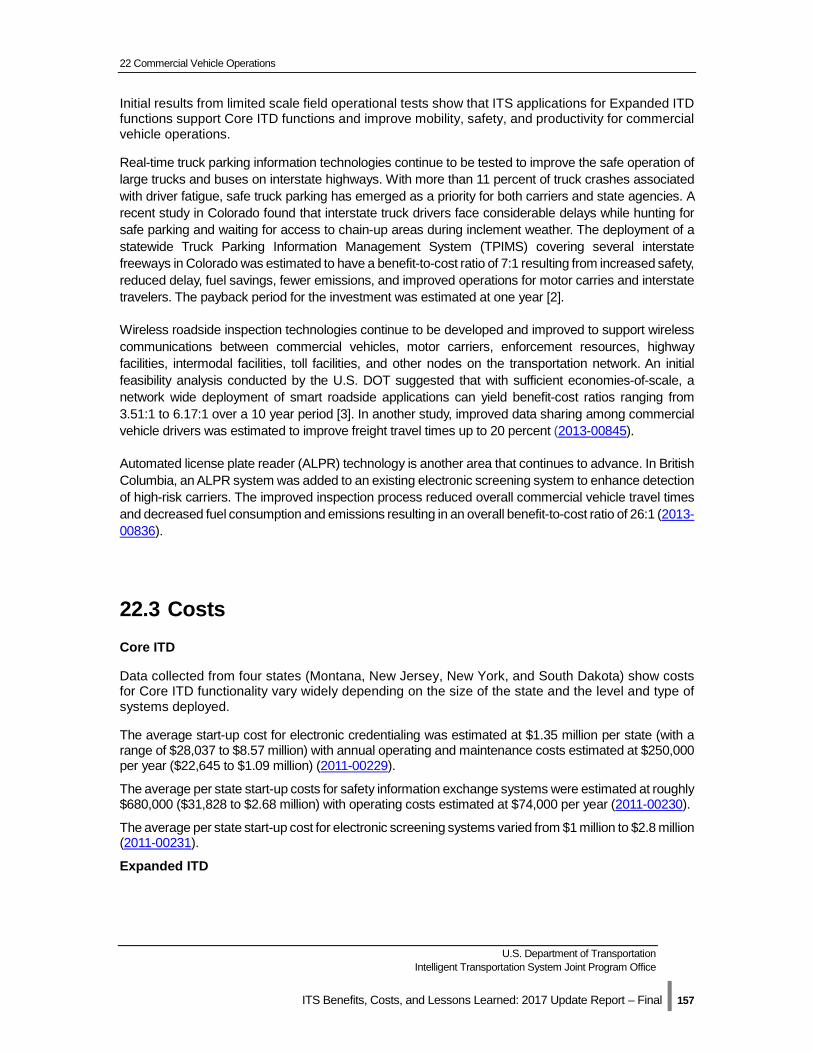
22 Commercial Vehicle Operations
U.S. Department of Transportation Intelligent Transportation System Joint Program Office
ITS Benefits, Costs, and Lessons Learned: 2017 Update Report – Final | 157
Initial results from limited scale field operational tests show that ITS applications for Expanded ITD functions support Core ITD functions and improve mobility, safety, and productivity for commercial vehicle operations.
Real-time truck parking information technologies continue to be tested to improve the safe operation of large trucks and buses on interstate highways. With more than 11 percent of truck crashes associated with driver fatigue, safe truck parking has emerged as a priority for both carriers and state agencies. A recent study in Colorado found that interstate truck drivers face considerable delays while hunting for safe parking and waiting for access to chain-up areas during inclement weather. The deployment of a statewide Truck Parking Information Management System (TPIMS) covering several interstate freeways in Colorado was estimated to have a benefit-to-cost ratio of 7:1 resulting from increased safety, reduced delay, fuel savings, fewer emissions, and improved operations for motor carries and interstate travelers. The payback period for the investment was estimated at one year [2].
Wireless roadside inspection technologies continue to be developed and improved to support wireless communications between commercial vehicles, motor carriers, enforcement resources, highway facilities, intermodal facilities, toll facilities, and other nodes on the transportation network. An initial feasibility analysis conducted by the U.S. DOT suggested that with sufficient economies-of-scale, a network wide deployment of smart roadside applications can yield benefit-cost ratios ranging from 3.51:1 to 6.17:1 over a 10 year period [3]. In another study, improved data sharing among commercial vehicle drivers was estimated to improve freight travel times up to 20 percent (2013-00845).
Automated license plate reader (ALPR) technology is another area that continues to advance. In British Columbia, an ALPR system was added to an existing electronic screening system to enhance detection of high-risk carriers. The improved inspection process reduced overall commercial vehicle travel times and decreased fuel consumption and emissions resulting in an overall benefit-to-cost ratio of 26:1 (2013-00836).
22.3 Costs Core ITD
Data collected from four states (Montana, New Jersey, New York, and South Dakota) show costs for Core ITD functionality vary widely depending on the size of the state and the level and type of systems deployed.
The average start-up cost for electronic credentialing was estimated at $1.35 million per state (with a range of $28,037 to $8.57 million) with annual operating and maintenance costs estimated at $250,000 per year ($22,645 to $1.09 million) (2011-00229).
The average per state start-up costs for safety information exchange systems were estimated at roughly $680,000 ($31,828 to $2.68 million) with operating costs estimated at $74,000 per year (2011-00230).
The average per state start-up cost for electronic screening systems varied from $1 million to $2.8 million (2011-00231).
Expanded ITD
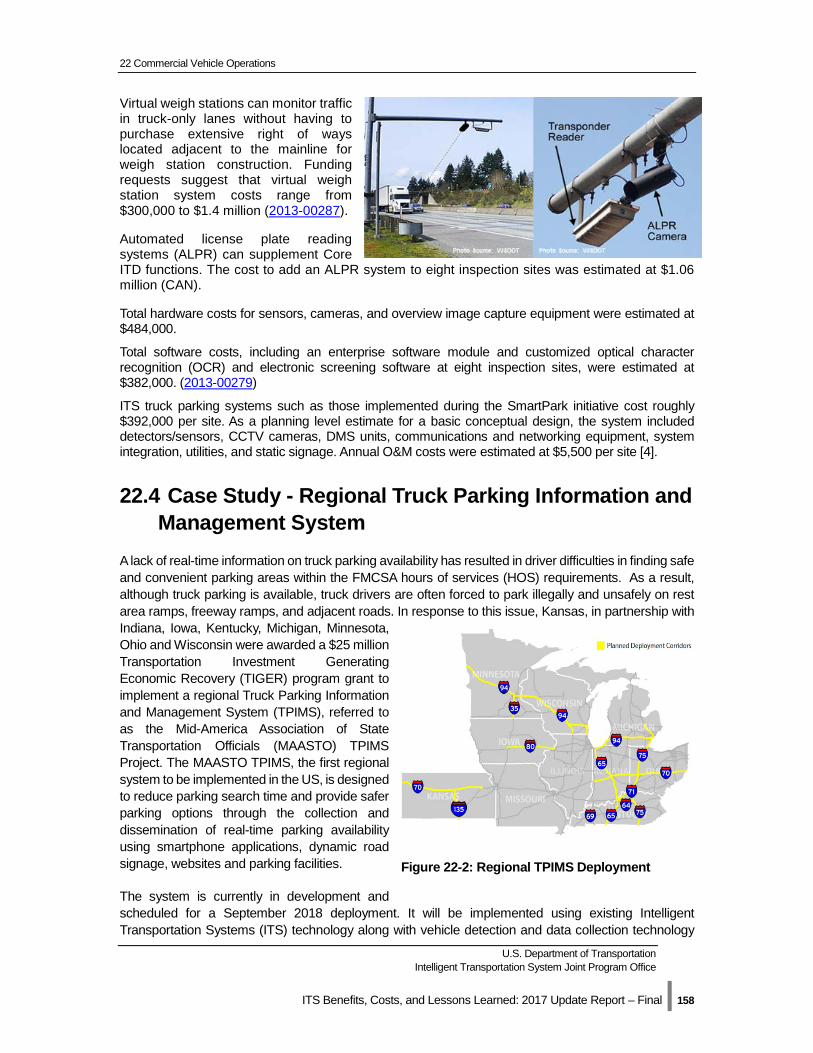
22 Commercial Vehicle Operations
U.S. Department of Transportation Intelligent Transportation System Joint Program Office
ITS Benefits, Costs, and Lessons Learned: 2017 Update Report – Final | 158
Virtual weigh stations can monitor traffic in truck-only lanes without having to purchase extensive right of ways located adjacent to the mainline for weigh station construction. Funding requests suggest that virtual weigh station system costs range from $300,000 to $1.4 million (2013-00287).
Automated license plate reading systems (ALPR) can supplement Core ITD functions. The cost to add an ALPR system to eight inspection sites was estimated at $1.06 million (CAN).
Total hardware costs for sensors, cameras, and overview image capture equipment were estimated at $484,000.
Total software costs, including an enterprise software module and customized optical character recognition (OCR) and electronic screening software at eight inspection sites, were estimated at $382,000. (2013-00279)
ITS truck parking systems such as those implemented during the SmartPark initiative cost roughly $392,000 per site. As a planning level estimate for a basic conceptual design, the system included detectors/sensors, CCTV cameras, DMS units, communications and networking equipment, system integration, utilities, and static signage. Annual O&M costs were estimated at $5,500 per site [4].
22.4 Case Study - Regional Truck Parking Information and Management System
A lack of real-time information on truck parking availability has resulted in driver difficulties in finding safe and convenient parking areas within the FMCSA hours of services (HOS) requirements. As a result, although truck parking is available, truck drivers are often forced to park illegally and unsafely on rest area ramps, freeway ramps, and adjacent roads. In response to this issue, Kansas, in partnership with Indiana, Iowa, Kentucky, Michigan, Minnesota, Ohio and Wisconsin were awarded a $25 million Transportation Investment Generating Economic Recovery (TIGER) program grant to implement a regional Truck Parking Information and Management System (TPIMS), referred to as the Mid-America Association of State Transportation Officials (MAASTO) TPIMS Project. The MAASTO TPIMS, the first regional system to be implemented in the US, is designed to reduce parking search time and provide safer parking options through the collection and dissemination of real-time parking availability using smartphone applications, dynamic road signage, websites and parking facilities.
The system is currently in development and scheduled for a September 2018 deployment. It will be implemented using existing Intelligent Transportation Systems (ITS) technology along with vehicle detection and data collection technology
Figure 22-2: Regional TPIMS Deployment
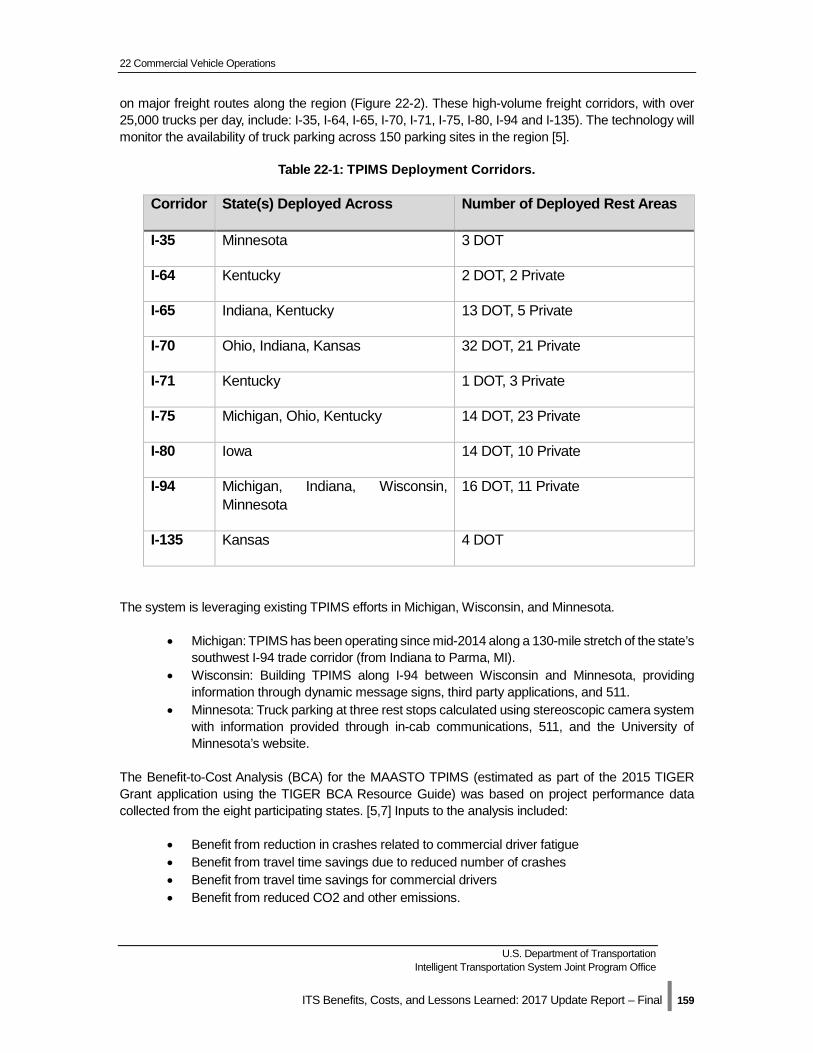
22 Commercial Vehicle Operations
U.S. Department of Transportation Intelligent Transportation System Joint Program Office
ITS Benefits, Costs, and Lessons Learned: 2017 Update Report – Final | 159
on major freight routes along the region (Figure 22-2). These high-volume freight corridors, with over 25,000 trucks per day, include: I-35, I-64, I-65, I-70, I-71, I-75, I-80, I-94 and I-135). The technology will monitor the availability of truck parking across 150 parking sites in the region [5].
Table 22-1: TPIMS Deployment Corridors.
Corridor State(s) Deployed Across Number of Deployed Rest Areas
I-35 Minnesota 3 DOT
I-64 Kentucky 2 DOT, 2 Private
I-65 Indiana, Kentucky 13 DOT, 5 Private
I-70 Ohio, Indiana, Kansas 32 DOT, 21 Private
I-71 Kentucky 1 DOT, 3 Private
I-75 Michigan, Ohio, Kentucky 14 DOT, 23 Private
I-80 Iowa 14 DOT, 10 Private
I-94 Michigan, Indiana, Wisconsin, Minnesota
16 DOT, 11 Private
I-135 Kansas 4 DOT
The system is leveraging existing TPIMS efforts in Michigan, Wisconsin, and Minnesota.
• Michigan: TPIMS has been operating since mid-2014 along a 130-mile stretch of the state’s southwest I-94 trade corridor (from Indiana to Parma, MI).
• Wisconsin: Building TPIMS along I-94 between Wisconsin and Minnesota, providing information through dynamic message signs, third party applications, and 511.
• Minnesota: Truck parking at three rest stops calculated using stereoscopic camera system with information provided through in-cab communications, 511, and the University of Minnesota’s website.
The Benefit-to-Cost Analysis (BCA) for the MAASTO TPIMS (estimated as part of the 2015 TIGER Grant application using the TIGER BCA Resource Guide) was based on project performance data collected from the eight participating states. [5,7] Inputs to the analysis included:
• Benefit from reduction in crashes related to commercial driver fatigue • Benefit from travel time savings due to reduced number of crashes • Benefit from travel time savings for commercial drivers • Benefit from reduced CO2 and other emissions.
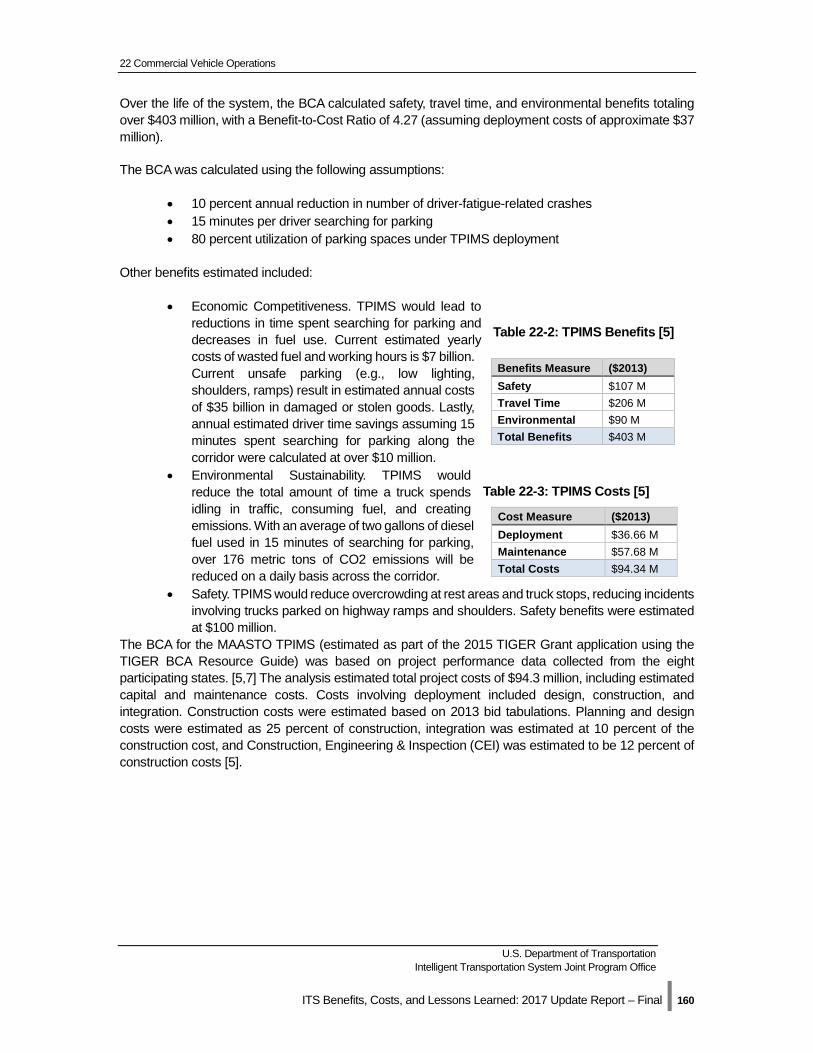
22 Commercial Vehicle Operations
U.S. Department of Transportation Intelligent Transportation System Joint Program Office
ITS Benefits, Costs, and Lessons Learned: 2017 Update Report – Final | 160
Over the life of the system, the BCA calculated safety, travel time, and environmental benefits totaling over $403 million, with a Benefit-to-Cost Ratio of 4.27 (assuming deployment costs of approximate $37 million).
The BCA was calculated using the following assumptions:
• 10 percent annual reduction in number of driver-fatigue-related crashes • 15 minutes per driver searching for parking • 80 percent utilization of parking spaces under TPIMS deployment
Other benefits estimated included:
• Economic Competitiveness. TPIMS would lead to reductions in time spent searching for parking and decreases in fuel use. Current estimated yearly costs of wasted fuel and working hours is $7 billion. Current unsafe parking (e.g., low lighting, shoulders, ramps) result in estimated annual costs of $35 billion in damaged or stolen goods. Lastly, annual estimated driver time savings assuming 15 minutes spent searching for parking along the corridor were calculated at over $10 million.
• Environmental Sustainability. TPIMS would reduce the total amount of time a truck spends idling in traffic, consuming fuel, and creating emissions. With an average of two gallons of diesel fuel used in 15 minutes of searching for parking, over 176 metric tons of CO2 emissions will be reduced on a daily basis across the corridor.
• Safety. TPIMS would reduce overcrowding at rest areas and truck stops, reducing incidents involving trucks parked on highway ramps and shoulders. Safety benefits were estimated at $100 million.
The BCA for the MAASTO TPIMS (estimated as part of the 2015 TIGER Grant application using the TIGER BCA Resource Guide) was based on project performance data collected from the eight participating states. [5,7] The analysis estimated total project costs of $94.3 million, including estimated capital and maintenance costs. Costs involving deployment included design, construction, and integration. Construction costs were estimated based on 2013 bid tabulations. Planning and design costs were estimated as 25 percent of construction, integration was estimated at 10 percent of the construction cost, and Construction, Engineering & Inspection (CEI) was estimated to be 12 percent of construction costs [5].
Cost Measure ($2013) Deployment $36.66 M Maintenance $57.68 M Total Costs $94.34 M
Benefits Measure ($2013) Safety $107 M Travel Time $206 M Environmental $90 M Total Benefits $403 M
Table 22-2: TPIMS Benefits [5]
Table 22-3: TPIMS Costs [5]
Joint Program Office U.S. Department of Transportation, Research and Innovative Technology Administration
ITS Benefits, Costs, and Lessons Learned: Update Report - Final | 161
23 Intermodal Freight
23.1 Introduction While the United States economy has been affected by an economic downturn in recent years, it is expected to recover and continue to grow. Long-term economic growth should result in even greater demand for freight transportation.
The freight industry and its customers are increasingly turning to information technologies and telecommunications to improve freight system efficiency and productivity, increase global connectivity, and enhance freight system security against common threats and terrorism. In short, these technologies help freight operators use the transportation system more intelligently. Most importantly, they do so in ways that improve safety, whether related to hazardous materials transport, heavy truck operation and maintenance, or load limit compliance.
Intelligent freight technologies are currently deployed in several areas including the following:
• Asset tracking: Mobile communications and global positioning systems, bar codes, and radiofrequency identification (RFID) tags track the location of trucks, containers, and cargo toimprove efficiency and to ensure the safety and security of shipments.
• On-board status monitoring: Sensors record vehicle operating conditions, check thecondition of cargo, and detect tampering or intrusion.
• Gateway facilitation: Non-intrusive inspection technologies, such as scanners and RFID tags,are used at terminals, inspection stations, and border crossings to search for contraband andenhance national security.
• Freight status information: Web-based technologies facilitate the exchange of informationon freight shipments and improve data flows.
• Network status information: Cameras, road-sensors, and display technologies monitorcongestion, weather conditions, and incidents.
The ITS Knowledge Resources provides information about the state of the art development and adoption of effective technologies by the freight industry and its customers. This information includes private, public, and network-based benefits, costs and lessons learned.
23.2 Benefits Efficiency Benefits Assessment
In 2013, the Federal Highway Administration finalized an assessment of a drayage optimization application sponsored under the Cross-Town Improvement Project (C-TIP) in Memphis, Tennessee. The purpose of this project was to test methods for leveraging technology to improve drayage operations. The evaluation of this application quantified benefits resulting from improved algorithms that optimize intermodal shipments from origin to destination. The U.S. DOT team partnered with a local drayage company in order to develop and deploy the algorithm.
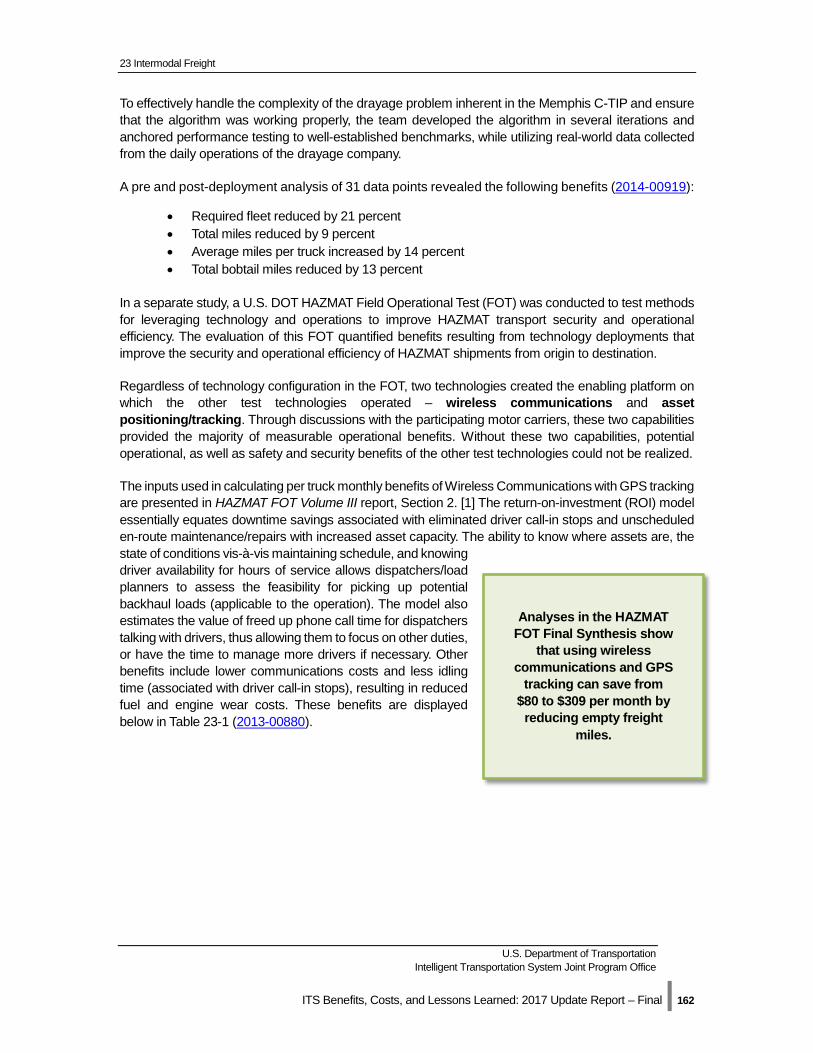
23 Intermodal Freight
U.S. Department of Transportation Intelligent Transportation System Joint Program Office
ITS Benefits, Costs, and Lessons Learned: 2017 Update Report – Final | 162
To effectively handle the complexity of the drayage problem inherent in the Memphis C-TIP and ensure that the algorithm was working properly, the team developed the algorithm in several iterations and anchored performance testing to well-established benchmarks, while utilizing real-world data collected from the daily operations of the drayage company.
A pre and post-deployment analysis of 31 data points revealed the following benefits (2014-00919):
• Required fleet reduced by 21 percent • Total miles reduced by 9 percent • Average miles per truck increased by 14 percent • Total bobtail miles reduced by 13 percent
In a separate study, a U.S. DOT HAZMAT Field Operational Test (FOT) was conducted to test methods for leveraging technology and operations to improve HAZMAT transport security and operational efficiency. The evaluation of this FOT quantified benefits resulting from technology deployments that improve the security and operational efficiency of HAZMAT shipments from origin to destination.
Regardless of technology configuration in the FOT, two technologies created the enabling platform on which the other test technologies operated – wireless communications and asset positioning/tracking. Through discussions with the participating motor carriers, these two capabilities provided the majority of measurable operational benefits. Without these two capabilities, potential operational, as well as safety and security benefits of the other test technologies could not be realized.
The inputs used in calculating per truck monthly benefits of Wireless Communications with GPS tracking are presented in HAZMAT FOT Volume III report, Section 2. [1] The return-on-investment (ROI) model essentially equates downtime savings associated with eliminated driver call-in stops and unscheduled en-route maintenance/repairs with increased asset capacity. The ability to know where assets are, the state of conditions vis-à-vis maintaining schedule, and knowing driver availability for hours of service allows dispatchers/load planners to assess the feasibility for picking up potential backhaul loads (applicable to the operation). The model also estimates the value of freed up phone call time for dispatchers talking with drivers, thus allowing them to focus on other duties, or have the time to manage more drivers if necessary. Other benefits include lower communications costs and less idling time (associated with driver call-in stops), resulting in reduced fuel and engine wear costs. These benefits are displayed below in Table 23-1 (2013-00880).
Analyses in the HAZMAT FOT Final Synthesis show
that using wireless communications and GPS
tracking can save from $80 to $309 per month by
reducing empty freight miles.
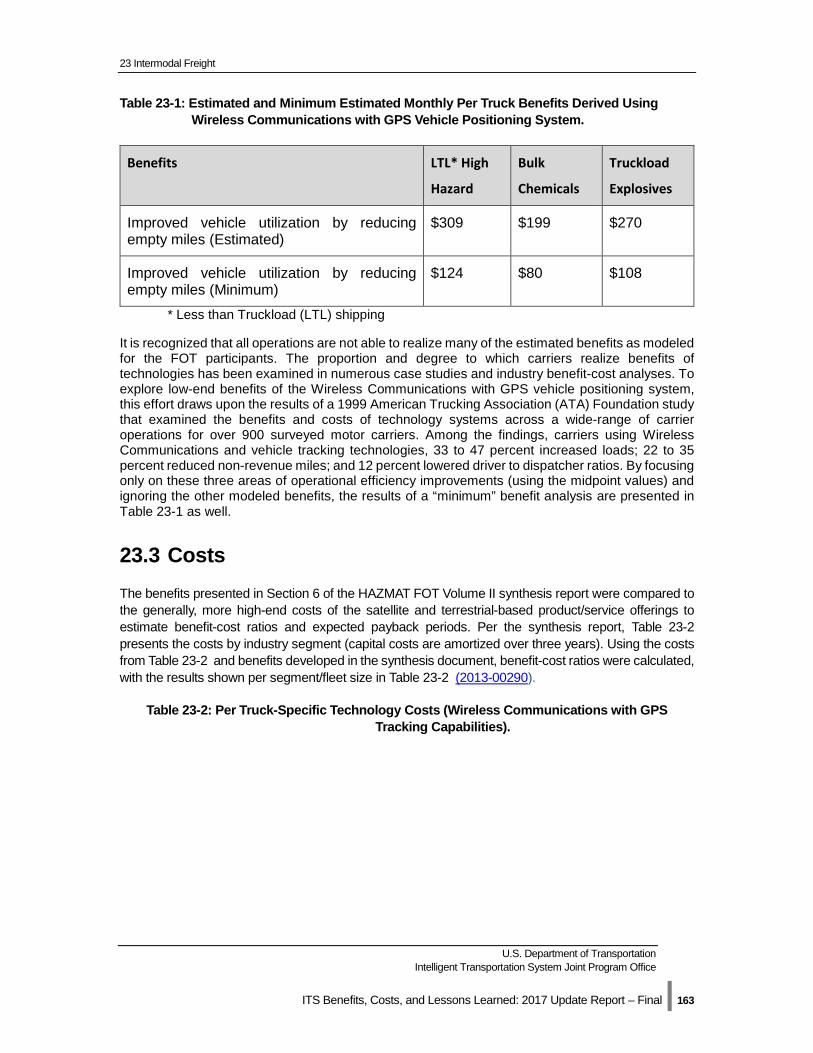
23 Intermodal Freight
U.S. Department of Transportation Intelligent Transportation System Joint Program Office
ITS Benefits, Costs, and Lessons Learned: 2017 Update Report – Final | 163
Table 23-1: Estimated and Minimum Estimated Monthly Per Truck Benefits Derived Using Wireless Communications with GPS Vehicle Positioning System.
Benefits
LTL* High
Hazard
Bulk
Chemicals
Truckload
Explosives
Improved vehicle utilization by reducing empty miles (Estimated)
$309 $199 $270
Improved vehicle utilization by reducing empty miles (Minimum)
$124 $80 $108
* Less than Truckload (LTL) shipping
It is recognized that all operations are not able to realize many of the estimated benefits as modeled for the FOT participants. The proportion and degree to which carriers realize benefits of technologies has been examined in numerous case studies and industry benefit-cost analyses. To explore low-end benefits of the Wireless Communications with GPS vehicle positioning system, this effort draws upon the results of a 1999 American Trucking Association (ATA) Foundation study that examined the benefits and costs of technology systems across a wide-range of carrier operations for over 900 surveyed motor carriers. Among the findings, carriers using Wireless Communications and vehicle tracking technologies, 33 to 47 percent increased loads; 22 to 35 percent reduced non-revenue miles; and 12 percent lowered driver to dispatcher ratios. By focusing only on these three areas of operational efficiency improvements (using the midpoint values) and ignoring the other modeled benefits, the results of a “minimum” benefit analysis are presented in Table 23-1 as well.
23.3 Costs The benefits presented in Section 6 of the HAZMAT FOT Volume II synthesis report were compared to the generally, more high-end costs of the satellite and terrestrial-based product/service offerings to estimate benefit-cost ratios and expected payback periods. Per the synthesis report, Table 23-2 presents the costs by industry segment (capital costs are amortized over three years). Using the costs from Table 23-2 and benefits developed in the synthesis document, benefit-cost ratios were calculated, with the results shown per segment/fleet size in Table 23-2 (2013-00290).
Table 23-2: Per Truck-Specific Technology Costs (Wireless Communications with GPS Tracking Capabilities).
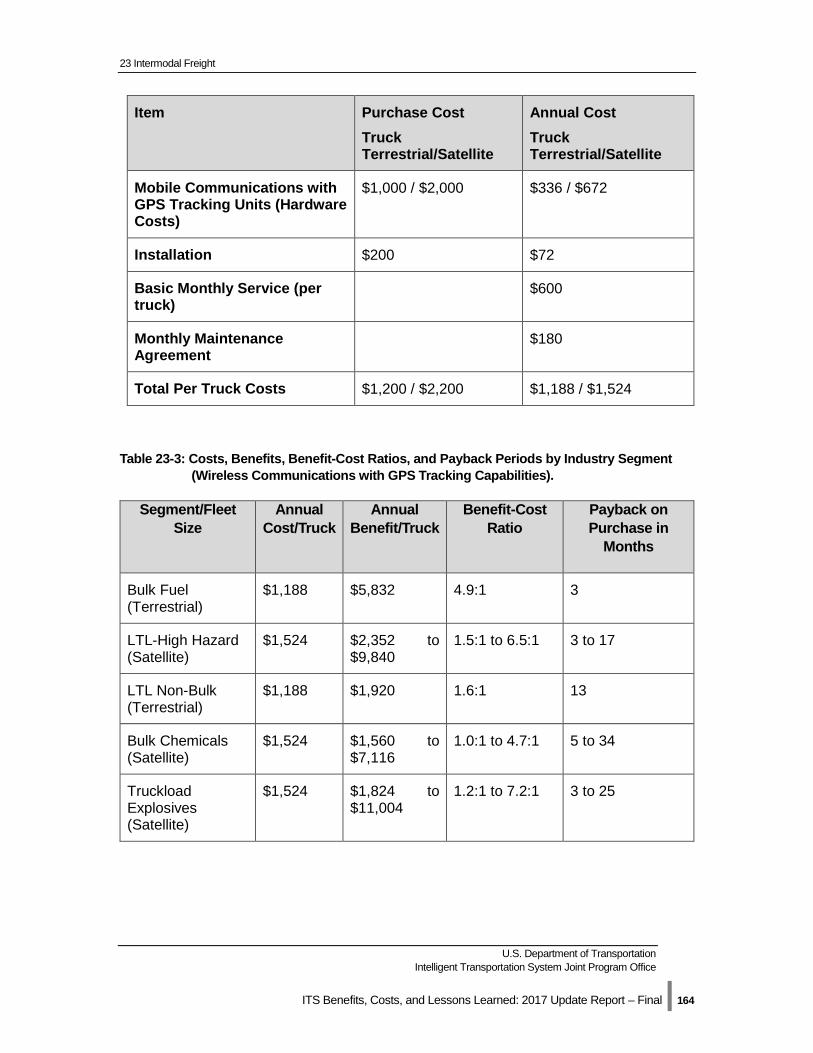
23 Intermodal Freight
U.S. Department of Transportation Intelligent Transportation System Joint Program Office
ITS Benefits, Costs, and Lessons Learned: 2017 Update Report – Final | 164
Item
Purchase Cost Truck Terrestrial/Satellite
Annual Cost Truck Terrestrial/Satellite
Mobile Communications with GPS Tracking Units (Hardware Costs)
$1,000 / $2,000 $336 / $672
Installation $200 $72
Basic Monthly Service (per truck)
$600
Monthly Maintenance Agreement
$180
Total Per Truck Costs $1,200 / $2,200 $1,188 / $1,524
Table 23-3: Costs, Benefits, Benefit-Cost Ratios, and Payback Periods by Industry Segment (Wireless Communications with GPS Tracking Capabilities).
Segment/Fleet Size
Annual Cost/Truck
Annual Benefit/Truck
Benefit-Cost Ratio
Payback on Purchase in
Months
Bulk Fuel (Terrestrial)
$1,188 $5,832 4.9:1 3
LTL-High Hazard (Satellite)
$1,524 $2,352 to $9,840
1.5:1 to 6.5:1 3 to 17
LTL Non-Bulk (Terrestrial)
$1,188 $1,920 1.6:1 13
Bulk Chemicals (Satellite)
$1,524 $1,560 to $7,116
1.0:1 to 4.7:1 5 to 34
Truckload Explosives (Satellite)
$1,524 $1,824 to $11,004
1.2:1 to 7.2:1 3 to 25
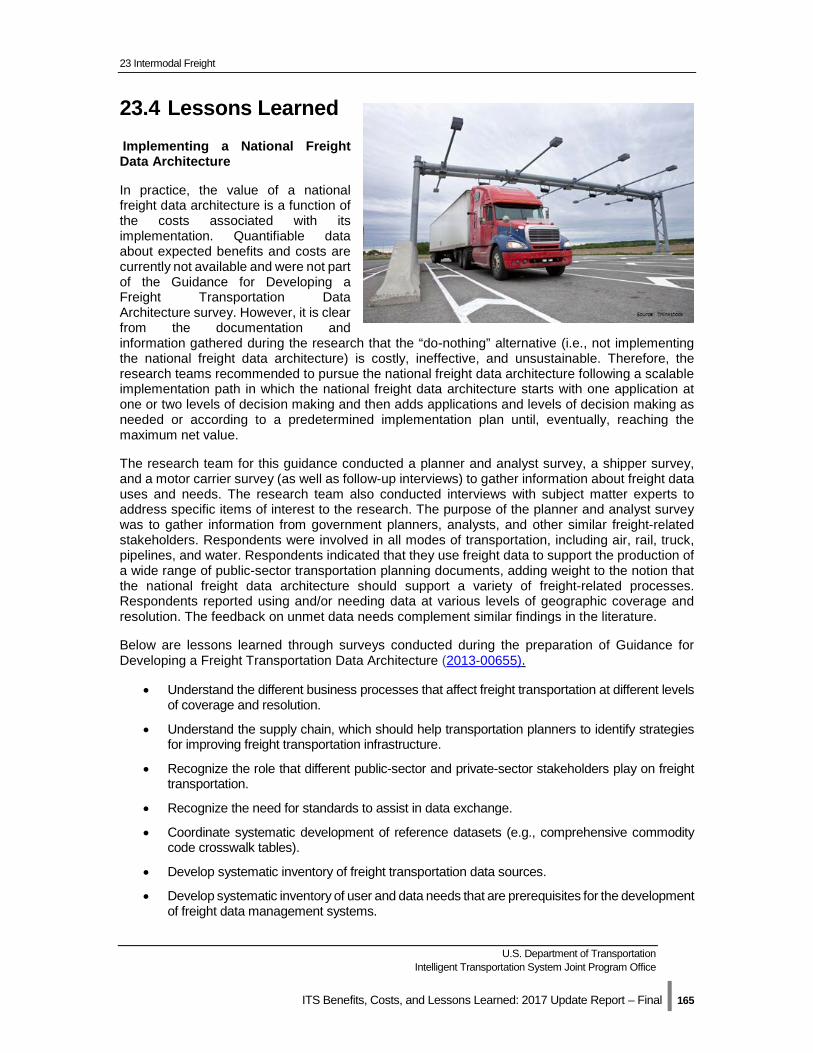
23 Intermodal Freight
U.S. Department of Transportation Intelligent Transportation System Joint Program Office
ITS Benefits, Costs, and Lessons Learned: 2017 Update Report – Final | 165
23.4 Lessons Learned Implementing a National Freight Data Architecture
In practice, the value of a national freight data architecture is a function of the costs associated with its implementation. Quantifiable data about expected benefits and costs are currently not available and were not part of the Guidance for Developing a Freight Transportation Data Architecture survey. However, it is clear from the documentation and information gathered during the research that the “do-nothing” alternative (i.e., not implementing the national freight data architecture) is costly, ineffective, and unsustainable. Therefore, the research teams recommended to pursue the national freight data architecture following a scalable implementation path in which the national freight data architecture starts with one application at one or two levels of decision making and then adds applications and levels of decision making as needed or according to a predetermined implementation plan until, eventually, reaching the maximum net value.
The research team for this guidance conducted a planner and analyst survey, a shipper survey, and a motor carrier survey (as well as follow-up interviews) to gather information about freight data uses and needs. The research team also conducted interviews with subject matter experts to address specific items of interest to the research. The purpose of the planner and analyst survey was to gather information from government planners, analysts, and other similar freight-related stakeholders. Respondents were involved in all modes of transportation, including air, rail, truck, pipelines, and water. Respondents indicated that they use freight data to support the production of a wide range of public-sector transportation planning documents, adding weight to the notion that the national freight data architecture should support a variety of freight-related processes. Respondents reported using and/or needing data at various levels of geographic coverage and resolution. The feedback on unmet data needs complement similar findings in the literature.
Below are lessons learned through surveys conducted during the preparation of Guidance for Developing a Freight Transportation Data Architecture (2013-00655).
• Understand the different business processes that affect freight transportation at different levels of coverage and resolution.
• Understand the supply chain, which should help transportation planners to identify strategies for improving freight transportation infrastructure.
• Recognize the role that different public-sector and private-sector stakeholders play on freight transportation.
• Recognize the need for standards to assist in data exchange.
• Coordinate systematic development of reference datasets (e.g., comprehensive commodity code crosswalk tables).
• Develop systematic inventory of freight transportation data sources.
• Develop systematic inventory of user and data needs that are prerequisites for the development of freight data management systems.
23 Intermodal Freight
U.S. Department of Transportation Intelligent Transportation System Joint Program Office
ITS Benefits, Costs, and Lessons Learned: 2017 Update Report – Final | 166
• Use as a reference for the identification of locations where there may be freight data redundancy and inefficiencies.
• Use as a reference for requesting funding allocations in the public and private sectors.
• Use as a reference for the development of outreach, professional development, and training materials.
Using Information Systems for Intermodal Ports
Pacific Gateway Portal (PGP) is a port user information system in a web-based form, operated by the Port of Vancouver. [2] The information available on PGP includes container status, vessel activity, and real time video images from both the port terminal side and also truck and driver identification. This system also has an option of an appointment system for trucks and dangerous goods applications. A truck appointment system is in use at all three terminals within the Port of Vancouver, and is very successful. In order to make appointments truck companies use the terminal’s web page. Appointments are matched with transactions determined by the terminal on the basis of capacities of terminal. Dedicated lanes are in use for trucks with an appointment. An approved Truck Licensing System (TLS) License is required by any party wishing to access Port of Vancouver's property for the purposes of draying marine containers to or from any of the terminals under the jurisdiction of Port Metro Vancouver. Trucks without a TLS license are not allowed to access Port Metro Vancouver property. Truckers also have to be in line at the gate entrance at least 15 minutes before expiration of their reservation time. If trucks arrive late they are required to go to the line for trucks with no reservation, or they will need a new reservation. There is no fee to use the reservation system, but there is a fee to use the web portal.
One of the major problems at marine container terminals is that the terminal gates, where trucks enter and exit the terminal to deliver or pick-up a container, are only open during certain hours on weekdays; due in part to union agreements, although operations within the terminal carry on 24/7. Consequently, trucks are forced to pick-up and deliver containers during specific hours of the day, resulting in high demand over certain periods. This phenomenon has led to inefficient gate operations that can spill traffic over to the surrounding roadway network causing serious safety and congestion problems. The problem of congestion also extends to the yard of the terminals where coupled with capacity issues, it can degrade the reliability and performance of carriers, shippers, and terminal operators. In addition to the deterioration of the performance of terminal and drayage operations, the environmental effects from idling trucks has also been starting to emerge as a serious problem as truck emissions have been linked to health conditions including asthma, cancer and heart disease [3].
Since intermodal freight terminals tend to be located in or near major cities, where right of way is limited and very expensive, implementing operational strategies to reduce the effect of the terminals’ truck related traffic on the surrounding roadway network and the terminal operations becomes more important and more viable than physical capacity expansions. Because of this, there is much research focusing on improving efficiency in the operations of intermodal marine container terminals without having to expand physical capacity. Below are a few of the lessons learned through implementation of the types of systems used at the Port of Vancouver (2013-00652):
• Coordinate between trucking companies and port intermodal terminals for efficient terminal operations. Gates that are clogged can worsen terminal capacity and this creates not only an operational but also an environmental problem. For a tactical/operational level gate strategy system to be effective, a large percentage of trucks will have to use it, and there has to be some priority or benefit for trucks with appointments. Incentives are necessary to get trucking companies to buy into appointment systems and actually make appointments (and keep them). Incentives may also be needed for the terminals to use the systems effectively. Gate appointments are a more favored alternative than extended gate hours, since the cost is lower.
23 Intermodal Freight
U.S. Department of Transportation Intelligent Transportation System Joint Program Office
ITS Benefits, Costs, and Lessons Learned: 2017 Update Report – Final | 167
• Deploy and expand gate appointment systems. Gate appointment systems have the potential to dramatically improve operations inside the terminal as well as at the gate, and as a secondary result, reduce congestion on the roadway system, and therefore reduce harmful emissions in the neighboring communities. Of course, as freight shipping increases, there will be a point that limits the amount of trucks and containers that can physically be processed within the constraints of terminal boundaries, but there is certainly room for improvement now, before reaching that point. For extended gate hours, additional workers are required at off-peak times, but this is a viable option to increase throughput at terminals. It will require that additional workers be added, hours and pay contracts be adjusted and associated businesses buy-in, but there is potential for greater amounts of container movement without the need to expand terminals.
Increased efficiency at intermodal port terminals due to any or all of the strategies discussed in this paper can affect the overall transportation community and all other types of intermodal transportation by allowing more containers to be shipped, and moved more quickly away from the ports, onto the other forms of transportation, and to their final destinations. Appointment systems and extended hours, as well as the managing technologies can be used by other modes experiencing congestion and air quality concerns to increase efficiency, thereby lowering congestion and emissions. The key to developing effective gate appointment systems is to ensure participation from all key stakeholders.
Joint Program Office U.S. Department of Transportation, Research and Innovative Technology Administration
ITS Benefits, Costs, and Lessons Learned: Update Report - Final | 168
24 Electronic Payment and Pricing
24.1 Introduction Congestion pricing, also known as road pricing or value pricing, uses ITS technology to charge motorists a fee that varies with the level of congestion. Value pricing reflects the idea that road pricing directly benefits motorists through reduced congestion and improved roadways. To eliminate additional congestion, most pricing schemes are set up electronically to offer a more reliable trip time without creating additional delay. Congestion pricing is different from tolling in that pricing strategies are used primarily to manage congestion or demand for highway travel, while also generating revenue to repay a bond or debt.
The U.S. DOT Congestion Pricing Primer describes four main types of congestion pricing strategies [1]:
• Variable priced lanes including express toll lanes and high-occupancy toll (HOT) lanes.
• Variable tolls on entire roadways or roadway segments (i.e., changing flat toll rates on existingtoll roads to variable rates based on congestion levels).
• Cordon charge (i.e., charging a fee to enter or drive in a congested area).
• Area-wide charge including distance-based charging or mileage fees.
The electronic payment and pricing applications profiled in this chapter, particularly variable tolling and congestion pricing are key elements of the U.S. DOT Tolling and Pricing Program. For more information please visit FHWA’s Congestion Pricingsite: http://www.ops.fhwa.dot.gov/congestionpricing/index.htm.
24.2 Benefits Electronic toll collection is a proven technology that has greatly reduced toll plaza delays, with corresponding improvements in capacity, agency cost savings, and fuel consumption reductions.
Electronic tolling can also produce safety benefits. Underused HOV lanes may irritate solo drivers on general purpose lanes, and hence motivate them to “cheat" and make a sudden entry. HOT lanes can help reduce violations and thus sudden entries by giving solo drivers a choice to opt in. Analysis revealed that violation rates on I-394 decreased following the implementation of MnPASS’ transponder-based electronic tolling. This was particularly evident in the diamond lane sections of the corridor where violation rates fell from 20 percent to nine percent (2015-01019).
Congestion pricing builds on the success of electronic tolling and “benefits drivers by reducing delays and stress, businesses by improving delivery and arrival times, transit agencies by improving transit speeds, and state and local governments by improving the quality of transportation services without tax increases or large capital expenditures, and by providing additional revenues for funding transportation.”[2] Recent congestion pricing initiatives have produced positive benefit-cost ratios, ranging from 6:1 to 25:1, as shown in Table 24-1.
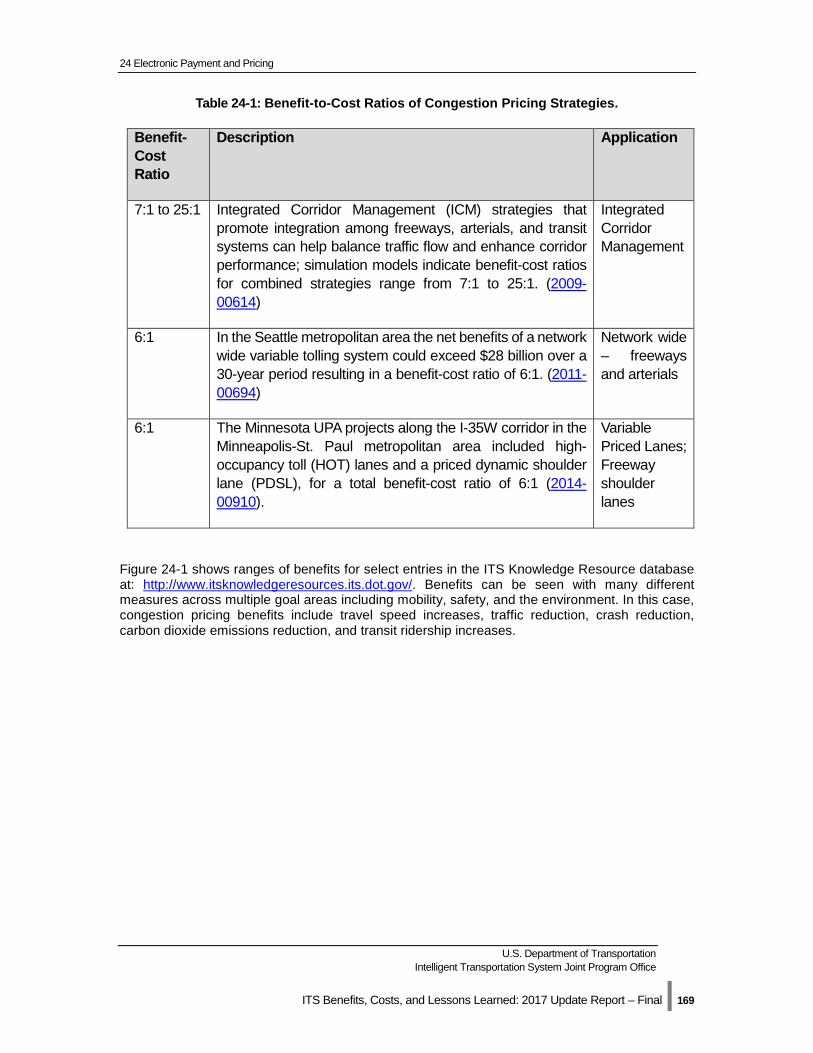
24 Electronic Payment and Pricing
U.S. Department of Transportation Intelligent Transportation System Joint Program Office
ITS Benefits, Costs, and Lessons Learned: 2017 Update Report – Final | 169
Table 24-1: Benefit-to-Cost Ratios of Congestion Pricing Strategies.
Benefit-Cost Ratio
Description Application
7:1 to 25:1 Integrated Corridor Management (ICM) strategies that promote integration among freeways, arterials, and transit systems can help balance traffic flow and enhance corridor performance; simulation models indicate benefit-cost ratios for combined strategies range from 7:1 to 25:1. (2009-00614)
Integrated Corridor Management
6:1 In the Seattle metropolitan area the net benefits of a network wide variable tolling system could exceed $28 billion over a 30-year period resulting in a benefit-cost ratio of 6:1. (2011-00694)
Network wide – freeways and arterials
6:1 The Minnesota UPA projects along the I-35W corridor in the Minneapolis-St. Paul metropolitan area included high-occupancy toll (HOT) lanes and a priced dynamic shoulder lane (PDSL), for a total benefit-cost ratio of 6:1 (2014-00910).
Variable Priced Lanes; Freeway shoulder lanes
Figure 24-1 shows ranges of benefits for select entries in the ITS Knowledge Resource database at: http://www.itsknowledgeresources.its.dot.gov/. Benefits can be seen with many different measures across multiple goal areas including mobility, safety, and the environment. In this case, congestion pricing benefits include travel speed increases, traffic reduction, crash reduction, carbon dioxide emissions reduction, and transit ridership increases.
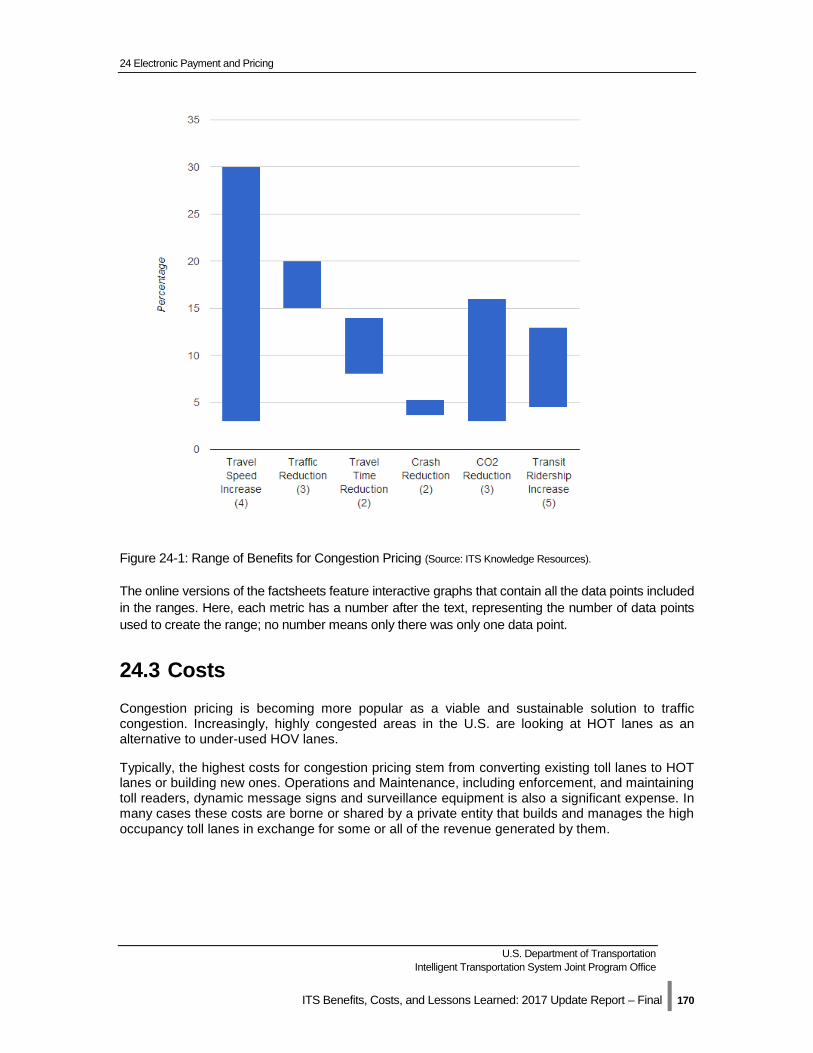
24 Electronic Payment and Pricing
U.S. Department of Transportation Intelligent Transportation System Joint Program Office
ITS Benefits, Costs, and Lessons Learned: 2017 Update Report – Final | 170
Figure 24-1: Range of Benefits for Congestion Pricing (Source: ITS Knowledge Resources).
The online versions of the factsheets feature interactive graphs that contain all the data points included in the ranges. Here, each metric has a number after the text, representing the number of data points used to create the range; no number means only there was only one data point.
24.3 Costs Congestion pricing is becoming more popular as a viable and sustainable solution to traffic congestion. Increasingly, highly congested areas in the U.S. are looking at HOT lanes as an alternative to under-used HOV lanes.
Typically, the highest costs for congestion pricing stem from converting existing toll lanes to HOT lanes or building new ones. Operations and Maintenance, including enforcement, and maintaining toll readers, dynamic message signs and surveillance equipment is also a significant expense. In many cases these costs are borne or shared by a private entity that builds and manages the high occupancy toll lanes in exchange for some or all of the revenue generated by them.
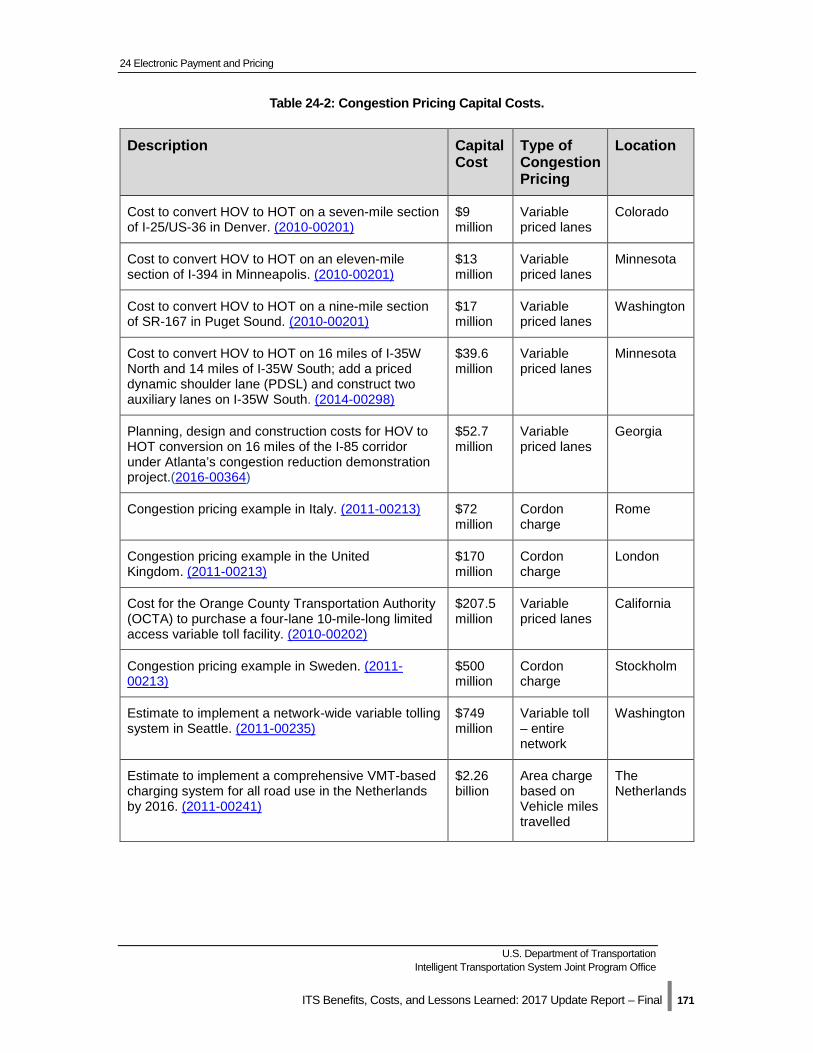
24 Electronic Payment and Pricing
U.S. Department of Transportation Intelligent Transportation System Joint Program Office
ITS Benefits, Costs, and Lessons Learned: 2017 Update Report – Final | 171
Table 24-2: Congestion Pricing Capital Costs.
Description Capital Cost
Type of Congestion Pricing
Location
Cost to convert HOV to HOT on a seven-mile section of I-25/US-36 in Denver. (2010-00201)
$9 million
Variable priced lanes
Colorado
Cost to convert HOV to HOT on an eleven-mile section of I-394 in Minneapolis. (2010-00201)
$13 million
Variable priced lanes
Minnesota
Cost to convert HOV to HOT on a nine-mile section of SR-167 in Puget Sound. (2010-00201)
$17 million
Variable priced lanes
Washington
Cost to convert HOV to HOT on 16 miles of I-35W North and 14 miles of I-35W South; add a priced dynamic shoulder lane (PDSL) and construct two auxiliary lanes on I-35W South. (2014-00298)
$39.6 million
Variable priced lanes
Minnesota
Planning, design and construction costs for HOV to HOT conversion on 16 miles of the I-85 corridor under Atlanta’s congestion reduction demonstration project.(2016-00364)
$52.7 million
Variable priced lanes
Georgia
Congestion pricing example in Italy. (2011-00213) $72 million
Cordon charge
Rome
Congestion pricing example in the United Kingdom. (2011-00213)
$170 million
Cordon charge
London
Cost for the Orange County Transportation Authority (OCTA) to purchase a four-lane 10-mile-long limited access variable toll facility. (2010-00202)
$207.5 million
Variable priced lanes
California
Congestion pricing example in Sweden. (2011-00213)
$500 million
Cordon charge
Stockholm
Estimate to implement a network-wide variable tolling system in Seattle. (2011-00235)
$749 million
Variable toll – entire network
Washington
Estimate to implement a comprehensive VMT-based charging system for all road use in the Netherlands by 2016. (2011-00241)
$2.26 billion
Area charge based on Vehicle miles travelled
The Netherlands
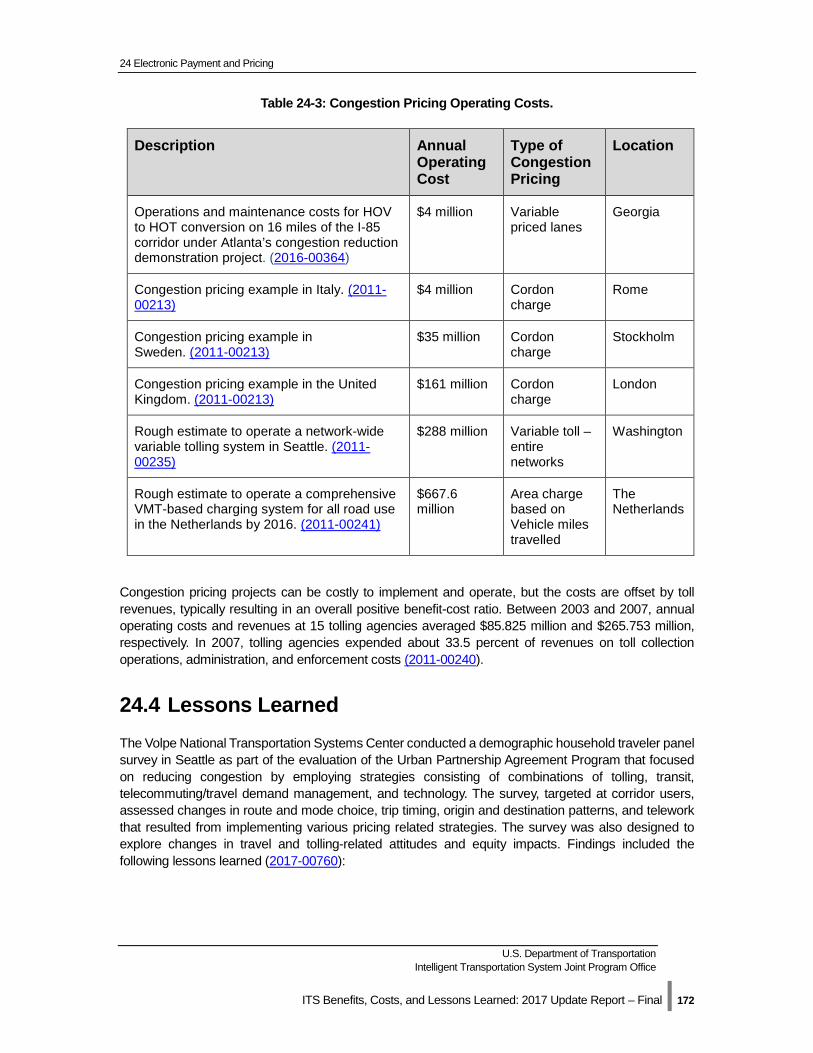
24 Electronic Payment and Pricing
U.S. Department of Transportation Intelligent Transportation System Joint Program Office
ITS Benefits, Costs, and Lessons Learned: 2017 Update Report – Final | 172
Table 24-3: Congestion Pricing Operating Costs.
Description Annual Operating Cost
Type of Congestion Pricing
Location
Operations and maintenance costs for HOV to HOT conversion on 16 miles of the I-85 corridor under Atlanta’s congestion reduction demonstration project. (2016-00364)
$4 million Variable priced lanes
Georgia
Congestion pricing example in Italy. (2011-00213)
$4 million Cordon charge
Rome
Congestion pricing example in Sweden. (2011-00213)
$35 million Cordon charge
Stockholm
Congestion pricing example in the United Kingdom. (2011-00213)
$161 million Cordon charge
London
Rough estimate to operate a network-wide variable tolling system in Seattle. (2011-00235)
$288 million Variable toll – entire networks
Washington
Rough estimate to operate a comprehensive VMT-based charging system for all road use in the Netherlands by 2016. (2011-00241)
$667.6 million
Area charge based on Vehicle miles travelled
The Netherlands
Congestion pricing projects can be costly to implement and operate, but the costs are offset by toll revenues, typically resulting in an overall positive benefit-cost ratio. Between 2003 and 2007, annual operating costs and revenues at 15 tolling agencies averaged $85.825 million and $265.753 million, respectively. In 2007, tolling agencies expended about 33.5 percent of revenues on toll collection operations, administration, and enforcement costs (2011-00240).
24.4 Lessons Learned The Volpe National Transportation Systems Center conducted a demographic household traveler panel survey in Seattle as part of the evaluation of the Urban Partnership Agreement Program that focused on reducing congestion by employing strategies consisting of combinations of tolling, transit, telecommuting/travel demand management, and technology. The survey, targeted at corridor users, assessed changes in route and mode choice, trip timing, origin and destination patterns, and telework that resulted from implementing various pricing related strategies. The survey was also designed to explore changes in travel and tolling-related attitudes and equity impacts. Findings included the following lessons learned (2017-00760):
24 Electronic Payment and Pricing
U.S. Department of Transportation Intelligent Transportation System Joint Program Office
ITS Benefits, Costs, and Lessons Learned: 2017 Update Report – Final | 173
• Pricing influences travel behavior, particularly with respect to route choice and the timing of trips. Even modest toll levels can significantly shift traffic volumes, route and lane choice, modes used, and vehicle occupancies.
• Travelers have a surprising amount of flexibility in their overall levels of travel. Diary data from Seattle showed respondents reduced their use of the priced route, total trips fell 14 percent, VMT decreased 15 percent, and average daily time spent traveling decreased 12 percent.
• Pricing affects the timing of trips in complex ways. General demand by time-of-day did not change significantly; however, there were small but measureable increases in the share of vehicle trips that occurred during the peak period
• Pricing does not appear to have a noticeable impact on telecommuting. Tolling did not lead to any increase in telecommuting.
• Travelers appreciate improved traffic conditions from variable tolling. Improvements in travel times on the tolled facility are noticed and appreciated by travelers. It led to greater levels of subjective trip satisfaction among SR-520 users.
• Attitudes toward tolling change with direct experience. In Seattle, general attitudes toward tolling shifted in a positive direction after the project was implemented.
• There are demographic differences in responses to tolling, mostly related to income. Although respondents of all income groups used the tolled facilities, the heaviest users were disproportionately from upper-income households.
Lessons learned lead to the following implications for deployment of congestion pricing strategies:
• Near term shifts in mode or increases in carpool size require programmatic support. Travelers are much more apt to make changes to their number of trips, the timing of those trips, and their choice of route (or lane), than they are to make more fundamental shifts in their mode of travel. For regions contemplating congestion pricing, this is an important consideration. The region may need to conduct additional community outreach and programmatic support to generate larger shifts in transit, carpooling, and telework.
• Make requirements for using a priced facility as simple and convenient as possible. • The more public communication, the better. A robust outreach plan, with ongoing and
constant public communication, can be a great tool to prepare the public for the new system.
• Agencies should anticipate that pricing will have differential impacts on corridor users. Road pricing creates a set of “winners” and “losers” in the region.
• Strong community and civic engagement supports a positive response to road pricing.
24.5 Case Study - Mileage-Based User Fee (MBUF) Pilot Project
Revenue derived from fuel taxes is a crucial source of funding for state departments of transportation, however, these revenues have decreased in recent years as vehicles have become more efficient. As a result, states have expressed growing interest in exploring options for replacing or supplementing the fuel tax, including the possibility of implementing road user fees, such as mileage-based user fees (MBUF) in many cases.
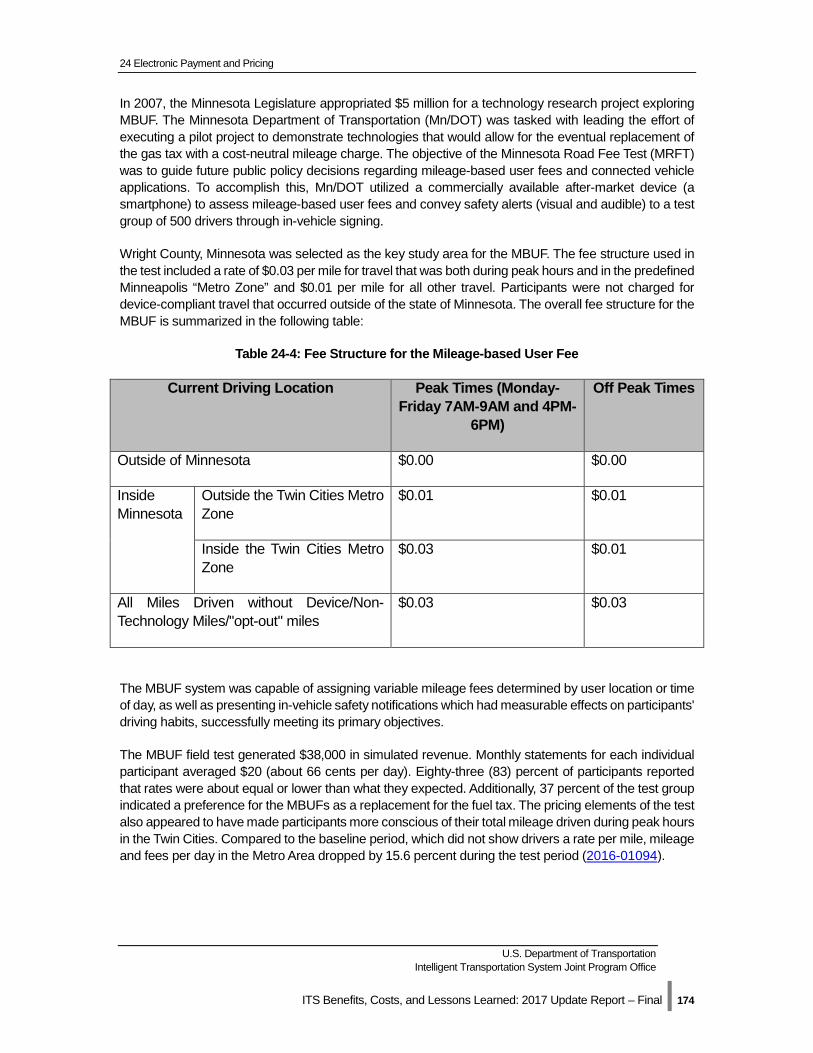
24 Electronic Payment and Pricing
U.S. Department of Transportation Intelligent Transportation System Joint Program Office
ITS Benefits, Costs, and Lessons Learned: 2017 Update Report – Final | 174
In 2007, the Minnesota Legislature appropriated $5 million for a technology research project exploring MBUF. The Minnesota Department of Transportation (Mn/DOT) was tasked with leading the effort of executing a pilot project to demonstrate technologies that would allow for the eventual replacement of the gas tax with a cost-neutral mileage charge. The objective of the Minnesota Road Fee Test (MRFT) was to guide future public policy decisions regarding mileage-based user fees and connected vehicle applications. To accomplish this, Mn/DOT utilized a commercially available after-market device (a smartphone) to assess mileage-based user fees and convey safety alerts (visual and audible) to a test group of 500 drivers through in-vehicle signing.
Wright County, Minnesota was selected as the key study area for the MBUF. The fee structure used in the test included a rate of $0.03 per mile for travel that was both during peak hours and in the predefined Minneapolis “Metro Zone” and $0.01 per mile for all other travel. Participants were not charged for device-compliant travel that occurred outside of the state of Minnesota. The overall fee structure for the MBUF is summarized in the following table:
Table 24-4: Fee Structure for the Mileage-based User Fee
Current Driving Location Peak Times (Monday-Friday 7AM-9AM and 4PM-
6PM)
Off Peak Times
Outside of Minnesota $0.00 $0.00
Inside Minnesota
Outside the Twin Cities Metro Zone
$0.01 $0.01
Inside the Twin Cities Metro Zone
$0.03 $0.01
All Miles Driven without Device/Non-Technology Miles/"opt-out" miles
$0.03 $0.03
The MBUF system was capable of assigning variable mileage fees determined by user location or time of day, as well as presenting in-vehicle safety notifications which had measurable effects on participants' driving habits, successfully meeting its primary objectives.
The MBUF field test generated $38,000 in simulated revenue. Monthly statements for each individual participant averaged $20 (about 66 cents per day). Eighty-three (83) percent of participants reported that rates were about equal or lower than what they expected. Additionally, 37 percent of the test group indicated a preference for the MBUFs as a replacement for the fuel tax. The pricing elements of the test also appeared to have made participants more conscious of their total mileage driven during peak hours in the Twin Cities. Compared to the baseline period, which did not show drivers a rate per mile, mileage and fees per day in the Metro Area dropped by 15.6 percent during the test period (2016-01094).
Joint Program Office U.S. Department of Transportation, Research and Innovative Technology Administration
ITS Benefits, Costs, and Lessons Learned: Update Report - Final | 175
References
1 Introduction
[1] FHWA Office of Safety, “Facts & Statistics,” http://safety.fhwa.dot.gov/facts_stats/, last accessed January 30, 2014.
[2] U.S. DOT ITS Joint Program Office, ITS ePrimer, 2013. http://www.pcb.its.dot.gov/eprimer/module1.aspx
2 Connected Vehicle – Safety
[1] Chang et al, Noblis, “Estimated Benefits of Connected Vehicle Applications: Dynamic Mobility Applications, AERIS, V2I Safety, and Road Weather Management”, Feb 2017, FHWA-JPO-15-255.
[2] National Highway Traffic Safety Administration, Department of Transportation, Notice of Proposed Rulemaking (NPRM), Federal Motor Vehicle Safety Standards; V2V Communications; 49 CFR Part 571, [Docket No. NHTSA-2016-0126] RIN 2127-AL55, December 2016.
[3] Kevin Gay, Valarie Kniss et al, Safety Pilot Model Deployment: Lessons Learned and Recommendations for Future Connected Vehicle Activities, U.S. Department of Transportation, September 2015, FHWA-JPO-16-363, http://ntl.bts.gov/lib/59000/59300/59361/FHWA-JPO-16-363.pdf
3 Connected Vehicle – Mobility
[1] Estimated Benefit of Connected Vehicles: Dynamic Mobility Applications, AERIS, V2I Safety, and Road Weather Management Applications. FHWA. Final Report. Report No. FHWA-JPO-15-255. August 2015.
4 Connected Vehicle – Environment
[1] Applications for the Environment Real-Time Information Synthesis Capstone Report: 2009 to 2014 Executive Summary. USDOT. http://www.its.dot.gov/research_archives/aeris/pdf/AERIS_Capstone_ExecSummary.pdf
5 Automated Vehicles
[1] U.S. DOT Releases Policy on Automated Vehicle Development. USDOT NHTSA, Briefing No. 14-13. 30 May 2013.
[2] “Average Annual Miles per Driver by Age Group,” USDOT FHWA OIP, Webpage https://www.fhwa.dot.gov/ohim/onh00/bar8.htm. Accessed 13 February 2017.
References
U.S. Department of Transportation Intelligent Transportation System Joint Program Office
ITS Benefits, Costs, and Lessons Learned: 2017 Update Report – Final | 176
[3] America’s Best Drivers Report. Allstate Insurance Company. 2016.
[4] Blincoe, et.al. The Economic and Societal Impact of Motor Vehicle Crashes 2010 (Revised), USDOT NHTSA, Report No. HS 812 013. May 2015.
[5] The Changing Face of Transportation. USDOT, Report No. BTS00-007. 2000.
6 Smart Cities
[1] United States Department of Transportation. “Smart City Challenge.” https://www.transportation.gov/smartcity
[2] New York City Mayor’s Office of Technology and Innovation. “Building a Smart + Equitable City.” https://www1.nyc.gov/site/forward/innovations/smartnyc.page
7 Accessible Transportation
[1] U.S. DOT Bureau of Transportation Statistics, Issue Brief: Transportation Difficulties Keep Over Half a Million Disabled at Home, 2003
[2] National Organization on Disability, N.O.D./Harris Survey of Americans with Disabilities, 2000. Available at: http://www.nod.org/content.cfm?id=798
[3] Accessible Transportation Technologies Research Initiative (ATTRI), User Needs Assessment Report, U.S.DOT, Final Report — March 2016, FHWA-JPO-16-354. http://ntl.bts.gov/lib/60000/60100/60128/FHWA-JPO-16-354.pdf
8 Mobility on Demand (MOD)
[1] Mobility on Demand- Research Program Framework. U.S. DOT Federal Transit Administration. September 2016.
[2] “U.S. Transportation Secretary Foxx Announces $8 Million in Groundbreaking Mobility on Demand Grants to Transform Public Transit.” MOD Fact Sheet, U.S. DOT Federal Transit Administration, Website: https://cms.dot.gov/sites/dot.gov/files/docs/FactSheet_MOD_20161013.pdf. Accessed 12 January 2017.
[3] “UbiGo: Unified everyday travel service for urban households,” UbiGo Innovation, Gothenburg, Sweden. Website: http://www.ubigo.se/las-mer/about-english/. Accessed 12 January 2017.
9.1 Arterial Management Overview
[1] Speed and Red Light Cameras. Governors Highway Safety Association. http://www.ghsa.org/html/issues/auto_enforce.html
[2] Taylor, M. (2014, August 14). Weather-Responsive Traffic Signal Control in Utah. Salt Lake City, Utah. Retrieved from http://www.its.dot.gov/presentations/Road_Weather2014/10A%20WRTM%20UDOT%20Weather%20Responsive%20Traffic%20Signal%20Management%20in%20Utah%208-14-14.pdf
References
U.S. Department of Transportation Intelligent Transportation System Joint Program Office
ITS Benefits, Costs, and Lessons Learned: 2017 Update Report – Final | 177
[3] Haseman, R., Day, C., & Bullock, D. (2010). Using Performance Measures To Improve Signal System Performance. West Lafayette: Purdue University.
[4] Balke, K., & Gopalakrishna, D. (2013). Utah DOT Weather Responsive Traffic Signal Timing. Washington DC: Federal Highway Administration. Retrieved from http://ntl.bts.gov/lib/51000/51100/51165/C42F9252.pdf
9.2 Arterial Management Traffic Control
[1] U.S. Department of Transportation. Federal Highway Administration. “Accelerating Innovation, Every Day Counts” Retrieved on January 7, 2014. http://www.fhwa.dot.gov/everydaycounts/technology/adsc/.
10.1 Freeway Management Overview
[1] OR217: Active Traffic Management. Oregon DOT. December 29, 2015.
[2] “OR 217 Active Traffic Management, Category: Best New Innovative Product, Service, or Application.” Oregon DOT.
[3] “OR217 Active Traffic Management (ATM) Project.” Oregon Department of Transportation. http://www.nascio.org/portals/0/awards/nominations2015/2015/2015OR6-Oregon-ODOT-2015%20-%20OR217%20ATM%20Project.pdf
10.2 ICM
[1] “ITS ePrimer: Module 3 (Presentation),” Professional Capacity Building (PCB) Program, U.S. DOT RITA. September 2013. URL: http://www.pcb.its.dot.gov/eprimer/documents/module3p.pdf. Last accessed 22 April 2014.
[2] Anton, Lubov, and Associates. “Economic Analysis,” Presentation, Minneapolis, MN. 2003. URL: http://nexus.umn.edu/Presentations/Northstar_economics.pdf. Last accessed 30 January 2014.
[3] Integrated Corridor Management Newsletter – 2012. U.S. DOT RITA webpage. URL: http://www.its.dot.gov/icms/docs/knowledgebase/html/news_fall12.htm. Last accessed 22 April 2014.
[4] Integrated Corridor Management: Implementation Guide and Lessons Learned – Version 2.0, U.S. DOT Federal Highway Administration website. URL: http://ntl.bts.gov/lib/59000/59600/59604/FHWA-JPO-16-280.pdf. Last accessed 6 September 2016.
11 Roadway Operations and Maintenance/Work Zone Management
[1] Zheng, Ahn, Monsere. "Impact of traffic oscillations on freeway crash occurrences," Accident Analysis and Prevention, Vol. 42(2), 2010, pp. 626-636. http://eprints.qut.edu.au/41883/2/41883.pdf
References
U.S. Department of Transportation Intelligent Transportation System Joint Program Office
ITS Benefits, Costs, and Lessons Learned: 2017 Update Report – Final | 178
[2] Lee, Chris. “Assessing Safety Benefits of Variable Speed Limits,” Transportation Research Record 1894, Report No. 04-4835. 2004. http://www.civil.uwaterloo.ca/bhellinga/publications/Publications/TRR%202004%20Assessing%20VSL%20(04-4835).pdf
12 Crash Prevention and Safety
[1] National Highway Traffic Safety Administration. Traffic Safety Facts. Early Estimate of Motor Vehicle Traffic Fatalities for the First 9 Months of 2016 January 2017. https://crashstats.nhtsa.dot.gov/Api/Public/ViewPublication/812358.
[2] Becic, E., & Manser, M. (2013). Cooperative Intersection Collision Avoidance System - Stop Sign Assist (CICAS-SSA). Saint Paul: Minnesota Department of Transportation. http://ihub.dot.state.mn.us/its/projects/2011-2015/cicas/trafficbasedfotfinalreport.pdf
[3] “Cooperative Intersection Collision Avoidance System – Stop Sign Assist (CICAS-SSA)” University of Minnesota, ITS Institute. http://www.its.umn.edu/Research/FeaturedStudies/intersections/cicas.html
13 Road Weather Management
[1] “How do Weather Events Impact Roads?” U.S. DOT FHWA Office of Operations Road Weather Management Program Website. http://www.ops.fhwa.dot.gov/weather/q1_roadimpact.htm. Accessed January 10, 2017.
[2] Goodwin, L., Weather Impacts on Arterial Traffic Flow, Mitretek Systems, Falls Church, VA. December 2002.
14.1 Operations And Fleet Management
[1] Miller, Virginia. Transit News Press Release, “Record 10.8 Billion Trips Taken On U.S. Public Transportation In 2014.” American Public Transportation Association. March 2015. http://www.apta.com/mediacenter/pressreleases/2015/pages/150309_ridership.aspx
[2] Dickens, M. Trends in Public Transportation Vehicle Fleets. Passenger Transport. 2015. http://www.apta.com/passengertransport/PT/Passenger%20Transport_Dec_21%202015_vehicle%20database.pdf
14.2 Information Dissemination
[1] Miller, Virginia. Transit News Press Release, “Record 10.8 Billion Trips Taken On U.S. Public Transportation In 2014.” American Public Transportation Association. March 2015. http://www.apta.com/mediacenter/pressreleases/2015/pages/150309_ridership.aspx
[2] TransitScreen blog: “Changing Urban Transportation with Real-Time Screens.” April 20, 2016. https://transitscreen.com/blog/changing-urban-transportation-with-real-time-screens/
15 Transportation Management Center
References
U.S. Department of Transportation Intelligent Transportation System Joint Program Office
ITS Benefits, Costs, and Lessons Learned: 2017 Update Report – Final | 179
[1] Federal Highway Administration, “Impacts of Technology Advancements on Transportation Management Center Operations”, January 2013. http://www.ops.fhwa.dot.gov/publications/fhwahop13008/fhwahop13008.pdf
[2] Intelligent Transportation Systems Joint Program Office, Transportation Management Center Data Capture for Performance and Mobility Measures Reference Manual, March 27, 2013. http://ntl.bts.gov/lib/47000/47500/47563/FHWA-JPO-13-055_Final_Pkg_508.pdf
[3] Intelligent Transportation Systems Joint Program Office, “Longitudinal Study of ITS Implementation: Decision Factors and Effects”, April 2013. http://www.its.dot.gov/research/pdf/longitudinal_study.pdf
[4] TRANSCOM. “An Introduction to TRANSCOM’s DFE/SPATEL Data Analysis Tool (Draft White Paper V0.4)”, June 2015. http://isgnew.infosenseglobal.com/white-paper/TRANSCOM-DFE-SPATE.pdf
[5] NYCDOT and NYSDOT. “ICM-495 Technical Memorandum: Corridor Operating Conditions, Inventory, and Needs (COIN)”, June 10, 2016.
16 Alternative Fuels
[1] U.S. Department of Energy. Alternative Fuels Data Center. Retrieved October 11, 2013. http://www.afdc.energy.gov
[2] U.S. Department of Energy. Maps and Data - AFV and HEV Model Offerings, By Manufacturer. Retrieved January 30, 2017. http://www.afdc.energy.gov/data/10304.
[3] U.S. Department of Energy. “Liquefied Natural Gas Allows for Cleaner Refuse Collection in Sacramento.” Retrieved October 11, 2013, from Alternative Fuels and Advanced Vehicles Data Center:
[4] The Intelligent Transportation Society of America (ITS America). “Electrification and the Smart Grid.” Retrieved October 14, 2013. www.its.dot.gov/research/pdf/Vehicle_ElectrificationSmartGrid201%20ITSA.pdf
[5] KAIST’s wireless Online Electric Vehicle (OLEV) runs inner city roads. Retrieved January 30, 2017. http://www.kaist.edu/_prog/_board/?mode=V&code=ed_news&no=10429&site_dvs_cd=en&menu_dvs_cd=0601&gubun=4404&site_dvs
[6] South Coast Air Quality Management District and Gladstein, Neandross & Associates. “Zero Emission Catenary Hybrid Truck Market Study.” March 8 2012. http://www.transpowerusa.com/wordpress/wp-content/uploads/2012/06/ZETECH_Market_Study_FINAL_2012_03_08.pdf
[7] U.S. Department of Energy. Plug-in Electric Vehicle Handbook. Retrieved January 30, 2017. http://www.afdc.energy.gov/pdfs/51227.pdf
[8] U.S. Department of Energy. “Natural Gas Benefits and Considerations.” Retrieved October 11, 2013. http://www.afdc.energy.gov/fuels/natural_gas_benefits.html
References
U.S. Department of Transportation Intelligent Transportation System Joint Program Office
ITS Benefits, Costs, and Lessons Learned: 2017 Update Report – Final | 180
[9] Flash-Charging Electric Public Transport: TOSA Buses. CPES- Centre for European Policy Studies. Retrieved January 30, 2017. http://pocacito.eu/sites/default/files/TOSA_Geneva.pdf
17 Traffic Incident Management
[1] National Strategy to Reduce Congestion on America's Transportation Network, Prepared by the U.S. DOT. May 2006.
[2] Shah, Vaishali et al. “Longitudinal Study of ITS Implementation: Decision Factors and Effects – Final Report”, FHWA-JPO-13-067, April 2013, available at: http://www.its.dot.gov/research/pdf/longitudinal_study.pdf
18 Emergency Management
All other data referenced is available through the ITS Knowledge Resources Database, which can be found at http://www.itsknowledgeresources.its.dot.gov/
19 Traveler Information
All other data referenced is available through the ITS Knowledge Resources Database, which can be found at http://www.itsknowledgeresources.its.dot.gov/
20.1 Connected Eco Driving, Intelligent Speed Control, Adaptive Cruise Control, Platooning
[1] Impacts of Technology Advancements on Transportation Management Center Operations, FHWA, January 2013. http://www.ops.fhwa.dot.gov/publications/fhwahop13008/fhwahop13008.pdf
[2] Transportation Management Center Data Capture for Performance and Mobility Measures Reference Manual, USDOT ITS Joint Program Office, March 27, 2013. http://ntl.bts.gov/lib/47000/47500/47563/FHWA-JPO-13-055_Final_Pkg_508.pdf
20.2 Navigation / Route Guidance, Driver Communications, And In-Vehicle Monitoring
All other data referenced is available through the ITS Knowledge Resources Database, which can be found at http://www.itsknowledgeresources.its.dot.gov/
21 Information Management
[1] Murphy, Ian B., “University of Maryland Breaks Down Traffic Data Silos by Showing ROI,” Data Informed, September 26, 2012. http://data-informed.com/university-of-maryland-breaks-down-traffic-data-silos-by-showing-roi/.
22 Commercial Vehicle Operations
[1] “Benefits of Commercial Vehicle Information Systems and Networks Program,” USDOT FMCSA. September 2008.
References
U.S. Department of Transportation Intelligent Transportation System Joint Program Office
ITS Benefits, Costs, and Lessons Learned: 2017 Update Report – Final | 181
[2] Colorado Truck Parking Information Management System, Fastlane 2016, Colorado DOT. 14 April 2016. URL: https://www.codot.gov/programs/planning/documents/plans-projects-reports/projects/fastlane-applications/truck-parking-information.pdf
[3] “Wireless Roadside Inspections for Trucks and Buses,” Smart Roadside Workshop, U.S. DOT FMCSA. 2008.
[4] “Using FMCSA’s CVISN Grants to Deploy ITS for Truck Parking,” ITS America 25th Annual Meeting, U.S. DOT FMCSA. June 2015. URL: http://www.its.dot.gov/presentations/its_america2015/SmartPark_TR01.pdf
[5] MAASTO Regional Truck Parking Information Management System (TPIMS) TIGER Proposal 2015. URL: http://www.maasto.net/documents/TPIMS-Grant.pdf
[6] MAASTO Regional Truck Parking Information Management System (TPIMS) Executive Summary. 2015. URL: http://www.maasto.net/documents/TPIMS-Summary.pdf
[7] Tiger Benefit-Cost Analysis (BCA) Resource Guide. 2015. URL: https://www.transportation.gov/policy-initiatives/tiger/tiger-benefit-cost-analysis-bca-resource-guide
23 Intermodal Freight
[1] Federal Motor Carrier Safety Administration, Hazardous Materials Safety and Security Technology Field Operational Test Volume IIl. U.S. DOT. December 2004.
[2] Pacific Gateway Portal. 2008. http://www.pacificgatewayportal.com/
[3] Solomon, D., Bailey G., “Pollution Prevention at Ports: Cleaning the Air.” Environmental Assessment Review, Vol. 24, pp. 749-774, 2004.
24 Electronic Payment and Pricing
[1] What is Congestion Pricing?” Congestion Pricing, A Primer, U.S DOT Federal Highway Administration website, http://ops.fhwa.dot.gov/Publications/congestionpricing/sec2.htm, last accessed 2/6/2017.
[2] Benefits of Congestion Pricing,” Congestion Pricing, A Primer, U.S DOT Federal Highway Administration website, http://ops.fhwa.dot.gov/Publications/congestionpricing/sec3.htm, last accessed 2/6/2017.
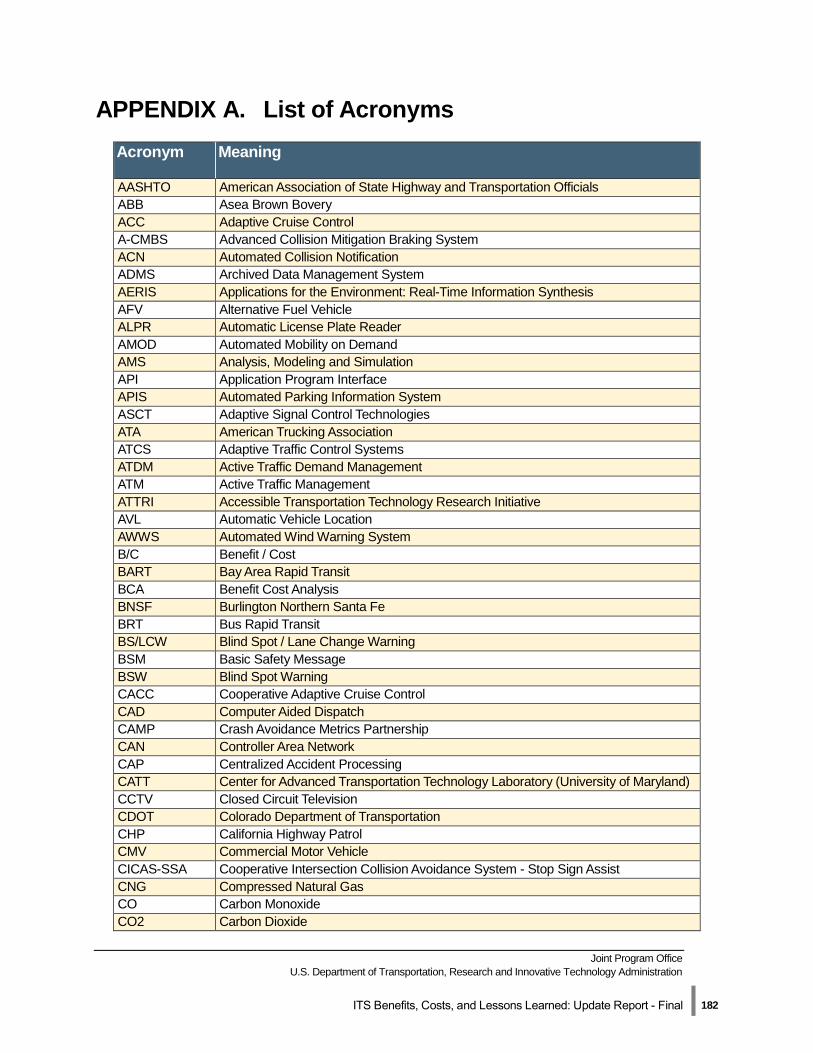
Joint Program Office U.S. Department of Transportation, Research and Innovative Technology Administration
ITS Benefits, Costs, and Lessons Learned: Update Report - Final | 182
APPENDIX A. List of Acronyms Acronym Meaning
AASHTO American Association of State Highway and Transportation Officials ABB Asea Brown Bovery ACC Adaptive Cruise Control A-CMBS Advanced Collision Mitigation Braking System ACN Automated Collision Notification ADMS Archived Data Management System AERIS Applications for the Environment: Real-Time Information Synthesis AFV Alternative Fuel Vehicle ALPR Automatic License Plate Reader AMOD Automated Mobility on Demand AMS Analysis, Modeling and Simulation API Application Program Interface APIS Automated Parking Information System ASCT Adaptive Signal Control Technologies ATA American Trucking Association ATCS Adaptive Traffic Control Systems ATDM Active Traffic Demand Management ATM Active Traffic Management ATTRI Accessible Transportation Technology Research Initiative AVL Automatic Vehicle Location AWWS Automated Wind Warning System B/C Benefit / Cost BART Bay Area Rapid Transit BCA Benefit Cost Analysis BNSF Burlington Northern Santa Fe BRT Bus Rapid Transit BS/LCW Blind Spot / Lane Change Warning BSM Basic Safety Message BSW Blind Spot Warning CACC Cooperative Adaptive Cruise Control CAD Computer Aided Dispatch CAMP Crash Avoidance Metrics Partnership CAN Controller Area Network CAP Centralized Accident Processing CATT Center for Advanced Transportation Technology Laboratory (University of Maryland) CCTV Closed Circuit Television CDOT Colorado Department of Transportation CHP California Highway Patrol CMV Commercial Motor Vehicle CICAS-SSA Cooperative Intersection Collision Avoidance System - Stop Sign Assist CNG Compressed Natural Gas CO Carbon Monoxide CO2 Carbon Dioxide
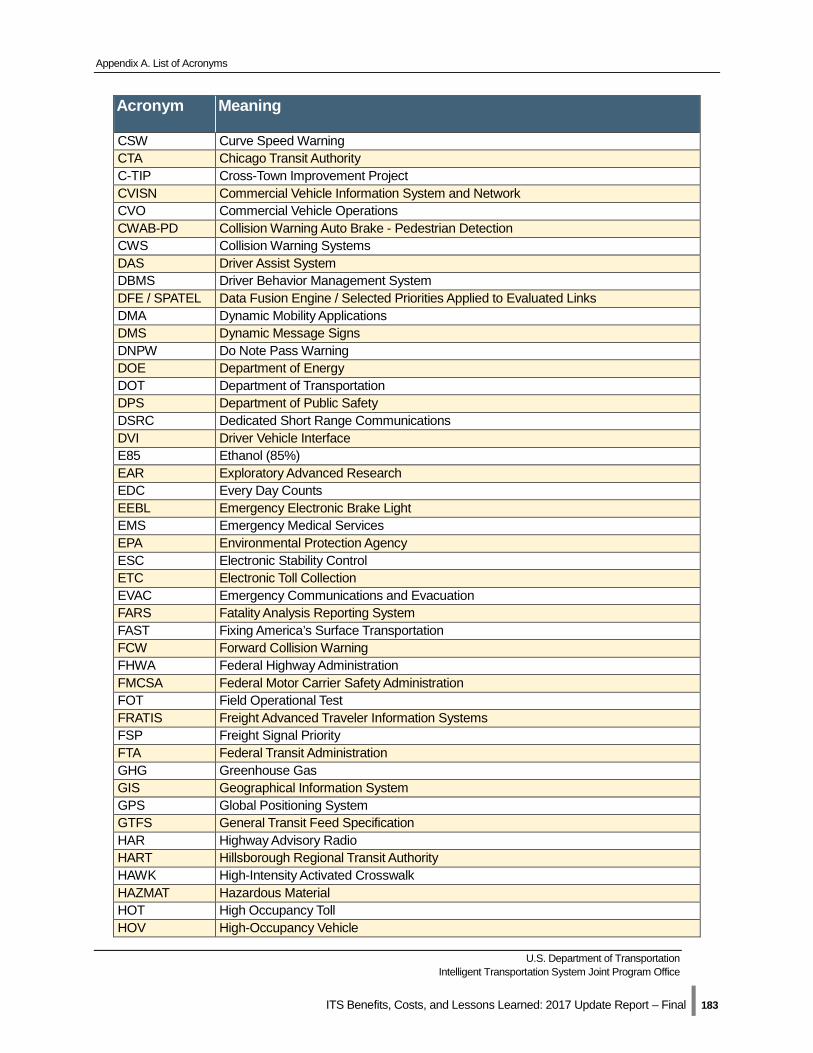
Appendix A. List of Acronyms
U.S. Department of Transportation Intelligent Transportation System Joint Program Office
ITS Benefits, Costs, and Lessons Learned: 2017 Update Report – Final | 183
Acronym Meaning
CSW Curve Speed Warning CTA Chicago Transit Authority C-TIP Cross-Town Improvement Project CVISN Commercial Vehicle Information System and Network CVO Commercial Vehicle Operations CWAB-PD Collision Warning Auto Brake - Pedestrian Detection CWS Collision Warning Systems DAS Driver Assist System DBMS Driver Behavior Management System DFE / SPATEL Data Fusion Engine / Selected Priorities Applied to Evaluated Links DMA Dynamic Mobility Applications DMS Dynamic Message Signs DNPW Do Note Pass Warning DOE Department of Energy DOT Department of Transportation DPS Department of Public Safety DSRC Dedicated Short Range Communications DVI Driver Vehicle Interface E85 Ethanol (85%) EAR Exploratory Advanced Research EDC Every Day Counts EEBL Emergency Electronic Brake Light EMS Emergency Medical Services EPA Environmental Protection Agency ESC Electronic Stability Control ETC Electronic Toll Collection EVAC Emergency Communications and Evacuation FARS Fatality Analysis Reporting System FAST Fixing America’s Surface Transportation FCW Forward Collision Warning FHWA Federal Highway Administration FMCSA Federal Motor Carrier Safety Administration FOT Field Operational Test FRATIS Freight Advanced Traveler Information Systems FSP Freight Signal Priority FTA Federal Transit Administration GHG Greenhouse Gas GIS Geographical Information System GPS Global Positioning System GTFS General Transit Feed Specification HAR Highway Advisory Radio HART Hillsborough Regional Transit Authority HAWK High-Intensity Activated Crosswalk HAZMAT Hazardous Material HOT High Occupancy Toll HOV High-Occupancy Vehicle
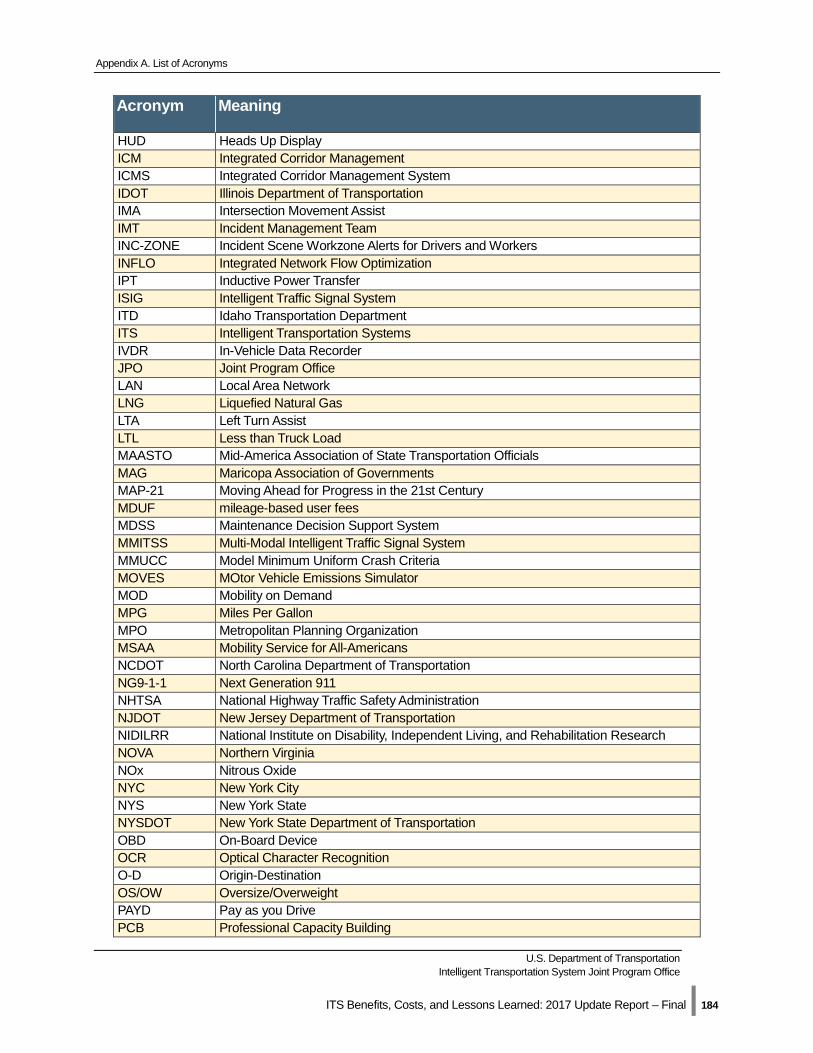
Appendix A. List of Acronyms
U.S. Department of Transportation Intelligent Transportation System Joint Program Office
ITS Benefits, Costs, and Lessons Learned: 2017 Update Report – Final | 184
Acronym Meaning
HUD Heads Up Display ICM Integrated Corridor Management ICMS Integrated Corridor Management System IDOT Illinois Department of Transportation IMA Intersection Movement Assist IMT Incident Management Team INC-ZONE Incident Scene Workzone Alerts for Drivers and Workers INFLO Integrated Network Flow Optimization IPT Inductive Power Transfer ISIG Intelligent Traffic Signal System ITD Idaho Transportation Department ITS Intelligent Transportation Systems IVDR In-Vehicle Data Recorder JPO Joint Program Office LAN Local Area Network LNG Liquefied Natural Gas LTA Left Turn Assist LTL Less than Truck Load MAASTO Mid-America Association of State Transportation Officials MAG Maricopa Association of Governments MAP-21 Moving Ahead for Progress in the 21st Century MDUF mileage-based user fees MDSS Maintenance Decision Support System MMITSS Multi-Modal Intelligent Traffic Signal System MMUCC Model Minimum Uniform Crash Criteria MOVES MOtor Vehicle Emissions Simulator MOD Mobility on Demand MPG Miles Per Gallon MPO Metropolitan Planning Organization MSAA Mobility Service for All-Americans NCDOT North Carolina Department of Transportation NG9-1-1 Next Generation 911 NHTSA National Highway Traffic Safety Administration NJDOT New Jersey Department of Transportation NIDILRR National Institute on Disability, Independent Living, and Rehabilitation Research NOVA Northern Virginia NOx Nitrous Oxide NYC New York City NYS New York State NYSDOT New York State Department of Transportation OBD On-Board Device OCR Optical Character Recognition O-D Origin-Destination OS/OW Oversize/Overweight PAYD Pay as you Drive PCB Professional Capacity Building
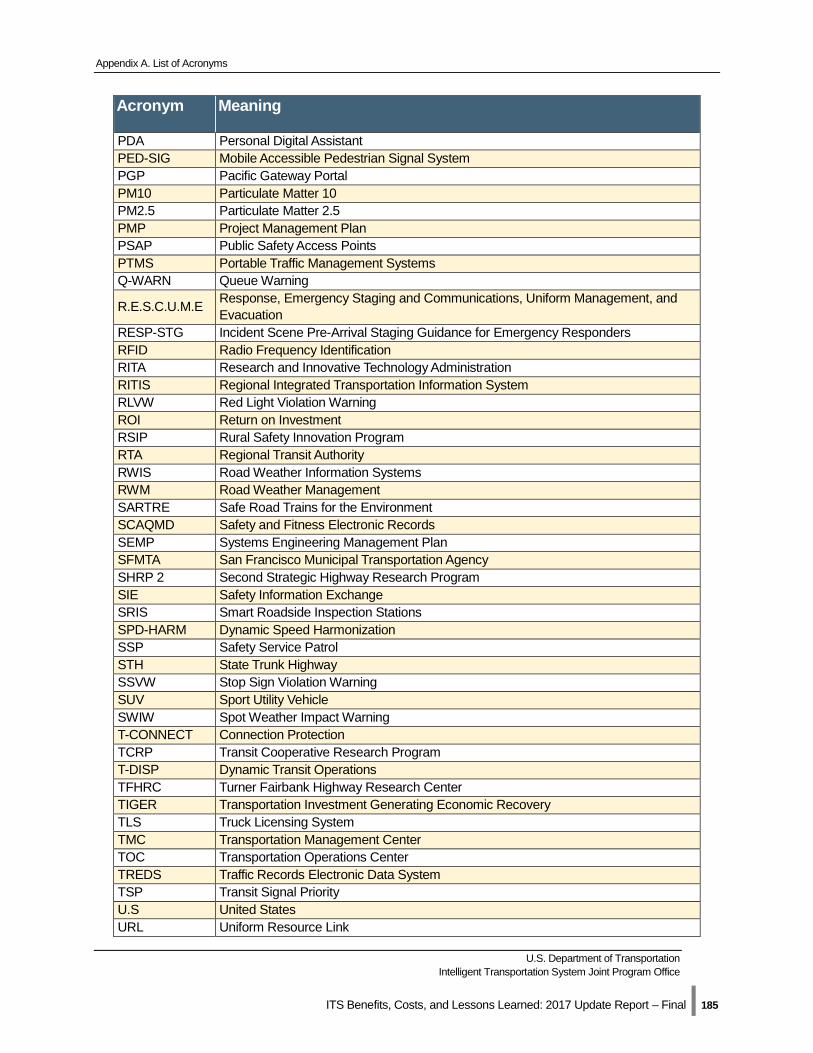
Appendix A. List of Acronyms
U.S. Department of Transportation Intelligent Transportation System Joint Program Office
ITS Benefits, Costs, and Lessons Learned: 2017 Update Report – Final | 185
Acronym Meaning
PDA Personal Digital Assistant PED-SIG Mobile Accessible Pedestrian Signal System PGP Pacific Gateway Portal PM10 Particulate Matter 10 PM2.5 Particulate Matter 2.5 PMP Project Management Plan PSAP Public Safety Access Points PTMS Portable Traffic Management Systems Q-WARN Queue Warning
R.E.S.C.U.M.E Response, Emergency Staging and Communications, Uniform Management, and Evacuation
RESP-STG Incident Scene Pre-Arrival Staging Guidance for Emergency Responders RFID Radio Frequency Identification RITA Research and Innovative Technology Administration RITIS Regional Integrated Transportation Information System RLVW Red Light Violation Warning ROI Return on Investment RSIP Rural Safety Innovation Program RTA Regional Transit Authority RWIS Road Weather Information Systems RWM Road Weather Management SARTRE Safe Road Trains for the Environment SCAQMD Safety and Fitness Electronic Records SEMP Systems Engineering Management Plan SFMTA San Francisco Municipal Transportation Agency SHRP 2 Second Strategic Highway Research Program SIE Safety Information Exchange SRIS Smart Roadside Inspection Stations SPD-HARM Dynamic Speed Harmonization SSP Safety Service Patrol STH State Trunk Highway SSVW Stop Sign Violation Warning SUV Sport Utility Vehicle SWIW Spot Weather Impact Warning T-CONNECT Connection Protection TCRP Transit Cooperative Research Program T-DISP Dynamic Transit Operations TFHRC Turner Fairbank Highway Research Center TIGER Transportation Investment Generating Economic Recovery TLS Truck Licensing System TMC Transportation Management Center TOC Transportation Operations Center TREDS Traffic Records Electronic Data System TSP Transit Signal Priority U.S United States URL Uniform Resource Link
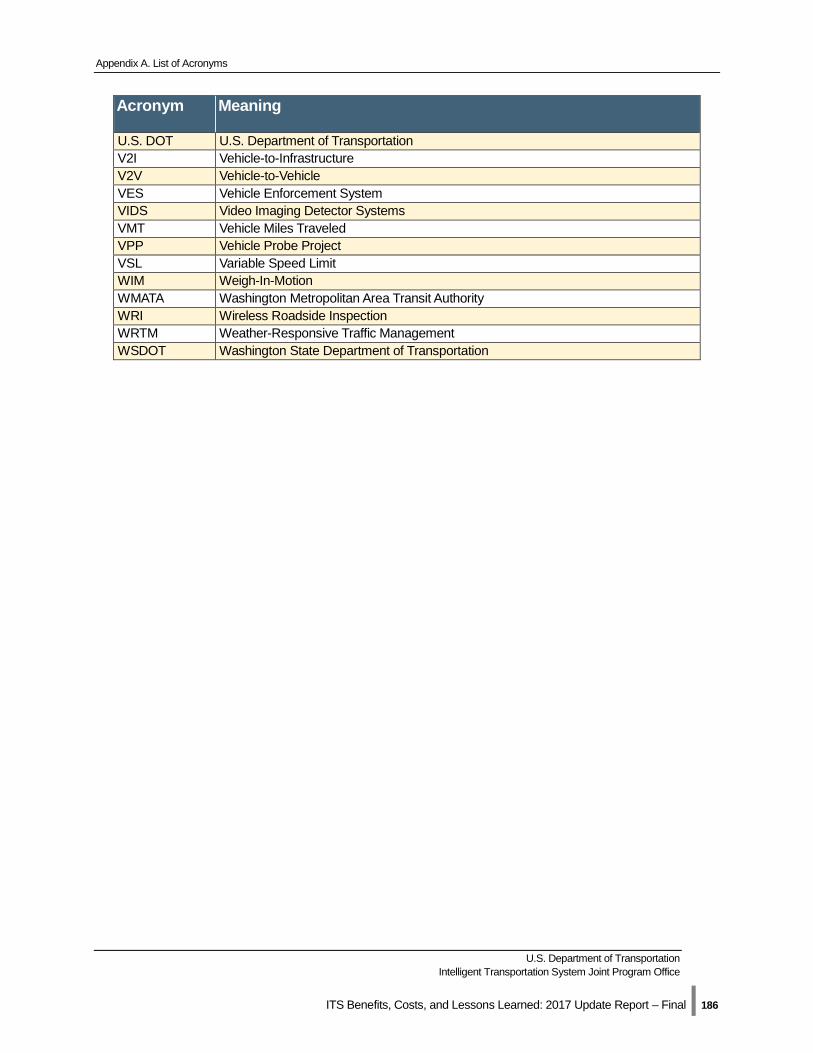
Appendix A. List of Acronyms
U.S. Department of Transportation Intelligent Transportation System Joint Program Office
ITS Benefits, Costs, and Lessons Learned: 2017 Update Report – Final | 186
Acronym Meaning
U.S. DOT U.S. Department of Transportation V2I Vehicle-to-Infrastructure V2V Vehicle-to-Vehicle VES Vehicle Enforcement System VIDS Video Imaging Detector Systems VMT Vehicle Miles Traveled VPP Vehicle Probe Project VSL Variable Speed Limit WIM Weigh-In-Motion WMATA Washington Metropolitan Area Transit Authority WRI Wireless Roadside Inspection WRTM Weather-Responsive Traffic Management WSDOT Washington State Department of Transportation
U.S. Department of Transportation ITS Joint Program Office-HOIT 1200 New Jersey Avenue, SE
Washington, DC 20590
Toll-Free “Help Line” 866-367-7487 www.its.dot.gov
FHWA-JPO-17-500