Intelligent Transport Systems for Smart Cities. The definition of a ‘Smart City’ 3. ITS for...
38
Intelligent Transport Systems for Smart Cities Ir Andrew Pickford BSc C.Eng MBA FIET FHKIE Director, Infrastructure and Transport Advisory Services APAC Innovation Summit 2015, HK Science Park 22-23 September 2015
Transcript of Intelligent Transport Systems for Smart Cities. The definition of a ‘Smart City’ 3. ITS for...

Intelligent Transport Systems for Smart Cities
Ir Andrew Pickford BSc C.Eng MBA FIET FHKIE Director, Infrastructure and Transport Advisory Services APAC Innovation Summit 2015, HK Science Park 22-23 September 2015

Agenda
1. Introduction 2. The definition of a ‘Smart City’ 3. ITS for Smart Cities: Strategic planning and prioitisation Challenges Needs-based ranking of ITS applications Pre-requisites and non-technology enablers
4. Application examples 5. Future Transport: from Intelligent Transport Systems to Integrated Transport
Services Mobility as a Service (MaaS): principles and aims
Page 1

Services
Page 2
Smart City
Technical assistance for NFC ticketing implementation to the STIF (Syndicate of Transport of
Ile-de-France)
Real-time multimodal
mobility solution
conception for the City of Copenhagen
New technologies
for public transportatio
n market studies
Functional analysis and Concept of Operations, traffic modelling / real time demand visualisation, macro-level emissions modelling, specification and delivery management of transit smart card services, advisory services on TDM / LEZ / managed motorways,
policy advisory / PPP transaction advisory, performance management regime development, procurement strategy development, stakeholder consultation
Our tools GIS
MAPINFO, ARGIS, QGIS, GLOBAL
MAPPER
Our skills
Big Data Market and
opportunities Studies
Interoperable Technical
specifications implementation assistance
to the IT department
of RFF (French Rail
Infrastructure Manager)
IT Master Plan for the RFF (French
railway infrastructure manager) for the capacity
and Circulation
systems
Our scope
Standard data analysis to produce mobility
indicators
Mobility Analysis
platform : to produce
indicators from mobile telephone
data
Programming Python, PHP,
JavaScript
Frameworks Backbone, node, API,
spark, Hadoop
Data Base Manager
SQL Server
Resource management
GESCAR (PERINFO)
Astana ITS technical
assistance
Traffic and pedestrian modelling
CUBE, Vissim, 3Ds
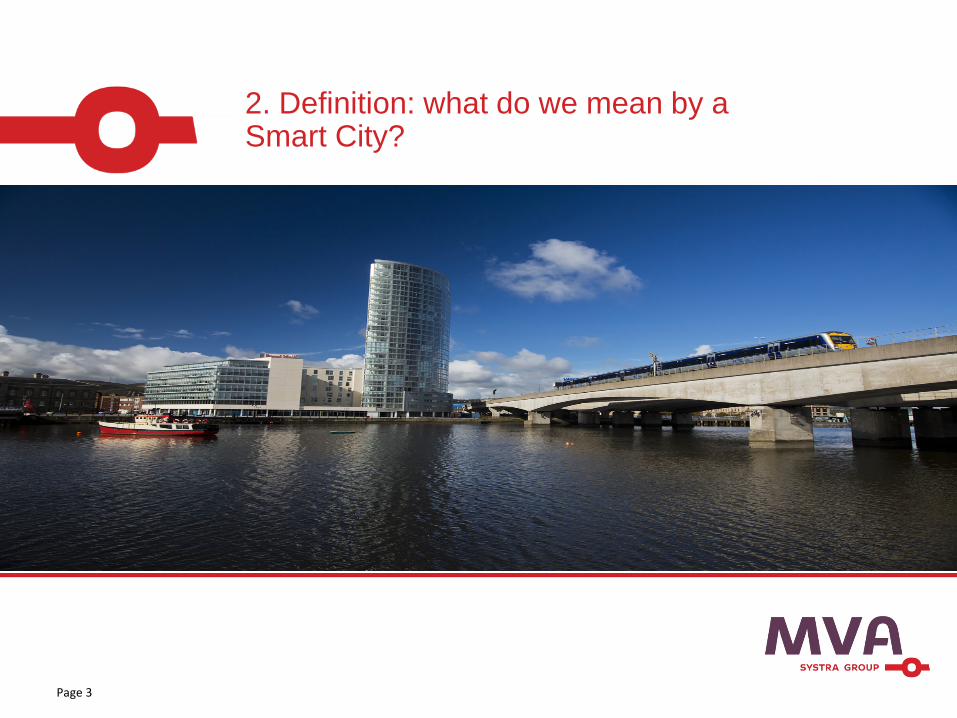
2. Definition: what do we mean by a Smart City?
Page 3

Smart Cities: Points of view
Top down, government led, techo-centric or bottom-up, citizen led? Technologies such as the Internet of Things (IOT) and municipal data
portals funded by tax payers are the enablers and pervasive sensing can be presented as good or bad
Competing visions of the future: smart city reflect competing visions of government, society and the role of the citizen
How much technology is really needed for communities to interact, particularly in rural communities?
What is the role of the user in designing his /her space in the smart city?
Integration of urban planners, architects, community group, engineers will contribute to the phased implementation of smart city innovations
Transport plays a vital role in connecting urban spaces
Page 4

Definitions
“[The use of] technology to enhance pedestrian and vehicular accessibility and manage the district facilities, and disseminate information to the public in digital format, with a view to making the area a better place for work and play”
CY Leung, Chief Executive, Hong Kong SAR, March 2015
Page 5

Definitions
“A Smart Nation means people and businesses are empowered through increased access to data, more participatory through the contribution of innovative ideas and solutions, and a more anticipatory government that utilises technology to better serve citizens’ needs.”
Infocomm Development Authority of Singapore
Page 6

Definitions
Page 7
“Adopting new approaches, through bringing people, technology and data together, will enable more integrated solutions to addressing London’s challenges… [an approach] that puts Londoners at the heart - driven by the principles of openness, collaboration, innovation and engagement.”
Greater London Authority, Smart London Plan, 2015

Page 8
3. Transport: Strategic planning and prioritisation
Transportation: challenges
Ensuring availability of transport capacity when and where needed Traditional focus of planning for peak demand > demand spreading /
reallocation amongst modes Planning for resilience against natural (e.g. meteorological disruption)
and man-made threats (e.g. terrorism, cyber warfare) Asset use optimisation: from initial planning (capex) to day-to-day
operations Improving accessibility for all users Improved information management within jurisdictional areas and
across jurisdictional boundaries Traditional focus on system performance > focus on outcomes
Overall: transport infrastructure and the systems that make it work need “to add value to the areas in which they serve”*.
[*Ref. IET Intelligent City Transport Hubs: Characteristics for Success]
Page 9

ITS-based services: productivity and liveability-based assessment
Page 10
Applications Improved productivity
Reduction in cost
Enhancement to livability
Scaleability Deployment (integration) Risk
AggregateAdded Value
Application 1 ✚✚✚
✚✚
✚✚
✚✚
✚✚
✚✚✚
Application 2 ✚
✚ ✚✚
✚✚✚
✚
✚✚
Application 3 ✚
✚
✚
✚✚
✚
✚✚
• Potential applications are then weighted based on local importance => ranking
• Technique allows sorting through many potentially conflicting applications and inter-dependencies
• Could extend to include safety, reduced harmful emissions / contribution to climate change and scoring of user satisfaction, etc.

ITS-based services: the Smart City ‘Hierarchy of Needs’
Page 11
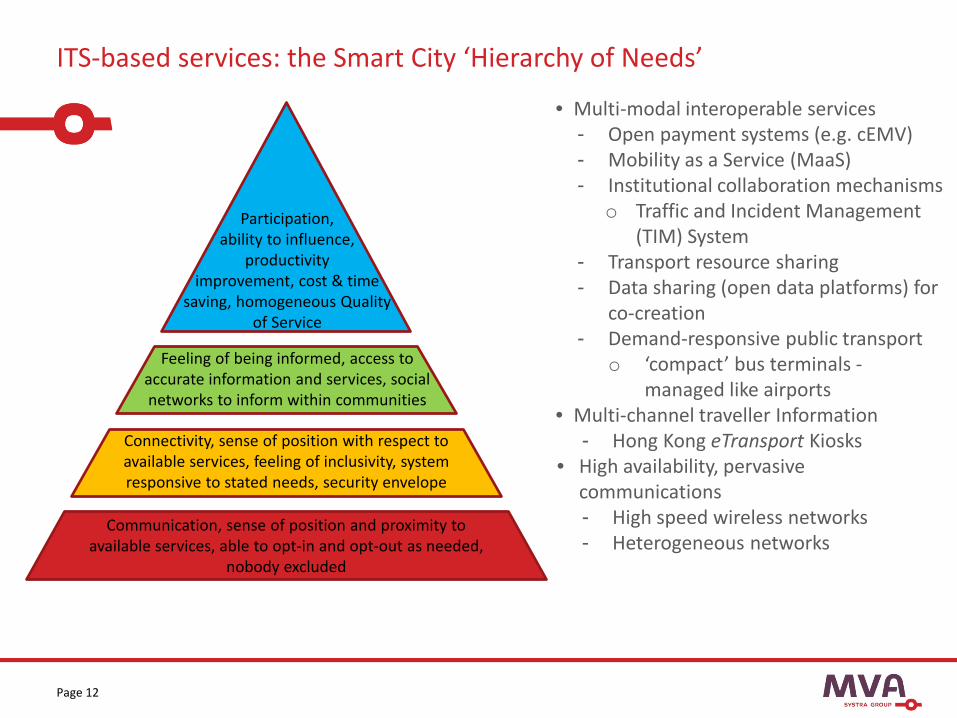
Service Integration Maturity: Increasing levels of service integration, consumption efficiency and inclusivity
Communication, sense of position and proximity to available services, able to opt-in and opt-out as needed,
nobody excluded
Participation, ability to influence,
productivity improvement, cost & time
saving, homogeneous Quality of Service
Connectivity, sense of position with respect to available services, feeling of inclusivity, system responsive to stated needs, security envelope
Feeling of being informed, access to accurate information and services, social networks to inform within communities
ITS-based services: the Smart City ‘Hierarchy of Needs’
Page 12
• Multi-modal interoperable services - Open payment systems (e.g. cEMV) - Mobility as a Service (MaaS) - Institutional collaboration mechanisms
o Traffic and Incident Management (TIM) System
- Transport resource sharing - Data sharing (open data platforms) for
co-creation - Demand-responsive public transport
o ‘compact’ bus terminals - managed like airports
• Multi-channel traveller Information - Hong Kong eTransport Kiosks
• High availability, pervasive communications - High speed wireless networks - Heterogeneous networks
Communication, sense of position and proximity to available services, able to opt-in and opt-out as needed,
nobody excluded
Participation, ability to influence,
productivity improvement, cost & time
saving, homogeneous Quality of Service
Connectivity, sense of position with respect to available services, feeling of inclusivity, system responsive to stated needs, security envelope
Feeling of being informed, access to accurate information and services, social networks to inform within communities
ITS-based services: the Smart City ‘Hierarchy of Needs’
Page 13
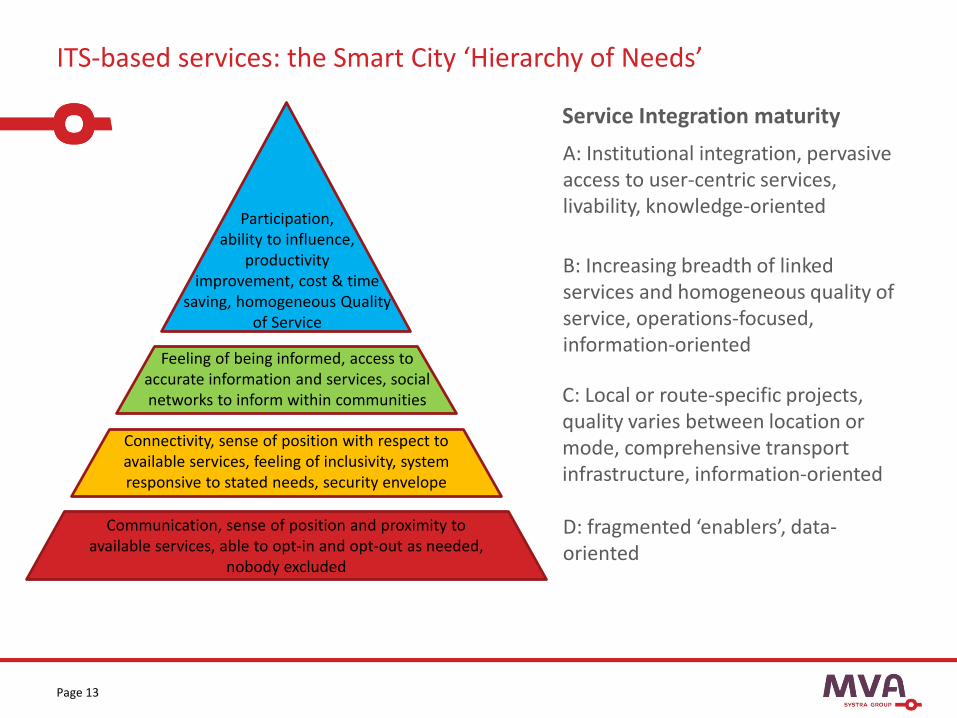
D: fragmented ‘enablers’, data-oriented
A: Institutional integration, pervasive access to user-centric services, livability, knowledge-oriented
C: Local or route-specific projects, quality varies between location or mode, comprehensive transport infrastructure, information-oriented
B: Increasing breadth of linked services and homogeneous quality of service, operations-focused, information-oriented
Communication, sense of position and proximity to available services, able to opt-in and opt-out as needed,
nobody excluded
Participation, ability to influence,
productivity improvement, cost & time
saving, homogeneous Quality of Service
Connectivity, sense of position with respect to available services, feeling of inclusivity, system responsive to stated needs, security envelope
Feeling of being informed, access to accurate information and services, social networks to inform within communities
Service Integration maturity

A more desirable future
Improved planning, selective new transport infrastructure and making better use of existing capacity: Can demand be spread or reallocated in the long term? Multi-modal planning within economic corridors
Reduce the journey time & journey time variability, ensure informed travellers particularly at modal interchanges
We need to move our thinking from pervasive, comprehensive provision of transport infrastructure and Intelligent Transport Systems to ‘joined up’ thinking and intermodal investments in selected application areas to deliver Integrated Transport Services.
Page 14
Enablers
Page 15
A Smart City Master Plan, embracing transportation and urban planning
A robust business case – to permit ‘best value’ prioritised investment
Available finance from public or (increasingly) private sector sources Agreed principles of governance, collaboration and data sharing
across institutional boundaries Service integration standards to enable connectivity amongst
individual services Minimum requirement specifications to enable data exchange Service level agreements with 3rd party transport service providers Stakeholder consultation and market testing: initial and ongoing, to
stimulate private sector participation

Page 16
4. Application examples

Application example: Copenhagen
Page 17
Objective: to ensure long-term economic growth on Copenhagen without a long-term decline in quality of transport services, road network performance, air quality and mobility by: Improving traffic flow and related accident rates Ensure broad awareness of travel options and air quality Reduce public transport journey time and journey time variability Reallocate a greater proportion of urban spaces to pedestrians
(+20%) and cyclists (+50%) Ensure maximum travel time of 15 minutes to green spaces for 90%
of residents and additional qualitative and quantitative objectives to ensure carbon neutrality by 2025
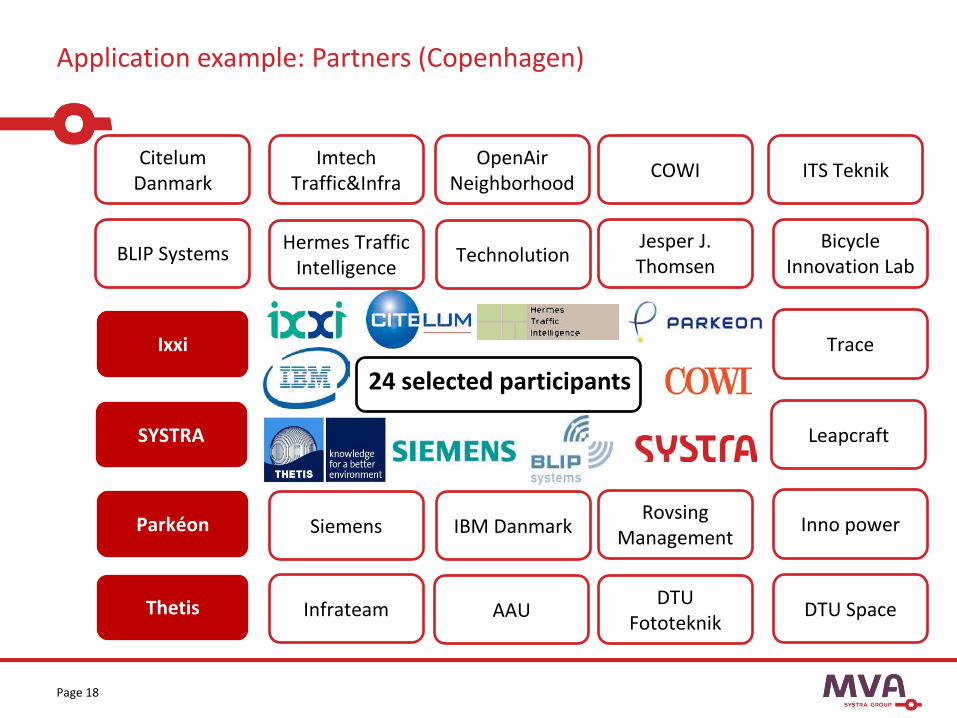
Application example: Partners (Copenhagen)
Page 18
24 selected participants
BLIP Systems
COWI
Ixxi
SYSTRA
Parkéon
DTU Space AAU Infrateam Thetis
ITS Teknik
DTU Fototeknik
Bicycle Innovation Lab
Trace
Leapcraft
Inno power
OpenAir Neighborhood
Imtech Traffic&Infra
Hermes Traffic Intelligence
Jesper J. Thomsen Technolution
Siemens Rovsing
Management IBM Danmark
Citelum Danmark

Copenhagen – example deliverable: Mitigation of harmful emissions by bus route reconfiguration
Page 19
© S
ystra
SA
• Define route changes • Model potential impact on air quality and
congestion • Reconfigure routes • Continuous performance monitoring of
service quality, congestion and air quality

Application example: Smart Motorways
Page 20
Managed motorway (M42, UK)
© 2
012
Mou
chel
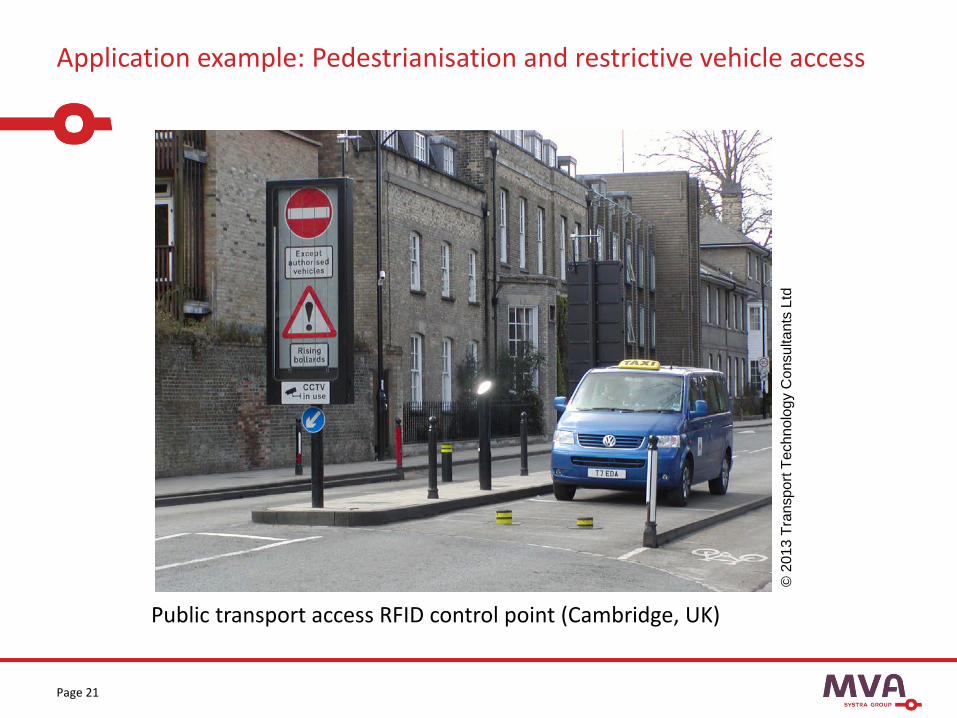
Application example: Pedestrianisation and restrictive vehicle access
Page 21
Public transport access RFID control point (Cambridge, UK)
© 2
013
Tran
spor
t Tec
hnol
ogy
Con
sulta
nts
Ltd

Case study: Demand allocation: Road and Light Rail
Page 22
© M
VA H
ong
Kong
Ltd
.
Feasibility study and modelling: Brunei

Application example: urban congestion charging
Page 23
© 2
011
Tran
spor
t Tec
hnol
ogy
Con
sulta
nts
Ltd
Urban charging point (trial system, London)

Application example: Compact Passenger Transport Interchange
Page 24
© M
VA H
ong
Kong
Ltd
.
Feasibility studies and modelling: Macau, Mexico and Brunei

Case study: Translink (Northern Ireland): Next Generation Ticketing
Page 25
Study to ensure ongoing innovation and to ensure that system remains ‘fit for purpose’ in long term
Increased accessibility for residents and visitors: partial transfer of back office functions to 3rd party service providers
Feasibility study: migration from current closed ticketing solution to open contactless EMV (cEMV) solution
Economic evaluation: capital and revenue cost assessment
Evaluation of the technical, security, legal and integration aspects of the NGT scheme
Implementation planned by 2017

Case study: capacity improvement through signal optimisation
Page 26
© M
VA H
ong
Kong
Ltd
.
Feasibility studies and modelling of gyratory system (Brunei)

Page 27
5. Future Transportation: from Intelligent Transport Systems to Integrated Transport Services

Current situation
Vehicles are in use, on average 4-5% of their lifetime Vehicle capacity is not fully utilised Transport capacity is wasted carrying and storing unused vehicle capacity US: High Occupancy and Toll (HOT) lanes Car pooling / car rental / car sharing
Infrastructure often planned for peak loading and challenges faced in managing that demand: Congestion Charging and Electronic Road Pricing Managed Motorways
The traveller has the problem of assembling all of the components of a trip to make it work: long-distance coach, minibus taxis, rail, bus, driving, walking, etc. linked by roads, car parks, bus terminals, rail stations, etc.
Page 28

Services convergence: a user perspective
Page 29

Services convergence: a user perspective
Page 30
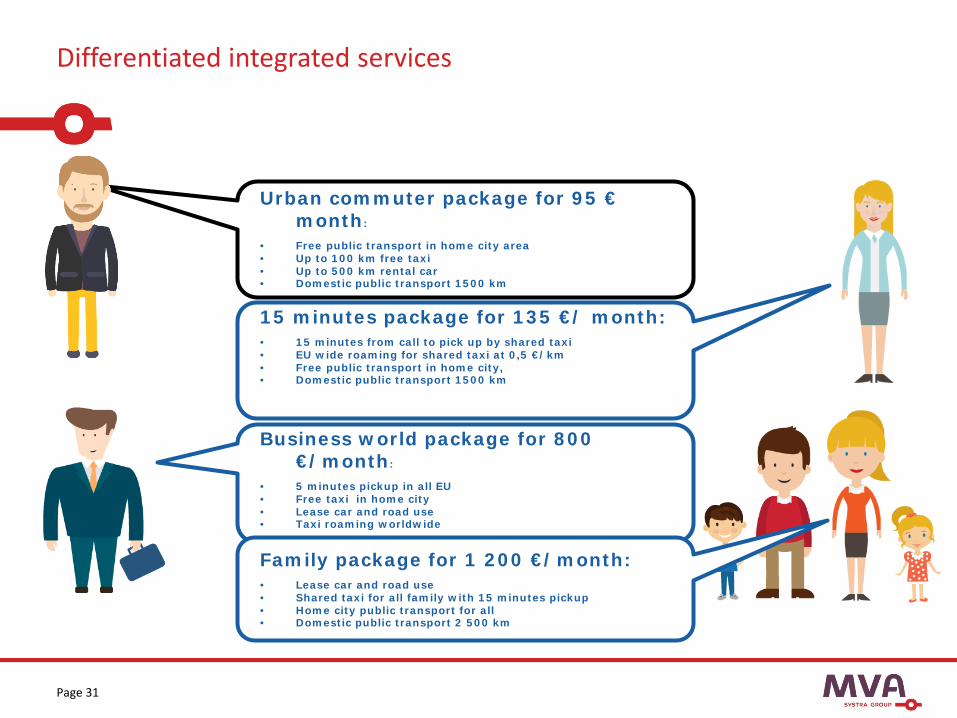
Differentiated integrated services
Urban commuter package for 95 € month:
• Free public transport in home city area • Up to 100 km free taxi • Up to 500 km rental car • Domestic public transport 1500 km
15 minutes package for 135 €/ month: • 15 minutes from call to pick up by shared taxi • EU wide roaming for shared taxi at 0,5 €/km • Free public transport in home city, • Domestic public transport 1500 km
Business world package for 800 €/month:
• 5 minutes pickup in all EU • Free taxi in home city • Lease car and road use • Taxi roaming worldwide
Family package for 1 200 €/month: • Lease car and road use • Shared taxi for all family with 15 minutes pickup • Home city public transport for all • Domestic public transport 2 500 km
Page 31
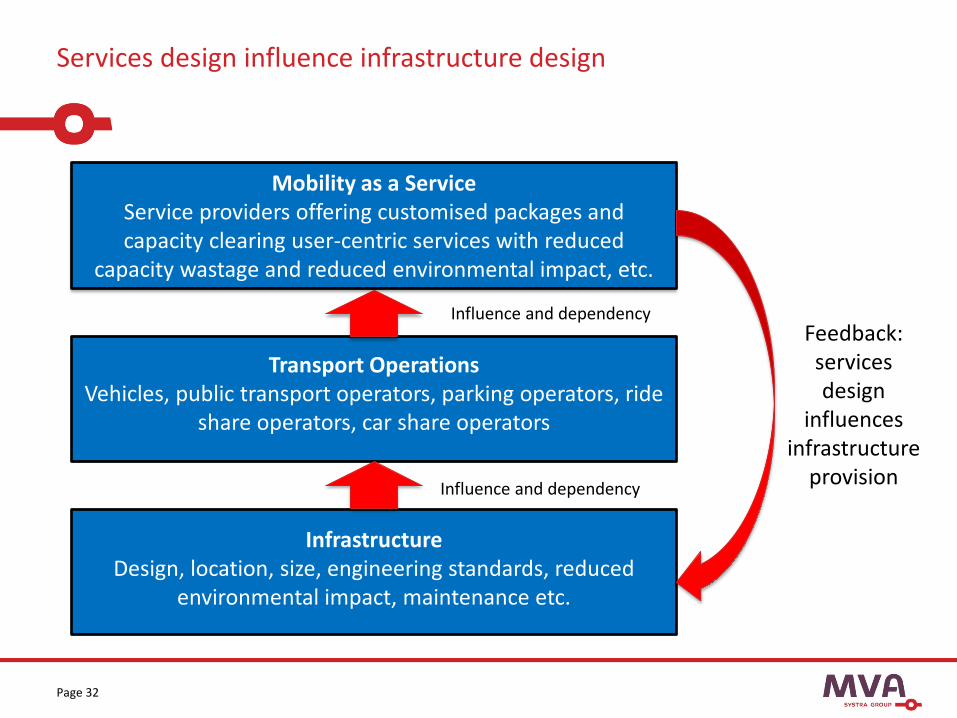
Services design influence infrastructure design
Page 32
Infrastructure Design, location, size, engineering standards, reduced
environmental impact, maintenance etc.
Transport Operations Vehicles, public transport operators, parking operators, ride
share operators, car share operators
Mobility as a Service Service providers offering customised packages and capacity clearing user-centric services with reduced
capacity wastage and reduced environmental impact, etc.
Feedback: services design
influences infrastructure
provision
Influence and dependency
Influence and dependency

6. Summary & Conclusions
Page 33
Summary & Conclusions
There is no common definition of a Smart City but all definitions focus on improved connectivity, support to city governance, broad deployment, and meaningful benefits to citizens and visitors – and businesses
Consider how to prioritise investment: Aim to improve resource productivity: infrastructure, road
users, commercial vehicle operators Reduce operating costs and benefit from economies of scale Contribution to a livable city’
Page 34

Summary & Conclusions
Technology is not a panacea – be selective in how technology is used
Prioritise the deployment of technology where its benefits are maximised
Address institutional challenges early on: data sharing and coordination
Tools include static and dynamic modelling and continuous monitoring to develop quantitative understanding of technical contributions and services to the management of Hong Kong’s transport and mobility infrastructure
Page 35
Integrated transport and mobility services rather than comprehensive transport systems!

Page 36
Heitenan S. and Pickford A., MaaS Appeal, Thinking Highways, summer 2015 edition, H3B Media
References and further reading - 2

Page 37
MVA Head Office in Asia
Email: [email protected] Web: www.mvaasia.com
Thank you!
14/F West, Warwick House, Taikoo Place, 979 King's Road, Island East, Hong Kong
For further information: