Intel SSD Data Center Family for PCIe -...
25
Evaluation Guide Intel® Solid-State Drive Data Center Family for PCIe P3700, P3600 and P3500 Series English
Transcript of Intel SSD Data Center Family for PCIe -...

Evaluation Guide
Intel® Solid-State Drive Data Center Family for PCIe P3700, P3600 and P3500 Series
English

Order Number: 330592-001US
Intel® Solid-State Drive Data Center Family for PCIe*
P3700, P3600 and P3500 Series
Evaluation Guide
June 2014
Revision 1.0

Intel® SSD DC P3700, P3600 and P3500 Series
Evaluation Guide June 2014 2 330592-001US
Ordering Information
Contact your local Intel sales representative for ordering information.
INFORMATION IN THIS DOCUMENT IS PROVIDED IN CONNECTION WITH INTEL PRODUCTS. NO LICENSE, EXPRESS OR IMPLIED, BY ESTOPPEL OR OTHERWISE, TO ANY INTELLECTUAL PROPERTY RIGHTS IS GRANTED BY THIS DOCUMENT. EXCEPT AS PROVIDED IN INTEL'S TERMS AND CONDITIONS OF SALE FOR SUCH PRODUCTS, INTEL ASSUMES NO LIABILITY WHATSOEVER AND INTEL DISCLAIMS ANY EXPRESS OR IMPLIED WARRANTY, RELATING TO SALE AND/OR USE OF INTEL PRODUCTS INCLUDING LIABILITY OR WARRANTIES RELATING TO FITNESS FOR A PARTICULAR PURPOSE, MERCHANTABILITY, OR INFRINGEMENT OF ANY PATENT, COPYRIGHT OR OTHER INTELLECTUAL PROPERTY RIGHT.
A "Mission Critical Application" is any application in which failure of the Intel Product could result, directly or indirectly, in personal injury or death. SHOULD YOU PURCHASE OR USE INTEL'S PRODUCTS FOR ANY SUCH MISSION CRITICAL APPLICATION, YOU SHALL INDEMNIFY AND HOLD INTEL AND ITS SUBSIDIARIES, SUBCONTRACTORS AND AFFILIATES, AND THE DIRECTORS, OFFICERS, AND EMPLOYEES OF EACH, HARMLESS AGAINST ALL CLAIMS COSTS, DAMAGES, AND EXPENSES AND REASONABLE ATTORNEYS' FEES ARISING OUT OF, DIRECTLY OR INDIRECTLY, ANY CLAIM OF PRODUCT LIABILITY, PERSONAL INJURY, OR DEATH ARISING IN ANY WAY OUT OF SUCH MISSION CRITICAL APPLICATION, WHETHER OR NOT INTEL OR ITS SUBCONTRACTOR WAS NEGLIGENT IN THE DESIGN, MANUFACTURE, OR WARNING OF THE INTEL PRODUCT OR ANY OF ITS PARTS.
Intel may make changes to specifications and product descriptions at any time, without notice. Designers must not rely on the absence or characteristics of any features or instructions marked "reserved" or "undefined." Intel reserves these for future definition and shall have no responsibility whatsoever for conflicts or incompatibilities arising from future changes to them. The information here is subject to change without notice. Do not finalize a design with this information.
Software and workloads used in performance tests may have been optimized for performance only on Intel microprocessors. Performance tests, such as SYSmark and MobileMark, are measured using specific computer systems, components, software, operations and functions. Any change to any of those factors may cause the results to vary. You should consult other information and performance tests to assist you in fully evaluating your contemplated purchases, including the performance of that product when combined with other products.
Results have been estimated based on internal Intel analysis and are provided for informational purposes only. Any difference in system hardware or software design or configuration may affect actual performance.
Intel does not control or audit the design or implementation of third party benchmark data or Web sites referenced in this document. Intel encourages all of its customers to visit the referenced Web sites or others where similar performance benchmark data are reported and confirm whether the referenced benchmark data are accurate and reflect performance of systems available for purchase.
The products described in this document may contain design defects or errors known as errata which may cause the product to deviate from published specifications. Current characterized errata are available on request.
Contact your local Intel sales office or your distributor to obtain the latest specifications and before placing your product order.
Copies of documents which have an order number and are referenced in this document, or other Intel literature, may be obtained by calling 1-800-548-4725, or go to: http://www.intel.com/design/literature.htm Intel and the Intel logo are trademarks of Intel Corporation in the U.S. and other countries.
*Other names and brands may be claimed as the property of others.
Copyright © 2014 Intel Corporation. All rights reserved.

Intel® SSD DC P3700, P3600 and P3500 Series
June 2014 Evaluation Guide 330592-001US 3
Contents
About This Guide ..................................................................................................................... 5
1 Overview ..................................................................................................................... 6
2 Types of Benchmarks .................................................................................................... 7
2.1 Synthetic Benchmarks ................................................................................................... 7 2.2 Application-Based Benchmarks ....................................................................................... 7 2.3 Trace-based Benchmarks ............................................................................................... 8 2.4 Summary of Benchmark Types ....................................................................................... 8
3 SSD Benchmarking Methodology Overview ....................................................................... 9
3.1 SSD Pre-Conditioning and System Configuration ............................................................... 9 3.1.1 Erase the SSD ................................................................................................. 9 3.1.2 Pre-Condition the SSD ..................................................................................... 10
4 Evaluating the Intel® SSD DC P3700, P3600 and P3500 Series ........................................... 11
4.1 Prepare for the Benchmark Test..................................................................................... 11 4.1.1 Define the Configuration and Test Procedure ...................................................... 11 4.1.2 Analyze Results .............................................................................................. 12
4.2 Perform the Benchmark Test ......................................................................................... 12 4.2.1 Review Requirements ...................................................................................... 12 4.2.2 Set up the System .......................................................................................... 13 4.2.3 Set up The Drive ............................................................................................. 14 4.2.4 Run the Benchmark Test .................................................................................. 14
4.3 Considerations on Multiple Workers ................................................................................ 17 4.4 Considerations in CPU Affinity and Power Management ..................................................... 18 4.5 Example Performance Results ........................................................................................ 19 4.6 Synthetic Benchmark Test Measurement Variations .......................................................... 20
5 Additional Product Information ...................................................................................... 21
Appendix A Additional Benchmark Information .................................................................... 22
A.1 Iometer* .................................................................................................................... 22 A.2 Flexible IO* Tester (FIO) .............................................................................................. 22 A.3 Sample Data on IOPS and QD Sweep ............................................................................. 22
Tables
Table 1: Terminology .................................................................................................... 4 Table 2: Benchmarking Summary ................................................................................... 8 Table 3: Windows* Setup Guidelines.............................................................................. 14 Table 4: Linux* Setup Guideline .................................................................................... 14 Table 5: Random IOPs Results – Intel® SSD DC P3700 and P3600 Series ........................... 19 Table 6: Sequential Performance Results – Intel® SSD DC P3700 and P3600 Series ............. 19 Table 7: Related Documentation .................................................................................... 21 Table 8: Related Tools ................................................................................................. 21 Table 9: Supported Server Platforms ............................................................................. 23 Table 10: Supported Client Platforms ............................................................................... 23

Intel® SSD DC P3700, P3600 and P3500 Series
Evaluation Guide June 2014 4 330592-001US
Revision History
Document Number
Revision Number
Description Revision Date
330592 001US Initial release. June 2014
Terms and Acronyms
Table 1: Terminology
Term Definition
GB Gigabyte
HDD Hard Disk Drive
I/O Input/Output
IOPS Input/Output Operations Per Second
JBOD Just a Bunch of Disks
KB Kilobytes
MB Megabytes
RAID Redundant Array of Independent Disks
SAS Serial Attached SCSI
SATA Serial Advanced Technology Attachment
SSD Solid-State Drive

Intel® SSD DC P3700, P3600 and P3500 Series
June 2014 Evaluation Guide 330592-001US 5
About This Guide
This document is a guide for evaluating the performance of Intel® Solid-State Drive Data Center
Family for PCIe* (Intel® SSD DC P3700, P3600 and P3500 Series).
This guide provides a high-level overview of different measurement and benchmarking methods and describes Intel's recommended method to evaluate the P3700, P3600 and P3500 Series.
This guide is intended for publications, OEMs, technical analysts, and individuals who plan to test or
evaluate P3700, P3600 and P3500 Series performance benefits and features.
This guide is divided into the following sections:
Section 1, “Overview” on page 6 provides an overview of the P3700, P3600 and P3500 Series.
Section 2, “Types of Benchmarks” on page 7 introduces the different benchmark types used to measure SSD performance and the situations they address and measure.
Section 3, “SSD Benchmarking Methodology Overview” on page 9 discusses the benchmarking methods performed by Intel to evaluate Intel SSDs.
Section 4, “Evaluating the Intel® SSD Data Center Family for PCIe*” on page 11 describes
how to evaluate the P3700, P3600 and P3500 Series and provides sample performance results.
Section 5, “Additional Product Information” on page 21 lists additional product information resources.
Appendix A, “Additional Benchmark Information” on page 22 discusses where to find additional information on the benchmarking tools referenced in this guide.

Intel® SSD DC P3700, P3600 and P3500 Series
Evaluation Guide June 2014 6 330592-001US
1 Overview
The Intel® Solid-State Drive Data Center Family for PCIe* is Gen3 SSD architected with the new higher performance controller interface – NVMe* (Non-Volatile Memory Express) delivering leading performance, low latency and Quality of Service. Matching the performance with world-class reliability and endurance, Intel® SSD Data Center Family for PCIe* offers a range of capacities – 400GB, 800GB, 1.2TB, 1.6TB and
2TB in both Add-In card and 2.5-inch form factor.
With PCIe* Gen3 support and NVMe* interface, the family of products deliver excellent sequential read performance up to 2.8 GB/s and sequential write speeds up to 1.9 GB/s. It delivers very high random read IOPS of up to 460K and random write IOPS of up to 180K for 4KB operations. Taking advantage of the direct path from the storage to the CPU by means of NVMe*, the Intel SSD Data Center Family for
PCIe* exhibits low latency of less than 20 μs for sequential access.
The 2.5-inch form factor of the P3700, P3600 and P3500 Series takes advantage of the 8639 connector
and provides hot-pluggable removal and insertion, providing in-service replacement options.
The Intel® SSD Data Center Family for PCIe* includes these key features:
Consistently High IOPS and throughput Sustained low latency High Endurance Technology (HET) Variable Sector Size and End-to-End data-path protection
Enhanced power-loss data protection Power loss protection capacitor self-test Out of band management Thermal throttling and monitoring
The Intel® SSD Data Center Family for PCIe* brings extreme data throughput directly to Intel® Xeon®
processors at greater rates up to 6X 6Gbps SATA and up to 4X 12Gbps Serial Attached SCSI (SAS) SSDs and improved efficiency, giving data center servers a performance boost. Enterprise applications become faster allowing data center servers the ability to support more users simultaneously, compute on larger data sets and address high-performance computing at lower total cost of ownership.
The P3700, P3600 and P3500 Series are easy to install; providing seamless, post-deployment server
storage upgrade with no changes to existing server design. It’s as easy as plugging into a PCIe* slot, loading drivers, and rebooting the system. For 2.5-inch form factor 8639-connector backplane or mid-plane support is needed for connectivity to the CPU.
The P3700, P3600 and P3500 Series a currently supported on:
• Windows Server* 2012 R2
• Windows Server* 2012
• Windows Server* 2008 R2 SP1/SP2
• Red Hat* Enterprise Linux* (RHEL) 6.5

Intel® SSD DC P3700, P3600 and P3500 Series
June 2014 Evaluation Guide 330592-001US 7
2 Types of Benchmarks
Benchmarks are designed to mimic a particular type of workload on a component or system. This section provides an overview of three types of benchmarks that can be used to measure SSD
performance:
Synthetic Benchmarks Application-Based Benchmarks Trace-Based Benchmarks
2.1 Synthetic Benchmarks Synthetic benchmarks measure raw drive input/output (IO) transfer rates. These benchmarks typically use well-defined, synthetic workloads and target only specific components such as SSDs, hard disk
drives (HDDs) or other networking devices. These benchmarks format results as raw megabytes (MBs) in Input/Output operations Per Second (IOPS).
Storage subsystem synthetic benchmarks focus on drive performance without taking bottlenecks into account from other subsystems such as CPU, memory, or graphics. This makes these benchmarks useful for measuring drive performance for changing parameters such as transfer sizes.
Examples of synthetic benchmarking tools include Iometer*, vdbench* and Flexible IO Tester* (FIO).
2.2 Application-Based Benchmarks Application-based benchmarks run real-world programs on a system and measure the application
performance as it uses the system.
Application-based benchmarks emulate intensive transaction processing, business and financial
utilities, etc. The resulting score is calculated based on the storage subsystem's performance in metrics such as raw throughput, quality of service [QoS], system resource utilization, etc.
TPCC* and TPOX* are examples of application-based benchmarks.
Application-based benchmarks can be helpful for determining an end user's experience of system
performance. In particular, a drive's behavior is more likely to match its real use behavior with an application-based workload benchmark than if benchmarked with a purely synthetic workload. Application-based benchmarks may also result in a single measure for system performance, which can be used as a product-ranking index.

Intel® SSD DC P3700, P3600 and P3500 Series
Evaluation Guide June 2014 8 330592-001US
2.3 Trace-based Benchmarks Trace-based benchmarks are based on traces, or recordings, of disk IO operations executed during a certain period of time of real use or script-based use. The trace is then used to play back the IO sequence on the particular drive to be tested. Trace-based benchmark results vary in format.
Traced-based benchmarking has many of the advantages of application-based benchmarking, if the
trace is collected from real-use or a realistic script-based activity. It has the additional advantage of highlighting disk IO behavior while avoiding the bottlenecks caused by the CPU, graphics, and memory subsystems. It is also possible to run long traces, so performance over time can be measured.
One disadvantage of trace-based benchmarking is that third-party tools required for testing are not as
readily available as those for synthetic and application-based benchmarking. Additionally, the recorded
trace may not reflect an applicable usage model.
2.4 Summary of Benchmark Types
Table 2: Benchmarking Summary
Feature Synthetic
Benchmark
Application-Based
Benchmark
Trace-Based
Benchmark
Measures drive IO performance in MB/s or IOPS Yes No Possibly
Measures application performance No Yes No
Measures overall system performance No Yes No
Represents real-world use cases No Possibly Possibly
Represents user experience No Yes No
Avoids system bottlenecks Yes No Yes

Intel® SSD DC P3700, P3600 and P3500 Series
June 2014 Evaluation Guide 330592-001US 9
3 SSD Benchmarking Methodology Overview
System configuration and SSD rates can affect run-to-run performance. To overcome this, pre-conditioning SSDs before benchmark testing, as well as using a consistent system configuration allows
for repeatable benchmarking results.
3.1 SSD Pre-Conditioning and System Configuration
The performance of an SSD is at its best when the SSD is new (out-of-the-box). As the SSD fills with
data, performance will degrade. Performance degradation varies based on the workload applied to the drive. Because performance measurements vary depending on the state of the drive, it is recommended
to perform benchmark testing on an SSD that is in an out-of-box state.
3.1.1 Erase the SSD
To regain out-of-the-box performance of an Intel® SSD DC P3700, P3600 or P3500 Series, perform
an erase on the drive. An erase deletes all data and returns the SSD to a common starting point for benchmarking consistency.
For the P3700, P3600 and P3500 Series, an erase can be done using the Intel® SSD Data Center Tool
using one of the following commands:
Windows isdct.exe -erase -drive <drivenum OR all for all drives>
Linux (RHEL or SLES) ./isdct -erase -drive <drivenum OR all for all drives>
The drive numbers can be retrieved using one of the following commands:
Windows isdct.exe -list
Linux (RHEL or SLES)
./isdct –list
See the Intel® Data Center Tool Users Guide for more details.

Intel® SSD DC P3700, P3600 and P3500 Series
Evaluation Guide June 2014 10 330592-001US
3.1.2 Pre-Condition the SSD
The following steps show an example of how to pre-condition an SSD for synthetic benchmarking. This methodology allows for repeatable results.
1. Perform an erase on the SSD. Fill up the entire span of the drive with sequential writes to
ensure that each LBA has been written to. 2. Install or image the boot drive with a supported operating system (OS). 3. Install the latest Intel® SSD DC P3700, P3600 or P3500 drivers for the selected OS. 4. Install benchmark tools. 5. Configure the system following Section 4.1, “Prepare for the Benchmark Test” on page 11. 6. Allow the system to complete background tasks and reach an idle state.
7. Run the benchmark.
3.1.3 Importance of System Configuration
Many items can impact storage subsystem performance. Items such as Microsoft Windows* SuperFetch* and Disk Defragmentation can cause varied storage subsystem performance significantly from run to run.
For any benchmarking system it is important to define and implement a configuration to ensure run-to-
run consistency. Section 4.0, “Evaluating the Intel® SSD Data Center Family for PCIe*” discusses a proposed system configuration in detail.

Intel® SSD DC P3700, P3600 and P3500 Series
June 2014 Evaluation Guide 330592-001US 11
4 Evaluating the Intel® SSD Data Center Family for PCIe* (P3700, P3600 and P3500)
This section outlines recommended benchmarking steps for evaluating the Intel® SSD DC P3700, P3600 and P3500 Series and provides sample testing results.
Prepare for the Benchmark Test Perform the Benchmark Test Example Performance Results
4.1 Prepare for the Benchmark Test
Before benchmark testing, define a standard configuration and test procedure, and then understand how to analyze and report the results. This process enables results to be accurate and repeatable, making comparisons more meaningful.
4.1.1 Define the Configuration and Test Procedure
Before starting the evaluation, consider each of the following factors so that the configuration and test procedure yield repeatable results:
Begin with a fresh installation of the operating system and workload(s) to avoid any problems
or inconsistencies while running the test. In some cases, system crashes and test failures can corrupt files on the drive and affect the operating system.
Disable or enable certain features or settings as required by the workload before each run. See Table 3 or 4 in Section 4.2.2, along with the documentation for the benchmark tool you will be running, for recommended settings.
Verify that system capabilities are fully enabled for all of the systems measured:
– DMA is enabled for all storage devices. – Disk cache (and size) is enabled. – Any evaluation that requires network connectivity should be performed in a controlled wired
network with consistent network performance to enable consistent performance results. – PCIe* Gen 3.0 is supported and the SSD is installed in a PCIe* Gen 3.0 x4, x8 or x16 slot.
Check the slot description on the motherboard to ensure that slot is electrically x4 or x8.
Document and publish all hardware and software setup components accurately so the comparison of results is clear and accurate. – Document all hardware components and their main features and specifications. – Note the operating system (OS) version used and whether any service packs were
installed. – List all driver versions used for the graphics card and other I/O devices.
– List driver and firmware versions of the drive being tested.
Check the setup to ensure jumpers are set properly. Make sure all cables and cards are
properly installed and hardware is functioning properly.
Make sure no other programs, such as a video card control panel, virus scanning software, etc., are running in the background at the same time as the workload.
Note: If any programs other than those intended by the user are running at the same time, the measured results may not convey the intent of the benchmark.

Intel® SSD DC P3700, P3600 and P3500 Series
Evaluation Guide June 2014 12 330592-001US
4.1.2 Analyze Results
Once a benchmark test has been run, analyzing and explaining the results is a critical step in the
evaluation process.
The objective of performance evaluation is to quantify the performance benefits of the system under consideration. Analyzing and explaining the results in relation to the features and benefits of a product under test will help users better appreciate product capabilities. It is important to understand what was
measured during a test when evaluating a workload's score result.
Several factors can affect a workload score:
Processor Performance
Platform Performance
I/O and Peripheral Performance
The following steps are recommended before interpreting and publishing results
1. Make sure the results obtained are valid and explainable. (See Section 4.3, “Example
Performance Results”.) If the results are not valid, further analysis may be required.
2. When explaining the results, be aware that conclusions often relate to the following:
– Features and capabilities of the SSD. For example, for an SSD benchmark that evaluates the P3700, P3600 and P3500 Series, highlight the features of the SSD that help explain the performance benefit of that benchmark.
– Operating System (OS), drivers, configuration setting benefits. For all benchmarks, note the OS used, driver versions used, power profile, power profile
settings, any specific features enabled or disabled, detailed software and hardware configurations, and any other special settings as required by the benchmark.
– Any other applicable system resources or various configuration details that can affect testing outcomes and interpretations. These details can enable Intel to provide assistance with troubleshooting or duplication if needed.
4.2 Perform the Benchmark Test
This section describes the recommended procedure for running synthetic benchmarks on the P3700,
P3600 and P3500 Series under supported operating systems.
4.2.1 Review Requirements
Verify that the SSD has the latest firmware.
– To view the current firmware installed on the SSD, use the Intel® SSD Data Center Tool.

Intel® SSD DC P3700, P3600 and P3500 Series
June 2014 Evaluation Guide 330592-001US 13
Verify that the SSD is erased and completely formatted.
– To erase the P3700, P3600 or P3500 Series, use the Intel SSD Data Center Tool to issue one of the following commands for your operating system:
Windows
isdct.exe -erase -drive <drivenum OR all for all drives>
Linux (RHEL or SLES) ./isdct -erase -drive <drivenum OR all for all drives>
The drive numbers can be retrieved using one of the following commands:
Windows isdct.exe -list
Linux (RHEL or SLES) ./isdct -list
See the Intel Data Center Tool Users Guide for more details.
4.2.2 Set up the System
1. Set your system to boot from the CD/DVD drive in the BIOS.
2. Begin the installation of a supported operating system (OS) from the operating system DVD. If a supported operating system is already installed, go to Step 6.
3. Install the latest P3700, P3600 or P3500 Series driver during the installation of the OS. See Product Installation Guide for driver setup. The drivers will be part of the package.
4. After installation of the OS is complete, restart the system.
5. Immediately after installing the OS, install the latest INF files to allow the operating system to recognize the chipset and all the components on the motherboard.
The INF file can be downloaded from the chipset software link at:
http://downloadcenter.intel.com/default.aspx?lang=eng
6. If you did not install the P3700, P3600 or P3500 Series driver during installation of the OS, or if the OS was already installed, install the appropriate Intel driver now.
Follow the instructions in the Readme file included with the driver for your operating system.
7. Install the latest sound driver for your system. For Intel motherboards, go the following site
and choose Support > Drivers and Downloads:
http://support.intel.com
8. Install the latest LAN driver. For Intel motherboards, go the following site and choose
Support > Drivers and Downloads:
http://support/intel.com
9. Download and install the latest graphics driver for your graphics card from the manufacturer website.
10. Perform initial setup following the guidelines in Table 3 or 4, depending on your operating system.
Intel® SSD DC P3700, P3600 and P3500 Series
Evaluation Guide June 2014 14 330592-001US
Table 3: Windows* Setup Guidelines
Feature Setting
Screen Saver Disable
Power Management Disable
System Protection (or System Restore or Backup processes) Disable
Automatic OS updates (for example, Windows Update) Disable
Disk Defragmentation Disable
Table 4: Linux* Setup Guideline
Feature Setting
Scheduler NA
Rotational 0
read_ahead_kb 0
NOTES:
1. Changeable in Linux* kernel 2.6.28 and newer, at /sys/block/sd†/queue
2. Found at /sys/block/sd†/queue
Replace † with letter of the target drive. To set these values, run: echo "value" > filename
For example, to set rotational to 0 for target drive /dev/sda, run: echo 0 > /sys/block/sda/queue/rotational
4.2.3 Set up The Drive
The default setting on the Intel® SSD DC P3700, P3600 and P3500 Series 800GB configures the drive to perform within PCIe* slot power specifications. The drive can be configured to Lower Performance
mode for less power consumption. See the P3700, P3600 or P3500 Series Product Specification for details.
To change the power setting from default to lower performance, use the following commands - (0 is set to 25 Watt average maximum power, 1 is set to 15 Watt and 2 is set to 10 Watt).
Windows
isdct.exe –power_mode -drive <devicenum> <0,1,2>
Linux (RHEL or SLES)
./isdct –power_mode -drive <devicenum> <0,1,2>
4.2.4 Run the Benchmark Test
1. Optimize mechanical drives before each test:
– Mechanical hard disk drives should complete drive optimization using a disk defragmenter program.
– Solid-state drives should not be defragmented using hard disk defragmentation tools.
2. Monitor Disk activity through Resource Monitor in Windows or a utility such as iostat* in RHEL/SLES.

Intel® SSD DC P3700, P3600 and P3500 Series
June 2014 Evaluation Guide 330592-001US 15
3. Pre-condition the drive by filling up the drive with sequential writes.
This makes sure that the benchmark tool does not record an artificially high out-of-box performance.
– In Windows, use Iometer to sequentially write to 100% span of the drive.
– In Linux, use the “dd” command on the test drive. e.g. dd of=/dev/nvme0n1 if=/dev/urandom oflag=direct
4. Set up the benchmark.
The Intel® SSD DC P3700, P3600 and P3500 Series shows up as a regular disk in disk management. Under Linux* it will provide two handles - /dev/nvme0 (for controller) and /dev/nvme0n1 (as namespace). You can query this by typing:
>ls /dev/nvme*
For benchmarking, use the namespace id.
Check that the latest P3700, P3600 or P3500 Series driver is installed on your system. Under
Windows* Device Manager> Storage Controller you should be able to see whether Intel driver is seen or not.
To setup the drive for benchmarking, use the following recommended procedure for your operating
system:
Iometer (Windows Server 2008/2012R2*)
– Verify that target drives are visible in Device Manager under Disk Management.
– Create an access specification to define the requisite workload. (Verify span is set to 100% of the drive.)
– Assign the newly created access specification to the manager. This enables workers to be assigned the same access specification.
Flexible IO tester (RHEL, SLES)
– Verify target drive namespace and controller are visible under /dev/nvme*
Setting FIO Paramenters
filename: List all target drives on the Intel® SSD, separated by a colon. For example: /dev/nvme0n1:/dev/nvme1n1:/dev/nvme2n1:/dev/nvme3n1. In case of a RAID volume, list
only the single RAID volume. E.g. /dev/md0
numjobs: For a sequential workload, set this to 1. For a random workload set this to 4 or higher with a combination of iodepth=32, this gives higher throughput
ioengine: Set to libaio, Linux native async IO engine
rw: Set to type of workload – read (for sequential reads), write (for sequential writes), randread (for random reads), randwrite (for random writes), randrw (for mixed random reads and writes), rw (for mixed sequential reads and writes)
direct: Set to 1, to use non-buffered IO
norandommap: Use this to generate a random offset for the IO (independent of what offsets
have been used in the past)
randrepeat: Set to 0. This will make sure the random number generator for generating offsets is seeded in a random/unpredictable manner every time.
group_reporting: Set to ‘on’ to report aggregate performance of all target drives.

Intel® SSD DC P3700, P3600 and P3500 Series
Evaluation Guide June 2014 16 330592-001US
Following is a sample FIO test for benchmarking 4KB Random Read Performance (for 10
minutes) on an 800GB Intel® SSD DC P3700, P3600 or P3500 Series:
fio –output=test_result.txt –name=myjob –filename=/dev/nvme0n1
–ioengine=libaio –direct=1 –norandommap –randrepeat=0 –runtime=600 –blocksize=4K –rw=randread –iodepth=32 –numjobs=4 –group_reporting
5. Run the benchmark.
– Run the workload on 100% span of the drive and allow the drive to reach steady state.
– Measure the aggregate performance and Quality of Service when the drive has reached
steady state.
6. Sequence of Workload.
– Sequential workload testing can be stimulated by the following workload:
Random = 0%
Number of Workers / Thread = 1
Runtime = 20 mins per workload (min)
Sequence
For %Read = [100%, 0%]
For TransferSize = [1MB, 128KB, 64KB]
For QueueDepth = [128, 64, 32, 16, 8, 4, 2, 1]
RunWorkload(%Read, TransferSize, QueueDepth)
End;
End;
End;
– Random workload testing can be simulated by the following workload:
Random = 100%
Number of Workers / Thread = upto 4
Runtime = 20 mins per workload (min)
Sequence
For TransferSize = [16KB, 8KB, 4KB]
For %Read = [100%, 0%]
For QueueDepth = [128, 64, 32, 16, 8, 4, 2, 1]
RunWorkload(%Read, TransferSize, QueueDepth)
End;
End;
End;

Intel® SSD DC P3700, P3600 and P3500 Series
June 2014 Evaluation Guide 330592-001US 17
7. The Intel® SSD DC P3700, P3600 and P3500 Series have an internal temperature sensor with an
accuracy of +/-2° C over a range of -10° C to 85° C which can be monitored using NVMe* Health Log.
For more information in sensor reading see SMART attributes sections. For temperature
information, read 0x02 log page byte 1. Log identified 0xC5 will also contain temperature statistics table.
In addition, drive will provide out of band access to temperature by means of SMBUS. The sensor has an accuracy of +/- 3C over a range of -20C to 125C. SMBUS temperature sensor will not be reported in NVMe* Health Log.
Refer to product specification.
Windows
isdct.exe –log 0x2 –drive <drivenum> -verbose
Linux (RHEL or SLES)
s/isdct –log 0x2 –drive <drivenum> -verbose
See Intel® Data Center Tool Users guide for more details.
8. The percentage wear-out of the drive can be monitored on the same log page. Byte 5 on log page 0x02 reports the wear-out of the individual NAND volumes. (Note: The wear-out is reported in hexadecimal. So, a 100% wear-out will correspond to a value of 0x64h.)
9. Analyze the results following the guidelines in Section 4.1.2, “Analyze Results.”
4.3 Considerations on Multiple Workers
Sequential read, write workload requires 1 CPU core for true sequentially. NVMe* drives provide higher
Native Queue Depth and IOs can spread across queues and multiple cores for better random performance scalability. Ordering cannot be guaranteed when IO is submitted by multiple workers on multiple CPUs. Thus the sequential workload begins to look more random as the number of workers goes up.
At 64K+, single worker provides best performance for sequential workloads.
However, for random workload best practice is to generate at least 4 workers with a Queue Depth of 32
for each. There can be other higher and lower combinations to better fit application needs.
Under IOMeter*user can set multiple workers in the IOMeter* GUI.
For FIO iodepth can be set for higher queue depth and numjobs for number of jobs.
Example:
fio –output=test_result.txt –name=myjob –filename=/dev/nvme0n1
–ioengine=libaio –direct=1 –norandommap –randrepeat=0 –runtime=600 –blocksize=4K –rw=randread –iodepth=32 –numjobs=4 –group_reporting

Intel® SSD DC P3700, P3600 and P3500 Series
Evaluation Guide June 2014 18 330592-001US
4.4 Considerations in CPU Affinity and Power Management
Operating Systems may schedule a single worker across multiple CPUs which can increase latency. For
optimal single worker performance, set the CPU affinity for the IOmeter dynamo process to a single CPU. CPU and system power management (for example, CPU C-states, PCI Link Power management) can add additional latency for low queue depth workloads because there is sufficient idle time for system devices to enter lower power states. For maximum single worker performance, Windows* should be configured with the High Performance system power policy.
Linux optimal configuration settings for FIO.
PCIe* Link Power management:
Add grub kernel boot parameter PCIe_aspm=off
CPU affinity for FIO:
#irqbalance -o -h exact after loading NVMe* driver but before running FIO
Add FIO parameter –cpus_allowed=<CPU>
Where <CPU> parameter is a comma separated list of CPUs.
Set max CPU performance (freq and disable CPU C-states)
For each <CPU>:
# echo “performance” >
/sys/devices/system/cpu/cpu<CPU>/cpufreq/scaling_governor

Intel® SSD DC P3700, P3600 and P3500 Series
June 2014 Evaluation Guide 330592-001US 19
4.5 Example Performance Results
This section provides an example of performance results Intel measured when testing the Intel® SSD DC P3700 or P3600 Series.
The results shown are based on specific system hardware configurations and may vary depending on
the system used. Exact configurations for each example are described below each result. If results vary considerably, contact your Intel representative.
Table 5: Random IOPs Results – Intel® SSD DC P3700 and P3600 Series
Specification1 Unit
400GB 800GB 1.2TB 1.6TB 2.0TB
P3700/P3600 P3700/P3600 P3700/P3600 P3700/P3600 P3700/P3600
Random 4KB 70/30
Read/Write (up to) 2 IOPS 150,000/80,000 200,000/110,000 NA/130,000 240,000/160,000 250,000/170,000
Random 8KB 70/30
Read/Write (up to) 3 IOPS 75,000/45,000 100,000/55,000 NA/65,000 140,000/75,000 150,000/80,000
Random 4KB Read
(up to) IOPS
450,000/320,000 460,000/430,000 NA/450,000 450,000/450,000 450,000/450,000
Random 4KB Write
(up to) IOPS 75,000/30,000 90,000/50,000 NA/50,000 150,000/56,000 180,000/70,000
Random 8KB Read
(up to) IOPS 260,000/180,000 280,000/240,000 NA/260,000 280,000/260,000 280,000/260,000
Random 8KB Write
(up to) IOPS 32,000/19,000 45,000/26,000 NA/27,000 75,000/33,000 90,000/35,000
Note: GB/s is equal to 1,073,741,824 bytes/second. 4KB is equal to 4,096 bytes. Iometer configured with QD=32 and
worker=4, 100% LBA range
System Configuration: Intel® Core i7-3770K CPU @ 3.50GHz, 8GB of system memory, Windows* Server 2012,
Table 6: Sequential Performance Results – Intel® SSD DC P3700 and P3600 Series
Specification Unit
400GB 800GB 1.2TB 1.6TB 2.0TB
P3700/P3600 P3700/P3600 P3700/P3600 P3700/P3600 P3700/P3600
Sequential Read1 MB/s 2,700/2,100 2,800/2,600 NA/2,600 2,800/2,600 2,800/2,600
Sequential Write1 MB/s 1,200/550 1,900/1,000 NA/1,400 1,900/1,700 1,900/1,700
Note: GB/s is equal to 1,073,741,824 bytes/second. 4KB is equal to 4,096 bytes. Iometer configured with QD=32 and
worker=4 , 100% LBA range
System Configuration: Intel® Core i7-3770K CPU @ 3.50GHz, 8GB of system memory, Windows* Server 2012,

Intel® SSD DC P3700, P3600 and P3500 Series
Evaluation Guide June 2014 20 330592-001US
4.6 Synthetic Benchmark Test Measurement Variations
Testing with synthetic benchmarks will result in measurement differences that depend on the benchmark tool and test methodology used.
Random performance is affected by the state of the drive once testing begins. For example, a fresh
out-of-the box drive will perform differently than a drive used over time. A good synthetic measurement methodology will exercise all drives such that they reach a steady state performance. Taking a synthetic measurement short of the steady state performance will produce varied results.
The data pattern can impact the drive’s performance. Some drives perform below datasheet
specifications for incompressible workloads. It is necessary to choose the right data pattern when benchmarking performance of the drive. The data pattern can be chosen based on the planned usage of the drive.
Most synthetic tools allow changing the data pattern.
In Windows, Iometer allows choosing from Full random, Pseudo-random and Repeatable byte data pattern.
Similarly, the –refill buffer parameter in Flexible IO tester allows changing to a pseudo random data
pattern.
Intel® SSD DC P3700, P3600 and P3500 Series
June 2014 Evaluation Guide 330592-001US 21
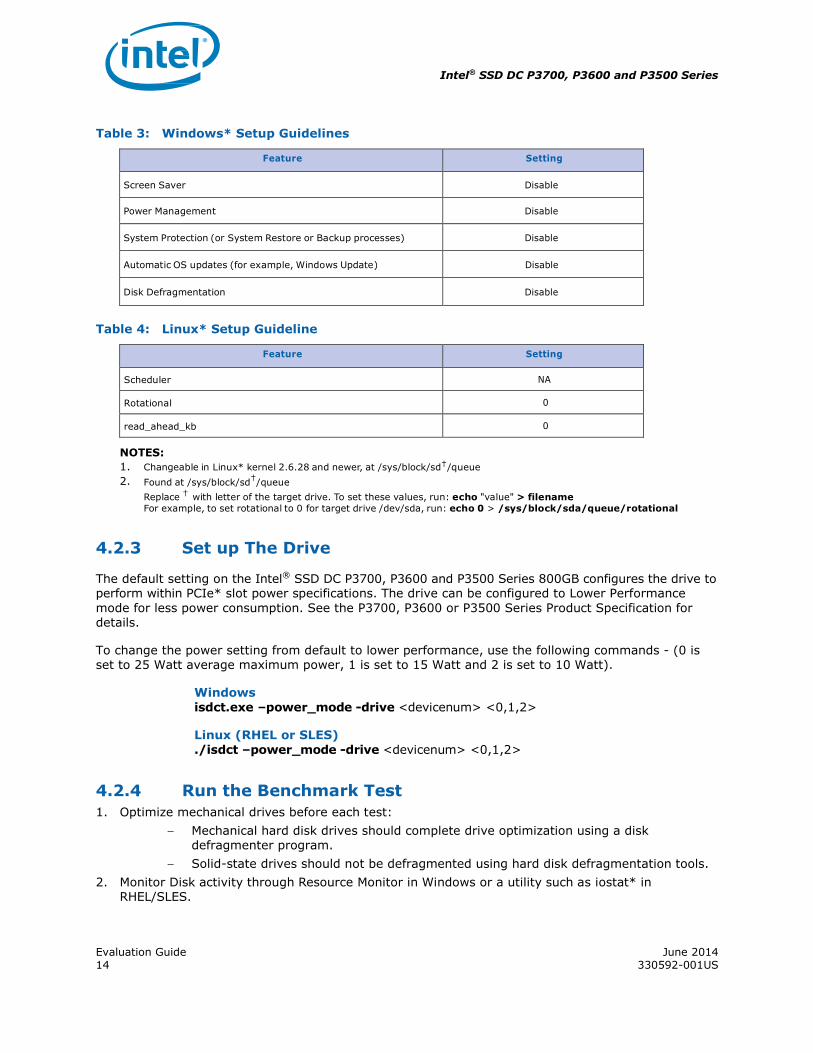
5 Additional Product Information
For additional information about the Intel® SSD DC P3700, P3600 and P3500 Series or supporting tools, see Tables 7 and 8 below.
Table 7: Related Documentation
Title Order Number
Intel® Solid-State Drive DC P3700 Series Product Specification 330566
Intel® Solid-State Drive DC P3600 Series Product Specification 330569
Product Brief for Intel® SSD Data Center Family for PCIe* 330591
Table 8: Related Tools
Product Download Link
Intel® SSD Data Center Tool http://www.intel.com/support/ssd

Intel® SSD DC P3700, P3600 and P3500 Series
Evaluation Guide June 2014 22 330592-001US
Appendix A Additional Benchmark Information
Common benchmarks are typically designed to highlight the performance and capabilities of the overall system.
While the addition of an Intel® SSD DC P3700, P3600 or P3500 Series will increase performance of sections of benchmarks that focus on the storage subsystems, other subsystem tests that do not access the storage subsystem may not show a gain in the benchmark score.
A.1 Iometer* Iometer is an open-source synthetic benchmark that allows for direct testing of the storage and
network subsystem.
For information on obtaining, installing, and running Iometer go to:
http://www.Iometer.org
A.2 Flexible IO* Tester (FIO*) FIO* is an open-source synthetic benchmark that allows for direct testing of the storage and network
subsystem.
For information on obtaining, installing and running FIO go to:
http://www.pkgs.repoforge.org/fio
A.3 Sample Data on IOPS and QD Sweep Following is an example performance chart showing IOPS and average latency on multiple different
Queue Depths.

Intel® SSD DC P3700, P3600 and P3500 Series
June 2014 Evaluation Guide 330592-001US 23
Table 9: Supported Server Platforms
Server/Motherboard CPU + Chipset BIOS
Romley - Copper Pass Jaketown + Patsburg 02.02.0002
Romley - Grizzly Pass Jaketown + Patsburg 02.02.0002
Romley - Crown Pass Jaketown + Patsburg 02.02.0002
Romley Refresh - Copper Pass Ivytown + Patsburg 02.02.0002
Romley Refresh - Grizzly Pass Ivytown + Patsburg 02.02.0002
Dell R620/720 (12G) Jaketown + Patsburg 2.1.3
Dell R620/720 (12G MLK) Ivytown + Patsburg 2.1.3
IBM M4 x3650 Ivytown + Patsburg 1.6
Supermicro Jaketown + Patsburg 3A
Grantley – Wildcat Pass Haswell + Wellsburg 01.01.0389
Oracle X5 (2u) Haswell + Wellsburg 30016700 (AMI)
Quanta S2S Haswell + Wellsburg S2S_3A02
Table 10: Supported Client Platforms
Desktop Client/Motherboard CPU + Chipset BIOS
Dry Fork I5-4670 + 0904 x64 (10/30/13)
Asus H87i-PLUS Haswell i5-4670 + AMI 1005
Intel DZ77GA-70K IvyBridge i7-3770K GAZ7711H.86A.0021.0222.2054
*Other names and brands are property of their respective owners

Fujitsu Customer Support
Please use the contact form at:
http://support.ts.fujitsu.com/contact/
For the Japanese market, please use the following URL:
http://jp.fujitsu.com/platform/server/primergy/support/
Telephone Support
For customer support phone numbers, please refer to the Fujitsu Technology Solutions service desk at
http://support.ts.fujitsu.com/contact/servicedesk/
For the Japanese market, please use the following URL:
http://jp.fujitsu.com/platform/server/primergy/support/supportdesk.html
Web
It is recommended to use the latest firmware / driver / BIOS versions on servers and components.
Software packages are available for download at:
http://support.ts.fujitsu.com > Server > Drivers & Downloads
For the Japanese market, please use the following URL:
http://jp.fujitsu.com/platform/server/primergy/downloads/
Corresponding user documentation for servers and optional components can be found online at:
http://manuals.ts.fujitsu.com > Industry Standard Servers > Expansion Cards > PCIe SSD Cards
For the Japanese market, please use the following URL:
http://jp.fujitsu.com/platform/server/primergy/manual/
The complete PRIMERGY documentation can also be downloaded as a DVD ISO image at:
ftp://ftp.ts.fujitsu.com/images/serverview
http://jp.fujitsu.com/platform/server/primergy/downloads/ (Japanese market)