Intel® Cloud Builders Guide NMView*
19
Intel® Cloud Builders Guide Intel® Xeon® Processor‐based Servers Supermicro* NMView* Intel® Cloud Builders Guide for Power Management in Cloud Design and Deployment using Supermicro® Platforms and NMView management software Supermicro* NMView* AUDIENCE AND PURPOSE This reference architecture outlines the usage of energy management and thermal technologies as part of planning, provisioning, and optimizing strategies in enterprise and cloud data centers to reduce energy cost and address constrained power situations. It is intended for data center administrators and enterprise IT professionals who seek energy management solutions to achieve better energy efficiency and power capacity utilization within existing or new data centers. The actions and results as prescribed can be used as a reference to understand energy management solutions implemented with the use of hardware and software components. The reader should be able to develop appropriate energy management solutions based on the design options presented using Supermicro NMView and Supermicro X8 and X9Servers implementing Intel® Power Management technologies. Intel® Xeon® Processor 5500 Series Intel® Xeon® Processor 5600 Series Intel® Xeon® Processor E5‐2600 Series
Transcript of Intel® Cloud Builders Guide NMView*

Intel® Cloud Builders Guide Intel® Xeon® Processor‐based Servers Supermicro* NMView*
Intel® Cloud Builders Guide for Power Management in Cloud Design and Deployment using Supermicro® Platforms and NMView management software Supermicro* NMView*
AUDIENCE AND PURPOSE
This reference architecture outlines the usage of energy management and thermal technologies
as part of planning, provisioning, and optimizing strategies in enterprise and cloud data centers
to reduce energy cost and address constrained power situations. It is intended for data center
administrators and enterprise IT professionals who seek energy management solutions to achieve
better energy efficiency and power capacity utilization within existing or new data centers. The
actions and results as prescribed can be used as a reference to understand energy management
solutions implemented with the use of hardware and software components.
The reader should be able to develop appropriate energy management solutions based on the
design options presented using Supermicro NMView and Supermicro X8 and X9Servers
implementing Intel® Power Management technologies.
Intel® Xeon® Processor 5500 Series Intel® Xeon® Processor 5600 Series
Intel® Xeon® Processor E5‐2600 Series

[ISV/OEM name and product]
2
Contents AUDIENCE AND PURPOSE ....................................................................................................................................................................................1
Executive Summary............................................................................................................................................................................................... 4
Introduction .......................................................................................................................................................................................................... 4
Server Power Management ....................................................................................................................................................................................5
Supermicro NMView ..............................................................................................................................................................................................5
Supermicro X8 and X9 Servers............................................................................................................................................................................... 6
Supermicro X8 and X9 Supported Systems..................................................................................................................................................... 6
Intel® Node Manager ............................................................................................................................................................................................ 6
Hardware Requirements ................................................................................................................................................................................ 6
Capabilities of Intel Node Manager Technology 1.5 (Supermicro X8) ...............................................................................................................7
Capabilities of Intel Node Manager Technology 2.0 (Supermicro X9) ...............................................................................................................7
Intel Xeon E5‐2600 Platform Power Supply Features ............................................................................................................................................. 8
Intel Closed Loop System Throttling (CLST) ................................................................................................................................................... 8
Smart Ride Through (SmaRT) ........................................................................................................................................................................ 8
Test‐Bed Blueprint ................................................................................................................................................................................................ 8
Design Considerations ................................................................................................................................................................................... 8
Software Architecture.................................................................................................................................................................................... 8
Hardware & Software Description .................................................................................................................................................................. 9
Physical Architecture ..................................................................................................................................................................................... 9
NMView Console Configuration............................................................................................................................................................................. 9
Initial Settings/Preferences ‐ Adding the License Key to NMView ..................................................................................................................10
Datacenter Hierarchy.................................................................................................................................................................................... 11
Scanning and Acquiring Servers ....................................................................................................................................................................12
Energy Management Use Cases............................................................................................................................................................................ 13
Use Case One: Monitoring Power, Temperature and Events of a Device or Group ................................................................................................. 13
Understanding Power and Thermal Data.......................................................................................................................................................14
Use Case Two: Creating Power Policies to Increase Server Density........................................................................................................................14

Intel® Cloud Builders Guide: Supermicro* NMView*
3
Use Case Three: Surviving Power and Thermal demands in the Data Center .........................................................................................................16
Emergency Power Reduction ........................................................................................................................................................................16
Mitigating Thermal Events ............................................................................................................................................................................16
Use Case Four: Optimizing Power Usage to Meet Workload and Power Demands................................................................................................. 17
Conclusion............................................................................................................................................................................................................18
Things to consider ................................................................................................................................................................................................18
Architectural Considerations.........................................................................................................................................................................18
1. Scalability ..........................................................................................................................................................................................18
2. Management Traffic Separation.........................................................................................................................................................18
3. Power Management...........................................................................................................................................................................19
4. Power Capping Capability in Supermicro NMView..............................................................................................................................19
5. System Management Software Suite………………………………………………………………………………………………………………………………….18
References ...........................................................................................................................................................................................................19

Intel® Cloud Builders Guide: Supermicro* NMView*
4
Executive Summary
The evolution of cloud computing has resulted in highly efficient and carefully optimized data centers with increased server density and capacity that makes considerations on energy consumption and utilization extremely critical along with several other factors that were not as significant in smaller data centers of the past. To support this evolution, Intel works with end users to create an open data center roadmap of usage models that address key IT pain points for more secure, efficient, and simple cloud architectures built on a foundation of transparency. This paper describes an Energy Management Reference Architecture based on Supermicro and Intel solutions with usage models aimed at data center power efficiency and optimal utilization of provisioned power and cooling capacity. The goal of energy management usage models is to optimize productivity per watt in order to reduce total cost of ownership (TCO). Requirements include the capability to monitor and cap power in real‐time at server, rack, zone, and data center levels. This means the ability to monitor and manage aggregated power consumption within a rack, zone, or data center based on available power and cooling resources. Intel® Node Manager is implemented on Intel® server chipsets starting with Intel Xeon processor 5500 and 5600 series platforms. Significant improvements with Intel® Node Manager 2.0 being introduced in 2012 on Intel based Supermicro server platforms supporting the E5 processor family which are also presented in this document. In this reference architecture we used Supermicro X8 and X9 Servers with Intel® Node Manager
1 and Supermicro
NMView2 which uses the Intel® Data
Center Manager3 SDK (Intel DCM) to
provide data center energy efficiency through real time power monitoring of
the servers, power capping and policy based energy management. We describe the following energy management use cases in detail along with experimental results and data. 1. Real‐time Server Energy Usage
Monitoring, Reporting and Analysis to get continuous and actual energy usage visibility via agentless monitoring of the servers along with other devices and systems in the enterprise network, data center and facilities. The actionable reporting and analysis with real‐time power monitoring enables reduction in energy cost and carbon emissions.
2. Power Guard Rail and Optimization
of Rack Density by imposing power limits to prevent server power consumption from straying beyond the preset limit. The deterministic power limit and guaranteed server power consumption ceiling helps maximize server count per rack and therefore return on investment of capital expenditure per available rack power when the rack is under power budget with negligible or no per server performance impact.
3. Disaster Recovery/Business
Continuity by applying significantly lower power caps to lower power consumption and heat generation when unforeseen circumstances like power outage and cooling system failure occur. In these scenarios it may be appropriate to set aggressively lower power caps, though performance may be affected. The use case illustrates how this works at a data center location or a group of servers.
4. Power Optimized Workloads to
achieve power efficiency. Workload profiles are built and a maximum performance loss target is set. Experiments determine how much capping can be applied before the performance target is hit. The
approach is to match actual performance against service level requirements. For workloads that were processor intensive, a 10 percent reduction in power savings equated to 13 percent decrease in performance.
The paradigm of cloud computing brings opportunity for data center efficiency. Energy management usage models addressed here can substantially help to meet power management requirements. Supermicro NMView can manage a wide range of devices and systems in the data center to reduce energy cost; however, this paper focuses its usage models on servers, specifically Supermicro X8 and X9 servers with Intel power management technologies.
Introduction
Enterprise data center efficiency has
become a central focal point for many
industry leaders and all facets of the data
center are being scrutinized for efficiency
modeling. Components across the data
center infrastructure are becoming more
power efficient and offering data
collection points to give administrators
more control of their enterprise
environments. Power and Thermal data
collection of an aggregated group of
servers can give data center managers the
ability to use this aggregated information
to formulate new methods to optimize
power usage in the data center while
ensuring power levels are met on a real‐
time basis. Enterprise computing is very
demanding and is increasing rack density
to new levels. Power and thermal
monitoring and control are gaining more
importance with each new system that is
focused on delivering the best
performance per watt per workload.
Companies are consistently focusing on
lowering TCO while still meeting
customer demands for increased
capability to run more workloads in the

Intel® Cloud Builders Guide: Supermicro* NMView*
5
data center. The benefit of tuning your
workloads to your data center capabilities
allows for a solid delivery of services,
while ensuring the infrastructure is
utilized in the most efficient manner.
In the past, data centers were using nameplate values for their servers to gauge how many systems could fit within a rack or circuit, but with the ability to poll data from systems in real time, a data center manager can monitor the actual usage and set a de‐rated power limit on those systems which can allow for more server density per circuit. Using de‐rate power numbers for data center planning versus the nameplate power can increase rack density by 40 percent. Supermicro X8 and X9 servers supports real time monitoring of power consumption using Intel Node Manager, and they are managed using Supermicro NMView on a regular basis to ensure the rack power is kept within boundaries, and alerts the system admin if power abatement is required to sustain the system service level agreements.
Server Power Management
In the past, power consumption used to be an afterthought for server deployment in data centers. Unfortunately, this view persists. For example, in many facilities the utility bill is bundled with the overall building charge which reduces the visibility of the data center cost. Even though servers have become much more efficient, packaging densities and net power consumption have increased. As a result, power and its associated thermal characteristics have become the dominant components of operational costs. Power and thermal challenges in data centers include:
Increased total operational costs due to increased power and cooling demands
Physical limitations of cooling and power within individual servers, racks, and data center facilities
Lack of visibility into actual real‐time power consumption of servers and racks
Complexity of management components and sub‐systems from multiple vendors with incompatible interfaces and management applications.
These challenges to manage datacenters can be translated into the following requirements:
Power monitoring and capping capabilities at all levels of the data center (system, rack identification, and data center). What can be done at an individual server level becomes much more compelling once physical or virtual servers are scaled up significantly.
Aggregation of the power consumed at the rack level and management of power within a rack group to ensure that the total power does not exceed the power allocated to a rack.
Higher level aggregation and control at the row or data center level to manage the power budget within the average power and cooling resources available.
Optimization of productivity per watt through management of power at the server, rack, row, and data center levels to optimize TCO.
Application of standards‐based power instrumentation solutions available in all servers to allow management for optimal data center efficiency. Extension of instrumentation to enable load balancing or load migration based on power consumption, and close coupled cooling for the management of pooled power and cooling resources.
Supermicro NMView
NMView is an application used to monitor
Supermicro X8 and X9 Series servers with
Intel® Node Manager. It can help
datacenter managers monitor the health
of servers in real time and immediately
respond when problems arise. Monitored
parameters include power, temperatures,
policies and events. NMView
authenticates access through the
Supermicro Baseboard Management
Controller (BMC) which must be
configured on each system in the
datacenter that is to be monitored.
Supermicro NMView provides real‐time
power monitoring and management for
up to five thousand servers per instance.
NMView can be setup in a tiered
architecture where multiple NMView
servers can communicate to a master
server.
Included in the Supermicro X8 and X9
server is the BMC which allows the
systems administrator access to monitor
power and thermal inlet temperature (X9
Series and newer). The BMC is fully
featured on the Supermicro X8 and X9
servers including full IPMI 2.0 support, a
graphical interface, as well as full remote
KVM with virtual media access.
Communication to the servers is
performed via TCP/IP and IPMI and no
other software or plugins are required for
access. The BMC must have IPMI over
LAN access with Administrator rights in
one of the first 3 cipher suites. This allows
out‐of‐band access from the console to
monitor and control each Supermicro X8
and X9 server.
Supermicro NMView has been developed
to address several imperatives that
impact enterprise customers on a daily
basis. Worldwide usage of Supermicro
high‐efficiency solutions could save up to
$5.7 billion per year in electricity costs, 57
billion kilowatt‐hours per year of
electricity or the equivalent of 9 billion
trees compared to the servers in use in
today's data centers.

Intel® Cloud Builders Guide: Supermicro* NMView*
6
For example, a datacenter with 1,000 1U high‐efficiency servers could save up to $84K annually in electricity costs, 700 tons of CO2, or the
equivalent of 240 acres of trees for the sequestration of CO2 emissions. http://www.supermicro.com/GreenIT/
The consequences of not managing power can be related to, but are not limited to these examples:
Rack density suffers from poor server placement, and no real monitoring has been available.
Unpredictable power bills due to no central monitoring capability. The energy provider supplies a bill, but there is no breakdown from
the overall power.
Brownout or blackout issue causes loss of workloads. If power could be mitigated to reduce load – the work could be sustained to ride
through the outage.
Stranded power from over‐subscribing servers in racks to ‘play it safe’ and ensure power limits aren’t exceeded.
All of these issues, and more, can be addressed by installing NMView along with Supermicro X8 and X9 server systems that utilize Intel® Node
Manager Technology.
Supermicro X8 and X9 Servers
Supermicro X8 and X9 servers offer the most advanced technological innovations to give you more capacity to implement workloads and the tools
to harness the power while delivering workloads in your datacenter. Supermicro’s IPMI based BMC management deploys, updates, monitors and
maintains the entire server lifecycle, through agent‐free out‐of‐band management. This allows customers to process more data, support more
applications, reduce infrastructure complexity, and increase efficiencies without increasing your bottom line costs.
To stay innovative, you must quickly adapt to the changing demands of your customers or constituents. And making sure your IT infrastructure
keeps pace can be a daunting task. With new Supermicro X8 and X9 servers systems management in your corner, you can spend more time on
expanding business and less time struggling to keep your operations up.
Supermicro X8 and X9 Supported Systems: The Supermicro X9 Serverboards are available in a variety of architectures including Twin and new
Fat Twin, GPU/MIC Supercomputer, MicroCloud, Data Center Optimized, SuperServer® Advantage, I/O Optimized, SuperWorkstation, and
SuperStorage Solutions. These Serverboards offer numerous advantages including up to 768GB of Reg. ECC DDR3‐1600MHz memory in 24 DIMM
slots, SATA 3.0 and SAS 2.0 (6Gb/s) HDD support, ConnectX FDR/QDR InfiniBand ports, dual 10 Gigabit Ethernet, Quad Ethernet LAN, PCI‐E 3.0
technology, LSI® 2308 controller with software RAID and LSI® 2208 controller with hardware RAID, IPMI 2.0, and Intel® Xeon® processor E5‐
2600/1600 series for highest performance. With New Generation X9 Serverboard Platform Supermicro offers the most extensive selection of
solutions for Data Center, Enterprise IT, Cloud Computing, Graphics, Technical Computing, and HPC environments. . The updated list of Intel
Node Manager supported systems from Supermicro can be found at this website: http://www.supermicro.com/products/nfo/nmview.cfm
Intel® Node Manager
Intel® Node Manager is an individual server power management capability that is embedded in Supermicro X8 and X9 servers. Intel® Node
Manager is firmware and hardware based technology that is used to optimize and manage power and cooling resources in the data center. This
server power management technology extends component instrumentation to the server level and can be used to make the most of every watt
consumed in the data center. Intel® Node Manager delivers the core capability to provide real‐time power and inlet temperature information and
can enable power limits to allow the data center to be run in a more efficient manner.
Hardware Requirements
Intel Chipset (Intel®5520 Chipset for Supermicro X8, and Intel®C600 Chipset for Supermicro X9)
Intel Manageability Engine Firmware enabled by default by BIOS on Supermicro hardware products(version 1.5 for Supermicro X8, and
version 2.0 for Supermicro X9)
PMBus Based Power Supply v1.1 (v1.2 recommended)
Intel® Cloud Builders Guide: Supermicro* NMView*
7
Baseboard Management Controller for communication between the console and Intel ME
Schematic of Supermicro Server and Basic level communication
Capabilities of Intel Node Manager Technology 1.5 (Supermicro X8)
Report system‐level power consumption
Limits power via policies defined by the IT Administrator at the system, rack, row, and room level using P and T‐State controls
Trigger and Time based Policies
Up to 16 policies ( stored in ME firmware) per system
Capabilities of Intel Node Manager Technology 2.0 (Supermicro X9)
In addition to the features found in Node Manager 1.5, additional controls and sensors in the Supermicro X9 Platforms include
Runtime Average Power Limiting (RAPL) to implement power control in CPU & Memory
Report inlet temperature per server
CPU Domain Power monitoring and limiting
Memory Domain Power monitoring and limiting
Dynamic Core Allocation (requires ACPI 4.0 compliant OS)
Intel® Cloud Builders Guide: Supermicro* NMView*
8
Intel Xeon E5‐2600 Platform Power
Supply Features
Intel Node Manager requires the usage of a PMBus (v1.1 or recommended v1.2) based power supply in order to monitor the direct power draw of the overall platform. In addition to this feature on the E5‐2600 based servers (Supermicro X9) there are additional features that have been built into the platforms to help mitigate cost and increase platform readiness in the datacenter.
Intel Closed Loop System Throttling
(CLST)
Reduces power supply unit (PSU) size and cost, improves PSU efficiency in redundant mode, and allows additional components to be added to the baseboard. A protection mechanism prevents PSU overloading and system crashing when platform power exceeds supported levels, and maintains the highest possible efficiency over the full operating range of system load states.
Smart Ride Through (SmaRT)
Controls the PSU load during AC line dropouts, provides higher PSU efficiency
at heavy load times, and simplifies PSU holdup time requirements. This allows the system to ‘ride through’ momentary losses of AC power while maintaining the highest possible power supply efficiency.
Test‐Bed Blueprint
Intel and Supermicro collaborated on
implementing a test bed that features
Supermicro X8 and X9 servers, designed
for high‐performance and efficiency in
enterprise computing. The test bed is
intended to provide an environment to
simulate the aspects of a data center that
are relevant to enterprise computing
usage models using Supermicro X8 and
X9 Servers which include Intel® Node
Manager Technology and being managed
by Supermicro NMView management
using Intel® DCM as the base framework
for power and thermal management.
Design Considerations
Supermicro X8 and X9 servers having
Intel® Node Manager Technology are
instrumented with PMBus compliant
power supplies required for real‐time
power monitoring. On the Supermicro X9
platforms the inlet thermal sensor is also
utilized for thermal readings and reaction
to those readings is triggered via power
policies set by the system administrator.
Authentication in this document will be
used as the Administrator account. More
advanced account authentication
methods can be reviewed in the
Supermicro NMView documentation.
Software Architecture
Supermicro NMView is based on the Intel
SDK Intel Data Center Manager (Intel
DCM) and supports a large infrastructure
of servers based on a tiering architecture.
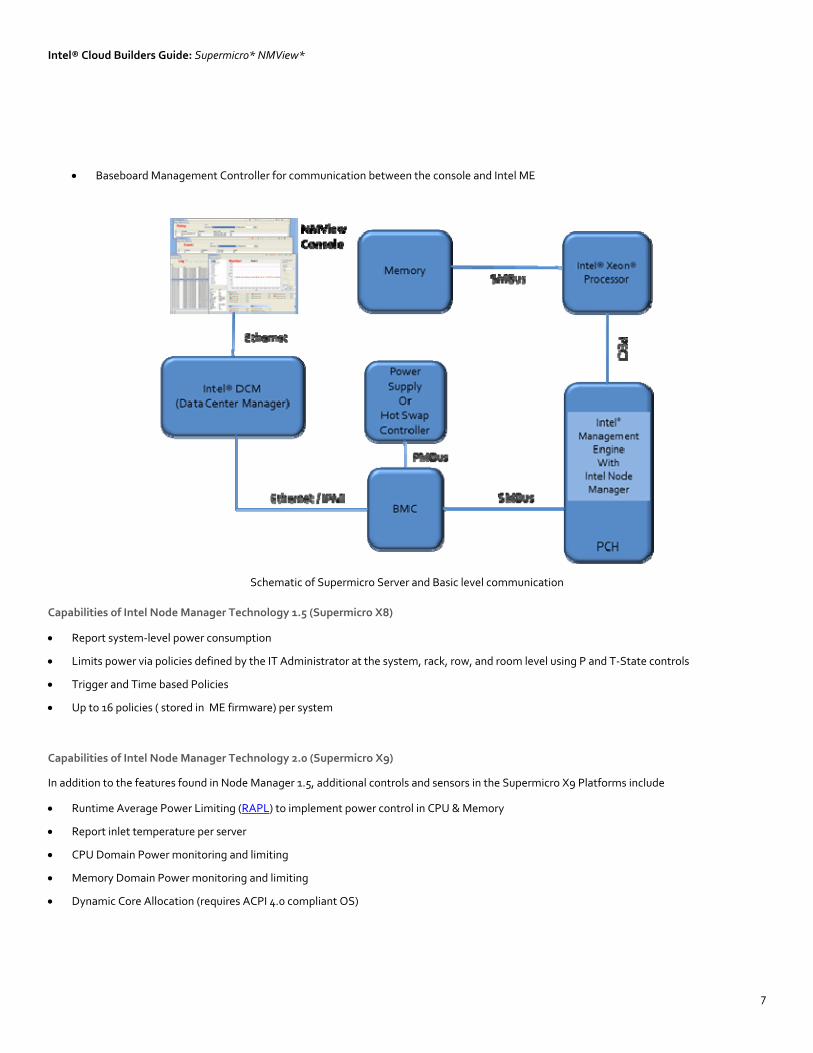
One master NMView system can control
multiple DCM servers – each DCM server
can manage 5,000 nodes so this gives the
customer the capability to grow and
expand their datacenter and control
power and thermals during the growth
and maintenance phase.
.
Schematic of Supermicro NMView Tiered Hierarchy of monitoring systems

Intel® Cloud Builders Guide: Supermicro* NMView*
9
Hardware & Software Description
Node System Physical Components BIOS/Firmware
Servers 1 thru 4 Supermicro 1026T‐URF4+ Dual Processor Intel® Xeon® Processor X5690,
3x500G RAID5, 12GB RAM BIOS 2.1a, BMC 1.73, Intel ME 1.12
Server 5 Supermicro SYS‐1027GR‐TRF SYS Dual Processor Intel® Xeon® Processor E5‐2670,
2x Intel 160G SSD, 64GB RAM, Dual GK104 nVidia BIOS 1.0c, BMC 1.73, Intel ME 2.1.5.95
Physical Architecture
The systems in our group testing for this document were housed in a single rack but split across two networks. The VM for NMView and Intel DCM
was provided by a Supermicro 1026T‐URF4 servers running VMware ESX5i and had a single virtual NIC on subnet 91, which also had access to
subnet 70 via the lab Gigabit network.
NMView Console Configuration
Virtual Machine (hosted on a Supermicro SYS‐1026T‐URF4+ running VMware ESX 5.1 Server)
40GB disk space
4GB available RAM
Single 1GbE Virtual NIC
4‐Cores x 3.47GHz (Intel Xeon X5670 Processor)
OS: Microsoft Windows Server 2008 R2 x64
IBM J9 VM (build 2.6, JRE 1.7.0 Windows Server 2008 R2 amd64‐64 20120322_106209 (JIT enabled, AOT enabled)
Bundled with NMView – Intel DCM 3.0.0.6118
10.1.91.x
10.1.70.x
NMView DCM
On Virtual Machine

Intel® Cloud Builders Guide: Supermicro* NMView*
10
Initial Settings/Preferences ‐ Adding the License Key to NMView
In order to get full functionality of power and thermal monitoring and limiting, the NMView server needs to be licensed for full feature utilization.
If the installation does not have a license key, the instance of NMView server is limited to monitoring capabilities. Registration is a simple process
to follow in the NMView Screen by clicking Help – Activation and selecting your method of installation. Shown below is the online activation, but
offline modes can be performed as well if your network is secured and does not allow for internet access.
The initial configuration of your server will depend on some key
factors depending on your datacenter requirements:
Power cost per kWh
Cooling/Power Multiplier (in general, many use 1.5 ratio of
cooling in relation to power usage)
Level of granularity that you want to monitor – we’ll be
using 30 seconds in this document
If you have a multiple NMView server installation, this is
where you can configure the tiered‐architecture – we are
using a single instance of NMView Server for this paper.
Intel DCM has several customization options. The screen
capture to the right shows the options we used in creating
this paper.
DCM Configuration 1

Intel® Cloud Builders Guide: Supermicro* NMView*
11
When starting up NMView for the first time, you’ll need to authenticate to the Intel DCM installation. The screenshot below shows our basic configuration for this NMView instance.
You can now double‐click on the server name which will open a new frame in the display. This new frame will be the primary window used in this
document, showcasing the monitor, policies, events and logging.
Datacenter Hierarchy
Depending on your datacenter configuration, you may wish to group systems in various ways – physical location, logical grouping, application
based grouping, or just simple racks and rows. You can define your NMView/DCM groups as you wish. In this document we are using four
Supermicro X8 systems, and one Supermicro X9 server which are denoted in specific racks, rows, room and overall datacenter hierarchy. In the
next section we will showcase how to add these systems to your NMView hierarchy.
Hierarchical display of the NMView monitored systems.

Intel® Cloud Builders Guide: Supermicro* NMView*
12
Scanning and Acquiring Servers
You can manually add each node to the NMView server using these simple steps:
1. Click “New Node” and a dialog box will pop up. 2. Input the properties of the node.
a. Name, Type, Connector Name, BMC Address and Derated Power are mandatory fields. b. Continue to add valid values to the rest of the fields as needed.
3. When finished, click the “OK” button to create the new node.
To assist in scale deployment, Supermicro has simplified the process to add systems to NMView by giving the ability to scan subnets with a
standard BMC username and password to acquire multiple systems in a simple network scan on your management network. By default, all
Supermicro BMC usernames and passwords from the factory are setup as ADMIN for username and ADMIN for the password – both are case
sensitive.
1. Click “New” to add a network discovery task and a dialog box will pop up 2. Please select a protocol and type in the IP range, network mask and login information (i.e. ADMIN and ADMIN) 3. Click “OK” to add the task, and the IP range will be scanned for authentication and added to a list.
4. Click the finished task to show the available devices. 5. Select the available devices. 6. Click “Add” to add the selected devices as entities.
Note: It is recommended to change the username/password combination to add a layer of security once you’ve acquired your servers into
NMView – It is highly recommended to establish good security practices for authentication.

Intel® Cloud Builders Guide: Supermicro* NMView*
13
Energy Management Use Cases
Using intelligent energy management at the server level helps IT administrators squeeze extra value and performance out of existing rack space while reducing the total cost of ownership by better managing power and operational cooling costs. Administrators can improve business continuity by dynamically capping power to avoid overcooling systems, reducing downtime and allowing critical operations to continue even during power or thermal events. They can also balance resources by dynamically moving power from one part of the data center to another, depending on where the need for power or cooling is greatest.
To maximize the benefits of Intel® Node Manager, a management console is required to aggregate power data and set policies for physical and
logical groups of servers. Supermicro NMView is the featured console in this document, and we will detail the resources available to support Intel®
Node Manager in scale deployment. Establishing policies give the data center administrator the ability to setup certain scenarios to manage
these four basic usage models.
Group management is utilized in Supermicro NMView via a simple hierarchical display ‐ while controlling multiple servers within the physical (or
logical) groups. Establishing boundaries and limits ensures that the server group operates within the guidelines as prescribed by the datacenter
manager.
Use Case One: Monitoring Power, Temperature and Events of a Device or Group
The most basic use case of monitoring gives us the basis of data to evaluate the systems in the datacenter and make conscious decisions from that
data. Data center administrators are expected to have information on rack density, thermal footprint, and overall power consumption on a
measured basis across the data center. Supermicro NMView gives simple access to some critical data found in each and every datacenter. By
using Intel® Node Manger technology in conjunction with the BMC, the data center manager can visually see the power consumed by each server,
and the thermal inlet temperature (X9 Series) on the front of each server chassis. These data points can be aggregated to make critical decisions
on server placement, manage ways to optimize cooling, and also maximize the usage of power circuits throughout the room.
Intel® Cloud Builders Guide: Supermicro* NMView*
14
When devices are added into NMView, the data collection process starts immediately and in our test bed demo – measures power and thermal
inlet temperature at 30 second intervals. Any events that occur on the systems will be logged automatically.
Understanding Power and Thermal Data
There are a multitude of sensors on the Supermicro server platforms that provide data to the NMView console. Many of these sensors provide
Maximum, Average, Minimum and Instantaneous readings and you can custom tailor your NMView display to showcase what data is important to
you at any moment. Primarily this document will discuss average power and thermal inlet temperature monitoring in accordance with the four
basic use case models.
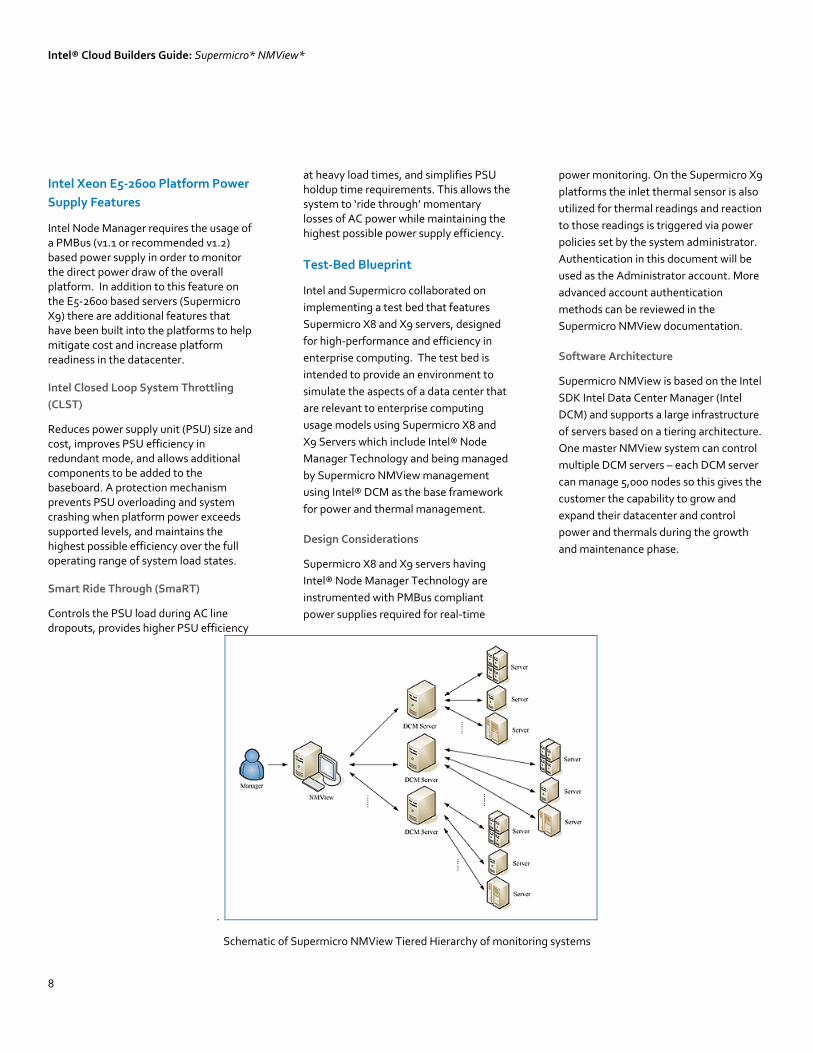
The Supermicro X9 Server above shows 4 discrete lines monitored over the past hour. You will notice the dip in measurements at the far left of the
graph. When the server was switching between workloads, there were a couple of minutes for that transition. You can see the workload changes
from the power curve.
Here’s a quick review of the info on the screenshot above:
The light blue line on top is the inlet thermal temperature, in this case showing an average 27C (80F)
The light green line is Average System Power which is 429W (under workload)
The pink line is Average CPU Domain Power (both processors are included) which is 199W (on average)
The bottom purple line is Average Memory Domain Power (all RAM included) which is 22W (on average)
The Node Manager 2.0 systems (Supermicro X9 servers) will have more ‘knobs and dials’ to monitor as stated previously, so you’re able to
customize your view per node, group, rack, row or entire room.
Use Case Two: Creating Power Policies to Increase Server Density
Both types of systems provided by Supermicro came with dual PMBus based power supplies (PSUs). These were setup in a redundant mode
where if one PSU fails, the second PSU can take the load of the system without worry of failure. On the X8 systems, each PSU is rated at 750W
(nameplate value) and the X9 system is rated at 1,800W (nameplate) per PSU.

Intel® Cloud Builders Guide: Supermicro* NMView*
15
Datacenter administrators usually understand that the ‘nameplate’ value printed on the PSU is usually a worst case scenario, but without solid
measurement or monitoring – many administrators are restrained by overpopulating the datacenter circuits because the nameplate value is
utilized when building racks and planning for power. With the 5 systems we have available – the nameplate total value is 4,800 watts.
Now with the nodes added to NMView – it’s easy to measure the power consumption in real‐time and when all five systems are under workload –
we show that all 5 systems are only using 1,372W of power – that’s 3,428W of power left stranded on the datacenter floor. Note that the
workloads on the test bed may differ from your datacenter, so it’s good to measure workloads that are pertinent to your customer loads.
We can safely add more density to this circuit. Given the data above, the average power consumption per server is 274 watts. If we take 4,800
watts as the maximum available on our power circuit divided by 274 watts per server – we could safely place 17 systems in the same power
footprint where we would normally only have 5 servers in the same 4,800W footprint. This is an increase of 3.4X in the number of servers that
could be placed in this rack.
NMView Screenshot of 6 systems power load at 1,538W (average).

Intel® Cloud Builders Guide: Supermicro* NMView*
16
Use Case Three: Surviving Power and Thermal demands in the Data Center
Emergency Power Reduction
Occasionally we hear from customers who have experienced brown‐outs or rolling black outs from their power providers due to over‐strained
power grids and running on battery and/or generator backup power is very costly. Supermicro platforms have Intel Node Manager technology
built which allows for throttling back system power to sustain workloads while reducing power to as low as technically possible while still
performing a workload.
In many High‐Performance Compute (HPC) instances, the workloads run for a very long time, sometimes many days. In the event that the public
service provider either asks for a reduction in power or has an outage – it can drop thousands of hours of compute cycles if the workloads do not
finish prior to that event. This is where a “Minimum Power Cap” can be placed on a group of systems.
In this example, we used BOINC (http://boinc.berkeley.edu) which is an open‐source software platform for volunteer computing and desktop Grid
computing. It has a very simple CPU benchmark that can tell you how many Dhrystone MIPS (Integer based Millions of Instruction per Second)
your CPU is capable of handling and when power limited it shows a limited response.
The Supermicro X9DRG‐HF server showcased the following under test:
Supermicro X9DRG‐HF MIPS Watts
100% Workload (Uncapped) 2686 403
Minimum Power 119 209
During the minimum (or emergency) power reduction – we experienced >45% decrease in power, but also take into account that we had ~96%
impact to workload (MIPS). The big difference in comparison to a brownout or power‐off situation is that if the power issue is mitigated – the
workload is not lost as we see in the screenshot below. If all power (and resulting MIPS) are lost, it results in Zero work being done. Also, take into
account that if servers are not gracefully shutdown, you have the potential for hardware failure, lost workloads, and there will be some recovery
time to setup the workloads again.
Mitigating Thermal Events
In the event that your datacenter has a thermal issue or HVAC failure, Intel Node Manager gives you the controls to react to a thermal event. The
inlet temperature sensor on the Supermicro X9 systems are continually measuring inlet temperatures and reporting back to the NMView console.

Intel® Cloud Builders Guide: Supermicro* NMView*
17
In the event that the temperature rises to a pre‐set value that the datacenter administrator deems as ‘dangerous’ – a policy trigger will throttle the
systems back to minimum power (like the prior example). This is important because it will do a few things:
1. Give the datacenter administrator(s) time to mitigate the thermal issue to reduce the rising temperatures
2. Reduce the power consumed by each server, thereby reducing the heat output from each system which can contribute to the thermal
issue that is already occurring in the room.
3. Since the policy is stored on each system and is controlled from the central console, reaction to the thermal emergency is a near instant
reaction to the temperature rise.
4. Once the temperature is lowered, the systems will report back to the console which will remove the thermal trigger policy and operation
will return to normal.
Use Case Four: Optimizing Power Usage to Meet Workload and Power Demands
The fourth use case is the most advanced model where we have to understand the workload and impacts of limiting power in relation to the
performance provided for the given workload. Each application can react differently and should be measured against a known set of metrics to
ensure the service delivered by the systems still meets or exceeds your customer’s service agreement.
Workloads differ for each customer and the workload in this paper is very CPU intensive. Some workloads may have more I/O dependencies or
not be as intensive as a CPU benchmark shown in this paper. The data shown in the table below illustrates the impact of power limiting on CPU
performance.
Supermicro SYS‐1027GR‐TRF MIPSDelta from Max
CPU Watts
100% 2686 100% 295
95% Power 2391 89% 280
90% Power 2345 87% 265
85% Power 2125 79% 251
80% Power Limit 1896 71% 236
Min Power 119 4% 209
The CPU intensive workload is impacted by only 13% when a 10% power limit is incurred. Depending on the workloads in your datacenter, this
may be a feasible solution to save power and also provide 87% CPU utilization to your customer base.

Intel® Cloud Builders Guide: Supermicro* NMView*
18
MIPS vs. Power(W) per Power Limit 1
The graph (MIPS vs. Power) above helps to display the workload to the wattage used by the platform, and the MIPS benchmark runs in a linear
fashion in accordance to the power limit imposed on the system. This can help you to monitor your own workloads in real‐time to help determine
the optimal workload to power ratio. This gives the datacenter administrator the capability to reduce power usage and still provide the CPU
cycles needed to ensure customer satisfaction.
Conclusion
As shown in this document, Supermicro NMView utilizing Intel® DCM provides a rich management console to monitor and manage power in the
datacenter. Supermicro X8 and X9 servers with embedded Intel® Node Manager Technology give the appropriate dials and knobs to custom tune
your workload demands to meet customer needs. Automation in server policies also gives assured management during times of crisis in the
datacenter, whether it’s a high‐temperature situation or simple time based policy to meet regional power requirements. The four use cases of
monitor, limit, survive and optimize are a superset of usage models in the datacenter that can be expanded to meet the power and workload
requirements to mitigate energy costs and meet compute demands of the datacenter.
Things to consider
Architectural Considerations
1. Scalability
A single installation of Supermicro NMView can support up to 5,000 nodes. For larger implementations, multiple instantiations or a tiered
installation would be required.
2. Management Traffic Separation
Many customers feel a need to separate their management data from their production data. The Supermicro BMC port allows you to put
your management data onto a separate network port. The reader should consider options to share the same network or use a separate
network, and IP space for the management data.

[ISV/OEM name and product]
19
3. Power Management
Usage of power management should be considered only after careful analysis of the workload performance under various conditions and
evaluated both before and after power capping has been used. As mentioned previously, there are many usage models that can benefit from
power monitoring and management. At the same time, there can be scenarios where power management may not be the optimal solution.
For example, if a highly sensitive production application is very CPU intensive and the host machine is already over‐subscribed for power,
adding a power cap below that maximum power consumption level could inadvertently affect the performance of the system and return less
than expected results from the application.
4. Power Capping Capability in Supermicro NMView
Basic Supermicro NMView gives you monitoring‐only capabilities for power and temperature, but you should upgrade to the license model to
implement policies on the server platform. For more details on acquiring the license required, visit http://www.supermicro.com/nmview.
5. System Management Software Suite
Supermicro Data Center Management Software Suite, which includes NMView as discussed in this paper, enables Data Center operator to manage large clusters remotely and help build a cloud solution that monitors hardware health, provision hardware configuration and upgrade BIOS and firmware revisions of the servers. Contact your local Supermicro sales representative for further information.
References
• Intel® Node Manager: http://www.intel.com/technology/nodemanager
• Supermicro* NMView: http://www.supermicro.com/products/nfo/nmview.cfm
• Intelligent Platform Management Interface (IPMI): http://www.intel.com/design/servers/ipmi/
• PMBus*: http://pmbus.org/specs.html
• Advanced Configuration & Power Interface (ACPI): http://www.acpi.info
To learn more about deployment of cloud solutions, visit www.intel.com/cloudbuilders