
Integrated Systems for Rapid Point of Care (PoC) Blood ...3fcf1bc0-8744-4e83-83fc...number of...
8
CREATED USING THE RSC ARTICLE TEMPLATE (VER. 3.1) - SEE WWW.RSC.ORG/ELECTRONICFILES FOR DETAILS ARTICLE TYPE www.rsc.org/xxxxxx | XXXXXXXX This journal is © The Royal Society of Chemistry [year] Journal Name, [year], [vol], 00–00 | 1 Integrated Systems for Rapid Point of Care (PoC) Blood Cell Analysis Cees van Berkel, a James D. Gwyer, a Steve Deane, a Nicolas Green, b Judith Holloway, c Veronica Hollis b and Hywel Morgan b * Received (in XXX, XXX) Xth XXXXXXXXX 200X, Accepted Xth XXXXXXXXX 200X First published on the web Xth XXXXXXXXX 200X 5 DOI: 10.1039/b000000x Counting the different subpopulations of cells in a fingerprick of human blood is important for a number of clinical point-of-care (PoC) applications. It is a challenge to demonstrate the integration of sample preparation and detection techniques in a single platform. In this article we review the applications for PoC haematology and the current solutions that are available. We demonstrate a 10 generic microfluidic platform that combines sample processing and characterisation and enumeration in a single, integrated system. Results of microfluidic 3-part differential leukocyte (granulocyte, lymphocyte and monocyte) counts, together with erythrocyte and thrombocyte (platelet) counts, in human blood are shown and corroborated with results from hospital clinical laboratory analysis. 15 1 Introduction 1.1 Point-of-care haematology Diagnostic testing at or near the site of patient care is often termed ‘near-patient’ or ‘point-of-care’ (PoC) testing. The applications of PoC testing are widespread, including the use 20 of instrument-free, disposable reagent test strips, such as the home pregnancy kit or blood glucose test, through to portable hand-held or bench-top devices used, for example, in blood gas analysis (see Price 1 for a review). Since it aims to provide the convenience of in situ diagnostic testing, whilst competing 25 with the performance of centralised laboratory services, there are many considerations to take into account when designing a successful PoC system, including test accuracy, quality control, cost-effectiveness, training required, turn-around time and data management. 2 30 In recent years, PoC testing in haematology has increased significantly, such that guidelines for its use have been issued by both the British Committee for Standards in Haematology (BCSH) and the International Council for Standardization in Haematology (ICSH). 3,4 The full blood count (FBC), the most 35 common clinical indicator of patient health, is one area where PoC systems are expected to make a significant impact. The FBC includes (at least) a 3- (or 5-)part leukocyte, or white blood cell (WBC) differential count, haemoglobin (Hb) concentration, platelet count, red blood cell (RBC) count and 40 a variety of red cell indices related to red cell size and haemoglobin content. Other parameters, including reticulocyte (immature RBC), nucleated RBC and haematopoietic progenitor cell counts, can also be measured by the large automated haematology analysers used in many hospital 45 laboratories (see Buttarello et al 5 for a review). To ascertain the clinical requirements for a PoC haematology test we interviewed a number of tertiary-care based clinicians at Southampton University Hospitals NHS Trust. This “snapshot” led to a priority list with neutrophil 50 count at the top, followed by platelets, Hb and total WBC. Clinicians working in specialist fields had additional specific requirements, for example, oncologists specialising in leukaemia required a lymphocyte count; allergists an eosinophil count. For some clinicians the haematocrit (Hct) or 55 packed (red) cell volume (PCV) was also desirable. The test must also correlate with standard laboratory analysers, in accordance with ICSH guidelines. 6 ICSH guidelines that are written with special reference to the FBC 4 have identified a clear need for a PoC FBC for use 60 in areas including GP surgeries, pharmacies and residential settings. Such a device needs to be portable, the test must be minimally invasive and the system simple to use. For self- testing devices, capillary blood can be collected from a finger puncture, such as with glucose tests 7 or anticoagulation 65 therapy. 8 Furthermore, any PoC test device marketed within Europe must satisfy the In Vitro Diagnostic (IVD) Medical Devices Directive (98/79/EC), 9 or for the USA the Clinical Laboratory of Improvement Amendments (CLIA) laws, governed by the Food and Drug Administration (FDA) and the 70 Centers for Disease Control and Prevention (CDC). 10 PoC tests used by untrained persons must i) be easy to use at all stages, ii) minimise the risks of user error in handling the device and interpreting the results, iii) should, if possible, include user quality control and iv) provide detailed and 75 specific instructions on its use and how to interpret or act upon results obtained. A further important consideration in PoC measurements is turn-around time, which for the FBC is dominated by the number of cells counted. Sample loading and metering are also important parameters in the design of 80 miniaturised systems. 11 There are some examples of small FBC systems. The simplest is the HemoCue WBC system, 12,13 which requires 10 μl of blood and measures total WBC count (no differential). Blood is drawn into a cuvette containing reagents that lyse the 85 erythrocytes (RBCs) and stain the WBC nuclei, which are then counted and analysed using a camera and image processing. The Chempaq XBC (eXpress Blood Counter), performs a 3-part differential and Hb measurement. 14,15 The
Transcript of Integrated Systems for Rapid Point of Care (PoC) Blood ...3fcf1bc0-8744-4e83-83fc...number of...

CREATED USING THE RSC ARTICLE TEMPLATE (VER. 3.1) - SEE WWW.RSC.ORG/ELECTRONICFILES FOR DETAILS
ARTICLE TYPE www.rsc.org/xxxxxx | XXXXXXXX
This journal is © The Royal Society of Chemistry [year] Journal Name, [year], [vol], 00–00 | 1
Integrated Systems for Rapid Point of Care (PoC) Blood Cell Analysis
Cees van Berkel,a James D. Gwyer,a Steve Deane,a Nicolas Green,b Judith Holloway,c Veronica Hollisb and Hywel Morganb*
Received (in XXX, XXX) Xth XXXXXXXXX 200X, Accepted Xth XXXXXXXXX 200X First published on the web Xth XXXXXXXXX 200X 5
DOI: 10.1039/b000000x
Counting the different subpopulations of cells in a fingerprick of human blood is important for a number of clinical point-of-care (PoC) applications. It is a challenge to demonstrate the integration of sample preparation and detection techniques in a single platform. In this article we review the applications for PoC haematology and the current solutions that are available. We demonstrate a 10
generic microfluidic platform that combines sample processing and characterisation and enumeration in a single, integrated system. Results of microfluidic 3-part differential leukocyte (granulocyte, lymphocyte and monocyte) counts, together with erythrocyte and thrombocyte (platelet) counts, in human blood are shown and corroborated with results from hospital clinical laboratory analysis. 15
1 Introduction
1.1 Point-of-care haematology
Diagnostic testing at or near the site of patient care is often termed ‘near-patient’ or ‘point-of-care’ (PoC) testing. The applications of PoC testing are widespread, including the use 20
of instrument-free, disposable reagent test strips, such as the home pregnancy kit or blood glucose test, through to portable hand-held or bench-top devices used, for example, in blood gas analysis (see Price1 for a review). Since it aims to provide the convenience of in situ diagnostic testing, whilst competing 25
with the performance of centralised laboratory services, there are many considerations to take into account when designing a successful PoC system, including test accuracy, quality control, cost-effectiveness, training required, turn-around time and data management.2 30
In recent years, PoC testing in haematology has increased significantly, such that guidelines for its use have been issued by both the British Committee for Standards in Haematology (BCSH) and the International Council for Standardization in Haematology (ICSH).3,4 The full blood count (FBC), the most 35
common clinical indicator of patient health, is one area where PoC systems are expected to make a significant impact. The FBC includes (at least) a 3- (or 5-)part leukocyte, or white blood cell (WBC) differential count, haemoglobin (Hb) concentration, platelet count, red blood cell (RBC) count and 40
a variety of red cell indices related to red cell size and haemoglobin content. Other parameters, including reticulocyte (immature RBC), nucleated RBC and haematopoietic progenitor cell counts, can also be measured by the large automated haematology analysers used in many hospital 45
laboratories (see Buttarello et al5 for a review). To ascertain the clinical requirements for a PoC haematology test we interviewed a number of tertiary-care based clinicians at Southampton University Hospitals NHS Trust. This “snapshot” led to a priority list with neutrophil 50
count at the top, followed by platelets, Hb and total WBC.
Clinicians working in specialist fields had additional specific requirements, for example, oncologists specialising in leukaemia required a lymphocyte count; allergists an eosinophil count. For some clinicians the haematocrit (Hct) or 55
packed (red) cell volume (PCV) was also desirable. The test must also correlate with standard laboratory analysers, in accordance with ICSH guidelines.6 ICSH guidelines that are written with special reference to the FBC4 have identified a clear need for a PoC FBC for use 60
in areas including GP surgeries, pharmacies and residential settings. Such a device needs to be portable, the test must be minimally invasive and the system simple to use. For self-testing devices, capillary blood can be collected from a finger puncture, such as with glucose tests7 or anticoagulation 65
therapy.8 Furthermore, any PoC test device marketed within Europe must satisfy the In Vitro Diagnostic (IVD) Medical Devices Directive (98/79/EC),9 or for the USA the Clinical Laboratory of Improvement Amendments (CLIA) laws, governed by the Food and Drug Administration (FDA) and the 70
Centers for Disease Control and Prevention (CDC).10 PoC tests used by untrained persons must i) be easy to use at all stages, ii) minimise the risks of user error in handling the device and interpreting the results, iii) should, if possible, include user quality control and iv) provide detailed and 75
specific instructions on its use and how to interpret or act upon results obtained. A further important consideration in PoC measurements is turn-around time, which for the FBC is dominated by the number of cells counted. Sample loading and metering are also important parameters in the design of 80
miniaturised systems.11 There are some examples of small FBC systems. The simplest is the HemoCue WBC system,12,13 which requires 10 µ l of blood and measures total WBC count (no differential). Blood is drawn into a cuvette containing reagents that lyse the 85
erythrocytes (RBCs) and stain the WBC nuclei, which are then counted and analysed using a camera and image processing. The Chempaq XBC (eXpress Blood Counter), performs a 3-part differential and Hb measurement.14,15 The

2 | Journal Name, [year], [vol], 00–00 This journal is © The Royal Society of Chemistry [year]
device uses a disposable cartridge that is filled with 20 µ l of blood. Cells are counted and differentiated using the Coulter principle (DC). Hb is determined by dual-wavelength spectrophotometry. A new model, the XDM, measures WBC, RBC (and RBC indices) and platelet counts with a single 5
disposable cartridge.16 The Sysmex pocH-100i analyser is an automated system that performs a 3-part differential, Hb concentration, platelets, RBCs and various platelet- and RBC-derived parameters. Cells are differentiated using the Coulter principle. Hb concentration is determined by 10
spectrophotometry. The system differs from the Chempaq XBC in that the neutrophils are defined separately to the other granulocytes, which are grouped in a ‘mixed’ population with the monocytes.17,18 All these devices have been CE marked (Europe) and 510k approved (US), which allows their use in 15
the clinical environment by trained professionals. They are not, however, approved for ‘self-testing’ use by the patient.
1.2 Sample Preparation: driven flow microfluidics
In moving blood cell counting from the clinical laboratory to PoC, consideration has to be given to how blood enters the 20
device and how it is processed prior to measurement. A 2 µL drop of blood will typically contain 10,000,000 erythrocytes, 14,000 leukocytes of which only 600 will be monocytes. To cover this very large dynamic range, sample preparation is used with dilution ratios of 1:10,000 to 1:20 for erythrocytes 25
and leukocytes, respectively. To count all the available monocytes within a minute implies flow rates of at least 40 µL/min, and microfluidic technologies offer solutions to handling and processing such volumes.19,20 The HemoCue cuvette is one example of a haematology test that uses a very 30
simple microfluidic cartridge. In this system, 10 µl of blood is drawn by capillary forces into a disposable micro-cuvette containing the dried reagents necessary for erythrocyte lysis and either haemoglobin labelling or WBC staining.12 The demand for complex multi-parameter analysis of blood 35
necessitates a different approach to sample preparation. In milli-fluidic approaches,14,21 such as the Chempaq cartridge, the blood is mixed in a reservoir after capillary metering of a known volume of blood. Reagents are stored in the mixing reservoir as liquids and convective mixing is achieved by a 40
small magnetic stirrer. Pumping relies on externally delivered gas pressure. To achieve a higher degree of reaction control, however, the blood has to be pumped through the device at a constant rate while sample preparation (e.g. erythrocyte lysis, dilution 45
or separation) occurs in the flow. For continuous-flow sample preparation and analysis, sample metering, valving, reagent storage and mixing of reagents all need to be integrated into the device. Technologies for these different component functions have been investigated by a number of authors. 50
Networks of microfluidic channels can be designed and tuned to achieve desired mixing and dilution ratios while minimizing the need for externally driven valves or pumps.22,23 At low Reynolds numbers flows are predominately laminar 55
and diffusive processes dominate. This can be used either for assessment24 or for mixing.25 The latter has been deployed in
erythrocyte lysis, an important pre-treatment step in the FBC, to create a microfluidic device for rapid and continuous lysis of RBCs. The lysis reagent sheathes a stream of whole blood, 60
lysing the RBCs in the process. Following lysis, cells are returned to isotonic conditions by addition of phosphate buffered saline (PBS). In cases where the desired reaction times are shorter than diffusion times, there is a requirement for additional features in the microfluidic channels to speed 65
up mixing,26,27,28 thus reducing the lysis time. Microfluidic devices offer fast and controlled cell lysis which may have a positive impact on white blood cell recovery.29 Additional technologies available in the continuous-flow sample preparation ‘toolkit’ include separation and sorting30 and 70
methods to create sheath flow.31,32
1.3 Sample detection: Impedance cytometry
Techniques for electrical differentiation of blood cells are very suitable to miniaturisation and integration in microfluidic devices. Cells are approximated to a resistor that describes the 75
cytoplasm in series with a capacitor for the small membrane.33 The first cytometer capable of measuring the electrical properties of single particles was developed by Coulter.34 It measures the DC resistance (or low frequency impedance) change caused by a cell passing through a narrow orifice 80
separating two electrically isolated fluid-filled chambers. A small orifice can detect small particles, but restricts the overall range of particle sizes that can be measured. Usually a large orifice is used together with a low conductivity sheath fluid.35,36 The Coulter counter only sizes cells. Hoffman et 85
al37,38 developed a flow-system, based on the Coulter counter design, but with an AC current to measure the impedance of cells at higher frequencies. Microfluidic impedance cytometry (MIC) is an evolution of the micro-Coulter counter, but instead of fabricating an 90
aperture with sensing electrodes in reservoirs on either side, micro-electrodes are integrated into the walls of the micro-channel. The basic idea was mentioned by Coulter himself,39 but has only become realisable with modern micro-fabrication methods.40,41,42 Ayliffe et al40 were the first to demonstrate 95
single cell impedance measurements in a micro-device, demonstrating the potential of single cell impedance analysis. Gawad et al42 demonstrated clear differentiation between different particles using a microfluidic impedance analysis system. This paper was the first demonstration of quantitative 100
analysis showing discrimination of two cell populations. The coplanar electrode design proposed by Gawad et al42 has been adapted for particle counting by many authors; for a review see Sun et al43 and references therein. Recently Holmes et al44
demonstrated the use of MIC for identification and 105
enumeration of the three common leukocytes in human blood. Further developments include the use of an “impedance label” to aid in discriminating sub-populations of cells, such as CD4+ monocytes in a mixed population.45 For recent reviews on the technology see Sun et al43 and Cheung et al46. 110
The principal distinction between (micro-) Coulter counters and MIC systems arises from the fact that in the former the electric field is in the same direction (longitudinal) to the fluid flow and confined by the diameter and length of the orifice,

This journal is © The Royal Society of Chemistry [year] Journal Name, [year], [vol], 00–00 | 3
Fig. 1 (a) Schematic diagram of the microfluidic impedance sensor, and the configuration of the detection electronics. The channel is a square cross section (40 µm × 40 µm), and the electrodes are 30 µm wide with a 40 µm gap. The figure shows the largest common blood cell (monocytes, 5
~16-20 µm diameter) and the platelet size (1-3 µm diameter) for reference. (b) Photographs of the impedance chip, which is 15 mm × 20mm in size, with two zooms of the sensing region. This consists of two pairs of overlapping electrodes; signal input is on the top pair (1,2); the bottom pair (3,4) is connected to a differential virtual ground current 10
sensing electronics.
while in the latter the electric field is substantially perpendicular (transverse) to the fluid flow and confined by the diameter of the channel and the geometry of the electrodes. The two approaches deal in a fundamentally 15
different way with the unavoidable issue of electrolysis. In micro-Coulter counters the electrodes tend to be large and well removed from the orifice to spread bubble formation over a large (electrode) area and keep the gas products away from the orifice. In contrast, in MIC the electrodes are small and 20
placed in the high flow region of the channel itself which means that products of electrolysis are continuously removed by the flow. This means that MIC can be easily integrated with the continuous-flow sample preparation techniques discussed in the previous section. In addition, the confinement 25
of the electric field means that in MIC it is easy to incorporate pairs of electrodes, so that differential sensing can be used to correct for any drift in the electrode-fluid interface, or the properties of the carrier fluid. Moreover, because the electrodes are within the channel itself, there are no aperture 30
access resistances and the sensing volume itself is small, leading to an improvement of thermal noise limit of roughly a factor of 2, which in turn leads to a larger dynamic range of particles for a given aperture. The small parasitic capacitances associated with microelectrode systems also allow 35
measurements to be made at relatively high frequencies. The MIC system is shown schematically in Fig. 1; full details have been described previously.44 Briefly, two pairs of electrodes are fabricated on the top and bottom of a micro-channel. The top pair of electrodes is driven by an AC voltage 40
source of fixed frequency. The current flowing across the channel is measured by the bottom pair of electrodes, which are connected to a differential amplifier. The output signal from the amplifier measures the impedance of the cell as it travels through the channel. The signal consists of a peak in 45
one polarity as it passes the first electrode pair, and then an identical peak in the opposite polarity as it passes the second electrode pair. The signal transient provides information on cell size, shape, velocity and position in the channel. Further improvements in (small) particle detection and 50
characterisation can be achieved by introducing more electrodes into the channel.47
Fig. 2 (a) Diagram of the WBC/RBC chip processes incorporating lysis and quench of the blood, followed by WBC count (with optical 55
haemoglobin analysis). Dilution of the blood for RBC/PLT analysis is shown in the upper arm. (b) CAD drawing of the chip design showing the different length channels, the input ports and the locations of the two impedance chips. (c) Photograph of the final microfluidic device made in PMMA. 60
2 Microfluidic impedance cytometry for FBC
To perform a rapid FBC of small blood samples, we have developed a generic microfluidic platform technology which combines sample preparation with impedance cytometry in a single, hybrid cartridge. Electronics for drive signals, 65
impedance measurements and software for data analysis is off-cartridge. A schematic diagram of the system architecture is shown in Fig. 2a. The cell analysis system consists of a microfluidic block that performs sample (whole blood) loading, pre-treatment and dilution in two separate channels 70
together with two separate impedance based cell counting/analysis chips that are bonded to the block. The system takes a small blood sample and performs analysis of WBC differential and Hb concentration in the bottom arm of Fig. 2a. RBC count and platelet count is performed in the top 75
arm. The microfluidic system was designed under the assumption of low Reynolds numbers which simplifies the design and allows the microfluidic system to be modelled as a resistive network with the flow rate equivalent to current and pressure equivalent to potential. The simulation was 80
performed using a Pspice-based simulator. Fig. 2b shows a CAD layout of the final microfluidic circuit that is used to process the blood, with separate WBC and RBC/platelet analysis areas. The microfluidic channels are approximately 300 µm × 300 µm and the flows are controlled by varying the 85
length (resistance) of the different sections. The two optical windows are used for Hb measurement, which is determined using absorbance. The various inputs are connected to syringe pumps of different volume driven by a common mechanism. A photograph of the final device is shown in Fig. 2c. 90
2.1 WBC Channel

4 | Journal Name, [year], [vol], 00–00 This journal is © The Royal Society of Chemistry [year]
Fig. 3 Simulations of flow profiles in microfluidic junction of different designs at Re = 2.2. (a) Single T junction. (b) Separated double junction. (c) Optimally spaced double junction. (d) Siphon ratio as function of Reynolds number for the different designs. 5
For WBC analysis, the erythrocytes are first lysed using a mixture of detergent and formic acid.44,48 The lysis reagent is delivered by a syringe pump to port 1 where it mixes with the blood sample in a continuous flow. The initial width of the blood stream (in the 300 µm wide channel) is 30 µm and 10
diffusion of the lysis reagent into the blood stream happens quickly (<1 s). The distance between port 1 and 2 in Fig. 2a provides 6 seconds exposure of sample to lysis reagent. The lysis chemistry is quenched using a second reagent delivered to port 2. The second longer channel (following port 2) mixes 15
the quench solution with the lysate, neutralising and stabilising the chemistry. This produces a clean debris-free sample, containing leukocytes, which are subsequently analysed by impedance (WBC chip). A third channel prior to the impedance chip balances the resistance to waste between 20
the WBC and RBC parts of the cartridge.
2.2 RBC/Platelet (PLT) channel
For RBC and PLT analysis, a small amount of the same blood sample is pumped through the top arm of the device (Fig. 2a), where it is mixed with a diluent that is pumped into port 3 at 25
three separate locations, giving a 10,000-fold dilution of the sample. At each stage, the blood and diluent passes through a long mixing channel before being separated into two; the largest volume is sent to waste, the smaller to the next dilution stage. The channel lengths are designed to allow sufficient 30
mixing time, to balance the flow rates of the different fluids and to match the impedance of the RBC line to that of the WBC line.
2.3 Junction design
For the successful design and stable operation of the 35
microfluidic sample preparation it is important that the
behaviour of the system is linear over the flow rates of interest. The Reynolds number (Re) is the ratio of the size of the inertial force to the viscous forces on a fluid element:
�� � �� ��� �
�� � (1) 40
where ρ fluid density, u the average velocity of the fluid, η is the viscosity of the fluid and Dh the hydraulic diameter of the channel, which for a square channel is its width d. Recasting this in terms of flow rate Q = ud2 gives
�� � ����� � �
� � (2) 45
This equation shows that for a required flow rate, a smaller channel (d) requires a larger pressure but leads to an increase in the Reynolds number. Typical values for our system are Q = 40 µl/min, ρ = 103, η = 10-3 and d = 300 µm, giving Re = 2.22. 50
This moderate Reynolds number indicates that the inertial forces are strong and care needs to be taken in the design of the microfluidic sample preparation to ensure linear and stable operation. In particular the behaviour of the microfluidic junctions should be independent of flow rate up to moderate 55
Reynolds number. To validate this, the behaviour of the junctions was modelled for different Reynolds number. Device operation requires sequential dilution of the sample, typically performed as in this case by using the T-shaped junction shown in Fig. 3a. The sample is first divided, and 60
most of the material goes to waste, and a fraction (in the case of these simulations and one junction in the device, a fraction of 0.1) passes to the second junction where it is mixed with the diluent. The behaviour of this junction was simulated for a wide range of Reynolds number and the siphon ratio, defined 65
as the fraction of the sample passing the first junction to be diluted, was calculated and is shown in Fig. 3d. The flow was simulated using FlexPDE (TM, PDE Solutions, US) for the channel sizes used in the physical device: 300 µm for the sample channel and 200 µm for the waste and diluent 70
channels. The junctions were located in a long simulation domain with straight channels and the flow rates were modified by controlling pressure over a wide range applied to inputs and outputs. As can be seen from the figure, the siphon ratio depends 75
strongly on flow rate (Reynolds number) with linear flow and fixed ratio up to a Reynolds number of approximately 0.2 and an increasing ratio for higher flow rates. This simple design causes large errors in dilution at the minimum flow rates required by our application as indicated by the vertical grey 80
line in Fig. 3d. Incorporation of the second dilution junction stabilises the flow to an extent, with Figs. 3b and 3c showing the flow profile at high flow rates for a large junction separation and short separation distances respectively. The dilution component is linear up to higher flow rates and 85
decreasing the separation distance improves the potential range of operation. The behaviour is dependent on the balance of mass flows, i.e. that the waste flow rate and the diluent flow rate are the same. If these are different, then the range of linear behaviour decreases. This implies that when the 90
Reynolds number is high, the inertial effects can be mitigated

This journal is © The Royal Society of Chemistry [year] Journal Name, [year], [vol], 00–00 | 5
Fig. 4 (a) Time trace of the unprocessed data captured by the impedance system. The voltage signal is the magnitude of the impedance measured at a single frequency. (b) Voltage from a single red blood cell (RBC) (~70 µm3) event. The raw data and fitted data are shown. (c) Similar signal for 5
a small (~1 µm3) platelet, with the raw data and fitted model.
by designing the junctions in such a way that the inertias of the different flows balance each other, demonstrated by the improved operation when the two junctions are brought together. This junction design (or similar) guarantees that the 10
simulation of the entire microfluidic is linear and can be modelled using equivalent circuit analysis.
2.4 Signal Analysis and Processing
The largest cells in whole blood are monocytes, with typical diameters in the region of 20 µm (~4,000 fL). Because it is 15
important to avoid clogging in the device, the channel width and height in the impedance analysis chips was set to 40 µm (see Fig. 1). This implies a sensing volume of 64,000 fL.
Although this is 3 to 5 times less than the sensing volume of a comparable Coulter aperture, the measurement of small 20
objects like platelets remains challenging. Mean platelet volumes are typically 6 fL and a reliable count requires a detection limit of 1 fL, i.e. a measurement of approximately 0.002% volume fraction. Fast diagnosis requires fast sample processing and analysis; 25
a 2 µL blood sample should be measured in 1 minute. Therefore, the velocity of the fastest cells (midstream in the flow) is ~1 m/s implying a minimum event of ~0.1 ms (for the electrode gap used in these devices). The bandwidth of the detection electronics must be sufficiently wide to detect these 30
fast moving events without distortion. The overall noise level in the electronics is determined by the thermal noise in the channel impedance and the current-to-voltage converter feedback resistors, which sets a fundamental limit. Thermal noise increases as the square root of the system bandwidth, 35
therefore the noise level increases by a factor of 2 when the cell speed is increased by a factor of 4. The signal level remains constant so the signal-to-noise ratio deteriorates by a factor of 2. In order to run at such high speeds, custom lock-in amplifiers were designed with optimised 5-pole band pass 40
Bessel filters. The Bessel characteristic preserves the pulse shape without undue distortion, and the band pass was chosen to allow up to the 5th harmonic component of the fastest events to pass. With a maximum cell speed of ~1 m/s, and with the 70 µm centre-to-centre distance of the electrodes, this 45
gives a maximum fundamental frequency of the cell events in the region of 7 kHz, and a 5th harmonic of 35 kHz. Fig. 4 shows typical data captured by the system. Fig. 4a illustrates a 20 ms time frame for a sample of diluted whole blood. The trace shows a small particle followed by 5 larger 50
particles. Note that dilution of the sample ensures that most particles arrive separately at random intervals, and overlapping events are relatively rare (<5%). Individual events are recovered from the data by matching it against a model function49 of a pair of anti-symmetric Gaussian peaks. 55
This is illustrated in Fig. 4b, which provides a close up of a red blood cell (RBC) (~70 fL) event and the model function. In this the correlation coefficient between the data and model function is > 98%. Fig. 4c shows the data and fit for a small (~1 fL) platelet event. This illustrates that the use of a model 60
function can reliably extract events even when they are comparable to the thermal noise level.49 The experimental relationship between impedance measurements and cell volume was made through reference experiments with beads.44 For particles which are small (<500 fL) compared to 65
the measurement volume (64,000 fL), the volume scale is approximately linear, while for larger particles it is sub-linear.43,47 For this particular system, the signal is ~7 mV/fL for particles the size of red blood cells or smaller.
3 Experimental 70
The impedance chips were fabricated from pairs of glass substrates bonded using adhesive bonding methods. The channel walls are fabricated from SU-8 and the Pt electrodes manufactured using conventional evaporation and photolithography techniques. The microfluidic cartridges are 75
6 | Journal Name, [year], [vol], 00–00 This journal is © The Royal Society of Chemistry [year]
micro-milled in PMMA (Carvill UK). Whole venous blood was collected into EDTA coated vacutainers from donors participating in the Philips Research UK donation programme. Lysis solution was 0.12% v/v formic acid, 0.05% w/v saponin; quench solution was 0.6% w/v sodium carbonate, 3% w/v 5
sodium chloride. The RBC diluent was pocH-pack D diluent (Sysmex, Japan). Blood reference data was obtained for each sample from Addenbrookes Hospital pathology laboratory using a Sysmex haematology analyser. Further experimental details can be found elsewhere.44 10
4 Results
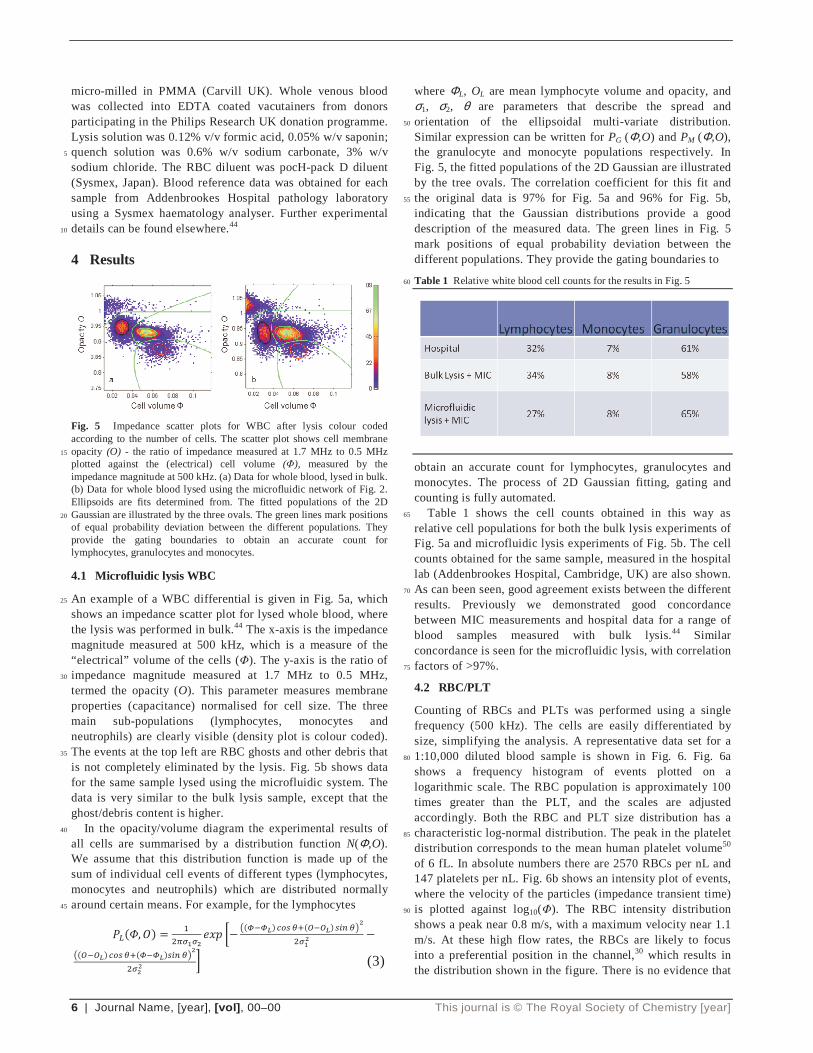
Fig. 5 Impedance scatter plots for WBC after lysis colour coded according to the number of cells. The scatter plot shows cell membrane opacity (O) - the ratio of impedance measured at 1.7 MHz to 0.5 MHz 15
plotted against the (electrical) cell volume (Φ), measured by the impedance magnitude at 500 kHz. (a) Data for whole blood, lysed in bulk. (b) Data for whole blood lysed using the microfluidic network of Fig. 2. Ellipsoids are fits determined from. The fitted populations of the 2D Gaussian are illustrated by the three ovals. The green lines mark positions 20
of equal probability deviation between the different populations. They provide the gating boundaries to obtain an accurate count for lymphocytes, granulocytes and monocytes.
4.1 Microfluidic lysis WBC
An example of a WBC differential is given in Fig. 5a, which 25
shows an impedance scatter plot for lysed whole blood, where the lysis was performed in bulk.44 The x-axis is the impedance magnitude measured at 500 kHz, which is a measure of the “electrical” volume of the cells (Φ). The y-axis is the ratio of impedance magnitude measured at 1.7 MHz to 0.5 MHz, 30
termed the opacity (O). This parameter measures membrane properties (capacitance) normalised for cell size. The three main sub-populations (lymphocytes, monocytes and neutrophils) are clearly visible (density plot is colour coded). The events at the top left are RBC ghosts and other debris that 35
is not completely eliminated by the lysis. Fig. 5b shows data for the same sample lysed using the microfluidic system. The data is very similar to the bulk lysis sample, except that the ghost/debris content is higher. In the opacity/volume diagram the experimental results of 40
all cells are summarised by a distribution function N(Φ,O). We assume that this distribution function is made up of the sum of individual cell events of different types (lymphocytes, monocytes and neutrophils) which are distributed normally around certain means. For example, for the lymphocytes 45
����, �� � ������� ��� ��
��� �!� "#$ %&�' '!� $() %*�����
���' '!� "#$ %&�� �!�$() %*�
����+ (3)
where ΦL, OL are mean lymphocyte volume and opacity, and σ1, σ2, θ are parameters that describe the spread and orientation of the ellipsoidal multi-variate distribution. 50
Similar expression can be written for PG (Φ,O) and PM (Φ,O), the granulocyte and monocyte populations respectively. In Fig. 5, the fitted populations of the 2D Gaussian are illustrated by the tree ovals. The correlation coefficient for this fit and the original data is 97% for Fig. 5a and 96% for Fig. 5b, 55
indicating that the Gaussian distributions provide a good description of the measured data. The green lines in Fig. 5 mark positions of equal probability deviation between the different populations. They provide the gating boundaries to
Table 1 Relative white blood cell counts for the results in Fig. 5 60
obtain an accurate count for lymphocytes, granulocytes and monocytes. The process of 2D Gaussian fitting, gating and counting is fully automated. Table 1 shows the cell counts obtained in this way as 65
relative cell populations for both the bulk lysis experiments of Fig. 5a and microfluidic lysis experiments of Fig. 5b. The cell counts obtained for the same sample, measured in the hospital lab (Addenbrookes Hospital, Cambridge, UK) are also shown. As can been seen, good agreement exists between the different 70
results. Previously we demonstrated good concordance between MIC measurements and hospital data for a range of blood samples measured with bulk lysis.44 Similar concordance is seen for the microfluidic lysis, with correlation factors of >97%. 75
4.2 RBC/PLT
Counting of RBCs and PLTs was performed using a single frequency (500 kHz). The cells are easily differentiated by size, simplifying the analysis. A representative data set for a 1:10,000 diluted blood sample is shown in Fig. 6. Fig. 6a 80
shows a frequency histogram of events plotted on a logarithmic scale. The RBC population is approximately 100 times greater than the PLT, and the scales are adjusted accordingly. Both the RBC and PLT size distribution has a characteristic log-normal distribution. The peak in the platelet 85
distribution corresponds to the mean human platelet volume50 of 6 fL. In absolute numbers there are 2570 RBCs per nL and 147 platelets per nL. Fig. 6b shows an intensity plot of events, where the velocity of the particles (impedance transient time) is plotted against log10(Φ). The RBC intensity distribution 90
shows a peak near 0.8 m/s, with a maximum velocity near 1.1 m/s. At these high flow rates, the RBCs are likely to focus into a preferential position in the channel,30 which results in the distribution shown in the figure. There is no evidence that

This journal is © The Royal Society of Chemistry [year] Journal Name, [year], [vol], 00–00 | 7
the platelet intensity distribution is other than random, indicating that these much smaller particles do not focus (the lift forces are too small). Fig. 6b shows better separation between platelets and RBCs than is evident from Fig. 6a. The aggregate frequency histogram for both platelets and RBCs at 5
different velocities is shown in Fig. 6c. Fig. 6d shows an intensity plot of the correlation coefficient, or goodness of fit, of each event against the model function of anti-symmetric Gaussian peaks.49 The intensity colour scale is the same as in Fig. 6b, and the vast majority of individual events are fitted 10
with a correlation coefficient of better that 98%. The tail with lower correlation coefficients of RBC sized events is due to
Fig. 6 Red blood cell and platelet data. a) Event size histogram for RBC and PLT. There are approximately 100 times fewer platelets events than 15
RBCs and the frequency axis is scaled by ×100. b) Intensity plot of individual events plotted as function of size and velocity. c) Velocity histogram. d) Intensity plot of individual events plotted as function correlation coefficient and size. The limit of detection is indicated by the arrow (left-hand side of figure). 20
cells that have some overlap with other cells in the measurement volume. The roll-off in correlation on the left hand side is signals from very small events that approach the signal noise floor. The vertical arrow in Fig. 6d indicates the limit of detection (LOD) of the current system at 70% 25
correlation coefficient. The LOD is approximately an order of magnitude below the mean platelet volume, giving a value of approximately 0.6 fL or 1 µm diameter. This LOD means that the platelets are sized accurately over the entire distribution. The deviation from the expected log-normal distribution may 30
be due to cellular debris,51 or may indicate that the system can identify other smaller objects such as micro-particles.52
4.3 Platelet Concordance
Concordance between PLT counts, especially for very low platelet numbers is an important challenge for a haematology 35
PoC test. Data for clinical whole blood samples is shown in Fig. 7. Comparison of absolute platelet counts with a standard haematology analyzer revealed excellent linearity with R2 = 99.8%, and an offset of 4 platelets/nL. Blank control runs showed a background count of (2.9 ± 0.3) platelets/nL. The 40
small offset indicates that the diluent was largely free of platelet-sized debris, and that the ability to discriminate platelets from noise is good. However, the fit revealed under-counting of the platelets by 12% relative to the reference
45
Fig. 7 Platelet data from clinically sourced, diluted human whole blood samples, showing excellent linearity between the absolute platelet counts obtained from the impedance cytometry system and the hospital central lab haematology analyzer.
method. A similar undercounting was also observed for the 50
RBCs. The main cause of this systematic error is probably coincident events over the impedance electrodes that cannot be separated. Straightforward stochastic reasoning indicates that this effect accounts for 6-10% undercounting.
5 Conclusions and outlook 55
Identifying and counting the different subpopulations of human blood cells is both clinically useful and technologically challenging. It provides a useful target application for the creation of a generic microfluidic platform technology in a single, hybrid cartidge. The prinicpal demand is to combine 60
sample preparation with impedance cytometery to cover the large dynamic range in cell number, size and morphology. In particular, the ability to count both the relatively abundant, but small platelets at the same time as counting the relatively rare, but large monocytes, is a challenge. The technologies 65
require good control of chemistry, accurate timming and control of flow, and precise control of concentrations, all of which are delivered through a well designed microfluidic sample preparation. The system described in this paper perform cell analysis and enumeration coupled with sample 70
preprocessing and dilution. Using clinical blood, it has demonstrated good concordance with large scale hospital analysers. Beyond PoC blood cell counting, the microfluidic platform technology will be useful in a range of applications in the future, including subtyping of blood cells, counting rare 75
cells, cell assays and other matrices.
8 | Journal Name, [year], [vol], 00–00 This journal is © The Royal Society of Chemistry [year]
Acknowledgements
The authors acknowledge the Technology Strategy Board and EPSRC for funding this work.
References aPhilips Research Laboratories, 101 Cambridge Science Park, Milton 5
Road, Cambridge, CB4 0FY, UK bSchool of Electronics and Computing Science, University of Southampton, Highfield, Southampton, SO17 1BJ, UK. E-mail: [email protected];Fax: +44(0)2380 593029; Tel: +44(0)2380 596775; +44(0)2380 593029; +44(0)2380 593330 10 cDivision of Infection, Inflammation and Repair, School of Medicine, University of Southampton, Southampton, SO16 6YD
1 C. P. Price, BMJ, 2001, 322, 1285-1288. 2 Device Bulletin DB 2010(02) Management and Use of IVD Point
of Care Test Devices, 2010, 15
http://www.mhra.gov.uk/Publications/Safetyguidance/DeviceBulletins/CON071082
3 C. Briggs, D. Guthrie, K. Hyde, I. Mackie, N. Parker, M. Popek, N. Porter and C. Stephens, Brit. J. Haematol., 2008, 142, 904–915.
4 C. Briggs, J. Carter, S.-H. Lee, L. Sandhaus, R. Simon-Lopez and 20
J.-L. Vives Corrons, Int. J. Lab. Hematol., 2008, 30, 105-116. 5 Buttarello and M. Plebani, Am. J. Clin. Pathol., 2008,130, 104-116. 6 International Council for Standardization in Haematology, Clin.
Lab. Haematol., 1994, 16, 157-174. 7 M. Montagnana, M. Caputo, D. Giavarina and G. Lippi, Clin. 25
Chim. Acta, 2009, 402, 7-13. 8 S. Braun, M. Spannagl and H. Völler, Anal. Bioanal. Chem., 2009,
393, 1463-1471. 9 Directive 98/79/EC of the European Parliament and of the Council
of 27 October 1998 on in vitro diagnostic medical devices, 1998, 30
http://ec.europa.eu/consumers/sectors/medical-devices/documents/index_en.htm
10 http://www.cdc.gov/clia 11 B. Weigl, G. Domingo, P. LaBarre and J. Gerlach, Lab Chip, 2008,
8, 1999-2014. 35
12 A. Osei-Bimpong, C Jury, R McLean and S M Lewis, Int. J. Lab. Hematol., 2008, 31, 657-664.
13 J. R. Casey and M. E. Pichichero, Clin. Pediatr., 2009, 48, 291-294.
14 B. A. Ekberg, U. D. Larsen and N. Fogh-Andersen, Point Care, 40
2005, 4, 64-65. 15 L. V. Rao, B. A. Ekberg, D. Connor, F. Jakubiak, G. M. Vallaro
and M. Snyder, Clin. Chim. Acta, 2008, 389, 120-125. 16 http://www.Chempaq.com 17 C. Briggs, S. Kunka, C. Pennaneach, L. Forbes and S. J. Machin, 45
Lab. Hematol., 2003, 9, 225-233. 18 S. Whisler and C. Dahlgren, Lab. Hematol., 2005, 11, 107-117. 19 M. Toner and D. Irimia, Ann. Rev. Biomed. Eng., 2005, 7, 77-103. 20 D. Heikali and D. Di Carlo, JALA, 2010, 319-328. 21 T. Takubo, N. Tsuchiya, K. Miyamura, Y. Sugiyama, I. Tsuda and 50
M. Miyazaki, Point Care, 2007, 6,174-175. 22 C. Kim, K. Lee, J. H. Kim, K. S. Shin, K. Lee, T. S. Kim and J. Y.
Kang, Lab Chip, 2008, 8, 473–479. 23 K.Hattori, S. Sugiura and T. Kanamori, Lab Chip, 2009, 9, 1763-
1772. 55
24 A. E. Kamholz, B. H. Weigl, B. A. Finlayson and P. Yager, Anal. Chem., 1999, 71, 5340-5347.
25 P. Sethu, M. Anahtar, L. L. Moldawer, R. G. Tompkins and M. Toner, Anal Chem, 2004, 76, 6247-6253.
26 A. P. Sudarsan and V. M. Ugaz, Lab Chip, 2006, 6, 74-82. 60
27 P. Sethu, L. L. Moldawer, M. N. Mindrinos, P. O. Scumpia, C. L. Tannahill, J. Wilhelmy, P. A. Efron, B. H. Brownstein, R. G. Tompkins and M. Toner, Anal. Chem., 2006, 78, 5453-5461.
28 L. E. Locascio, Anal. Bioanal. Chem., 2004, 379, 325-327. 29 F. Kouoh, H. Levert, B. Gressier, M. Luyckx, C. Brunet, T. Dine 65
and L. Ballester, Apmis, 2000, 108, 417-421.
30 D. R. Gossett, W. M. Weaver, A. J. Mach, S. C. Hur, H. T. Tse, W. Lee, H. Amini and D. Di Carlo, Anal. Bioanal. Chem., 2010, 397, 3249–3267.
31 A. Kummrow, J. Theisen, M. Frankowski, A. Tuchscheerer, H. 70
Yildirim, K. Brattke, M. Schmidt and J. Neukammera, Lab Chip, 2009, 9, 972-981.
32 N. Watkins, B. M. Venkatesan, M. Toner, W. Rodriguez and R. Bashir, 2009, Lab Chip, 9, 3177-3184.
33 K. R. Foster and H. P. Schwan, Crit. Rev. Biomed. Eng., 1989, 17, 75
25-104. 34 W. H. Coulter, Proc. Natl. Electron Conf., 1956, 12, 1034–1040. 35 L. Spielman and S. L. Gorsen, J. Colloid Interface Sci., 1968, 26,
175–182. 36 M. L. Shuler, R. Aris and H.M. Tsuchiya, Appl. Microbiol., 1972, 80
24, 384–388. 37 R. A. Hoffman and W. B. Brit, J Histochem. Cytochem., 1979, 27,
234-240. 38 R. A. Hoffman, T. S. Johnson and W. B. Britt, Cytometry, 1981, 1,
377–384. 85
39 W. H. Coulter, Means for counting particles suspended in a fluid, (US2656508), 1953.
40 H. E. Ayliffe, A. B. Frazier and R. D. Rabbitt, 1999, IEEE J. Microelectromech. Sys., 8, 50-57.
41 C. K. Fuller, J. Hamilton, H. Ackler, P. Krulevitch, B. Boser, A. 90
Eldredge, F. Becker, J. Yang and P. Gascoyne, Microfabricated Multi-Frequency Particle Impedance Characterization System, in Micro Total Analysis Systems, Enschede, Netherlands, 2000.
42 S. Gawad, L. Schild and P. H. Renaud, Lab Chip, 2001, 1, 76–82. 43 T. Sun and H. Morgan, Microfluid. Nanofluid., 2010, 8, 423–443. 95
44 D. Holmes, D. Pettigrew, C. Reccius, J. D. Gwyer, C. van Berkel, J. Holloway, D. E Davies and H. Morgan, Lab Chip, 2009, 9, 2881-2889.
45 D. Holmes and H. Morgan, Anal. Chem., 2010, 82, 1455–1461. 46 K. C. Cheung, M. Di Berardino, G. Schade-Kampmann, M. 100
Hebeisen, A. Pierzchalski, J. Bocsi, A. Mittag and A. Tarnok, Cytom. Part A, 2010, 77A, 648-666.
47 R. M. Pugo, S. C. Deane, C. Glasse, M. R. Burcher, H. Morgan and C. H. Reccius, Flow speed particle focussing in microfluidic impedance measurements, in Micro Total Analysis Systems, 105
Groningen, Netherlands, 2010. 48 S. L. Ledis, H. R. Crews, T. J. Fischer and T. Sena, Lysing reagent
system for isolation, identification and/or analysis of leukocytes from whole blood samples, (US5155044), 1992.
49 T. Sun, C. van Berkel, N. G. Green and H. Morgan, Microfluid. 110
Nanofluid., 2009, 6, 179–187. 50 J. B. Bain, Blood Cells: A Practical Guide, Blackwells, Oxford,
2006. 51 International Council for Standardization in Haematology, J. Clin.
Pathol., 1982, 35, 1320-1322. 115
52 B. Furie, J. Zwicker, T. LaRocca, C. Kos, B. Bauer, B. C. Furie, Haematol. Rep., 2005, 9, 5-8.