Integrated Dual Disorder Treatment: Co-Occurring · PDF fileEvidence-Based Practice...
62
Integrated Dual Disorder Treatment: Co-Occurring Evidence-Based Practice Implementation, Alteration, and Fidelity Over Time Jennifer Harrison, LMSW, CAADC [email protected] Dissertation Defense
Transcript of Integrated Dual Disorder Treatment: Co-Occurring · PDF fileEvidence-Based Practice...
Integrated Dual Disorder Treatment: Co-Occurring Evidence-Based Practice Implementation, Alteration, and Fidelity Over Time Jennifer Harrison, LMSW, CAADC
Dissertation Defense
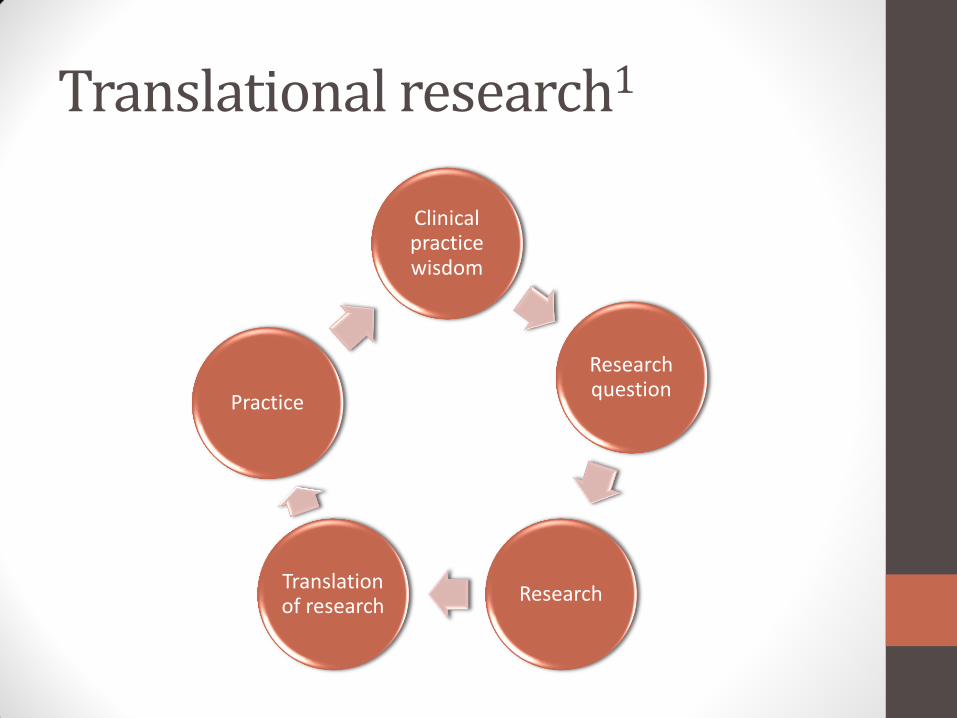
Translational research1
Clinical practice wisdom
Research question
Research Translation of research
Practice

Translational research1
Clinical practice wisdom
Research question
Research Translation of research
Practice: IDDT

Mental illness and substance use disorders2, 3
Mental Illness –
40 million
Substance Use
Disorder – 22 million
Co-Occurring Disorder – 7.8 million
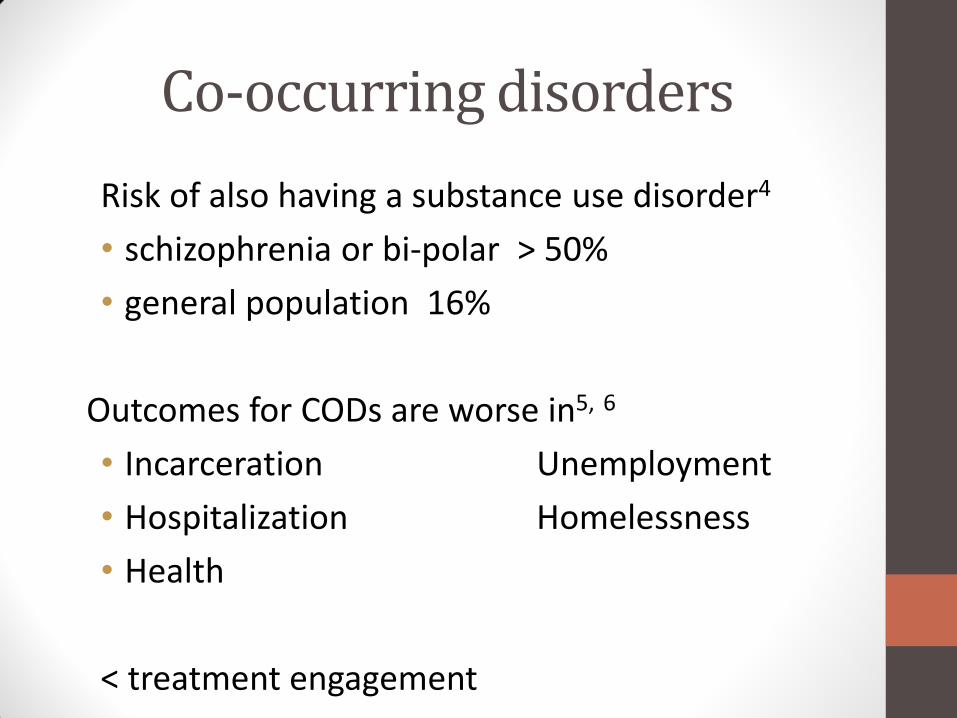
Co-occurring disorders
Risk of also having a substance use disorder4
• schizophrenia or bi-polar > 50%
• general population 16%
Outcomes for CODs are worse in5, 6
• Incarceration Unemployment
• Hospitalization Homelessness
• Health
< treatment engagement

Four quadrant model for co-occurring disorders: Mental illness (MI) and substance use disorder (SUD) 7
• Low MI Low SUD
• High MI Low SUD
• Low MI High SUD
• High MI High SUD
IV III
I II

Four quadrant model for co-occurring disorders 7
• Low MI Low SUD
• High MI Low SUD
• Low MI High SUD
• High MI High SUD
IV III
I II
Integrated Dual Disorder
Treatment
Ambulatory
Care

IDDT…..a complex model for a complex population

IDDT
• ACT + COD = IDDT
• Integrated Dual Disorder Treatment: Evidence-Based Practice for adults with COD8, 9
• Full multi-disciplinary team
• Stage-matched interventions
• Motivational interviewing
• Family education
• Active outreach

IDDT fidelity8, 9, 10
• Fidelity has 26 measures
• 12 organizational items
• 14 treatment items
• High fidelity (> 4.00/5.00) associated with improved outcomes10, 11, 12
• Hospitalization
• Substance use and abstinence
• Treatment engagement
• Studies limited8, 10, 11, 12

What we know…
Need for COD treatment
IDDT works in research settings
How to implement IDDT

What we DON’T know…
How IDDT is implemented
How IDDT is sustained
How IDDT is altered

Dissertation paper topics
Paper 1:
Implementation
Paper 2:
Sustainability
Paper 3:
Alteration

• 2006-2012 • 68 teams • No Wayne
County

Describing IDDT fidelity
Is there variation:
1) Individual item scores
2) Subscale scores
3) Total fidelity
….in a large state-wide sample

Sample
Baseline Review (68)
Second review (40)
Third review (13)
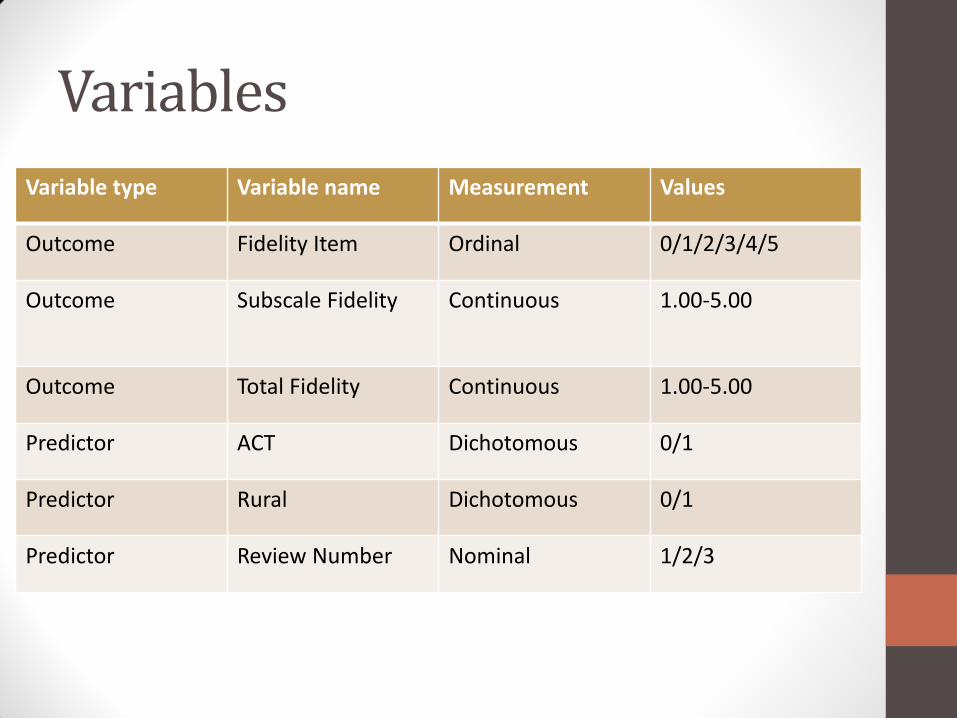
Variables
Variable type Variable name Measurement Values
Outcome Fidelity Item Ordinal 0/1/2/3/4/5
Outcome Subscale Fidelity Continuous 1.00-5.00
Outcome Total Fidelity Continuous 1.00-5.00
Predictor ACT Dichotomous 0/1
Predictor Rural Dichotomous 0/1
Predictor Review Number Nominal 1/2/3

Statistical analysis
• SPSS v. 20 13 • Statistical significance = .05 • Median and interquartile range of
individual fidelity measures, and mean and standard deviation of subscales, and total fidelity by review
• Independent t-test for ACT, rural, and review # and fidelity

IDDT Team Characteristics
0
10
20
30
40
50
60
70
80
90
% rural % ACT
Baseline
Second
Third

Low IDDT fidelity items
1
1.5
2
2.5
3
3.5
4
4.5
5
Penetration Family Services Self-Help
Baseline (68)
Second (40)
Third (13)

High IDDT fidelity items
1
1.5
2
2.5
3
3.5
4
4.5
5
Baseline (68)
Second (40)
Third (13)

High IDDT fidelity items
1
1.5
2
2.5
3
3.5
4
4.5
5
Baseline (68)
Second (40)
Third (13)

IDDT Fidelity Outcomes at Baseline and Subsequent reviews
1
1.5
2
2.5
3
3.5
4
4.5
5
Baseline (68) Second (40) Third (13)
Org. subscale
Tx. subscale
Total fidelity

IDDT Fidelity Outcomes at Baseline and Subsequent reviews
1
1.5
2
2.5
3
3.5
4
4.5
5
Baseline (68) Second (40) Third (13)
Org. subscale
Tx. subscale
Total fidelity
ACT
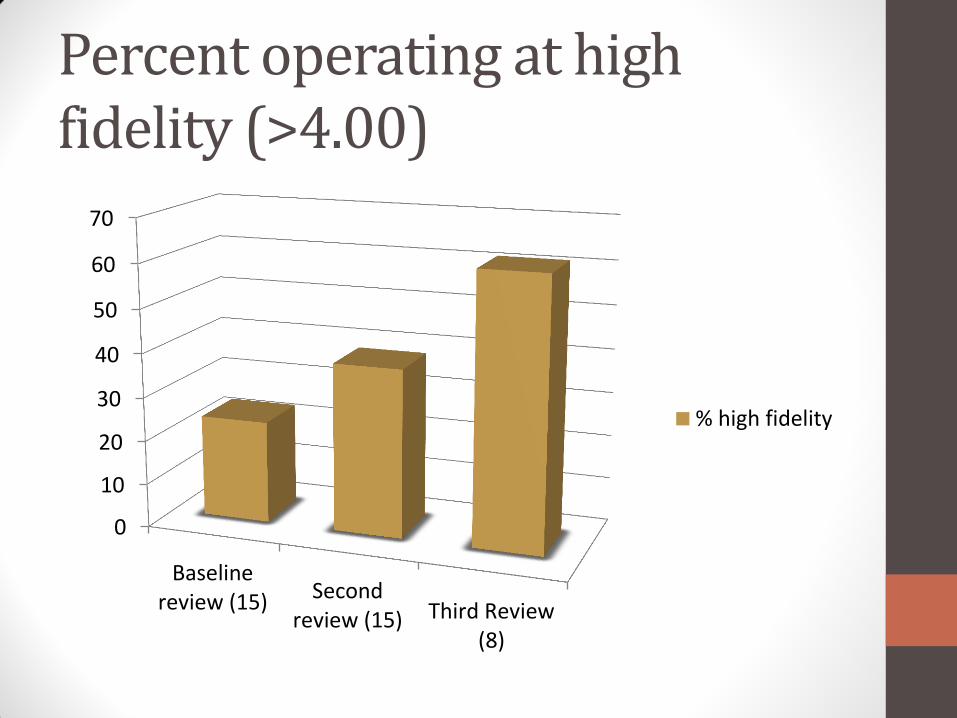
Percent operating at high fidelity (>4.00)
0
10
20
30
40
50
60
70
Baselinereview (15) Second
review (15) Third Review(8)
% high fidelity
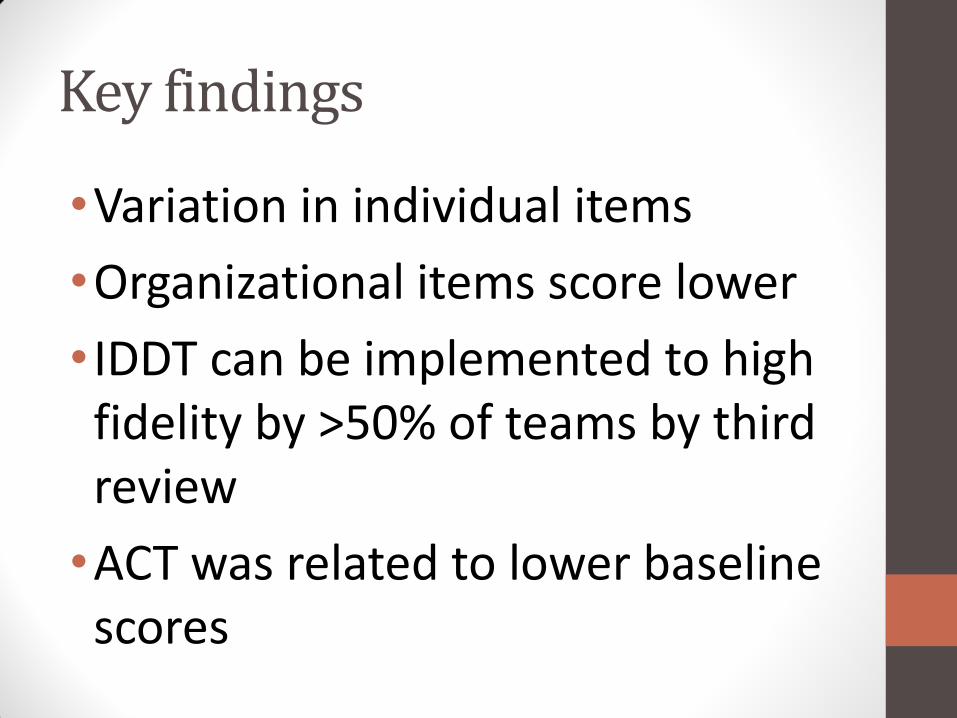
Key findings
•Variation in individual items
•Organizational items score lower
• IDDT can be implemented to high fidelity by >50% of teams by third review
•ACT was related to lower baseline scores

Strengths
•Full state sample of 68 teams and 3 reviews
•Review of items, subscales, and fidelity
•Potential blueprint for state-wide implementation of IDDT

Limitations
•Significant team variables not measured •Missing reviews – 68 original teams, 40 with 2 reviews, 13 third reviews •Time not evaluated •No data from Wayne County in this data set

Research Questions: Is there a change in IDDT fidelity over time of sustained implementation across teams in a full state sample?
Is there variation in individual teams with respect to IDDT fidelity change over time of sustained implementation in a large sample?

Sample – fidelity over time within team
IDDT team #27
FY 2006: 1st review
FY 2012: 2nd review
IDDT team #11
FY 2007: 1st review
FY 2009: 2nd review
FY 2012:
3rd review

Variables
Variable Type Variable Name Measurement Values
Predictor – Level 1 Year of Review Ordinal 2006-2012
Predictor – Level 1 Review Occurrence Ordinal 1/2/3
Predictor – Level 2 Implementation Time
Ordinal Early (1)/Mid (2) /Late (3)
Predictor – Level 2 ACT Dichotomous 0/1
Predictor – Level 2 Rural Dichotomous 0/1
Outcome Total Fidelity Continuous 1.00 – 5.00

Statistical Analysis
• SPSS v. 20 ; alpha value set at .05
• ANOVA for year of review and fidelity, and adopter status and fidelity
• HLM for two level model of growth and team variables 14
• Repeated measures design with fidelity at level 1 (RM) and team at level 2

HLM model
Level-1 Model • Yti = π0i + π1i*(ati) + eti Level-2 Model • π0i = β00 + r0i
π1i = β10 + r1i
where Yti is the mean fidelity for team i at time t, and the range of i goes from 1 to 68 and t from 1 to 3 π0i is the baseline mean fidelity for team i π1i is the linear growth rate for team i ati is the indicator for time eti is the random error at level 1 with variance eti =
β00 is the mean baseline fidelity score across teams r0i is the random error at level two (team level) of baseline fidelity score across teams with variance β10 is the mean growth rate across IDDT teams r1i is the random error at level two (team level) of growth rate across teams with variance
r1i= 11
r0i = 00

IDDT fidelity at baseline, second, and third reviews (N=122)
0
0.5
1
1.5
2
2.5
3
3.5
4
4.5
5
2006 2007 2008 2009 2010 2011 2012
Baseline (68)
Second (40)
Third (13)
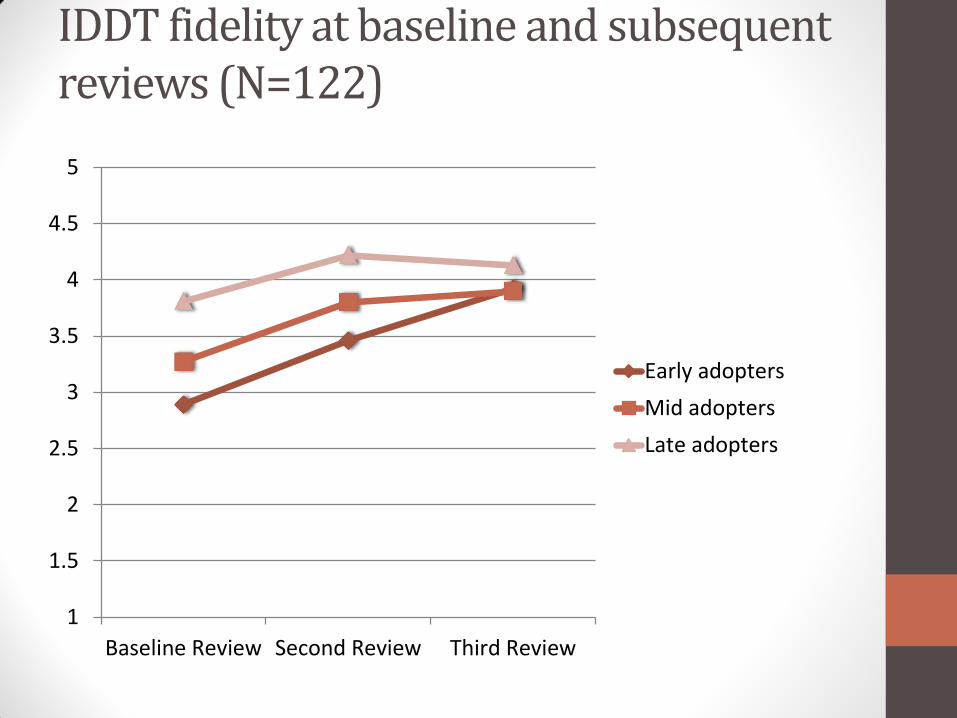
IDDT fidelity at baseline and subsequent reviews (N=122)
1
1.5
2
2.5
3
3.5
4
4.5
5
Baseline Review Second Review Third Review
Early adopters
Mid adopters
Late adopters

IDDT fidelity at baseline and subsequent reviews (N=122)
1
1.5
2
2.5
3
3.5
4
4.5
5
Baseline Review Second Review Third Review
Early adopters
Mid adopters
Late adopters
ACT

One-Way ANOVA of time of adoption and
IDDT total fidelity at baseline
1
1.5
2
2.5
3
3.5
4
4.5
5
2006-07 (13) 2008-09 (28) 2010-12 (23)
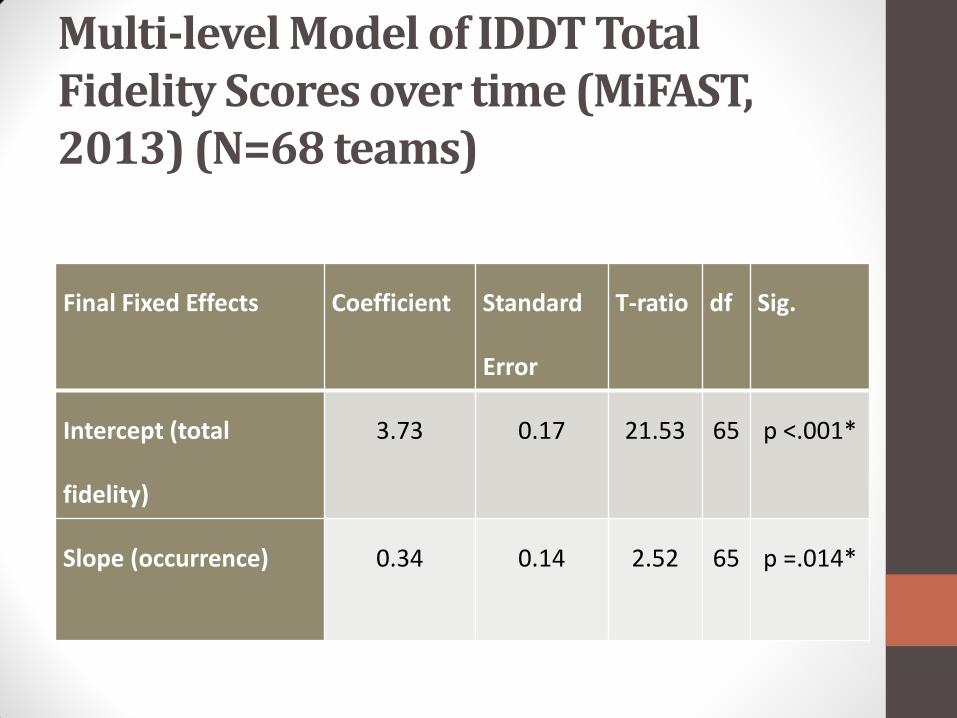
Multi-level Model of IDDT Total Fidelity Scores over time (MiFAST, 2013) (N=68 teams)
Final Fixed Effects Coefficient Standard
Error
T-ratio df Sig.
Intercept (total
fidelity)
3.73 0.17 21.53 65 p <.001*
Slope (occurrence) 0.34 0.14 2.52 65 p =.014*

Key Findings
• IDDT fidelity improved over time
•Late adopters had higher baseline fidelity (state-wide support?)
•Once controlled for year of review, ACT no longer predicted lower baseline scores

Strengths
•Sample size…can employ multi-level approach
•Examine team characteristics and time to see if confound

Limitations
•Number of teams with 3 reviews (growth models)
•Self-selection bias to complete second and third review

Research Question:
How does IDDT fidelity differ when a large scale evidence-based practice alteration, the addition of peers, is added?

IDDT + Peers – EBP Alteration
• Peers = people with lived recovery experience of MI/SUD
• Peers are correlated with decreased hospitalization, improved housing outcomes, and decreased drug-use15, 16
• ACT + peers = lower hospitalization, homelessness, and time to arrest 17, 18
IDDT + peers = 200719, 20, 21
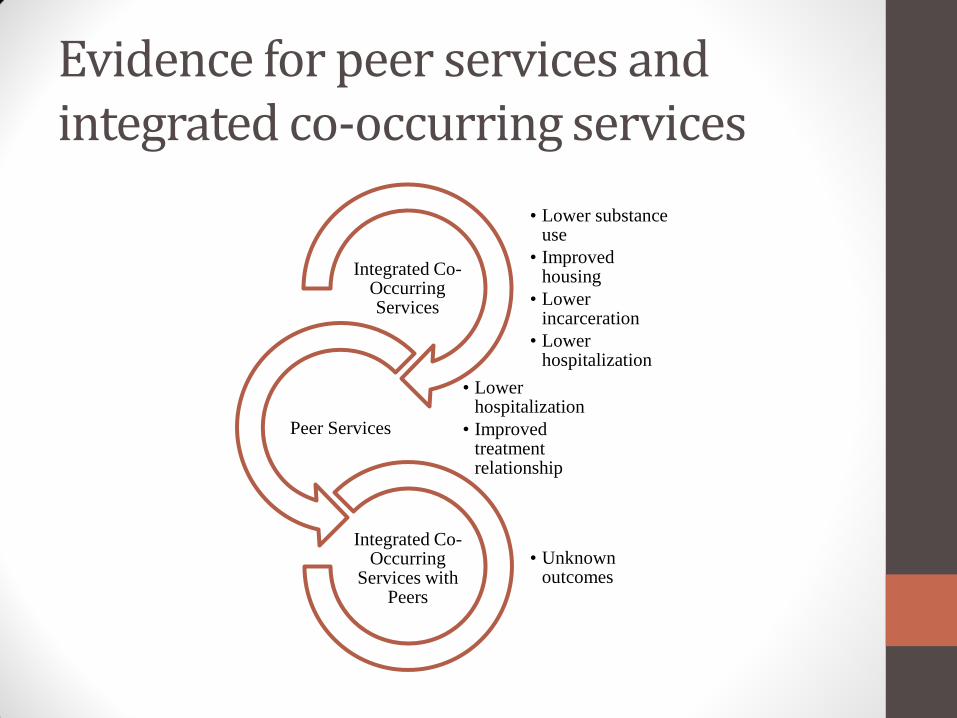
Evidence for peer services and integrated co-occurring services
• Lower substance use
• Improved housing
• Lower incarceration
• Lower hospitalization
Integrated Co-Occurring Services
• Lower hospitalization
• Improved treatment relationship
Peer Services
• Unknown outcomes
Integrated Co-Occurring
Services with Peers

Sample
IDDT teams (68)
Reported on peers(20)
Had a peer (17)

Variables
Variable Type Variable Name Measurement Values
Predictor Peer Dichotomous 0/1
Predictor Peer FTE Ordinal 0 = No peer 1 = Part-time peer 2 = Full-time peer
Outcome Total Fidelity Continuous 1.00 – 5.00
Outcome High Fidelity Dichotomous 0/1

Statistical Analysis
• SPSS v. 20 , alpha = .05
•Chi-square and t-tests to compare full population and sample reporting on peers
• T-tests for relationship between peer variables and fidelity
•ANOVA to examine mean fidelity by peer status

IDDT fidelity for baseline review for teams in Michigan (N=68)
All teams (68)
Teams reporting for peers (20)
Teams NOT reporting for peers(48)
Test of difference (Independent t-test or x2 with df and p-value)
% Rural
45.6% 45% 45.8% x2 (1)=.004, p=.95
% also offering ACT
77.9% 90% 72.9% x2 (1)=2.40, p=.12
% Early or Mid-adopters (2006-2010)
66.1% 64.6% 70% x2 (2)=.67, p=.71
Organizational Subscale Fidelity Mean (SD)
3.24 (.85) 3.36 (.74) 3.19 (.89) t (63)=-.71, p=.49
Treatment Subscale Fidelity Mean (SD)
3.52 (.65) 3.58 (.61) 3.49 (.67) t (64)=-.46, p=.65
Total Fidelity Mean (SD) 3.38 (.71) 3.48 (.58) 3.34 (.76) t (62) = -.75, p=.46
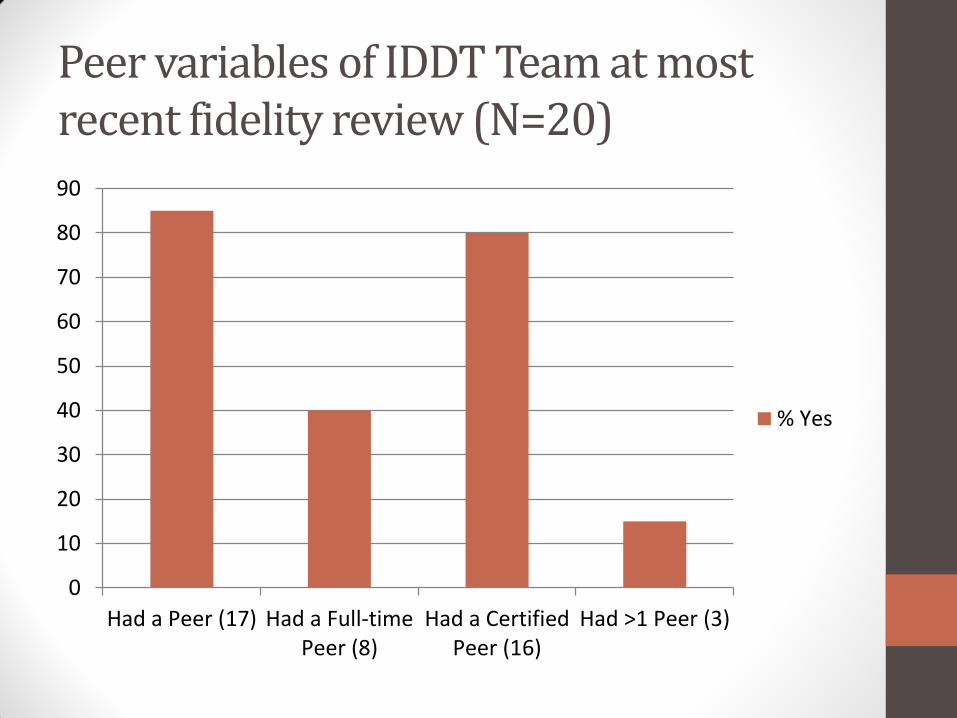
Peer variables of IDDT Team at most recent fidelity review (N=20)
0
10
20
30
40
50
60
70
80
90
Had a Peer (17) Had a Full-timePeer (8)
Had a CertifiedPeer (16)
Had >1 Peer (3)
% Yes

One-Way ANOVA of peer status and IDDT total
fidelity
1
1.5
2
2.5
3
3.5
4
4.5
5
No Peer (3) Part-Time Peer (9) Full-Time Peer (8)

One-Way ANOVA of peer status and IDDT total
fidelity
1
1.5
2
2.5
3
3.5
4
4.5
5
No Peer (3) Part-Time Peer (9) Full-Time Peer (8)

Key Findings
•Peers are associated with improved fidelity
•Dose response relationship between peer FTE and fidelity

Strengths
•First evaluation of peers on IDDT
•Demonstrates that this practice alteration can be achieved
•Aligns with revisions in IDDT toolkit22

Limitations
•Low response rate for peer data
•May have been variation in what different teams considered FT
•Many factors could confound for peer FTE and fidelity

Consolidated findings
Paper 1: Implementation
* Item scores vary
* Organizational items score lower
* Majority of teams at high fidelity
Paper 2:
Sustainability
* IDDT improves over time
* Later adopters have higher fidelity
Paper 3:
Alteration
* Teams with peers have higher fidelity
*Full-time peer teams have higher fidelity

Questions could not answer…
•Why some teams dropped out after baseline, or second review?
•Relationship of team size, team leader, resources, or other factors and fidelity?
•Possible confounders with peers and fidelity?

Translational research
Clinical practice wisdom
Research question
Research Translation of research
Practice

Further research
• IDDT fidelity and clinical outcomes
• IDDT-light for other quadrants of COD
•Qualitative experience of being a peer, working with a peer, being served by a peer

Acknowledgements
• To my dissertation committee members Linwood Cousins, PhD, Jessaca Spybrook, PhD, and Amy Curtis, PhD
• To the WMU Interdisciplinary Health Sciences PhD Program, School of Social Work, and College of Health and Human Services
• To the MiFAST reviewers and IDDT team leaders
• To the peers in Michigan and elsewhere
• To my family, friends, and colleagues

References 1 Fixsen, D.L., Naoom, S.F., Blasé, K.A., Friedman, R.M., & Wallace, F. (2005). Implementation Research: A Synthesis of the Literature. Tampa, FL: University of South Florida, Louis de la Parte Florida Mental Health Institute, The National Implementation Research Network (FMHI Publication #231).
2 Substance Abuse and Mental Health Services Administration, Center for Behavioral Health Statistics and Quality. (2014). The NSDUH Report: Substance Use and Mental Health Estimates from the 2013 National Survey on Drug Use and Health: Overview of Findings. Rockville, MD: Author.
3 Karg, R.S., Bose, J., Batts, K.J., Forman-Hoffman, V.L., Liao, D., Hirsch, E., …Hedden,S.L. (2014). Past Year Mental Disorders among Adults in the United States: Results from the 2008-2012 Mental Health Surveillance Study.
4 Hunt, G.E., Siegfried, N., Morley, K., Sitharthan, T., & Cleary, M. (2013). Psychosocial
interventions for people with both severe mental illness and substance misuse. Cochrane Database of Systematic Reviews, 10, 1-258.
5 Lai, H.M., Sitharthan, T., & Huang, Q.R. (2012). Exploration of the comorbidity of alcohol use disorders and mental health disorders among inpatients presenting to all hospitals in New South Wales, Australia. Substance Abuse, 33(2), 138–45.
6 Drake, R.E., O’Neal, E.L., & Wallach, M.A. (2008). A systematic review of psychosocial research on psychosocial interventions for people with co-occurring mental and substance use disorders. Journal of Substance Abuse Treatment, 34, 123– 138.
7 National Association of State Mental Health Program Directors and National Association of State Alcohol and Drug Abuse Directors. (1998). The new conceptual framework for co-occurring mental health and substance use disorders. Washington, DC: NASMHPD.
8 McHugo, G. J., Drake, R. E., Whitley, R., Bond, G. R., Campbell, K., Rapp, C. A., & Finnerty, M. T. (2007). Fidelity outcomes in the national implementing evidence-based practices project. Psychiatric Services, 58(10), 1279-1284.
9 Substance Abuse and Mental Health Services Administration (2010). Integrated treatment for co-occurring disorders evidence-based practice (EBT) kit. Rockville, MD: Author.
10 Chandler, D. W. (2009). Implementation of integrated dual Disorders treatment in eight California programs. America Journal of Psychiatric Rehabilitation, 12, 330-351.

References 11 Chandler, D. W. (2011). Fidelity and outcomes in six integrated dual disorders treatment programs. Community Mental Health Journal, 47(1), 82-89.
12 Brunette, M. F., Asher, D., Whitley, R., Lutz, W. J., Wieder, B. L., Jones, A. M., & McHugo, G. J. (2008). Implementation of integrated dual disorders treatment: A qualitative analysis of facilitators and barriers. Psychiatric Services, 59(9), 989-995.
13 IBM Corporation. (2011). IBM SPSS Statistics for Windows, Version 20.0. Armonk, NY: Author.
14 Raudenbush, S. W., & Bryk, A. S. (2002). Hierarchical linear models : Applications and data analysis methods (2nd ed.). Thousand Oaks, CA: Sage Publications.
15 Sledge, W. H., Lawless, M., Sells, D., Wieland, M., O'Connell, M. J., & Davidson, L. (2011). Effectiveness of peer support in reducing readmissions of persons with multiple psychiatric hospitalizations. Psychiatric Services, 62(5), 541-544.
16 Min, S. Y., Whitecraft, J., Rothbard, A. B., & Salzer, M. S. (2007). Peer support for persons with co-occurring disorders and community tenure: A survival analysis. Psychiatric Rehabilitation, 30(3), 207-213.
17 van Vugt, M.D., Kroon, H., Delespaul, P., & Mulder, C.L. (2012). Consumer-providers in Assertive Community Treatment programs: Associations With client outcomes. Psychiatric Services, 6, 477-481.
18 Clarke, G. N., Herinckx, H. A., Kinney, R. F., Paulson, R. I., Cutler, D. L., Lewis, K., & Oxman, E. (2000). Psychiatric hospitalizations, arrests, emergency room visits and homelessness of clients with serious and persistent mental illness: Findings from a randomized trial of two ACT programs vs. usual care. Mental Health Services Research, 2(3), 155-164.
19 Michigan Department of Community Health. (2007a). Michigan department of community health (MDCH) recovery policy and the role of peer support specialists. Lansing, MI: Author.
20 Michigan Department of Community Health (2007b). Medical services administration bulletin MSA 07-52. Lansing, MI: Author.
21 Michigan Department of Community Health. (2010). Michigan PIHP/CMHSP provider qualifications per Medicaid services & HCPCS/CPT codes. Lansing MI: Author.
22 Substance Abuse and Mental Health Services Administration, Center for Behavioral Health Statistics and Quality. (2015). Integrated Treatment for Co-Occurring Disorders KIT updated draft. Rockville, MD: Author.