INSTITUTIONS AND MARKETS IN THE PHILIPPINES · PDF fileINSTITUTIONS AND MARKETS IN THE...
33
1 INSTITUTIONS AND MARKETS IN THE PHILIPPINES – EVIDENCE FROM GLOBAL INDICATORS Lino Briguglio and Carmen Saliba University of Malta ABSTRACT The objective of this paper is to assess the administrative, economic and social institutions in the Philippines. For this purpose, the paper utilises seven indicators relating to administrative, economic and social governance to assess the scores and the rankings assigned to the Philippines and compares them to scores and rankings pertaining to (i) other ASEAN member countries and (ii) other countries globally. The indices utilised in the study are also tested for correlation, using a one-to-one comparison, to (a) GDP per capita (b) economic growth and (c) macroeconomic stability, so as to assess how these macroeconomic aggregates relate to the scores of the indices. The results indicate that the Philippines registered relatively low scores with regard to its institutional set-ups when compared to other countries in the region and globally. JEL: Classification: O43 - Institutions and Growth; D02 - Institutions: Design, Formation, and Operations N2 - Financial Markets and Institutions CONTENTS 1. INTRODUCTION........................................................................................................... 3 2. LITERATURE ON INSTITUTIONS AND MARKETS ............................................ 3 2.1 Institutions and Economic Growth.......................................................................... 3 2.2 Institutions and Competitiveness ............................................................................. 4 2.3 Institutions and Corruption ..................................................................................... 4 2.4 Institutions and Social Cohesion .............................................................................. 5 2.5 Market Efficiency, Institutions and Growth........................................................... 5 3. GLOBAL INDICATORS AND THE PHILIPPINES’ SCORES ............................... 5 3.1 The Worldwide Governance Indicators (WGI) ..................................................... 5 3.1.1 The WGI: Regional Comparisons................................................................. 6 3.1.2 The WGI: Global Comparisons .................................................................... 7 3.1.3 The WGI: Correlation with other economic variables ................................. 7 3.2 The Rule of Law Index ............................................................................................. 9 3.2.1 The RLI: Regional Comparisons .................................................................. 9 3.2.2 The RLI: Global Comparisons ................................................................... 10 3.2.3 The RLI: Correlation with economic changes in the region ...................... 10 3.3 The Corruption Perception Index ......................................................................... 11 3.3.1 The CPI: Regional Comparisons ................................................................ 11 3.3.2 CPI: Global Comparisons .......................................................................... 12
-
Upload
nguyenkhanh -
Category
Documents
-
view
222 -
download
1
Transcript of INSTITUTIONS AND MARKETS IN THE PHILIPPINES · PDF fileINSTITUTIONS AND MARKETS IN THE...

1
INSTITUTIONS AND MARKETS IN THE PHILIPPINES –
EVIDENCE FROM GLOBAL INDICATORS
Lino Briguglio and Carmen Saliba
University of Malta
ABSTRACT
The objective of this paper is to assess the administrative, economic and social institutions in
the Philippines. For this purpose, the paper utilises seven indicators relating to administrative,
economic and social governance to assess the scores and the rankings assigned to the
Philippines and compares them to scores and rankings pertaining to (i) other ASEAN
member countries and (ii) other countries globally. The indices utilised in the study are also
tested for correlation, using a one-to-one comparison, to (a) GDP per capita (b) economic
growth and (c) macroeconomic stability, so as to assess how these macroeconomic
aggregates relate to the scores of the indices. The results indicate that the Philippines
registered relatively low scores with regard to its institutional set-ups when compared to other
countries in the region and globally.
JEL: Classification: O43 - Institutions and Growth; D02 - Institutions: Design, Formation, and
Operations N2 - Financial Markets and Institutions
CONTENTS
1. INTRODUCTION........................................................................................................... 3
2. LITERATURE ON INSTITUTIONS AND MARKETS ............................................ 3
2.1 Institutions and Economic Growth .......................................................................... 3
2.2 Institutions and Competitiveness ............................................................................. 4
2.3 Institutions and Corruption ..................................................................................... 4
2.4 Institutions and Social Cohesion .............................................................................. 5
2.5 Market Efficiency, Institutions and Growth........................................................... 5
3. GLOBAL INDICATORS AND THE PHILIPPINES’ SCORES ............................... 5
3.1 The Worldwide Governance Indicators (WGI) ..................................................... 5
3.1.1 The WGI: Regional Comparisons................................................................. 6
3.1.2 The WGI: Global Comparisons .................................................................... 7
3.1.3 The WGI: Correlation with other economic variables ................................. 7
3.2 The Rule of Law Index ............................................................................................. 9
3.2.1 The RLI: Regional Comparisons .................................................................. 9
3.2.2 The RLI: Global Comparisons ................................................................... 10
3.2.3 The RLI: Correlation with economic changes in the region ...................... 10
3.3 The Corruption Perception Index ......................................................................... 11
3.3.1 The CPI: Regional Comparisons ................................................................ 11
3.3.2 CPI: Global Comparisons .......................................................................... 12

2
3.3.3 The CPI: Correlation with economic changes in the region ...................... 12
3.4 The Economic Freedom of the World Index ........................................................ 13
3.4.1 The EWFI: Regional Comparisons............................................................. 13
3.4.2 The EWFI: Global Comparisons ................................................................ 14
3.4.3 The EFWI: Correlation with economic changes in the region ................... 14
3.5 The Global Competitiveness Index ........................................................................ 14
3.5.1 The GCI: Regional Comparisons ............................................................... 15
3.5.2 The GCI: Global Comparisons................................................................... 16
3.5.3 The GCI: Correlation with economic aggregates ...................................... 17
3.6 The Doing Business Index....................................................................................... 18
3.6.1 The DBI: Regional Comparisons ............................................................... 19
3.6.2 The DBI: Global Comparisons ................................................................... 19
3.6.3 The DBI: Correlation with economic aggregates ...................................... 20
3.7 The Human Development Index ............................................................................ 20
3.7.1 The HDI: Regional Comparisons ............................................................... 21
3.7.2 The HDI: Global Comparisons .................................................................. 21
3.7.3 The HDI: Correlation with economic aggregates ...................................... 21
4. MAIN IMPLICATIONS OF THE FINDINGS .......................................................... 22
4.1.1 Institutions and Markets in the Philippines ................................................ 22
4.1.2 Institutions, market efficiency and Growth................................................. 22
4.1.3 Institutions, market efficiency and GDP per capita. .................................. 23
4.1.4 Institutions, market efficiency and macroeconomic stability ..................... 23
4.1.5 Institutions, market efficiency and corruption ............................................ 24
5. CONCLUSION ............................................................................................................. 24
REFERENCES ....................................................................................................................... 24
APPENDIX 1: DEFINITIONS OF THE COMPONENTS OF THE 7 INDICES ........... 27
APPENDIX 2: THE SCORES OF THE PHILIPPINES SINCE 2005 ............................. 32
3
INSTITUTIONS AND MARKETS IN THE PHILIPPINES –
EVIDENCE FROM GLOBAL INDICATORS
Lino Briguglio and Carmen Saliba
University of Malta
1. INTRODUCTION
The objective of this paper is to assess the administrative, economic and social institutions in
the Philippines. For this purpose, the paper utilises seven indicators to assess the scores and
the rankings assigned to the Philippines and compares them to (i) scores in other ASEAN
member countries and (ii) scores in other countries globally. The indices utilised in the study
are the following:
1. Worldwide Governance Indicators,
2. Rule of Law Index
3. Corruption Perception Index and
4. Economic Freedom of the World Index,
5. Global Competitiveness Indicators,
6. Doing Business Index, and
7. Human Development Index.
The first three indicators (the Worldwide Governance Indicators, the Rule of Law Index, and
the Corruption Perception Index) mostly relate to legal and administrative institutions. The
next three indicators (the Economic Freedom of the World Index, the Global Competitiveness
Indicators and the Doing Business Index) mostly relate to economic governance, and are
therefore associated with economic and business institutions and with the workings of
markets. The seventh indicator (the Human Development Index) mostly relates to social
governance, and is therefore associated with social institutions. It should be stated, however,
that there is some overlap between the first six indicators, with some of them drawing on
similar sources, although they all have a degree of distinctiveness.
The scores of the mentioned indices are also tested for correlation, using a one-to-one
comparison, to (a) GDP per capita (b) economic growth and (c) macroeconomic stability, so
as to assess how these macroeconomic aggregates relate to the scores of the indices.
The paper is organised in five sections. Following this introductory section, a brief literature
review is presented focussing on the connection between institutions and a number of
economic variables. The section that follows will examine each of the seven indicators
mentioned above, focussing on the relative scores of the Philippines within the region and
globally. Section 4 summarises the main tendencies derived from the previous seven sections.
Section 5 concludes the study and proposes a number of implications that emerge from the
analysis.
2. LITERATURE ON INSTITUTIONS AND MARKETS
2.1 Institutions and Economic Growth
Several publications associate institutional capacity with growth and development. (North
1990; Rodrik,1999; Aron, 2000; Commission on Growth and Development, 2008).

4
Institutions form one of the pillars of the Global Competitiveness Index of the World
Economic Forum (2012).
Jutting (2003), in an extensive literature review on the subject, concluded that ―most of the
studies suggest a strong and robust relationship between institutional quality and growth and
development outcomes‖.
A similar conclusion was reached by Rodrik et al. (2002) due to the direct and indirect
effects of institutions on growth and development, with the indirect effects including
increases in investment attractiveness, better policies, better management of conflict and an
increase in the social capital stock of a community – factors which are known to influence
economic growth and development.
The direction of causation of economic growth and institutions are discussed in some studies.
Some authors prefer the theory of growth first and institutions later, (e.g. Glaeser et al., 2004)
while others take the opposite view (e.g. Acemoglu et al.,2005).
2.2 Institutions and Competitiveness
There are several indicators that link institutions with competitiveness‘ - perhaps the most
famous being the WEF‘s Global Competitiveness Indicators (Schwab, 2012). It is argued that
the quality of institutions influences investment decisions and the organization of production
and plays a key role in the ways in which societies distribute the benefits and bear the costs of
development strategies and policies
2.3 Institutions and Corruption
Institutions are formed by legal and administrative arrangements. Sometimes institutions are
associated with excessive bureaucracy and red tape, overregulation, corruption, and lack of
transparency and political patronage.
The relationship between corruption and institutions is considered in de Vaal and Ebben
(2011) who present a model that shows that for corruption to have a positive effect on
growth, institutional quality has to be sufficiently low.
Some studies indicate that corruption is extensive in developing countries (Svensson, 2005).
Corruption may be beneficial to the persons who bribe and those bribed, but it creates various
economic downsides, including additional costs to firms and negative effects on the provision
of goods and services by the government (Olken and Pande, 2011). Corruption also generates
an atmosphere of uncertainty and dishonesty.
There are studies (e.g. Huntington, 1968), that suggest that corruption can be beneficial, when
governments are autocratic and remain in power by hook or by crook. In this case, graft may
provide an opportunity for entrepreneurs to influence the decision-making process and enable
them to generate business and innovative activities). However, as Easterly (2006) argued,
claims that corruption ―greases the wheels‖ of growth simply do not stand up to empirical
scrutiny.
5
2.4 Institutions and Social Cohesion
Institutions may be conducive to enhancing social cohesion in a country, which is necessary
to support the effective functioning of the economic apparatus, without the hindrance of civil
unrest. Social cohesion is also associated with effective social dialogue which, in turn, would
enable collaborative approaches towards the undertaking of corrective measures in the face of
adverse economic shocks (Briguglio et al., 2009). Easterly (2006) argues that good
institutions can unify fractionalized peoples, and defeat the average tendency to divide and
rule. This line of arguments supports the contention in Easterly (2001) that formal institutions
contribute to the ―social glue‖ that tends to be in short supply when there are ethno-linguistic
divisions.
2.5 Market Efficiency, Institutions and Growth
The science of economics views markets and their efficient operation through the price
mechanism as the best way to allocate resources in the economy. If a market adjusts rapidly
to achieve equilibrium following an external shock, the risk of being negatively affected by
such a shock will be lower than if the market remains in disequilibrium. Indeed, with very
slow or non-existent market adjustment, resources will not be efficiently allocated in the
economy, resulting in welfare costs, manifested, for instance, in unemployed resources and
waste or shortages in the goods markets.
It is often contended that when markets can operate it is better to let them operate without
government intervention in order to foster economic growth. Government intervention
however is generally justified in the case of merit goods (such as education, health and
pensions)1 which have relative high positive externalities.
2 However, a functioning market
does not mean absence of institutions or the law of the jungle. As a matter of fact, most
countries, particularly those upholding the benefits of free markets, adopt competition law
and policy, with related competition authorities. It is contended that the recent global
financial turmoil might not have happened if the regulatory institutions appropriately oversaw
the excessive risks in the financial markets of the USA and the UK, among others (Ocampo,
2008).
3. GLOBAL INDICATORS AND THE PHILIPPINES’ SCORES
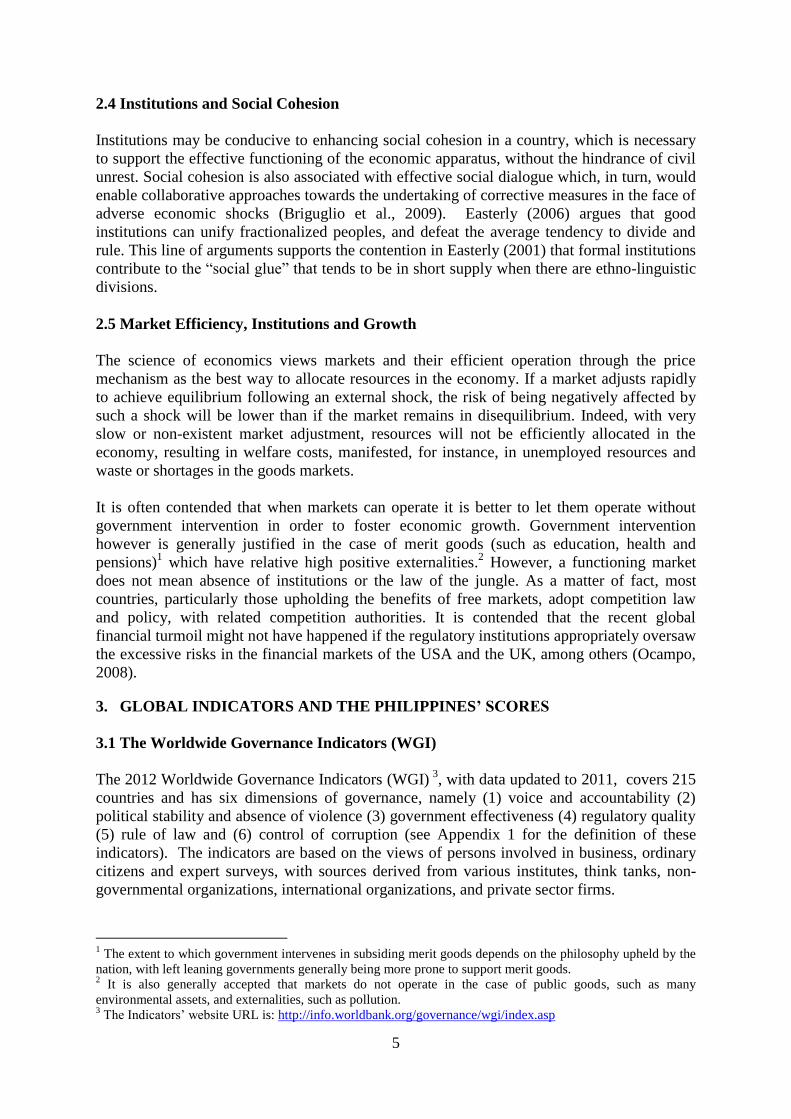
3.1 The Worldwide Governance Indicators (WGI)
The 2012 Worldwide Governance Indicators (WGI) 3
, with data updated to 2011, covers 215
countries and has six dimensions of governance, namely (1) voice and accountability (2)
political stability and absence of violence (3) government effectiveness (4) regulatory quality
(5) rule of law and (6) control of corruption (see Appendix 1 for the definition of these
indicators). The indicators are based on the views of persons involved in business, ordinary
citizens and expert surveys, with sources derived from various institutes, think tanks, non-
governmental organizations, international organizations, and private sector firms.
1 The extent to which government intervenes in subsiding merit goods depends on the philosophy upheld by the
nation, with left leaning governments generally being more prone to support merit goods. 2 It is also generally accepted that markets do not operate in the case of public goods, such as many
environmental assets, and externalities, such as pollution. 3 The Indicators‘ website URL is: http://info.worldbank.org/governance/wgi/index.asp

6
The data is first rescaled using the Min-Max approach4 to render the data comparable across
sources. The resulting estimates of governance are a weighted average of the data from each
source5 with scores assigned a value of approximately -2.5 to 2.5, with higher values
corresponding to better governance. The scores are accompanied by confidence intervals at
the 90% level of significance. A detailed description of the methodology is given in
Kaufmann et al. (2010).
3.1.1 The WGI: Regional Comparisons
It can be seen from Table 1 that there many negative WGI scores assigned to the 10 members
of the ASEAN, indicating that governance is, overall, rather weak in the region. The only two
countries with a predominance of plus values are Singapore and Brunei Darussalam, which
overall are ranked first and second respectively in the region. The worst performer in terms of
governance is Myanmar, where all the scores are negative. Loa PDR, Cambodia and Vietnam
also have predominantly negative scores.
Table 1
The Scores and Rankings of the Philippines compared to other ASEAN Member Countries
in terms of the Worldwide Governance Indicators*
V&A
PS&AV
GE
RQ
RL
CC
AVG
Sco
re
Ra
nk
Sco
re
Ra
nk
Sco
re
Ra
nk
Sco
re
Ra
nk
Sco
re
Ra
nk
Sco
re
Ra
nk
Sco
re
Ra
nk
Brunei D -0.63 6 1.12 2 0.88 3 1.17 2 0.88 2 0.84 2 0.71 2
Cambodia -0.91 7 -0.44 6 -0.75 8 -0.45 7 -1.03 9 -1.10 9 -0.78 8
Indonesia -0.08 2 -0.82 7 -0.24 6 -0.33 6 -0.66 7 -0.66 6 -0.46 5
Lao PDR -1.60 9 0.01 5 -0.91 9 -0.96 9 -0.92 8 -1.06 8 -0.91 9
Malaysia -0.44 4 0.16 4 1 2 0.66 3 0.52 3 0.00 3 0.32 3
Myanmar -1.86 10 -1.16 9 -1.64 10 -2.13 10 -1.42 10 -1.69 10 -1.65 10
Philippines -0.02 1 -1.39 10 0.00 5 -0.27 5 -0.51 6 -0.78 7 -0.49 6
Singapore -0.19 3 1.21 1 2.16 1 1.83 1 1.70 1 2.12 1 1.47 1
Thailand -0.45 5 -1.02 8 0.10 4 0.24 4 -0.24 4 -0.37 4 -0.29 4
Vietnam -1.48 8 0.17 3 -0.28 7 -0.61 8 -0.47 5 -0.59 5 -0.54 7
* Scores range from -2.5 to +2.5, with -2.5 representing the worst possible WGI score and +2.5 the highest possible score.
Key: V&A = voice and accountability; PS&AV = political stability and absence of violence; GE = government
effectiveness; RQ = regulatory quality; RL = rule of law; and CC = control of corruption; AVG = average scores of the six
indices.
The Philippines ranks 6th
overall in the region when all indices are considered together,
however its scores are particularly low in terms of Political Stability & Absence of Violence
and Control of Corruption.
4 This rescaling method is based on the formula (Xi-Xmin)/(Xmax-Xmin) where Xi is an ith observation in an
array of observations of a given variable. Xmin is the observation with the minimum value and Xmax is the
observation with the maximum value in the same array of observations. Thus the observation with the minimum
value will be rescaled to equal zero and the observation with the maximum value will be rescaled to equal 1. All
other observations will have a value between 0 and 1. This method is commonly used in composite indices. Its
main shortcoming is that outliers can give distorted results. 5 The weights reflect the pattern of correlation among data sources. The method adopted by the authors assigns
greater weight to data sources that tend to be more strongly correlated with each other. The authors argue that
while this weighting improves the statistical precision of the aggregate indicators, it typically does not affect
very much the ranking of countries on the aggregate indicators
7
It can be seen also that in terms of Voice and Accountability, all countries in the region were
assigned a negative score. However the least negative of them all was that assigned to the
Philippines. This indicator captures perceptions of the extent to which a country's citizens are
able to participate in selecting their government, as well as freedom of expression, freedom of
association, and a free media. Interestingly even Singapore, which has the highest scores
overall, received a negative score in terms of Voice and Accountability.
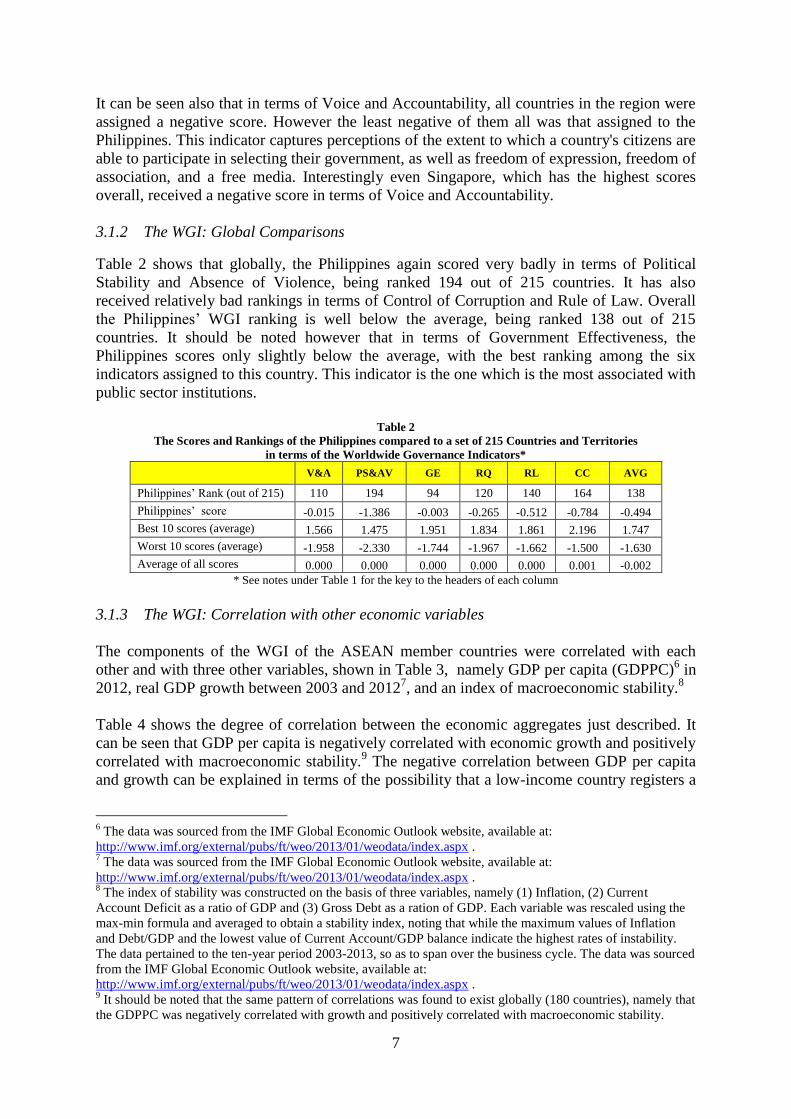
3.1.2 The WGI: Global Comparisons
Table 2 shows that globally, the Philippines again scored very badly in terms of Political
Stability and Absence of Violence, being ranked 194 out of 215 countries. It has also
received relatively bad rankings in terms of Control of Corruption and Rule of Law. Overall
the Philippines‘ WGI ranking is well below the average, being ranked 138 out of 215
countries. It should be noted however that in terms of Government Effectiveness, the
Philippines scores only slightly below the average, with the best ranking among the six
indicators assigned to this country. This indicator is the one which is the most associated with
public sector institutions.
Table 2
The Scores and Rankings of the Philippines compared to a set of 215 Countries and Territories
in terms of the Worldwide Governance Indicators*
V&A PS&AV GE RQ RL CC AVG
Philippines‘ Rank (out of 215) 110 194 94 120 140 164 138
Philippines‘ score -0.015 -1.386 -0.003 -0.265 -0.512 -0.784 -0.494
Best 10 scores (average) 1.566 1.475 1.951 1.834 1.861 2.196 1.747
Worst 10 scores (average) -1.958 -2.330 -1.744 -1.967 -1.662 -1.500 -1.630
Average of all scores 0.000 0.000 0.000 0.000 0.000 0.001 -0.002
* See notes under Table 1 for the key to the headers of each column
3.1.3 The WGI: Correlation with other economic variables
The components of the WGI of the ASEAN member countries were correlated with each
other and with three other variables, shown in Table 3, namely GDP per capita (GDPPC)6 in
2012, real GDP growth between 2003 and 20127, and an index of macroeconomic stability.
8
Table 4 shows the degree of correlation between the economic aggregates just described. It
can be seen that GDP per capita is negatively correlated with economic growth and positively
correlated with macroeconomic stability.9 The negative correlation between GDP per capita
and growth can be explained in terms of the possibility that a low-income country registers a
6 The data was sourced from the IMF Global Economic Outlook website, available at:
http://www.imf.org/external/pubs/ft/weo/2013/01/weodata/index.aspx . 7 The data was sourced from the IMF Global Economic Outlook website, available at:
http://www.imf.org/external/pubs/ft/weo/2013/01/weodata/index.aspx . 8 The index of stability was constructed on the basis of three variables, namely (1) Inflation, (2) Current
Account Deficit as a ratio of GDP and (3) Gross Debt as a ration of GDP. Each variable was rescaled using the
max-min formula and averaged to obtain a stability index, noting that while the maximum values of Inflation
and Debt/GDP and the lowest value of Current Account/GDP balance indicate the highest rates of instability.
The data pertained to the ten-year period 2003-2013, so as to span over the business cycle. The data was sourced
from the IMF Global Economic Outlook website, available at:
http://www.imf.org/external/pubs/ft/weo/2013/01/weodata/index.aspx . 9 It should be noted that the same pattern of correlations was found to exist globally (180 countries), namely that
the GDPPC was negatively correlated with growth and positively correlated with macroeconomic stability.

8
higher growth rate in relative terms than a high-income country, given an equal increment,
and that growth possibilities for low income countries tend to have better possibilities for
growth in view of excess capacity and lower costs. The negative correlation between growth
and stability should not be construed as an indication that macroeconomic stability is not
conducive to growth.10
In fact a regression analysis between economic growth and
macroeconomic stability, keeping GDP per capita constant, carried out by the present author,
produced a positive sign on the stability variable, indicating that if the sample of countries is
segmented into higher-income and lower-income countries, the one-to-one correlation
between growth and stability would be positive.
Table 3
Aggregate Economic Variables in the ASEAN
GDP Per
capita US$
Growth (%)
2003-2012
Stability
2003-2012
Brunei D 38449 1.07 1.000
Cambodia 847 7.95 0.384
Indonesia 3363 5.69 0.369
Lao PDR 1290 7.63 0.111
Malaysia 9626 5.06 0.550
Myanmar 800 9.19 0.000
Philippines 2385 5.17 0.405
Singapore 48620 6.10 0.388
Thailand 5355 4.27 0.473
Vietnam 1358 6.96 0.214
Table 4
Correlation between the Aggregate Economic Variables in the ASEAN
GDP Per
capita
Growth
2003-2012
Stability
2003-2012
GDP Per Capita 1
Growth 2009-12 -0.47 1
Stability 0.57 -0.87 1
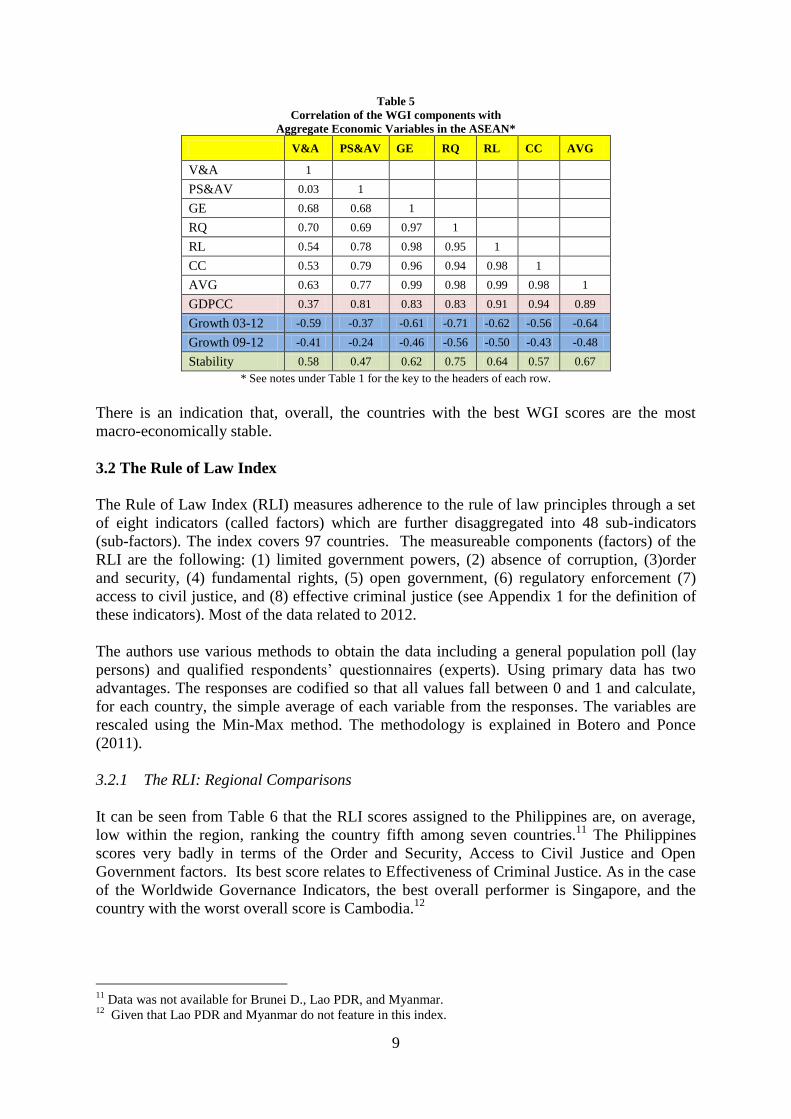
Table 5 correlates the components of the WGI with the economic aggregates shown in Table
3. It emerges that the components of the WGI are generally highly correlated with each other,
with the exception of the relation between Voice & Accountability and Political Stability.
The indices are also generally highly correlated with GDP per capita, indicating that higher-
income countries in general have better governance.
However there is no indication that growth and good governance move in the same direction,
if at all the opposite appears to be the case. In fact, the fastest growing countries in the region
were those with the lowest GDP scores, possibly due to the fact that they started from very
low levels, as explained above.
10
In many studies, macroeconomic stability is thought to support economic growth. On this issue see for
example, Sirimaneetham and Temple (2009).
9
Table 5
Correlation of the WGI components with
Aggregate Economic Variables in the ASEAN*
V&A PS&AV GE RQ RL CC AVG
V&A 1
PS&AV 0.03 1
GE 0.68 0.68 1
RQ 0.70 0.69 0.97 1
RL 0.54 0.78 0.98 0.95 1
CC 0.53 0.79 0.96 0.94 0.98 1
AVG 0.63 0.77 0.99 0.98 0.99 0.98 1
GDPCC 0.37 0.81 0.83 0.83 0.91 0.94 0.89
Growth 03-12 -0.59 -0.37 -0.61 -0.71 -0.62 -0.56 -0.64
Growth 09-12 -0.41 -0.24 -0.46 -0.56 -0.50 -0.43 -0.48
Stability 0.58 0.47 0.62 0.75 0.64 0.57 0.67
* See notes under Table 1 for the key to the headers of each row.
There is an indication that, overall, the countries with the best WGI scores are the most
macro-economically stable.
3.2 The Rule of Law Index
The Rule of Law Index (RLI) measures adherence to the rule of law principles through a set
of eight indicators (called factors) which are further disaggregated into 48 sub-indicators
(sub-factors). The index covers 97 countries. The measureable components (factors) of the
RLI are the following: (1) limited government powers, (2) absence of corruption, (3)order
and security, (4) fundamental rights, (5) open government, (6) regulatory enforcement (7)
access to civil justice, and (8) effective criminal justice (see Appendix 1 for the definition of
these indicators). Most of the data related to 2012.
The authors use various methods to obtain the data including a general population poll (lay
persons) and qualified respondents‘ questionnaires (experts). Using primary data has two
advantages. The responses are codified so that all values fall between 0 and 1 and calculate,
for each country, the simple average of each variable from the responses. The variables are
rescaled using the Min-Max method. The methodology is explained in Botero and Ponce
(2011).
3.2.1 The RLI: Regional Comparisons
It can be seen from Table 6 that the RLI scores assigned to the Philippines are, on average,
low within the region, ranking the country fifth among seven countries.11
The Philippines
scores very badly in terms of the Order and Security, Access to Civil Justice and Open
Government factors. Its best score relates to Effectiveness of Criminal Justice. As in the case
of the Worldwide Governance Indicators, the best overall performer is Singapore, and the
country with the worst overall score is Cambodia.12
11
Data was not available for Brunei D., Lao PDR, and Myanmar. 12
Given that Lao PDR and Myanmar do not feature in this index.

10
Table 6
The Scores and Rankings of the Philippines compared to other ASEAN Member Countries
in terms of the Rule of Law Index*
LGP AC O&S FR OG RE ACJ ECJ AVG
Sco
re
Ra
nk
Sco
re
Ra
nk
Sco
re
Ra
nk
Sco
re
Ra
nk
Sco
re
Ra
nk
Sco
re
Ra
nk
Sco
re
Ra
nk
Sco
re
Ra
nk
Sco
re
Ra
nk
Cambodia 0.34 7 0.31 6 0.70 5 0.43 7 0.37 6 0.33 7 0.37 7 0.40 0.41 7
Indonesia 0.64 2 0.30 7 0.72 4 0.56 4 0.53 2 0.50 5 0.49 3 0.45 7 0.52 4
Malaysia 0.57 3 0.69 2 0.86 2 0.50 5 0.48 4 0.52 2 0.57 2 0.61 5 0.60 2
Philippines 0.56 4 0.41 4 0.60 7 0.57 3 0.46 5 0.51 3 0.43 6 0.42 2 0.49 5
Singapore 0.73 1 0.91 1 0.93 1 0.73 1 0.67 1 0.80 1 0.79 1 0.87 6 0.80 1
Thailand 0.53 5 0.41 5 0.63 6 0.66 2 0.50 3 0.51 4 0.43 5 0.59 1 0.53 3
Vietnam 0.40 6 0.43 3 0.82 3 0.48 6 0.35 7 0.39 6 0.43 4 0.57 3 0.49 6
* Scores range from 0 to 1, with 0 representing the worst Rule of Law score and 1 the best possible score.
Key: LGP = limited government powers; AC = absence of corruption; O&S = order and stability; FR = fundamental rights; OG = open governments; RE = regulatory enforcement; ACJ = Access to civil justice; ECJ = effective criminal justice; AVG = average of all
score.
3.2.2 The RLI: Global Comparisons
Globally, the RLI scores indicate that the Philippines scores badly in terms of Access to Civil
Justice, which is a similar result when only the ASEAN group was considered, as can be seen
from Table 7. Its best rankings are in Limited Government Powers and Regulatory Quality,
but the relative scores are still below the global average.
Table 7
The Scores and Rankings of the Philippines compared to a set of 97 Countries
in terms of the Rule of Law Index*
LGP AC O&S FR OG RE ACJ ECJ AVG
Philippines‘ rank (out of 97) 46 63 77 59 59 52 84 72 64
Philippines‘ score (out of 97) 0.564 0.414 0.603 0.569 0.455 0.509 0.427 0.419 0.495
Best 10 scores (average) 0.869 0.918 0.903 0.871 0.850 0.838 0.784 0.815 0.844
Worst 10 scores (average) 0.305 0.260 0.466 0.377 0.316 0.328 0.373 0.313 0.386
Average of all scores 0.572 0.534 0.713 0.618 0.523 0.542 0.557 0.533 0.574
* For the key to column headings see Table 6
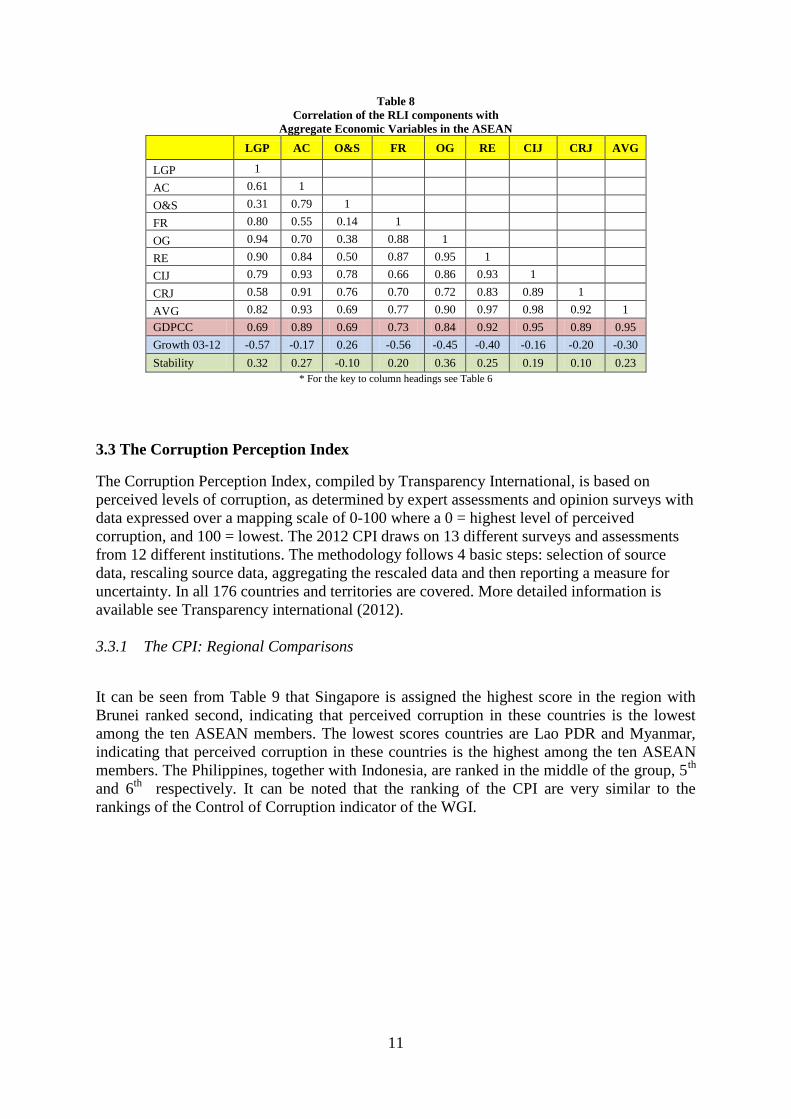
3.2.3 The RLI: Correlation with economic changes in the region
It can be seen from Table 8 that with few exceptions, the components of the RLI are highly
positively correlated with each other. The components are also highly correlated to GDP per
capita, again indicating that the higher income countries in the region are better governed in
terms of rule of law. Again, there is no positive correlation with economic growth, and if at
all the connection seems to be negative, indicating that the fastest growing economies are the
relatively poorer ones.
In the case of the macroeconomic stability, it appears that, in general, the economies with the
best rule of law scores are also the most stable, although the correlation coefficients in this
regard are somewhat low.
11
Table 8
Correlation of the RLI components with
Aggregate Economic Variables in the ASEAN
LGP AC O&S FR OG RE CIJ CRJ AVG
LGP 1
AC 0.61 1
O&S 0.31 0.79 1
FR 0.80 0.55 0.14 1
OG 0.94 0.70 0.38 0.88 1
RE 0.90 0.84 0.50 0.87 0.95 1
CIJ 0.79 0.93 0.78 0.66 0.86 0.93 1
CRJ 0.58 0.91 0.76 0.70 0.72 0.83 0.89 1
AVG 0.82 0.93 0.69 0.77 0.90 0.97 0.98 0.92 1
GDPCC 0.69 0.89 0.69 0.73 0.84 0.92 0.95 0.89 0.95
Growth 03-12 -0.57 -0.17 0.26 -0.56 -0.45 -0.40 -0.16 -0.20 -0.30
Stability 0.32 0.27 -0.10 0.20 0.36 0.25 0.19 0.10 0.23
* For the key to column headings see Table 6
3.3 The Corruption Perception Index
The Corruption Perception Index, compiled by Transparency International, is based on
perceived levels of corruption, as determined by expert assessments and opinion surveys with
data expressed over a mapping scale of 0-100 where a 0 = highest level of perceived
corruption, and 100 = lowest. The 2012 CPI draws on 13 different surveys and assessments
from 12 different institutions. The methodology follows 4 basic steps: selection of source
data, rescaling source data, aggregating the rescaled data and then reporting a measure for
uncertainty. In all 176 countries and territories are covered. More detailed information is
available see Transparency international (2012).
3.3.1 The CPI: Regional Comparisons
It can be seen from Table 9 that Singapore is assigned the highest score in the region with
Brunei ranked second, indicating that perceived corruption in these countries is the lowest
among the ten ASEAN members. The lowest scores countries are Lao PDR and Myanmar,
indicating that perceived corruption in these countries is the highest among the ten ASEAN
members. The Philippines, together with Indonesia, are ranked in the middle of the group, 5th
and 6th
respectively. It can be noted that the ranking of the CPI are very similar to the
rankings of the Control of Corruption indicator of the WGI.

12
Table 9
The Score and Ranking of the Philippines Compared to other ASEAN Member Countries
in terms of the Corruption Perception Index*
Country Score Rank in the
region
Brunei 55 2
Cambodia 22 8
Indonesia 32 6
Laos 21 9
Malaysia 49 3
Myanmar 15 10
Philippines 34 5
Singapore 87 1
Thailand 37 4
Vietnam 31 7
* In case of the rank, the 1 represents the lowest level of perceived corruption in the ASEAN and 8 the highest. In the case of scores, the
lowest possible perceived corruption carries a score of 100 and the highest possible level of perceived corruption carries a score of 0.
3.3.2 CPI: Global Comparisons
Globally, the Philippines are ranked 105th
in the list of 215 economies, within the lower half
of the countries surveyed, although at the upper end of this half, as shown in Table 10. The
score assigned to the Philippines is however rather low at 34, and well under the average
score of 43, meaning that the Philippines are not perceived as the most corrupt globally, but
they can still be labelled as being perceived as highly corrupt.
Table 10
The Score and Ranking of the Philippines compared to a set of 176 Countries and Territories
in terms of the Corruption Perception Index
Country CPI
Philippines‘ rank (out of 176) 105
Philippines‘ score 34
Best 10 scores (average) 87
Worst 10 scores (average) 14
Average score globally 43
3.3.3 The CPI: Correlation with economic changes in the region
As was the case with the GWI and the RLI, the CPI scores are highly positively correlated
with income per capita, and tend to be negatively related to economic growth, as can be seen
from Table 11. The CPI scores would seem to be positively correlated with macroeconomic
stability.
Table 11
Correlation of the CPI components with
Aggregate Economic Variables in the ASEAN
CPI
CPI 1
GDPPC 0.913
Growth 03-12 -0.514
Stability 0.525
13
3.4 The Economic Freedom of the World Index
This Economic Freedom of the World Index (EFWI) has five areas (sub-indices), namely (1)
size of government; (2) legal system & security of property rights; (3) access to sound
money; (4) freedom to trade internationally; and (5) regulation of credit, labour, and business
(see Appendix 1 for the definition of these indicators). The index is based on data sourced
from surveys, expert panels, and generic case studies including sources such as the
International Monetary Fund, World Bank, and World Economic Forum that provide data for
a large number of countries. Data provided directly from a source within a country are rarely
used, and only when the data are unavailable from international sources. Most of the scores
utilise the Min-Max formula to rescale the data (1 to 10). The 2010 index covers 144
countries and territories. The methodology is explained in the Explanatory Notes and Data
Sources Appendix in Gwartney et al. (2012).
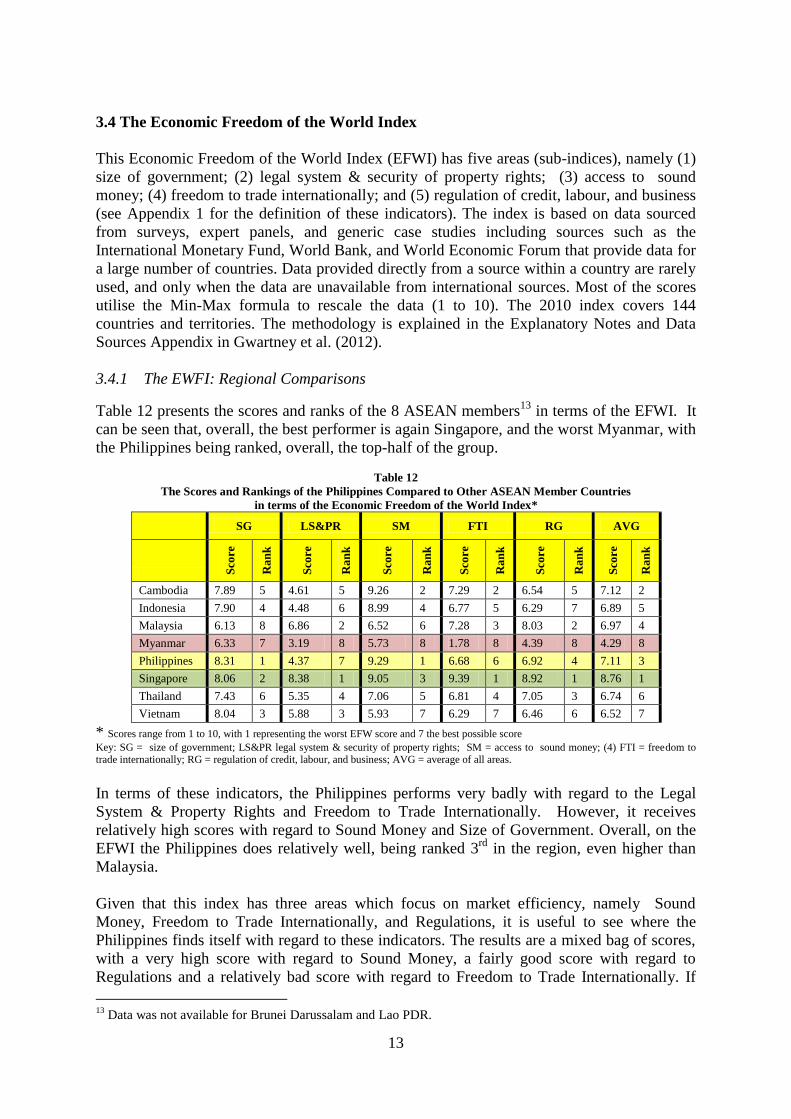
3.4.1 The EWFI: Regional Comparisons
Table 12 presents the scores and ranks of the 8 ASEAN members13
in terms of the EFWI. It
can be seen that, overall, the best performer is again Singapore, and the worst Myanmar, with
the Philippines being ranked, overall, the top-half of the group.
Table 12
The Scores and Rankings of the Philippines Compared to Other ASEAN Member Countries
in terms of the Economic Freedom of the World Index*
SG LS&PR SM FTI RG AVG
Sco
re
Ra
nk
Sco
re
Ra
nk
Sco
re
Ra
nk
Sco
re
Ra
nk
Sco
re
Ra
nk
Sco
re
Ra
nk
Cambodia 7.89 5 4.61 5 9.26 2 7.29 2 6.54 5 7.12 2
Indonesia 7.90 4 4.48 6 8.99 4 6.77 5 6.29 7 6.89 5
Malaysia 6.13 8 6.86 2 6.52 6 7.28 3 8.03 2 6.97 4
Myanmar 6.33 7 3.19 8 5.73 8 1.78 8 4.39 8 4.29 8
Philippines 8.31 1 4.37 7 9.29 1 6.68 6 6.92 4 7.11 3
Singapore 8.06 2 8.38 1 9.05 3 9.39 1 8.92 1 8.76 1
Thailand 7.43 6 5.35 4 7.06 5 6.81 4 7.05 3 6.74 6
Vietnam 8.04 3 5.88 3 5.93 7 6.29 7 6.46 6 6.52 7
* Scores range from 1 to 10, with 1 representing the worst EFW score and 7 the best possible score
Key: SG = size of government; LS&PR legal system & security of property rights; SM = access to sound money; (4) FTI = freedom to trade internationally; RG = regulation of credit, labour, and business; AVG = average of all areas.
In terms of these indicators, the Philippines performs very badly with regard to the Legal
System & Property Rights and Freedom to Trade Internationally. However, it receives
relatively high scores with regard to Sound Money and Size of Government. Overall, on the
EFWI the Philippines does relatively well, being ranked 3rd
in the region, even higher than
Malaysia.
Given that this index has three areas which focus on market efficiency, namely Sound
Money, Freedom to Trade Internationally, and Regulations, it is useful to see where the
Philippines finds itself with regard to these indicators. The results are a mixed bag of scores,
with a very high score with regard to Sound Money, a fairly good score with regard to
Regulations and a relatively bad score with regard to Freedom to Trade Internationally. If
13
Data was not available for Brunei Darussalam and Lao PDR.
14
these indicators are combined, the Philippines would be ranked 4th
among the eight ASEAN
countries in the region, being surpassed by Singapore and Cambodia. Surprisingly, the
second ranked country on this index is Cambodia, which registers relatively high scores with
regard to market efficiency.
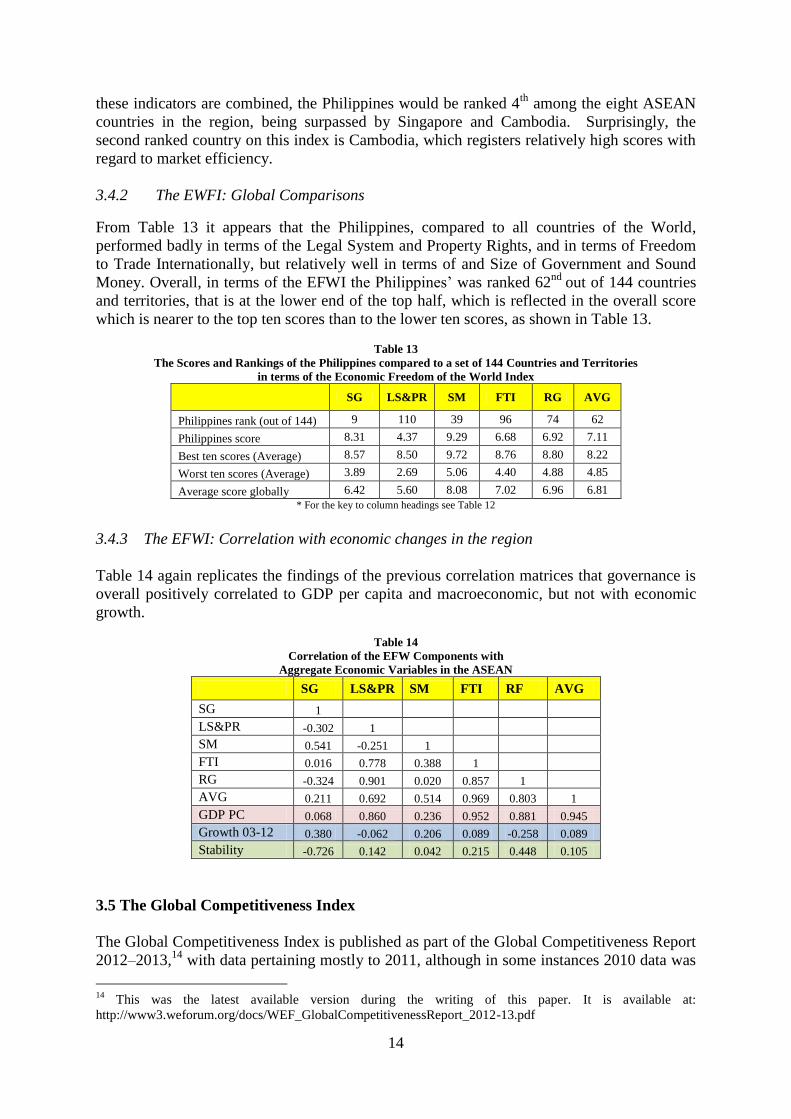
3.4.2 The EWFI: Global Comparisons
From Table 13 it appears that the Philippines, compared to all countries of the World,
performed badly in terms of the Legal System and Property Rights, and in terms of Freedom
to Trade Internationally, but relatively well in terms of and Size of Government and Sound
Money. Overall, in terms of the EFWI the Philippines‘ was ranked 62nd
out of 144 countries
and territories, that is at the lower end of the top half, which is reflected in the overall score
which is nearer to the top ten scores than to the lower ten scores, as shown in Table 13.
Table 13
The Scores and Rankings of the Philippines compared to a set of 144 Countries and Territories
in terms of the Economic Freedom of the World Index
SG LS&PR SM FTI RG AVG
Philippines rank (out of 144) 9 110 39 96 74 62
Philippines score 8.31 4.37 9.29 6.68 6.92 7.11
Best ten scores (Average) 8.57 8.50 9.72 8.76 8.80 8.22
Worst ten scores (Average) 3.89 2.69 5.06 4.40 4.88 4.85
Average score globally 6.42 5.60 8.08 7.02 6.96 6.81
* For the key to column headings see Table 12
3.4.3 The EFWI: Correlation with economic changes in the region
Table 14 again replicates the findings of the previous correlation matrices that governance is
overall positively correlated to GDP per capita and macroeconomic, but not with economic
growth.
Table 14
Correlation of the EFW Components with
Aggregate Economic Variables in the ASEAN
SG LS&PR SM FTI RF AVG
SG 1
LS&PR -0.302 1
SM 0.541 -0.251 1
FTI 0.016 0.778 0.388 1
RG -0.324 0.901 0.020 0.857 1
AVG 0.211 0.692 0.514 0.969 0.803 1
GDP PC 0.068 0.860 0.236 0.952 0.881 0.945
Growth 03-12 0.380 -0.062 0.206 0.089 -0.258 0.089
Stability -0.726 0.142 0.042 0.215 0.448 0.105
3.5 The Global Competitiveness Index
The Global Competitiveness Index is published as part of the Global Competitiveness Report
2012–2013,14
with data pertaining mostly to 2011, although in some instances 2010 data was
14
This was the latest available version during the writing of this paper. It is available at:
http://www3.weforum.org/docs/WEF_GlobalCompetitivenessReport_2012-13.pdf

15
used.15
The authors define competitiveness as ―the set of institutions, policies, and factors
that determine the level of productivity of a country.‖ The authors argue that ―the level of
productivity, in turn, sets the level of prosperity that can be earned by an economy. In other
words, a more competitive economy is one that is likely to sustain growth.‖ The GCI covers
144 countries. The scores are based on the Min-Max method, with scores ranging from 1 to7.
The methodology is explained in Chapter 1.3 of the Global Competitiveness Report.
The overall index is a weighted average of many different components, each measuring a
different aspect of competitiveness. These components are grouped into 3 sub-indices16
, with
12 pillars as follows: Sub-index 1: Basic requirements
Pillar 1: Macroeconomic environment
Pillar 2: Institutions
Pillar 3: Infrastructure
Pillar 4: Health and primary education
Sub-index 2: Efficiency enhancers
Pillar 5: Market size
Pillar 6: Financial market development
Pillar 7: Higher education and training
Pillar 8: Technological readiness
Pillar 9: Goods market efficiency
Pillar 10: Labour market efficiency
Sub-index 3: Innovation and sophistication factors
Pillar 11: Business sophistication
Pillar 12: Innovation
(see Appendix 1 for the definition of these indicator pillars).
3.5.1 The GCI: Regional Comparisons
Table 15 presents GCI the scores of the Philippines and other ASEAN member countries for
which data was available. Table 15
The Scores and Rankings of the Philippines compared to other ASEAN Member Countries
in terms of the Global Competitiveness Index
Country
BI
Sub-index
1
EF
Sub-
index 2
IS
Sub-
index 3
IN
Pillar 2
GM
Pillar 6
LM
Pillar 7
FM
Pillar 8
Overall
GCI
Sco
re
Ra
nk
Sco
re
Ra
nk
Sco
re
Ra
nk
Sco
re
Ra
nk
Sco
re
Ra
nk
Sco
re
Ra
nk
Sco
re
Ra
nk
Sco
re
Ra
nk
Brunei D 5.56 2 4.05 6 3.63 5 4.86 4 4.23 6 5.07 2 4.27 4 4.87 3
Cambodia 4.14 8 3.84 8 3.54 7 3.84 5 4.43 4 4.78 4 4.12 6 4.01 8
Indonesia 4.74 5 4.21 4 3.96 3 3.86 7 4.29 5 3.87 8 4.07 7 4.40 5
Malaysia 5.38 3 4.89 2 4.70 2 5.00 2 5.16 2 4.82 3 5.44 2 5.06 2
Philippines 4.35 6 4.17 5 3.60 6 3.57 8 4.17 7 4.01 7 4.25 5 4.23 6
Singapore 6.34 1 5.65 1 5.27 1 6.07 1 5.60 1 5.80 1 5.85 1 5.67 1
Thailand 4.89 4 4.38 3 3.72 4 3.82 6 4.56 3 4.32 6 4.46 3 4.52 4
Vietnam 4.22 7 4.03 7 3.32 8 4.94 3 4.13 8 4.52 5 3.85 8 4.11 7
* The lowest possible GCI score is 1 and the highest possible level of GCI score is 7.
Key: BI = basic requirements indicators, EF = efficiency enhancers; IS = innovation & sophistication; IN = Institutions; GM = goods market efficiency; LM = labour market efficiency; FM = financial market development; AVG = average of all indices.
15
In addition, some formulae for constructing 2011 data required information from other years. 16
The GCI utilise a somewhat arbitrary weighting procedure, depending on the stage of development of the
country being considered, as measured by the GDP per capita. See Schwab (2012: 9).
16
It can be seen from Table 15 that out of the eight countries17
represented in the Global
Competitiveness Index (last column), the Philippines ranked sixth, with Vietnam and
Cambodia scoring lower. As expected, in the region Singapore and Malaysia received the
highest GCI scores.
The Basic Requirements Indicator sub-index includes a pillar entitled Institutions (IN), in
which as can be seen in Table 13, the Philippines‘ score is the lowest in the eight countries
included in the table.
The indicators relating to market efficiency are part of the third sub-index entitle Efficiency
Enhancers (EF) with includes the goods and labour markets. It can be seen from Table 13,
that the Philippines‘‘ scores are relatively low with regard to Goods Market Efficiency (GM)
and the Labour Market Efficiency (LM), placing the country the one before the last in the
region, the last being Vietnam.
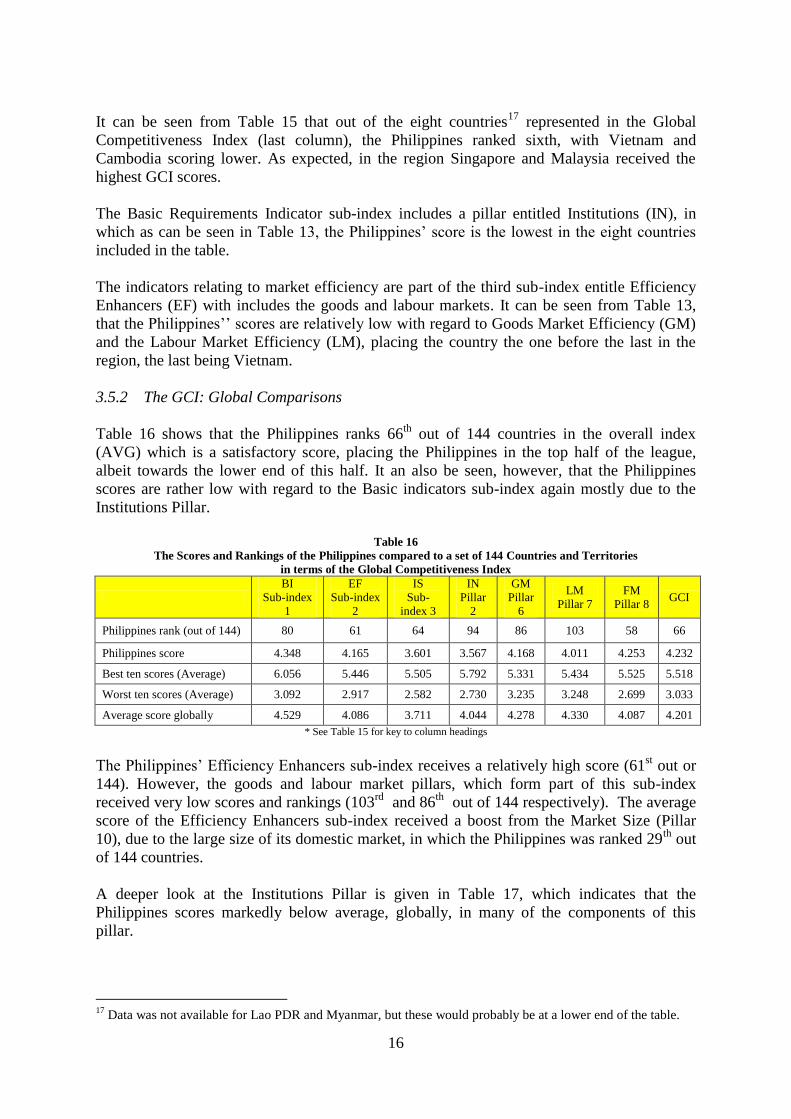
3.5.2 The GCI: Global Comparisons
Table 16 shows that the Philippines ranks 66th
out of 144 countries in the overall index
(AVG) which is a satisfactory score, placing the Philippines in the top half of the league,
albeit towards the lower end of this half. It an also be seen, however, that the Philippines
scores are rather low with regard to the Basic indicators sub-index again mostly due to the
Institutions Pillar.
Table 16
The Scores and Rankings of the Philippines compared to a set of 144 Countries and Territories
in terms of the Global Competitiveness Index
BI
Sub-index
1
EF
Sub-index
2
IS
Sub-
index 3
IN
Pillar
2
GM
Pillar
6
LM
Pillar 7
FM
Pillar 8 GCI
Philippines rank (out of 144) 80 61 64 94 86 103 58 66
Philippines score 4.348 4.165 3.601 3.567 4.168 4.011 4.253 4.232
Best ten scores (Average) 6.056 5.446 5.505 5.792 5.331 5.434 5.525 5.518
Worst ten scores (Average) 3.092 2.917 2.582 2.730 3.235 3.248 2.699 3.033
Average score globally 4.529 4.086 3.711 4.044 4.278 4.330 4.087 4.201
* See Table 15 for key to column headings
The Philippines‘ Efficiency Enhancers sub-index receives a relatively high score (61st out or
144). However, the goods and labour market pillars, which form part of this sub-index
received very low scores and rankings (103rd
and 86th
out of 144 respectively). The average
score of the Efficiency Enhancers sub-index received a boost from the Market Size (Pillar
10), due to the large size of its domestic market, in which the Philippines was ranked 29th
out
of 144 countries.
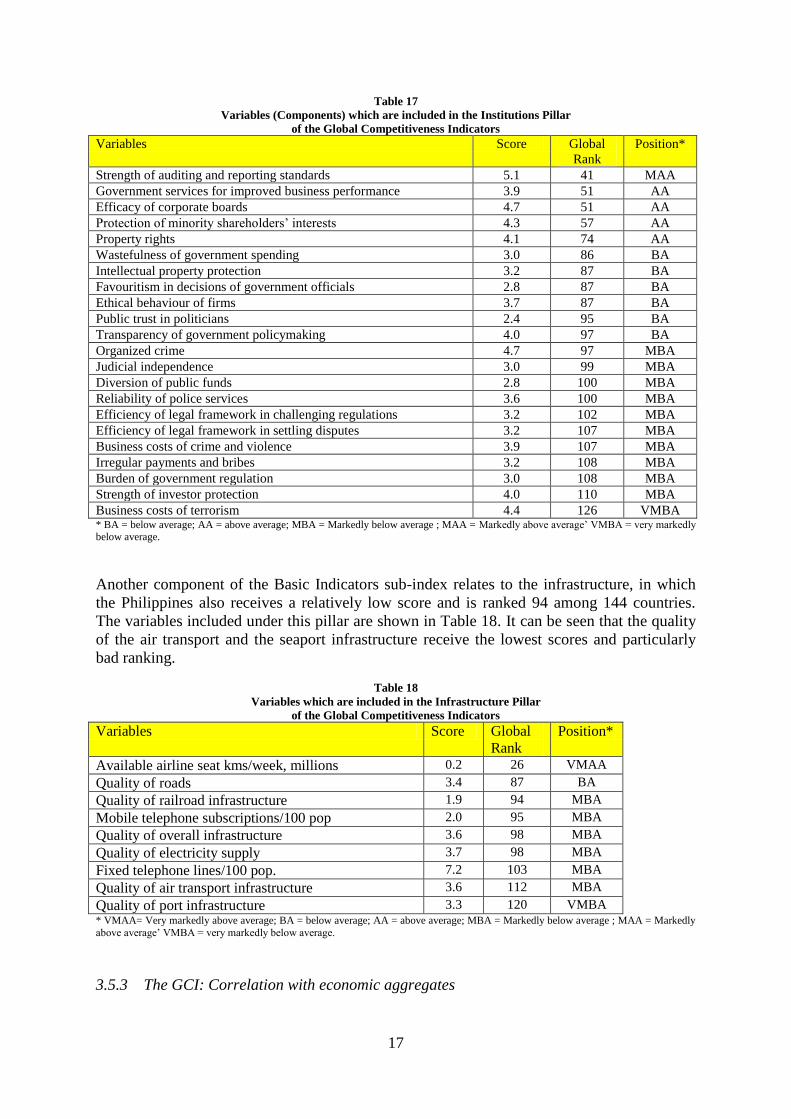
A deeper look at the Institutions Pillar is given in Table 17, which indicates that the
Philippines scores markedly below average, globally, in many of the components of this
pillar.
17
Data was not available for Lao PDR and Myanmar, but these would probably be at a lower end of the table.
17
Table 17
Variables (Components) which are included in the Institutions Pillar
of the Global Competitiveness Indicators
Variables Score Global
Rank
Position*
Strength of auditing and reporting standards 5.1 41 MAA
Government services for improved business performance 3.9 51 AA
Efficacy of corporate boards 4.7 51 AA
Protection of minority shareholders‘ interests 4.3 57 AA
Property rights 4.1 74 AA
Wastefulness of government spending 3.0 86 BA
Intellectual property protection 3.2 87 BA
Favouritism in decisions of government officials 2.8 87 BA
Ethical behaviour of firms 3.7 87 BA
Public trust in politicians 2.4 95 BA
Transparency of government policymaking 4.0 97 BA
Organized crime 4.7 97 MBA
Judicial independence 3.0 99 MBA
Diversion of public funds 2.8 100 MBA
Reliability of police services 3.6 100 MBA
Efficiency of legal framework in challenging regulations 3.2 102 MBA
Efficiency of legal framework in settling disputes 3.2 107 MBA
Business costs of crime and violence 3.9 107 MBA
Irregular payments and bribes 3.2 108 MBA
Burden of government regulation 3.0 108 MBA
Strength of investor protection 4.0 110 MBA
Business costs of terrorism 4.4 126 VMBA * BA = below average; AA = above average; MBA = Markedly below average ; MAA = Markedly above average‘ VMBA = very markedly below average.
Another component of the Basic Indicators sub-index relates to the infrastructure, in which
the Philippines also receives a relatively low score and is ranked 94 among 144 countries.
The variables included under this pillar are shown in Table 18. It can be seen that the quality
of the air transport and the seaport infrastructure receive the lowest scores and particularly
bad ranking.
Table 18
Variables which are included in the Infrastructure Pillar
of the Global Competitiveness Indicators
Variables Score Global
Rank
Position*
Available airline seat kms/week, millions 0.2 26 VMAA
Quality of roads 3.4 87 BA
Quality of railroad infrastructure 1.9 94 MBA
Mobile telephone subscriptions/100 pop 2.0 95 MBA
Quality of overall infrastructure 3.6 98 MBA
Quality of electricity supply 3.7 98 MBA
Fixed telephone lines/100 pop. 7.2 103 MBA
Quality of air transport infrastructure 3.6 112 MBA
Quality of port infrastructure 3.3 120 VMBA * VMAA= Very markedly above average; BA = below average; AA = above average; MBA = Markedly below average ; MAA = Markedly
above average‘ VMBA = very markedly below average.
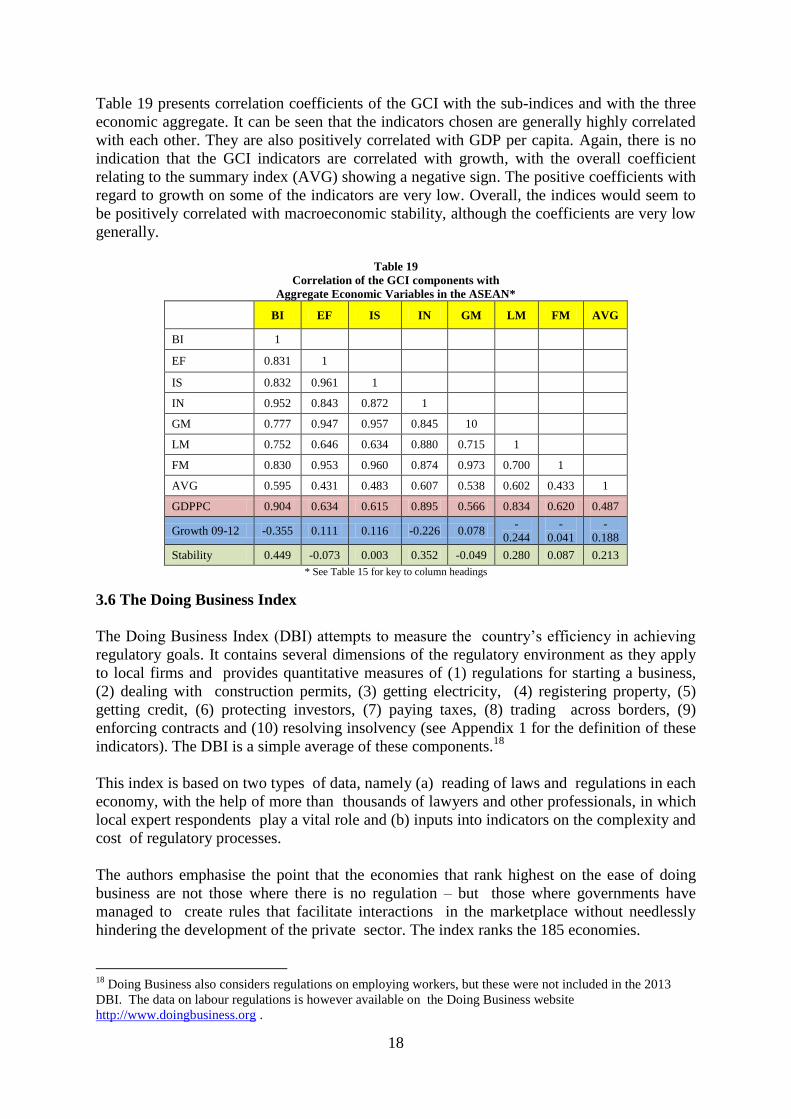
3.5.3 The GCI: Correlation with economic aggregates
18
Table 19 presents correlation coefficients of the GCI with the sub-indices and with the three
economic aggregate. It can be seen that the indicators chosen are generally highly correlated
with each other. They are also positively correlated with GDP per capita. Again, there is no
indication that the GCI indicators are correlated with growth, with the overall coefficient
relating to the summary index (AVG) showing a negative sign. The positive coefficients with
regard to growth on some of the indicators are very low. Overall, the indices would seem to
be positively correlated with macroeconomic stability, although the coefficients are very low
generally.
Table 19
Correlation of the GCI components with
Aggregate Economic Variables in the ASEAN*
BI EF IS IN GM LM FM AVG
BI 1
EF 0.831 1
IS 0.832 0.961 1
IN 0.952 0.843 0.872 1
GM 0.777 0.947 0.957 0.845 10
LM 0.752 0.646 0.634 0.880 0.715 1
FM 0.830 0.953 0.960 0.874 0.973 0.700 1
AVG 0.595 0.431 0.483 0.607 0.538 0.602 0.433 1
GDPPC 0.904 0.634 0.615 0.895 0.566 0.834 0.620 0.487
Growth 09-12 -0.355 0.111 0.116 -0.226 0.078 -
0.244
-
0.041
-
0.188
Stability 0.449 -0.073 0.003 0.352 -0.049 0.280 0.087 0.213
* See Table 15 for key to column headings
3.6 The Doing Business Index
The Doing Business Index (DBI) attempts to measure the country‘s efficiency in achieving
regulatory goals. It contains several dimensions of the regulatory environment as they apply
to local firms and provides quantitative measures of (1) regulations for starting a business,
(2) dealing with construction permits, (3) getting electricity, (4) registering property, (5)
getting credit, (6) protecting investors, (7) paying taxes, (8) trading across borders, (9)
enforcing contracts and (10) resolving insolvency (see Appendix 1 for the definition of these
indicators). The DBI is a simple average of these components.18
This index is based on two types of data, namely (a) reading of laws and regulations in each
economy, with the help of more than thousands of lawyers and other professionals, in which
local expert respondents play a vital role and (b) inputs into indicators on the complexity and
cost of regulatory processes.
The authors emphasise the point that the economies that rank highest on the ease of doing
business are not those where there is no regulation – but those where governments have
managed to create rules that facilitate interactions in the marketplace without needlessly
hindering the development of the private sector. The index ranks the 185 economies.
18
Doing Business also considers regulations on employing workers, but these were not included in the 2013
DBI. The data on labour regulations is however available on the Doing Business website
http://www.doingbusiness.org .

19
The authors of the DBI also present distance to frontier (DTF)19
scores, which measure the
distance of each economy from the highest performance observed on each of the topics across
all economies included in FBI. An economy‘s distance to frontier is indicated on a scale from
0 to 100, where 0 represents the lowest performance and 100 the frontier on that indicator
across all economies since 2005.20
3.6.1 The DBI: Regional Comparisons
Table 20 present the Distance to Frontier scores of the DBI. It can be seen that the Philippines
is ranked 8th
in the 9 ASEAN members included in the table (no data was available for
Myanmar). It performed badly in most sub-indices, particularly Paying Taxes and Resolving
Insolvency. Its best score was in Getting Electricity.
Table 20
The Scores and Rankings of the Philippines compared to other ASEAN Member Countries
in terms of the Doing Business Index (Distance to Frontier Scores)*
SB CP GE RP GC
DT
F
Ra
nk
DT
F
Ra
nk
DT
F
Ra
nk
DT
F
Ra
nk
DT
F
Ra
nk
Brunei D 52.6 9 72.4 5 81.1 4 45.6 9 43.8 6
Cambodia 54.9 8 45.4 9 59.7 7 66.4 6 68.8 4
Indonesia 71.3 5 79.0 4 67.7 6 62.2 8 43.8 6
Lao PDR 71.0 6 69.5 6 45.8 9 73.9 5 25.0 9
Malaysia 93.6 2 57.7 8 82.4 3 79.5 3 100.0 1
Philippines 65.3 7 62.4 7 78.9 5 64.1 7 43.8 6
Singapore 95.9 1 92.8 1 90.6 1 79.4 4 87.5 2
Thailand 87.5 3 87.0 2 90.5 2 85.6 1 62.5 5
Vietnam 75.9 4 85.8 3 52.9 8 82.7 2 75.0 3
Table 20 (cont) PI PT TB EC RI EDB
DT
F
Ra
nk
DT
F
Ra
nk
DT
F
Ra
nk
DT
F
Ra
nk
DT
F
Ra
nk
DT
F
Ra
nk
Brunei D 47.7 6 82.7 3 73.9 5 43.9 7 50.5 2 57.0 4
Cambodia 56.7 5 72.1 4 55.9 8 31.6 9 14.5 7 51.8 7
Indonesia 61.9 4 58.2 7 75.5 4 33.7 8 15.9 5 55.7 5
Lao PDR 17.0 9 62.9 6 38.1 9 54.4 5 0.0 9 45.8 9
Malaysia 90.0 2 88.3 2 83.4 2 71.9 2 47.9 3 79.1 2
Philippines 44.4 7 56.3 8 71.0 6 51.6 6 6.2 8 51.7 8
Singapore 96.7 1 95.0 1 91.5 1 89.6 1 96.8 1 91.7 1
Thailand 79.3 3 71.4 5 80.3 3 67.8 3 45.5 4 74.1 3
Vietnam 30.4 8 47.3 9 69.5 7 66.1 4 15.6 6 52.2 6
* The Distance to Frontier scores range from 0 to 100, with 100 being the best performer among all countries.
Key: SB = starting a business; CP = dealing with construction permits; GE = getting electricity; RP = registering property; GC = getting
credit; PI= protecting investors; PT = paying taxes; TB = trading across borders; EC = enforcing contracts; RI = resolving insolvency; EDB = ease of doing business rank.
3.6.2 The DBI: Global Comparisons
19
More information about TF is available at:
http://www.doingbusiness.org/~/media/GIAWB/Doing%20Business/Documents/Annual-
Reports/English/DB13-Chapters/Ease-of-doing-business-and-distance-to-frontier.pdf 20
For the tax rate the frontier is defined as the total tax rate corresponding to the 15th percentile based on the
overall distribution of total tax rates for all years

20
When comparing the Philippines with other countries globally, in terms of the DBI, it
emerges that the Philippines is ranked 138th
among 185 countries, as can be seen from Table
21. Again, the lowest rankings were in Resolving Insolvencies and Paying taxes, with the
best ranking obtained with regard to Getting Electricity.
Table 21
The Scores and Rankings of the Philippines compared to a set of 185 Countries and Territories
in terms of the Doing Business Index*
SB CP GE RP GC PI PT TB EC RI EDB
Philippines‘ Rank (out of
185) 161 100 57 122 129 128 143 53 111 165 138
Philippines DTF** 65.3 62.4 78.9 64.1 43.8 44.4 56.3 71.0 51.6 6.2 51.7
Highest 10 ranks (average) 15.2 11.7 23.9 32.2 13.8 21.7 25.8 17.4 15.1 18.2 5.5
Lowest 10 ranks (average) 166.4 139.6 142.6 138.2 136.8 154.3 168.8 163.2 135 155.4 180.5
Average ranking 93 93 93 93 85 87 93 93 93 94 93
*See Table 20 for the key to column headings ** Distance to Frontier = see text
3.6.3 The DBI: Correlation with economic aggregates
Examining the correlation of the DBI with the three economic aggregates described above, it
can be seen from Table 22 that the indicators are generally positively correlated with each
other, although in some cases the coefficients have a very low value. As in the other indices,
the DBI and its components are positively correlated with GDP per capita (with the exception
of Registering Property). Again, the correlation with growth is generally negative. The
correlation with macroeconomic stability are also mostly positive.
Table 22
Correlation of the Distance from Frontier Scores of the DBI Components
With Aggregate Economic Variables in the ASEAN
SB CP GE RP GC PI PT TB EC RI EDB
SB 1
CP 0.50 1
GE 0.44 0.27 1
RP 0.80 0.35 0.02 1
GC 0.63 0.04 0.41 0.53 1
PI 0.65 0.17 0.82 0.29 0.72 1
PT 0.37 -0.01 0.65 -0.02 0.51 0.74 1
TB 0.57 0.45 0.85 0.16 0.64 0.82 0.48 1
EC 0.86 0.56 0.45 0.70 0.60 0.49 0.43 0.53 1
RI 0.57 0.47 0.76 0.17 0.60 0.79 0.84 0.77 0.68 1
EDB 0.81 0.41 0.78 0.45 0.73 0.92 0.78 0.81 0.77 0.91 1
GDP PC 0.19 0.41 0.58 -0.24 0.25 0.46 0.75 0.54 0.44 0.87 0.61
Growth 03-12 0.13 -0.19 -0.64 0.51 0.10 -0.22 -0.35 -0.48 0.00 -0.39 -0.21
Stability -0.27 -0.09 0.60 -0.62 0.07 0.31 0.52 0.44 -0.13 0.43 0.22
*See Table 13 for the key to column headings
3.7 The Human Development Index
The Human Development Index (HDI) measures the average achievements in a country in
three basic dimensions of human development, namely health (measured by life expectancy),
education (measured by the geometric average of years of schooling and expected years of

21
schooling)21
and the standard of living, measured by the log of GNI per capita (PPP $). All
variables were rescaled using the Min-Max formula. The HDI is the geometric mean of the
three dimensions. A description of the methodology is available at Klugman et al. (2011).
The most recent index covers 186 economies.
3.7.1 The HDI: Regional Comparisons
In this comparison, the Health and Education components of the HDI are used because the
focus of this section is on social institutions, assumed to be captured by these two indices.
Table 23
The Scores and Rankings of the Philippines compared to other ASEAN Member Countries
in terms of the Human Development Index
Health Education HDI
Score Rank Score Rank Score Rank
Brunei D 0.847 2 0.651 2 0.855 2
Cambodia 0.435 10 0.388 8 0.543 8
Indonesia 0.611 6 0.459 6 0.629 6
Lao PDR 0.556 8 0.321 9 0.543 8
Malaysia 0.743 4 0.608 3 0.769 3
Myanmar 0.495 9 0.267 10 0.498 10
Philippines 0.590 7 0.549 4 0.654 5
Singapore 0.935 1 0.694 1 0.895 1
Thailand 0.738 5 0.478 5 0.690 4
Viet Nam 0.769 3 0.417 7 0.617 7
* The scores range from 0 to 1 with 0 signifying the worst possible performer and 1 the best possible.
It can be seen from Table 23 that in terms of the HDI, the Philippines is ranked 5th
within the
region, the time slightly surpassing Indonesia. However it receives a relatively high rank with
regard to Education (4th
) and a lower rank with regard to Health (7th
). As in the other indices
described above, Singapore, the smallest member of the ASEAN, is ranked first in the region.
3.7.2 The HDI: Global Comparisons
Table 24, shows that the Philippines rank rather low globally (114th
out of 186 economies).
Again, the rank for Education is somewhat better and the rank for Health is somewhat worse.
Table 24
The Scores and Rankings of the Philippines compared to a set of 186 Countries and Territories
in terms of the Human Development Index
Health Education HDI
Philippines' rank (Out of 186) 122 102 114
Philippines' score .590 .549 .654
Average highest ten scores .935 .865 .925
Average lowest ten score .134 .100 .337
Average of all scores .614 .525 .675
3.7.3 The HDI: Correlation with economic aggregates
21
Mean of years of schooling for adults aged 25 years and expected years of schooling for children of school
entering age.
22
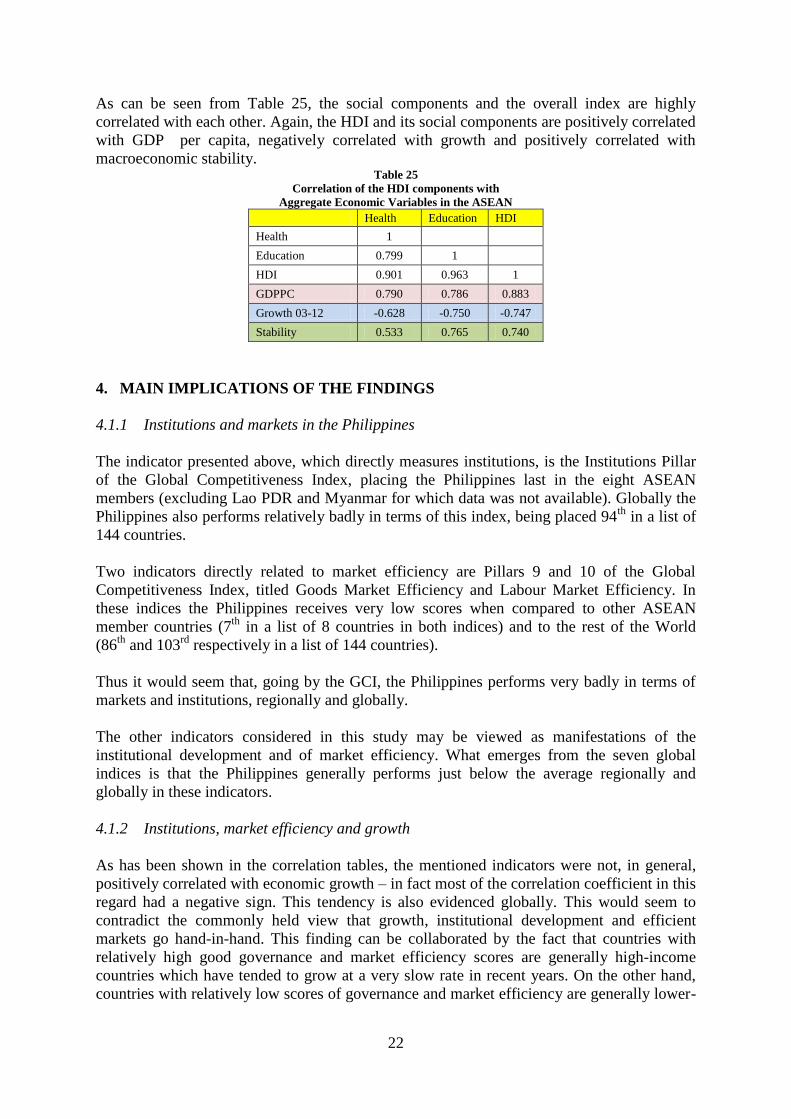
As can be seen from Table 25, the social components and the overall index are highly
correlated with each other. Again, the HDI and its social components are positively correlated
with GDP per capita, negatively correlated with growth and positively correlated with
macroeconomic stability. Table 25
Correlation of the HDI components with
Aggregate Economic Variables in the ASEAN
Health Education HDI
Health 1
Education 0.799 1
HDI 0.901 0.963 1
GDPPC 0.790 0.786 0.883
Growth 03-12 -0.628 -0.750 -0.747
Stability 0.533 0.765 0.740
4. MAIN IMPLICATIONS OF THE FINDINGS
4.1.1 Institutions and markets in the Philippines
The indicator presented above, which directly measures institutions, is the Institutions Pillar
of the Global Competitiveness Index, placing the Philippines last in the eight ASEAN
members (excluding Lao PDR and Myanmar for which data was not available). Globally the
Philippines also performs relatively badly in terms of this index, being placed 94th
in a list of
144 countries.
Two indicators directly related to market efficiency are Pillars 9 and 10 of the Global
Competitiveness Index, titled Goods Market Efficiency and Labour Market Efficiency. In
these indices the Philippines receives very low scores when compared to other ASEAN
member countries (7th
in a list of 8 countries in both indices) and to the rest of the World
(86th
and 103rd
respectively in a list of 144 countries).
Thus it would seem that, going by the GCI, the Philippines performs very badly in terms of
markets and institutions, regionally and globally.
The other indicators considered in this study may be viewed as manifestations of the
institutional development and of market efficiency. What emerges from the seven global
indices is that the Philippines generally performs just below the average regionally and
globally in these indicators.
4.1.2 Institutions, market efficiency and growth
As has been shown in the correlation tables, the mentioned indicators were not, in general,
positively correlated with economic growth – in fact most of the correlation coefficient in this
regard had a negative sign. This tendency is also evidenced globally. This would seem to
contradict the commonly held view that growth, institutional development and efficient
markets go hand-in-hand. This finding can be collaborated by the fact that countries with
relatively high good governance and market efficiency scores are generally high-income
countries which have tended to grow at a very slow rate in recent years. On the other hand,
countries with relatively low scores of governance and market efficiency are generally lower-
23
income countries which have tended to grow at a faster rate than high-income countries
during the decade 2003-2012.
One could argue that the connection between growth on the one hand, and institutional
development and market efficiency on the other, is not contemporaneous in that institutions
and market efficiency precede economic growth, and tests of the interrelationship of these
two variables should measure the institutions/market variables lagged a number of years,
given that institutions and markets take time to have an impact on growth. Conversely, it may
be assumed that the causality runs from economic growth to institutional development and
market efficiency in that countries that grow can afford to improve their institutions and their
markets.22
There may therefore be a two-way causation in this regard, as already explained in
Section 2 of this paper, with some authors preferring the theory of growth first and
institutions later, while other take the opposite view.
These arguments can be both valid, and the correlations between the indices and economic
growth presented in this study could therefore be interpreted in this light. The approach taken
in this study is too simple to explain the causation issue, however it certainly shows that in
the ASEAN and globally, there is no evidence that countries that currently have the highest
scores with regard to institutional/efficient markets scores are those that have grown fastest.
In the case of the Philippines, its rate of growth averaged 5.17% annually over the ten-year
period between 2003 and 2012, even though its institutions and market scores on the GCI
were relatively low globally and among the lowest in the ASEAN.
4.1.3 Institutions, market efficiency and GDP per capita.
The correlation results would seem to suggest that countries with the highest GDP per capita
have the highest degree of institutional development and market efficiency. This result is
plausible, in that institutional set-ups are costly and can best be afforded by rich countries,
most of which have been at the forefront of development for many decades. Extending the
arguments presented in the preceding section, one can argue that the idea of growth first and
institutions later may have some validity in that growth leads to prosperity and prosperity
renders the country more able to afford institutional development and to promote market
efficiency. In addition, the democratic institutions in most developed countries may have
fostered awareness of the need for institutional development and market efficiency.23
4.1.4 Institutions, market efficiency and macroeconomic stability
In this study, the correlations between institutions, market efficiency and macroeconomic
stability were found to be generally positive. Again here, the causal direction may be
disputed, in that it is difficult to establish whether stability leads to development of vice-
versa. However, economic stability is often associated with good economic governance
(Briguglio et al, 2009). The ranking of the Philippines in terms of macroeconomic stability
was satisfactory in the ASEAN (being ranked 4th
among 10 countries) and globally (being
ranked 54th
among 174 countries).24
Being a large economy, the Philippines may be relatively
more sheltered than smaller countries from external shocks, given that it is not highly
22
A related line of reasoning is that countries that currently enjoy a high standard of living and currently tend to
grow at a slower rate than poorer countries, have in the past promoted market efficiency and institutional
development and they are now reaping the benefits as a result of their high income per capita. 23
An interesting discussion is given in Seigle et al. (2004) and Chen 24
Author‘s calculations (see also footnote 6).

24
dependent on exports and imports. This may explain the finding that although economic
stability and institutional development and market efficiency were generally found to be
positively related to macroeconomic stability, in the case of the Philippines this correlation
does not apply.
4.1.5 Institutions, market efficiency and corruption
As indicated in the brief literature review presented in Section 2 of this paper, corruption is
shown to have various economic downsides. The Philippines received relatively bad scores
on at least three indices relating to corruption discussed above. In the CPI, the Philippines
ranked 5th
out of 10 countries in the region and 105th
out of 176 countries globally. In the
Absence of Corruption component of the RLI, the Philippines ranked 4th
out of 7 countries in
the region and 63rd
out of 97 countries globally. In the Control of Corruption component of
the WGI the Philippines ranked 7th
out of 10 countries regionally and 164th
or of 215
countries globally.25
These indicators indicate that there is a correlation between institutional
underdevelopment and inefficient markets with corruption. This is perhaps one of the most
worrying factors of the indicators discussed above with regard to the Philippines.26
5. CONCLUSION
What are the main implications of this study for the Philippines economy? As indicated in
this study, the Philippines registered a relatively high growth rates during the recent decade,
but it is still a lower-middle-income country, according to the World Bank‘s classification.
Typically, countries in that income bracket tend to have inferior institutional set-ups when
compared to richer countries. Likewise, many countries in the Philippines‘ income bracket
are characterised by gross market inefficiencies. The indicators described in this study
support this contention.
As argued above, it is not easy to prove conclusively as to the whether a lower-income
country, such as the Philippines, is in such a situation because its institutional set-up and its
markets are underdeveloped, or whether the causal relationship is the other way round,
namely that its institutions and markets are underdeveloped because the country does not
afford them.
Whatever the direction of the causality, there can be no doubt that institutions and
functioning markets remain important requisites for good economic governance, and the
indicators described above indicate that, in this regard, the situation of the Philippines leaves
much to be desired.
REFERENCES
Acemoglu, D., Johnson, D. and Robinson, J.A. (2005). Institutions as a Fundamental Cause
of Long-run Growth.‖ In Aghion, P. and Durlauf, S.N. Handbook of Economic
Growth, Volume IA. Available at : http://economics.mit.edu/files/4469
25
In the GCI, there is an index entitled ―Irregular payments and bribes‖ which is also a reflection of corruption
in which the Philippines also received worrying scores, with the country being ranked 108th
among 144
countries. 26
Corruption was identified as one of the most problematic matter for doing business in the Philippines in the
Global Competitiveness Report (see Schwab, 2012: 292).
25
Agrast, M.D., Botero, J.C., Martinez, J., Ponce, A. and Pratt, C.S. WJP Rule of Law Index,
2012-2013. Washington DC, A World Justice Project. Available at:
http://worldjusticeproject.org/sites/default/files/WJP_Index_Report_2012.pdf .
Aron, J. (2000). ―Growth and Institutions: A Review of the Evidence,‖ The World Bank
Research Observer. Vol. 15 (1), 99-135. Available at:
http://www.ppge.ufrgs.br/giacomo/arquivos/eco02237/aron-2000.pdf.
Botero, J.C. and Ponce, A. (2011). ―Measuring the Rule of Law‖ Available at SSRN:
http://dx.doi.org/10.2139/ssrn.1966257
Briguglio, L., Cordina, G., Farrugia, N. and Vella, S. (2009). ― Economic Vulnerability and
Resilience: Concepts and Measurements,‖ Oxford Development Studies, Vol. 37(3):
229-247. Available at:
http://econpapers.repec.org/article/tafoxdevs/v_3a37_3ay_3a2009_3ai_3a3_3ap_3a2
29-247.htm .
Chen, L.E. (2007). ―Development First, Democracy Later? Or Democracy First,
Development Later? The Controversy over Development and Democracy.‖ Paper
presented at the annual meeting of the Southern Political Science Association,
January 3-6, 2007, Available at:
http://www.democracy.uci.edu/files/democracy/docs/conferences/grad/chen.pdf
Commission on Growth and Development (2008). The Growth Report Strategies for
Sustained Growth and Inclusive Development. Washington, DC: World Bank.
Available at: https://openknowledge.worldbank.org/handle/10986/6507 .
Easterly, W. (2001). ―Can institutions resolve ethnic conflict?‖ Economic Development and
Cultural Change, Vol. 49(4): 687-706. Available at:
http://www.hks.harvard.edu/fs/pnorris/Acrobat/stm103%20articles/Easterly_Instituti
ons_Ethnic_Conflict.pdf .
Easterly (2006). ―Social Cohesion, Institutions, and Growth,‖ Centre for Global
Development, Working Paper Number 94. Available at: http://www.degit.ifw-
kiel.de/papers/degit_14/c014_014.pdf
de Vaal, A. and Ebben, W. (2011). Institutions and the Relation between Corruption and
Economic Growth Review of Development Economics, Vol. 15(1): 108–123.
Available at: http://www.degit.ifw-kiel.de/papers/degit_14/c014_014.pdf
Glaeser, E.L., La Porta, R., Lopez-de-Silanes, F. and Shleifer, A, (2004). ―Do Institutions
Cause Growth?‖ NBER Working Paper 10568. Available at:
http://www.nber.org/papers/w10568.pdf.
Gwartney, J., Lawson, R. and Hall, J. (2012). Economic Freedom of the World, 2012 Report.
Available at: http://www.freetheworld.com/2012/EFW2012-complete.pdf .
Jutting, J. (2003). Institutions and Development: A Critical Review. Working Paper, No.210.
Paris: OECD Development Centre. Available at:
http://portals.wi.wur.nl/files/docs/SPICAD/Institutions_and_developmentOECD.pdf .
Huntington, S. (1968). Political Order in Changing Societies, Yale University Press, New
Haven.
Kaufmann, D., Kraay, A. and Mastruzzi, M. (2010). ―The Worldwide Governance Indicators:
Methodology and Analytical Issues,‖ World Bank Policy Research Working Paper
No. 5430. Available at:
http://papers.ssrn.com/sol3/papers.cfm?abstract_id=1682130.
Klugman, J., Rodriguez, F. and Choi, H. J. (2011). ―The HDI 2010: New Controversies, Old
Critiques.‖ Human Development Research Paper 1. UNDP–HDRO, New York.
http://hdr.undp.org/en/reports/global/hdr2011/papers/HDRP_2011_01.pdf .
Leff, N.H. (1964). ―Economic Development Through Bureaucratic Corruption,‖ American
Behavioral Scientist, Vol. 8 (3): 8-14.

26
North, D.C. 1990. Institutions, Institutional Change and Economic Performance. Cambridge:
Cambridge University Press.
Ocampo, J.A. (2008). ‗Macroeconomic Vulnerability and Reform: Managing Pro-Cyclical
Capital Flows‘, paper presented at the international symposium ‗Financial
Globalization and Emerging Market Economies‘. Bangkok, Bank of Thailand.
Available at:
http://www.bot.or.th/English/EconomicConditions/Semina/Documents/08_Paper_O
campo.pdf .
Olken, B. A. and Pande, R. (2012). ―Corruption in Developing Countries.‖ NBER Working
Paper no. 17398. Available at: http://www.nber.org/papers/w17398 .
Rodrik, D. (1999). Institutions for High Quality Growth: What They are and How They Affect
Growth, Paper prepared for the International Monetary Fund Conference on Second-
Generation Reforms, Washington, D.C.: 8-9 November.
Schwab, K. (2012) The Global Competitiveness Report 2012–20130. Switzerland: World
Economic Forum. Available at:
http://www3.weforum.org/docs/WEF_GlobalCompetitivenessReport_2012-13.pdf .
Siegle, J.T., Weinstein, M.M. and Halperin, M.H. (2004). ―Why Democracies Excel,‖
Foreign Affairs, Vol. 83(5): 57-71. Available at: http://africacenter.org/wp-
content/uploads/2004/10/Why-Democracies-Ecxel.pdf .
Sirimaneetham, V. and Temple, J.R.W. (2009). ―Macroeconomic Stability and the
Distribution of Growth Rates,‖ The World Bank Economic Review, Vol. 23(2): 443–
479. Available at:
https://openknowledge.worldbank.org/bitstream/handle/10986/4510/wber_23_3_443
.pdf?sequence=1 .
Svensson, J. (2005). ―Eight questions about Corruption,‖ Journal of Economic Perspectives,
Vol. 19(5): 19-42. Available at:
http://pubs.aeaweb.org/doi/pdfplus/10.1257/089533005774357860
Transparency International (2012. ―The Corruption Perception Index 2012 – Methodological
notes.‖ Available at:
http://www.transparency.org/files/content/pressrelease/2012_CPITechnicalMethodol
ogyNote_EMBARGO_EN.pdf.
UNDP (2013). Human Development Report - The Rise of the South: Human Progress in a
Diverse World, Available at: http://hdr.undp.org/en/reports/global/hdr2013/
World Bank (2013). Doing Business 2013: Smarter Regulations for Small and Medium-Size
Enterprises. Washington, DC: World Bank Group. Available at:
http://www.doingbusiness.org/reports/global-reports/doing-business-2013
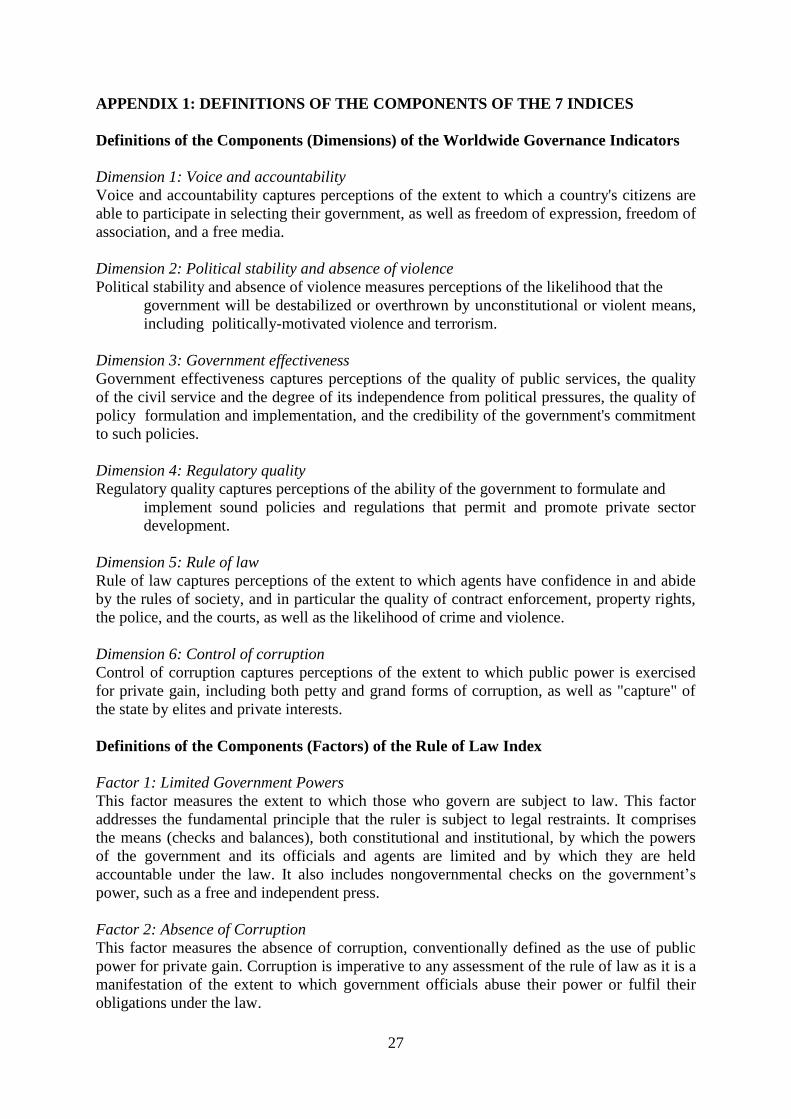
27
APPENDIX 1: DEFINITIONS OF THE COMPONENTS OF THE 7 INDICES
Definitions of the Components (Dimensions) of the Worldwide Governance Indicators
Dimension 1: Voice and accountability
Voice and accountability captures perceptions of the extent to which a country's citizens are
able to participate in selecting their government, as well as freedom of expression, freedom of
association, and a free media.
Dimension 2: Political stability and absence of violence
Political stability and absence of violence measures perceptions of the likelihood that the
government will be destabilized or overthrown by unconstitutional or violent means,
including politically-motivated violence and terrorism.
Dimension 3: Government effectiveness
Government effectiveness captures perceptions of the quality of public services, the quality
of the civil service and the degree of its independence from political pressures, the quality of
policy formulation and implementation, and the credibility of the government's commitment
to such policies.
Dimension 4: Regulatory quality
Regulatory quality captures perceptions of the ability of the government to formulate and
implement sound policies and regulations that permit and promote private sector
development.
Dimension 5: Rule of law
Rule of law captures perceptions of the extent to which agents have confidence in and abide
by the rules of society, and in particular the quality of contract enforcement, property rights,
the police, and the courts, as well as the likelihood of crime and violence.
Dimension 6: Control of corruption
Control of corruption captures perceptions of the extent to which public power is exercised
for private gain, including both petty and grand forms of corruption, as well as "capture" of
the state by elites and private interests.
Definitions of the Components (Factors) of the Rule of Law Index
Factor 1: Limited Government Powers
This factor measures the extent to which those who govern are subject to law. This factor
addresses the fundamental principle that the ruler is subject to legal restraints. It comprises
the means (checks and balances), both constitutional and institutional, by which the powers
of the government and its officials and agents are limited and by which they are held
accountable under the law. It also includes nongovernmental checks on the government‘s
power, such as a free and independent press.
Factor 2: Absence of Corruption
This factor measures the absence of corruption, conventionally defined as the use of public
power for private gain. Corruption is imperative to any assessment of the rule of law as it is a
manifestation of the extent to which government officials abuse their power or fulfil their
obligations under the law.

28
Factor 3: Order and Security
This factor measures how well the society assures the security of persons and property.
Human security is one of the defining aspects of any rule of law society and a fundamental
function of the state
Factor 4: Fundamental Rights
This factor encompasses adherence to the following rights: equal treatment and absence of
discrimination7; the right to life and security of the person; freedom of thought, religion, and
expression, including freedom of the media; freedom of association, including the right to
collective bargaining; the prohibition of forced and child labor8; the right to privacy; the
rights of the accused; and the retroactive application of the criminal laws.
Factor 5: Open Government
This factor measures the level of access, participation, and collaboration between
the government and its citizens, and plays a crucial role in the promotion of accountability.
Requesting information from public authorities is an important tool to empower citizens by
giving them a way to voice their concerns and demand accountability from their
governments.
Factor 6: Regulatory Enforcement
This factor measures the fairness and effectiveness in enforcing government regulations.
Public enforcement of government regulations is pervasive in modern societies as a method
to induce ‗good‘ conduct. A critical feature of the rule of law is that such rules are upheld and
properly enforced by authorities, particularly because public enforcement might raise the
scope for negligence and abuse by officials pursuing their own interest.
Factor 7: Access to Civil Justice
This factor is central to the rule of law. In a rule of law society, all people should be able to
obtain remedies in conformity with fundamental rights. Access to justice has both a ―thin‖
and a ―thick‖ meaning. In our framework, we favour an intermediate conception and address
access to justice in terms of access to dispute resolution mechanisms, mostly in terms of
access to counsel 14 and access to tribunals. This differs from other frameworks which
conceptualize access to justice in the ‗thicker‘ sense, in which access to justice encompasses
other aspects such as legitimacy of the courts or elements that contribute to enhance the legal
empowerment of the poor.
Factor 8: Effective Criminal Justice
This factor deals with the criminal justice system. An effective criminal justice system is a
key aspect of the rule of law, as it constitutes the natural mechanism to redress grievances
and bring action against individuals for offenses against society.
Definition of the Components (Areas) of the Economic Freedom of the World Index
Area 1. Size of Government: Expenditures, Taxes, and Enterprises
This area measures the extent to which countries rely on the political process to allocate
resources and goods and services. When government spending increases relative to spending
by individuals, households, and businesses, government decision-making is substituted for
personal choice and economic freedom is reduced. This area is measured in terms of

29
government consumption, transfers and subsidies, Government enterprises and investment,
top marginal tax rate.
Area 2.Legal Structure and Security of Property Rights
Protection of persons and their rightfully acquired property is a central element
of economic freedom and a civil society. Indeed, it is the most important function
of government. This area is measured in terms of judicial independence, impartial courts,
protection of property rights, military interference in rule of law and politics, integrity of the
legal system, legal enforcement of contracts, regulatory restrictions on sale of real property,
reliability of police and business costs of crime.
Area 3. Access to Sound Money
An absence of sound money undermines gains from trade and to protect property rights and,
thus, economic freedom. Inflation erodes the value of property held in monetary instruments.
When governments finance their expenditures by creating money, in effect, they are
expropriating the property and violating the economic freedom of their citizens. This area is
measured in terms of money growth, standard deviation of inflation, inflation: most recent
year, freedom to own foreign currency bank accounts.
Areas 4. Freedom to Trade Internationally
Freedom of exchange across national boundaries is a key ingredient of economic freedom.
Many goods and services are now either produced abroad or contain resources supplied from
abroad. Thus, freedom to trade internationally also contributes substantially to modern living
standards. This area is measured in terms of the existence of trade taxes and tariff rates,
regulatory trade barriers (non-tariff trade barriers and compliance cost of importing and
exporting), black-market exchange rates, controls of the movement of capital and people
Area 5. Regulation of Credit, Labour, and Business
When regulations restrict entry into markets and interfere with the freedom to engage in
voluntary exchange, they reduce economic freedom. This area is measured in terms of credit
market regulations (ownership of banks, private sector credit and interest rate
controls/negative real interest rates), Labour market regulations (minimum wage, hiring and
firing regulations, centralized collective bargaining, hours regulations, mandated cost of
worker dismissal, and conscription) and business regulations (administrative requirements,
bureaucracy costs, starting a business, extra payments/bribes/favouritism, licensing
restrictions and cost of tax compliance).
Definition of the Components (Pillars) Global Competitiveness Indicators
Pillar 1: Institutions
This pillar is composed of two-subdivisions namely (a) Public Institutions (with a weight of
75% and with 17 sub-indices as follows: Property Rights, Intellectual Property Protection,
Diversion of Public Funds, Public Trust in Politicians, Irregular Payments and Bribes,
Judicial Independence; Favouritism in Decisions of Government Officials,
Wastefulness of Government Spending, Burden of Government Regulation, Efficiency of
Legal Framework in Settling Disputes, Efficiency of Legal Framework in Challenging
Regulations, Transparency of Government Policymaking, Provision of Government Services
for Improved Business, Performance, Business Costs of Terrorism, Business Costs of Crime
and Violence, Organized Crime, Reliability of Police Services) and (b) Private Institutions
(with a weight of 25% and with 5 sub-indices as follows: Ethical Behaviour of Firms,
30
Strength of Auditing and Reporting Standards, Efficacy of Corporate Boards, Protection of
Minority Shareholders‘ Interests, Strength of Investor Protection).
.
Pillar2: Infrastructure
This pillar has two sub-divisions, namely (a) Transport infrastructure (with 6sub-indices as
follows: Quality of Overall Infrastructure, Quality of Roads, Quality of Railroad
Infrastructure, Quality of Port Infrastructure, Quality of Air Transport Infrastructure,
Available Airline Seat Kilometres, and (b) Electricity and Telephony Infrastructure (with 3
sub-indices as follows: Quality of Electricity Supply, Mobile telephone subscriptions,
Fixed telephone lines). The sub-divisions have equal weights.
Pillar 3: Macroeconomic environment
This pillar has 5 sub-indices namely Government Budget Balance, Gross National Savings,
Inflation, Government Debt, and Country Credit Rating. with equal weights.
Pillar 4: Health and primary education
This pillar has two sub-divisions namely (a) Health (with 8 sub-indices as follows: 4.01
Business Impact of Malaria, Malaria Incidence, Business Impact of tuberculosis,
Tuberculosis Incidence, Business Impact of HIV/AIDS, HIV Prevalence, Infant Mortality,
Life Expectancy) and (b) Primary Education (with 2 sub-indices as follows: Quality of
Primary Education, Primary Education Enrolment Rate). They are assigned equal weights.
Pillar 5: Higher education and training
This pillar has three sub-divisions, namely (a) Quantity of Education (with 2 sub-indices as
follows: Secondary Education Enrolment Rate, Tertiary Education Enrolment Rate)
(b) Quality of Education (with 4 sub-indices as follows: Quality of the Educational System,
Quality of Math and Science Education, Quality of Management Schools, Internet Access in
Schools) and (c) On-the-job Training (with 2 sub-indices as follows: Local availability of
Specialized Research and Training Services, Extent of Staff Training). They are assigned
equal weights.
Pillar 6: Goods market efficiency
This pillar has two sub-divisions, namely (a) Domestic and Foreign Competition (66%
weight, with 14 sub-indices as follows: Intensity of local Competition, Extent of Market
Dominance, Effectiveness of Anti-Monopoly Policy, Extent and Effect of Taxation, Total
Tax Rate, Number of Procedures required to start a Business, Time required to Start a
Business, Agricultural Policy Costs, Prevalence of Trade Barriers, Trade Tariffs, Prevalence
of Foreign Ownership, Business Impact of Rules on FDI, Burden of Customs Procedures,
Imports as a Percentage of GDP) and (b) Quality of Demand Conditions (with 33% weight
with 3 sub-indices namely Degree of Customer Orientation, and Buyer Sophistication).
Pillar 7: Labour market efficiency
This pillar has two sub-divisions, namely (a) Flexibility (with 5 sub-indices as follows:
Cooperation in Labour-Employer Relations, Flexibility of Wage Determination, Hiring and
Firing Practices, Redundancy Costs, Extent and Effect of Taxation) and (b) Efficient Use of
Talent (with 4 sub-indices as follows: Pay and Productivity, Reliance on Professional
Management, Brain Drain, Female Participation in Labour Force), with equal weights.
Pillar 8: Financial market development

31
This pillar has two sub-divisions, namely (a) Efficiency (with 5 sub-indices as follows:
Availability of Financial Services, Affordability of Financial Services, Financing through
Local Equity, Market, Ease of Access to Loans, Venture Capital Availability) and (b)
Trustworthiness and Confidence (with 3 sub-indices as follows: Soundness of Banks,
Regulation of Securities Exchanges, Legal Rights Index) with equal weights.
Pillar 9: Technological readiness
This pillar is composed of two sub-divisions, namely (a) Technological Adoption (with 3
sub-indices as follows: Availability of Latest Technologies, Firm-level Technology
Absorption, FDI and Technology) and (b) Transfer and ICT Use (with 6 sub-indices as
follows: Internet Users, Broadband Internet Subscriptions, Internet Bandwidth, Mobile
Broadband Subscriptions, Mobile Telephone Subscriptions, Fixed Telephone Lines) with
equal weights.
Pillar 10: Market size
This pillar has two sub-divisions, namely (a) Domestic Market Size, with 75% and (b)
Foreign Market Size, with 25% weight.
Pillar 11: Business sophistication
This pillar has 10 sub-indices, namely Local Supplier Quantity, Local Supplier Quality, State
of Cluster Development, Nature of Competitive Advantage, Value Chain Breadth, Control of
International Distribution, Production Process Sophistication, Extent of Marketing,
Willingness to Delegate Authority, Reliance on Professional Management
Pillar 12: Innovation
This pillar has seven sub-indices, namely Capacity for Innovation, Quality of Scientific
Research Institutions, Company Spending on R&D, University-Industry Collaboration in
R&D, Government Procurement of Advanced Technology Products, Availability of
Scientists and Engineers, PCT Patent Applications, and Intellectual Property Protection.
Definition of the Components (Areas) of the Doing Business Index
Area 1.Starting a Business
Measures the procedures, time and cost for a small to medium-sized limited-liability
company to start up and operate formally
Area 2. Dealing with Construction Permits
Tracks the procedures, time and cost to build a warehouse – including obtaining necessary
licenses and permits, completing required notifications and inspections, and obtaining utility
connections
Area 3. Getting Electricity
Analyzes the procedures, time and cost required for a business to obtain a permanent
electricity connection for a newly constructed warehouse
Area 4. Registering Property
Examines the steps, time and cost involved in registering property, assuming a standardized
case of an entrepreneur who wants to purchase land and a building that is already registered
Area 5. Paying Taxes

32
Addresses the taxes and mandatory contributions that a medium-sized company must pay or
withhold in a given year, as well as measures of the administrative burden in paying taxes
Area 6. Trading Across Borders
Looks at the procedural requirements for exporting and importing a standardized cargo of
goods
Area 7. Getting Credit
Explores two sets of issues—credit information registries and the effectiveness of collateral
and bankruptcy laws in facilitating lending
Area 8. Protecting Investors
Measures the strength of legal protections of minority investors against the misuse of
corporate assets by company directors for their personal gain
Area 9. Enforcing Contracts
Assesses the efficiency of the judicial system by following the evolution of a commercial sale
dispute over the quality of goods and tracking the time, cost and number of procedures
involved from the moment the plaintiff files the lawsuit until payment is received
Area 10. Resolving Insolvency
Identifies weaknesses in existing bankruptcy law and the main procedural and administrative
bottlenecks in the bankruptcy process
Area 11. Employing Workers (not included in rankings)
Measures the regulation of employment, specifically as it affects the hiring and layoff of
workers and the rigidity of working hours
APPENDIX 2: THE SCORES OF THE PHILIPPINES SINCE 2005
The indicators presented in this study have been compiled in previous years, and many
countries, including the Philippines, featured in previous compilations of these indicators.
However, one has to be cautious in comparing the scores of a country in one year with those
of previous years. Changes over time in a country‘s score are affected by a combination of
many factors including (a) revision of data over the years for a particular country; (b) changes
in the methodology used in obtaining and processing the raw data and (c) changes in the
methodology, including the weighting procedure, used to aggregate the data. For these
reasons the changes over time reported below should be interpreted with caution.
The Philippines’ Worldwide Governance Indicators Scores since 2005
Looking at the WGI scores for the Philippines, it appears there was deterioration with regard
to Control of Corruption, Rule of Law and Regulatory Quality. Government Effectiveness
and Voice and accountability would seem to have improved slightly. PSAV deteriorated
sharply after 2005, but was practically at the same level as 2005 in 2011.
The Philippines’ Rule of Law Scores since 2005

33
It is not possible to meaningfully compare RLI scores for the Philippines over time. The
compilers of the report state explicitly that the 2012-2013 scores are not comparable with the
scores of prior years.
The Philippines’ Corruption Perception Index Scores since 2005
The methodology used for compiling the CPI was changed and as a result country scores of
the CPI 2012 cannot be compared against those of 2011 or previous editions. Year to year
comparisons will be possible
from 2012 onwards.
The Philippines’ Economic Freedom of the World Scores since 2005
The compilers of the index present a chain-linked index to as to render comparisons possible
over time. In the case of the Philippines it appears that overall, the EFWI did not change
markedly between 2005 and 2010 (from 7.00 to 7.06). Looking at the components of the
Index, it emerges that there was deterioration in Legal System and Property Rights (from 4.28
to 3.85), Freedom to Trade Internationally (from 7.11 to 6.95) and Size of Government (from
8.79 to 8.31). There was a marked improvement in Sound Money (from 7.94 to 9.29), and a
very slight improvement in regulation (from 6.75 to 6.80).
The Philippines’ Global Competitiveness Scores since 2005
The GCI contains a large number of Indicators, and it is difficult to meaningfully compared
the changes between 2005 and 2012 for the Philippines. However the report itself states that
the Philippines has improved considerably in its ranking since 2005, but many weaknesses
remain to be addressed. The country‘s infrastructure is still in a dire state, particularly with
respect to sea (120th) and air transport (112th), with little or no progress achieved to date.
Furthermore, various market inefficiencies and rigidities continue.
The Philippines’ Doing Business Index Scores since 2005
The DBI website presents Distance to Frontier scores over time (for the Philippines the data
covers 2006 to 2013. Overall the DBI DTF score increased slightly from 50.4 to 51.7, mostly
due to improvements in Starting a Business, Paying Taxes, Trading Across Borders and
Enforcing Contracts. The other components did not change or only registered slight
improvements.
The Philippines’ Human Development Index Scores since 2005
The Human Development Index score of the Philippines improved from .630 to .654 between
2005 and 2012 (adjusted for comparability between these years). However this was still
below the global average of .694 in 2012.
![Yes [ / ] No [ ] · Philippines and, accordingly, is well-positioned to capture emerging consumer markets and take advantage of the continuing macroeconomic growth in the Philippines,](https://static.fdocuments.us/doc/165x107/5e8be609360624295a65008a/yes-no-philippines-and-accordingly-is-well-positioned-to-capture-emerging.jpg)