Institutions and Growth: a GMM/IV Panel VAR Approach; by Carlos … · 7 I chose EFW for two...
14
WP/15/174 IMF Working Papers describe research in progress by the author(s) and are published to elicit comments and to encourage debate. The views expressed in IMF Working Papers are those of the author(s) and do not necessarily represent the views of the IMF, its Executive Board, or IMF management. Institutions and Growth: a GMM/IV Panel VAR Approach by Carlos Góes
Transcript of Institutions and Growth: a GMM/IV Panel VAR Approach; by Carlos … · 7 I chose EFW for two...

WP/15/174
IMF Working Papers describe research in progress by the author(s) and are published to elicit comments and to encourage debate. The views expressed in IMF Working Papers are those of the author(s) and do not necessarily represent the views of the IMF, its Executive Board, or IMF management.
Institutions and Growth: a GMM/IV Panel VAR Approach
by Carlos Góes

© 2015 International Monetary Fund WP/15/174
IMF Working Paper
Western Hemisphere Department
Institutions and Growth: a GMM/IV Panel VAR Approach
Prepared by Carlos Góes1
Authorized for distribution by Alfredo Cuevas
July 2015
Abstract
Both sides of the institutions and growth debate have resorted largely to microeconometric
techniques in testing hypotheses. In this paper, I build a panel structural vector
autoregression (SVAR) model for a short panel of 119 countries over 10 years and find
support for the institutions hypothesis. Controlling for individual fixed effects, I find that
exogenous shocks to a proxy for institutional quality have a positive and statistically
significant effect on GDP per capita. On average, a 1 percent shock in institutional quality
leads to a peak 1.7 percent increase in GDP per capita after six years. Results are robust to
using a different proxy for institutional quality. There are different dynamics for advanced
economies and developing countries. This suggests diminishing returns to institutional
quality improvements.
JEL Classification Numbers: O43, C33, C14.
Keywords: Institutions, Panel VAR, Economic Development.
Author’s E-Mail Address: [email protected]
1 International Monetary Fund (WHD). I thank Maddie Eldridge (2013) for giving me the initial insight that one
should try to incorporate the feedback loops between institutions and growth to this debate, which pointed to a
VAR-type analysis. I am grateful to Troy Matheson, Alfredo Cuevas, Joshua Hall, Ranae Jabri, Nicolas Magud,
Roberto Ellery, Alex Herman, and Leo Feler for their helpful comments. All potential mistakes and omissions
are solely mine.
IMF Working Papers describe research in progress by the author(s) and are published to
elicit comments and to encourage debate. The views expressed in IMF Working Papers are
those of the author(s) and do not necessarily represent the views of the IMF, its Executive Board,
or IMF management.

3
Contents Page
Abstract ......................................................................................................................................2
I. Introduction ............................................................................................................................4
II. Methodology .........................................................................................................................5
III. Data ......................................................................................................................................6
IV. Results..................................................................................................................................7
V. Robustness ..........................................................................................................................11
VI. Conclusion .........................................................................................................................12
Appendix ..................................................................................................................................13
References ................................................................................................................................14

4
I. INTRODUCTION
Since Acemoglu, Johnson and Robinson's (AJR, 2001) seminal paper supporting the link
between institutions and development, the debate over the role of institutions on economic
growth has spurred much research. Those who are critics of institutionalism are perhaps
better represented by Jeffrey Sachs (2003), who has emphasized the prevalence of ecology
and geography over institutions in economic development.
However, both sides of such debate have resorted largely to microeconometric techniques in
testing hypotheses. There are several reasons for that. The most important one is that
complete time series of country-wide institutional quality indicators have only become
available in the last fifteen years. This has limited the extent to which researchers can explore
dynamics in the institutions-growth relationship since the data are still too scant for
individual-country time series analysis. Additionally, although the popularity of panel vector
autoregressions has been increasing over the last quarter century2, its use is still remarkably
rarer than traditional VARs.
In this paper, I take a macroeconometric approach to the institutions-development debate. I
build a panel structural vector autoregression (SVAR) model from equations estimated with
Arellano-Bond's generalized method of moments/instrumental variables (GMM/IV)
technique for 119 countries over 10 years.
The advantages of this approach are manifold. By using Arellano-Bond, it estimates unbiased
fixed-effects average coefficients for short panels (N > T). The results, then, control for all
the time-invariant characteristics that are usually considered in the development literature.
They include, for instance: latitude, access to sea, temperature, humidity, language, culture of
colonizing power, initial income, etc.
This approach permits the calculation of unbiased impulse response functions (IRFs), which
takes full advantage of the information contained in the cross sectional dimension of the
sample. Finally, as with any VAR-approach, the model assumes endogeneity of the all
variables in the system and can estimate dynamics of purely exogenous shocks.
Using the Economic Freedom of the World Index as a proxy for institutions, I find that
exogenous shocks to institutional quality have a positive and statistically significant effect on
GDP per capita. On average, a 1 percent shock in institutional quality, as measured by this
proxy index, leads to a peak 1.7 percent increase in GDP per capita after six years. Such peak
response is robust to using a different proxy for institutions (the Corruption Perception
Index). There are different dynamics for advanced and developing countries, suggesting
diminishing returns to institutional quality improvements.
2 See Canova and Ciccarelli (2013) for a comprehensive literature review.

5
II. METHODOLOGY
I estimate the following model:
where is a bi-dimensional vector of stacked endogenous variables, is the
log of GDP per capita in constant 2005 U.S. dollars, is the proxy for institutional quality,
is a diagonal matrix of time-invariant individual-specific intercepts,
is
a polynomial of lagged coefficients, is a matrix of lagged coefficients, and is a vector
of stacked residuals, and is a matrix of contemporaneous coefficients.
Since is correlated with the error term in dynamic panels, estimation through OLS leads to
biased coefficients (cf. Nickell, 1981). To avoid this, I estimate a system of equations
with Arellano-Bond's GMM/IV technique3. Each equation has the first difference of an
endogenous variable on the left hand side and lagged first differences of all endogenous
variables on the right hand side.
In its equivalent vector moving average representation (VMA), the Panel SVAR model can
be rendered as follows:
where
is a polynomial of reduced-form responses to
innovations and .
To recover the matrix and identify the model, I first calculate the variance-covariance
matrix . Since , then . As the structural
residuals are assumed to be uncorrelated ( , I derive the matrix by
decomposing the variance-covariance matrix into two triangular matrices.
3 As explained in Arellano and Bond (1991), the GMM estimators assume , where is a matrix
of instruments which are orthogonal to the error terms, namely lags the variables in the right hand side. For each
equation, the moment estimators will minimize the above assumption by changing the symmetric matrix in
where is a matrix of all lagged variables on the right hand-side and is a
vector of the variable on the left-hand side.

6
To identify the model, I need to impose one restriction to orthogonalize the contemporaneous
responses. I choose to exogenize GDP per capita, by imposing that institutional quality has
no contemporaneous effect on the former while GDP per capita is allowed to
contemporaneously impact institutional quality. By construction, this reduces the short-term
impact of institutional quality on GDP per capita, so this design is more robust if one is
trying to test the institutional hypothesis.
In recovering the impulse responses from the matrices, I follow the method explained by
Lutkepöhl (2007). Take the following rendering of the VMA representation of the Panel
SVAR:
where
). Since , it follows that
and . After factorizing the identity and truncating the impulse horizon to
periods, I can recover matrices of marginal responses recursively:
To recover structural shocks, I multiply all by and then use a bi-dimensional impulse
vector to construct a matrix of structural responses:
Collecting the first column into a vector ( ), I have the IRF of the of the
first endogenous variable to a shock in the first endogenous variable. I then repeat the process
until the variable ( ) and change the impulse variable by replacing
vector above. After recovering the point estimates of all the IRFs, I calculate standard
errors nonparametrically through a simulation algorithm with 1000 repetitions (see Appendix
for details).
III. DATA
I use GDP per capita data in constant 2005 U.S. dollars from the World Bank's World
Development Indicators as the income variable and the Fraser Institute's Economic Freedom
of the World Index (EFW) as a proxy for institutional quality. The index takes into account
five institutions-related subcomponents, namely: legal system reliability, monetary stability,
burden of regulation, size of government, and freedom to trade internationally4
4 See Gwartney, Lawson, and Hall (2014).

7
I chose EFW for two reasons. First, it is significantly correlated with the risk of appropriation
index AJR used in their original paper (t-stat > 7). It is also correlated to other potential
proxies for institutions, such as the Economist Intelligence Unit's Democracy Index or
Transparency International's Corruption Perception Index (CPI), which was used in the
robustness section. In fact, the first principal component of those four indices explain about
70% of the total variance, suggesting that those different metrics are measuring similar
underlying characteristics. If the index AJR used in their paper or any of the other indices
mentioned are a good proxies for institutions, so should be the EFW index.
Second, it provides a continuous annual time series between 2000 and 2012 for a very wide
range of countries. Since the Arellano-Bond estimators perform better on short panels (i.e.,
panels with large N and small T), I wanted to take advantage of the information available
from the variability between individuals as much as possible. The large cross sectional
dimension of the EFW index fits suit.
The data are organized into a panel of 119 countries and 12 years. The Arellano-Bond
framework implies a necessity to transform the data into first differences and use lagged
instruments. For such reason, the final estimation sample drops to 10 years, resulting a total
of 1190 observations.
IV. RESULTS
The results from the estimated GMM/IV Panel VAR are average responses of endogenous
variables to an exogenous shock in any variable after controlling for time-invariant
y = 0.4936x + 0.0081
R² = 0.2493
-3
-2
-1
0
1
2
3
-4 -2 0 2 4EFW Index, 2012
Ris
k o
f E
xp
rop
riati
on
In
dex
, 19
85
-19
95
y = 0.615x + 0.08
R² = 0.3107
-3
-2
-1
0
1
2
3
-4 -2 0 2 4EFW Index, 2012
Dem
ocr
acy
In
dex
, 20
10
Figure 1. Correlation between EFW index and Risk of Expropriation index (AJR's
sample, n = 61) and between EFW index and Economist Intelligence Unit's Democracy Index (n = 107) . Variables were standardized, so the scale is in standard deviations. In
all indices, a higher score means better institutions.

8
characteristics of individual members. It takes into consideration all the simultaneous
dynamics in the system. Since the Panel SVAR is stable, over the long run shocks converge
to zero. This means that shocks are temporary and over the long run the series return to their
deterministic trends.
It is not obvious what a shock in institutional quality is. Such shock is an innovation in
institutional quality as captured by the proxy of choice. Taking the EFW index as a proxy,
the institutional gap between Nicaragua and Costa Rica, for instance, is about 10%.
Similarly, Burundi is about 30% below Rwanda. The results in this section suggest
improvements in institutions can lead to higher income per capita, which is also observed in
the contemporaneous correlation between the two variables, as seen in Figure 2 below. The
standard deviation in changes in the institutions proxy is 3.5% and the average annual
improvement is 0.4%.
I find that, on average, a 1 percent temporary shock in institutional quality leads to a peak 1.7
percent increase in GDP per capita after six years5. The relationship remains positive and
statistically significant up until up to 10 years after the shock, though decreasingly so. After
the fourth year, uncertainty increases rapidly – as shown by the broadening confidence
bands.
5 The standard-deviation of reduced-form (structural) shocks is 4.7% (7.5%) and 4.2% (6.8%) for GDP per
capita and the institutions proxy, respectively.
y = 7.2689x - 5.5022R² = 0.4519
4
5
6
7
8
9
10
11
12
1 1.5 2 2.5Log of Institutions Proxy (2000-2012)
Lo
g o
f G
DP
per
Cap
ita
in C
on
stan
t 20
05
US
Do
llars
(2
00
0-2
012)
Figure 2. Contemporaneous correlation
between EFW index and GDP per capita.The chart includes all time periods for all
countries (NT = 1571)
0
5
10
15
20
25
-15 -10 -5 0 5 10 15
Annual Percent Change in Institutions Proxy
Dis
trib
uti
on, i
n p
erce
nt o
f to
tal
Mean: 0.4%Median: 0.2%
Std. dev: 3.5%
Figure 3. Distribution of Annual Percent
Changes in Institutions Proxy (NT = 1450)

9
One of the setbacks of the GMM/IV approach is that it imposes homogeneous dynamics
across individuals. To address this shortcoming, I split the sample between advanced and
developing countries. I find that, as expected, the dynamics are indeed different among
different country groups.
When restricting the sample to 25 advanced economies, the impact of improved institutional
quality in GDP per capita is much smaller than observed in the whole sample, peaking at
0.35 percent two years following a 1 percent shock. Interestingly, after shocks both on GDP
per capita and on institutional quality, institutional quality quickly returns back to its trend.
Results are in Figure 5 below.
-1
-0.5
0
0.5
1
1.5
2
2.5
3
3.5
0 1 2 3 4 5 6 7 8 9 10
Response of GDP per capita to
a 1% shock in institutional quality
Years after shock
-0.4
-0.2
0
0.2
0.4
0.6
0.8
1
1.2
0 1 2 3 4 5 6 7 8 9 10
Response of institutional quality to
a 1% shock in institutional quality
Years after shock
0
0.2
0.4
0.6
0.8
1
1.2
1.4
0 1 2 3 4 5 6 7 8 9 10
Response of GDP per capita to
a 1% shock in GDP per capita
Years after shock
90% confidence
interval
-0.2
-0.1
0
0.1
0.2
0.3
0.4
0.5
0 1 2 3 4 5 6 7 8 9 10
Response of institutional quality to
a 1% shock in GDP per capita
Years after shock
Figure 4. Impulse Response Functions, Full Sample. Calculated from GMM/IV Panel
VAR (N = 119, T = 10). Standard errors from re-sampling simulation with 1,000
repetitions.

10
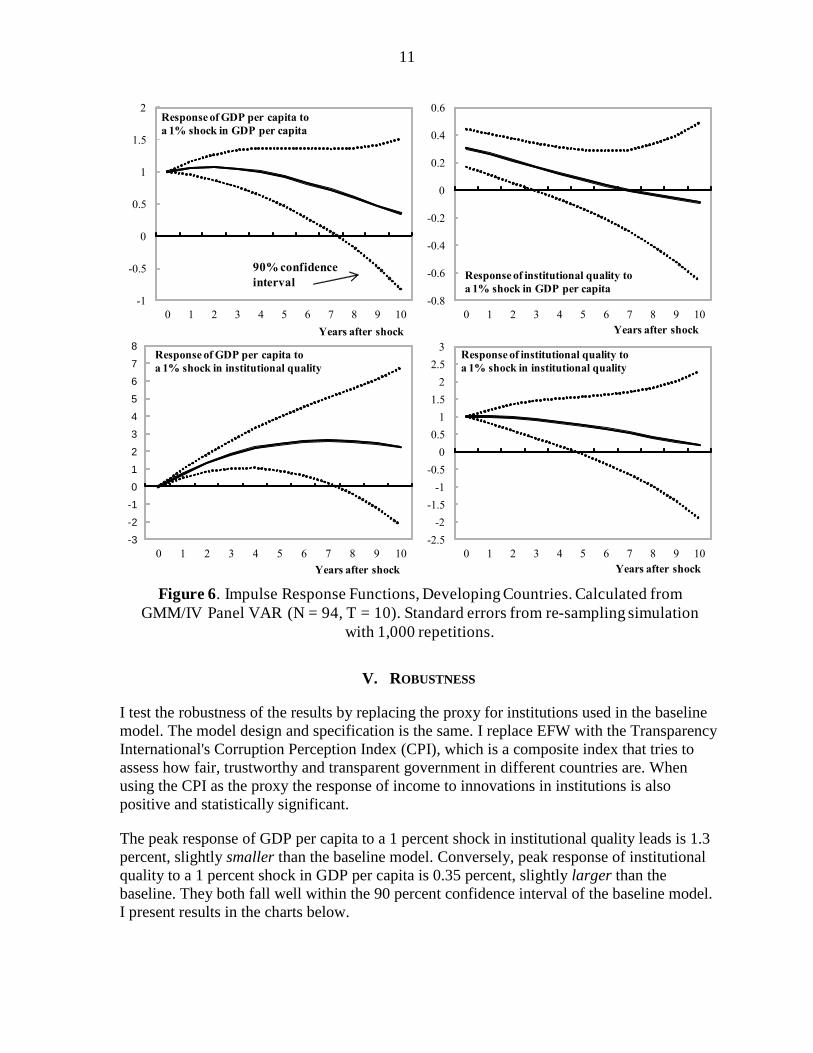
This is strikingly different from the results of estimating the model with the remaining
94 developing countries. For developing countries, the peak statistically significant response
is 2.6 percent. Standard errors are much larger throughout all responses, which is expected,
since developing countries tend to be more heterogeneous than advanced economies.
-0.1
0
0.1
0.2
0.3
0.4
0.5
0.6
0.7
0 1 2 3 4 5 6 7 8 9 10
Response of GDP per capita to
a 1% shock in institutional quality
Years after shock
-0.2
0
0.2
0.4
0.6
0.8
1
1.2
0 1 2 3 4 5 6 7 8 9 10
Response of institutional quality to
a 1% shock in institutional quality
Years after shock
0
0.1
0.2
0.3
0.4
0.5
0.6
0.7
0.8
0.9
1
0 1 2 3 4 5 6 7 8 9 10
Response of GDP per capita to
a 1% shock in GDP per capita
Years after shock
90% confidence
interval
-0.15
-0.1
-0.05
0
0.05
0.1
0.15
0.2
0.25
0 1 2 3 4 5 6 7 8 9 10
Response of institutional quality to
a 1% shock in GDP per capita
Years after shock
Figure 5. Impulse Response Functions, Advanced Economies. Calculated from
GMM/IV Panel VAR (N = 25, T = 10). Standard errors from re-sampling simulation
with 1,000 repetitions.
11
V. ROBUSTNESS
I test the robustness of the results by replacing the proxy for institutions used in the baseline
model. The model design and specification is the same. I replace EFW with the Transparency
International's Corruption Perception Index (CPI), which is a composite index that tries to
assess how fair, trustworthy and transparent government in different countries are. When
using the CPI as the proxy the response of income to innovations in institutions is also
positive and statistically significant.
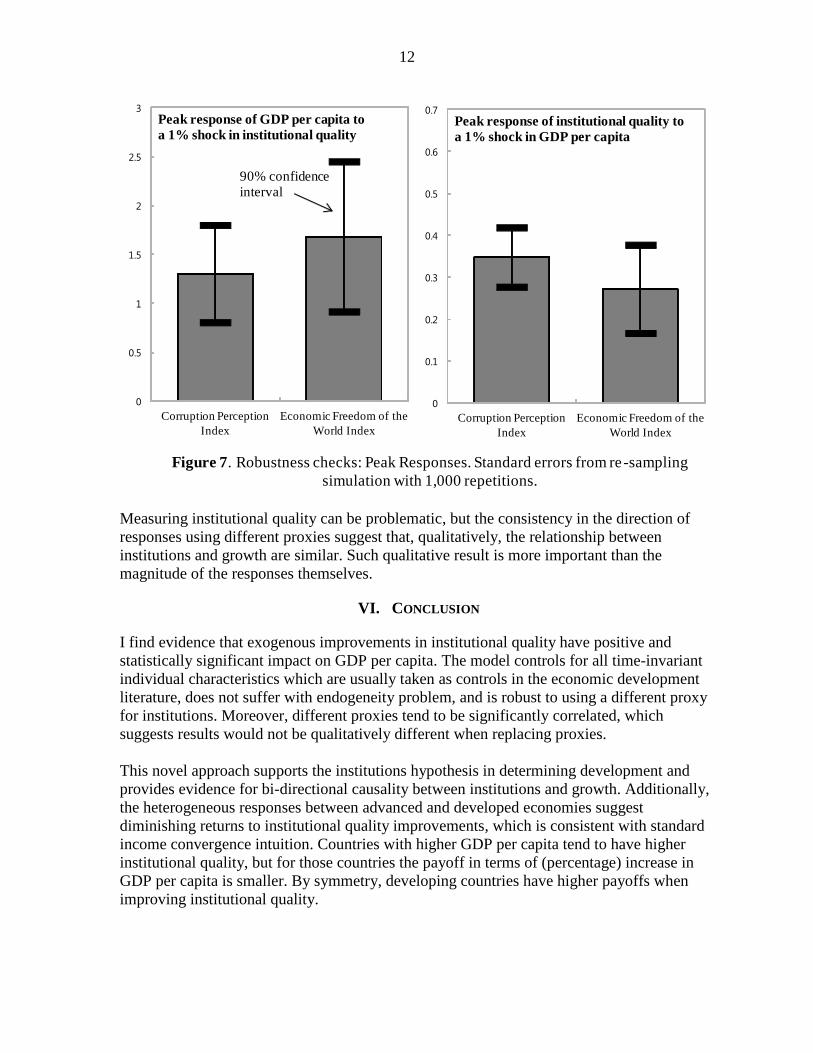
The peak response of GDP per capita to a 1 percent shock in institutional quality leads is 1.3
percent, slightly smaller than the baseline model. Conversely, peak response of institutional
quality to a 1 percent shock in GDP per capita is 0.35 percent, slightly larger than the
baseline. They both fall well within the 90 percent confidence interval of the baseline model.
I present results in the charts below.
-3
-2
-1
0
1
2
3
4
5
6
7
8
0 1 2 3 4 5 6 7 8 9 10
Response of GDP per capita to
a 1% shock in institutional quality
Years after shock
-2.5
-2
-1.5
-1
-0.5
0
0.5
1
1.5
2
2.5
3
0 1 2 3 4 5 6 7 8 9 10
Response of institutional quality to
a 1% shock in institutional quality
Years after shock
-1
-0.5
0
0.5
1
1.5
2
0 1 2 3 4 5 6 7 8 9 10
Response of GDP per capita to
a 1% shock in GDP per capita
Years after shock
90% confidence
interval
-0.8
-0.6
-0.4
-0.2
0
0.2
0.4
0.6
0 1 2 3 4 5 6 7 8 9 10
Response of institutional quality to
a 1% shock in GDP per capita
Years after shock
Figure 6. Impulse Response Functions, Developing Countries. Calculated from
GMM/IV Panel VAR (N = 94, T = 10). Standard errors from re-sampling simulation
with 1,000 repetitions.
12
Measuring institutional quality can be problematic, but the consistency in the direction of
responses using different proxies suggest that, qualitatively, the relationship between
institutions and growth are similar. Such qualitative result is more important than the
magnitude of the responses themselves.
VI. CONCLUSION
I find evidence that exogenous improvements in institutional quality have positive and
statistically significant impact on GDP per capita. The model controls for all time-invariant
individual characteristics which are usually taken as controls in the economic development
literature, does not suffer with endogeneity problem, and is robust to using a different proxy
for institutions. Moreover, different proxies tend to be significantly correlated, which
suggests results would not be qualitatively different when replacing proxies.
This novel approach supports the institutions hypothesis in determining development and
provides evidence for bi-directional causality between institutions and growth. Additionally,
the heterogeneous responses between advanced and developed economies suggest
diminishing returns to institutional quality improvements, which is consistent with standard
income convergence intuition. Countries with higher GDP per capita tend to have higher
institutional quality, but for those countries the payoff in terms of (percentage) increase in
GDP per capita is smaller. By symmetry, developing countries have higher payoffs when
improving institutional quality.
0
0.5
1
1.5
2
2.5
3
Corruption Perception
Index
Economic Freedom of the
World Index
Peak response of GDP per capita to
a 1% shock in institutional quality
90% confidenceinterval
Figure 7. Robustness checks: Peak Responses. Standard errors from re-sampling
simulation with 1,000 repetitions.
0
0.1
0.2
0.3
0.4
0.5
0.6
0.7
Corruption Perception
Index
Economic Freedom of the
World Index
Peak response of institutional quality to
a 1% shock in GDP per capita

13
Appendix
I use a resampling algorithm with the following steps:
1. I draw a random k-dimensional vector , where and all follow
a discrete uniform distribution , where is the number of cross-
sections in the sample. I set k to 10 percent of the sample size plus one cross-section
( ) and truncate the result by discarding any decimal points.
2. I exclude k cross-sections from our original sample, thus restricting the sample to
observations.
3. I re-estimate the model with the restricted sample, collect the matrices of responses,
extract individual vectors for each IRF and organize the simulated IRFs into a
separate matrix for each m endogenous variable.
4. After I repeat this procedure times the result will be two distribution
matrices D:
where m is the response variable, h is the response horizon, and n is the number
of repetitions of the simulation exercise.
5. From I take the square root of the second moment of each row to build a vector of
standard errors:

14
REFERENCES
Acemoglu, Daron, Simon Johnson, and James A. Robinson, 2001, “The Colonial Origins of
Comparative Development: An Empirical Investigation,” The American Economic
Review, Vol. 91 No. 5.
Arellano, Manuel and Stephen Bond, 1991, “Some Tests of Specification for Panel Data:
Monte Carlo Evidence and an Application to Employment Equations,” The Review of
Economic Studies, Vol. 58 No. 2.
Canova, Fabio and Matteo Ciccarelli, 2013, “Panel Vector Autoregression: A Survey,”
Working Paper 1507, European Central Bank.
Eldridge, Madeline, 2013, “The Smithian Roots of the Institutions Hypothesis,” George
Mason University, Mimeo.
Gwartney, James, Robert Lawson, and Joshua Hall, 2014, “Economic Freedom of the World:
2014 — Annual Report,” (Vancouver: Fraser Institute).
Lutkepöhl, Helmut, 2007, “New Introduction to Multiple Time Series Analysis,”( Berlin:
Springer).
Nickel, Stephen, 1981, “Biases in Dynamic Models with Fixed Effects,” Econometrica,
Vol. 49. No. 6, pp. 1417–26.
Sachs, Jeffrey, 2003, “Institutions Don’t Rule: Direct Effects of Geography on Per Capita
Income,” NBER Working Paper No. 9490 (Cambridge, Massachusetts: National
Bureau of Economic Research).