Institutional presentation 2012
33
1 INSTITUTIONAL PRESENTATION Financial and Operational Results December 31 st , 2012
Transcript of Institutional presentation 2012
1
INSTITUTIONAL PRESENTATION
Financial and Operational Results
December 31st, 2012
Disclaimer
The statements contained in this report regarding the outlook on business,
estimations on financial and operational results and growth prospects for COMGÁS
are merely estimations and, as such, are based exclusively on management
expectations regarding future events and tendencies, that affect or may affect the
business. These estimations are subject to many risks and uncertainties and are
made considering the information currently available, and depend, substancially on
market conditions, the Brazilian economys performance, the business sector and
international markets, and are therefore subject to change without pior notice.
Because of these uncertainties, the investor should not make any investment
decisions based on these estimations and declarations on future operations.
Company Overview
4
History
1872: The British company San Paulo Gas receives authorization to explore the concession of public services of
ilumination in São Paulo;
1912: The Canadian company Light assumes ownership;
1959: The company is nationalized and renamed Companhia Paulista de Serviços de Gás (Comgás);
1968: The joint-stock company is incorporated under the control of the city government and is named
Comgás;
1984: Comgás is taken over by Companhia Energética de São Paulo (CESP), the state-owned power utility;
1996: The company goes public and is traded on the São Paulo Stock Exchange (Bovespa) beginning in 1997;
1999: PRIVATIZATION: The consortium formed by British Gas and Shell obtain a controlling stake in Comgás;
2010: Comgás is consolidated as Brazil’s largest natural gas distributor responsible for more than 30% of the
sales of natural gas in the country;
2011: Comgás reached customer 1,000,000;
2012: Cosan aquires 60.1% of Comgás’ social capital from British Gas (BG)
The Company’s Course
Regulada ...
5
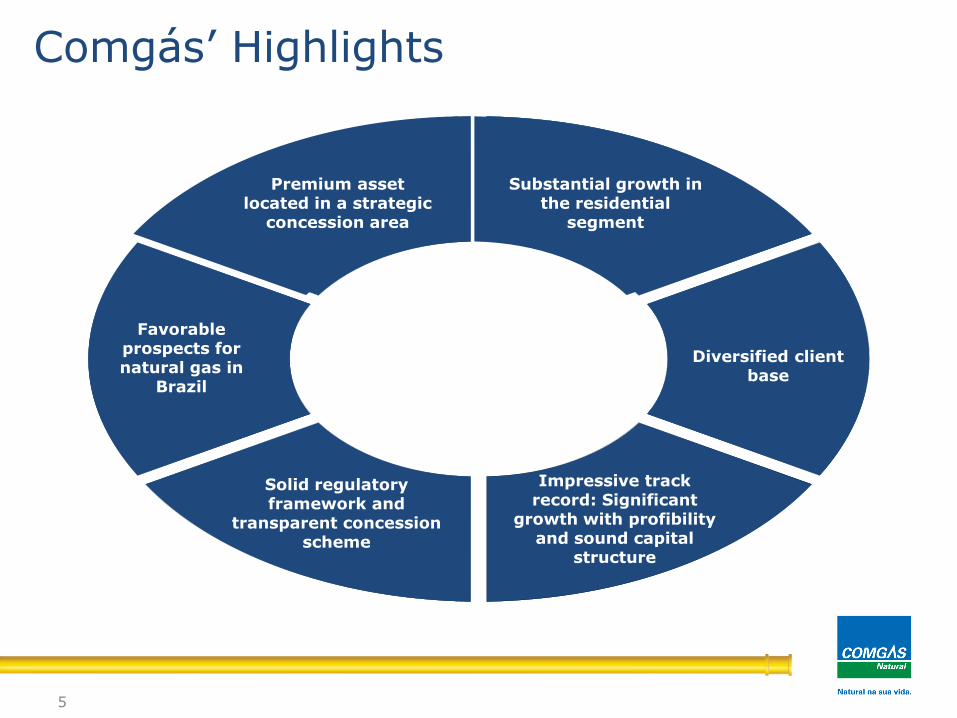
Comgás’ Highlights
Premium asset locatedin a strategic concession
area
Substantial growth in theresidential segment
Diversified clientbase
Impressive trackrecord: Significant
growth with profibilityand sound capital
structure
Solid regulatoryframework and
transparent concessionscheme
Favorableprospects for natural gas in
Brazil
Premium assetlocated in a strategic
concession area
Substantial growth in the residential
segment
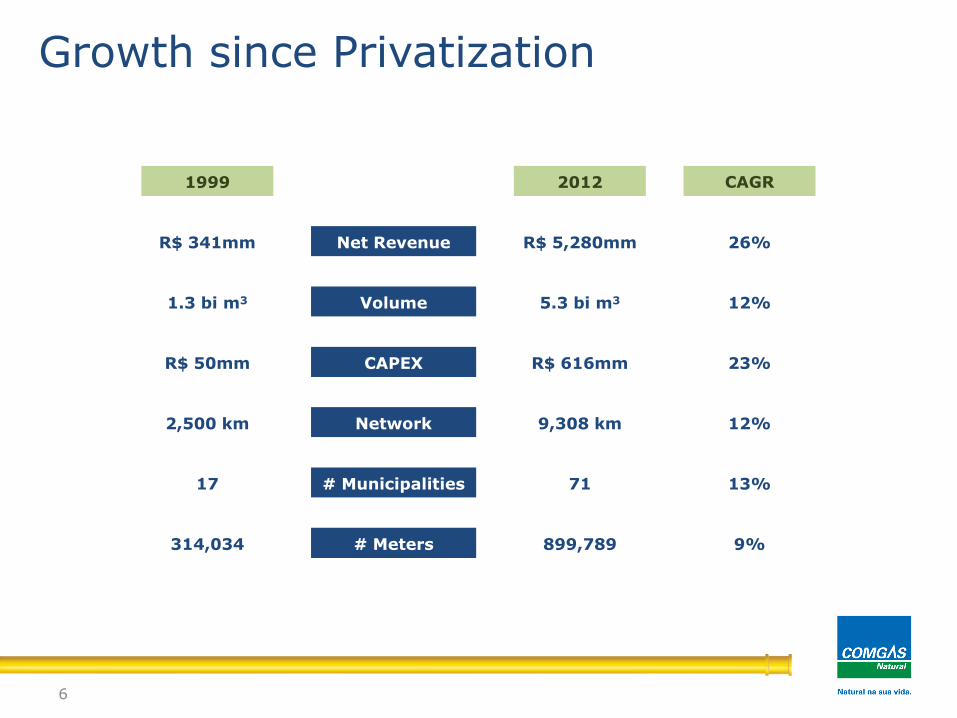
1999 2012 CAGR
R$ 341mm Net Revenue R$ 5,280mm 26%
1.3 bi m3 Volume 5.3 bi m3 12%
R$ 50mm CAPEX R$ 616mm 23%
2,500 km Network 9,308 km 12%
17 # Municipalities 71 13%
314,034 # Meters 899,789 9%
6
Growth since Privatization
Comgás: uma combinação de competências e princípios
7
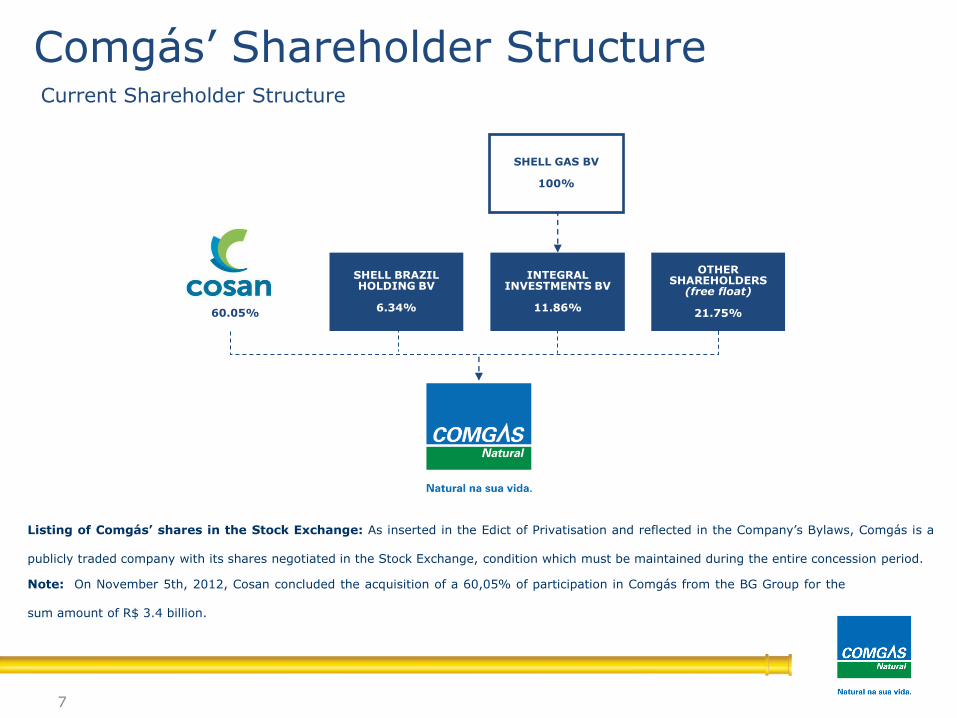
SHELL BRAZIL HOLDING BV
6.34%
INTEGRAL INVESTMENTS BV
11.86%
SHELL GAS BV
100%
OTHER SHAREHOLDERS
(free float)
21.75%60.05%
Note: On November 5th, 2012, Cosan concluded the acquisition of a 60,05% of participation in Comgás from the BG Group for the
sum amount of R$ 3.4 billion.
Comgás’ Shareholder StructureCurrent Shareholder Structure
Listing of Comgás’ shares in the Stock Exchange: As inserted in the Edict of Privatisation and reflected in the Company’s Bylaws, Comgás is a
publicly traded company with its shares negotiated in the Stock Exchange, condition which must be maintained during the entire concession period.
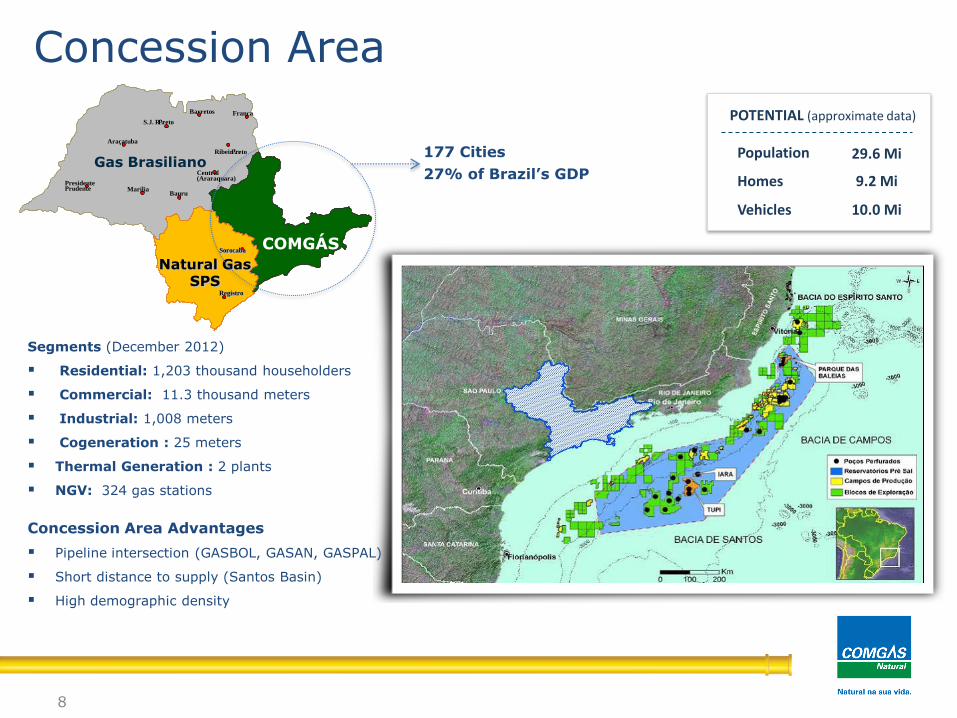
177 Cities
27% of Brazil’s GDP
Área de concessão
Segments (December 2012)
Residential: 1,203 thousand householders
Commercial: 11.3 thousand meters
Industrial: 1,008 meters
Cogeneration : 25 meters
Thermal Generation : 2 plants
NGV: 324 gas stations
Gas Brasiliano
PresidentePresidentePrudentePrudente
AraçatubaAraçatuba
S.J. Rio S.J. Rio PretoPreto
MaríliaMaríliaBauruBauru
CentralCentral(Araraquara)(Araraquara)
RibeirãoRibeirãoPretoPreto
FrancaFrancaBarretosBarretos
Natural GasSPS
RegistroRegistro
SorocabaSorocabaCOMGÁS
8
Concession Area Advantages
Pipeline intersection (GASBOL, GASAN, GASPAL)
Short distance to supply (Santos Basin)
High demographic density
Population 29.6 Mi
Homes 9.2 Mi
Vehicles 10.0 Mi
POTENTIAL (approximate data)
Concession Area
9
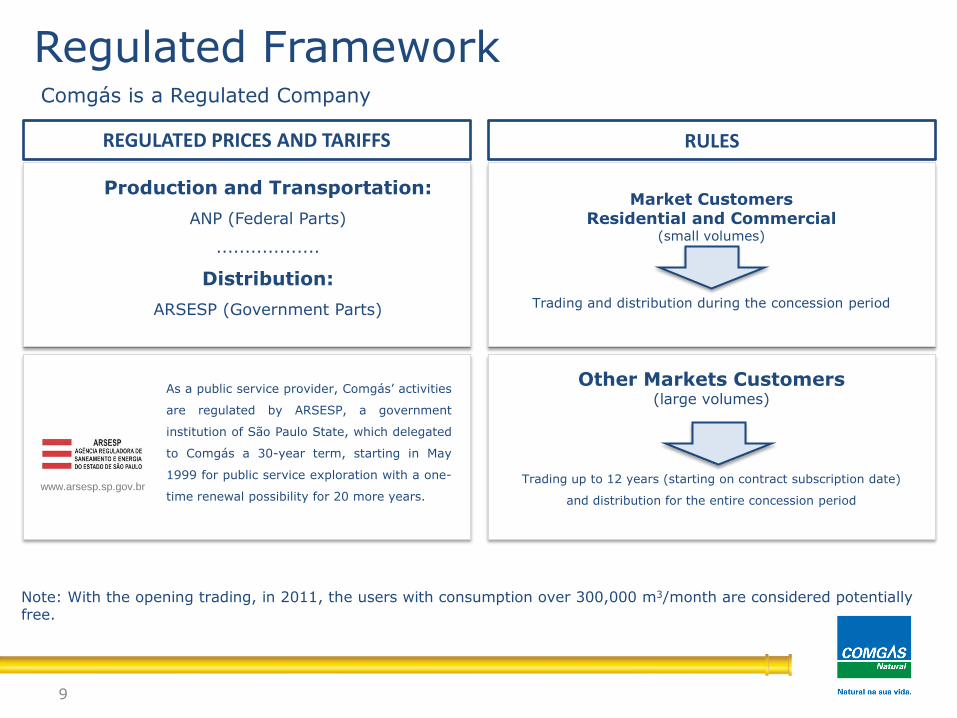
Note: With the opening trading, in 2011, the users with consumption over 300,000 m3/month are considered potentiallyfree.
Market CustomersResidential and Commercial
(small volumes)
Trading and distribution during the concession period
Other Markets Customers (large volumes)
Trading up to 12 years (starting on contract subscription date)
and distribution for the entire concession period
Production and Transportation:
ANP (Federal Parts)
..................
Distribution:
ARSESP (Government Parts)
www.arsesp.sp.gov.br
As a public service provider, Comgás’ activities
are regulated by ARSESP, a government
institution of São Paulo State, which delegated
to Comgás a 30-year term, starting in May
1999 for public service exploration with a one-
time renewal possibility for 20 more years.
REGULATED PRICES AND TARIFFS RULES
Regulated FrameworkComgás is a Regulated Company
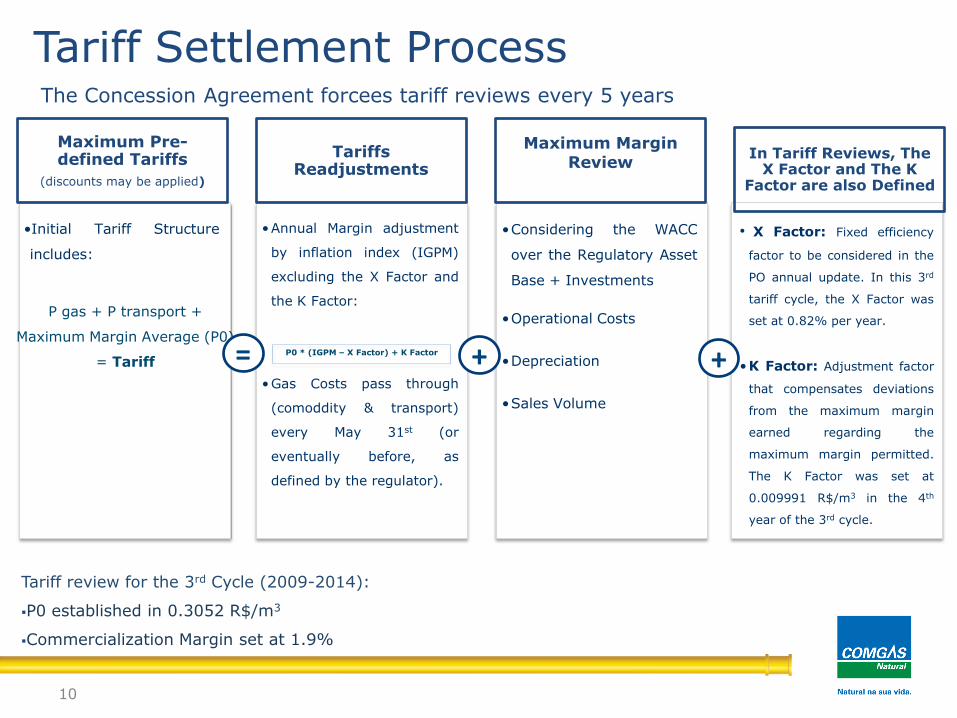
The Concession Agreement forcees tariff reviews every 5 years
10
Maximum MarginReview
•Considering the WACC
over the Regulatory Asset
Base + Investments
•Operational Costs
•Depreciation
•Sales Volume
Maximum Pre-defined Tariffs
(discounts may be applied)
•Initial Tariff Structure
includes:
TariffsReadjustments
•Annual Margin adjustment
by inflation index (IGPM)
excluding the X Factor and
the K Factor:
•Gas Costs pass through
(comoddity & transport)
every May 31st (or
eventually before, as
defined by the regulator).
In Tariff Reviews, TheX Factor and The K
Factor are also Defined
• X Factor: Fixed efficiency
factor to be considered in the
PO annual update. In this 3rd
tariff cycle, the X Factor was
set at 0.82% per year.
•K Factor: Adjustment factor
that compensates deviations
from the maximum margin
earned regarding the
maximum margin permitted.
The K Factor was set at
0.009991 R$/m3 in the 4th
year of the 3rd cycle.
P gas + P transport +
Maximum Margin Average (P0)
= TariffP0 * (IGPM – X Factor) + K Factor
Tariff review for the 3rd Cycle (2009-2014):
P0 established in 0.3052 R$/m3
Commercialization Margin set at 1.9%
= + +
Tariff Settlement Process
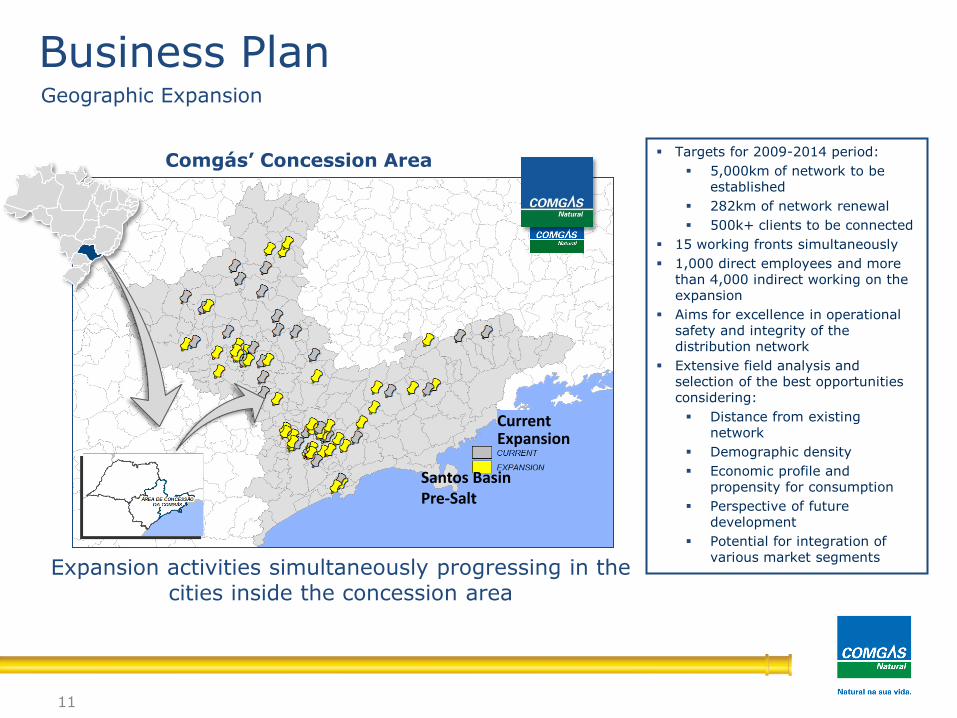
Santos Basin Pre-Salt
CurrentExpansion
Comgás’ Concession Area
Expansion activities simultaneously progressing in the cities inside the concession area
Targets for 2009-2014 period:
5,000km of network to be established
282km of network renewal
500k+ clients to be connected
15 working fronts simultaneously
1,000 direct employees and more than 4,000 indirect working on the expansion
Aims for excellence in operational safety and integrity of the distribution network
Extensive field analysis and selection of the best opportunities considering:
Distance from existing network
Demographic density
Economic profile and propensity for consumption
Perspective of future development
Potential for integration of various market segments
11
Business PlanGeographic Expansion
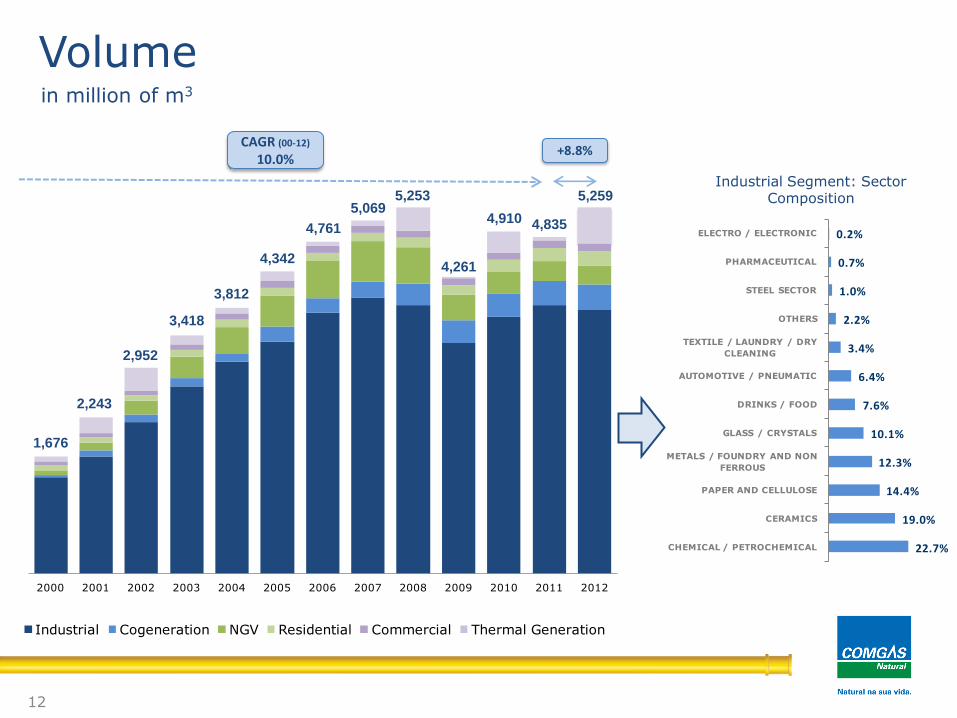
2000 2001 2002 2003 2004 2005 2006 2007 2008 2009 2010 2011 2012
Industrial Segment: Sector Composition
CAGR (00-12)
10.0%
1,676
2,243
2,952
3,418
3,812
4,342
4,761
5,069
4,261
5,253 5,259
4,8354,910
+8.8%
12
Volumein million of m3
72,0%
6,8%
5,2%
3,8%
2,1%
10,0%
Industrial Cogeneration NGV Residential Commercial Thermal Generation
22.7%
19.0%
14.4%
12.3%
10.1%
7.6%
6.4%
3.4%
2.2%
1.0%
0.7%
0.2%
CHEMICAL / PETROCHEMICAL
CERAMICS
PAPER AND CELLULOSE
METALS / FOUNDRY AND NON
FERROUS
GLASS / CRYSTALS
DRINKS / FOOD
AUTOMOTIVE / PNEUMATIC
TEXTILE / LAUNDRY / DRY
CLEANING
OTHERS
STEEL SECTOR
PHARMACEUTICAL
ELECTRO / ELECTRONIC
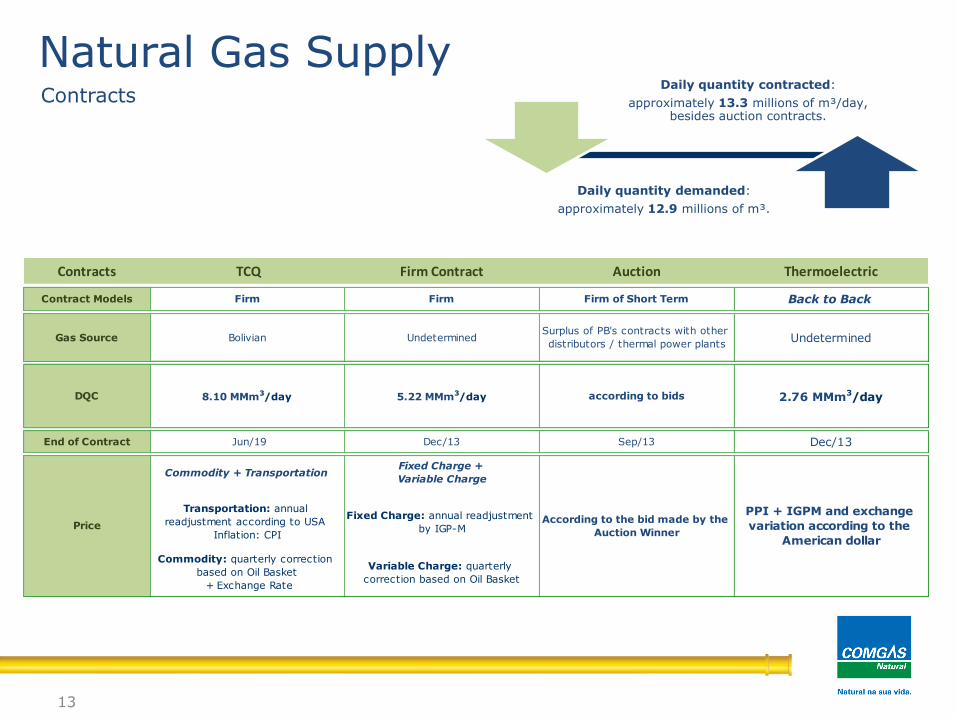
Fornecimento de Gás Natural: CONTRATOS
13
Daily quantity contracted:
approximately 13.3 millions of m³/day, besides auction contracts.
Daily quantity demanded:
approximately 12.9 millions of m³.
Contracts
Natural Gas Supply
Contracts TCQ Firm Contract Auction Thermoelectric
Contract Models Firm Firm Firm of Short Term Back to Back
Gas Source Bolivian UndeterminedSurplus of PB's contracts with other
distributors / thermal power plantsUndetermined
End of Contract Jun/19 Dec/13 Sep/13 Dec/13
Commodity + TransportationFixed Charge +
Variable Charge
Transportation: annual
readjustment according to USA
Inflation: CPI
Fixed Charge: annual readjustment
by IGP-M
Commodity: quarterly correction
based on Oil Basket
+ Exchange Rate
Variable Charge: quarterly
correction based on Oil Basket
2.76 MMm3/day
PPI + IGPM and exchange
variation according to the
American dollar
DQC
Price
8.10 MMm3/day 5.22 MMm3/day according to bids
According to the bid made by the
Auction Winner
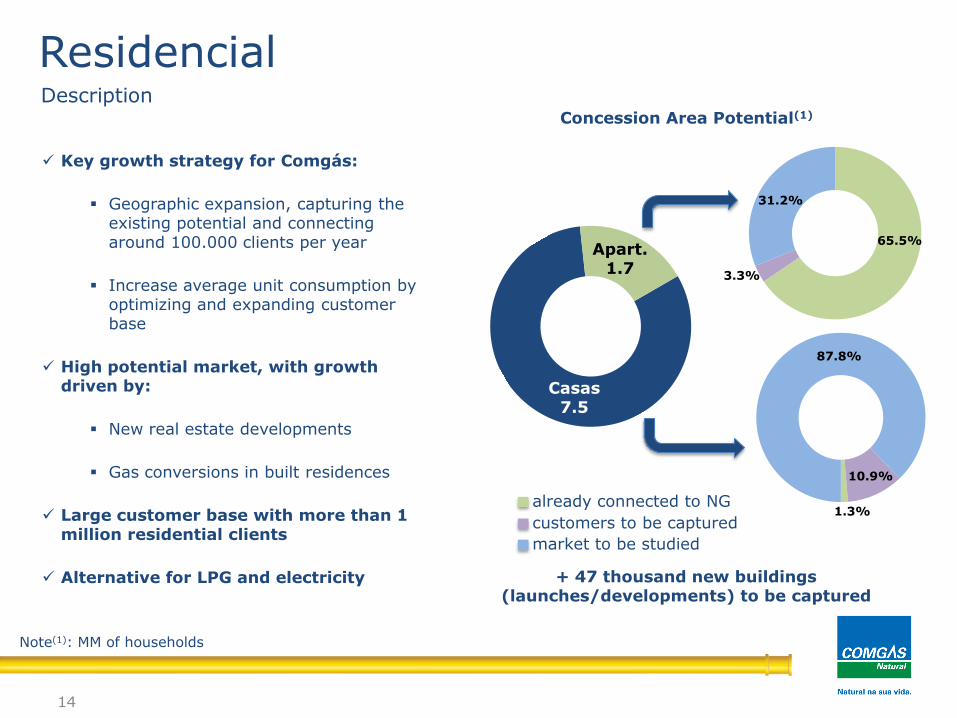
Key growth strategy for Comgás:
Geographic expansion, capturing the existing potential and connecting around 100.000 clients per year
Increase average unit consumption by optimizing and expanding customer base
High potential market, with growth driven by:
New real estate developments
Gas conversions in built residences
Large customer base with more than 1 million residential clients
Alternative for LPG and electricity
Concession Area Potential(1)
14
+ 47 thousand new buildings (launches/developments) to be captured
ResidencialDescription
Note(1): MM of households
Casas7.5
Apart.1.7
31.2%
65.5%
3.3%
87.8%
10.9%
1.3%customers to be captured
market to be studied
already connected to NG
15
IndustrialDescription
Comgás is present in all of the relevant industries in the concession area;
A diversified customer base with more than 1,000 corporate clients;
A multi-use product: from the production of heat and low-pressure steam to more
complex processes;
Many advantages compared to other fuels:
No storage requirements
Environmental issues
Guarantee of supply
Low operational costs
Growth Strategy:
Maintain a strong consumer base with future growth in line with growth in GDP / industrial
production
Approach small and medium enterprises (SMEs) to anchor expansion projects
Bring new industrial corporate clients into the concession area
Natural gas vehicle (NGV) may be used as fuel for both individual and mass
transportation;
Stands out for savings and environmental benefits:
Currently, it is more cost competitive than gasoline and ethanol
Strong economic benefit for heavy users
Comgás is currently working with the government to implement public policies that
should benefit the sector:
Fiscal incentives (IPVA reduction)
Public transportation policy
Growth Strategy:
Project in development: use of NGV in public transportation and other heavy users
16
Natural Gas Vehicle- NGVDescription
Over 11.1 thousand clients;
Focus on medium and large establishments;
Growth platform integrated with the expansion of the residential segment;
New applications have a high development potential:
Emerging market with high consumption potential
Structure dedicated in developing non conventional application development: acclimatization,
commercial cogeneration and generation during peak hours
17
CommercialDescription
Cogeneration:
Industrial strategic decision aiming efficiency and energy security in the medium and
long term
Sustainable growth depends on firm gas supply and price visibility vis-a-vis electricity
Market with a high potential development
Thermal Generation:
Demand depends on the level of thermal dispatch (determined by the government)
Back to back gas contracts
18
Cogeneration and Thermal GenerationDescription
Financial and Operational Highlights
20
Highlights
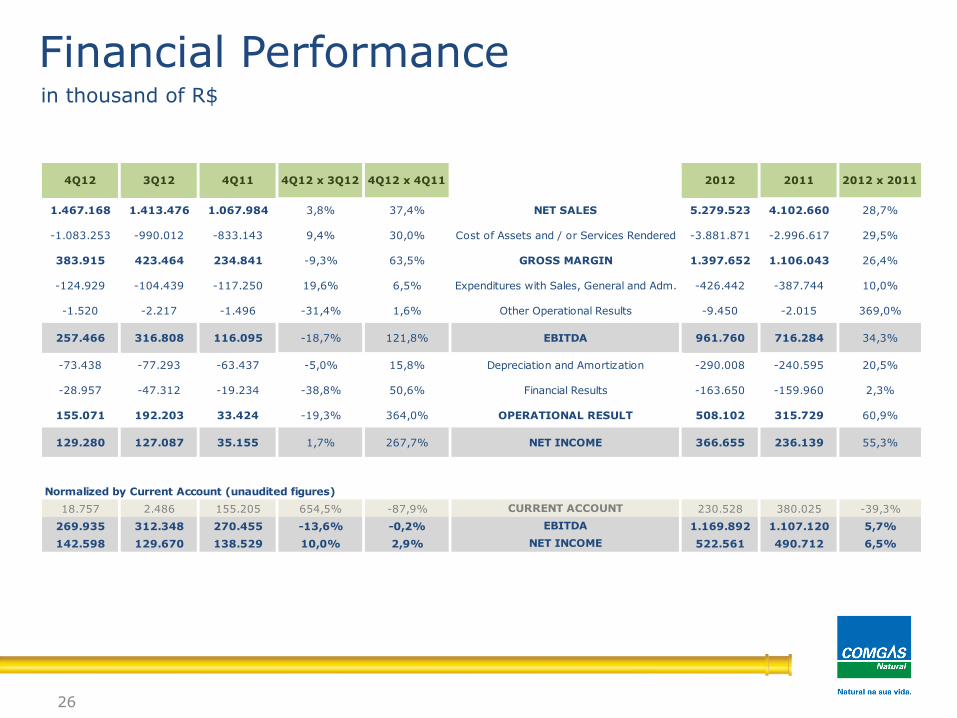
Record volume: the total volume distributed was 5,259mm³, 8.8% above that of 2011;
Record investments: R$ 616 million in 2012, in which R$ 189 million were invested during the 4Q2012;
Record residential connections: 115 thousand new households connected during the year;
Record network extension: 1,282 km of network built during the year;
Record revenue: R$ 6,5bi of gross revenue and R$ 5,3bi of net sales during the year;
Extraordinary tariff adjustment: because of the dollar volatility and consequent raise of gas cost, on 11/29
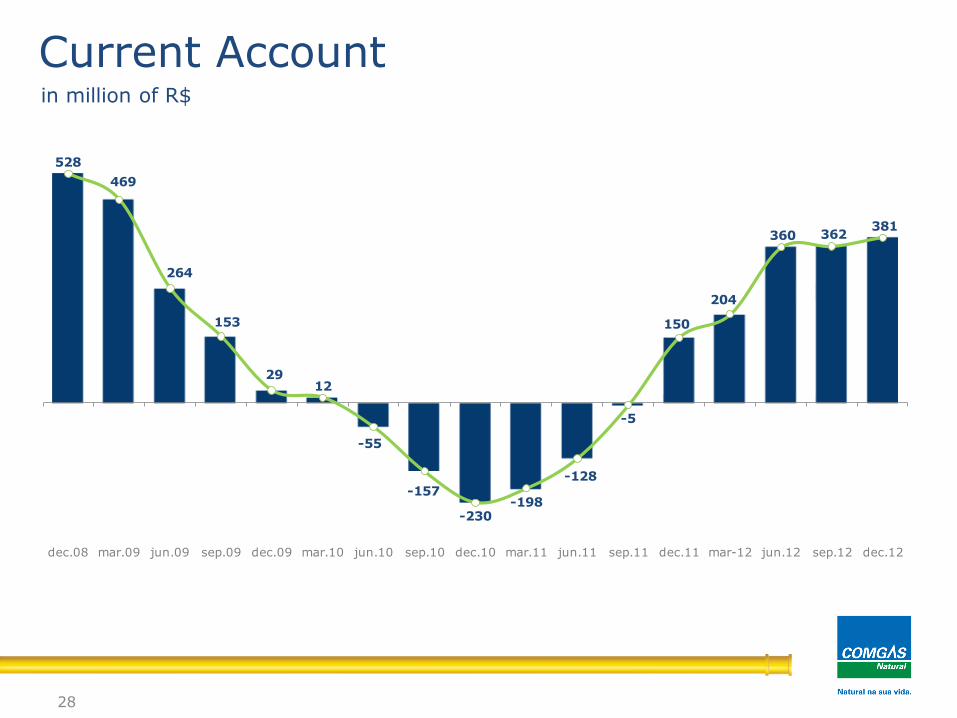
ARSESP authorized new tariffs. Despite the adjustment, the account balance closed the year in R$ 381mm;
Funding: on October 2nd, a long term funding contract was signed with BNDES, of the sum total of R$ 1.1
billion;
ARSESP’s approval: transfer of 60.1% of BG’s participation in Comgás to Provence Participações S.A.
(company controlled by Cosan S.A. Indústria e Comércio);
Incorporation: in December, Provence Participações S.A. was incorporated by Comgás, resulting in the
amount of R$ 844mm recorded as a deferred tax.
Year of 2012
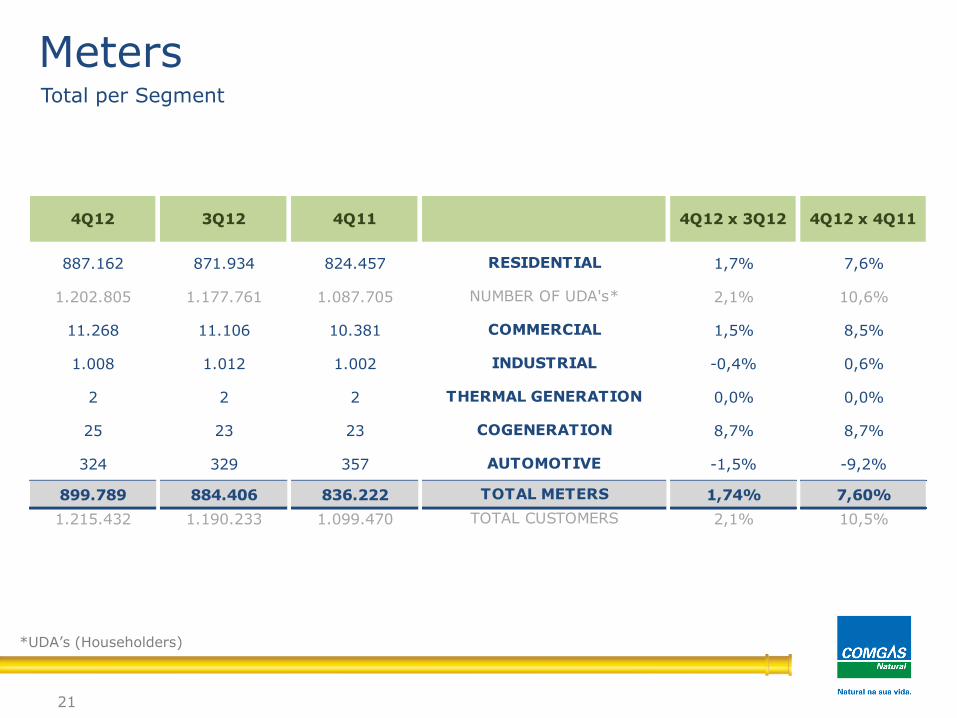
Meters
21
Total per Segment
*UDA’s (Householders)
887.162 871.934 824.457 1,7% 7,6%
1.202.805 1.177.761 1.087.705 2,1% 10,6%
11.268 11.106 10.381 1,5% 8,5%
1.008 1.012 1.002 -0,4% 0,6%
2 2 2 0,0% 0,0%
25 23 23 8,7% 8,7%
324 329 357 -1,5% -9,2%
899.789 884.406 836.222 1,74% 7,60%
1.215.432 1.190.233 1.099.470 2,1% 10,5%
4Q12 4Q11
THERMAL GENERATION
INDUSTRIAL
3Q12 4Q12 x 4Q11
RESIDENTIAL
NUMBER OF UDA's*
COMMERCIAL
4Q12 x 3Q12
COGENERATION
AUTOMOTIVE
TOTAL METERS
TOTAL CUSTOMERS
22
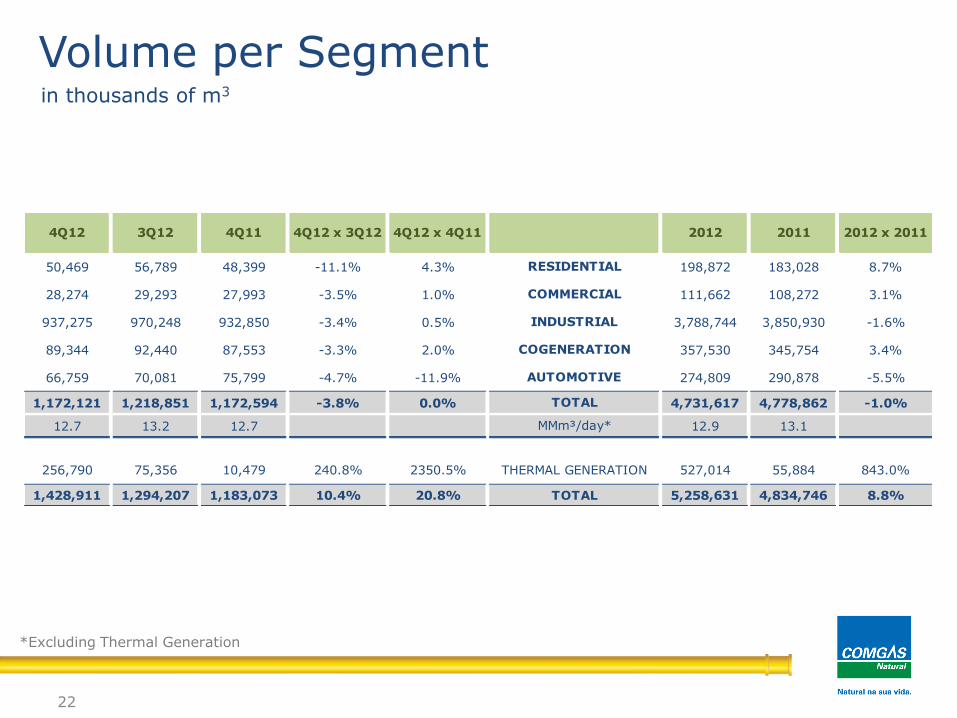
Volume per Segmentin thousands of m3
*Excluding Thermal Generation
50,469 56,789 48,399 -11.1% 4.3% 198,872 183,028 8.7%
28,274 29,293 27,993 -3.5% 1.0% 111,662 108,272 3.1%
937,275 970,248 932,850 -3.4% 0.5% 3,788,744 3,850,930 -1.6%
89,344 92,440 87,553 -3.3% 2.0% 357,530 345,754 3.4%
66,759 70,081 75,799 -4.7% -11.9% 274,809 290,878 -5.5%
1,172,121 1,218,851 1,172,594 -3.8% 0.0% 4,731,617 4,778,862 -1.0%
12.7 13.2 12.7 12.9 13.1
256,790 75,356 10,479 240.8% 2350.5% 527,014 55,884 843.0%
1,428,911 1,294,207 1,183,073 10.4% 20.8% 5,258,631 4,834,746 8.8%
AUTOMOTIVE
4Q12 x 3Q12 4Q12 x 4Q11
COMMERCIAL
TOTAL
INDUSTRIAL
COGENERATION
4Q11
TOTAL
MMm³/day*
THERMAL GENERATION
4Q12 3Q12
RESIDENTIAL
2012 2011 2012 x 2011
72%
7%
5%
4%
2%
10%
56%
4%
3%
27%
9%
1%
23
Margin x Volume
Margin Volume
in IFRS
5.3 bi m³1.4 bi R$
72,0%
6,8%
5,2%
3,8%
2,1%
10,0%
Industrial Cogeneration NGV Residential Commercial Thermal Generation
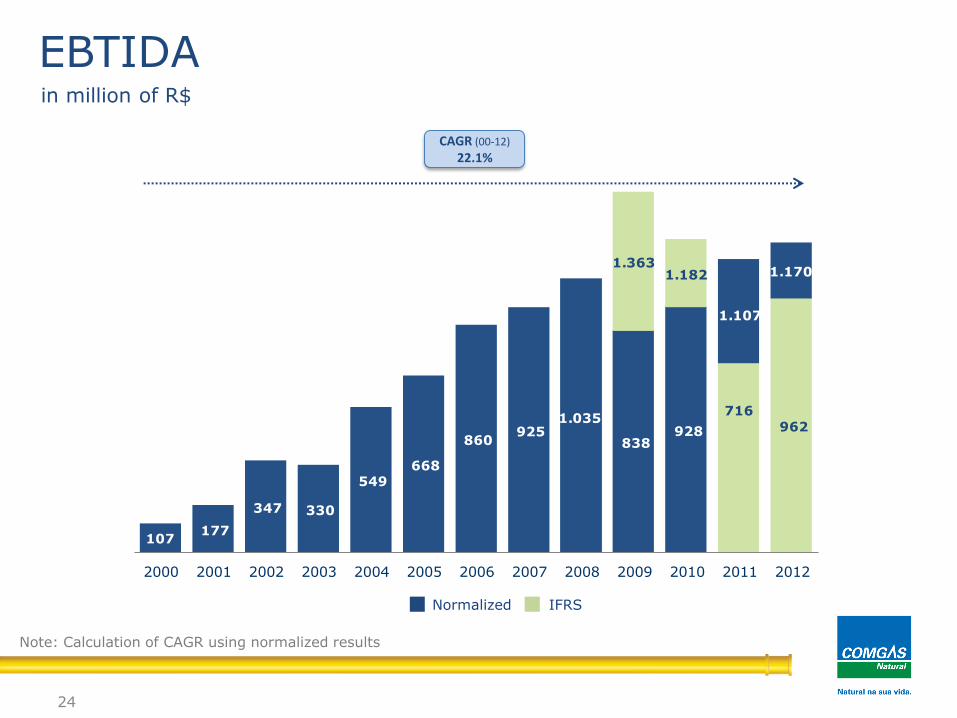
107 177
347 330
549 668
860 925
1.035
838 928
1.107
962
1.363 1.182
716
1.170
2000 2001 2002 2003 2004 2005 2006 2007 2008 2009 2010 2011 2012
24
CAGR (00-12)
22.1%
EBTIDAin million of R$
Normalized IFRS
Note: Calculation of CAGR using normalized results
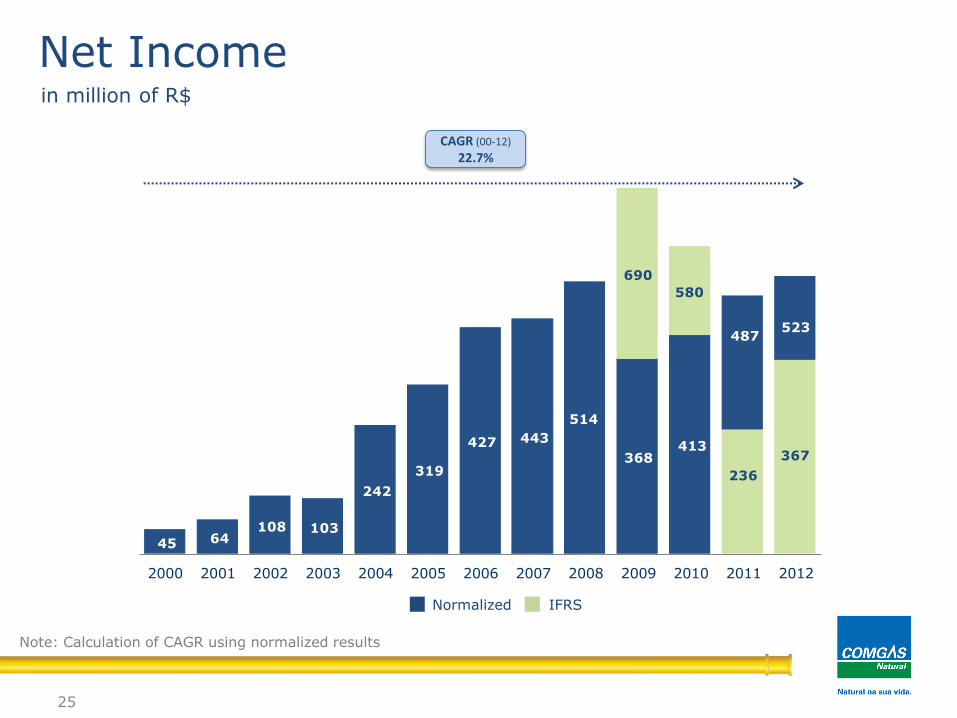
45 64 108 103
242
319
427 443
514
368 413
487
367
690
580
236
523
2000 2001 2002 2003 2004 2005 2006 2007 2008 2009 2010 2011 2012
25
Net Incomein million of R$
CAGR (00-12)
22.7%
Normalized IFRS
Note: Calculation of CAGR using normalized results
26
Financial Performancein thousand of R$
1.467.168 1.413.476 1.067.984 3,8% 37,4% 5.279.523 4.102.660 28,7%
-1.083.253 -990.012 -833.143 9,4% 30,0% -3.881.871 -2.996.617 29,5%
383.915 423.464 234.841 -9,3% 63,5% 1.397.652 1.106.043 26,4%
-124.929 -104.439 -117.250 19,6% 6,5% -426.442 -387.744 10,0%
-1.520 -2.217 -1.496 -31,4% 1,6% -9.450 -2.015 369,0%
257.466 316.808 116.095 -18,7% 121,8% 961.760 716.284 34,3%
-73.438 -77.293 -63.437 -5,0% 15,8% -290.008 -240.595 20,5%
-28.957 -47.312 -19.234 -38,8% 50,6% -163.650 -159.960 2,3%
155.071 192.203 33.424 -19,3% 364,0% 508.102 315.729 60,9%
129.280 127.087 35.155 1,7% 267,7% 366.655 236.139 55,3%
Normalized by Current Account (unaudited figures)
18.757 2.486 155.205 654,5% -87,9% 230.528 380.025 -39,3%
269.935 312.348 270.455 -13,6% -0,2% 1.169.892 1.107.120 5,7%
142.598 129.670 138.529 10,0% 2,9% 522.561 490.712 6,5%
4Q12
EBITDA
4Q12 x 3Q12
OPERATIONAL RESULT
NET SALES
Cost of Assets and / or Services Rendered
Expenditures with Sales, General and Adm.
GROSS MARGIN
Depreciation and Amortization
3Q12 4Q11
Financial Results
Other Operational Results
NET INCOME
NET INCOME
CURRENT ACCOUNT
EBITDA
4Q12 x 4Q11 2012 x 20112012 2011
27
Financial IndicatorsAnnualized figures
18,84 12,38 10,40 18,84 10,40
3,06 4,24 1,97 3,06 1,97
0,97 1,35 1,47 0,97 1,47
2,28 2,45 2,56 2,28 2,56
0,39 0,40 0,22 0,39 0,22
0,58 0,59 0,59 0,58 0,59
26,2% 30,0% 22,0% 26,5% 27,0%
17,5% 22,4% 10,9% 18,2% 17,5%
8,8% 9,0% 3,3% 6,9% 5,8%
6,1% 10,3% 5,5% 6,1% 5,5%
16,2% 34,3% 18,9% 16,2% 18,9%
Normalized by Current Account (unaudited figures)
30,1% 32,0% 39,8% 33,2% 39,6%
20,5% 23,9% 27,7% 24,2% 29,3%
10,8% 9,9% 14,2% 10,8% 13,0%
4Q12 3Q12 4Q11
Return on Assets (%)
Return on Equity (%)
Gross Margin (%)
Net Debt over Equity (x)
Net Debt over EBITDA (x)
Short Term Debt over Total Debt (x)
Current Ratio (x)
Gross Margin (%)
Net Margin (%)
EBITDA Margin (%)
2012 2011
Equity per share ($)
Earnings per share ($)
EBITDA Margin (%)
Net Margin (%)
28
Current Accountin million of R$
528
469
264
153
2912
-55
-157
-230-198
-128
-5
150
204
360 362 381
dec.08 mar.09 jun.09 sep.09 dec.09 mar.10 jun.10 sep.10 dec.10 mar.11 jun.11 sep.11 dec.11 mar-12 jun.12 sep.12 dec.12
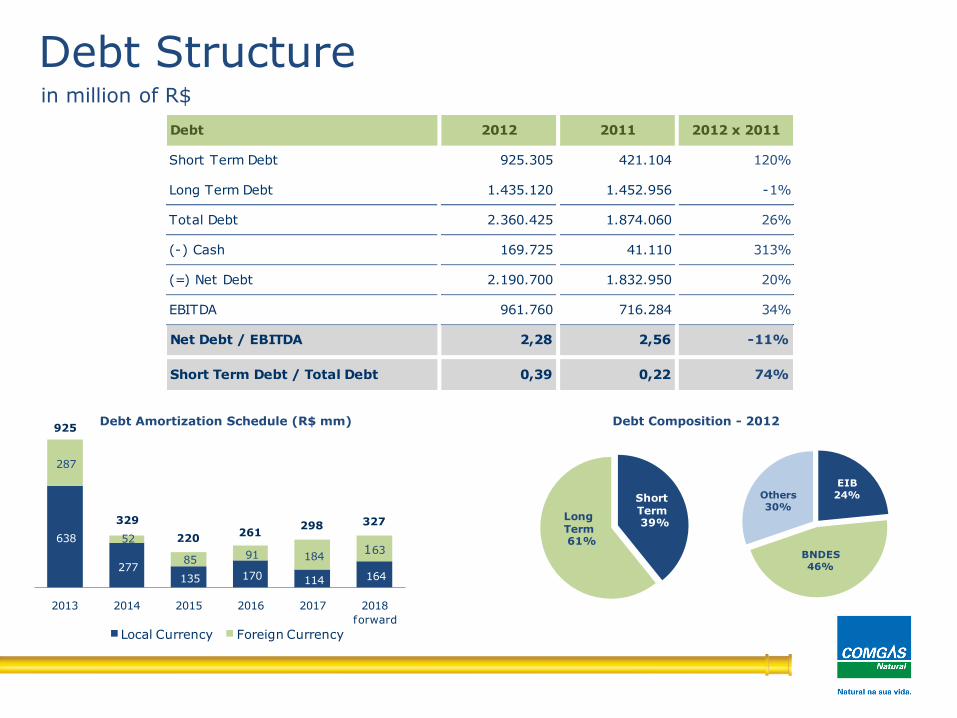
EIB 24%
BNDES46%
Others 30%
Long Term61%
Short Term39%
638
277 135 170 114 164
287
52
85 91 184163
2013 2014 2015 2016 2017 2018
forward
Local Currency Foreign Currency
Estrutura de Endividamento
329
220261
298 327
925
Debt Structurein million of R$
Debt Amortization Schedule (R$ mm) Debt Composition - 2012
Debt 2012 2011 2012 x 2011
Short Term Debt 925.305 421.104 120%
Long Term Debt 1.435.120 1.452.956 -1%
Total Debt 2.360.425 1.874.060 26%
(-) Cash 169.725 41.110 313%
(=) Net Debt 2.190.700 1.832.950 20%
EBITDA 961.760 716.284 34%
Net Debt / EBITDA 2,28 2,56 -11%
Short Term Debt / Total Debt 0,39 0,22 74%
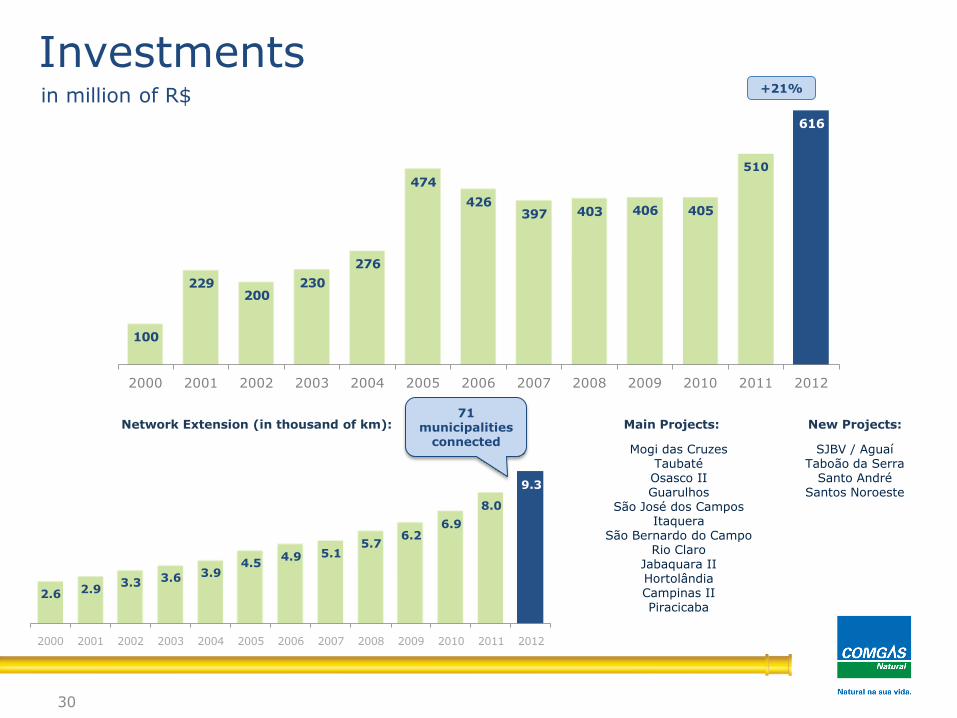
2.6 2.93.3 3.6 3.9
4.54.9 5.1
5.76.2
6.9
8.0
9.3
2000 2001 2002 2003 2004 2005 2006 2007 2008 2009 2010 2011 2012
100
229200
230
276
474
426397 403 406 405
510
616
2000 2001 2002 2003 2004 2005 2006 2007 2008 2009 2010 2011 2012
Investimentos
Main Projects:Network Extension (in thousand of km):
Mogi das CruzesTaubatéOsasco IIGuarulhos
São José dos CamposItaquera
São Bernardo do CampoRio Claro
Jabaquara IIHortolândiaCampinas IIPiracicaba
New Projects:
SJBV / AguaíTaboão da Serra
Santo AndréSantos Noroeste
30
71 municipalities
connected
Investmentsin million of R$ +21%
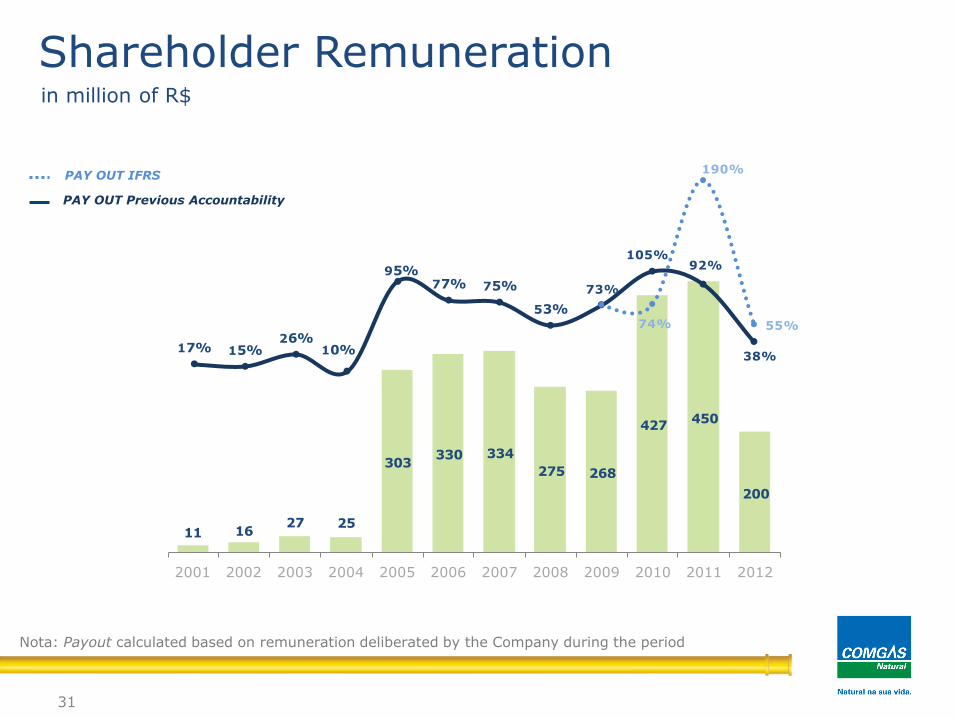
31
PAY OUT Previous Accountability
PAY OUT IFRS
Shareholder Remunerationin million of R$
Nota: Payout calculated based on remuneration deliberated by the Company during the period
11 1627 25
303330 334
275 268
427450
200
2001 2002 2003 2004 2005 2006 2007 2008 2009 2010 2011 2012
17% 15%26%
10%
95%77% 75%
53%
73%
105%92%
38%
74%
190%
55%
0
10.000
20.000
30.000
40.000
50.000
60.000
70.000
80.000
80
90
100
110
120
130
140
150
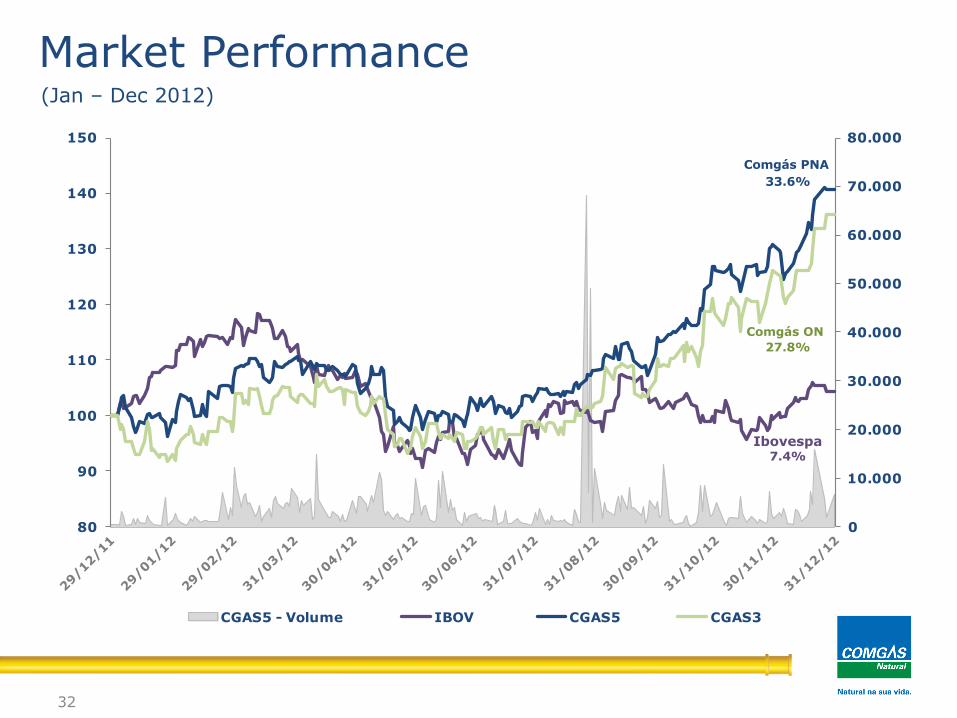
CGAS5 - Volume IBOV CGAS5 CGAS3
Ibovespa7.4%
Comgás PNA
33.6%
Comgás ON
27.8%
32
Market Performance(Jan – Dec 2012)
INVESTOR RELATIONS
www.comgas.com.br/en/investors
ROBERTO LAGE CFO and
IRO
PAULO POLEZITreasury and
Investor Relations
ANDRÉ SALGUEIROInvestor Relations
Rua Olimpíadas, nº 205, 10º floor - Vila Olímpia - CEP 04551-000 / São Paulo - SP - Brazil
33