Institutional Determinants of New Firm Entry in Russia: A Cross-Regional Analysis
10
INSTITUTIONAL DETERMINANTS OF NEW FIRM ENTRY IN RUSSIA: A CROSS-REGIONAL ANALYSIS Randolph Luca Bruno, Maria Bytchkova, and Saul Estrin* Abstract—We investigate how the regional institutional environment—in particular, the political environment—affects Russian new firm entry across regions, industries, firm size classes, and time. We find that entry rates in Russia are explained by natural entry rates and the institutional environment. Industries that are characterized by low entry barriers in developed market economies are found to have lower entry rates in regions subject to greater political fluidity, as in the case of gubernatorial change. We also find that higher levels of political fluidity and democracy increase relative entry rates for small-sized firms but reduce them for medium-sized or large ones. I. Introduction T HE entry of new firms is an important process for mar- ket economies (Caves, 1998; Bartelsman, Haltiwanger, & Scarpetta, 2004), transferring resources from low- to high-productivity activities and dissipating monopoly rents (Bartelsman, Scarpetta, & Schivardi, 2005). Entry, how- ever, is constrained by industry-specific barriers (Bain, 1968; Lofstrom, Bates, & Parker, 2011), and these may be compounded in developing economies by the weakness of political and economic institutions, which may also contri- bute to the market power of incumbents (Djankov et al., 2002). This paper investigates the effects of such institu- tions on new firm entry. Its main contribution is to move beyond standard cross-country modeling to analyze cross- regional and cross-sector entry rates within a single econ- omy, Russia. Previous studies of institutions and entry across countries have faced problems of unobserved hetero- geneity (Djankov et al., 2002). Thus, Klapper, Laeven, and Rajan (2006), who considered cross-industry, cross-country variation in entry rates, could only partially control for dif- ferences in macroeconomic policy, trading regimes, and other country-specific factors. In concentrating on regional differences, we build on Berkowitz and DeJong (2005), who show that Russian regional entrepreneurial activity is significantly associated with subsequent growth. Russia is a federation of states and subunits and, while much of the formal regulatory and institutional framework remains common, control over significant aspects is decen- tralized to the regional level. The constitution gives exclu- sive authority to the central government in the regulation of foreign trade—the legal framework of a single market as well as over financial, currency, and customs regulations (OECD, 2002). However, in most other aspects of the insti- tutional and political environment, there remains great diversity among Russian regions, and this allows us to explore the impact of institutional heterogeneity on entry rates in a novel way. This institutional heterogeneity partly arises because Russia followed a regionally differentiated process of transition to a market economy after the demise of the Soviet Union in 1991. In some regions, market- oriented reforms were introduced and implemented rapidly, in others more slowly, and in some hardly at all. As a result, the Russian context provides a natural quasi-experimental setting to investigate how institutions influence new firm entry. To exploit this, we build on ideas of Acemoglu and Johnson (2005), who link the security of property rights to democracy, in order to construct a data set that charts politi- cal and institutional change in Russia over time. On this basis, we relate the patterns of firm entry rates by industry and region to prior political changes associated with the timing and results of elections and to changes in measures of regional democracy. Our empirical investigation draws on three data sources: a comprehensive longitudinal enterprise data set, Orbis (BvD Copyright) between 1996 and 2008, and new data concerning Russian political and economic institutions at the regional level. The first new data set measures political fluidity by documenting governor turnover in the regions and has been collected from primary sources in Russia for this study. The second, which we refer to as the Petrov data, provides information about regional political democracy and economic openness (McFaul, Petrov, & Ryabov, 2004). The Orbis data set, a more comprehensive version of the Amadeus data set used by Klapper et al., (2006), enables us to measure entry at the date of incorporation of the firm rather than using the more common but less satisfactory proxy of the date when the firm enters the data set (Dunne, Roberts, & Samuelson, 1989). It also includes the smallest firms, while most studies of entry focus on firms employing more than fifty workers, though entry often takes place by the smallest firms. We also build on recent developments in the entry bar- riers literature by exploiting the concept of natural entry Received for publication July 30, 2009. Revision accepted for publica- tion July 17, 2012. * Bruno: University College London, Fondazione Rodolfo DeBenedetti, and IZA; Bytchkova: London School of Economics and Political Science; Estrin: London School of Economics and Political Science, CEPR, and IZA. We thank Will Bartlett, Daniel Berkowitz, Nauro Campos, Richard Connolly, Padma Desai, Francesca Lotti, Laura Magazzini, Tomasz Mickiewicz, Eugene Nivorozhkin, Thomas F. Remington, Catherine Tho- mas, the editor, and an anonymous referee for fruitful comments. Ver- sions of this paper have been presented at the London Business School; CIFREM, University of Trento; SSEES, University College of London; the EACES Conference, Higher School of Economics, Moscow; the Inter- national OECD-UNDP Conference at the School of Local Development, Trento; the Italian Congress of Econometrics and Empirical Economics, University of Marche, Ancona; the COST workshop, ‘‘Firm-Level Data Analysis in Transition and Developing Economies,’’ University of Edin- burgh, Scotland; CEELBAS, St. Antony’s College, University of Oxford; and the University of Birmingham seminar series. We thank Tanja Lipiai- nen, Michael Rochlitz, and Imogen Wade for excellent research assis- tance. Any remaining errors are our own. A supplemental appendix is available online at http://www.mitpress journals.org/doi/suppl/10.1162/REST_a_00322. The Review of Economics and Statistics, December 2013, 95(5): 1740–1749 Ó 2013 by the President and Fellows of Harvard College and the Massachusetts Institute of Technology
Transcript of Institutional Determinants of New Firm Entry in Russia: A Cross-Regional Analysis

INSTITUTIONAL DETERMINANTS OF NEW FIRM ENTRY IN RUSSIA:
A CROSS-REGIONAL ANALYSIS
Randolph Luca Bruno, Maria Bytchkova, and Saul Estrin*
Abstract—We investigate how the regional institutional environment—inparticular, the political environment—affects Russian new firm entryacross regions, industries, firm size classes, and time. We find that entryrates in Russia are explained by natural entry rates and the institutionalenvironment. Industries that are characterized by low entry barriers indeveloped market economies are found to have lower entry rates inregions subject to greater political fluidity, as in the case of gubernatorialchange. We also find that higher levels of political fluidity and democracyincrease relative entry rates for small-sized firms but reduce them formedium-sized or large ones.
I. Introduction
THE entry of new firms is an important process for mar-ket economies (Caves, 1998; Bartelsman, Haltiwanger,
& Scarpetta, 2004), transferring resources from low- tohigh-productivity activities and dissipating monopoly rents(Bartelsman, Scarpetta, & Schivardi, 2005). Entry, how-ever, is constrained by industry-specific barriers (Bain,1968; Lofstrom, Bates, & Parker, 2011), and these may becompounded in developing economies by the weakness ofpolitical and economic institutions, which may also contri-bute to the market power of incumbents (Djankov et al.,2002). This paper investigates the effects of such institu-tions on new firm entry. Its main contribution is to movebeyond standard cross-country modeling to analyze cross-regional and cross-sector entry rates within a single econ-omy, Russia. Previous studies of institutions and entryacross countries have faced problems of unobserved hetero-geneity (Djankov et al., 2002). Thus, Klapper, Laeven, andRajan (2006), who considered cross-industry, cross-countryvariation in entry rates, could only partially control for dif-ferences in macroeconomic policy, trading regimes, andother country-specific factors. In concentrating on regional
differences, we build on Berkowitz and DeJong (2005),who show that Russian regional entrepreneurial activity issignificantly associated with subsequent growth.
Russia is a federation of states and subunits and, whilemuch of the formal regulatory and institutional frameworkremains common, control over significant aspects is decen-tralized to the regional level. The constitution gives exclu-sive authority to the central government in the regulation offoreign trade—the legal framework of a single market aswell as over financial, currency, and customs regulations(OECD, 2002). However, in most other aspects of the insti-tutional and political environment, there remains greatdiversity among Russian regions, and this allows us toexplore the impact of institutional heterogeneity on entryrates in a novel way. This institutional heterogeneity partlyarises because Russia followed a regionally differentiatedprocess of transition to a market economy after the demiseof the Soviet Union in 1991. In some regions, market-oriented reforms were introduced and implemented rapidly,in others more slowly, and in some hardly at all. As a result,the Russian context provides a natural quasi-experimentalsetting to investigate how institutions influence new firmentry. To exploit this, we build on ideas of Acemoglu andJohnson (2005), who link the security of property rights todemocracy, in order to construct a data set that charts politi-cal and institutional change in Russia over time. On thisbasis, we relate the patterns of firm entry rates by industryand region to prior political changes associated with thetiming and results of elections and to changes in measuresof regional democracy.
Our empirical investigation draws on three data sources:a comprehensive longitudinal enterprise data set, Orbis(BvD Copyright) between 1996 and 2008, and new dataconcerning Russian political and economic institutions atthe regional level. The first new data set measures politicalfluidity by documenting governor turnover in the regionsand has been collected from primary sources in Russia forthis study. The second, which we refer to as the Petrov data,provides information about regional political democracyand economic openness (McFaul, Petrov, & Ryabov, 2004).The Orbis data set, a more comprehensive version of theAmadeus data set used by Klapper et al., (2006), enables usto measure entry at the date of incorporation of the firmrather than using the more common but less satisfactoryproxy of the date when the firm enters the data set (Dunne,Roberts, & Samuelson, 1989). It also includes the smallestfirms, while most studies of entry focus on firms employingmore than fifty workers, though entry often takes place bythe smallest firms.
We also build on recent developments in the entry bar-riers literature by exploiting the concept of natural entry
Received for publication July 30, 2009. Revision accepted for publica-tion July 17, 2012.
* Bruno: University College London, Fondazione Rodolfo DeBenedetti,and IZA; Bytchkova: London School of Economics and Political Science;Estrin: London School of Economics and Political Science, CEPR, andIZA.
We thank Will Bartlett, Daniel Berkowitz, Nauro Campos, RichardConnolly, Padma Desai, Francesca Lotti, Laura Magazzini, TomaszMickiewicz, Eugene Nivorozhkin, Thomas F. Remington, Catherine Tho-mas, the editor, and an anonymous referee for fruitful comments. Ver-sions of this paper have been presented at the London Business School;CIFREM, University of Trento; SSEES, University College of London;the EACES Conference, Higher School of Economics, Moscow; the Inter-national OECD-UNDP Conference at the School of Local Development,Trento; the Italian Congress of Econometrics and Empirical Economics,University of Marche, Ancona; the COST workshop, ‘‘Firm-Level DataAnalysis in Transition and Developing Economies,’’ University of Edin-burgh, Scotland; CEELBAS, St. Antony’s College, University of Oxford;and the University of Birmingham seminar series. We thank Tanja Lipiai-nen, Michael Rochlitz, and Imogen Wade for excellent research assis-tance. Any remaining errors are our own.
A supplemental appendix is available online at http://www.mitpressjournals.org/doi/suppl/10.1162/REST_a_00322.
The Review of Economics and Statistics, December 2013, 95(5): 1740–1749
� 2013 by the President and Fellows of Harvard College and the Massachusetts Institute of Technology

rates in the context of difference-in-difference methods. Wefollow Klapper et al. (2006) in using the rate of entry byindustry in developed countries as a proxy for the sector’snatural entry propensity. These natural entry rates reflect,for example, technological barriers in the industry causedby economies of scale or organizational efficiencies gainedby incumbents.
We find that heterogeneity in Russian regional institu-tions over time does affect entry rates relative to the levelsthat pertain to developed market economies. Political fluid-ity has a negative effect on entry rates in industries in whichthe barriers to entry are lower. Thus, industries character-ized by higher entry rates in Western economies experiencecomparatively less entry in Russian regions that suffer fromgreater political fluidity, measured by the turnover of theregional governor. This pattern of results is also found usingthe Petrov data set: greater democracy (and therefore theincreased possibility of political fluidity) reduces entry inindustries with relatively low entry barriers. When firm sizeis taken into account, political fluidity and greater relianceon democratic institutions reduce entry rates for mediumand large Russian firms but not for small ones.
The paper is organized as follows. In section II, webriefly review the literature on entry and institutions; in sec-tion III, we describe the data set; section IV is dedicated toour empirical strategy and section V to regression results.We draw our conclusions in section VI.
II. Literature
Barriers to entry represent a cost for a new entrant that isnot borne by the incumbents. The main barriers to entryidentified in the literature include economies of scale, learn-ing curve advantages, product differentiation, and theincumbents’ absolute cost advantages (Dixit, 1979; Aghion& Bolton, 1987).1 Political and economic institutions canalso affect the costs of setting up and running a business, aswell as the likelihood that profits will be expropriated byothers (Acemoglu & Johnson, 2005). Specific national orlocal regulations can raise the costs of entry, as enumeratedexhaustively by Djankov et al. (2002). They find a positiverelationship across 85 countries between the size of informaleconomy and the burden of entry regulations, measured bythe number of procedures, time, and cost of starting a firm.Klapper et al. (2006) find that regulations hinder entry, nota-bly for firms in naturally high-entry industries.2 Turning toinstitutional entry barriers more generally, De Soto’s (1990)analysis stresses the interrelationship between formal andinformal entry barriers, with higher formal levels of regula-tion implying greater corruption and higher informal entrybarriers. A common mechanism is that when institutions are
weak, incumbents can capture government processes ofentry regulation using their control to limit entry.3
Heterogeneity in institutions has therefore already beenused to explain differences in cross-country entry rates empiri-cally. However, in these studies, the measures of institutionalheterogeneity are limited because of the need for cross-coun-try comparability. Moreover, these contain unobservedsources of heterogeneity: institutional variation may be corre-lated with a variety of other country-specific factors, for exam-ple, macroeconomic policies, exchange rate factors, and tar-iffs, associated with intersectoral rates of entry. We thereforeundertake our study within one country, exploiting Russia’sregional diversity in both formal and informal institutions.
Russia has a long national history and identity, a unifiedexchange rate, and a common macroeconomic policy regime.However, regional governors still have the authority tocreate formal and informal regional economic barriers, andthis devolution of political power is the basis of heterogeneityin regional institutional factors (Berkowitz & DeJong,2005; Remington, 2011).4 Regional authorities hold swayover local commercial courts, inspectorates, and other stateorgans, and national legislation can always be interpreted invariety of ways, with specific laws being applied selectivelyas the authorities see fit (Popov, 2001; OECD, 2002). Thisallows the regional political and economic elites to providepreferential treatment to some firms and to block or harassothers by exploiting a plethora of mechanisms—preferentialtax rebates and leases, debt restructuring, withholdinglicenses, and the imposition of administrative hurdles, includ-ing especially harassment by the tax authorities and inspecto-rates, for example. Frye and Shleifer (1997) document thatregional authorities also behave in a predatory manner,expropriating profits within their region (see also Centre forEconomic and Financial Research, 2007). The extent of thegovernor’s reliance on these mechanisms and their purposein so doing varies from region to region.5 In consequence, theinstitutional environment is very heterogeneous, with someregions having a favorable climate for new firms (Nizny Nov-gorod, Yaroslavl, and Moscow for example), while others(for example, Kursk and Magadan) do not (OECD, 2002).6
1 These ideas have been tested on developed economy data, includingDunne, Roberts, and Samuelson (1989) and Geroski (1991).
2 Bertrand and Kramarz (2002) find that labor regulations reduce entryinto labor-intensive sectors, but property rights protection increases entryinto R&D-intensive sectors.
3 For example, Tybout (2000) argues that the costs of entry vary withthe prevalence of the shadow economy in a sector and that when institu-tions are weaker, large firms can more effectively lobby legislative bodiesto restrict entry.
4 The ability of regional authorities to form local policies independentlyof the central government waned somewhat after 2000, but local informalpractices and networks have largely preserved the diversity of local insti-tutions, as documented by Remington (2011).
5 For example, an average small company in Kurgan oblast in 2001 wasinspected 10 times compared to 2.5 times in Samara oblast over the sametime period (Centre for Economic and Financial Research, 2007).
6 For example, Chelyabinsk introduced additional procedures andhigher fees than those stipulated by federal law for such activities asemployment services, international tourism, passenger transportation, andthe production and marketing of alcohol. Primorskiy krai decreed higherfees for licensing pharmaceuticals, while Nizhny Novgorod extendedlicensing requirements for engineering systems, building, and road main-tenance. The republics of Udmurtia and Mordovia introduced regionalcertification of companies.
1741INSTITUTIONAL DETERMINANTS OF NEW FIRM ENTRY IN RUSSIA

The case of IKEA in Russia illustrates the use of admin-istrative hurdles to preclude new entry and the highly perso-nalized nature of regional economic governance. IKEA wastrying to open a chain of branches in Russian regions butmet local obstacles in Samara and Ufa with delays in re-ceiving permits and other administrative hassles. In Samara,the rumored reason behind these difficulties was the invol-vement of Governor Artyakov and his wife in the construc-tion industry, while the mayor owned a competing retailfurniture company (‘‘Growing IKEA Russia CorruptionScandal,’’ 2010; ‘‘Gosstroi utverdil proektnuju dokumentat-siju Samarskoi Ikei,’’ 2011).
III. Measures of Entry and Regional Institutional
Quality
Our entry data are drawn from the Orbis database, whichcontains balance sheet information from 1996 to 2008 forall registered firms in Russia, as well as their location andthe year of incorporation. Orbis does not have any restric-tions on firm size. We use two measures of entry into anindustry, annual entry and entry spanning a two-year per-iod, and we base our measure on the year in which the firmis registered as being incorporated rather than the morecommon, but less accurate, indicator of the year in whichthe firm enters the database. This improves the quality ofthe measure considerably in environments such as Russiawhere reporting standards by firm are not always uniformlyapplied. Thus, Entry 1-year is the number of companies inan industry and region with incorporation year ¼ T dividedby the number of companies with the incorporation year �T.7 Industries are denoted by the subscript i on Nace two-digit dummies (excluding agriculture, mining, utility, finan-cial intermediation, public administration, education, andhealth); regions are denoted by r, (88 region dummies);8
time is denoted by t for the years 1996 to 2008.9 One of theadvantages of Orbis is that it contains every registered firmrather than all firms above a certain size. This is potentiallyan advantage in the analysis of entry because entrants areusually smaller than incumbents (Geroski, 1995). However,the inclusion of smaller firms as a firm size category mayalso increase the noise in the regression, especially sinceentry may entail a process of entrepreneurs learning aboutfuture profitability (Jovanovic, 1982). We estimate our firmsize models on a four-dimensional database (region, indus-try, year, and firm size), which increases the size of the
sample and captures the differential effect of institutions onentry-size categories. In this experiment, the dependentvariable is defined in the following way: now Entry 1-yearis the number of companies with incorporation year ¼ T ofa specific size category divided by the number of companieswith the incorporation year � T of the same-size category.We adopt a standard-size taxonomy by employees: s1 < 50,s2 ¼ [51–250], s3 > 250.10
To explore the links between entry and the political andinstitutional environment at the regional level, we use twodata sets. The first is a new database, constructed for thisstudy, on governors’ turnover in the Russian regions be-tween 1996 and 2008. The second, the Petrov data set,draws on the regional democratisation scores compiled byMcFaul et al. (2004).
The first data set builds on the idea that regional politicsshape local institutions both formally and informally, butcan be subject to external shocks because of the electoralprocess. We explore the effects of the periodic uncertaintythat affects regional businesses every four years as thegubernatorial term in the office expires and the politicalincumbent faces the risk of being replaced by another can-didate. In principle, the impact of greater political fluidityon the costs of entry could go either way; the loss of officecould create regulatory uncertainty or act to offset theentrenched power of incumbents if this is negative for busi-ness. Acemoglu and Robinson (2006) and Lizzeri and Per-sico (2005) suggest that intense political competition maybe welfare reducing because political instability may induceincumbent politicians to focus on short-term rents ratherthan long-term growth-enhancing reforms. On the otherhand, the turnover of politicians may have a discipliningeffect on incumbent governors and offset the power ofentrenched insiders, therefore promoting new entry. Thiswould parallel Besley, Persson, and Sturm’s (2010) findingthat political competition in the southern United States ledto probusiness policies and a subsequent improvement ineconomic performance. In the Russian context, we proposethat fewer changes in governor—continuity of politicalrule—contribute to a more stable investment environment.With the same governor and political elite in office, firmscan build more stable and durable links with local politi-cians. Since local networks and relationships are crucial, anew governor, whether from the same party or a differentone, might introduce her or his own group of associates,disrupting existing informal relationships and creatingpotential institutional insecurity. To capture the level ofuncertainty associated with the potential change of gover-nor, we constructed a governor turnover data set by docu-
7 Entry 2-year is the number of companies in an industry and regionwith incorporation year ¼ T or (T – 1) divided by the number of compa-nies with the incorporation year � T. For brevity, all the reported resultsrefer to the one-year entry rate, but the results hold with the two-yearentry measure (available on request).
8 The Chechen Republic is dropped from the data.9 Incorporation in the early years of transition could be caused by priva-
tization rather than new entry, but since most Russian firms were priva-tized by 1997, such instances are rare in our database. We also cannot dis-tinguish between new entry and a legal change of name, but the latter isoften a result of change of ownership and may represent a new way ofrecombination of the firm’s assets.
10 The sample exploits all the firms declaring their date of incorpora-tion. The database is built by splitting the overall firm sample into threeparts according to size category. Entry rates are computed within separatecategories, and the three parts are pooled back together. Some firms doreport date of incorporation but not size and therefore are part of the data-base of the complete sample. Only firms reporting date of incorporationand size are included in the size-level data.
1742 THE REVIEW OF ECONOMICS AND STATISTICS
menting instances when the incumbent governor’s term inthe office expired (whether she or he stood for reelection orreappointment), instances of governor change (whetherthrough elections or new appointment), and the character ofthese changes (whether there is a change in the local rulingelite). The indices therefore indicate the degree of uncer-tainty faced by a prospective new entrant firm as the politi-cal environment changes from the status quo characterizedby no foreseeable change in governor and therefore bystable economic and political policies to:
1. A possible change in governor as the incumbent’sterm in office expires, even if the incumbent ulti-mately remains in office. Elections open up the possi-bility of a change in ties to business groups, envi-sioned economic policies, investment programs, and,importantly, new informal rules of the game becauseof their potential to disrupt elite networks.
2. A new governor coming to power who, being part ofthe same political group, is likely to provide somecontinuity with previous policies but also potentialchange in personal networks of power. Since so manydecisions and practices are based on personal ties andloyalties, turnover in the higher echelons of the localadministration may generate considerable uncertaintyabout future practices and policies.
3. The election of a new governor from an oppositionparty—someone who is probably even more likely todiscontinue current policies and practices.
Thus, the variable ‘‘political fluidity’’ was measured on a3 plus 1-point scale, [0,3], for each year during the period1996 to 2008. Zero represents the status quo and wasassigned to years when no election or governor appointmenttook place. Years when the current governor stood forreelection or reappointment and the incumbent remained inpower were assigned a value of 1. Instances when theincumbent was replaced by a candidate from the same poli-tical elite were assigned a value of 2. Cases when the newgovernor came from the opposition were given the value of3. In the regressions, we consider the impact of each politi-cal change on its own [0,1] dummy, as well as the cumula-tive [0,3] political fluidity index.
We also considered whether these new measures of turn-over and overall political fluidity were in fact correlatedwith important social and economic changes in the regions(see table A1.2 in the online appendix). The political riskratings and the criminal risk ratings provided by Russianresearch group Expert RA show a statistically significantcorrelation coefficient (around 0.3) with government change(positive) and elite change (negative), respectively. More-over, political fluidity is positively correlated (above 0.20)with the election, pluralism, elites, and democratizationvariables from the Petrov database: the positive correlationbetween turnover of governors and institutional variablesimplies a correspondence between political fluidity and
‘‘good institutions.’’ Thus we observe some interesting dif-ferences between regions that experienced a turnover inpower and regions that saw none. For example, over the per-iod 2004 to 2006, regions that experienced no change inpower on average saw an improvement in their risk ranking.In contrast, regions that saw an opposition candidate cometo power saw their risk ranking fall. Moreover, the evalua-tion of a region’s risk is more volatile for regions thatexperienced deeper political change; political as well ascriminal risks in regions where opposition candidates cameto power increased significantly in 2005 but fell in regionswith no change.
Our second institutional data set measures democraticpractices in Russian regions in terms of the extent of mediafreedom, the level of democracy, and the extent of opennessof regional political life. We use indices from an importantnew data set, collected by McFaul et al. (2004), with tensubindicators to provide an overall assessment of politicaland economic openness in each region. In our estimations,we used both the summary variable for democratization(composed of all ten subindicators) and each of the ten sub-indicators separately; for brevity, we report the overalldemocracy indicator only (composed of nine subindicators,that is, excluding economic liberalization; see the appen-dix). The subindicators give an account of political factors(political openness, elections, pluralism, regional politicalstructure), economic factors (economic liberalization, cor-ruption), and civil society and social factors (media, civilsociety, elites, local self-government). Together, they cap-ture the openness of regional political and economic pro-cesses and indicate how easy it is for a new entrant to gaugefuture profits from the venture and to estimate the likelihoodof losing the investment. These Petrov indices provide a richmeasure of democratic functioning in Russian regions, butmore so than with our political fluidity indices, there is thepossibility of endogeneity with some of these measures—for example, liberalization.11 We therefore enter the Petrovdata with lags and in our discussion place more emphasis onthe result using the political fluidity index we constructed.
IV. Estimation Strategy
In order to test the relationship between entry and theinstitutional environment, we run a tobit estimation modelfor the dependent censored [0,1] entry variable—the pro-portion of new entrants on incumbents plus entrants calcu-lated from the year of incorporation declared by the firm.12
We follow the difference-in-difference approach of Klapperet al. (2006). The specification includes regional fixedeffects, Nace two-digit industry fixed effects,13 and time
11 The results for the separate subindicators are broadly consistent andare available on request.
12 The date of incorporation is reported by 85% of firms.13 We exclude agriculture, mining, utility, financial intermediation, pub-
lic administration, education, and health. These sectors have a lower entryrate.
1743INSTITUTIONAL DETERMINANTS OF NEW FIRM ENTRY IN RUSSIA

fixed effects.14 The industry-level natural entry rates aretime invariant and so are captured in the industry fixedeffects, but we include the interaction term Entry EU[1998–2003] � INSTITUTION Region-Year (t – 1) or EntryEU [1998–2003] � INSTITUTION Region-Year (�2). Thisspecification is equivalent to testing whether institutionsdifferentially affect entry rates given the natural entryrate,15 the latter reflecting barriers to entry for the industryin a developed market economy. The institutional variablesare loaded as either the governors’ turnover indicators orthe Petrov index. The natural entry rates are sourced fromthe European Union 1998–2003 average data.16
The following models are estimated, where the subscripti stands for industry, r stands for region, t stands for time,and s stands for the size category—s1 < 50, s2 ¼ [51–250],s3 > 250:17
Entryr;i;t ¼ dEntryEUi; 1998�2003½ � � Instr; t�1ð Þ þ
XR
r¼1
brDr
þXl
i¼1
biDi þXT
t¼1
btDtþ 2r;i;t ð1Þ
Entryr;i;t;s ¼X3
s¼1
ds EntryEUs;i; 1998�2003½ � � Instr; t�1ð Þ
� �
þX3
s¼1
XR
r¼1
bsrDsr þX3
s¼1
Xl
i¼1
bsiDsi
þXT
t¼1
btDtþ 2r;i;t;s ð2Þ
In equation (2), the interaction terms between institutionsand the natural entry rate, as well as regional and sectoraldummies, are included for all three size categoriesP3
s¼1 :::ð Þ; time dummies are unmodified (for a comparison,
see Aghion, Fally, & Scarpetta, 2007).
V. Results
New firm entry rates in Russia as a whole do not appearto be particularly low by international standards (but seeAidis, Estrin, & Mickiewicz, 2008). Thus, we find that entryrate is registered in an interval between 11.9% and 2.4%throughout the 1996–2008 time span compared with 7.09%in Europe and 6.65% in the United States using the sameNACE industries in 1998–1989 (Dun & Bradstreet, 2000).Entry rates for large firms, employing more than 250 work-ers, are on average 4.3% and decline over time (6.7% in1996 and 0.4% in 2008), while those for the smallest firmsregister an average of 11.3%.
We report the estimation results for equations (1) and (2)and are particularly interested in the coefficients d and ds¼1
ds¼2 ds¼3 stemming from the interacted terms by sizeP3s¼1 ds. The dependent variable is the one-year entry rate
at the level of the sector, region, and year in equation (1)and the one-year entry rate at the level of the sector, region,year, and size category in equation (2).18 Thus, the formerexploits the three-dimensional database (region, industry,and time), whereas the latter exploits the four-dimensionalone (region, industry, time and size). The effects on entryof political fluidity are discussed in section VA and of thePetrov democratization index in section VB.
The governor’s political fluidity indicator was con-structed on a [0,3] scale. To facilitate the interpretation ofthe coefficients of the tobit regression model, we rescaledall of the institutional variables (democratization as well asgovernor turnovers) in the [0,1] interval and report the tobitmarginal effects on truncated expected value at 0 (lowerbound) and 1 (upper bound). These transformations allowus to interpret the magnitude of the s and ss negative (posi-tive) coefficients as the percentage decrease (increase) ofthe natural entry rate for an average region passing from thestatus quo to the most fluid (on a cumulative scale), ordemocratic political environment.
A. Governor Turnovers and the Entry Rates
Table 1 reports the impact of the three individual politi-cal fluidity variables (three 0-1 dummies—Election, Gover-nor Change, and Elite Change—and the overall politicalfluidity [0,3] dummy, rescaled) each with one-year andtwo-year lag specifications. Columns 1 and 2 refer to theElection variable. We do not identify any significant effect,perhaps because the timing of elections in Russia is prede-termined and cannot be strategically moved by governors.Hence, the timing of elections would probably not affect afirm’s decision to enter a market unless there was also anexpectation of political change (see the regression by sizecategories). Columns 3 and 4 refer to the Governor Changevariable. Here we do identify a significant decreased likeli-
14 Entry rates decrease between 1996 and 2008, which is captured bytime dummies. The sample does not show the existence of a unit root. Seeonline appendix 3 for a battery of tests on the unit root in our region-sector panel.
15 For example, consider two sectors: one characterized by the naturalentry rates of 0% and the other of 100%, respectively. The interactionterm Entry EU[1998–2003] � INSTITUTIONRegion-Year(�1) will capture theimpact of institutions on the 100% entry sector with respect to the noentry one.
16 Aghion et al. (2004) analyze entry determinants using both structuralvariables and exogenous variation via instrumental variable estimation totackle potential reverse causality—namely, that entry might improveinstitutions. This could in principle occur in our specification if an entryrate specific to a sector-region affects the institutional environment of theregion. However, we think this is unlikely in our data because the depen-dent variable varies across regions, time, and industry, whereas the poten-tially endogenous regressor is at the regional-time level only.
17 For robustness, the regressions are run with the two-year lag institu-tional variables: EntryEU
i; 1998�2003½ � � Instr; t�2ð Þ. One-year and two-year lag
results are both reported in tables.
18 We also ran all regressions with the two-year entry rate as a depen-dent variable. The results are fully consistent with the one-year entryresults (available on request).
1744 THE REVIEW OF ECONOMICS AND STATISTICS
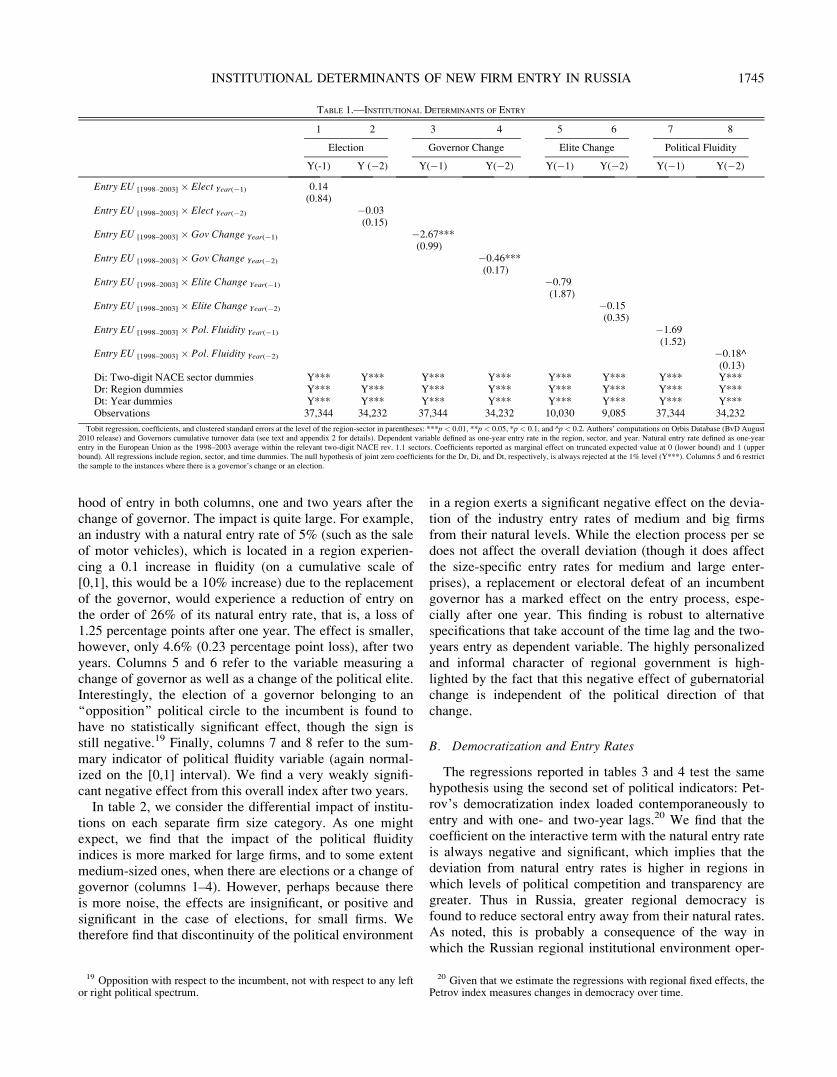
hood of entry in both columns, one and two years after thechange of governor. The impact is quite large. For example,an industry with a natural entry rate of 5% (such as the saleof motor vehicles), which is located in a region experien-cing a 0.1 increase in fluidity (on a cumulative scale of[0,1], this would be a 10% increase) due to the replacementof the governor, would experience a reduction of entry onthe order of 26% of its natural entry rate, that is, a loss of1.25 percentage points after one year. The effect is smaller,however, only 4.6% (0.23 percentage point loss), after twoyears. Columns 5 and 6 refer to the variable measuring achange of governor as well as a change of the political elite.Interestingly, the election of a governor belonging to an‘‘opposition’’ political circle to the incumbent is found tohave no statistically significant effect, though the sign isstill negative.19 Finally, columns 7 and 8 refer to the sum-mary indicator of political fluidity variable (again normal-ized on the [0,1] interval). We find a very weakly signifi-cant negative effect from this overall index after two years.
In table 2, we consider the differential impact of institu-tions on each separate firm size category. As one mightexpect, we find that the impact of the political fluidityindices is more marked for large firms, and to some extentmedium-sized ones, when there are elections or a change ofgovernor (columns 1–4). However, perhaps because thereis more noise, the effects are insignificant, or positive andsignificant in the case of elections, for small firms. Wetherefore find that discontinuity of the political environment
in a region exerts a significant negative effect on the devia-tion of the industry entry rates of medium and big firmsfrom their natural levels. While the election process per sedoes not affect the overall deviation (though it does affectthe size-specific entry rates for medium and large enter-prises), a replacement or electoral defeat of an incumbentgovernor has a marked effect on the entry process, espe-cially after one year. This finding is robust to alternativespecifications that take account of the time lag and the two-years entry as dependent variable. The highly personalizedand informal character of regional government is high-lighted by the fact that this negative effect of gubernatorialchange is independent of the political direction of thatchange.
B. Democratization and Entry Rates
The regressions reported in tables 3 and 4 test the samehypothesis using the second set of political indicators: Pet-rov’s democratization index loaded contemporaneously toentry and with one- and two-year lags.20 We find that thecoefficient on the interactive term with the natural entry rateis always negative and significant, which implies that thedeviation from natural entry rates is higher in regions inwhich levels of political competition and transparency aregreater. Thus in Russia, greater regional democracy isfound to reduce sectoral entry away from their natural rates.As noted, this is probably a consequence of the way inwhich the Russian regional institutional environment oper-
TABLE 1.—INSTITUTIONAL DETERMINANTS OF ENTRY
1 2 3 4 5 6 7 8
Election Governor Change Elite Change Political Fluidity
Y(-1) Y (�2) Y(�1) Y(�2) Y(�1) Y(�2) Y(�1) Y(�2)
Entry EU [1998–2003] � Elect Year(�1) 0.14(0.84)
Entry EU [1998–2003] � Elect Year(�2) �0.03(0.15)
Entry EU [1998–2003] � Gov Change Year(�1) �2.67***(0.99)
Entry EU [1998–2003] � Gov Change Year(�2) �0.46***(0.17)
Entry EU [1998–2003] � Elite Change Year(�1) �0.79(1.87)
Entry EU [1998–2003] � Elite Change Year(�2) �0.15(0.35)
Entry EU [1998–2003] � Pol. Fluidity Year(�1) �1.69(1.52)
Entry EU [1998–2003] � Pol. Fluidity Year(�2) �0.18^(0.13)
Di: Two-digit NACE sector dummies Y*** Y*** Y*** Y*** Y*** Y*** Y*** Y***Dr: Region dummies Y*** Y*** Y*** Y*** Y*** Y*** Y*** Y***Dt: Year dummies Y*** Y*** Y*** Y*** Y*** Y*** Y*** Y***Observations 37,344 34,232 37,344 34,232 10,030 9,085 37,344 34,232
Tobit regression, coefficients, and clustered standard errors at the level of the region-sector in parentheses: ***p < 0.01, **p < 0.05, *p < 0.1, and ^p < 0.2. Authors’ computations on Orbis Database (BvD August2010 release) and Governors cumulative turnover data (see text and appendix 2 for details). Dependent variable defined as one-year entry rate in the region, sector, and year. Natural entry rate defined as one-yearentry in the European Union as the 1998–2003 average within the relevant two-digit NACE rev. 1.1 sectors. Coefficients reported as marginal effect on truncated expected value at 0 (lower bound) and 1 (upperbound). All regressions include region, sector, and time dummies. The null hypothesis of joint zero coefficients for the Dr, Di, and Dt, respectively, is always rejected at the 1% level (Y***). Columns 5 and 6 restrictthe sample to the instances where there is a governor’s change or an election.
19 Opposition with respect to the incumbent, not with respect to any leftor right political spectrum.
20 Given that we estimate the regressions with regional fixed effects, thePetrov index measures changes in democracy over time.
1745INSTITUTIONAL DETERMINANTS OF NEW FIRM ENTRY IN RUSSIA

ates, with informal political-business networks at the locallevel determining enterprise outcomes. It is usually thoughtthat democracy would be conducive to securing propertyrights and providing incentives to create a fair ownershipand legal system. However, turnover in the political elitehas a detrimental effect on entry rates in Russia. This isprobably because conventional indicators of democracy
measure the extent of political contestation and not the fair-ness and strength of political institutions that frame regionalpolicymaking. In an environment where institutions areweak and personal ties are important, change of politicalelites and greater contestation among local groups may notnecessarily result in better political institutions but rathergreater disruption of personal ties among the ruling elite.
TABLE 2.—INSTITUTIONAL DETERMINANTS OF ENTRY BY SIZE
1 2 3 4 5 6 7 8
Election Governor Change Elite Change Political Fluidity
Y(�1) Y(�2) Y(�1) Y(�2) Y(�1) Y(�2) Y(�1) Y(�2)
{Small} Entry EU [1998–2003] � Elect Year(�1) 1.37***(0.45)
{Medium} Entry EU [1998–2003] � Elect Year(�1) �12.34***(1.34)
{Large} Entry EU [1998–2003] � Elect Year(�1) �21.68***(1.94)
{Small} Entry EU [1998–2003] � Elect Year(�2) 0.25***(0.08)
{Medium} Entry EU [1998–2003] � Elect Year(�2) �1.92***(0.25)
{Large} Entry EU [1998–2003] � Elect Year(�2) �3.48***(0.38)
{Small} Entry EU [1998–2003] � Gov Change Year(�1) 0.52(0.55)
{Medium} Entry EU [1998–2003] � Gov Change Year(�1) �15.77***(2.06)
{Large} Entry EU [1998–2003] � Gov Change Year(�1) �23.77***(3.30)
{Small} Entry EU [1998–2003] � Gov Change Year(�2) 0.10(0.09)
{Medium} Entry EU [1998–2003] � Gov Change Year(�2) �2.06***(0.38)
{Large} Entry EU [1998–2003] � Gov Change Year(�2) �3.94***(0.65)
{Small} Entry EU [1998–2003] � Elite Change Year(�1) 1.91**(0.86)
{Medium} Entry EU [1998–2003] � Elite Change Year(�1) �22.78***(4.16)
{Large} Entry EU [1998–2003] � Elite Change Year(�1) �31.73***(6.86)
{Small} Entry EU [1998–2003] � Elite Change Year(�2) 0.33**(0.16)
{Medium} Entry EU [1998–2003] � Elite Change Year(�2) �2.27**(0.90)
{Large} Entry EU [1998–2003] � Elite Change Year(�2) �2.99**(1.39)
{Small} Entry EU [1998–2003] � Pol. Fluidity Year(�1) 2.17***(0.80)
{Medium} Entry EU [1998–2003] � Pol. Fluidity Year(�1) �27.61***(2.78)
{Large} Entry EU [1998–2003] � Pol. Fluidity Year(�1) �44.38***(4.35)
{Small} Entry EU [1998–2003] � Pol. Fluidity Year(�2) 0.20***(0.07)
{Medium} Entry EU [1998–2003] � Pol. Fluidity Year(�2) �1.95***(0.25)
{Large} Entry EU [1998–2003] � Pol. Fluidity Year(�2) �3.53***(0.43)
Dr � [size]: Regions � Size Dummies Y*** Y*** Y*** Y*** Y*** Y*** Y*** Y***Di � [size]: 2 Digit NACE Sector � Size Dummies Y*** Y*** Y*** Y*** Y*** Y*** Y*** Y***Dt: Year dummies Y*** Y*** Y*** Y*** Y*** Y*** Y*** Y***Observations 79,764 73,117 79,764 73,117 21,473 19,383 79,764 73,117
Tobit regression, coefficients and clustered standard errors at the level of the region-sector-size in parentheses: ***p < 0.01, **p < 0.05, and *p < 0.1. Authors’ computations on Orbis Database (BvD August2010 release) and governors cumulative turnover data (see text and appendix 2 for details). Dependent variable defined as one-year entry rate in the region, sector, size and year. Natural entry rate defined as one-yearentry in the European Union as 1998–2003 average within the relevant two-digit NACE rev. 1.1 sector and size category. Coefficients reported as marginal effect on truncated expected value at 0 (lower bound) and 1(upper bound). All regressions include [Regions]�[size], [Sector] � [size], and Time dummies. The null hypothesis of joint zero coefficients for the Dr � [size]; Di � [size], Dt, respectively, is always rejected at 1%level (Y***). Columns 5 and 6 restrict the sample to the instances where there is a governor’s change or an election.
1746 THE REVIEW OF ECONOMICS AND STATISTICS

This perhaps explains the disproportionally large effect ofpolitical fluidity on entry rates of medium and large firms,as these firms tend to rely relatively more on networkingwith top regional politicians than small firms do.
Table 4 replicates the previous experiment with firm sizecategories and loading the Petrov data for political institu-tions. As before, we find that the direction of the impact ofthe degree of democratization on entry rates depends on thesize of the entrant. Greater democracy acts to stimulateentry by small-sized firms, reducing the deviation of entryby sector from their natural rate, though the results may bebiased because of greater measurement error. However, as
for when all the size categories are combined, greaterdemocratization reduces entry for medium and, especially,large firms. These findings apply to all three specificationsof lags.
VI. Conclusion
This paper looks at the development of the existing lit-erature on entry and the institutional environment. First, wecircumvent the problem encountered in traditional cross-country studies of approximating institutions by country-specific dummies. Our approach also reduces the number of
TABLE 3.—DEMOCRATIZATION DETERMINANTS OF ENTRY
1 2 3
DemocratizationYear (t)
DemocratizationYear (t � 1)
DemocratizationYear (t � 2)
Entry EU [1998–2003] � Democratization �0.64***(0.22)
Entry EU [1998–2003] � Democratization Year (t�1) �0.56**(0.22)
Entry EU [1998–2003] � Democratization Year (t�2) �0.49**(0.15)
Di: 2 digit NACE sector dummies Y*** Y*** Y***Dr: Region dummies Y*** Y*** Y***Dt: Year dummies Y*** Y*** Y***Observations 40,456 37,344 34,232
Tobit regression, coefficients and clustered standard errors at the level of the region-sector in parentheses: ***p < 0.01, **p < 0.05, *p < 0.1. Authors’ computations on Orbis Database (BvD August 2010 release)and Petrov democratization variable: dem1 is a 1991–2001 time-invariant variable; dem2 is a 2000–2004 time-invariant variable; dem3 is a 2001–2006 time-invariant variable. These are merged to create time-variantdemocratization variables on the 1996–2008 time span: contemporaneous (column 1), lag 1 (column 2) and lag 2 (column 3) (see the text and appendix 2 for further details). The dependent variable is defined as theone-year entry rate in the region, sector, and year. The natural entry rate is defined as one-year entry in the European Union as the 1998–2003 average within the relevant two-digit NACE rev. 1.1 sectors. Coefficientsreported as marginal effect on truncated expected value at 0 (lower bound) and 1 (upper bound). All regressions include regions, sector, and time dummies. The null hypothesis of joint zero coefficients for the Dr,Di, and Dt, respectively, is always rejected at 1% level (Y***).
TABLE 4.—DEMOCRATIZATION DETERMINANTS OF ENTRY BY SIZE
1 2 3
DemocratizationYear (t)
DemocratizationYear (t � 1)
DemocratizationYear (t � 2)
{Small} Entry EU [1998–2003] � Democratization 0.27***(0.05)
{Medium} Entry EU [1998–2003] � Democratization �1.03**(0.41)
{Large} Entry EU [1998–2003] � Democratization �2.09***(0.69)
{Small} Entry EU [1998–2003] � Democratization Year (t�1) 0.28***(0.05)
{Medium} Entry EU [1998–2003] � Democratization Year (t�1) �1.48***(0.43)
{Large} Entry EU [1998–2003] � Democratization Year (t�1) �1.62**(0.72)
{Small} Entry EU [1998–2003] � Democratization Year (t�2) 0.25***(0.04)
{Medium} Entry EU [1998–2003] � Democratization Year (t�2) �1.02**(0.44)
{Large} Entry EU [1998–2003] � Democratization Year (t�2) �1.26*(0.74)
Dr � [size]: Regions � Size Dummies Y*** Y*** Y***Di � [size]: 2 digit NACE Sector � Size Dummies Y*** Y*** Y***Dt: Year dummies Y*** Y*** Y***Observations 86,411 79,764 73,117
Tobit regression, coefficients, and clustered standard errors at the level of the region-sector-size in parentheses: ***p < 0.01, **p < 0.05, and *p < 0.1. Authors’ computations on Orbis database (BvD August2010 release) and Petrov democratization variable: dem1 is a 1991–2001 time-invariant variable; dem2 is a 2000–2004 time-invariant variable; dem3 is a 2001–2006 time-invariant variable. These are merged to cre-ate time-variant democratization variables on the 1996–2008 time span—contemporaneous (column 1), lag 1 (column 2), and lag 2 (column 3) (see the text and appendix 2 for further details). The dependent variableis defined as the-year entry rate in the region, sector, size, and year. The Natural entry rate is defined as the-year entry in the European Union as the 1998–2003 average within the relevant two-digit NACE rev. 1.1sectors. Coefficients are reported as a marginal effect on truncated expected value at 0 (lower bound) and 1 (upper bound). All regressions include regions, sector, and time dummies. The null hypothesis of joint zerocoefficients for the Dr*[size], D*[size]i, and Dt, respectively, is always rejected at the 1% level (Y***).
1747INSTITUTIONAL DETERMINANTS OF NEW FIRM ENTRY IN RUSSIA

alternative explanations by analyzing entry in the context ofa single national entity. Furthermore, by the use of a newdata set on political fluidity, we have been able to allay con-cerns about the endogeneity of institutional indicators.Finally, we extend the studies of institutional impact onentry, pioneered by Djankov et al. (2002). While these stu-dies explored the impact of formal institutions on entry,they may fail to capture the impact of informal practices.Our work addresses this criticism by taking account ofinformal institutions and demonstrates that the politicalchanges behind the institutional environment have a signifi-cant influence on entry rates.
We show that the negative deviation across regions ofindustrial entry rates from their natural levels is exacerbatedby political fluidity shaped by both formal and informalinstitutions. This is in line with the findings of Besley et al.(2010), who also find that political discontinuities reducethe power of entrenched insiders and reduce entry costs. InRussia, political fluidity increases the entry of small firmsand reduces it for larger ones. These results are robust toalternative specifications, for example controlling for one-or two-year entry, different lags, and large- and medium-firm-size categories. We conclude that in Russia, entry ofmedium and big firms is promoted by continuity in theregional political arena, whether in the form of reelection ofan incumbent or the election of a candidate from the samepolitical elite. While this finding runs counter to expecta-tions about the effect of greater democracy in other con-texts, it is consistent with the way that the regional institu-tional environment in Russia is believed to operate (Aidiset al. 2008; Remington, 2011), often being based on highlypersonalized informal networks. In contrast, small firms’entry appears to benefit from a more competitive politicalenvironment. We offer two related explanations: that theyare too small to benefit from the elite relationships or topose a threat to the incumbents by entry. Thus, the differ-ence in the effect of business environment on the entry ofsmall firms compared to larger ones may indicate predatorystate behavior. Big firms are more likely to be targeted byunscrupulous politicians because they are more visible andgenerate higher rents. This ‘‘grabbing hand’’ view of thestate (Frye & Shleifer, 1997) would predict that larger firmsare disproportionally affected by a change of politicians atthe very top of regional administration and therefore aremore affected by uncertainty and political competition. Asomewhat different explanation hinges on the need to forgeclose links with the top politicians in order to set up firmsand prosper as a business in Russia. Large and mediumfirms are more likely to rely on personal networks with toppoliticians than small firms are. Therefore, disruption ofsuch networks through a change of governor is more likelyto have an impact on the entry of larger firms and leavesmaller businesses relatively unaffected.
We also find that entry is most significantly affected witha one-year lag after a change of governor, the effect fadingaway after two years, as one might expect given that entry
is a long-term project between the initial decision to enterand actual establishment of a firm. Although the legal regis-tration of a firm may be completed in a year, creating agoing concern may take longer. We also confirm the impactof institutions on entry using a data set characterizing regio-nal political regimes with respect to democratic institutions.This measure has the advantage of indicating the directionof the political change, though our analysis is less robustin terms of reverse causality. Nonetheless, the findings arebroadly supportive of the previous experiment.
REFERENCES
Acemoglu, D., and S. Johnson, ‘‘Institutions as a Fundamental Cause ofLong-Run Growth,’’ in P. Aghion, and S. Durlauf (eds.), Hand-book of Economic Growth, vol. 1 (Amsterdam: Elsevier, 2005).
——— ‘‘Economic Backwardness in Political Perspective,’’ AmericanPolitical Science Review 100 (2006), 115–131.
Aghion, P., & P. Bolton ‘‘Contracts as a Barrier to Entry,’’ American Eco-nomic Review 77 (1987), 388–401.
Aghion, P., R. Blundell, R. Griffith, P. Howitt, and S. Prantl ‘‘Entry andProductivity Growth: Evidence from Microlevel Panel Data,’’Journal of the European Economic Association (2004), 265–276.
Aghion, P., T. Fally, and S. Scarpetta, ‘‘Credit Constraints as Barrier toEntry and Post-Entry Growth of Firms,’’ Economic Policy 22(2007), 731–779.
Aidis, R., S. Estrin, and T. Mickiewicz, ‘‘Institutions and Entrepreneur-ship Development in Russia: A Comparative Perspective,’’ Journalof Business Venturing 23 (2008), 656–672.
Bain, J., Industrial Organization (New York: Wiley, 1968).Bartelsman, E., J. Haltiwanger, and S. Scarpetta, ‘‘Microeconomic Evi-
dence of Creative Destruction in Industrial and Developing Coun-tries,’’ World Bank Policy Research Working Paper 3464 (2004).
Bartelsman, E., S. Scarpetta, and F. Schivardi, ‘‘Comparative Analysis ofFirm Demographics and Survival: Micro-Level Evidence for theOECD Countries,’’ Industrial and Corporate Change 14 (2005),365–391.
Berkowitz, D., and D. DeJong, ‘‘Entrepreneurship and Post-Socialist Growth,’’Oxford Bulletin of Economics and Statistics 67 (2005), 25–46.
Bertrand, M., and F. Kramarz, ‘‘Does Entry Regulation Hinder Job Crea-tion? Evidence from the French Retail Industry,’’ Quarterly Jour-nal of Economics 117 (2002), 1369–1413.
Besley, T., T. Persson, and D. Sturm, ‘‘Political Competition, Policy andGrowth: Theory and Evidence from the US,’’ Review of EconomicStudies 77 (2010), 1329–1352.
Caves, R., ‘‘Industrial Organization and New Findings on the Turnoverand Mobility of Firms,’’ Journal of Economic Literature 36(1998), 1947–1982.
Centre for Economic and Financial Research at New Economic School,Monitoring the Administrative Barriers to Small Business Devel-opment in Russia, Round 6 (2007), http://www.cefir.ru/index.php?l¼eng\&id¼260.
De Soto, H., The Other Path: The Invisible Revolution in the Third World(New York: Harper, 1990).
Dixit, A., ‘‘A Model of Duopoly Suggesting a Theory of Entry Barriers,’’Bell Journal of Economics 10 (1979) 20–32.
Djankov, S., R. La Porta, F. Lopez-de-Silanes, and A. Shleifer, ‘‘The Regu-lation of Entry,’’ Quarterly Journal of Economics 117 (2002), 1–37.
Dun and Bradstreet, US Entry Rate, 1998–99, data (2000), http://www.dnb.com/us.
Dunne, T., M. J. Roberts, and L. Samuelson, ‘‘The Growth and Failure ofU.S. Manufacturing Plants,’’ Quarterly Journal of Economics 104(1989), 671–698.
Frye, T., and A. Shleifer, ‘‘The Invisible Hand and the Grabbing Hand,’’American Economic Review 87 (1997), 354–358.
Geroski, P. A., Entry and Market Contestability: An International Com-parison (Oxford: Basil Blackwell, 1991).
——— ‘‘What Do We Know about Entry?’’ International Journal ofIndustrial Organisation 13 (1995), 421–440.
‘‘Gosstroi utverdil proektnuju dokumentatsiju Samarskoi Ikei,’’ VolgaNews, June 15, 2011.
1748 THE REVIEW OF ECONOMICS AND STATISTICS

‘‘Growing IKEA Russia Corruption Scandal: Two Execs Fired,’’ RussiaMonitor (2010), http://therussiamonitor.com/2010/02/15/growing-ikea-russia-corruption-scandal-two-execs-fired/.
Jovanovic, B., ‘‘Selection and the Evolution of Industry,’’ Econometrica50 (1982), 649–670.
Klapper, L., L. Laeven, and R. Rajan, ‘‘Entry Regulation as a Barrier toEntrepreneurship,’’ Journal of Financial Economics 82 (2006),591–629.
Lizzeri, A., and N. Persico, ‘‘A Drawback of Electoral Competition,’’ Jour-nal of the European Economic Association 3 (2005), 1318–1348.
Lofstrom, M., T. Bates, and S. Parker, ‘‘Transitions to Entrepreneurshipand Industry-Specific Barriers,’’ IZA discussion paper 6103 (2011).
McFaul, M. A., N. Petrov, and A. Ryabov, Between Dictatorship andDemocracy: Russian Post-Communist Political Reform (Washington,DC: Carnegie Endowment for International Peace, 2004).
OECD, Trade Politics in Russia: The Role of Local and Regional Govern-ments (Paris: OECD, 2002).
Popov, V., ‘‘Reform Strategies and Economic Performance of Russia’sRegions,’’ World Development 29 (2001), 865–886.
Remington, T. F., The Politics of Inequality in Russia (Cambridge: Cam-bridge University Press, 2011).
Tybout, J. R., ‘‘Manufacturing Firms in Developing Countries: How WellDo They Do, and Why,’’ Journal of Economic Literature 38(2000), 11–44.
1749INSTITUTIONAL DETERMINANTS OF NEW FIRM ENTRY IN RUSSIA