Institute for Transport Studies, University Karlsruhe Adding Value to Your Data: Analysis of Travel...
21
Institute for Transport Studies, University Karlsruhe Adding Value to Your Data: Analysis of Travel Expenses Based on Trip Diary and Enriched Odometer Reading Data Tobias Kuhnimhof, Institute for Transport Studies, University Karlsruhe
-
Upload
alberta-bradford -
Category
Documents
-
view
217 -
download
0
Transcript of Institute for Transport Studies, University Karlsruhe Adding Value to Your Data: Analysis of Travel...

Institute for Transport Studies, University Karlsruhe
Adding Value to Your Data: Analysis of Travel Expenses Based on Trip Diary and Enriched Odometer Reading Data
Tobias Kuhnimhof, Institute for Transport Studies, University Karlsruhe

Institute for Transport Studies, University Karlsruhe
Agenda
Problem Statement and Objective
Available Data: MOP, EVS
Imputing Automobile Expenditures
Approach
Results
The Problem of Imputing Public Transport Expenditures
Conclusions

Institute for Transport Studies, University Karlsruhe
Problem Statement and Objective
Little Knowledge about travel expenses and particularly relationship of expenses and mobility behavior
Reason: No sufficient Data available:
Survey Income Expenditure Mobility
EVS MOP MiD
Approach: Close this gap by imputing mobility expenditure
Institute for Transport Studies, University Karlsruhe
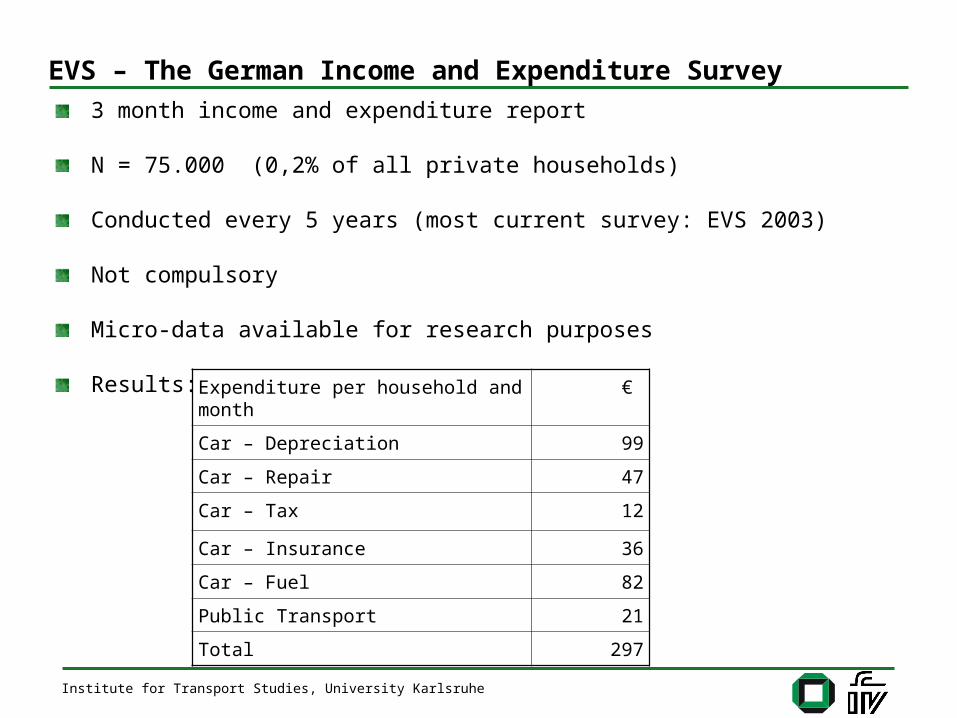
EVS – The German Income and Expenditure Survey
3 month income and expenditure report
N = 75.000 (0,2% of all private households)
Conducted every 5 years (most current survey: EVS 2003)
Not compulsory
Micro-data available for research purposes
Results: Expenditure per household and month €
Car – Depreciation 99
Car – Repair 47
Car – Tax 12
Car – Insurance 36
Car – Fuel 82
Public Transport 21
Total 297
Institute for Transport Studies, University Karlsruhe
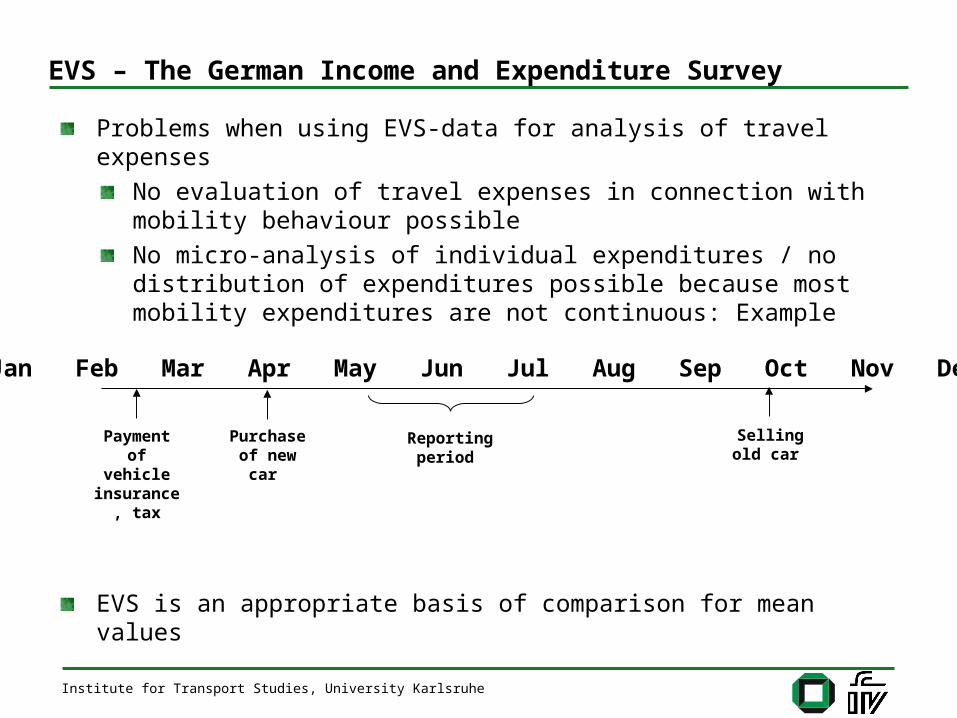
EVS – The German Income and Expenditure Survey
Problems when using EVS-data for analysis of travel expenses
No evaluation of travel expenses in connection with mobility behaviour possible
No micro-analysis of individual expenditures / no distribution of expenditures possible because most mobility expenditures are not continuous: Example
EVS is an appropriate basis of comparison for mean values
Jan Feb Mar Apr May Jun Jul Aug Sep Oct Nov Dec
Purchase of new car
Payment of vehicle
insurance, tax
Selling old car
Reporting period

Institute for Transport Studies, University Karlsruhe
The German Mobility Panel – Mobility Diary and Odometer Survey
MOP Mobility Survey:
One week trip diary in 3 consecutive years
Annual sample of ~ 1.000 households, ~ 2.000 persons
Subset of MOP households enters into odometer survey sample
N = ~ 400 vehicles
Details of the car: Make, Model, Year of construction …
3 month odometer reading survey
Each fuelling of the car is reported with: Liters, Price, Full or not?, Mileage of vehicle
Data used for this expenditure analysis: Fall 2004 / Spring 2005

Institute for Transport Studies, University Karlsruhe
The Idea of Imputing Mobility Expenditures
Imputing fixed costs based on car data, season ticket,…
Imputing out-of-pocket costs based on 7-day activity and mobility diary:
Private Train Use: KM x Price = Expenditure
Train Use on Business Trip: No Expenditure for private HH
Shared Ride / on Foot: No Expenditure
Trips by Car: KM x Fuel/KM x Fuel Price = Expenditure

Institute for Transport Studies, University Karlsruhe
Imputing Automobile Expenditures
Offline (e.g. ADAC) and online (e.g. autobudget.de) databases for car value and expenditure estimation available quite similar results
Necessary Assumptions: •Type of insurance •Annual mileage•…
Total costs per year: •Depreciation …
Monthly expenditures: •Repairs •Tax •…
Car Details: •Make, Model •Year of construction …

Institute for Transport Studies, University Karlsruhe
Imputing Automobile Expenditures
Assumptions for imputing automobile costs using autobudget.de:
Type of financing (leasing, instalment purchase, “cash”) doesn’t matter in terms of monthly cost
Holding period: 5 years
Automobile insurance:
Vehicle age > 7 years obligatory insurance only
Younger vehicles the younger the better the insurance
Fuel prices (spring 2005):
Petrol: 1.18 €/Liter
Diesel: 1.04 €/Liter
Automobile expenditures were only imputed for households with complete information about all vehicles in the household:
N=317 Cars (212 Households)

Institute for Transport Studies, University Karlsruhe
Results – Expenditures per Car
Expenditures per car and month – Comparison of EVS- and MOP-Data
Differences in expenditures for fuel can be attributed to increases of fuel prices 2003 2005
Satisfactory conformity of results
€ per month and automobile EVS (2003) MOP (2005)
Depreciation 96 79 Tax 11 13 Insurance 35 30 Repair and Maintenance 45 55 Fuel 79 103 Total 266 281

Institute for Transport Studies, University Karlsruhe
By type of registration
Results – Expenditures per Car
Expenditures per Car
0
50
100
150
200
250
300
350
400
450
500
Private Company Car of Self-Employed
Company Car ofEmployer
Eu
ro p
er M
on
th

Institute for Transport Studies, University Karlsruhe
By Age
Results – Expenditures per Car
Expenditures per Month
0
50
100
150
200
250
300
350
400
450
0 - 3 Years 4 - 6 Years 7 - 9 Years > 9 Years
Vehicle Age
Eu
ro p
er
Mo
nth Fuel
Repair
Tax
Insurance
Depreciation

Institute for Transport Studies, University Karlsruhe
Distribution of total costs per month
Results – Expenditures per Car
Automobile Total Costs Per Month
0
5
10
15
20
25
total costs per month [€]
shar
e o
f fl
eet
[%]

Institute for Transport Studies, University Karlsruhe
Results – Automobile Expenditures per Household
Expenditures per household and month – Comparison of EVS- and MOP-Data
Company cars not included
Satisfactory conformity of results
Expenditure per household and month EVS [€] MOP [€]
Car – Depreciation 99 96
Car – Repair 47 56
Car – Tax 12 13
Car – Insurance 36 35
Car – Fuel 82 93
Total 276 293

Institute for Transport Studies, University Karlsruhe
Results – Automobile Expenditures per Household
Expenditures per household and month by population of residence
Automobile Expenditures per Household and Month
0
50
100
150
200
250
300
350
400
< 20.000 20.000 - 100.000 >100.000
Population of Residence
Eu
ro p
er M
on
th
Fuel
Fixed Costs

Institute for Transport Studies, University Karlsruhe
Results – Automobile Expenditures per Household
Expenditures per household and month by incomce
Automobile Expenditures per Household and Month
0
50
100
150
200
250
300
350
400
450
500
< 1.000 Euro 1.000 - 2.000Euro
2.000 - 3.000Euro
> 3.000 Euro
Monthly Household Income
Eu
ro p
er M
on
th
Fuel
Fixed Costs
Institute for Transport Studies, University Karlsruhe
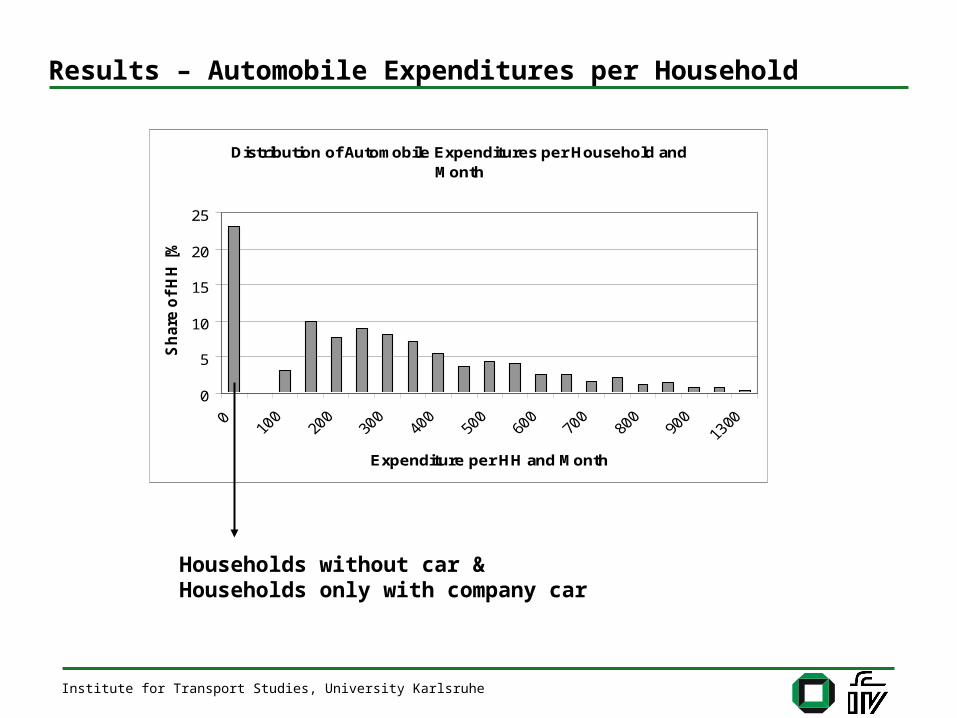
Results – Automobile Expenditures per Household
Distribution of Automobile Expenditures per Household and Month
0
5
10
15
20
25
Expenditure per HH and Month
Sh
are
of
HH
[%
]
Households without car & Households only with company car

Institute for Transport Studies, University Karlsruhe
Costs for public transport = fixed costs (Bahncard, season tickets) + out of pocket costs (tickets)
Assumptions:
Persons with disabilities ride for free
Season ticket holders ride for free when commuting and in city of residence
Bahncard holders: 25% reduction on trains
Business trips pose no expense to private households
The Problem of Imputing Public Transport Expenditures

Institute for Transport Studies, University Karlsruhe
Prices have to be assumed for:
– Urban transport single fare
– Monthly season ticket prices (normal / reduced)
– Railway prices
Actual public transport prices paid - sources of information:
Deutsche Bahn (=German Rail):total revenue / total passenger KM travelled = 0,08 € /
KM
KVV (Karlsruhe urban transport association):
total revenue / total no. of trips = 0,53 € / Trip
EVS: Monthly public transport expenditures by private households = 21 €
The Problem of Imputing Public Transport Expenditures

Institute for Transport Studies, University Karlsruhe
Assuming (low) prices:
– Urban transport single fare = 1 €
– Monthly season ticket prices (normal / reduced) = 20 € / 15 €
– Railway prices (Bahncard = 50 €) = 0.1 € / KM
Actual public transport prices paid - sources of information:
Deutsche Bahn (=German Rail):total revenue / total passenger KM travelled = 0,08 € /
KM
Σ(total expenditures for rail KM & Bahncard / rail-KM) = 0.08 € / KM
KVV (Karlsruhe urban transport association):
total revenue / total no. of trips = 0,53 € / Trip
Σ(total expenditures for single fare & season ticket / # trips) = 0.69 € / Trip
EVS: Monthly public transport expenditures by private households = 21 €
MOP: Monthly public transport expenditures by private households = 30 €
The Problem of Imputing Public Transport Expenditures

Institute for Transport Studies, University Karlsruhe
Satisfactory results of imputing automobile costs:
Maybe not exact in each individual case
But apparently no general bias
Now possible
Analysis of automobile expenditure distribution
Analysis of automobile expenditure in relation with mobility behaviour
Not yet satisfactory results of imputing public transport costs
Bias: Travellers in data set seem to spend too much on public transport
Possible explanations:- Bias in data set ? - Job ticket paid by employer? - Public transport expenditures in EVS too low?- Better assumptions and / or regional differentiation necessary?
Conclusions