
INSIDE - New Mexico Workforce Connection · · 2012-09-11Volume 39, No. 03 (published - April 30,...
20
Volume 39, No. 03 (published - April 30, 2010) Kenneth Ortiz Kenneth Ortiz Kenneth Ortiz Kenneth Ortiz Kenneth Ortiz Secretary Secretary Secretary Secretary Secretary Economic Research and Analysis P.O. Box 1928, Albuquerque, N.M. 87103 - 505.841.8645 Bill Richardson Bill Richardson Bill Richardson Bill Richardson Bill Richardson Governor Governor Governor Governor Governor www.dws.state.nm.us Growth I NSIDE A Publication Presenting Highlights of March 2010 Labor Market Data NM & MSA Highlights Page 2-6 NM Household Data History Total Nonfarm Growth NM Ranking Page 7 Area Spotlight: Eddy County Page 8 NM Unemployment Insurance Claims Page 9 Unemployment Rates by County Page 9 NM Labor Force Estimates Page 10 Unemployment Rate Rankings by County and by State Page 10-11 Nonfarm Employment: Growth Rates by Industry Page 11 Nonfarm Employment: State & MSAs Page 12-13 Article: Projections Tools- Occupational Growth in Varying Industries Page 14-15 Average Hours & Earnings & US Consumer Price Index Page 16 Workforce Information Tip Page 17 NM Occupational Shortages and Surpluses Page 17 NM Economic Activity by Area Page 18-19 March 2010 over March 2009 - Not Seasonally Adjusted Current Regional Nonfarm Employment Growth Special Article: Special Article: Special Article: Special Article: Special Article: Projections Tools Projections Tools Projections Tools Projections Tools Projections Tools Page 14 Page 14 Page 14 Page 14 Page 14 -4.5% -4.0% -3.5% -3.0% -2.5% -2.0% -1.5% -1.0% -0.5% 0.0% TX US UT NM OK CO CA AZ WY NV -1.5% -1.7% -1.9% -2.1% -2.7% -3.1% -3.1% -3.2% -3.6% -4.3% ---U.S. Average--- ...The rate of over-the-year job growth for New Mexico was negative 2.1 percent, representing a loss of 17,000 jobs. ...Over the past 12 months, payroll employment has declined by 1.7 percent, subtracting 6,300 jobs from the Albuquerque MSA economy. Job growth has been negative for 18 consecutive months. ...Over the year, the job growth rate for the Las Cruces MSA was negative at 0.4 percent, and this month marked the fifteenth consecutive month of negative job growth for Las Cruces. ...Over the year, the rate of job growth for the Santa Fe MSA was minus 1.3 percent, representing a loss of 800 jobs. ...Total employment in the Farmington MSA decreased by 3,500 jobs or 6.8 percent over the past 12 months. This continues the negative growth trend that began in December 2008.
Transcript of INSIDE - New Mexico Workforce Connection · · 2012-09-11Volume 39, No. 03 (published - April 30,...
Volume 39, No. 03 (published - April 30, 2010)
Kenneth OrtizKenneth OrtizKenneth OrtizKenneth OrtizKenneth OrtizSecretarySecretarySecretarySecretarySecretary
Economic Research and AnalysisP.O. Box 1928, Albuquerque, N.M. 87103 - 505.841.8645
Bill RichardsonBill RichardsonBill RichardsonBill RichardsonBill RichardsonGovernorGovernorGovernorGovernorGovernor
www.dws.state.nm.us
Gro
wth
INSIDE
A Publication Presenting Highlights ofMarch 2010 Labor Market Data
NM & MSA HighlightsPage 2-6
NM Household Data HistoryTotal Nonfarm Growth
NM RankingPage 7
Area Spotlight: Eddy CountyPage 8
NM Unemployment Insurance ClaimsPage 9
Unemployment Rates by CountyPage 9
NM Labor Force EstimatesPage 10
Unemployment Rate Rankingsby County and by State
Page 10-11
Nonfarm Employment:Growth Rates by Industry
Page 11
Nonfarm Employment: State & MSAsPage 12-13
Article: Projections Tools-Occupational Growth in
Varying IndustriesPage 14-15
Average Hours & Earnings& US Consumer Price Index
Page 16
Workforce Information TipPage 17
NM OccupationalShortages and Surpluses
Page 17
NM Economic Activity by AreaPage 18-19
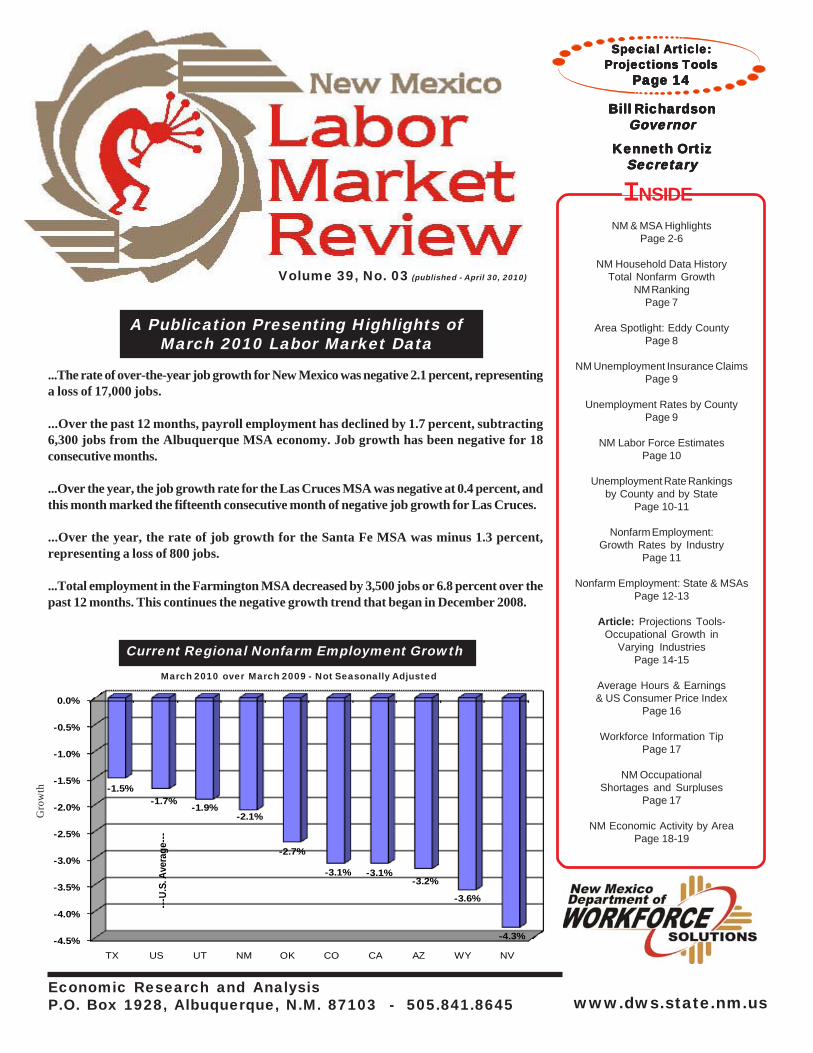
March 2010 over March 2009 - Not Seasonally Adjusted
Current Regional Nonfarm Employment Growth
Special Article:Special Article:Special Article:Special Article:Special Article:Projections ToolsProjections ToolsProjections ToolsProjections ToolsProjections Tools
Page 14Page 14Page 14Page 14Page 14
-4.5%
-4.0%
-3.5%
-3.0%
-2.5%
-2.0%
-1.5%
-1.0%
-0.5%
0.0%
TX US UT NM OK CO CA AZ WY NV
-1.5%-1.7%
-1.9%-2.1%
-2.7%
-3.1% -3.1%-3.2%
-3.6%
-4.3%
---U.
S. A
vera
ge---
...The rate of over-the-year job growth for New Mexico was negative 2.1 percent, representinga loss of 17,000 jobs.
...Over the past 12 months, payroll employment has declined by 1.7 percent, subtracting6,300 jobs from the Albuquerque MSA economy. Job growth has been negative for 18consecutive months.
...Over the year, the job growth rate for the Las Cruces MSA was negative at 0.4 percent, andthis month marked the fifteenth consecutive month of negative job growth for Las Cruces.
...Over the year, the rate of job growth for the Santa Fe MSA was minus 1.3 percent,representing a loss of 800 jobs.
...Total employment in the Farmington MSA decreased by 3,500 jobs or 6.8 percent over thepast 12 months. This continues the negative growth trend that began in December 2008.
-2-
New Mexico Labor Force and Payroll Employment
Note: Numbers may not add due to rounding.
New Mexico Prel. Revised Change From Seasonally Adjusted Mar 2010 Feb 2010 Mar 2009 Feb 2010 Mar 2009 Civilian Labor Force 966,700 964,200 954,900 +2,500 +11,800 Employment 881,200 880,700 894,500 +500 -13,300 Unemployment 85,400 83,500 60,400 +1,900 +25,000 Rate 8.8% 8.7% 6.3% Rate (not seasonally adjusted) 9.0% 8.9% 6.5%
New Mexico’s seasonally adjusted unemployment rate was 8.8 percent in March 2010, up from 8.7 percent in February and 6.3 percent ayear ago. The national unemployment rate remained at 9.7 percent.
The rate of over-the-year job growth, comparing March 2010 with March 2009, was negative 2.1 percent, representing a loss of 17,000jobs. For this indicator, New Mexico ranked thirty-fourth among the states. The national average was negative 1.7 percent. New Mexicohas experienced job losses from the impact of the national recession, and we have been especially hard hit in the goods-producingindustries of mining, construction, and manufacturing. The state relies more heavily on mining and construction employment than thenational average, so these declines have hit the state disproportionately. New Mexico was fortunate during the 2001 recession to stillhave a strong construction industry, with losses not reported until later in 2002. This time around the construction industry hasconsistently lost more jobs than any other industry in the state since the middle of 2008.
New Mexico’s economy performed well in the recent past; job growth peaked at 3.5 percent in June 2006 and unemployment reached arecord low of 3.4 percent in mid-2007. Momentum impact from the national recession led to falling job growth that escalated in late 2008.Over-the-year job growth first turned negative in November 2008 and reached a low of minus 4.9 percent for the months of September andOctober 2009. Recent months have seen gradual improvement to negative 2.1 percent. It is likely that we are several months into a slowrecovery.
The state’s unemployment rate is currently at a more than a 22-year high, having increased sharply during 2009 and so far in 2010. Evenwith the recent increases, the state’s unemployment rate is still below the national average. Until the past several years, it had been morecommon for New Mexico’s unemployment rate to be above the national average.
Four of the state’s 13 industries posted job growth since last year, while nine others reported employment declines. The largest private-sector gains were in leisure & hospitality, which added 2,200 jobs. These gains have appeared in the time since the employment serieswas benchmarked and may not stand the test of time. The number of government jobs is up by 3,900 overall, with gains of 2,600 in federalgovernment from hiring for Census 2010. Small gains are also showing up at the state and local levels. Government employment is likelyto remain strong for a while as thousands of Census Bureau workers collect information from households that did not return their Censusforms. The educational & health services industry also added jobs, just not as many as we have become accustomed to. The entireindustry was up 600 since last year, which is very low by historical standards. Rounding out the gaining industries was information,which registered an increase of 300 jobs, likely from activity from the state’s film industry.
Every other industry lost jobs over the year. The goods-producing industries of mining, manufacturing, and construction have shed acombined 10,800 jobs since last March. Mining was down 2,300 jobs over the year, while construction slipped by 7,600 andmanufacturing by 900.
The professional & business services industry, often considered a barometer for the rest of the economy, reported employment that wasdown by 3,900 jobs from last year. The transportation, warehousing & utilities industry lost 2,500 jobs, down 10.8 percent. Retail tradereported losses of 3,900, while the much smaller wholesale trade industry contracted by 1,300. The miscellaneous other services categoryreported 1,500 fewer jobs. The financial activities industry also lost jobs, declining by 100 since last March.
-3-
(Bernalillo, Sandoval, Torrance & Valencia Counties)Albuquerque MSA Labor Force and Payroll Employment
Note: Numbers may not add due to rounding.
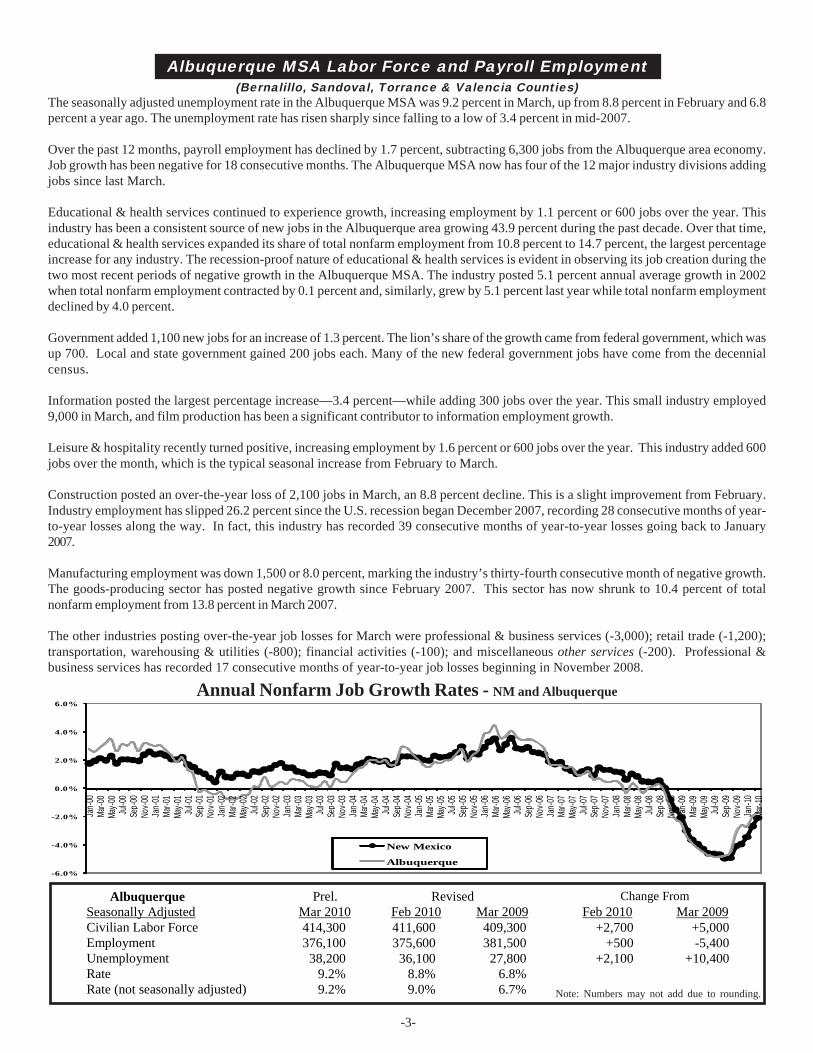
Annual Nonfarm Job Growth Rates - NM and Albuquerque
Albuquerque Prel. Revised Change From Seasonally Adjusted Mar 2010 Feb 2010 Mar 2009 Feb 2010 Mar 2009 Civilian Labor Force 414,300 411,600 409,300 +2,700 +5,000 Employment 376,100 375,600 381,500 +500 -5,400 Unemployment 38,200 36,100 27,800 +2,100 +10,400 Rate 9.2% 8.8% 6.8% Rate (not seasonally adjusted) 9.2% 9.0% 6.7%
The seasonally adjusted unemployment rate in the Albuquerque MSA was 9.2 percent in March, up from 8.8 percent in February and 6.8percent a year ago. The unemployment rate has risen sharply since falling to a low of 3.4 percent in mid-2007.
Over the past 12 months, payroll employment has declined by 1.7 percent, subtracting 6,300 jobs from the Albuquerque area economy.Job growth has been negative for 18 consecutive months. The Albuquerque MSA now has four of the 12 major industry divisions addingjobs since last March.
Educational & health services continued to experience growth, increasing employment by 1.1 percent or 600 jobs over the year. Thisindustry has been a consistent source of new jobs in the Albuquerque area growing 43.9 percent during the past decade. Over that time,educational & health services expanded its share of total nonfarm employment from 10.8 percent to 14.7 percent, the largest percentageincrease for any industry. The recession-proof nature of educational & health services is evident in observing its job creation during thetwo most recent periods of negative growth in the Albuquerque MSA. The industry posted 5.1 percent annual average growth in 2002when total nonfarm employment contracted by 0.1 percent and, similarly, grew by 5.1 percent last year while total nonfarm employmentdeclined by 4.0 percent.
Government added 1,100 new jobs for an increase of 1.3 percent. The lion’s share of the growth came from federal government, which wasup 700. Local and state government gained 200 jobs each. Many of the new federal government jobs have come from the decennialcensus.
Information posted the largest percentage increase—3.4 percent—while adding 300 jobs over the year. This small industry employed9,000 in March, and film production has been a significant contributor to information employment growth.
Leisure & hospitality recently turned positive, increasing employment by 1.6 percent or 600 jobs over the year. This industry added 600jobs over the month, which is the typical seasonal increase from February to March.
Construction posted an over-the-year loss of 2,100 jobs in March, an 8.8 percent decline. This is a slight improvement from February.Industry employment has slipped 26.2 percent since the U.S. recession began December 2007, recording 28 consecutive months of year-to-year losses along the way. In fact, this industry has recorded 39 consecutive months of year-to-year losses going back to January2007.
Manufacturing employment was down 1,500 or 8.0 percent, marking the industry’s thirty-fourth consecutive month of negative growth.The goods-producing sector has posted negative growth since February 2007. This sector has now shrunk to 10.4 percent of totalnonfarm employment from 13.8 percent in March 2007.
The other industries posting over-the-year job losses for March were professional & business services (-3,000); retail trade (-1,200);transportation, warehousing & utilities (-800); financial activities (-100); and miscellaneous other services (-200). Professional &business services has recorded 17 consecutive months of year-to-year job losses beginning in November 2008.
-6.0%
-4.0%
-2.0%
0.0%
2.0%
4.0%
6.0%
Jan-
00Ma
r-00
May-0
0Ju
l-00
Sep-
00No
v-00
Jan-
01Ma
r-01
May-0
1Ju
l-01
Sep-
01No
v-01
Jan-
02Ma
r-02
May-0
2Ju
l-02
Sep-
02No
v-02
Jan-
03Ma
r-03
May-0
3Ju
l-03
Sep-
03No
v-03
Jan-
04Ma
r-04
May-0
4Ju
l-04
Sep-
04No
v-04
Jan-
05Ma
r-05
May-0
5Ju
l-05
Sep-
05No
v-05
Jan-
06Ma
r-06
May-0
6Ju
l-06
Sep-
06No
v-06
Jan-
07Ma
r-07
May-0
7Ju
l-07
Sep-
07No
v-07
Jan-
08Ma
r-08
May-0
8Ju
l-08
Sep-
08No
v-08
Jan-
09Ma
r-09
May-0
9Ju
l-09
Sep-
09No
v-09
Jan-
10Ma
r-10
New Mexico
Albuquerque
-4-
(Doña Ana County)Las Cruces MSA Labor Force and Payroll Employment
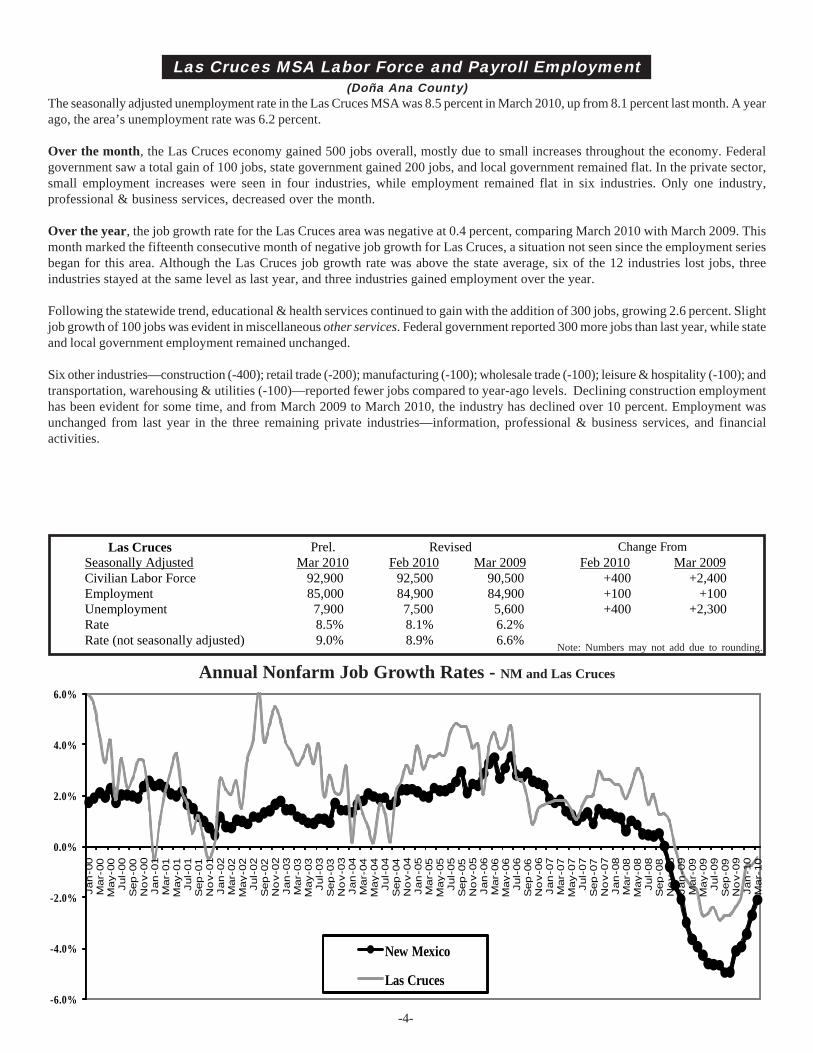
Annual Nonfarm Job Growth Rates - NM and Las Cruces
Note: Numbers may not add due to rounding.
Las Cruces Prel. Revised Change From Seasonally Adjusted Mar 2010 Feb 2010 Mar 2009 Feb 2010 Mar 2009 Civilian Labor Force 92,900 92,500 90,500 +400 +2,400 Employment 85,000 84,900 84,900 +100 +100 Unemployment 7,900 7,500 5,600 +400 +2,300 Rate 8.5% 8.1% 6.2% Rate (not seasonally adjusted) 9.0% 8.9% 6.6%
The seasonally adjusted unemployment rate in the Las Cruces MSA was 8.5 percent in March 2010, up from 8.1 percent last month. A yearago, the area’s unemployment rate was 6.2 percent.
Over the month, the Las Cruces economy gained 500 jobs overall, mostly due to small increases throughout the economy. Federalgovernment saw a total gain of 100 jobs, state government gained 200 jobs, and local government remained flat. In the private sector,small employment increases were seen in four industries, while employment remained flat in six industries. Only one industry,professional & business services, decreased over the month.
Over the year, the job growth rate for the Las Cruces area was negative at 0.4 percent, comparing March 2010 with March 2009. Thismonth marked the fifteenth consecutive month of negative job growth for Las Cruces, a situation not seen since the employment seriesbegan for this area. Although the Las Cruces job growth rate was above the state average, six of the 12 industries lost jobs, threeindustries stayed at the same level as last year, and three industries gained employment over the year.
Following the statewide trend, educational & health services continued to gain with the addition of 300 jobs, growing 2.6 percent. Slightjob growth of 100 jobs was evident in miscellaneous other services. Federal government reported 300 more jobs than last year, while stateand local government employment remained unchanged.
Six other industries—construction (-400); retail trade (-200); manufacturing (-100); wholesale trade (-100); leisure & hospitality (-100); andtransportation, warehousing & utilities (-100)—reported fewer jobs compared to year-ago levels. Declining construction employmenthas been evident for some time, and from March 2009 to March 2010, the industry has declined over 10 percent. Employment wasunchanged from last year in the three remaining private industries—information, professional & business services, and financialactivities.
-6.0%
-4.0%
-2.0%
0.0%
2.0%
4.0%
6.0%
Jan
-00
Mar
-00
Ma y
-00
Jul-
00S
ep-0
0N
ov-
00Ja
n-0
1M
ar-0
1M
ay-0
1Ju
l-01
Se p
-01
No
v-01
Jan
-02
Mar
-02
Ma y
-02
Jul-
02S
e p-0
2N
ov-
02Ja
n-0
3M
ar-0
3M
ay-0
3Ju
l-03
Se p
-03
No
v-03
Jan
-04
Mar
-04
Ma y
-04
Jul-
04S
e p-0
4N
ov-
04Ja
n-0
5M
ar-0
5M
a y-0
5Ju
l-05
Se p
-05
No
v-05
Jan
-06
Mar
-06
Ma y
-06
Jul-
06S
e p-0
6N
ov-
06Ja
n-0
7M
ar-0
7M
a y-0
7Ju
l-07
Se p
-07
No
v-07
Jan
-08
Mar
-08
Ma y
-08
Jul-
08S
e p-0
8N
ov-
08Ja
n-0
9M
ar-0
9M
a y-0
9Ju
l-09
Sep
-09
No
v-09
Jan
-10
Mar
-10
New Mexico
Las Cruces
-5-
(Santa Fe County)Santa Fe MSA Labor Force and Payroll Employment
Annual Nonfarm Job Growth Rates - NM and Santa Fe
Note: Numbers may not add due to rounding.
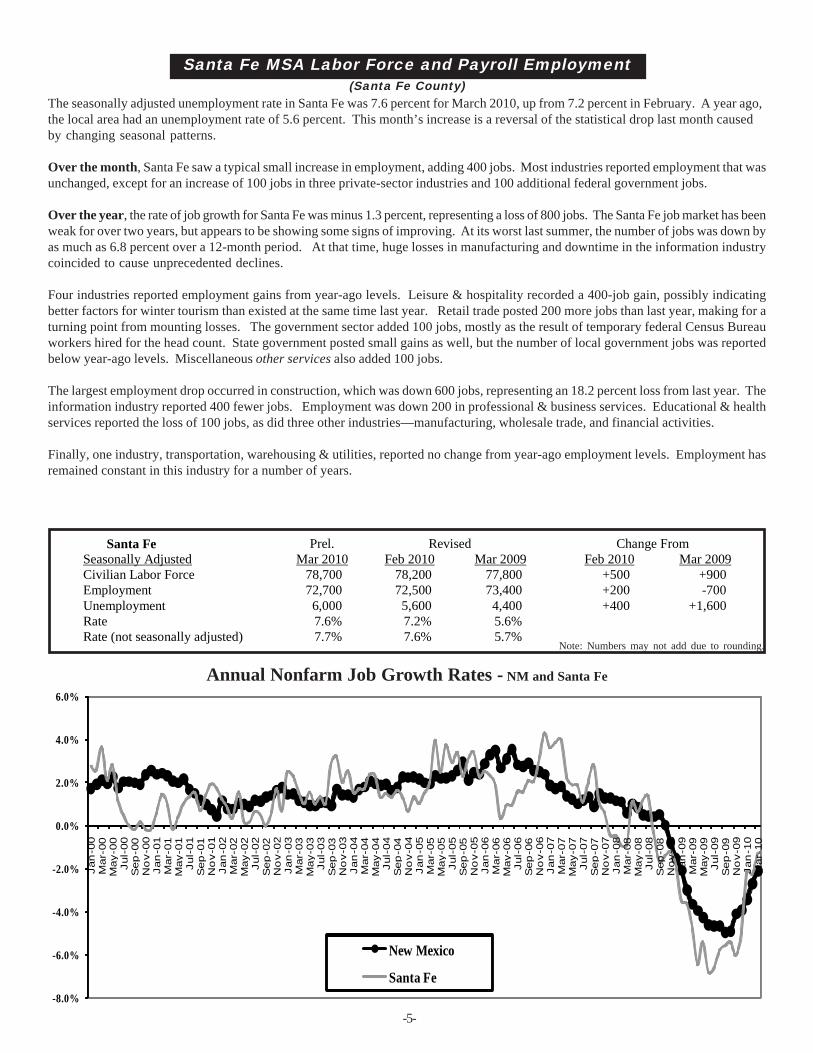
Santa Fe Prel. Revised Change From Seasonally Adjusted Mar 2010 Feb 2010 Mar 2009 Feb 2010 Mar 2009 Civilian Labor Force 78,700 78,200 77,800 +500 +900 Employment 72,700 72,500 73,400 +200 -700 Unemployment 6,000 5,600 4,400 +400 +1,600 Rate 7.6% 7.2% 5.6% Rate (not seasonally adjusted) 7.7% 7.6% 5.7%
The seasonally adjusted unemployment rate in Santa Fe was 7.6 percent for March 2010, up from 7.2 percent in February. A year ago,the local area had an unemployment rate of 5.6 percent. This month’s increase is a reversal of the statistical drop last month causedby changing seasonal patterns.
Over the month, Santa Fe saw a typical small increase in employment, adding 400 jobs. Most industries reported employment that wasunchanged, except for an increase of 100 jobs in three private-sector industries and 100 additional federal government jobs.
Over the year, the rate of job growth for Santa Fe was minus 1.3 percent, representing a loss of 800 jobs. The Santa Fe job market has beenweak for over two years, but appears to be showing some signs of improving. At its worst last summer, the number of jobs was down byas much as 6.8 percent over a 12-month period. At that time, huge losses in manufacturing and downtime in the information industrycoincided to cause unprecedented declines.
Four industries reported employment gains from year-ago levels. Leisure & hospitality recorded a 400-job gain, possibly indicatingbetter factors for winter tourism than existed at the same time last year. Retail trade posted 200 more jobs than last year, making for aturning point from mounting losses. The government sector added 100 jobs, mostly as the result of temporary federal Census Bureauworkers hired for the head count. State government posted small gains as well, but the number of local government jobs was reportedbelow year-ago levels. Miscellaneous other services also added 100 jobs.
The largest employment drop occurred in construction, which was down 600 jobs, representing an 18.2 percent loss from last year. Theinformation industry reported 400 fewer jobs. Employment was down 200 in professional & business services. Educational & healthservices reported the loss of 100 jobs, as did three other industries—manufacturing, wholesale trade, and financial activities.
Finally, one industry, transportation, warehousing & utilities, reported no change from year-ago employment levels. Employment hasremained constant in this industry for a number of years.
-8.0%
-6.0%
-4.0%
-2.0%
0.0%
2.0%
4.0%
6.0%
Jan
-00
Mar
-00
Ma y
-00
Jul-
00S
e p-0
0N
ov-
00Ja
n-0
1M
ar-0
1M
a y-0
1Ju
l-01
Se p
-01
No
v-01
Jan
-02
Mar
-02
May
-02
Jul-
02S
e p-0
2N
ov-
02Ja
n-0
3M
ar-0
3M
a y-0
3Ju
l-03
Se p
-03
No
v-03
Jan
-04
Mar
-04
Ma y
-04
Jul-
04S
e p-0
4N
ov-
04Ja
n-0
5M
ar-0
5M
a y-0
5Ju
l-05
Sep
-05
No
v-05
Jan
-06
Mar
-06
Ma y
-06
Jul-
06S
e p-0
6N
ov-
06Ja
n-0
7M
ar-0
7M
ay-0
7Ju
l-07
Se p
-07
No
v-07
Jan
-08
Mar
-08
Ma y
-08
Jul-
08S
e p-0
8N
ov-
08Ja
n-0
9M
ar-0
9M
a y-0
9Ju
l-09
Sep
-09
No
v-09
Jan
-10
Mar
-10
New Mexico
Santa Fe
Note: Numbers may not add due to rounding.
(San Juan County)Farmington MSA Labor Force and Payroll Employment
Annual Nonfarm Job Growth Rates - NM and Farmington
-6-
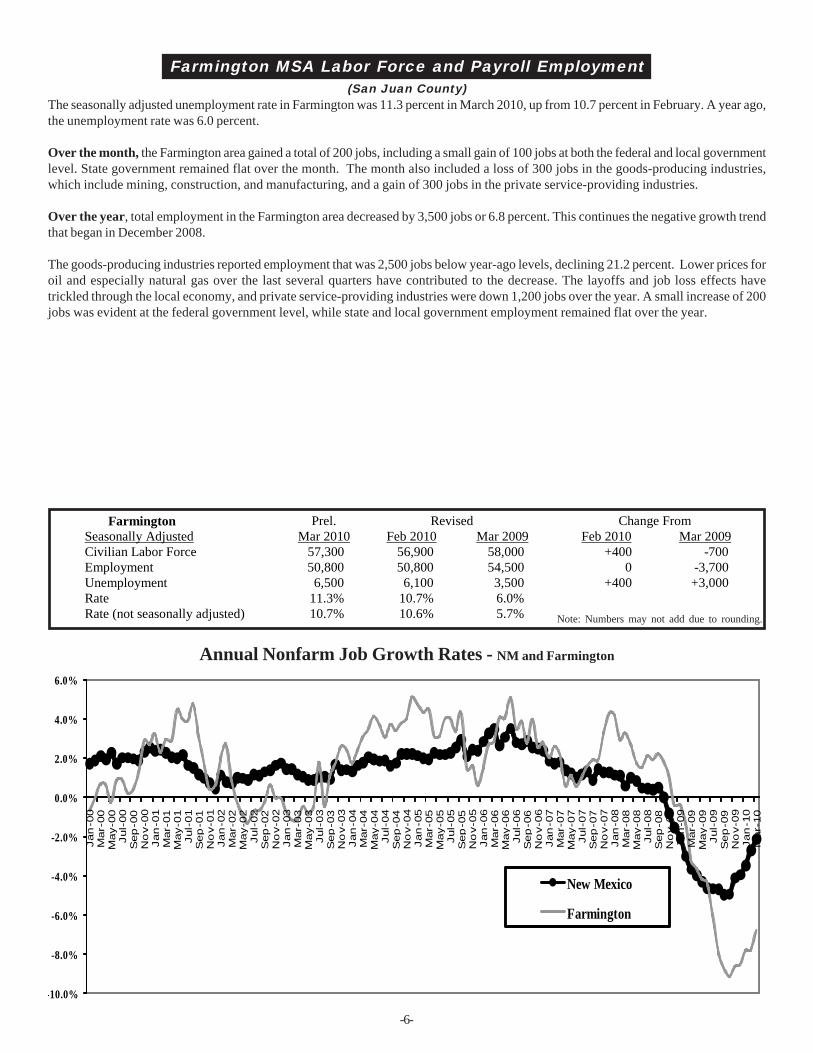
Farmington Prel. Revised Change From Seasonally Adjusted Mar 2010 Feb 2010 Mar 2009 Feb 2010 Mar 2009 Civilian Labor Force 57,300 56,900 58,000 +400 -700 Employment 50,800 50,800 54,500 0 -3,700 Unemployment 6,500 6,100 3,500 +400 +3,000 Rate 11.3% 10.7% 6.0% Rate (not seasonally adjusted) 10.7% 10.6% 5.7%
The seasonally adjusted unemployment rate in Farmington was 11.3 percent in March 2010, up from 10.7 percent in February. A year ago,the unemployment rate was 6.0 percent.
Over the month, the Farmington area gained a total of 200 jobs, including a small gain of 100 jobs at both the federal and local governmentlevel. State government remained flat over the month. The month also included a loss of 300 jobs in the goods-producing industries,which include mining, construction, and manufacturing, and a gain of 300 jobs in the private service-providing industries.
Over the year, total employment in the Farmington area decreased by 3,500 jobs or 6.8 percent. This continues the negative growth trendthat began in December 2008.
The goods-producing industries reported employment that was 2,500 jobs below year-ago levels, declining 21.2 percent. Lower prices foroil and especially natural gas over the last several quarters have contributed to the decrease. The layoffs and job loss effects havetrickled through the local economy, and private service-providing industries were down 1,200 jobs over the year. A small increase of 200jobs was evident at the federal government level, while state and local government employment remained flat over the year.
-10.0%
-8.0%
-6.0%
-4.0%
-2.0%
0.0%
2.0%
4.0%
6.0%
Jan
-00
Mar
-00
May-
00
Jul-
00
Sep
-00
No
v-00
Jan
-01
Mar
-01
May-
01
Jul-
01
Sep
-01
No
v-01
Jan
-02
Mar
-02
May-
02
Jul-
02
Sep
-02
No
v-02
Jan
-03
Mar
-03
May-
03
Jul-
03
Sep
-03
No
v-03
Jan
-04
Mar
-04
May-
04
Jul-
04
Sep
-04
No
v-04
Jan
-05
Mar
-05
May-
05
Jul-
05
Sep
-05
No
v-05
Jan
-06
Mar
-06
May-
06
Jul-
06
Sep
-06
No
v-06
Jan
-07
Mar
-07
May-
07
Jul-
07
Sep
-07
No
v-07
Jan
-08
Mar
-08
May-
08
Jul-
08
Sep
-08
No
v-08
Jan
-09
Mar
-09
May-
09
Jul-
09
Sep
-09
No
v-09
Jan
-10
Mar
-10
New Mexico
Farmington
New Mexico – Seasonally AdjustedLabor Force, Employment,
Unemployment & Unemployment Rate
Total Nonfarm Employment Growth Rankings
New Mexico and United States
-7-
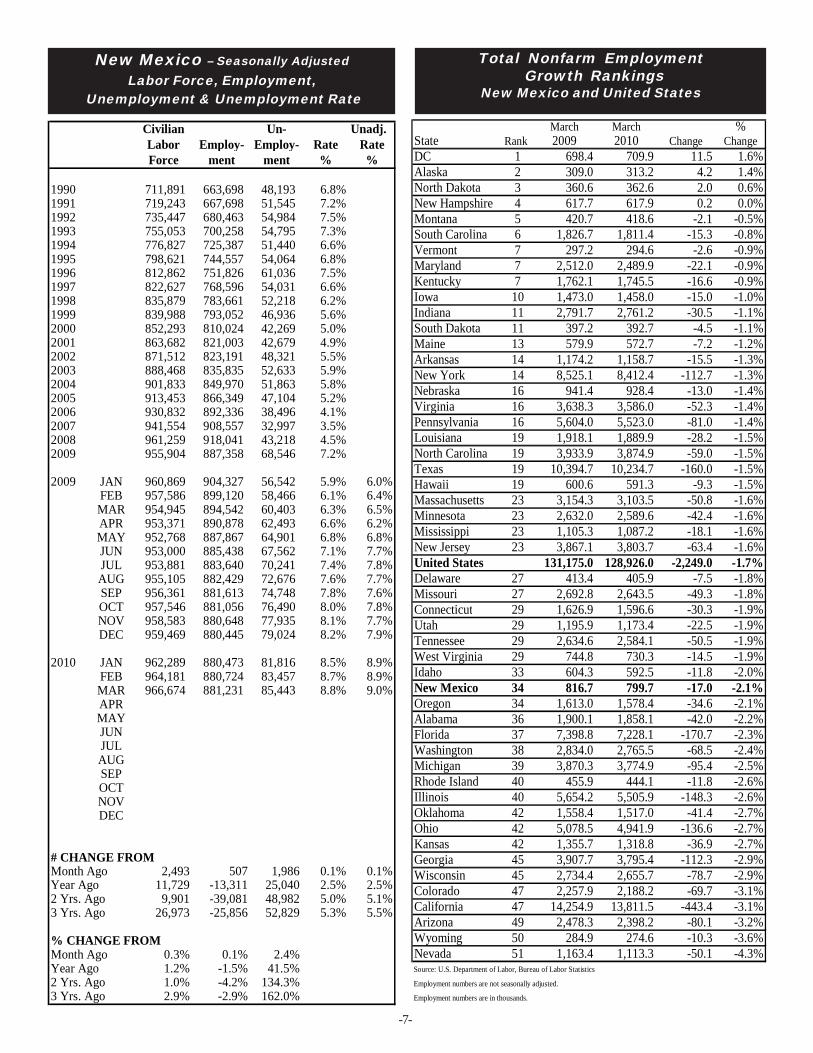
March March %State Rank 2009 2010 Change ChangeDC 1 698.4 709.9 11.5 1.6%Alaska 2 309.0 313.2 4.2 1.4%North Dakota 3 360.6 362.6 2.0 0.6%New Hampshire 4 617.7 617.9 0.2 0.0%Montana 5 420.7 418.6 -2.1 -0.5%South Carolina 6 1,826.7 1,811.4 -15.3 -0.8%Vermont 7 297.2 294.6 -2.6 -0.9%Maryland 7 2,512.0 2,489.9 -22.1 -0.9%Kentucky 7 1,762.1 1,745.5 -16.6 -0.9%Iowa 10 1,473.0 1,458.0 -15.0 -1.0%Indiana 11 2,791.7 2,761.2 -30.5 -1.1%South Dakota 11 397.2 392.7 -4.5 -1.1%Maine 13 579.9 572.7 -7.2 -1.2%Arkansas 14 1,174.2 1,158.7 -15.5 -1.3%New York 14 8,525.1 8,412.4 -112.7 -1.3%Nebraska 16 941.4 928.4 -13.0 -1.4%Virginia 16 3,638.3 3,586.0 -52.3 -1.4%Pennsylvania 16 5,604.0 5,523.0 -81.0 -1.4%Louisiana 19 1,918.1 1,889.9 -28.2 -1.5%North Carolina 19 3,933.9 3,874.9 -59.0 -1.5%Texas 19 10,394.7 10,234.7 -160.0 -1.5%Hawaii 19 600.6 591.3 -9.3 -1.5%Massachusetts 23 3,154.3 3,103.5 -50.8 -1.6%Minnesota 23 2,632.0 2,589.6 -42.4 -1.6%Mississippi 23 1,105.3 1,087.2 -18.1 -1.6%New Jersey 23 3,867.1 3,803.7 -63.4 -1.6%United States 131,175.0 128,926.0 -2,249.0 -1.7%Delaware 27 413.4 405.9 -7.5 -1.8%Missouri 27 2,692.8 2,643.5 -49.3 -1.8%Connecticut 29 1,626.9 1,596.6 -30.3 -1.9%Utah 29 1,195.9 1,173.4 -22.5 -1.9%Tennessee 29 2,634.6 2,584.1 -50.5 -1.9%West Virginia 29 744.8 730.3 -14.5 -1.9%Idaho 33 604.3 592.5 -11.8 -2.0%New Mexico 34 816.7 799.7 -17.0 -2.1%Oregon 34 1,613.0 1,578.4 -34.6 -2.1%Alabama 36 1,900.1 1,858.1 -42.0 -2.2%Florida 37 7,398.8 7,228.1 -170.7 -2.3%Washington 38 2,834.0 2,765.5 -68.5 -2.4%Michigan 39 3,870.3 3,774.9 -95.4 -2.5%Rhode Island 40 455.9 444.1 -11.8 -2.6%Illinois 40 5,654.2 5,505.9 -148.3 -2.6%Oklahoma 42 1,558.4 1,517.0 -41.4 -2.7%Ohio 42 5,078.5 4,941.9 -136.6 -2.7%Kansas 42 1,355.7 1,318.8 -36.9 -2.7%Georgia 45 3,907.7 3,795.4 -112.3 -2.9%Wisconsin 45 2,734.4 2,655.7 -78.7 -2.9%Colorado 47 2,257.9 2,188.2 -69.7 -3.1%California 47 14,254.9 13,811.5 -443.4 -3.1%Arizona 49 2,478.3 2,398.2 -80.1 -3.2%Wyoming 50 284.9 274.6 -10.3 -3.6%Nevada 51 1,163.4 1,113.3 -50.1 -4.3%Source: U.S. Department of Labor, Bureau of Labor Statistics
Employment numbers are not seasonally adjusted.
Employment numbers are in thousands.
Civilian Un- Unadj.Labor Employ- Employ- Rate RateForce ment ment % %
1990 711,891 663,698 48,193 6.8%1991 719,243 667,698 51,545 7.2%1992 735,447 680,463 54,984 7.5%1993 755,053 700,258 54,795 7.3%1994 776,827 725,387 51,440 6.6%1995 798,621 744,557 54,064 6.8%1996 812,862 751,826 61,036 7.5%1997 822,627 768,596 54,031 6.6%1998 835,879 783,661 52,218 6.2%1999 839,988 793,052 46,936 5.6%2000 852,293 810,024 42,269 5.0%2001 863,682 821,003 42,679 4.9%2002 871,512 823,191 48,321 5.5%2003 888,468 835,835 52,633 5.9%2004 901,833 849,970 51,863 5.8%2005 913,453 866,349 47,104 5.2%2006 930,832 892,336 38,496 4.1%2007 941,554 908,557 32,997 3.5%2008 961,259 918,041 43,218 4.5%2009 955,904 887,358 68,546 7.2%
2009 JAN 960,869 904,327 56,542 5.9% 6.0%FEB 957,586 899,120 58,466 6.1% 6.4%MAR 954,945 894,542 60,403 6.3% 6.5%APR 953,371 890,878 62,493 6.6% 6.2%MAY 952,768 887,867 64,901 6.8% 6.8%JUN 953,000 885,438 67,562 7.1% 7.7%JUL 953,881 883,640 70,241 7.4% 7.8%AUG 955,105 882,429 72,676 7.6% 7.7%SEP 956,361 881,613 74,748 7.8% 7.6%OCT 957,546 881,056 76,490 8.0% 7.8%NOV 958,583 880,648 77,935 8.1% 7.7%DEC 959,469 880,445 79,024 8.2% 7.9%
2010 JAN 962,289 880,473 81,816 8.5% 8.9%FEB 964,181 880,724 83,457 8.7% 8.9%MAR 966,674 881,231 85,443 8.8% 9.0%APRMAYJUNJULAUGSEPOCTNOVDEC
# CHANGE FROMMonth Ago 2,493 507 1,986 0.1% 0.1%Year Ago 11,729 -13,311 25,040 2.5% 2.5%2 Yrs. Ago 9,901 -39,081 48,982 5.0% 5.1%3 Yrs. Ago 26,973 -25,856 52,829 5.3% 5.5%
% CHANGE FROMMonth Ago 0.3% 0.1% 2.4%Year Ago 1.2% -1.5% 41.5%2 Yrs. Ago 1.0% -4.2% 134.3%3 Yrs. Ago 2.9% -2.9% 162.0%
Area Spotlight:Eddy CountyJoy Forehand, Economist
-8-
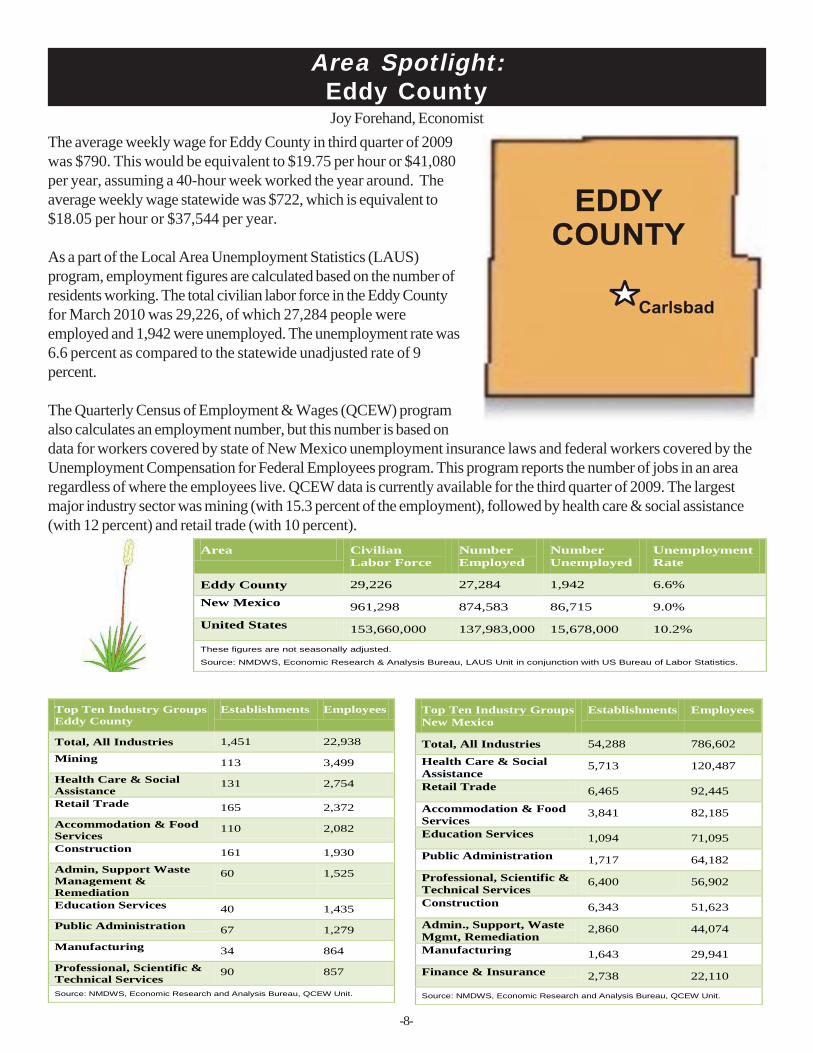
The average weekly wage for Eddy County in third quarter of 2009was $790. This would be equivalent to $19.75 per hour or $41,080per year, assuming a 40-hour week worked the year around. Theaverage weekly wage statewide was $722, which is equivalent to$18.05 per hour or $37,544 per year.
As a part of the Local Area Unemployment Statistics (LAUS)program, employment figures are calculated based on the number ofresidents working. The total civilian labor force in the Eddy Countyfor March 2010 was 29,226, of which 27,284 people wereemployed and 1,942 were unemployed. The unemployment rate was6.6 percent as compared to the statewide unadjusted rate of 9percent.
The Quarterly Census of Employment & Wages (QCEW) programalso calculates an employment number, but this number is based ondata for workers covered by state of New Mexico unemployment insurance laws and federal workers covered by theUnemployment Compensation for Federal Employees program. This program reports the number of jobs in an arearegardless of where the employees live. QCEW data is currently available for the third quarter of 2009. The largestmajor industry sector was mining (with 15.3 percent of the employment), followed by health care & social assistance(with 12 percent) and retail trade (with 10 percent).
Area Civilian Labor Force
Number Employed
Number Unemployed
Unemployment Rate
Eddy County 29,226 27,284 1,942 6.6%
New Mexico 961,298 874,583 86,715 9.0%
United States 153,660,000 137,983,000 15,678,000 10.2%
These figures are not seasonally adjusted.
Source: NMDWS, Economic Research & Analysis Bureau, LAUS Unit in conjunction with US Bureau of Labor Statistics.
Top Ten Industry Groups Eddy County
Establishments Employees
Total, All Industries 1,451 22,938
Mining 113 3,499
Health Care & Social Assistance
131 2,754
Retail Trade 165 2,372
Accommodation & Food Services
110 2,082
Construction 161 1,930
Admin, Support Waste Management & Remediation
60 1,525
Education Services 40 1,435
Public Administration 67 1,279
Manufacturing 34 864
Professional, Scientific & Technical Services
90 857
Source: NMDWS, Economic Research and Analysis Bureau, QCEW Unit.
Top Ten Industry Groups New Mexico
Establishments Employees
Total, All Industries 54,288 786,602
Health Care & Social Assistance
5,713 120,487
Retail Trade 6,465 92,445
Accommodation & Food Services
3,841 82,185
Education Services 1,094 71,095
Public Administration 1,717 64,182
Professional, Scientific & Technical Services
6,400 56,902
Construction 6,343 51,623
Admin., Support, Waste Mgmt, Remediation
2,860 44,074
Manufacturing 1,643 29,941
Finance & Insurance 2,738 22,110
Source: NMDWS, Economic Research and Analysis Bureau, QCEW Unit.
Total Nonfarm Employment Growth Rankings
New Mexico and United States
-9-
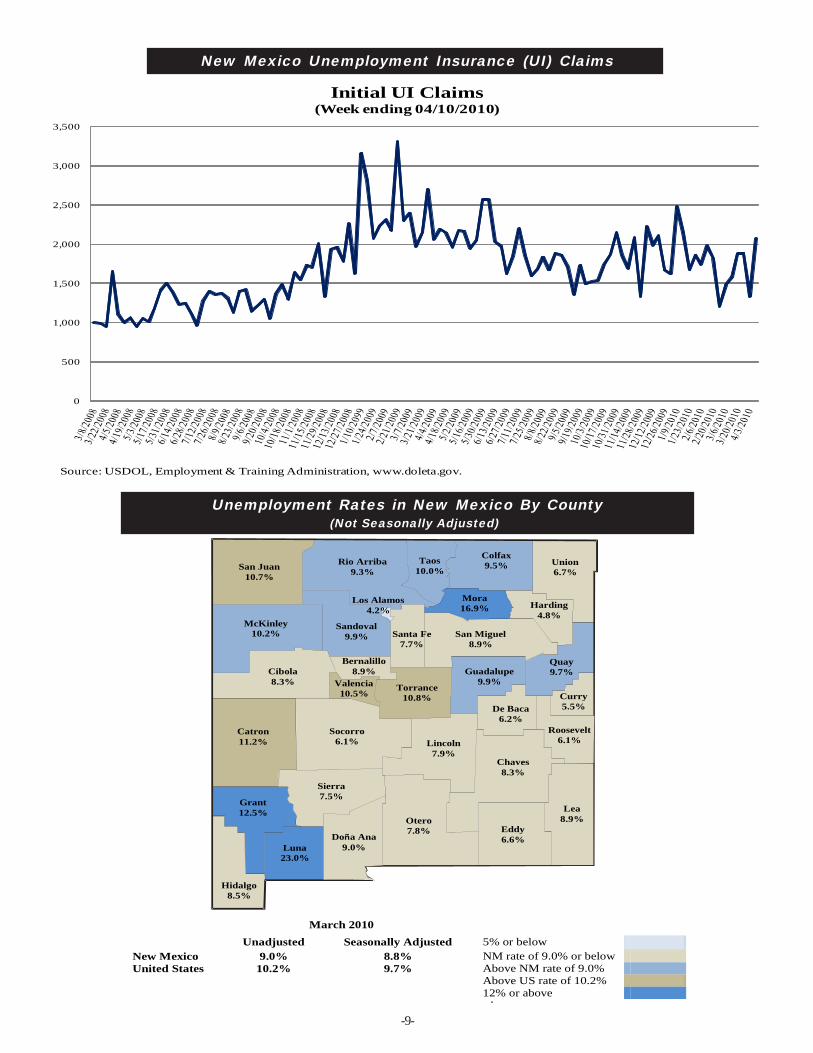
New Mexico Unemployment Insurance (UI) Claims
.
Unemployment Rates in New Mexico By County (Not Seasonally Adjusted)
0
500
1,000
1,500
2,000
2,500
3,000
3,500
Initial UI Claims(Week ending 04/10/2010)
Source: USDOL, Employment & Training Administration, www.doleta.gov.
San Juan 10.7%
Rio Arriba 9.3%
McKinley 10.2%
Sandoval 9.9%
Taos 10.0%
Colfax 9.5% Union
6.7%
Harding 4.8%
Mora 16.9%
San Miguel 8.9%
Santa Fe 7.7%
Cibola 8.3%
Torrance 10.8%
Guadalupe 9.9% Valencia
10.5%
Socorro 6.1%
Catron 11.2% Lincoln
7.9%
De Baca 6.2%
Chaves 8.3%
Quay 9.7%
Roosevelt 6.1%
Lea 8.9%
Eddy 6.6%
Otero 7.8%
Sierra 7.5%
Grant 12.5%
Luna 23.0%
Doña Ana 9.0%
Los Alamos 4.2%
Curry 5.5%
Hidalgo 8.5%
Bernalillo 8.9%
March 2010
Unadjusted Seasonally Adjusted 5% or below New Mexico 9.0% 8.8% NM rate of 9.0% or below United States 10.2% 9.7% Above NM rate of 9.0% Above US rate of 10.2% 12% or above
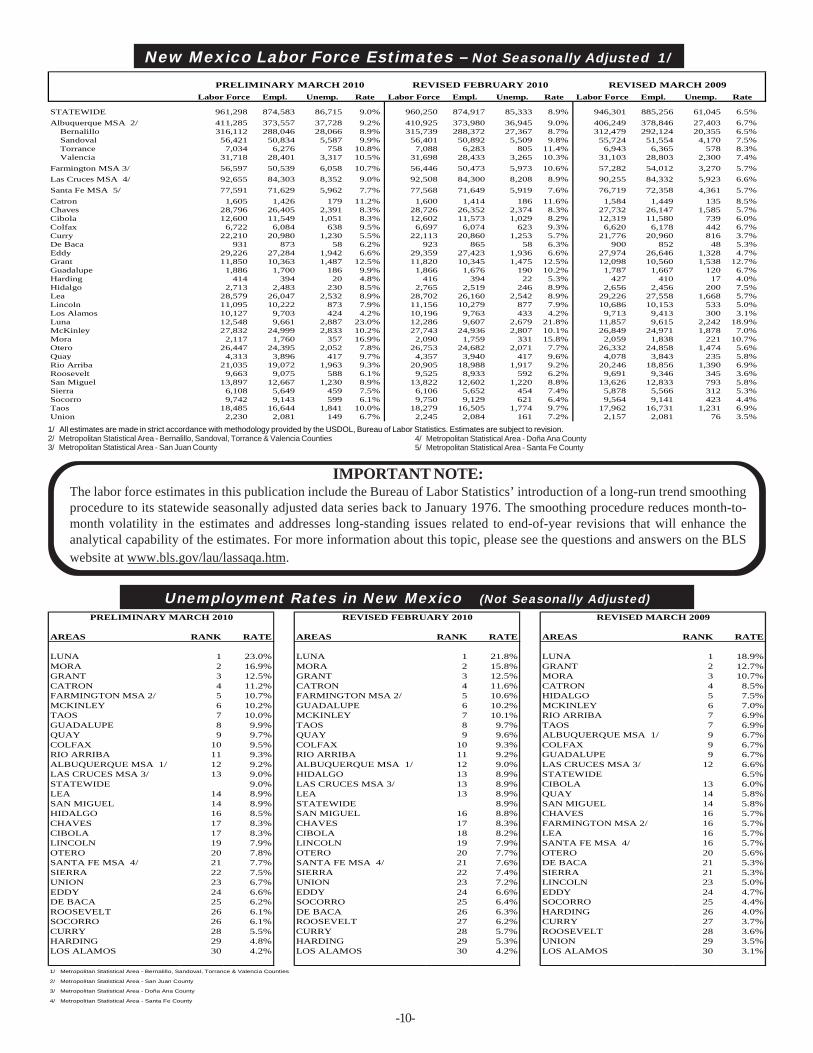
New Mexico Labor Force Estimates – Not Seasonally Adjusted 1/
Unemployment Rates in New Mexico (Not Seasonally Adjusted)
1/ All estimates are made in strict accordance with methodology provided by the USDOL, Bureau of Labor Statistics. Estimates are subject to revision.2/ Metropolitan Statistical Area - Bernalillo, Sandoval, Torrance & Valencia Counties3/ Metropolitan Statistical Area - San Juan County
4/ Metropolitan Statistical Area - Doña Ana County5/ Metropolitan Statistical Area - Santa Fe County
IMPORTANT NOTE:The labor force estimates in this publication include the Bureau of Labor Statistics’ introduction of a long-run trend smoothingprocedure to its statewide seasonally adjusted data series back to January 1976. The smoothing procedure reduces month-to-month volatility in the estimates and addresses long-standing issues related to end-of-year revisions that will enhance theanalytical capability of the estimates. For more information about this topic, please see the questions and answers on the BLSwebsite at www.bls.gov/lau/lassaqa.htm.
-10-
PRELIMINARY MARCH 2010 REVISED FEBRUARY 2010 REVISED MARCH 2009
AREAS RANK RATE AREAS RANK RATE AREAS RANK RATE
LUNA 1 23.0% LUNA 1 21.8% LUNA 1 18.9%MORA 2 16.9% MORA 2 15.8% GRANT 2 12.7%GRANT 3 12.5% GRANT 3 12.5% MORA 3 10.7%CATRON 4 11.2% CATRON 4 11.6% CATRON 4 8.5%FARMINGTON MSA 2/ 5 10.7% FARMINGTON MSA 2/ 5 10.6% HIDALGO 5 7.5%MCKINLEY 6 10.2% GUADALUPE 6 10.2% MCKINLEY 6 7.0%TAOS 7 10.0% MCKINLEY 7 10.1% RIO ARRIBA 7 6.9%GUADALUPE 8 9.9% TAOS 8 9.7% TAOS 7 6.9%QUAY 9 9.7% QUAY 9 9.6% ALBUQUERQUE MSA 1/ 9 6.7%COLFAX 10 9.5% COLFAX 10 9.3% COLFAX 9 6.7%RIO ARRIBA 11 9.3% RIO ARRIBA 11 9.2% GUADALUPE 9 6.7%ALBUQUERQUE MSA 1/ 12 9.2% ALBUQUERQUE MSA 1/ 12 9.0% LAS CRUCES MSA 3/ 12 6.6%LAS CRUCES MSA 3/ 13 9.0% HIDALGO 13 8.9% STATEWIDE 6.5%STATEWIDE 9.0% LAS CRUCES MSA 3/ 13 8.9% CIBOLA 13 6.0%LEA 14 8.9% LEA 13 8.9% QUAY 14 5.8%SAN MIGUEL 14 8.9% STATEWIDE 8.9% SAN MIGUEL 14 5.8%HIDALGO 16 8.5% SAN MIGUEL 16 8.8% CHAVES 16 5.7%CHAVES 17 8.3% CHAVES 17 8.3% FARMINGTON MSA 2/ 16 5.7%CIBOLA 17 8.3% CIBOLA 18 8.2% LEA 16 5.7%LINCOLN 19 7.9% LINCOLN 19 7.9% SANTA FE MSA 4/ 16 5.7%OTERO 20 7.8% OTERO 20 7.7% OTERO 20 5.6%SANTA FE MSA 4/ 21 7.7% SANTA FE MSA 4/ 21 7.6% DE BACA 21 5.3%SIERRA 22 7.5% SIERRA 22 7.4% SIERRA 21 5.3%UNION 23 6.7% UNION 23 7.2% LINCOLN 23 5.0%EDDY 24 6.6% EDDY 24 6.6% EDDY 24 4.7%DE BACA 25 6.2% SOCORRO 25 6.4% SOCORRO 25 4.4%ROOSEVELT 26 6.1% DE BACA 26 6.3% HARDING 26 4.0%SOCORRO 26 6.1% ROOSEVELT 27 6.2% CURRY 27 3.7%CURRY 28 5.5% CURRY 28 5.7% ROOSEVELT 28 3.6%HARDING 29 4.8% HARDING 29 5.3% UNION 29 3.5%LOS ALAMOS 30 4.2% LOS ALAMOS 30 4.2% LOS ALAMOS 30 3.1%
1/ Metropolitan Statistical Area - Bernalillo, Sandoval, Torrance & Valencia Counties
2/ Metropolitan Statistical Area - San Juan County
3/ Metropolitan Statistical Area - Doña Ana County
4/ Metropolitan Statistical Area - Santa Fe County
REVISED FEBRUARY 2010Labor Force Empl. Unemp. Rate Labor Force Empl. Unemp. Rate Labor Force Empl. Unemp. Rate
STATEWIDE 961,298 874,583 86,715 9.0% 960,250 874,917 85,333 8.9% 946,301 885,256 61,045 6.5%% %Albuquerque MSA 2/ 411,285 373,557 37,728 9.2% 410,925 373,980 36,945 9.0% 406,249 378,846 27,403 6.7% Bernalillo 316,112 288,046 28,066 8.9% 315,739 288,372 27,367 8.7% 312,479 292,124 20,355 6.5% Sandoval 56,421 50,834 5,587 9.9% 56,401 50,892 5,509 9.8% 55,724 51,554 4,170 7.5% Torrance 7,034 6,276 758 10.8% 7,088 6,283 805 11.4% 6,943 6,365 578 8.3% Valencia 31,718 28,401 3,317 10.5% 31,698 28,433 3,265 10.3% 31,103 28,803 2,300 7.4%% %Farmington MSA 3/ 56,597 50,539 6,058 10.7% 56,446 50,473 5,973 10.6% 57,282 54,012 3,270 5.7%% %Las Cruces MSA 4/ 92,655 84,303 8,352 9.0% 92,508 84,300 8,208 8.9% 90,255 84,332 5,923 6.6%% %Santa Fe MSA 5/ 77,591 71,629 5,962 7.7% 77,568 71,649 5,919 7.6% 76,719 72,358 4,361 5.7%% %Catron 1,605 1,426 179 11.2% 1,600 1,414 186 11.6% 1,584 1,449 135 8.5%Chaves 28,796 26,405 2,391 8.3% 28,726 26,352 2,374 8.3% 27,732 26,147 1,585 5.7%Cibola 12,600 11,549 1,051 8.3% 12,602 11,573 1,029 8.2% 12,319 11,580 739 6.0%Colfax 6,722 6,084 638 9.5% 6,697 6,074 623 9.3% 6,620 6,178 442 6.7%Curry 22,210 20,980 1,230 5.5% 22,113 20,860 1,253 5.7% 21,776 20,960 816 3.7%De Baca 931 873 58 6.2% 923 865 58 6.3% 900 852 48 5.3%Eddy 29,226 27,284 1,942 6.6% 29,359 27,423 1,936 6.6% 27,974 26,646 1,328 4.7%Grant 11,850 10,363 1,487 12.5% 11,820 10,345 1,475 12.5% 12,098 10,560 1,538 12.7%Guadalupe 1,886 1,700 186 9.9% 1,866 1,676 190 10.2% 1,787 1,667 120 6.7%Harding 414 394 20 4.8% 416 394 22 5.3% 427 410 17 4.0%Hidalgo 2,713 2,483 230 8.5% 2,765 2,519 246 8.9% 2,656 2,456 200 7.5%Lea 28,579 26,047 2,532 8.9% 28,702 26,160 2,542 8.9% 29,226 27,558 1,668 5.7%Lincoln 11,095 10,222 873 7.9% 11,156 10,279 877 7.9% 10,686 10,153 533 5.0%Los Alamos 10,127 9,703 424 4.2% 10,196 9,763 433 4.2% 9,713 9,413 300 3.1%Luna 12,548 9,661 2,887 23.0% 12,286 9,607 2,679 21.8% 11,857 9,615 2,242 18.9%McKinley 27,832 24,999 2,833 10.2% 27,743 24,936 2,807 10.1% 26,849 24,971 1,878 7.0%Mora 2,117 1,760 357 16.9% 2,090 1,759 331 15.8% 2,059 1,838 221 10.7%Otero 26,447 24,395 2,052 7.8% 26,753 24,682 2,071 7.7% 26,332 24,858 1,474 5.6%Quay 4,313 3,896 417 9.7% 4,357 3,940 417 9.6% 4,078 3,843 235 5.8%Rio Arriba 21,035 19,072 1,963 9.3% 20,905 18,988 1,917 9.2% 20,246 18,856 1,390 6.9%Roosevelt 9,663 9,075 588 6.1% 9,525 8,933 592 6.2% 9,691 9,346 345 3.6%San Miguel 13,897 12,667 1,230 8.9% 13,822 12,602 1,220 8.8% 13,626 12,833 793 5.8%Sierra 6,108 5,649 459 7.5% 6,106 5,652 454 7.4% 5,878 5,566 312 5.3%Socorro 9,742 9,143 599 6.1% 9,750 9,129 621 6.4% 9,564 9,141 423 4.4%Taos 18,485 16,644 1,841 10.0% 18,279 16,505 1,774 9.7% 17,962 16,731 1,231 6.9%Union 2,230 2,081 149 6.7% 2,245 2,084 161 7.2% 2,157 2,081 76 3.5%
PRELIMINARY MARCH 2010 REVISED MARCH 2009
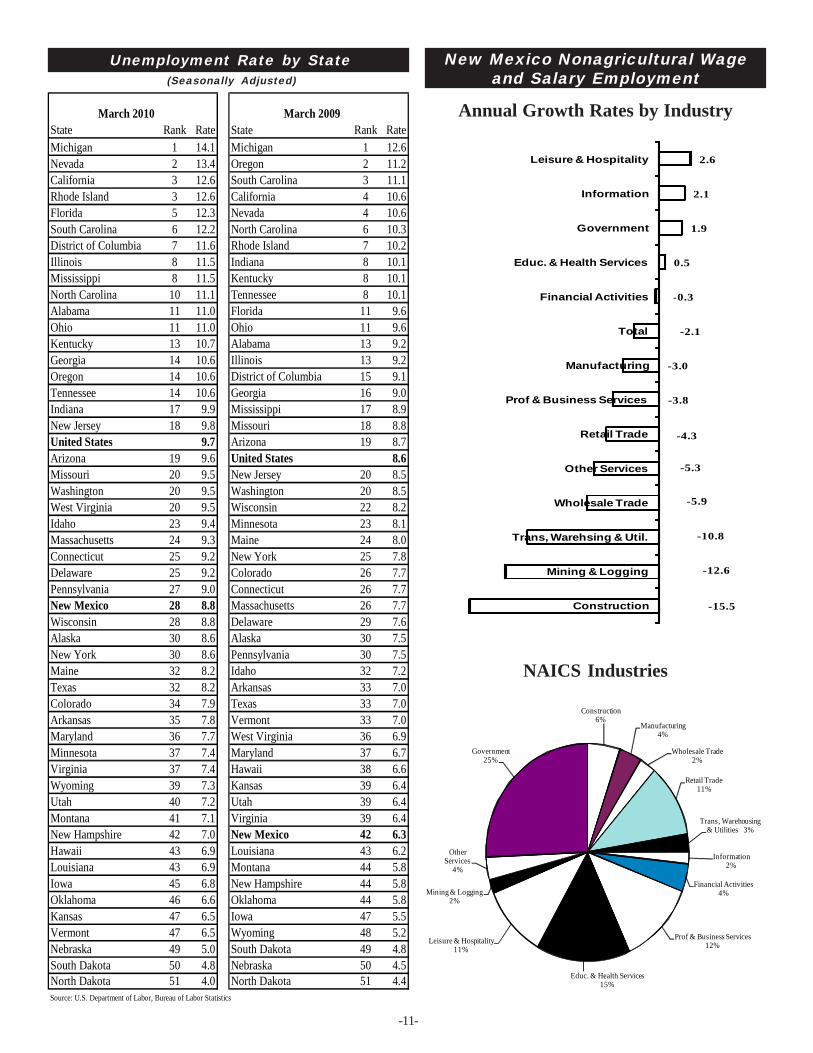
Annual Growth Rates by Industry
NAICS Industries
New Mexico Nonagricultural Wageand Salary Employment
-11-
Unemployment Rate by State(Seasonally Adjusted)
Construction6%
Manufacturing4%
Wholesale Trade2%
Retail Trade11%
Trans, Warehousing& Utilities 3%
Information2%
Financial Activities4%
Prof & Business Services12%
Educ. & Health Services15%
Leisure & Hospitality11%
Mining & Logging2%
OtherServices
4%
Government25%
March 2010 March 2009State Rank Rate State Rank RateMichigan 1 14.1 Michigan 1 12.6Nevada 2 13.4 Oregon 2 11.2California 3 12.6 South Carolina 3 11.1Rhode Island 3 12.6 California 4 10.6Florida 5 12.3 Nevada 4 10.6South Carolina 6 12.2 North Carolina 6 10.3District of Columbia 7 11.6 Rhode Island 7 10.2Illinois 8 11.5 Indiana 8 10.1Mississippi 8 11.5 Kentucky 8 10.1North Carolina 10 11.1 Tennessee 8 10.1Alabama 11 11.0 Florida 11 9.6Ohio 11 11.0 Ohio 11 9.6Kentucky 13 10.7 Alabama 13 9.2Georgia 14 10.6 Illinois 13 9.2Oregon 14 10.6 District of Columbia 15 9.1Tennessee 14 10.6 Georgia 16 9.0Indiana 17 9.9 Mississippi 17 8.9New Jersey 18 9.8 Missouri 18 8.8United States 9.7 Arizona 19 8.7Arizona 19 9.6 United States 8.6Missouri 20 9.5 New Jersey 20 8.5Washington 20 9.5 Washington 20 8.5West Virginia 20 9.5 Wisconsin 22 8.2Idaho 23 9.4 Minnesota 23 8.1Massachusetts 24 9.3 Maine 24 8.0Connecticut 25 9.2 New York 25 7.8Delaware 25 9.2 Colorado 26 7.7Pennsylvania 27 9.0 Connecticut 26 7.7New Mexico 28 8.8 Massachusetts 26 7.7Wisconsin 28 8.8 Delaware 29 7.6Alaska 30 8.6 Alaska 30 7.5New York 30 8.6 Pennsylvania 30 7.5Maine 32 8.2 Idaho 32 7.2Texas 32 8.2 Arkansas 33 7.0Colorado 34 7.9 Texas 33 7.0Arkansas 35 7.8 Vermont 33 7.0Maryland 36 7.7 West Virginia 36 6.9Minnesota 37 7.4 Maryland 37 6.7Virginia 37 7.4 Hawaii 38 6.6Wyoming 39 7.3 Kansas 39 6.4Utah 40 7.2 Utah 39 6.4Montana 41 7.1 Virginia 39 6.4New Hampshire 42 7.0 New Mexico 42 6.3Hawaii 43 6.9 Louisiana 43 6.2Louisiana 43 6.9 Montana 44 5.8Iowa 45 6.8 New Hampshire 44 5.8Oklahoma 46 6.6 Oklahoma 44 5.8Kansas 47 6.5 Iowa 47 5.5Vermont 47 6.5 Wyoming 48 5.2Nebraska 49 5.0 South Dakota 49 4.8South Dakota 50 4.8 Nebraska 50 4.5North Dakota 51 4.0 North Dakota 51 4.4Source: U.S. Department of Labor, Bureau of Labor Statistics
-15.5
-12.6
-10.8
-5.9
-5.3
-4.3
-3.8
-3.0
-2.1
-0.3
0.5
1.9
2.1
2.6
Construction
Mining & Logging
Trans, Warehsing & Util.
Wholesale Trade
Other Services
Retail Trade
Prof & Business Services
Manufacturing
Total
Financial Activities
Educ. & Health Services
Government
Information
Leisure & Hospitality
-12-
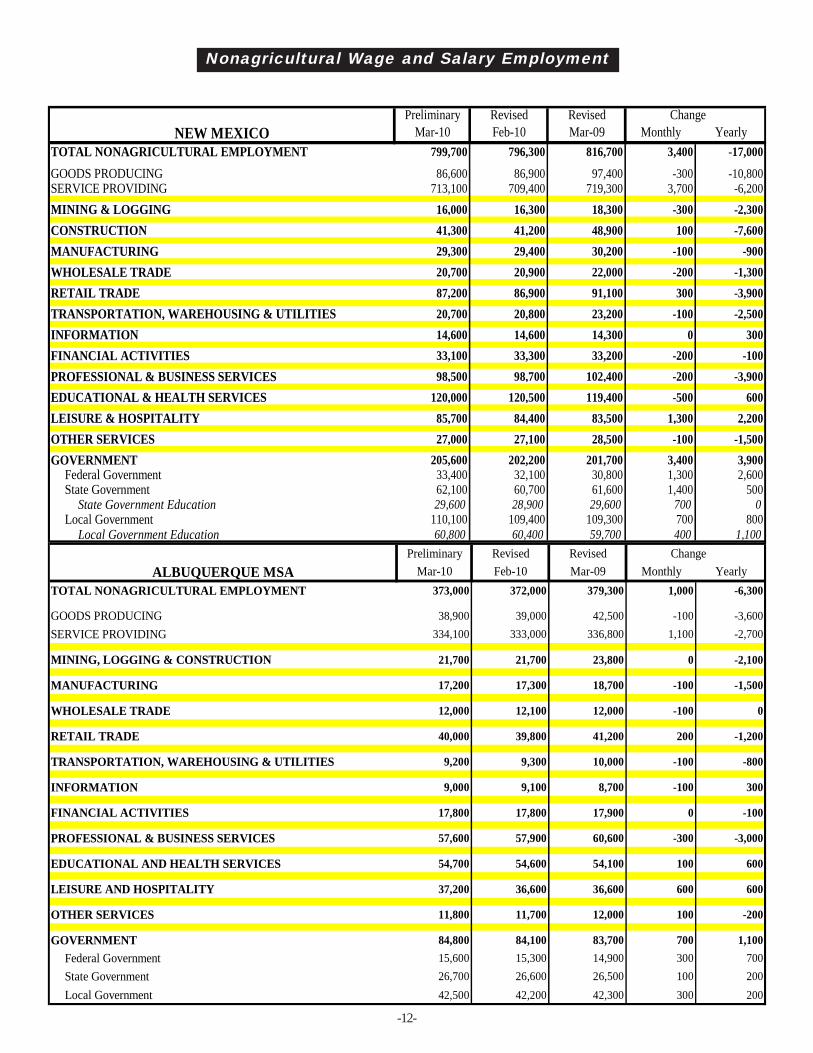
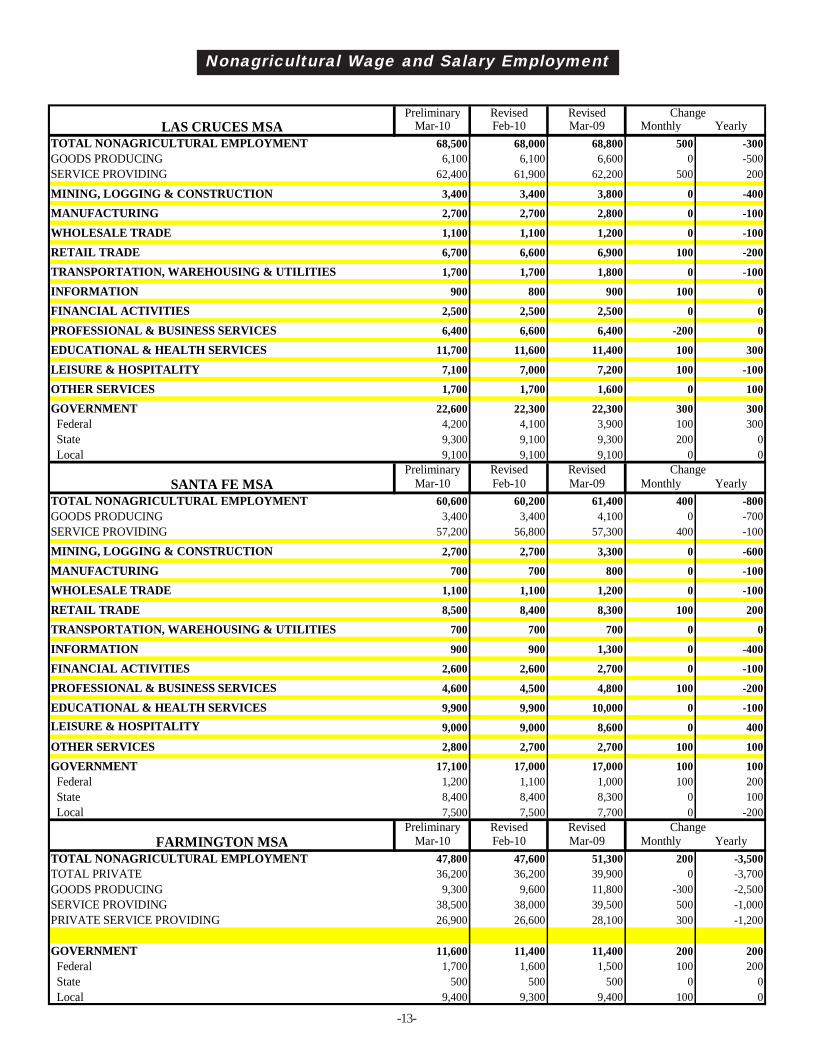
Nonagricultural Wage and Salary Employment
Preliminary Revised Revised ChangeMar-10 Feb-10 Mar-09 Monthly Yearly
TOTAL NONAGRICULTURAL EMPLOYMENT 799,700 796,300 816,700 3,400 -17,000
GOODS PRODUCING 86,600 86,900 97,400 -300 -10,800SERVICE PROVIDING 713,100 709,400 719,300 3,700 -6,200
MINING & LOGGING 16,000 16,300 18,300 -300 -2,300CONSTRUCTION 41,300 41,200 48,900 100 -7,600MANUFACTURING 29,300 29,400 30,200 -100 -900WHOLESALE TRADE 20,700 20,900 22,000 -200 -1,300RETAIL TRADE 87,200 86,900 91,100 300 -3,900TRANSPORTATION, WAREHOUSING & UTILITIES 20,700 20,800 23,200 -100 -2,500INFORMATION 14,600 14,600 14,300 0 300FINANCIAL ACTIVITIES 33,100 33,300 33,200 -200 -100PROFESSIONAL & BUSINESS SERVICES 98,500 98,700 102,400 -200 -3,900EDUCATIONAL & HEALTH SERVICES 120,000 120,500 119,400 -500 600LEISURE & HOSPITALITY 85,700 84,400 83,500 1,300 2,200OTHER SERVICES 27,000 27,100 28,500 -100 -1,500GOVERNMENT 205,600 202,200 201,700 3,400 3,900
Federal Government 33,400 32,100 30,800 1,300 2,600State Government 62,100 60,700 61,600 1,400 500
State Government Education 29,600 28,900 29,600 700 0Local Government 110,100 109,400 109,300 700 800
Local Government Education 60,800 60,400 59,700 400 1,100
NEW MEXICO
Preliminary Revised Revised ChangeMar-10 Feb-10 Mar-09 Monthly Yearly
TOTAL NONAGRICULTURAL EMPLOYMENT 373,000 372,000 379,300 1,000 -6,300
GOODS PRODUCING 38,900 39,000 42,500 -100 -3,600SERVICE PROVIDING 334,100 333,000 336,800 1,100 -2,700
MINING, LOGGING & CONSTRUCTION 21,700 21,700 23,800 0 -2,100
MANUFACTURING 17,200 17,300 18,700 -100 -1,500
WHOLESALE TRADE 12,000 12,100 12,000 -100 0
RETAIL TRADE 40,000 39,800 41,200 200 -1,200
TRANSPORTATION, WAREHOUSING & UTILITIES 9,200 9,300 10,000 -100 -800
INFORMATION 9,000 9,100 8,700 -100 300
FINANCIAL ACTIVITIES 17,800 17,800 17,900 0 -100
PROFESSIONAL & BUSINESS SERVICES 57,600 57,900 60,600 -300 -3,000
EDUCATIONAL AND HEALTH SERVICES 54,700 54,600 54,100 100 600
LEISURE AND HOSPITALITY 37,200 36,600 36,600 600 600
OTHER SERVICES 11,800 11,700 12,000 100 -200
GOVERNMENT 84,800 84,100 83,700 700 1,100Federal Government 15,600 15,300 14,900 300 700State Government 26,700 26,600 26,500 100 200Local Government 42,500 42,200 42,300 300 200
ALBUQUERQUE MSA
-13-
Nonagricultural Wage and Salary Employment
Preliminary Revised Revised ChangeMar-10 Feb-10 Mar-09 Monthly Yearly
TOTAL NONAGRICULTURAL EMPLOYMENT 68,500 68,000 68,800 500 -300GOODS PRODUCING 6,100 6,100 6,600 0 -500SERVICE PROVIDING 62,400 61,900 62,200 500 200
MINING, LOGGING & CONSTRUCTION 3,400 3,400 3,800 0 -400
MANUFACTURING 2,700 2,700 2,800 0 -100
WHOLESALE TRADE 1,100 1,100 1,200 0 -100
RETAIL TRADE 6,700 6,600 6,900 100 -200
TRANSPORTATION, WAREHOUSING & UTILITIES 1,700 1,700 1,800 0 -100
INFORMATION 900 800 900 100 0
FINANCIAL ACTIVITIES 2,500 2,500 2,500 0 0
PROFESSIONAL & BUSINESS SERVICES 6,400 6,600 6,400 -200 0
EDUCATIONAL & HEALTH SERVICES 11,700 11,600 11,400 100 300
LEISURE & HOSPITALITY 7,100 7,000 7,200 100 -100
OTHER SERVICES 1,700 1,700 1,600 0 100
GOVERNMENT 22,600 22,300 22,300 300 300 Federal 4,200 4,100 3,900 100 300 State 9,300 9,100 9,300 200 0 Local 9,100 9,100 9,100 0 0
Preliminary Revised Revised ChangeMar-10 Feb-10 Mar-09 Monthly Yearly
TOTAL NONAGRICULTURAL EMPLOYMENT 60,600 60,200 61,400 400 -800GOODS PRODUCING 3,400 3,400 4,100 0 -700SERVICE PROVIDING 57,200 56,800 57,300 400 -100
MINING, LOGGING & CONSTRUCTION 2,700 2,700 3,300 0 -600
MANUFACTURING 700 700 800 0 -100
WHOLESALE TRADE 1,100 1,100 1,200 0 -100
RETAIL TRADE 8,500 8,400 8,300 100 200
TRANSPORTATION, WAREHOUSING & UTILITIES 700 700 700 0 0
INFORMATION 900 900 1,300 0 -400
FINANCIAL ACTIVITIES 2,600 2,600 2,700 0 -100
PROFESSIONAL & BUSINESS SERVICES 4,600 4,500 4,800 100 -200
EDUCATIONAL & HEALTH SERVICES 9,900 9,900 10,000 0 -100LEISURE & HOSPITALITY 9,000 9,000 8,600 0 400
OTHER SERVICES 2,800 2,700 2,700 100 100
GOVERNMENT 17,100 17,000 17,000 100 100 Federal 1,200 1,100 1,000 100 200 State 8,400 8,400 8,300 0 100 Local 7,500 7,500 7,700 0 -200
Preliminary Revised Revised ChangeMar-10 Feb-10 Mar-09 Monthly Yearly
TOTAL NONAGRICULTURAL EMPLOYMENT 47,800 47,600 51,300 200 -3,500TOTAL PRIVATE 36,200 36,200 39,900 0 -3,700GOODS PRODUCING 9,300 9,600 11,800 -300 -2,500SERVICE PROVIDING 38,500 38,000 39,500 500 -1,000PRIVATE SERVICE PROVIDING 26,900 26,600 28,100 300 -1,200
GOVERNMENT 11,600 11,400 11,400 200 200 Federal 1,700 1,600 1,500 100 200 State 500 500 500 0 0 Local 9,400 9,300 9,400 100 0
LAS CRUCES MSA
SANTA FE MSA
FARMINGTON MSA
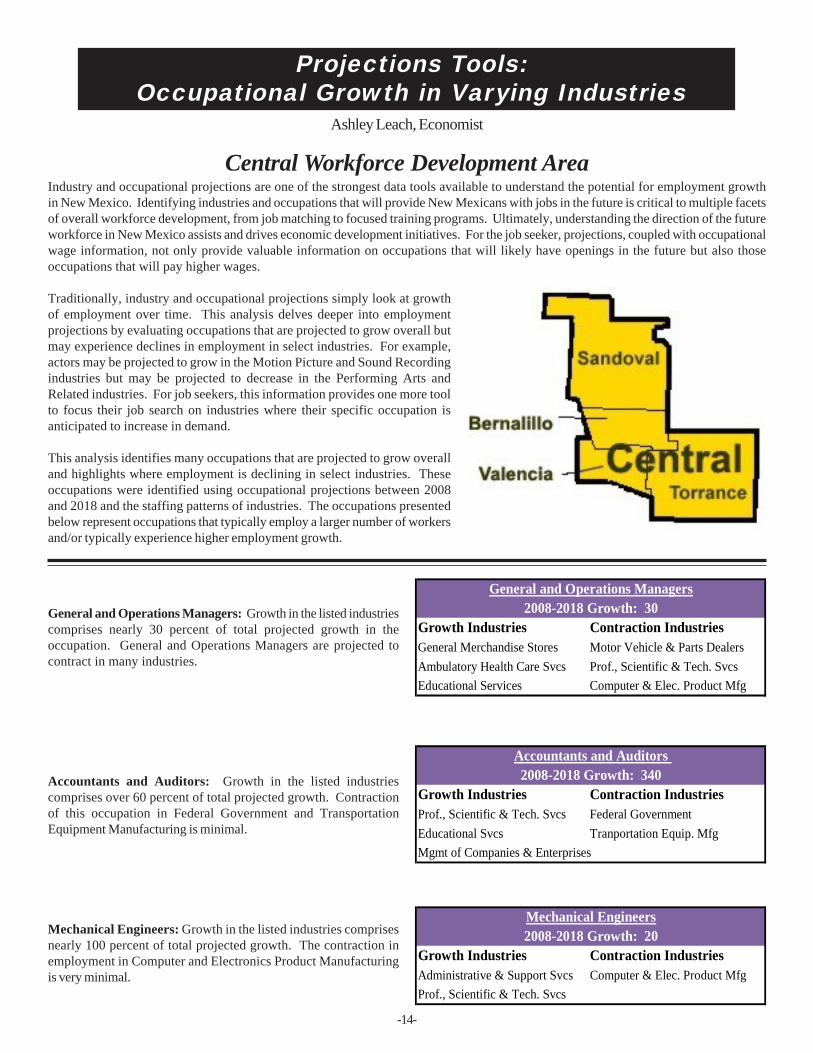
Ashley Leach, Economist
-14-
Projections Tools:Occupational Growth in Varying Industries
Central Workforce Development AreaIndustry and occupational projections are one of the strongest data tools available to understand the potential for employment growthin New Mexico. Identifying industries and occupations that will provide New Mexicans with jobs in the future is critical to multiple facetsof overall workforce development, from job matching to focused training programs. Ultimately, understanding the direction of the futureworkforce in New Mexico assists and drives economic development initiatives. For the job seeker, projections, coupled with occupationalwage information, not only provide valuable information on occupations that will likely have openings in the future but also thoseoccupations that will pay higher wages.
Traditionally, industry and occupational projections simply look at growthof employment over time. This analysis delves deeper into employmentprojections by evaluating occupations that are projected to grow overall butmay experience declines in employment in select industries. For example,actors may be projected to grow in the Motion Picture and Sound Recordingindustries but may be projected to decrease in the Performing Arts andRelated industries. For job seekers, this information provides one more toolto focus their job search on industries where their specific occupation isanticipated to increase in demand.
This analysis identifies many occupations that are projected to grow overalland highlights where employment is declining in select industries. Theseoccupations were identified using occupational projections between 2008and 2018 and the staffing patterns of industries. The occupations presentedbelow represent occupations that typically employ a larger number of workersand/or typically experience higher employment growth.
General and Operations Managers: Growth in the listed industriescomprises nearly 30 percent of total projected growth in theoccupation. General and Operations Managers are projected tocontract in many industries.
Accountants and Auditors: Growth in the listed industriescomprises over 60 percent of total projected growth. Contractionof this occupation in Federal Government and TransportationEquipment Manufacturing is minimal.
Mechanical Engineers: Growth in the listed industries comprisesnearly 100 percent of total projected growth. The contraction inemployment in Computer and Electronics Product Manufacturingis very minimal.
Growth Industries Contraction IndustriesGeneral Merchandise Stores Motor Vehicle & Parts DealersAmbulatory Health Care Svcs Prof., Scientific & Tech. SvcsEducational Services Computer & Elec. Product Mfg
2008-2018 Growth: 30General and Operations Managers
Growth Industries Contraction IndustriesProf., Scientific & Tech. Svcs Federal GovernmentEducational Svcs Tranportation Equip. MfgMgmt of Companies & Enterprises
Accountants and Auditors 2008-2018 Growth: 340
Growth Industries Contraction IndustriesAdministrative & Support Svcs Computer & Elec. Product MfgProf., Scientific & Tech. Svcs
Mechanical Engineers2008-2018 Growth: 20
-15-
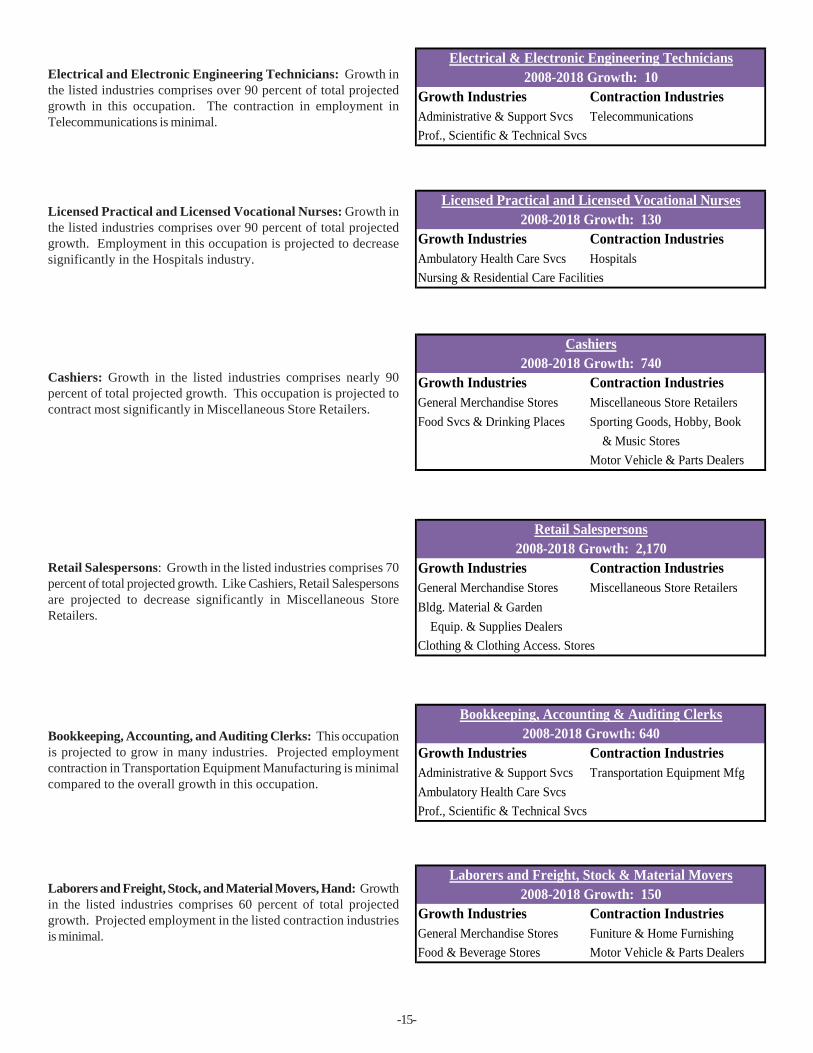
Electrical and Electronic Engineering Technicians: Growth inthe listed industries comprises over 90 percent of total projectedgrowth in this occupation. The contraction in employment inTelecommunications is minimal.
Licensed Practical and Licensed Vocational Nurses: Growth inthe listed industries comprises over 90 percent of total projectedgrowth. Employment in this occupation is projected to decreasesignificantly in the Hospitals industry.
Cashiers: Growth in the listed industries comprises nearly 90percent of total projected growth. This occupation is projected tocontract most significantly in Miscellaneous Store Retailers.
Retail Salespersons: Growth in the listed industries comprises 70percent of total projected growth. Like Cashiers, Retail Salespersonsare projected to decrease significantly in Miscellaneous StoreRetailers.
Bookkeeping, Accounting, and Auditing Clerks: This occupationis projected to grow in many industries. Projected employmentcontraction in Transportation Equipment Manufacturing is minimalcompared to the overall growth in this occupation.
Laborers and Freight, Stock, and Material Movers, Hand: Growthin the listed industries comprises 60 percent of total projectedgrowth. Projected employment in the listed contraction industriesis minimal.
Growth Industries Contraction IndustriesAdministrative & Support Svcs TelecommunicationsProf., Scientific & Technical Svcs
Electrical & Electronic Engineering Technicians2008-2018 Growth: 10
Growth Industries Contraction IndustriesAmbulatory Health Care Svcs HospitalsNursing & Residential Care Facilities
Licensed Practical and Licensed Vocational Nurses2008-2018 Growth: 130
Growth Industries Contraction IndustriesGeneral Merchandise Stores Miscellaneous Store RetailersFood Svcs & Drinking Places Sporting Goods, Hobby, Book
& Music StoresMotor Vehicle & Parts Dealers
Cashiers2008-2018 Growth: 740
Growth Industries Contraction IndustriesGeneral Merchandise Stores Miscellaneous Store RetailersBldg. Material & Garden Equip. & Supplies DealersClothing & Clothing Access. Stores
2008-2018 Growth: 2,170Retail Salespersons
Growth Industries Contraction IndustriesAdministrative & Support Svcs Transportation Equipment MfgAmbulatory Health Care SvcsProf., Scientific & Technical Svcs
Bookkeeping, Accounting & Auditing Clerks2008-2018 Growth: 640
Growth Industries Contraction IndustriesGeneral Merchandise Stores Funiture & Home Furnishing Food & Beverage Stores Motor Vehicle & Parts Dealers
Laborers and Freight, Stock & Material Movers2008-2018 Growth: 150
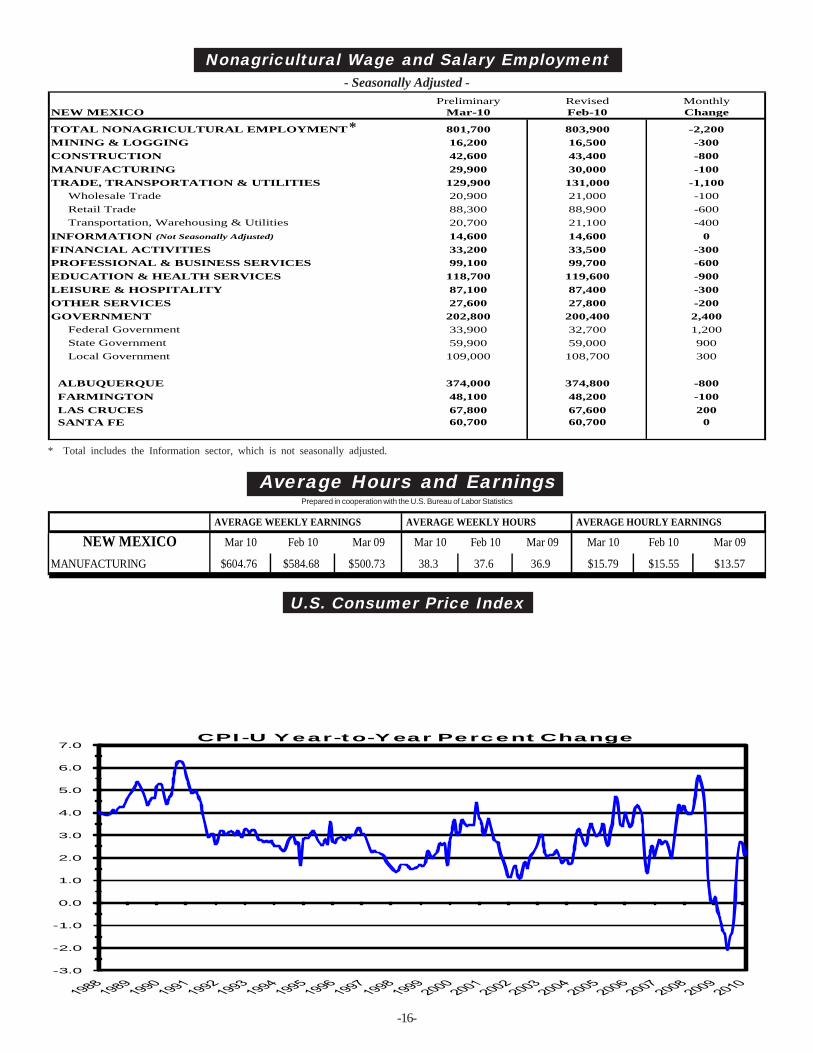
* Total includes the Information sector, which is not seasonally adjusted.
Nonagricultural Wage and Salary Employment- Seasonally Adjusted -
*
Prepared in cooperation with the U.S. Bureau of Labor Statistics
Average Hours and Earnings
U.S. Consumer Price Index
-16-
Preliminary Revised Monthly
NEW MEXICO Mar-10 Feb-10 Change
TOTAL NONAGRICULTURAL EMPLOYMENT 801,700 803,900 -2,200MINING & LOGGING 16,200 16,500 -300CONSTRUCTION 42,600 43,400 -800MANUFACTURING 29,900 30,000 -100TRADE, TRANSPORTATION & UTILITIES 129,900 131,000 -1,100 Wholesale Trade 20,900 21,000 -100 Retail Trade 88,300 88,900 -600 Transportation, Warehousing & Utilities 20,700 21,100 -400INFORMATION (Not Seasonally Adjusted) 14,600 14,600 0FINANCIAL ACTIVITIES 33,200 33,500 -300PROFESSIONAL & BUSINESS SERVICES 99,100 99,700 -600EDUCATION & HEALTH SERVICES 118,700 119,600 -900LEISURE & HOSPITALITY 87,100 87,400 -300OTHER SERVICES 27,600 27,800 -200GOVERNMENT 202,800 200,400 2,400 Federal Government 33,900 32,700 1,200 State Government 59,900 59,000 900 Local Government 109,000 108,700 300
ALBUQUERQUE 374,000 374,800 -800 FARMINGTON 48,100 48,200 -100 LAS CRUCES 67,800 67,600 200 SANTA FE 60,700 60,700 0
AVERAGE WEEKLY EARNINGS AVERAGE WEEKLY HOURS AVERAGE HOURLY EARNINGS
NEW MEXICO Mar 10 Feb 10 Mar 09 Mar 10 Feb 10 Mar 09 Mar 10 Feb 10 Mar 09
MANUFACTURING $604.76 $584.68 $500.73 38.3 37.6 36.9 $15.79 $15.55 $13.57
-3.0
-2.0
-1.0
0.0
1.0
2.0
3.0
4.0
5.0
6.0
7.0CPI-U Year-to-Year Percent Change
-17-
New Mexico Occupational Shortages and Surpluses*
Workforce Information TipHow do I find the employment situation for Rio Arriba County?
1. Start at http://laser.state.nm.us/2. Under "Historic Data Analysis" on the left-hand side of the screen, click on "Employment and Wage Data."
Click on "Labor Force Data" and click on "Labor Force, Employment & Unemployment."3. In Step 1, use the pull-down list to select "County." Then put a check mark in the box next to Rio Arriba by
clicking in the box. Click on "Select" at the bottom right of the counties.4. In Step 2, select "Monthly" from the pull-down list and then March 2010 in the box below. Click on "Search."5. Now you have a table for civilian labor force, employment, unemployment, and the unemployment rate for March.
Clicking on "Time" in the report column will result in a nice compilation of employment statistics for RioArriba.
Suzan ReaganLabor Market Information WebmasterNew Mexico Department of Workforce SolutionsEconomic Research & Analysis Bureau
For more labor market information and publications, give it a click!
www.dws.state.nm.us/dws-lmi.html
Correc Officers & Jailers Admin Services Managers Laborers & Freight, Stock & Mat Movers Dental Assistants Bookkeeping, Accting & Auditing Clerks Maids & Housekeeping CleanersLPN and LVN Cashiers Maintenance & Repair Wrkrs Nursing Aides, Orderlies & Attendants Const Carpenters Receptionists & Information ClerksRegistered Nurses Const Laborers Retail Salespersons
Customer Service Representatives Sales Representatives, Services Exec Secretaries & Admin Assts Security Guards1st-Line Super/Managers of Retail Sales Teacher AsstsHome Health Aides Truck Drivers, Heavy & Tractor-TrailerJanitors & Cleaners
Food Preparation & Serving Related Wrkrs Admin Services Managers Stock ClerksNursing Aides, Orderlies & Attendants Bookkeeping, Accting & Auditing Clerks TellersRegistered Nurses Cashiers
Computer Support SpecialistsConst LaborersCustomer Service RepresentativesExec Secretaries & Admin AsstsRetail SalespersonsSales Representatives, Services Security Guards
Correc Officers & Jailers Admin Services Managers Dental Assistants Cashiers LPN and LVN Const Laborers Nonfarm Animal Caretakers Customer Service Representatives
Home Health Aides Janitors & Cleaners Maintenance & Repair Wrkrs Medical Assts Production Wrkrs
Registered Nurses Admin Services Managers LPN and LVN Bookkeeping, Accting & Auditing Clerks
CashiersConst Laborers Customer Service Representatives Exec Secretaries & Admin Assts Receptionists & Information ClerksRetail SalespersonsSecurity Guards
Dental Assistants Admin Services Managers Probation Officers & Correc Treatment Specialists Boilermakers Truck Drivers, Heavy & Tractor-Trailer Child, Family & School Social Wrkrs
Const Laborers Janitors & Cleaners Maintenance & Repair Wrkrs Retail Salespersons
Interviewers, Census TakersOffice & Admin Support Wrkrs
**Occupational Rollover Statistics is an indicator of occupational activity with both numerous job orders & resumes in NM Workforce Connection.
Shortages SurplusesStatewide Summary Statewide Summary
Santa Fe MSA Santa Fe MSA
Albuquerque MSA Albuquerque MSA
Las Cruces MSA Las Cruces MSA
Occupational Rollover Statistics**
*Based on posted job orders & resumes entered in the NM Workforce Connection System by occupation in the last 30 Days (April 21, 2010).
Farmington MSA Farmington MSA
-18-
(SOURCES: Published articles, government documents, private and public sector news releases and reports from local NewMexico Department of Workforce Solutions Workforce Centers. In most cases, no attempt is made to verify accuracy of information.)
New Mexico Area Economic Activity
Statewide:The Job Training Incentive Program (JTIP) board approved $1,267,280in funds at its March meeting, helping to create 137 new jobs with anaverage wage of $30 an hour. March’s JTIP recipients comprised fivecompanies from Albuquerque. ClosedWon, LLC, provider ofconsultation and integration services for customers deployingSalesforce.com-based Customer Relationship Management (CRM)and related IT business systems, received $71,002 to create four newjobs. CPFD Software, developer and distributer of computer-aided-engineering (CAE) software products across international automotive,chemical, petrochemical, and power generation industries, was granted$30,998 for two new jobs. One new job was funded by the $18,498approved for IntelliCyt Corporation, developer and marketer ofinnovative high-throughput flow cytometry products for life sciencesresearch and drug discovery. The Lovelace Respiratory ResearchInstitute, a private biomedical research organization dedicated toimproving public health through research on the prevention,treatment, and cure of respiratory disease, will receive $172,335 for20 new employees. Outcomes Health Information Solutions, LLC,provider of health information management and customized web-based solutions for acquiring, mining, mobilizing, and reportinghealthcare data to payers, medical providers, and researchorganizations, plans 110 new jobs with the $974,447 approved by theboard. This was the first meeting of the JTIP board since the NewMexico Legislature agreed to continue essential funding for theprogram.
Central WIA Area:
Albuquerque Area, Bernalillo County:Work on the the Parq Central Hotel isproceeding, and the facility appears to beon track for an opening this fall. The formerMemorial Hospital, at 806 Central AvenueSW in the historic Huning Highlandneighborhood, is being converted into a74-room boutique hotel. The new hotelwill be a fusion of art deco and modern elements. The boutiqueproperty was formerly a historic hospital built in 1926 by the Atchison,Topeka and Santa Fe Railroad. The project required an industrialrevenue bond from the city and historic tax credits from the state.
Three of the five Garduño’s restaurants in Albuquerque were closedin early March. The closures by parent company Tortilla Inc. are partof a Chapter 11 bankruptcy intended to save at least part of thebusiness. About 100 people lost their jobs, roughly half of theGarduño’s workforce. The restaurants that were shut down were theMontgomery, Academy, and Fourth Street locations. The Winrockand Cottonwood restaurants are still open, along with two in LasVegas, Nevada.
In a surprise move in mid-March, Convergys Corp. announced plansto close its call center in Albuquerque. The center opened in 2007 in aspace formerly occupied by America Online. The Cincinnati firm saidin a statement that a “staggered reduction of employees” would begin
at the end of March and continue through the end of June. Employeesin good standing may interview for job openings at other Convergyslocations, according to the statement. The Albuquerque center is theone of two call centers the company operates in New Mexico. Itopened a second site in Las Cruces in early 2008. The planned closureof the Albuquerque location, which will result in the layoff of 677people, was prompted by the loss of one large customer. City and stateofficials planned a job fair for affected workers.
Sitel, a leading global business process outsourcing (BPO) provider,is continuing to expand its HomeShore call center service program inand around Albuquerque. Sitel HomeShore is a proprietary home-based agent offering designed to give Fortune 500 clients greaterflexibility in managing their outsourced customer care needs. Since itsinitial launch in 2008, the Albuquerque HomeShore program has provento be a successful model for Sitel clients across the country. Over thenext three months, Sitel plans to add an additional 200 associates tothe HomeShore program in Albuquerque. This recruitment drive willsupport the recent expansion of a major worldwide hospitality providerthat has outsourced its calls to Sitel to provide customer service andtechnical support, both online and by telephone. The program hasproven itself to be a great success in the Albuquerque area, with morethan 150 associates added in the past year. Individuals interested inexploring employment opportunities with Sitel’s home-based agentprogram in Albuquerque may visit www.sitel.com to apply online.
Rio Rancho Area, Sandoval County:The first building as part of the University of New Mexico’s (UNM)West campus located in Rio Rancho’s downtown City Center hasopened and begun serving students. The 42,000-square-foot building—part of Phase 1 of this project—has classroom space, a small bookstore,a common area, and office space for student support. There is also afood service area open to the public 7 a.m. to 7 p.m., Monday throughFriday. This two-story building will be a half mile from CNM’s first RioRancho campus building, with a new road connecting both buildings.The estimated cost for the Phase 1 building is $10.5 million. UNM’sexisting partnership with CNM will allow students to get a two-yearcommunity college degree with the opportunity to earn a bachelor’sdegree, a master’s degree, or eventually a Ph.D. from UNM West.
Sprint, the second-largest employer in Rio Rancho, was looking for200 more workers to fill new call center positions. Sprint has about adozen call centers throughout the country. The company held an on-site hiring event at the Sprint Contact Center in Rio Rancho, located at4300 Sprint Boulevard.
Eastern WIA Area:
Roswell Area, Chaves County:Travelers to Roswell will soon have somenew choices for accommodations. The newHoliday Inn Hotel & Conference Centeris in the due diligence phase and expectedto start moving forward in the near future.The new facility will be located on North
Farmington Area, San Juan County:The federal government is investing more than $32 million in stimulusfunds to help the nation’s largest American Indian reservation, theNavajo Nation, build a high-speed Internet highway that will connectthousands of homes and businesses across the sprawling reservation.U.S. Commerce Secretary Gary Locke announced the grant Thursday,saying Navajo communities in New Mexico, Arizona, and Utah willbenefit. Locke said that 60 percent of homes on the reservation lackbasic telephone service and that many Navajo communities haveunemployment levels that exceed 40 percent. He said Navajos are stuckon the wrong side of the digital divide and the grant will help fix that.Once all the fiber optic cables are in place, officials say affordablebroadband service will be accessible to 30,000 homes, 1,000 businesses,and 1,100 community institutions.
Taos Area, Taos County:The U.S. Census Bureau continued to hire people to work as Censustakers in their own neighborhoods in all areas of Taos County. The jobspay $12.25 per hour and 50 cents per mile. People could fill an applicationand take the pre-employment test at the following locations: TaosCounty Economic Development Corporation, 1021 Salazar Road, and atthe Youth and Family Center, 407 Paseo del Canon East. Some of thesejobs were available as recently as early April but may have been filled bythe time this publication is available.
Southwestern WIA Area:
Las Cruces Area, Doña Ana County:Two new restaurants could be coming to LaCruces soon. The new La Iguana restauranton the Downtown Mall is framed, and ownershave the required permits and are on track fora May opening. The eatery will be locatednear the Rio Grande Theatre on the stretch ofMain Street that has been reopened. The restaurant will have anindustrial, urban setting and will be open for breakfast, lunch, anddinner. It will include indoor and outdoor seating. The former Casa deMenudo at 1103 S. Solano Avenue will now be the location of a newrestaurant called El Patrón. It will specialize in home-style cooking withan emphasis on Mexican food. The restaurant will be open from 7 a.m. to3 p.m. Tuesday to Sunday.
Convergys Corp. is hiring for its call center in Las Cruces, following theannouncement earlier in the month that it would lay off 677 at itsAlbuquerque facility. Potential employees were invited to attend arecruitment open house on March 31. New employees will be providingservice support for a client in the telecommunications industry. Companyofficials did not give details on how many positions they are looking tofill in Las Cruces. Convergys said it will offer training, competitivewages and benefits (including medical and dental insurance), tuitionreimbursement, a 401(k) plan, and paid and unpaid time off. Five weeksof paid training will start in April for the new positions.
-19-
Main Street. A 68-suite Comfort Suites Hotel is on track andscheduled to be completed in the spring of 2010. The hotel featuresupgraded finishes, high-end furnishings, and LCD-screen TVs ineach room. The Comfort Suites Hotel is located at 3610 North MainStreet across from the Hampton Inn. Groundbreaking is also expectedto start soon for a Marriott Towneplace Suites Hotel to be locatedbetween Walgreens and La Quinta on East 19th Street. Constructionof the 71-room, extended-stay hotel is expected to take approximatelyone year.
Clovis Area, Curry County:The Federal Energy Regulatory Commission granted Tres Amigaspermission to start negotiating the price of its transmission serviceswith regulations to ensure those prices are fair. If constructed, theTres Amigas complex would allow the diversion of excess electricpower by transmitting it from one grid to the other. Governor BillRichardson has said the project could mean billions of dollars beingspent locally by the company and would bring countless constructionjobs to eastern New Mexico. In this latest ruling, the federal commissionsaid it welcomed the Tres Amigas concept.
Northern WIA Area:
Laguna Pueblo, Cibola County:The Route 66 Casino Hotel will begetting a new restaurant, live musicstage, a casino lounge, 200 brand newslots, and a new non-smoking casinosection later this summer. The projectwill also include a new Ultimate RewardsPlayers Club, Poker Room, Bingo Hall,Casino Snack Bar, and reconfigured casino floor. All of theimprovements have been carefully planned to minimize disruption ofthe daily operation. Many of the new features will be introducedindividually leading up to the planned grand opening this summer.One of the major parts of the project will be Thunder Road Cantinaand Steakhouse. The 200-seat dining and entertainment experiencewill feature steaks and barbecue specialties in an exhibition kitchen.The cantina will include a full bar with a wide selection of specialtytequilas and beers. The bar will feature a live entertainment stagewhere an eclectic variety of music will be featured on weekends andholidays.
Raton Area, Colfax County:First Solar Inc. has sold the30-megawatt Cimarron I solar project innortheast New Mexico to Southern Company, a large Georgia-basedutility, and Turner Renewable Energy, a company founded by TedTurner. The project would be the first under a partnership formed inJanuary with Turner, who owns the Vermejo Park Ranch in ColfaxCounty. The sale will not affect Tri-State Generation and TransmissionAssociation’s plans to purchase all of the project’s electricity undera 25-year contract signed with First Solar last year. Tri-State providespower to 44 electric cooperatives in four states, including 12 in NewMexico. The project will consist of 500,000, two-foot by four-footphotovoltaic panels generating enough power to serve the equivalentneeds of about 9,000 homes. It is expected to create 120 to 140construction jobs.
New Mexico Department of Workforce SolutionsEconomic Research and Analysis (CC6097)P.O. Box 1928Albuquerque, New Mexico 87103
Official BusinessPenalty for Private Use, $300
New Mexico Labor Market Reviewis a monthly publication from the New MexicoDepartment of Workforce Solutions.
Herb Greenwall, Acting Bureau Chief Economic Research and Analysis Bureau
Major Contributors: Mark Boyd, Economist Supervisor Tracy Shaleen, Economist Joy Forehand, Economist
Other Contributors: Herb Greenwall, Economist Supervisor Bob Richards, Economist Suzan Reagan, Economist Ashley Leach, Economist