
Innovation Excellence 2005 - Arthur D. Little · ADL’s 2005 global innovation excellence survey...
43
Presentation to Respondents February 2005 Innovation Excellence 2005 How companies use innovation to improve profitability and growth
Transcript of Innovation Excellence 2005 - Arthur D. Little · ADL’s 2005 global innovation excellence survey...

Presentation to Respondents
February 2005
Innovation Excellence 2005How companies use innovation to improve profitability and growth

Global_Innovation_Excellence_PresDinner_041216_v03 1
After a difficult economic period, last year has shown high GDP growth, but innovation will be crucial for further growth
Annual GDP growth
1) ForecastSources: Eurostat July 2004, Worldbank, European Commission, The Economist
-2
0
2
4
6
8
10
2000 2001 2002 2003 2004 2005
Japan
China
Euro Zone
USA
GDP growth (%)
Background – Innovation and GDP growth
Innovation is crucial
� World economy has gone through difficult time with low economic growth
� In the past few years, companies and governments have strongly focused on restructuring
� Economic outlook for 2005 is poor: GDP growth is expected to decline in the USA, Japan and China and to stagnate at a low level in the Euro zone
� Many industries increasingly focus on innovation for further growth after recent focus on cost cutting and efficiency gains have been largely exhausted
1) 1)
0

Global_Innovation_Excellence_PresDinner_041216_v03 2
There are important differences in regional innovation strength, but everywhere it is high on the public and corporate agenda
Background – Innovation Strength and R&D expenditure
Innovation Strength
1) Weighted average of various indicators concerning innovationSource: European Innovation Scoreboard 2004
0,77
0,70
0,44
0 0,2 0,4 0,6 0,8 1
Japan
Euro Zone
USA
StrongWeak
Country Innovation Index1) (Strength)
Innovation is high on the agenda
� Innovation is of paramount importance to implement the ‘Lisbon agenda’ to make Europe the world’s most competitive region
� Governments try to boost innovation in order to stimulate economic growth– Mr. Schröder declared 2004 as the ‘year
of innovation’ and set-up a dedicated innovation office
– In France, the ‘Beffa report’ advises a � 1 billion annual public/private investment to improve innovation capabilities
– In the USA, the government is investing significantly in nanotechnology
� New emerging markets yield new opportunities and challenges to globalise the innovation process
Sources: European commission, Bundeskanzleramt, LeMonde, Nature Biotechnology
0

Global_Innovation_Excellence_PresDinner_041216_v03 3
Analysed types of innovation
� Product and Service innovations: Development and commercialisation of new products or services – often in association with new technologies – to fulfil new customer demands
� Process innovations: New ways of manufacturing products or to generate services leading to advantages concerning cost, quality or logistics
Key Questions
� What is the potential of Innovation Excellence?
� Which strategic levers are used to increase growth and profitability?
� What are the most important innovation goals?
� How to achieve Innovation Excellence and what are the Key Success Factors?
� What are the main barriers in the innovation process?
� What are the trends and best practices in innovation management?
Background – Key Questions 0
Arthur D. Little used its Third Global Innovation Survey to evaluate the untapped potential of innovation and what excellent companies do
Analysis is focused on the most innovative companies (best 25% in each industry sector) to identify best practice in Innovation Excellence
Global_Innovation_Excellence_PresDinner_041216_v03 4
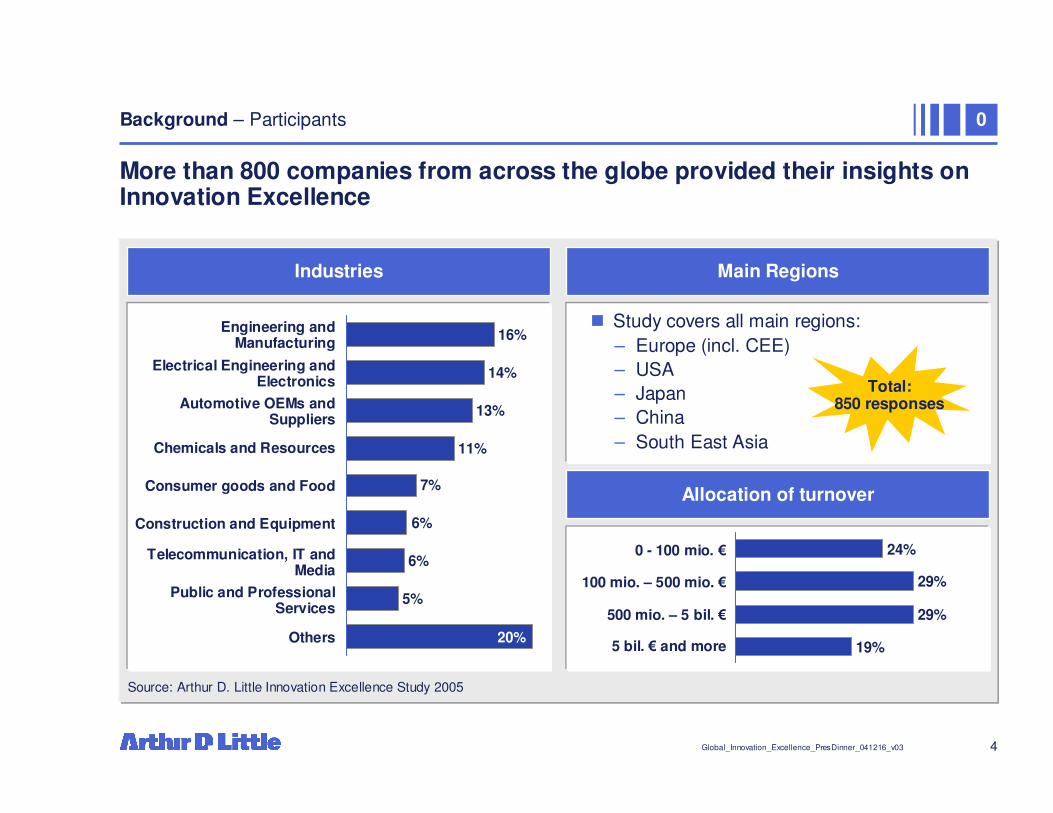
More than 800 companies from across the globe provided their insights on Innovation Excellence
16%
14%
13%
11%
7%
6%
6%
5%
20%
Source: Arthur D. Little Innovation Excellence Study 2005
24%
29%
29%
19%
0 - 100 mio. �
100 mio. – 500 mio. �
500 mio. – 5 bil. �
5 bil. � and more
Background – Participants
� Study covers all main regions:– Europe (incl. CEE)– USA– Japan– China– South East Asia
Total:850 responses
Engineering and Manufacturing
Electrical Engineering and Electronics
Automotive OEMs and Suppliers
Chemicals and Resources
Consumer goods and Food
Construction and Equipment
Telecommunication, IT and Media
Public and Professional Services
Others
Industries Main Regions
Allocation of turnover
0

Global_Innovation_Excellence_PresDinner_041216_v03 5
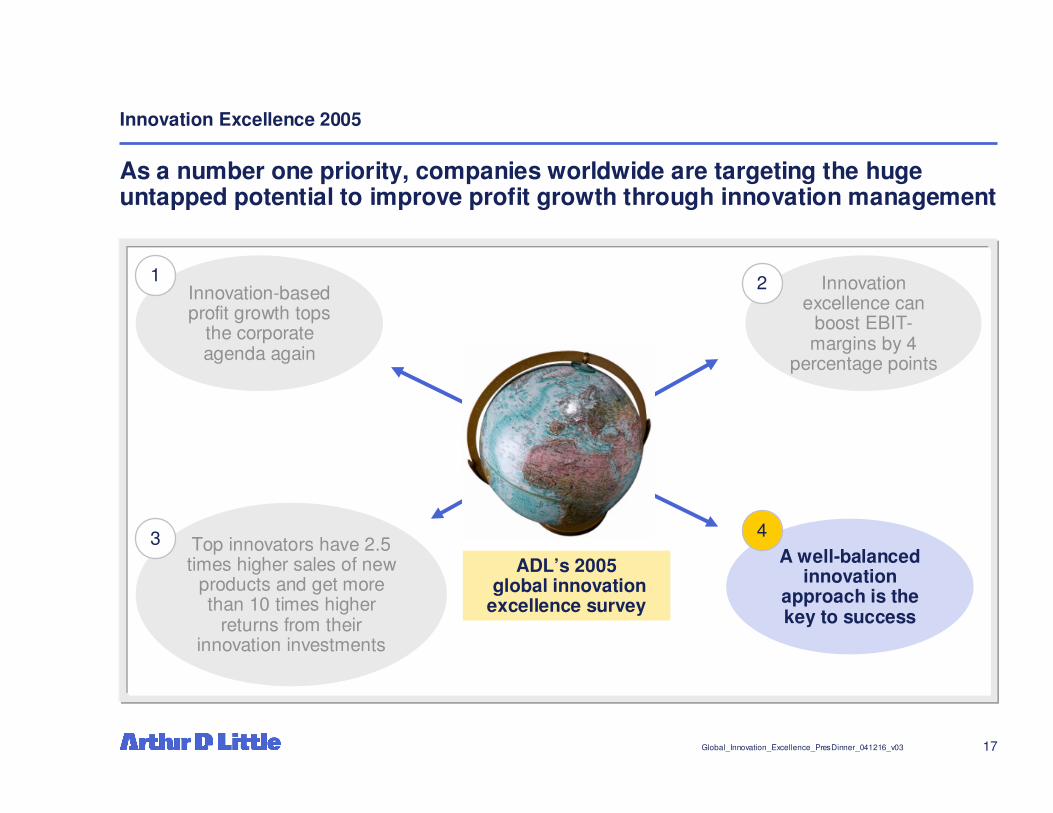
Worldwide, companies target with number one priority the huge untapped potential to improve profit growth through better innovation management
Innovation Excellence 2005
ADL’s 2005global innovation
excellence survey
Innovation-based profit growth tops
the corporate agenda again
Innovation excellence can
boost EBIT-margins by 4
percentage points
Top innovators have 2.5 times higher sales of new
products and get more than 10 times higher
returns from their innovation investments
A well-balanced innovation approach
is the key to success
1 2
3 4

Global_Innovation_Excellence_PresDinner_041216_v03 6
Levers to Increase Profitability and Growth
Companies believe that enhancing innovative ability is today the most important lever to increase profitability and growth1
1) Same answer across all regions and industries Source: Arthur D. Little Innovation Excellence Study 2005
The importance of innovation
4,3
4,0
3,9
3,7
3,7
3,7
3,6
3,4
2 3 4 5
Enhance innovation ability
Focus on core competencies
Cost cutting
Organic growth
Capital efficiency
Internationalization
Active pricing
Acquisitions and alliances
Lowimportance
Very highimportance
1

Global_Innovation_Excellence_PresDinner_041216_v03 7
There are fundamental differences between industries with regard to innovation investments and efficiency
The importance of innovation – Industry differences
Share of R&D budget in total sales in %
Sha
re o
f sal
es g
ener
ated
by
prod
ucts
laun
ched
in th
e la
st 5
yea
rs in
%
Source: Arthur D. Little Innovation Excellence Study 2005
Aerospace
0%
10%
20%
30%
40%
50%
60%
70%
0% 1% 2% 3% 4% 5% 6% 7% 8% 9% 10% 11%
Pharmaceuticals
Electrical engineering and Electronics
Automotive OEMs and Suppliers
Chemicals and Resources
Consumer goods and food
Engineering and Manufacturing
Financial Institutions
Logistics and Services
Public and Professional Services
Telecommunication, IT and Media
Utilities
Efficient Innovators High Intensity Innovators
Low intensity innovators Low Leverage Innovators
Inter-industry average
Inter-industry average
Construction and Equipment
1

Global_Innovation_Excellence_PresDinner_041216_v03 8
Industry segments can be classified in four clusters describing the differences in innovation dynamics
The importance of innovation – Clusters of Innovation 1
Source: Arthur D. Little Innovation Excellence Study 2005
Innovative Success
Efficient Innovators High Intensity Innovators
Low Intensity Innovators Low Leverage Innovators
Innovation Expenditure
High
LowHighLow
� Medium innovation expenditure at high innovation efficiency
� Development in networks and stringent profitability analysis
� Medium risk
� High innovation expenditure� Innovative ability is critical for business
success � High risk
� Low to medium innovation expenditure� Generally long product life cycles� Low risk
� High innovation expenditure at partially insufficient innovation effectiveness
� Innovation is critical but difficult to achieve� Extremely high risk
Illustrative

Global_Innovation_Excellence_PresDinner_041216_v03 9
As a number one priority, companies worldwide are targeting the huge untapped potential to improve profit growth through innovation management
Innovation Excellence 2005
ADL’s 2005global innovation
excellence survey
Innovation-based profit growth tops
the corporate agenda again
Innovation excellence can
boost EBIT-margins by 4
percentage points
Top innovators have 2.5 times higher sales of new
products and get more than 10 times higher
returns from their innovation investments
A well-balanced innovation approach
is the key to success
1 2
3 4

Global_Innovation_Excellence_PresDinner_041216_v03 10
Increase rate of innovation1)
Increase sales
Shorten time to market
Reduction of product cost
Reduction of develop-ment cost2)
Improvement Potential Absolute increase in EBIT margin
1) Number of successful new product launches per year2) Project specific development costsSource: Arthur D. Little Innovation Excellence Study 2005
Bot
tom
line
Top
line
15%
15%
16%
26%
28%
Average all industries
Improvement Potential
Achieving Innovation Excellence can boost the EBIT-margin by 4 percentage points through both top line growth and bottom line improvements
4 percentage points
2

Global_Innovation_Excellence_PresDinner_041216_v03 11
In some industries poor innovators are expected to catch up, while in other industries top innovators believe they will strengthen their position
Improvement Potential
CommentsDifference in EBIT-margin improvement (%)
� Poor innovators will try to ‘catch up’
(2,4)
(1,9)
(1,6)
(0,9)
(0,8)
(0,7)
0,1
0,2
0,8
1,0
2,2
2,3
3,5
-4 -3 -2 -1 0 1 2 3 4
Telecom, IT and Media
Public and Professional Services
Logistics and Services
Electrical Eng. and Electronics
Financial Institutions
Engineering and Manufacturing
Chemicals
Pharmaceuticals
Automotive OEMs and Suppliers
Construction and Equipment
Aerospace
Consumer goods and Food
Utilities
Source: Arthur D. Little Innovation Excellence Study 2005
Top innovators* see less
improvement potential than
poor innovators
Top innovators* see more
improvement potential than
poor innovators
� ‘Status Quo’
� Top innovators will strengthen their position
* Top 25% in innovation efficiency vs. bottom 25% (poor innovators)
2

Global_Innovation_Excellence_PresDinner_041216_v03 12
The innovation improvement potential and focus differ per industry
Source: Arthur D. Little Innovation Excellence Study 2005
Chemicals and ResourcesAutomotive
Engineering & Manufacturing Financial Institutions
Telecommunication, IT, Media
0%
10%
20%
30%
40% Increase rate of innovation
Shorten time-to-market
Increase in sales
Reduction of development
cost
Reduction of product
cost
0%
10%
20%
30%
40% Increase rate of innovation
Shorten time-to-market
Increase in sales
Reduction of development
cost
Reduction of product
cost
0%
10%
20%
30%
40% Increase rate of innovation
Shorten time-to-market
Increase in sales
Reduction of development
cost
Reduction of product
cost
0%
10%
20%
30%
40% Increase rate of innovation
Shorten time-to-market
Increase in sales
Reduction of development
cost
Reduction of product
cost
Consumer goods and food
0%
10%
20%
30%
40% Increase rate of innovation
Shorten time-to-market
Increase in sales
Reduction of development
cost
Reduction of product
cost
0%
10%
20%
30%
40% Increase rate of innovation
Shorten time-to-market
Increase in sales
Reduction of development
cost
Reduction of product
cost
Improvement Potential 2

Global_Innovation_Excellence_PresDinner_041216_v03 13
As a number one priority, companies worldwide are targeting the huge untapped potential to improve profit growth through innovation management
Innovation Excellence 2005
ADL’s 2005global innovation
excellence survey
Innovation-based profit growth tops
the corporate agenda again
Innovation excellence can
boost EBIT-margins by 4
percentage points
Top innovators have 2.5 times higher sales of new products and get
more than 10 times higher returns from
their innovation investments
A well-balanced innovation approach
is the key to success
1 2
3 4

Global_Innovation_Excellence_PresDinner_041216_v03 14
Share of total sales generated by new products in %
On average, Top Quartile Innovators have 2.5 times higher sales of new1
products than companies in the bottom quartile
Consumer goods and Food
Low share of new products
High share of new products
Electrical Engineering & Electronics
Telecommunication, IT, Media
Logistics and Services
Aerospace
Chemicals and Resources
Pharmaceuticals
Engineering & Manufacturing
Financial Institutions
Utilities
56%
66%
60%
43%
37%
40%
48%
39%
31%
33%
27%
8%
49%
60%
19%
20%
7%
23%
7%
6%
10%
26%
20%
24%
20%
11%
15%
14%
1) Products less than 5 years old2) Top innovators are defined as the 25% best performing companies in each industry in terms of innovation efficiencySource: Arthur D. Little Innovation Excellence Study 2005
Public and Professional Services
Automotive OEMs & Suppliers
Construction and Equipment
Average
Top Innovators2 (top 25%)Poor Innovators (bottom 25%)
Good Innovators are much better than bad ones 3

Global_Innovation_Excellence_PresDinner_041216_v03 15
Innovation efficiency factor1)
The Top Quartile Innovators get more than 10 times higher returns from their innovation investment
Low efficiency Very high efficiency
Top Innovators (top 25%)
Poor Innovators (bottom 25%)
1) Share of total sales generated by new products / Share of total sales spent on R&D (higher value means higher efficiency)Source: Arthur D. Little Innovation Excellence Study 2005
Consumer goods and Food
Logistics and Services
Public and Professional Services
Electrical Engineering & Electronics
Construction and Equipment
Financial Institutions
Automotive OEMs & Suppliers
Chemicals and Resources
Pharmaceuticals
Utilities
63
63
36
32
31
32
28
30
18
10
70
43
39
45
5,1
0,9
3,3
2,4
2,4
3,1
2,0
2,1
2,1
2,1
4,3
3,6
4,0
1,7Aerospace
Telecommunication, IT, Media
Engineering & Manufacturing
Average
Good Innovators are much better than bad ones 3

Global_Innovation_Excellence_PresDinner_041216_v03 16
3
3.3
3.3
3.3
3.3
3.2
3.1
3.1
3.6
Badly defined innovation strategy
Unclear responsibilities
Lack of market intelligence
Incentive system not promoting innovation
Organizational barriers
Corporate culture hostile to innovation
Lack of internal resources
No clear evaluation criteria
External financial barriers
External administrative barriers
Lack of skilled personnel 2.9
2.8
2.7
2 3 4 5
Barriers to InnovationIn
tern
alE
xter
nal
Low importance Very high importance
Source: Arthur D. Little Innovation Excellence Study 2005
What are the barriers that stand in the way of better innovationperformance?
Average of all survey participants
Good Innovators are much better than bad ones
Global_Innovation_Excellence_PresDinner_041216_v03 17
As a number one priority, companies worldwide are targeting the huge untapped potential to improve profit growth through innovation management
Innovation Excellence 2005
ADL’s 2005global innovation
excellence survey
Innovation-based profit growth tops
the corporate agenda again
Innovation excellence can
boost EBIT-margins by 4
percentage points
Top innovators have 2.5 times higher sales of new
products and get more than 10 times higher
returns from their innovation investments
A well-balanced innovation
approach is the key to success
1 2
3 4

Global_Innovation_Excellence_PresDinner_041216_v03 18
Idea Management
Resource & Competence Management
Development & Launch Post-Launch
Product/Service Portfolio
management
Technology Management
Business & Technology Intelligence
Customer & Business
Results
Business Vision & Strategy
Learning
Learning
Partners
Customers
A well balanced approach
A well-balanced innovation approach is the key to success
Learning from best practices
Learning from top
innovators
4How to succeed with innovation?

Global_Innovation_Excellence_PresDinner_041216_v03 19
Innovation goals
The best innovators expect a range of returns from innovation, but see effectively meeting customer needs as the most important goal
4,3
3,8
3,8
3,8
3,7
3,7
3,7
3,6
3,5
3,3
2 3 4 5
Effectively meet customer needs
Low importance
Very high importanceAverage of top innovators (top 25%)
Source: Arthur D. Little Innovation Excellence Study 2005
Efficiency of manufacturing
Reduce product costs
New products for niche markets
New products for broad groups
Innovative brand equity
Improve efficiency of R&D
Shorten time to market
Create new customer needs
Modularisation of products
Top Innovators – Innovation goals 4

Global_Innovation_Excellence_PresDinner_041216_v03 20
Top innovators address all elements of innovation capability in a balanced way, despite some elements appearing to have a higher impact
Average Ranking of Processes Impact on sales of new productsProcesses
Very high importance
3,7
3,9
3,9
3,9
4,1
12345Low
importance
Market intelligence
Strategic planning
Product development process
Technology and resource management
Idea management 7,9%
6,7%
5,5%
4,8%
2,4%
0% 4% 8% 12%
Impact1) on sales of new products(sales increase if process is ranked high)
Source: Arthur D. Little Innovation Excellence Study 2005 1) Industries with significant correlation only
Top Innovators – Innovation management 4

Global_Innovation_Excellence_PresDinner_041216_v03 21
Customer contact and excellent business intelligence form essential components of Innovation Excellence
2 3 4 5
Systematic market andtechnology screening
Direct customer contact
Extrovert corporate culture
Clear role allocation
Low importance Very highimportance
Source: Arthur D. Little Innovation Excellence Study 2005
Gaining Market Intelligence
4Top Innovators – Critical success factors

Global_Innovation_Excellence_PresDinner_041216_v03 22
Pivotal factors in idea management include creative employees and a systematic process to generate new ideas
Methodology to evaluate and
select new ideas
Creative employees
Available time to generate ideas
Systematic process to generate new ideas
Source: Arthur D. Little Innovation Excellence Study 2005
Idea Management
2 3 4 5Low importance Very high
importance
4Top Innovators – Critical success factors

Global_Innovation_Excellence_PresDinner_041216_v03 23
Top innovators explicitly link strategy and clear innovation objectives
Tight relation between innovation objectives
and business strategy
Clear product or service strategy
Defined core competencies
Distinct product and /or technology platforms
Strategic make-or-buy decisions
Source: Arthur D. Little Innovation Excellence Study 2005
Low importance Very highimportance
Strategic Planning of Product / Technology Development
2 3 4 5
4Top Innovators – Critical success factors

Global_Innovation_Excellence_PresDinner_041216_v03 24
Top Innovators focus on good cross-functional teams and a milestone-based development process
Cross-functional teams
Milestone-based product development
process
Methodology of risk management
Management of development partners
Collocation of development teams in critical project phases
Source: Arthur D. Little Innovation Excellence Study 2005
Low importance Very highimportance
Product Development Process and Project Management
2 3 4 5
4Top Innovators – Critical success factors

Global_Innovation_Excellence_PresDinner_041216_v03 25
The secrets of success are good project management and technology partnerships
Systematic improvement of project
management skills
Active license management
Technology partnerships with other
companiesCollaboration with
federal research institutes
Clear separation between product and
technology development
Source: Arthur D. Little Innovation Excellence Study 2005
Management of Technology and Resources
Low importance Very highimportance
2 3 4 5
4Top Innovators – Critical success factors

Global_Innovation_Excellence_PresDinner_041216_v03 26
Customer & Business Results
Good performance indicators help companies to set the baseline and support improvement in innovation excellence
Source: Arthur D. Little Innovation Excellence Study 2005
General metrics, indirectlyrelated to innovation, e.g.
� Customer satisfaction� Total sales� Market share� EBIT
Frequency
36%
17%
11%
11%
4%
3%
2%
16%
0% 30% 60%
Sales / results of new products
Number of new products
Impact on sales, EBIT, and/or costs
Number of patents
Time to market
Project management measures
Innovation rate
Others
Metrics directlyrelated to innovation
53%47%
Learning
Learning
Key Innovation Metrics
4Top Innovators – Innovation Metrics

Global_Innovation_Excellence_PresDinner_041216_v03 27
Both large multinationals and small companies can be the innovation leaders in their industries (1/2)
Source: Arthur D. Little Innovation Excellence Study 2005 Remark: Companies in alphabetical order
High Intensity Innovators
Aerospace
� Boeing� EADS� Lockheed Martin� OHB-System
Electrical Engineeringand Electronics
� ABB� Canon� IBM� Intel
Automotive OEMsand Suppliers
� Bosch� BMW� Continental� DaimlerChrysler� Toyota
Engineering andManufacturing
� Alstom� Caterpillar� GE� Krones� Tetra Pak
Telecommunication, IT and Media
� Cisco� IBM� Microsoft� NTT DoCoMo� Vodafone
Efficient Innovators
Pharmaceuticals
� Amgen� Eli Lilly� Gentech� Novartis� Pfizer
Top Innovators – Most admired innovators
Most admired innovators
4

Global_Innovation_Excellence_PresDinner_041216_v03 28
Both large multinationals and small companies can be the innovation leaders in their industries (2/2)
Source: Arthur D. Little Innovation Excellence Study 2005 Remark: Companies in alphabetical order
Conservative Innovators
Financial Institutions
� AIA� Bank of China� Citigroup� Merchant Bank� Prudential
Utilities
� Essent� DZH� MVV� RWE
Chemicalsand Resources
� 3M� BASF� BP� Dupont
Constructionand Equipment
� BAM� Caterpillar� Vaillant� Grohe
Low Leverage Innovators
Public and Professional Services
� Adecco� Arcadis� SGS Int.
Consumer goodsand Food
� Danone� L'Oreal� Procter&Gamble� SIG� Unilever
Top Innovators – Most admired innovators
Most admired innovators
4

Global_Innovation_Excellence_PresDinner_041216_v03 29
Four real life examples illustrate different approaches to innovation excellence
4
3
1 Improve overall Innovation Management capability: Tetra Pak
2
Use of partnerships: BMW and ZF Lenksysteme
Collaboration with lead users: 3M Medical
Building platforms: Toyota
Best Practice in Innovation Management
4Best practice examples

Global_Innovation_Excellence_PresDinner_041216_v03 30
Tetra Pak, a world leading packaging company, faced tougher market situations and used a balanced improvement approach to innovation to regain their leadership
� Tetra Pak faced slower growth in the developed markets
� Competition was getting tougher
� And Tetra Pak realized that it had lost its innovation leadership and decided to rebuild its innovation capability
� They decided to take a holistic view on the Innovation Process and started on a systematic journey to regain their leadership in innovation
Best practice examples – Tetra Pak
Challenge
4

Global_Innovation_Excellence_PresDinner_041216_v03 31
Approach
Tetra Pak took a holistic approach to innovation by working on three priority initiatives; structure, process and measurements & tools
� Structure– Appoint corporate CTO and an Innovation Process
Board to lead the improvement activities– Introduced a number of other organizational bodies,
e.g. technology strategy council, centers of expertise
� Process– Worked to refine and implement processes for all
the sub-processes of the Innovation Process, e.g. product development, idea management, business intelligence
� Measurements & tools– Introduced a balanced scorecard including
innovation measurements in managers scorecards– Introduced a web based interactive tool to support
implementation of processes and execution of projects
Business intelligence
Technology intelligence
Strategy and
planning
Product development
Idea management
TechnologyResource Development
Innovation Process
Best practice examples – Tetra Pak 4

Global_Innovation_Excellence_PresDinner_041216_v03 32
Results
Very impressive results have been reached so far, but Tetra Pak considers these changes part of a never ending journey of improvements
� Drastically improved number of product launches, up to three times more than in the past
� Alignment throughout company towards the same innovation objectives
� Dramatic increase in number of products launched on time
� Transparency and alignment via Product Cycle Plans (PCP) has increased internal customer satisfaction & confidence considerably
0
5
10
15
20
25
30
35
40
45
50
1998 1999 2000 2001 2002 2003
Best practice examples – Tetra Pak
Number of product launches
4

Global_Innovation_Excellence_PresDinner_041216_v03 33
Challenge
The medical division of 3M utilized the Lead User concept as a "innovation generator" for new solutions in the field of infection prevention
Who can develop radically new solutions
� The medical division of 3M looked for new solutions in the field of operation room infection prevention and control
� Normal customers only asking for incremental improvements
� Studies show that users rather than manufacturers are often the initial developers of break-through products and processes
� Ongoing studies prove that those innovative users really exist. They have higher and more advanced needs and will benefit the most from a new product. They are called: Lead users (LU)
Complication
� LUs are very hard to find
Find LUs and integrate them into the product development process
Best practice examples – 3M Medical Division 4

Global_Innovation_Excellence_PresDinner_041216_v03 34
Approach
Lead User teams explore the periphery of a particular market and similar markets to develop new products for their own area of focus
Identification of Lead Users
� Use of the networking approach to identify users with different levels of expertise in the target- and in analogue markets
� In the target market 3M identified and analyzed surgeons working under complicated conditions (e.g. battlefield)
� Microbiologists as well as make-up artists were identified as users from analogue markets
Learning's from Lead Users
� Speed is the main issue (less dependence on antibiotics)
� Make up artists had developed solutions to attach things to the skin
Develop radically new products by combining LU knowledge from different areas
Planetary gear
Level1
Level2
Level3
Level of expertise
1st approach
2nd approach
Target Market Analogue Markets
Best practice examples – 3M Medical Division 4

Global_Innovation_Excellence_PresDinner_041216_v03 35
Results
The 3M example and other studies show that early integration of Lead Users increases the probability of successful products, hence growth!
� Development of new antimicrobial draping products
� Radically new approach for patient-individual infection control
� Major new long-term growth strategy for the Medical-Surgical Department
� 3M was a pioneer using the LU-concept. Due to the positive experiences the company now works closely with Academics and Psychologists to create a training program and other materials for the correct use of the lead user concept
� All LU-projects at 3M so far, resulted in completely new product lines
Best practice examples – 3M Medical Division
Average annual sales of LU projects:146 mil. $ (18 mil. $ non-LU projects)
4

Global_Innovation_Excellence_PresDinner_041216_v03 36
Top line growth through innovation: Toyota realized that despite its reputation for efficiency, it needed a new innovative platform strategy
� Situation:Through the 1980's, Toyota had already proved "top level" efficiency by means of allocating human resources at the production line
� Complication:However in 1994, Cho, then president of TMM3), witnessed fewer components on the floor and leaner labor in operation at Ford’s Atlanta plant, and feared Toyota would not survive the competition against Ford. He realized that Ford’s operation was rooted to the concept of platform design
� Challenge:Cho acknowledged4); "Design and Production must work seamlessly. We must install a new platform strategy that would fit Toyota"
1) VA/VE: Value Analysis, Value Engineering; 2) Kaizen: Improvement, Betterment; 3) TMM: Toyota Motor Manufacturing, Toyota’s Manufacturing subsidiary in the USA; 4) Source: Satoshi Hino, “Study of Toyota’s Management System”, Diamond Publishing
Toy
ota
Ford
Tackling the design concepthas given Ford an advantage against
Toyota at the production line
ManufacturingDesign
VA/VE1)
Design of Product AComponent
AB C D E F
Product B Product CB C D F
Kaizen2)
Efficiency
KaizenKaizen
Kaizen
Time
Platform ManagementMaximizing the sharing of components, which
resulted in leaner labor in operations
Continuous improvement performed, and attained
“top level” efficiency
Sharing of components was performed, however ad hoc and incomplete
Challenge
Best practice examples – Toyota 4

Global_Innovation_Excellence_PresDinner_041216_v03 37
Approach
1) C21: Century 21, Project for Platform Integration; 2) Chief Engineer (CE) = The project leader of a model development
� Toyota decided not to simply follow Ford, and installed "C211)", the new platform strategy.
� C21 was geared for the challenge of managing the trade-off;– Maximize component sharing across models– Emphasize product uniqueness
� Toyota formed "C21 Platform Committee" with Chief Engineers2)
working seamlessly across product planning, and design. The committee plans the product mix that optimizes the trade-off.– In the past before C21, the output of the product division was simply
handed over to the design division downstream.– The product planning division usually emphasizes the product
uniqueness while the design division usually tries to maximize the component sharing, and both divisions were merely islands to each other.
– The implementation of C21 however, brought in the system, which some people call “Lean Design”, to check the optimization between them.
– The committee first listens to both opinions of the product planning and design divisions, and then, the committee makes a decision on where to place a point of optimization, considering the whole picture of the product mix.
– As a result of C21, shorter development lead time was actualized by the year 2001
Pro
cess
&O
rgan
izat
ion
FordMaxim
izeC
omponent S
haring
Emphasize Product Uniqueness
Con
cept
Toyota’s New Platform Strategy
Toyota(Before "C21")
Toyota’sC21
C21 Platform CommitteeProduct
Planning Div.Design
Div.Model1
Model2
C21Maximize
componentsharing
Emphasizeproduct
uniquenessBeforeC21
CE
CE
In 1998, Toyota installed a new platform strategy to manage the trade-off between component sharing and product uniqueness
Best practice examples – Toyota 4

Global_Innovation_Excellence_PresDinner_041216_v03 38
Results
� The number of models per platform rose from 5.5 to 8.7 over the 5 years from 1998 to 20031)
� Toyota’s production increased 18% in units from 2000 to 20032)
� Toyota’s financial statistics also show significant growth from 2000 to 2003. Revenue rose 28%, net profit shot up 39%2)
FinancialP
roductivity
Models
Units
Revenue
Net P
rofit
5,532 6,5374,000
8,000
12,121 15,50110,000
20,000
881 1,227500
1,000
1,500
2000 2003
2000 2003
2000 2003
Growth 118%
(CAGR 106%)
Growth 128%
(CAGR 109%)
Growth 139%
(CAGR 112%)
(K Units)
(\Bil)
(\Bil)
1998 2003Platforms
Models
11Approx 60
761
Models / PF 5.5 8.7
Toyota’s focus on innovation led to profit increase by 39% since 2000 following the higher production efficiency of their platform strategy
Source: 1) Takanori Maema, "Toyota vs. Benz vs. Honda", Kodansha Publishing; 2) Toyota, Annual Report 2000 – 2003
Best practice examples – Toyota 4
Global_Innovation_Excellence_PresDinner_041216_v03 39
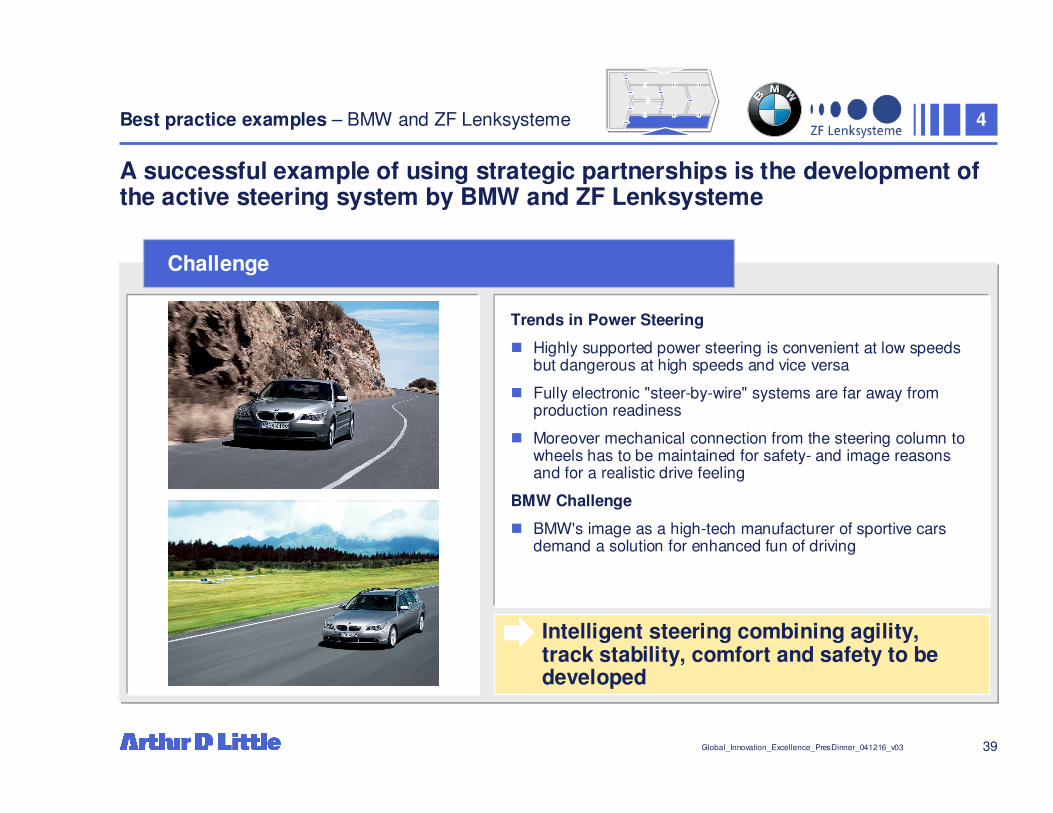
Challenge
Intelligent steering combining agility, track stability, comfort and safety to be developed
A successful example of using strategic partnerships is the development of the active steering system by BMW and ZF Lenksysteme
Trends in Power Steering
� Highly supported power steering is convenient at low speeds but dangerous at high speeds and vice versa
� Fully electronic "steer-by-wire" systems are far away from production readiness
� Moreover mechanical connection from the steering column to wheels has to be maintained for safety- and image reasons and for a realistic drive feeling
BMW Challenge
� BMW's image as a high-tech manufacturer of sportive cars demand a solution for enhanced fun of driving
Best practice examples – BMW and ZF Lenksysteme 4

Global_Innovation_Excellence_PresDinner_041216_v03 40
Approach
Abolish the fixed proportion between steering wheel turning and wheel turning
Using the tight German network of metal- and electrical companies, a feasible solution was found
Development approach
� Combination of knowledge from different areas:– BMW: Value added functions for the customer – ZF Lenksysteme (Joint Venture of ZF and Bosch):
Mechanical- and electrical Know-How– Small electrical company: Sound insulation
� Excessive use of simulation possibilities for virtual verification to ensure efficiency of development process
Technological approach
� Planetary gear and connected electronic motor increase or decrease the steering angle according to driving situation, maintaining mechanical connection
� Existing power steering controls the steering wheel moment
Planetary gear
Electronicmotor
Steering rod
Cog rail
Best practice examples – BMW and ZF Lenksysteme 4

Global_Innovation_Excellence_PresDinner_041216_v03 41
Results
40% of all new 5 and 6 series BMW's are ordered with the new active steering as an accessory
Innovative development approach and technical solution enhanced the partners' innovative image and is highly demanded by customers
Results
� Higher power steering support at low speeds (parking) and lower power steering support at high speeds (highway), higher safety through connection to the ESP system
� Accessing "steer-by-wire" advantages and also maintaining safety standards through an electro-mechanical solution
� Many positive test reports and customer reactions
Awards
� Innovationspreis der Deutschen Wirtschaft (2004)
� Technology Award of the Year (2004)Innovationspreis der Deutschen Wirtschaft
Winner in category: Large companies
Best practice examples – BMW and ZF Lenksysteme 4

Global_Innovation_Excellence_PresDinner_041216_v03 42
Conclusions
� Innovation-based profit growth tops the corporate agenda again
� Innovation excellence can boost EBIT-margins by 4%
� Top innovators have 2.5 times higher sales of new products and get more than 10 times higher returns from their innovation investments
� A well-balanced innovation approach is the key to success:– Good business intelligence– Clear innovation objectives linked to strategy– Milestone-based idea generation and implementation process– Use of resource platform and modularization– Measurement of/feedback on innovation performance– Wise use of partnerships
1
2
3
4
4
Worldwide, companies target with number one priority the huge untapped potential to improve profit growth through better innovation management