Inno Db Internals Inno Db File Formats And Source Code Structure

9 2007
Inno
vati
on s
tudi
es
Innovation Staff Recruitment Programme Feasibility Study

Nils Gabrielsson, Tarmo Kalvet, Kimmo Halme
Tallinn 2007
Innovation Staff Recruitment Programme Feasibility Study
9 2007
Inno
vati
on s
tudi
es

Commissioned by Division of Technology and Innovation, Ministry of Economic Affairs and Communications of the
Public of Estonia
Financed by Ministry of Economic Affairs and Communications of the Republic of Estonia
Carried out by inno Scandinavia AB, Advansis Oy, PRAXIS
Layout by Katrin Leismann
Cover photo by Corbis Corporation
Tallinn, 2007
© Ministry of Economic Affairs and Communications of the Republic of Estonia, 2007
Reproduction is authorised, provided the source is acknowledged
ISBN 978-9985-9875-0-6
ISBN 978-9985-9875-1-3 (PDF)
ISSN 1406-7692
Authors:
Nils Gabrielsson holds a master’s degree in civil/environmental engineering from the Royal Institute of Technology in Stockholm. Since
2001 Nils is the managing director of inno Scandinavia, a daughter-company within the inno-group. Since joining inno in 1998 Nils has
developed a wide knowledge regarding Swedish and European R&D-systems as well as national and regional innovation processes,
especially through the participation and management of several Swedish RITTS projects and follow up initiative such as the trans-
regional innovations projects. He is also an expert in the working methods of industrial collaborative research and has been responsible
for the development of a methodology for performance evaluation of the Swedish research institutes. Nils’ main competence is the
development of models for collaboration activities between industry and R&D-institutions. Further, he is an advisor to different Swedish
research and innovation-supporting organisations such as VINNOVA, Stockholm Science City (owned by the major research- and higher-
education institutions in Stockholm) and The Knowledge Foundation.
Tarmo Kalvet has graduated from the University of Tartu with MPA in Public Administration and was also enrolled in the PhD program
2002-2007. He has also studied in the Global Network for Economics of Learning, Innovation and Competence Building Systems
(GLOBELICS) and Cambridge Advanced Program on Rethinking Development Economics (CAPORDE). Since joining PRAXIS Center for
Policy Studies in 2001 he has led the innovation research programme and has participated in many respective studies. PRAXIS has
contributed to all stages of policy cycle, including problem definition and agenda setting, construction of policy alternatives and policy
formulation, policy design, policy implementation, monitoring and evaluation. Before joining PRAXIS Center for Policy Studies in 2001,
he has worked for Archimedes Foundation as researcher for various ICT-related research projects. Tarmo is also a staff member of the
one-year Masters program in Technology Governance, a technology-focused special graduate degree, placed at the Institute of
Humanities and Social Sciences, Tallinn University of Technology.
Kimmo Halme holds a Licentiate in Technology - degree in international business strategy and MSc in industrial management from
Helsinki University of Technology. Kimmo is Managing Director of Advansis Oy and has been working as consultant since 2003, after
the founding of the company with Tarmo Lemola. Prior to that, he was working for the Science and Technology Policy Council of Finland
and for the European Commission. Kimmo has an extensive experience in innovation policy planning and implementation at interna-
tional, national and regional levels from nearly 20 years and from several countries, focusing largely on programme, institution and pol-
icy evaluations, on the planning and development of innovation policy instruments, as well as on advisory assignments for international
organisations and governments.

Up to the present our economic success has been achieved due to the excellent utilisation of our competitiveedges that enable companies to operate successfully without the extensive R&D and innovation expendituresin the domestic market. Unfavourable demographic trends, changes in economic structure and increase inlabour costs exhausting one of the previously main competitive edges have brought Estonia to the next „tran-sition period“ where consistent R&D and innovation generative human capital have become essential to achiev-ing the international competitiveness of economy.
There is need for knowledge, skills and competence for realizing the excellent ideas and thoughts in compa-nies. Due to the small size of Estonian companies and relatively weak collaboration between academia and indus-try, the aforementioned features have quite frequently become an influential obstacle in the company devel-opment. Innovation takes place through people and the economic competitiveness depends on the applicationof the human capital. Therefore, in addition to other various human capital development support measures,the government plans to implement a new measure to increase the innovation capability of companies by facil-itating the involvement of highly qualified people in the company.
In purpose to increase the innovation capability of companies, to improve the management skills of innovationprojects and to increase the collaboration between academia and industry, the implementation of mobilityscheme has been included as a new activity in the operational programme of research and development andinnovation strategy 2007–2013 „Knowledge-based Estonia“ and in the operational programme of „EstonianEnterprise Policy 2007–2013“.
The aim of the current study was to assess the need for public sector intervention in favouring mobility and todesign the recruitment support scheme for Estonia in order to increase in-house innovation capacity of com-panies through recruitment of researchers, engineers, designers, innovation managers, marketing specialists etc.The present study will provide possible tools and valuable input for policymakers to design the new mobilitysupport measures. Hopefully it will give a positive impulse to the performance of Estonian companies, as oureconomic competitiveness and sustainability primarily depend on the ability to create social capital and utiliseit properly.
Division of Technology and Innovation Ministry of Economic Affairs and Communications
Foreword


Table of Contents
Definitions and abbreviations . . . . . . . . . . . . . . . . . . . . . . . . . . . . . . . . . . . . . . . . . . . . . . . . . . . . . . . . . . . . . . 7Lühikokkuvõte . . . . . . . . . . . . . . . . . . . . . . . . . . . . . . . . . . . . . . . . . . . . . . . . . . . . . . . . . . . . . . . . . . . . . . . . . . 8Executive Summary . . . . . . . . . . . . . . . . . . . . . . . . . . . . . . . . . . . . . . . . . . . . . . . . . . . . . . . . . . . . . . . . . . . . . 11
1 Introduction . . . . . . . . . . . . . . . . . . . . . . . . . . . . . . . . . . . . . . . . . . . . . . . . . . . . . . . . . . . . . . . . . . . . . . . 141.1 The study . . . . . . . . . . . . . . . . . . . . . . . . . . . . . . . . . . . . . . . . . . . . . . . . . . . . . . . . . . . . . . . . . . . . . . . . . . 141.2 Work carried out . . . . . . . . . . . . . . . . . . . . . . . . . . . . . . . . . . . . . . . . . . . . . . . . . . . . . . . . . . . . . . . . . . . . 14
2 Theoretical framework . . . . . . . . . . . . . . . . . . . . . . . . . . . . . . . . . . . . . . . . . . . . . . . . . . . . . . . . . . . . . . 152.1 Promoting Industry-Science relationship . . . . . . . . . . . . . . . . . . . . . . . . . . . . . . . . . . . . . . . . . . . . . . . . . . . 152.2 The importance of human resources for SMEs . . . . . . . . . . . . . . . . . . . . . . . . . . . . . . . . . . . . . . . . . . . . . . 162.3 Overview of mobility/recruitment policy measures . . . . . . . . . . . . . . . . . . . . . . . . . . . . . . . . . . . . . . . . . . . . 18
3 The Estonian context . . . . . . . . . . . . . . . . . . . . . . . . . . . . . . . . . . . . . . . . . . . . . . . . . . . . . . . . . . . . . . . . 193.1 Estonian labour market developments . . . . . . . . . . . . . . . . . . . . . . . . . . . . . . . . . . . . . . . . . . . . . . . . . . . . 193.2 R&D intensity of the Estonian economy . . . . . . . . . . . . . . . . . . . . . . . . . . . . . . . . . . . . . . . . . . . . . . . . . . . 203.3 People in science, engineering and research . . . . . . . . . . . . . . . . . . . . . . . . . . . . . . . . . . . . . . . . . . . . . . . . 213.4 Shortage of skilled labour is a bottleneck for growth . . . . . . . . . . . . . . . . . . . . . . . . . . . . . . . . . . . . . . . . . 243.5 Classification of companies and need for mobility support measures . . . . . . . . . . . . . . . . . . . . . . . . . . . . . 263.6 An estimation of the future need for skilled people . . . . . . . . . . . . . . . . . . . . . . . . . . . . . . . . . . . . . . . . . . 28
3.6.1 Labour demand prognosis . . . . . . . . . . . . . . . . . . . . . . . . . . . . . . . . . . . . . . . . . . . . . . . . . . . . . . . . . 283.6.2 Science and engineers and researchers . . . . . . . . . . . . . . . . . . . . . . . . . . . . . . . . . . . . . . . . . . . . . . . 28
4 Discussion and conclusions . . . . . . . . . . . . . . . . . . . . . . . . . . . . . . . . . . . . . . . . . . . . . . . . . . . . . . . . . . . 324.1 Is there a policy rationale for a mobility/recruitment scheme in Estonia? . . . . . . . . . . . . . . . . . . . . . . . . . . . 324.2 Existing instruments in Estonia to support mobility . . . . . . . . . . . . . . . . . . . . . . . . . . . . . . . . . . . . . . . . . . . 354.3 Which of the available policy measures are appropriate for Estonia? . . . . . . . . . . . . . . . . . . . . . . . . . . . . . . 36
4.3.1 Skilled workers migration schemes . . . . . . . . . . . . . . . . . . . . . . . . . . . . . . . . . . . . . . . . . . . . . . . . . . 364.3.2 Repatriate schemes . . . . . . . . . . . . . . . . . . . . . . . . . . . . . . . . . . . . . . . . . . . . . . . . . . . . . . . . . . . . . . 374.3.3 Researcher mobility scheme . . . . . . . . . . . . . . . . . . . . . . . . . . . . . . . . . . . . . . . . . . . . . . . . . . . . . . . . 374.3.4 Recruitment of skilled people schemes . . . . . . . . . . . . . . . . . . . . . . . . . . . . . . . . . . . . . . . . . . . . . . . 384.3.5 Labour market schemes . . . . . . . . . . . . . . . . . . . . . . . . . . . . . . . . . . . . . . . . . . . . . . . . . . . . . . . . . . . 39
4.4 Implications and success factors for an Estonian mobility and recruitment scheme . . . . . . . . . . . . . . . . . . . 39
5 Scheme descriptions . . . . . . . . . . . . . . . . . . . . . . . . . . . . . . . . . . . . . . . . . . . . . . . . . . . . . . . . . . . . . . . . 415.1 Type 1 Scheme – Recruitment of research-trained personnel . . . . . . . . . . . . . . . . . . . . . . . . . . . . . . . . . . . . 41
5.1.1 Framework . . . . . . . . . . . . . . . . . . . . . . . . . . . . . . . . . . . . . . . . . . . . . . . . . . . . . . . . . . . . . . . . . . . . 415.1.2 Implementation . . . . . . . . . . . . . . . . . . . . . . . . . . . . . . . . . . . . . . . . . . . . . . . . . . . . . . . . . . . . . . . . . 425.1.3 Administration and monitoring . . . . . . . . . . . . . . . . . . . . . . . . . . . . . . . . . . . . . . . . . . . . . . . . . . . . . 42
5.2 Type 2 Scheme – Recruitment of international expertise . . . . . . . . . . . . . . . . . . . . . . . . . . . . . . . . . . . . . . . 435.2.1 Framework . . . . . . . . . . . . . . . . . . . . . . . . . . . . . . . . . . . . . . . . . . . . . . . . . . . . . . . . . . . . . . . . . . . . 435.2.2 Implementation . . . . . . . . . . . . . . . . . . . . . . . . . . . . . . . . . . . . . . . . . . . . . . . . . . . . . . . . . . . . . . . . . 445.2.3 Administration and monitoring . . . . . . . . . . . . . . . . . . . . . . . . . . . . . . . . . . . . . . . . . . . . . . . . . . . . . 44
5.3 Type 3 Scheme – Recruitment of specific purpose specialists . . . . . . . . . . . . . . . . . . . . . . . . . . . . . . . . . . . . 455.3.1 Framework . . . . . . . . . . . . . . . . . . . . . . . . . . . . . . . . . . . . . . . . . . . . . . . . . . . . . . . . . . . . . . . . . . . . 455.3.2 Implementation . . . . . . . . . . . . . . . . . . . . . . . . . . . . . . . . . . . . . . . . . . . . . . . . . . . . . . . . . . . . . . . . . 465.3.3 Administration and monitoring . . . . . . . . . . . . . . . . . . . . . . . . . . . . . . . . . . . . . . . . . . . . . . . . . . . . . 46
5.4 Comparison of the scheme types . . . . . . . . . . . . . . . . . . . . . . . . . . . . . . . . . . . . . . . . . . . . . . . . . . . . . . . . 485.5 General organisational set-up . . . . . . . . . . . . . . . . . . . . . . . . . . . . . . . . . . . . . . . . . . . . . . . . . . . . . . . . . . . 495.6 General application process . . . . . . . . . . . . . . . . . . . . . . . . . . . . . . . . . . . . . . . . . . . . . . . . . . . . . . . . . . . . 50
6 Evaluation framework and ex-ante estimation of targets and costs . . . . . . . . . . . . . . . . . . . . . . . . . 516.1 Evaluation framework . . . . . . . . . . . . . . . . . . . . . . . . . . . . . . . . . . . . . . . . . . . . . . . . . . . . . . . . . . . . . . . . . 516.2 Ex-ante evaluation . . . . . . . . . . . . . . . . . . . . . . . . . . . . . . . . . . . . . . . . . . . . . . . . . . . . . . . . . . . . . . . . . . . 52
6.2.1 Operational (success) indicators . . . . . . . . . . . . . . . . . . . . . . . . . . . . . . . . . . . . . . . . . . . . . . . . . . . . . 526.2.2 Attraction packages . . . . . . . . . . . . . . . . . . . . . . . . . . . . . . . . . . . . . . . . . . . . . . . . . . . . . . . . . . . . . 52

6.2.3 Qualification of necessary financial resources . . . . . . . . . . . . . . . . . . . . . . . . . . . . . . . . . . . . . . . . . . . 546.2.4 Synergy effects . . . . . . . . . . . . . . . . . . . . . . . . . . . . . . . . . . . . . . . . . . . . . . . . . . . . . . . . . . . . . . . . . 54
AppendicesAppendix 1 Statistical tables on Estonian Context . . . . . . . . . . . . . . . . . . . . . . . . . . . . . . . . . . . . . . . . . . . . . . 56Appendix 1.1 R&D intensities and sectoral value added to GDP, 2005 . . . . . . . . . . . . . . . . . . . . . . . . . . . . . . . . . 56Appendix 1.2 R&D personnel (full-time equivalent), 1998–2004 . . . . . . . . . . . . . . . . . . . . . . . . . . . . . . . . . . . . . 57Appendix 1.3 R&D personnel in business sector by level of education, 2004 . . . . . . . . . . . . . . . . . . . . . . . . . . . . 58Appendix 1.4 Total R&D expenditures, 1998–2004 . . . . . . . . . . . . . . . . . . . . . . . . . . . . . . . . . . . . . . . . . . . . . . . 59Appendix 1.5 Companies with innovative activities, 2002–2004 . . . . . . . . . . . . . . . . . . . . . . . . . . . . . . . . . . . . . 60Appendix 1.6 Innovative and exporting companies, 2002–2004 . . . . . . . . . . . . . . . . . . . . . . . . . . . . . . . . . . . . . 61Appendix 1.7 Companies reporting R&D expenditures, 2005 . . . . . . . . . . . . . . . . . . . . . . . . . . . . . . . . . . . . . . . 62Appendix 1.8 Admittance in doctoral courses, 2000–2005 . . . . . . . . . . . . . . . . . . . . . . . . . . . . . . . . . . . . . . . . . 63Appendix 1.9 Graduates of doctoral courses, 2000–2005 . . . . . . . . . . . . . . . . . . . . . . . . . . . . . . . . . . . . . . . . . . 64
Appendix 2 Overview of good practice programmes . . . . . . . . . . . . . . . . . . . . . . . . . . . . . . . . . . . . . . . . . . . . 65Appendix 3 List of interviewees . . . . . . . . . . . . . . . . . . . . . . . . . . . . . . . . . . . . . . . . . . . . . . . . . . . . . . . . . . . . 70Appendix 4 List of references . . . . . . . . . . . . . . . . . . . . . . . . . . . . . . . . . . . . . . . . . . . . . . . . . . . . . . . . . . . . . . 71

Innovation Staff Recruitment Programme Feasibility StudyDefinitions and abbreviations
7
Definitions and abbreviations
Definitions
Innovation The transformation of a new or existing knowledge in a new marketable product, service or process*
Higher education Higher education is education provided by universities, vocational universities (community colleges, liberal arts colleges, and technical colleges, etc.) and other collegial institutions that award academic degrees, such as career colleges.
Tertiary education Post-secondary or tertiary education, also referred to as third-stage, third level education, or higher education, is the non-compulsory educational level following the completion of a school providing a secondary education, such as a high school, secondary school, or gymnasium. Tertiary education is normally taken to include undergraduate and postgraduate education, as well as vocational education and training. Tertiary education generally results in the receipt of certificates, diplomas, or academic degrees.
Skilled people Skilled people are people with at least tertiary education. In the context of the present study highly skilled people are defined as people with at least tertiary education in fields relevant to innovation.**
Mobility and A mobility or recruitment measure is a publicly co-funded policy measure directly or recruitment measures indirectly aiming at increasing companies’ innovation capability through the uptake of
highly skilled people. Measures can be divided into direct and indirect measures.
Direct mobility and These are policy instruments for which the explicit and primary goal is to enhance recruitment measures the science-industry human capital mobility, such as subsidies for joint PhD or financial
support to companies to hire public researchers in the business sector, while maintaining links with research organisations.
Indirect mobility and Indirect measures consist of joint structures involving companies and research recruitment measures organisations (and other actors) –often referred to as ‘competence centres’.
Framework measures Measures include e.g. income tax reductions, work permit fast track, spouse work (individual-oriented permit, etc.measures)
Spin-offs Firm established by members of an R&D institution or institution of professional higher education, the main activity of which is to commercialise the knowledge or intellectual property created by the R&D institution or institution of professional higher education.
Start-ups New firms established especially to develop or commercialise an invention licensed from a public research organisation but without staff participation.
Abbreviations
R&D Research and DevelopmentBERD Business Expenditure on R&DFP6 EU Sixth Framework Programme for Research and Technological Development (2002–2006)GERD Government expenditure on R&DHEI Higher Education InstitutionsHERD Higher Education Expenditure on R&DMKM Ministry of Economic Affairs and CommunicationsPRO Public Research OrganisationPSRE Public Sector Research EstablishmentS&E Science and EngineeringHRSTE Human Resource in Science and TechnologyCIS Community Innovation SurveySME Small and Medium Sized Enterprises
* Definition adopted from DG Regio ** Such as engineers, innovation managers, industrial researchers, design specialists

Innovation Staff Recruitment Programme Feasibility StudyLühikokkuvõte
8
Eesti majandus on läbinud ühe arengutsükli, mille tulemusena on käivitatud palju tugeva turupotentsiaaliga ette-võtteid, kellel on head eeldused edasiseks arenguks. Vaatamata majanduses toimunud positiivsetele arengute-le domineerivad endiselt traditsioonilisi majandusharusid esindavad ettevõtted, kelle käive ja kasumlikkus töö-taja kohta jäävad märkimisväärselt maha vastavatest näitajatest arenenud maades. Ettevõtete edu baseerumineeelkõige odaval tööjõul ja ressurssidel on olnud siiamaani üheks põhjuseks, miks erasektori investeeringud tea-dus- ja arendustegevusse ning innovatsiooni on väga väikesed ja suurel hulgal Eesti ettevõtjatel puuduvad koge-mused uute innovaatiliste toodete, teenuste ja tehnoloogiate arendamisel.
Eesti teadus- ja arendustegevuse strateegia 2002–2006 „Teadmistepõhine Eesti” raames on võetud kasutuse-le hulk meetmeid olukorra parandamiseks. Keskseks eesmärgiks on suurendada avaliku sektori investeeringuidteadus- ja arendustegevusse, maksimeerides samaaegselt erasektori kaasatust, edendada rahvusvahelist koos-tööd ja täiustada rahvuslikku innovatsioonisüsteemi.
Siiani on pööratud suhteliselt vähe tähelepanu poliitikameetmetele, mis oleksid suunatud innovatsiooniga tege-levate töötajate kaasamisele ettevõtetesse kui ühele olulisele võimalusele tõsta ettevõtete innovatsioonivõime-kust ja soodustada teadmistesiiret. Rahvusvaheliselt on antud teema saanud aga suure tähelepanu osaliseks,kuna traditsioonilised meetmed ettevõtete ja teadusasutuste koostöö arendamiseks ei too tihti kaasa oodatudtulemusi1. Viimase kümnendi jooksul on paljud Euroopa riigid rakendanud erinevaid toetusskeeme mobiilsusesoodustamiseks. Sageli on need suunatud teadlaste või doktorantide mobiilsusele, kuid esineb ka üldisemaidtoetusskeeme kvalifitseeritud töötajate mobiilsuse suurendamiseks. Antud toetusskeemide analüüsist võib tehaüldise järelduse, et vastavad skeemid paistavad toimivat rahuldavalt tööstuse seisukohast, kuid neil on sageliraskusi väikese ja keskmise suurusega ettevõteteni jõudmisega. Toetuste andmine kvalifitseeritud tööjõu püsi-va iseloomuga mobiilsuse soodustamiseks ei ole levinud, tõenäoliselt seetõttu, et selliste meetmetega kaasneboht tööjõuturgu moonutada.
Eestis võivad mobiilsust soodustava skeemi rakendamisel ilmneda tagasilöögid seoses valitseva üldise tööjõu -puudusega aga ka asjaoluga, et Eestis domineerivad väga madalate innovatsioonialaste oskustega ettevõtted.„Keele” ja töötavade erinevus ettevõtete ja teadussektori vahel ning ettevõtete nõudluse puudumine teadus-ja arendustegevuse järele kujutavad endast takistavat faktorit. Teisest küljest puuduvad Eesti innovatsiooni -poliitika tööriistakastist tõhusad meetmed kvalifitseeritud töötajate mobiilsuse soodustamiseks, eriti ettevõtetehulgas, kellel on olemas kasvupotentsiaal, kuid ebapiisavad innovatsioonialased oskused.
Eelöeldut arvestades tegi Eesti Majandus- ja Kommunikatsiooniministeerium meeskonnale, mis koosneb inno-group’i kuuluvast inno Scandinavia AB-st (Rootsi), Poliitikauuringute Keskusest PRAXIS (Eesti) ja Advansis Oy-st(Soome), ülesandeks viia läbi eeluuring toetusmeetmele, mis soodustaks innovatsiooniga tegelevate töötajatekaasamist Eesti ettevõtetesse ning toetaks mobiilsust teaduseasutuste ja ettevõtete vahel. Eeluuringu eesmär-giks oli:� Anda ülevaade toetusskeemi käivitamise kontekstist ja hinnata toetusskeemi põhjendatust sellest konteks -
tist tulenevalt.� Suurendada teadmisi teistes riikides rakendatud toetusskeemidest, mis oleksid Eesti kontekstis suurima
tõenäosusega tõhusad ja efektiivsed.� Hinnata võimaliku toetusskeemi võimalikke kulusid ja sellega kaasnevat kasu.
Eeluuringul on kuus peatükki: 1) sissejuhatus, 2) teoreetiline raamistik, 3) hetkeolukord Eestis, 4) järeldused sobi-vate mobiilsust toetavate skeemide osas, 5) väljapakutud skeemide detailsed kirjeldused ja 6) ex ante analüüs,mis sisaldab ettepanekuid hindamise raamistiku jaoks.
Peatükk, mis käsitleb inimressursi mobiilsuse teoreetilist raamistikku, toob välja riikide üha suureneva tähele -panu pööramise kvalifitseeritud tööjõule ja aina suureneva võitluse kvalifitseeritud töötajate järele globaalselt.Inimressursi mobiilsuse käsitlus tugineb arusaamal, et traditsiooniline tehnoloogiasiire, kus teadmised antaksesaatja poolt edasi passiivsele vastuvõtjale kodifitseeritud kujul, ei ole efektiivne, kuna vastuvõtja pole võim-eline seda informatsiooni ise lahti kodeerima. Poliitikameetmed, mis keskenduvad teadmiste siirdele inimres-sursi mobiilsuse kaudu, võiksid seetõttu olla sobivaks lahenduseks, kuid teatud kitsendavate tingimuste puhulvõivad nendega kaasneda tugevad ebasoodsad mõjud. Inimressursi mobiilsuse käsitlus teeb vahet kahel mobiil-sust suurendaval poliitikameetmel – otsesel ja kaudsel. Neist esimene keskendub otsesele rahalisele toetusele
Lühikokkuvõte
1 European Commission (2003): Evaluation of the Trend Chart Policy Benchmarking Workshops, 2001–2002, Trendchart.

Innovation Staff Recruitment Programme Feasibility StudyLühikokkuvõte
9
teadusasutuste ja ettevõtete vaheliste suhete edendamiseks, teine aga ettevõtete ja teadusasutuste vaheliste-le ühisstruktuuridele, kus töötajate mobiilsus on kõigest üks komponent.2
Peatükk lõppeb viitega Rootsi uuringule, mis osutab väga kõrgele kasvutempole ettevõtetes, kes kaasavad ette -võtetesse innovatsiooni alal pädevaid töötajaid, ent samas rõhutab ka erinevate ettevõtete erinevaid vajadusi.Suuremad firmad vajavad kõrge kvalifikatsiooniga tööjõudu, nagu näiteks teadlasi, väike- ja keskmise suuruse-ga ettevõtted vajavad aga kõrgharidusega insenere, ent mitte tingimata teadustöö taustaga. Seetõttu on jätku -suutliku majanduskasvu soodustamiseks ning nii väikese- ja keskmise suurusega kui ka suuremate ettevõteteinnovatsioonivõimekuse tõstmiseks vaja välja töötada paindlikud ja laiapõhjalised poliitikameetmed.
Eesti olukorda käsitlev peatükk annab detailse ülevaate Eestis valitsevast olukorrast, mis puudutab kvalifitseeri-tud tööjõu kättesaadavust, ligipääsu ja nõudlust selle järele – nii praeguses situatsioonis kui ka tulevikus. Peatükksisaldab infot Eesti ettevõtete teadus- ja arendustegevuse intensiivsuse kohta, tuues välja summaarsed kulutu-sed teadus- ja arendustegevusele ning täistööaja ekvivalendi. Eesti väiksusele ning erasektori piiratud teadus- jaarendustegevuse intensiivsusele viitab teadus- ja arendustegevuse kulutusi omavate ettevõtete vähesus: erine-vate sektorite ja ettevõttetüüpide vahelisest ülevaatest selgub, et Eesti Statistikaameti andmetel on teadus- jaarendustegevusega tegelevaid ettevõtteid kokku 357 (2005). 129 neist kuuluvad töötlevasse tööstusesse, kus-juures 44 tegelevad elektri- ja optikaseadmete tootmisega. Nende 111 ettevõtte seas, kellel on teadus- ja aren-dustegevuse (T&A) kulutused suuremad kui 10% käibest, domineerivad põhitegevusena teadus- ja arendus-tegevusega tegelevad ettevõtted (27) ja IT-firmad (24). Ettevõtete arv, kelle T&A kulutused jäävad vahemikku1–10% käibest, on 88; suurimad allharud on siin keemia- (12), elektroonika- (11) ja metallitööstus (9). Paljudettevõtted, kes on raporteerinud T&A kulutusi, on väga väikesed – 43% neist annab tööd vähem kui 10 ini-mesele.
Samas peatükis antakse ülevaade ka teadus- ja arendustööga tegelevate inimeste kättesaadavusest ehk tead-laste ja inseneride pakkumise poolest. Järeldatakse, et Eestis valitseb vastava kvalifikatsiooniga inimeste puudusning olukord muutub veelgi halvemaks Eesti teadlaste ja inseneride ebasoodsa ealise struktuuri tõttu, aga ka Eestiettevõtete teadus- ja arendustegevuse alaste tegevuste kiire kasvu tõttu. Mitmesugused empiirilised uuringu näi-tavad, et Eesti ettevõtetel on suuri probleeme sobiva personali leidmisega; 2000 ettevõtja hulgas läbi viidud ula-tuslik uuring kinnitas, et 2005. a pidas 70% ettevõtetest kvalifitseeritud töötajate leidmist keeruliseks (Saar Poll2005). Ent see vajadus pole kõigis sektorites ühesugune. Kuna praegused teadus- ja arendustegevuse ninginnovatsioonipoliitika meetmed on suures osas keskendunud ülikoolidele ja teadusmahukatele ettevõtetele,on äärmiselt oluline tõdeda, et kuigi paljude Eesti firmade arendusvõimekus on piiratud ning teadus- ja aren-dustegevus puudub, võivad nad kasu saada toote-, protsessi-, organisatooni- või turunduslikest uuendustest,et tõsta oma konkurentsivõimet. Uuring pakub välja järgmise lihtsa firmade tüpoloogia, iseloomustamaksnende vajadust kvalifitseeritud töötajate järele:
Tüüp Vajadus
a. Maailmaklassi tasemel või sellele lähedal olevad Vanemteadurid (tipptasemel); turundusspetsialistidteadusmahukad ettevõtted (turundusspetsialistidel peavad tavaliselt olema tugevad
tehnilised teadmised teadusmahukatest toodetest – seega vajalik kahekordse profiili olemasolu)
b. Rahvusvaheliselt konkurentsivõimelised tugeva Rahvusvahelise kogemusega juhid, kes omavad toote ja arendustegevuse võimekusega ning vähese tehnoloogia juhtimise alast kompetentsi uurimistöö võimekusega ettevõtted
c. Konkurentsivõimelised (kasvavad) ettevõtted, Rahvusvahelise kogemusega juhid, insenerid, disainerid, kellel on piiratud arendustegevuse võimekus innovatsioonijuhid, rahvusvahelise müügi asjatundjad, ning puudub uurimistegevus muud spetsialistid
d. Mittekasvavad ettevõtted Puudub
Vaatamata praegustele haridussüsteemi tugevdamisele suunatud pingutustele, on vajalikud täiendavad meetmed,et rahuldada kasvav vajadus kvalifitseeritud spetsialistide järele. Uuring püüab hinnata nõudlust teadus- ja aren-dustöötajate ning inseneride järele tulevikus. Seda nõudlust saab hinnata kas poliitiliste eesmärkide põhjal (ntteadlaste ja inseneride arvu suhe tööjõusse peaks olema võrdne Saksamaa tasemega) või arengutendentsidepõhjal, mille on kujundanud viimaste aastate tööstussektori tegelikud kulutused teadus- ja arendustegevuseletööstuses. Uuringus on ära toodud erinevad tuleviku nõudluse arvutamise võimalused. Saavutamaks Eestissamasugune teadlaste ja inseneride intensiivsus kui näiteks Rootsis (u 5%), peaks teadlaste ja inseneride arv
2 European Commission (2001): European Trend Chart on Innovation, Policy Benchmarking Workshop. Favouring Industry-Science Relationships through Human Capital Mobility.

Innovation Staff Recruitment Programme Feasibility StudyLühikokkuvõte
10
tõusma 17 000-ni. Aastal 2005 oli ülikooli lõpetanud teadlaste ja inseneride arv u. 5800. Eeldades, et igal aas-tal läheb pensionile umbes 3 000–4 000 inimest, tähendab see, et ilma tööjõudu impordita kulub sellise tead-laste ja inseneride arvu taseme saavutamiseks 7–8 aastat.
Eesti olukorda kirjeldavale peatükile järgnev peatükk sisaldab diskussiooni avaliku sektori sekkumise põhjenda-tuse (rationale) kohta. Jõutakse järeldusele, et arvestades praegu Eestis valitsevat olukorda ja arengu kitsaskohti,on kvalifitseeritud tööjõu mobiilsust ja kaasamist soodustava toetusskeemi käivitamine riigi poolt põhjendatud.Tuginedes rahvusvahelistele kogemustele ja heale praktikale, tõstab peatükk esile terve rea selliste toetusskee-mide edutegureid ning tuvastab sarnaste eesmärkidega programme ja algatusi Eestis. Tuginedes inimressursiallikatele ja kompetentsi vajadustele, pakutakse välja kolm eri tüüpi toetusskeemi. Need on järgmised:� Toetus teadustöö kogemusega inimeste (järeldoktorid, doktorid) kaasamiseks ettevõtetesse� Toetus rahvusvahelise kogemusega inimeste kaasamiseks ettevõtetesse� Toetus spetsiifilistes teemades kogemust omavate inimeste kaasamiseks ettevõtetesse
Väljatoodud toetusskeeme on soovitav käsitleda kui ühe programmi eri variante ning neid tuleks juhtida samaorganisatsioonilise raamistiku piires. Erinevate toetusskeemide iseloomustused on toodud alljärgnevas tabelis:
Skeemi Doktorantide ja järeldoktorite Rahvusvahelise kogemusega Teemapõhiste spetsialistide tüüp/tunnus kaasamine ekspertide kaasamine värbamine
Sihtgrupid Maailmaklassi tasemel või Rahvusvaheliselt konkurentsi- Konkurentsivõimelisedsellele lähedal olevad teadus- võimelised tugeva arendus (kasvavad) ettevõtted, kellel mahukad ettevõtted tegevuse võimekusega ning on piiratud arendustegevuse
vähese uurimistöö võimekus ning puudub võimekusega ettevõtted uurimistegevus
Eesmärk Suurendada ettevõtte teadus- Aidata väike- ja keskmise Vähendada väikeste ja ja arendustegevuse alast suurusega ettevõtetel kaasata keskmise suurusega ette-kompetentsi ja tugevdada kõrge kvalifikatsiooniga võtete takistusi spetsialistidekontakte teadusasutustega töötajaid välismaalt kaasamiseks innovatsiooni-
projektidesse
Sihtgrupi suurus 125–150 ettevõtet 250–300 ettevõtet 1 500 ettevõtet
Allikas Ülikoolid ja teised teadus- Välismaa firmad ja Akadeemilised institutsioonid, asutused Eestis ja välismaal institutsioonid, välismaal konsultatsioonifirmadtöötavad eestlased
Stiimulid 50% palgakuludest. 50% palgakuludest, mis Kuni 35% palgakuludest Eritoetus väiksematele kolme aasta jooksul väheneb. 12 kuu jooksul. ettevõtetele. Atraktiivsuspaketid. Projektipõhine taotlemine.
Eeldatav arv 10 kuni 40 inimest aastas 10 kuni 30 inimest aastas 25 kuni 85 inimest aastas
Orienteeruv eelarve 0,36–2,16 milj. eurot aastas 0,5–4,8 milj. eurot aastas 0,44–1,5 milj. eurot aastas(v.a TA)
Viiendas peatükis on ära toodud eeltoodud toetusskeemide üksikasjalik kirjeldus. Nimetatud peatükk käsitlebka lähemalt toetusskeemide ellurakendamist, eeskätt erinevate organisatsioonide kohustusi, ning annab üle-vaate võimalikust taotlemisprotsessist. Kuues peatükk tutvustab hindamise raamistikku keskendudes mõjunäita -jatele. Ex-ante hindamine, mis moodustab samuti ühe osa kuuendast peatükist, sisaldab ettepanekuid toetus -skeemi edukuse näitajate osas, samuti vajalike rahaliste vahendite mahtu, mis toetusskeemi rakendamisekskulub. Hinnangulised rahalised vahendid on kokkuvõtlikult esitatud alljärgnevas tabelis:
Skeemitüüp/ Doktorite ja Rahvusvahelise Teemapõhiste Atraktiivsus-toetus Kokkutunnus järeldoktorite kogemusega spetsialistide
kaasamine ekspertide kaasamine kaasamine
2007 180 000 500 000 490 000 50 000 1 220 000
2008 540 000 1 400 000 880 000 115 000 2 935 000
2009 1 260 000 2 600 000 1 660 000 230 000 5 750 000
2010 1 800 000 3 300 000 1 660 000 290 000 7 050 000
2011 2 160 000 3 600 000 1 660 000 320 000 7 740 000
Lisaks eeltoodule on toetusskeemi rakendamiseks vaja ka tehnilise abi ressursse, mille suurus küündib iga toetus -skeemi osa puhul 125 000 euroni aastas.

Innovation Staff Recruitment Programme Feasibility StudyExecutive Summary
11
The Estonian economy has passed one developmental cycle, by the end of which many companies that havestrong market potentials and good prospects for further development have been started. In spite of these pos-itive developments, however, the economy is still dominated by companies representing traditional branches ofeconomy whose turnover and profitability per employee lag well behind the corresponding figures of devel-oped countries. Due to the fact that companies have been able to prosper relying on cheap labour and otherresources, private investments in R&D and innovation activities are very low and a large part of Estonian entre-preneurs lack experiences in developing new innovative products, services and technologies.
Within the framework of the Estonian Research and Development Strategy 2002–2006 “Knowledge-basedEstonia” a number of measures have been launched to improve the situation. Central goals are to increase pub-lic sector investments in R&D simultaneously maximising the involvement of the private sector, to foster inter-national co-operation and to enhance the national innovation system.
So far little attention has been given to policy measures addressing the recruitment of innovation staff in enter-prises as an essential part in raising innovation capacities and increasing knowledge transfer. Internationally, how-ever, the issue has received a great deal of attention as traditional instruments to promote industry-science rela-tions often show disappointing results.3 During the past decade many European member states have launcheddifferent types of mobility promoting schemes. Often these address the mobility of researchers or PhD-studentsbut also more general mobility of skilled people-schemes can be found. A general observation from the evalu-ation of programmes is that they seem to be working satisfactorily from the viewpoint of industry but that theyoften have difficulties reaching SMEs. Financial incentives to foster skilled people mobility on more permanentbasis is not common, probably due to the inherit risk of such measures of distorting the labour market.
In Estonia both of the given potential drawbacks may occur due to the general shortage of labour the countryexperiences but also due to the dominance of companies with very low innovation skills. The difference in lan-guage and work practices and a simple lack of demand for R&D on the side of industry constitute a blockingfactor. On the other hand, the Estonian innovation policy tool-box is lacking powerful measures to promotemobility and uptake of skilled people, in particular among companies with growth potential but insufficientinnovation skills. Therefore, a team comprising inno Scandinavia AB (Sweden) as a representative of inno-group,PRAXIS Centre for Policy Studies (Estonia) and Advansis Oy (Finland) have been assigned by the Ministry ofEconomic Affairs and Communications for Estonia to carry out a feasibility study regarding a policy schemefavouring recruitment of innovation staff in enterprises and science-industry mobility. The objectives of the fea-sibility study are:� To increase the understanding of the context in which the mobility and recruitment scheme shall be
launched.� To increase the knowledge of scheme types that are best suited to be efficient and effective in the Estonian
context� To raise knowledge about the potential costs and benefits of a future scheme.
The feasibility study covers six chapters: 1) introduction, 2) a theoretical framework, 3) the present situation inEstonia, 4) conclusions on suitable mobility supporting measures, 5) detailed descriptions of suggested meas-ures and 6) an Ex-ante evaluation including suggestions for an evaluation framework.
The chapter describing the theoretical framework regarding human resources mobility points out the increas-ing focus nations pay to skilled workforce and the increasing competition for skilled people globally. The con-cept of human resource mobility recognizing that knowledge transfer from a sender to a passive receiver, i.e.codified knowledge is transferred from science to industry, is misleading, as the receiver will not be able to decodethe information. Policies focusing on the transfer of human resources might therefore be an appropriate solu-tion but with potentially strong adverse effects under certain restrictions. The approach on human resource mobil-ity distinguishes between two policy measures to increase mobility, direct and indirect schemes. The former focus-es on direct subsidies to research-industry relationships while the latter focuses on joint structures betweencompanies and research organisations, where personnel mobility is only one component.4
Executive Summary
3 European Commission (2003): Evaluation of the Trend Chart Policy Benchmarking Workshops, 2001–2002, Trendchart. 4 European Commission (2001): European Trend Chart on Innovation, Policy Benchmarking Workshop. Favouring Industry-
Science Relationships through Human Capital Mobility.

Innovation Staff Recruitment Programme Feasibility StudyExecutive Summary
12
The chapter concludes with the reference to a Swedish study showing very high growth rates of companiesemploying staff skilled in innovation but also emphasises the different needs of different companies. Larger firmsare in need of highly qualified resources such as scientists and researchers, SMEs are in need of skilled workersi.e. staff with tertiary education as engineers but not necessarily with research background. Therefore, to fos-ter sustainable economic growth and increase the innovative capacities for SMEs as well as larger enterprises,flexible and inclusive policies need to be developed.
The chapter on the situation in Estonia provides a detailed and partially quantified picture of the situation inEstonia regarding availability of, access to and demand of skilled workforce – now and in the future. It providesdetails on the R&D-intensity of Estonian companies regarding total R&D-expenditure and the number of FullTime Equivalents (FTE). Estonian smallness and limited R&D intensity of private sector is indicated by the smallnumber of companies with business expenditures on R&D: A characterisation of differences between sectorsand types of companies is given showing that there are altogether 357 companies conducting R&D accordingto the Statistical Office of Estonia (2005). 129 of them belong to the manufacturing sector: 44 in the manu-facture of electrical and optical equipment, there are 111 companies with BERD/turnover higher than 10% ofturnover, dominated by dedicated R&D companies (27) and IT companies (24). The number of companies withBERD/turnover 1–10% is 88; the largest sub-sectors are chemical (12), electronics (11) and metal (9) industries.Many companies reporting BERD are very small – 43% employ less than 10 people.
In the same chapter also the situation regarding availability of people in science, engineering and research ishighlighted. It is concluded that there is a lack of people in science and engineering and that the situation isbound to get worse due to the unfavourable age structure of Estonian researchers, scientists and engineers butalso because of the rapid increase in R&D efforts of Estonian companies. Various empirical evidence confirmthat Estonian enterprises have major problems in finding suitable personnel; an extensive study among 2000entrepreneurs confirmed that 70% of enterprises found finding skilled workers complicated in 2005 (Saar Poll2005). The need is not identical in all sectors, though. Whereas current science, technology and innovation pol-icy measures have mostly focused on universities and research-intensive companies, it is crucial to recognisethat many competitive and growing firms in Estonia have limited development and no research capacity, butcan take advantage of product, process, and organisational and/or marketing innovations in order to increasetheir competitiveness. The study suggests the following simple typology of firms for characterising their needfor skilled people:
Type Need
World-class or close to world-class research-intensive Senior (top level) researchers; marketing specialists companies (marketing specialists usually need to have technical
knowledge about the very research-intensive products – so a double profile is probably needed)
Internationally competitive companies with strong Internationally experienced managers, people with development and some research capacity product and technology management competence
Competitive (growing firms) with limited development and Internationally experienced managers, engineers, designers, innovation managers, international sales,
no research capacity other specialists
Non-growth companies n/a
Strong efforts are currently under way to strengthen the educational system but complementary measures arenecessary in order to satisfy the demand for people. The study makes an attempt to estimate the future demandfor scientists, researchers and engineers. The demand can be estimated either based on political targets (e.g.the ratio of science and engineering (S&E) work force to total force should be equal to that of Germany) or onthe trends set by actual industry R&D-spending in recent years. Different calculations are provided in the study.One result is that in order to reach the same intensity of S&E workforce in Estonia as, for example, in Sweden(approx. 5%) a further 17,000 people must in work in S&E-professions. The number of graduates in S&E wasapprox. 5,800 in 2005. Assuming a yearly retirement of some 3,000–4,000 persons, it means that it will take7–8 years before the given level of S&E-workforce is achieved without importing work force.
The chapter after the description of the Estonian situation contains a discussion on the rationale for public inter-vention through policy measures. It concludes that, considering the present situation and bottlenecks for growthin Estonia, a scheme promoting the mobility and recruitment of skilled people is motivated. The chapter fur-ther highlights a number of success factors of such schemes based on international experiences and good prac-tice and identifies existing Estonian schemes and initiatives with related aims. Based on the sources of peopleand the type of skills sought, three different types of support measures are suggested. These are:

Innovation Staff Recruitment Programme Feasibility StudyExecutive Summary
13
� Support to Recruitment of research-trained personnel� Support to Recruitment of international expertise� Support to Recruitment of specific purpose specialists
It is suggested that the given support initiatives are considered to be different variants of the same scheme andthat they are managed within the same organisational umbrella. The characteristics of the different schemesare presented in the table below:
Scheme type / Recruitment of research-trained Recruitment of international Recruitment of specific element staff expertise purpose specialists
Target groups World-class or close to Internationally competitive Competitive (growing firms) world-class, research-intensive with limited research but with limited development companies strong development capacity and no research capacity
Objective To upgrade company Helping SMEs to find and Lowering the barrier for SMEsR&D skills and strengthen hire highly skilled people to hire specialists in projectscontacts to research from abroad
Target group size Estimated target group size: Estimated target group size: Estimated target group size: 125–150 companies 250–300 companies 1.500 companies
Source of skills Higher education and Foreign companies, Academic institutions, research institutions in institutions, returning expert companiesEstonia and abroad expatriates
Incentives 50% of salary costs. 50% of salary costs, Up to 35% of salary costs Special support for decreasing for three years. for 12 months. smaller companies. Attraction packages. Project-related application.
Expected output From 10 to 40 persons From 10 to 30 persons From 25 to 85 personsper year per year per year
Tentative budget 0.36–2.16 mill. Euro/year 0.5–4.8 mill. Euro/year 0.44–1.5 mill. Euro/year(excl TA)
A detailed description of the schemes is provided in Chapter 5. The given chapter also covers in some detailthe implementation of the scheme, in particular responsibilities of different organisations, and also outlines theapplication process. Chapter 6 presents the evaluation framework focusing on impact indicators. The Ex-anteevaluation, which also forms a part of Chapter 6, provides suggestions for operational success indicators anda quantification of necessary financial resources to be allocated to the measures. The estimated financialresources are summarised in the table below:
Scheme type / Recruitment of Recruitment of Recruitment of Attraction support Totalelement research-trained international specific purpose
personnel expertise specialists
2007 180 000 500 000 490 000 50 000 1 220 000
2008 540 000 1 400 000 880 000 115 000 2 935 000
2009 1 260 000 2 600 000 1 660 000 230 000 5 750 000
2010 1 800 000 3 300 000 1 660 000 290 000 7 050 000
2011 2 160 000 3 600 000 1 660 000 320 000 7 740 000
In addition to the given resources it is estimated that there is a need for technical assistance resources to eachof the schemes amounting to 125.000 Euro per year.

Innovation Staff Recruitment Programme Feasibility Study1. Introduction
14
1.1 The study
A team comprising inno Scandinavia AB (Sweden) as a representative of inno-group, PRAXIS Centre for PolicyStudies (Estonia) and Advansis Oy (Finland) has been assigned by the Ministry of Economic Affairs andCommunications for Estonia (MKM) to carry out a feasibility study regarding a policy scheme favouring recruit-ment of innovation staff in enterprises and science-industry mobility. The objectives of the feasibility study are:� To increase the understanding of the context in which the mobility and recruitment scheme shall be
launched;� To increase the knowledge of the scheme types that are best suited to be efficient and effective in the
Estonian context;� To raise knowledge about the potential costs and benefits of a future scheme.
The objectives shall be reached taking under consideration global good practice related to the given topic andthrough the integration of Estonian stakeholder organisations in the process.
1.2 Work carried out
The present report outlines a set of measures (schemes) for promoting recruitment and mobility that we believehas a strong potential to address the needs of Estonian industry for skilled people. The scheme outlines arebased on the results of a thorough desk research, interviews with international recruitment and mobility schememanagers and on interviews with Estonian stakeholders.
The desk research has covered a wide range of relevant reports addressing both the situation in Estonia andinternationally. The references can be found in Appendix 4.
Interviews have been carried out with some 19 Estonian stakeholders (list in Appendix 3). These include repre-sentatives of companies, academic institutions and Enterprise Estonia. Also, interviews have been conductedwith managers of mobility/recruitment schemes in other countries.
International good practice relevant to the study has been identified and analysed. Initially a draft paper wasdesigned outlining different types of mobility/recruitment measures. In the course of the study the scope of thegood practice examples included has come to focus on repatriate schemes and the schemes sourcing skilledpeople internationally as well as on the recruitment of skilled workers by SMEs.
1 Introduction

Innovation Staff Recruitment Programme Feasibility Study2. Theoretical framework
15
Sustainable economic growth is regarded as the key to prosperity and human well-being. Economic researchprovides two kinds of models that explain which factors influence economic growth and respectively, what pol-icy implications may be drawn from the model: 1) the exogenous model based on findings of Solow-Swan (1956),also known as neoclassic models and 2) the endogenous models by Mankiw, Romer and Weil (1992) or Aghionand Howitt (1997). The important finding that human capital and innovation are the driving forces behind eco-nomic growth, besides other factors, is the basic output of endogenous growth theory.
The recognition of the importance of human resources stresses the fact that availability of and access to skilledpeople is crucial to the competitiveness of companies and thereby in end-effect to nations. For this reason, coun-tries commit significant resources to graduate education and compete intensely to attract top scientists andresearchers. The worldwide competition for skilled workers has increased in recent years through various socio-economic effects such as the ageing population of developed societies (large proportions of the labour work-force retire within the next decade)5 or declining birth rates.
Empirical evidence suggests that the global demand for skilled people has led to an increase in migration. Forexample a study undertaken by Open Doors (2004) states that the number of foreign scholars employed by USuniversities rose over 40% between 1993 and 2003 from about 60,000 to 84,000, the majority of which werein the engineering and natural sciences. Nonetheless, as of today America is aware that they run into strongcompetition for international students, who will later become a potential resource for future scholars, from coun-tries as United Kingdom, where international student enrolment rates grew by 29 percent between 1999 and2005, or Japan with an increase of 108 percent for that time frame.6 As competing countries have implementedvarious strategies to recruit international students and researchers, including using national marketing strate-gies, aligning immigration policies with recruiting goals or creating regional education hubs, and besides abovestated socio-economic effects, the fight for high-qualified and scarce personnel will become much more intensewithin the next decade.
2.1 Promoting Industry-Science relationships through human resources mobility
Following the concept of National Systems of Innovation (NSI)7national policies strive to close the gap betweenresearch and industry by focusing on an interactive mode of diffusion of knowledge among actors of the sys-tem. This perception of innovation and factors driving innovation departs from the general, endogenous theoryof growth by Grossman and Helpman (1991) or Aghion and Howitt (1990). The endogenous growth theory pre-sumes that efforts in research and development lead to innovation and commercialisation and subsequently bet-ter economic performance. The NSI approach states that innovation is an interactive process in which its key actors,e.g. firms, interact with manifold other actors in their environment (research organisations, customers, regula-tors) influencing this innovation process. Innovation is therefore understood as a very complex process with intri-cate causal links. Policy instruments are thus designed to support knowledge flows between individual actors.
The main barrier between research and industry seems to be the language of both worlds. Therefore, variouschannels to promote the given relationship have been established, among the most popular in recent years ishuman resource mobility. The concept of human resource mobility recognizes that knowledge transfer from asender to a passive receiver, i.e., codified knowledge is transferred from science to industry, is misleading, asthe receiver will not be able to decode the information. Policies focusing on the transfer of human resourcesmight therefore be an appropriate solution but with potentially strong adverse effects under certain restrictions.The approach on human resource mobility distinguishes between two policy measures to increase mobility, directand indirect schemes. The former focuses on direct subsidies to research-industry relationships while the latterconcentrates on joint structures between companies and research organisations, where personnel mobility isonly one component.8 Further, it has to be acknowledged that industry-science relations are only pieces of thepuzzle of promoting innovation.
2 Theoretical framework
5 Oliveira Martins J., F. Gonand, P. Antolin, C. de la Maisonneuve and K.-Y. Yoo (2005): The Impact of Ageing on Demand,Factor Markets and Growth, OECD Economics Department Working Papers, No. 420, OECD, Paris.
6 Open Doors (2006): Students on the Move: The Future of International Students in the United States. ACE Issue Brief. 7 The NSI approach helps to understand how innovation evolves and what the elements and framework conditions are that
determine and affect innovation and economic development. [M. LankhuizenR. Klein Woolthuis (2003): The National Systems of Innovation Approach and Innovation by SMEs, Netherlands]
8 European Commission (2001): European Trend Chart on Innovation, Policy Benchmarking Workshop. Favouring Industry-Science Relationships through Human Capital Mobility.

Innovation Staff Recruitment Programme Feasibility Study2. Theoretical framework
16
Results from empirical studies concerning the given issue do not provide a clear picture on how effective mobil-ity policies are, as effects of programmes are complex and non-uniform. Workshops undertaken by the EuropeanUnion9 point at benefits and learning arising from the implementation of mobility schemes as: � The mobility of ideas seems to be at least as interesting as physical mobility of people.� Human resource mobility schemes can be seen as instruments to facilitate communicative interaction
between researchers from both science and industry. Yet the impact on the establishment of dynamic long-term relationships between science and industry seems limited. Neither direct nor indirect human mobili-ty schemes provide all-embracing solutions to bridge the Industry-Science gap.
� Learning-oriented mobility of human resources is the key objective. In this respect the human resourcemobility schemes seem more appropriate than the traditional schemes that focus on the transfer of tech-nology.
Nonetheless, adverse effects resulting from mobility schemes might occur if there are certain constraints regard-ing contributing factors, e.g. the danger of drying up the science base by promoting the uptake of youngresearchers by industry. Another important constraint of mobility schemes might be the applicability to differ-ent company sizes, as mobility schemes already implemented in many European countries state the concernthat they are not able to reach SMEs with those schemes, which is in line with the theoretical framework stat-ing that absorption capacity is an indispensable condition for successful knowledge transfer. This leads over tothe next issue that any policy addressing human resource mobility is especially relevant for larger firms and hightechnology firms but not necessarily for Small and Medium Sized companies.
2.2 The importance of human resources for SMEs
SMEs play an extensive role in sustaining growth and employment in economy. SMEs make up the majority ofEuropean firms both in absolute and relative terms. In 2003, across Europe10, there were more than 19 millionSMEs and almost 6 million in the new Member States and Candidate Countries11; in both cases they account-ed for 99% of total number of enterprises. A study by Florio and Ozzimo (2006) shows that SMEs have thelargest share of total national employment in Europe, similarly Schmidt (1997) points out that SMEs play anextensive role within innovation events. According to figures provided by the Statistical Office of Estonia, 99%of Estonian companies are SMEs and they account for 77% of total employment (2005) in the business sector.Further, SME’s share of value added created in business sector in 2005 was 75% and their share of exportsamounted to 83% in the same year.
As described above, technological progress respectively innovations are assumed to be drivers of economic growthand prosperity. Therefore, it is indispensable to understand the mechanisms of the innovation process from apolitico-economic point of view. The following parameters could be identified as crucial by theory12: � Resources needed to produce technological progress,� Access to the given resources,� The efficient assignment of resources,� The question of how technological process can be described and how the diffusion takes place,� Factors that hinder or support the formation and diffusion of technological progress.
Based on the parameters, a linear model on how to create innovation was adapted within the first decadesfollowing the Second World War. This model lead to the conclusion that only large enterprises would be ableto afford and push technological progress, which was in line with the Schumpeterian growth framework. Todaythe Schumpeterian framework is being revised by researchers with particular emphasis on the dynamic “cre-ative destruction” process, leading to a broader understanding of mechanisms and consequences of techno-logical progress. Thus, the scientific world diverged from the linear approach, which viewed innovation as anoutcome of R&D efforts of large enterprises, and instead it came to favour a perception of innovation-basedcomplex networking of different actors, producing, spreading and adopting different kind of knowledge. Thisnew complex approach also recognizes different kinds of innovation stages, innovation and imitation, the lat-ter often carried out by SMEs. A further difference between large and small enterprises, noticed by the newapproach, is that activities underpinning innovation differ significantly from each other. To illustrate, invest-ment in R&D plays only a minor role for SMEs. A study by Schmidt (1997) also reveals that R&D in SMEs is lesssystematic and discontinuous and that knowledge generation mainly stems from knowledge management
9 European Commission (2003): Evaluation of the Trend Chart Policy Benchmarking Workshops, 2001-2002, Trendchart. 10 15 old Member States of the European Union, the three countries of European Economic Area (Norway, Liechtenstein
and Iceland) and Switzerland.11 Data refer to private enterprises in non-primary sectors.12 Schmidt, E. (1997): Innovation im Mittelstand: Theoretische und empirische Aspekte, RWI, Essen.

Innovation Staff Recruitment Programme Feasibility Study2. Theoretical framework
17
which is determined by relations to customers and competitors. Barriers to innovation, identified by SMEs,often include financial constraints or constraints related to in-house management of competences (qualifiedstaff). Problems associated with access to valuable market information and technologies and missing net-working- and co-operation structures play only a minor role for SMEs, but are within the main concerns forlarger enterprises.
The given picture of SMEs is supported by a recent Swedish study13, which, based on data from 1997 to 2003,showed that small companies hiring an engineer (first and only one) increased their productivity by 290% andtheir turnover by over 500% during the period. At the same time the number of employees increased by 190%.The given effect was much smaller for companies already having at least one engineer when hiring a new one.Companies not having an engineer during the period at all perceived a small increase in the number of employ-ees and turnover, but a negative growth of productivity.
The concluding remarks from the given theoretical approach towards the role and variables influencing SMEsability to manage innovation processes does not exclude policies favouring the mobility of human resource man-agement as stated by the latter chapter. Rather, it points at differences in the educational standards of the mobilehuman resources. As larger firms are in need of highly qualified resources such as scientist and researchers, SMEsare in need of skilled workers i.e. staff with tertiary education as engineers but not necessarily research back-ground. Therefore, to foster sustainable economic growth, increasing the innovative capacities for SMEs as wellas larger enterprises, flexible and inclusive policies need to be developed.
13 Ramböll Management AB (2006): „När kunskap ger resultat – värdet av ingenjörer i mindre företag “.
Repatriateschemes
� Make use ofexpatriates,often withhigh-educationallevels;� Support stock of high-skilled ontemporary basisfrom outside;
� Sustainablegrowth policy;� Educationpolicy;
� South Africa-SANSA� UN-TOKTEN � Belgium-MIDA
� SANSAhas more than2,200 members(2003) in 60 countries;� Pakistan-TOKTEN: Since 2003, 834 consultancieshave been carried out � MIDA:50 direct transfersin 2001/02;
� SANSA:databaseconnected toNEXUS database � Pakistan-TOKTEN:financial supportand DailySubsistenceAllowance (UN)� MIDA:financial supportfor time abroadand technicalequipmentprovided;
� SANSA:founded byuniversity, handedover to NationalResearchFoundation(public);� Pakistan-TOKTEN:cooperationbetween nationalgovernments and UN� MIDA:cooperationbetween Belgiangovernment,InternationalOrganization ofMigration (IOM)and participatingstates govern -ments;
2.3 Overview of mobility/recruitment policy measures
Scheme Type Objectives Field of Best Practise Examples of results Supporting Responsibilities
Application instruments

Innovation Staff Recruitment Programme Feasibility Study2. Theoretical framework
18
Researchermobilityschemes
Recruitmentof skilledpeopleschemes
� Enhanceinnovativecapacities oflargeenterprises;� Create linkbetweenindustry-science
� Facilitateinnovativecapacities ofenterprises(focus onSMEs)
�Wage subsidyschemes viaEducationpolicy or Fiscal Growthpolicy;
�Wage subsidyschemes toincreasemanagementand innovativeresources;
� Denmark-Industrial PhD� France-CIFRE� USA-H1Bvisa is a non-immigrant visa
� KIM (NL)� KTP (UK)
� Denmark:1988–2004 422 projects were accepted� France:1500 projects get approved,annually� H1B: yearlynumbers/ CAP for 2006: 65000 people;
� (KIM) 794 projects were started, 670 completedbetween1998–2002� (KTP)Estimated that onaverage, everymillion investedin KTP results in77 new jobs created, andtraining for 263members of staff,
� Financialincentives are paid tocollaboratingresearch centres;overall subsidy is given tocompany-transferred intoresearcher loan;
(KTP) Regionaloffices supportboth companiesand individuals
� Denmark:Ministry ofScience,Technology andInnovation,Department ofScience &Innovation� France:Managed byANVAR� H1B:Department ofHomeland Security(DHS) H1B base incorporated handles application;
� (KIM) Installedby Ministry ofEconomic Affairs,carried out bySyntens(foundation)� (KTP) Managedby Department ofTrade and Industry
Scheme Type Objectives Field of Best Practise Examples of results Supporting Responsibilities
Application instruments

Innovation Staff Recruitment Programme Feasibility Study3. The Estonian context
19
3.1 Estonian Labour Market developments
Estonia has experienced strong economic growth since 2000. In 2005 the annual growth rate was 10.5% andin Q4 2006 it accelerated to 11.2% making Estonia one of the fastest growing economies in the EU. Such rapiddevelopments are also reflected by corresponding employment indicators.
Since 2005 increase in employment rate may be observed: employment increased by 1.4 percent to 64% in2005 (for ages 15–64) and exceeded slightly the respective indicator of the EU (Figure 1). This trend has alsocontinued in the first half of 2006, when the employment rate reached 67% in the first quarter and to 68.4%in the second quarter, which is the highest quarterly level since 2000. In the light of the given developmentsEstonia might already reach the national employment target of 67.2% (as defined in National Reform Programme)before 2010. Also, these developments suggest that while achieving the EU employment target of 70% by 2010seemed unrealistic in 2005, the situation looks more optimistic today.
Figure 1. Employment rate (15–64) in Estonia and EU
Source: Statistical Office of Estonia, Eurostat
Figure 2. Unemployment rate in Estonia and EU
Source: Statistical Office of Estonia, Eurostat
After the peak of 13.8% in 2000, unemployment rate has decreased to 7.9% in 2005 (Figure 2). This trendcontinued also in the first half of 2006, when the unemployment fell to 6.4% in the first quarter and 6.2% inthe second quarter. In absolute terms there were 51.6 thousand unemployed according to the Labour ForceSurvey in 2005. The number of the unemployed fell to 37,000 in the 3rd quarter of 2006. Unemployment isstill high for young people (15.9% in 2005) and for non-Estonians (15.2%) compared to 6.2% for Estonians.
Labour migration has also increased during last two and half years. Starting form May 2005 until the end of2005 about 25,000 Estonians have moved to work abroad, the majority of them to Finland (about 7,000 withwork permits and 7,000 posted workers). Second target country was UK with 5,000 and the third one Irelandwith about 3,000 workers (Ministry of Social Affairs).
Another major challenge, somehow felt as rather distant, but impacting the education system already in nearfuture, is related to the demographic situation in Estonia. Estonian population has constantly declined startingfrom early 1990’s, but also the age structure of the population has clearly changed. The decrease in the numberof children and increase in life expectancy have inevitably raised the share of older people in the population. Estonia
3 The Estonian context

Innovation Staff Recruitment Programme Feasibility Study3. The Estonian context
20
today is one of the fastest ageing countries in Europe. In 2006 the percentage of those over 60 was 22%, butin 2050 it will increase to 34% of the population (United Nations 2007).
Consequently, rapid economic growth has been accompanied with declining unemployment and inactivity. Asa result a new phenomenon of labour shortage has emerged for Estonia. Sectoral distribution of labour short-age is different; it seems that the most affected sectors are construction, transportation, health care and ICT.
3.2 R&D intensity of the Estonian economy
When looking at the structure of the Estonian economy using Keith Pavitt’s sectoral taxonomy of innovations(1984), which is a well-established identification of some regularities in the way in which technological changeunfolds and affects economic activity, we can argue that majority of Estonian manufacturing enterprises belongto supplier-dominated or production-intensive sub-fields.
In supplier-dominated activities (such as agriculture, textiles, clothing, building, mining, forestry, commerce, andtraditional manufacturing) most innovations come from suppliers of equipment and materials; firms that oper-ate in these activities undertake generally little R&D and request few patents; main innovations are incremen-tal cost-reducing process innovations embodied in intermediate and capital goods.
In production-intensive activities (such as scale-intensive industries including cement and glass manufacturing,metal refining, and transportation equipment, and specialized suppliers such as machinery production), R&D isconducted in the larger firms; it is centred on both product and process technologies; firms tend towards ver-tical integration and appropriability is linked to tacit knowledge, secrecy, and patents. While R&D based inno-vative acts in the supplier-dominated or production-intensive sectors are everywhere relatively low, this explainswhy Estonian enterprises are generally investing very little resources to research and development.
Indeed, empirical data shows that the Estonian research system is not strong in an international comparison. In2005 total spending on R&D reached 0.9% of GDP; EU15 average was 1.9% and EU27 1.8%. Private spend-ing on R&D was 0.36% of GDP in Estonia (2004); in EU15 it was 1.2% and EU27 1.0% (Eurostat 2007),although private spending has increased to 0.42% in 2005 (Statistical Office of Estonia).
The branches of Estonian industry whose sectoral value added as % of national GDP is the highest, are notR&D intensive. For example, when transport, storage and communication have a contribution of 10.6% to GDP(2005), its R&D intensity14 is only 0.1; in the wholesale and retail trade and repair of motor vehicles the respec-tive figures are 13.2 and 0.08. The most R&D intensive sectors in Estonia are computer and related activities,manufacture of electrical and optical equipment, chemical industry, and manufacture of transport equipment(Appendix 1.1).
These conclusions hold when looking at the R&D personnel (FTE) by sectors. Out of the 445 R&D FTE in themanufacturing industry (2004), 207 are employed in electronics and 91 in the chemical industry (Appendixes1.2 and 1.3). When considering total R&D expenditures mainly the same picture may be observed, only finan-cial intermediation, transport, storage and communications, and electricity, gas and water supply come up aswell (Appendix 1.4). A sharp increase took place in private R&D expenditures in 2003 and has continued to risestrongly in 2004 and 2005 as well. Again, manufacture of electrical and optical equipment and computers andrelated activities were the most rapidly growing sectors; the share of these sectors exceeded one third of thetotal private R&D expenditures in 2004.
Observations concerning innovative sectors are also confirmed with the results of the survey on the companieswith innovative activities (CIS4) (Appendices 1.5 and 1.6).
Estonian smallness and limited R&D intensity of private sector are also indicated by the small number of com-panies with business expenditures on R&D: There are altogether 357 companies conducting R&D according tothe Statistical Office of Estonia (2005). 129 of them belong to the manufacturing sector: 44 in the manufac-ture of electrical and optical equipment, 18 in the chemical industry and 19 in the food industry. 210 belongto the services sector: 67 to the computer and related activities and 29 are dedicated R&D companies (overviewof main sectors in Table 1; full data in Appendix 1.7).
14 Share of sectoral R&D in sectoral value added.

Innovation Staff Recruitment Programme Feasibility Study3. The Estonian context
21
Table 1. Companies reporting R&D expenditures, 2005
Companies Employeesreporting above 150–249 50–149 10–49 below
BERD 249 10
Total 357 33 20 54 97 153
Manufacturing 129 21 12 34 34 28
Manufacture of food products and beverages 19 7 3 6 3 0
Manufacture of coke, chemical products… 18 3 1 3 7 4
Manufacture of other non-metallic mineral products 9 2 1 2 4 0
Manufacture of basic metals… 14 0 2 6 6 0
Manufacture of electrical and optical equipment 44 2 2 7 9 24
Electricity, gas and water supply 9 5 1 2 1 0
Services 210 4 6 18 58 124
Wholesale and retail trade… 30 0 0 1 8 21
Transport, storage and communication 10 2 3 2 2 1
Financial intermediation 5 2 2 0 1 0
Computer and related activities 67 0 0 3 14 50
Research and development 29 0 0 0 8 21
Real estate, renting and business activities… 27 0 1 4 8 14
Source: Statistical Office of Estonia, 2007
There are 111 companies with BERD/turnover higher than 10% of turnover, dominated by dedicated R&D com-panies (27) and IT companies (24). The share of companies with BERD/turnover being 1–10% is 88; the largestsub-sectors are chemical (12), electronics (11) and metal (9) industries. 158 companies have the ratio less than1% (for detailed data see Appendix 1.7).
Many companies reporting BERD are very small – 43% employ less than 10 people (Figure 3). Of the 204 BERDreporting companies employing more than 10 people, 101 of them are in manufacturing (20 in the manufac-ture of electrical and optical equipment, 19 in the manufacture of food products and beverages) and 86 in theservices sector (17 in the computer and related activities). 220 (out of 357 that report of BERD) haveexport/turnover ratio below 10%. Those with the ratio above 49% are 69 (Figure 4, see also Appendix 1.7).
Figure 3. Number of employees in companies Figure 4. Export/turnover ratio in companies reporting of BERD reporting of BERD
Source: Statistical Office of Estonia, 2007 Source: Statistical Office of Estonia, 2007
According to Archimedes Foundation the number of applications submitted to the European CommunityFramework Programme for Research, Technological Development and Demonstration (FP6, 2002–2006) byEstonian companies was altogether 132 (58 in information society technologies, 16 in biotech, but also 9 inenergy and 7 in environment fields, for example). FP6 funding was granted to 51 project proposals that weresubmitted by 43 companies (some companies participated in multiple projects).

Innovation Staff Recruitment Programme Feasibility Study3. The Estonian context
22
Table 2. FP6 funded projects with Estonian participants by research priority
Information society technologies 17
Horizontal research activities involving SMEs 13
Sustainable development, global change and ecosystems 6
Life sciences, genomics and biotechnology for health 4
Nanotechnologies and nanosciences, knowledge-based multifunctional materials and new production processes and devices 3
Research and innovation 3
Science and society 3
Citizens and governance in a knowledge-based society 1
Human resources and mobility 1
Total number of projects: 51
Source: Archimedes Foundation, 2007
3.3 People in science, engineering and research
Compared to all EU states the degree of the Estonian population with tertiary education is high: 31.4% com-pared to EU25 average of 21.9. However, the degree of people in science and engineering is low compared toadvanced countries as shown by the table below:
Table 3. Total and S&E workforce in Estonia, Sweden, Ireland and Germany
Country Total labour workforce Total S&E work force S&E workers as % of workforce
(2004) (2004) (2004)
Estonia 659,100 17,000 2.6
Sweden 4,512,000 270,000 6.0
Ireland 2,014,000 141,000 7.0
Germany 43,320,000 2,063,000 4.8
Source: Labour Force Statistics by OECD (2004)
Estonia is also behind EU25-average when it comes to the output of graduates in science and engineering sub-jects. However, as illustrated by the following figure, a good catching-up process from an initial very low posi-tion seems to be under way.

Innovation Staff Recruitment Programme Feasibility Study3. The Estonian context
23
Figure 5. Share of tertiary graduates in science and engineering (SE) as a % of the population aged25–29, 2003, AAGR of tertiary graduates in SE between 1998–2003, in EU-25 and other selectedcountries
Source: Eurostat Database
Admittance to science and engineering has increased over the last five years in Estonia (Table 4).
Table 4. Enrolment, admittance and graduates in S&E15 in Estonia, 2000–2005
2000 2001 2002 2003 2004 2005
Integrated bachelor and master courses Enrolment – – 486 740 996 1286
Admittance – – 378 381 405 430
Graduates – – 13 10 10 6
Master courses Enrolment 897 1086 1238 1390 1486 2189
Admittance 421 470 533 586 549 1242
Graduates 150 186 248 256 262 335
Doctoral courses Enrolment 496 543 598 688 752 834
Admittance 127 115 140 165 176 195
Graduates 42 31 38 49 66 63
Source: Statistical Office of Estonia, 2007
Admittance to social sciences and humanities dominate; admittance to engineering was 56 (in 2005), physicalsciences 51, life sciences 38 (in 2005), computer sciences (34) (Appendix 1.8). Among the graduates (118 in2005) there were 15 graduates from engineering (19), 15 from life sciences and 5 from computer sciences(Appendix 1.9).
The Estonian work force engaged in R&D is still quite modest. The table below shows the Full Time Equivalents(FTE) spent on R&D by industry in Estonia, Sweden and Germany.
15 Science and engineering includes the following fields of education: life sciences, physical sciences, mathematics and sta-tistics, computing, engineering and engineering trades, manufacturing and production, architecture and building.Integrated bachelor and master courses include only architecture and building.

Innovation Staff Recruitment Programme Feasibility Study3. The Estonian context
24
Table 5. R&D personnel in FTE in industry and in work force
Country R&D FTE in industry FTE per 10.000 of work force
Estonia (2004) 1.084 159
Sweden (2003) 49.000 1.086
Germany (2003) 330.000 762
Source: Statistical Office of Estonia and VINNOVA 2003
However, personnel engaged in R&D in business sector has grown more than twice over 1998–2004 and almostfour times in the manufacturing sector, although it is primarily contributable to the low level of 1998 (whenthe R&D personnel in FTE was only 104 in manufacturing in total). Two fields of activities – manufacture of elec-trical and optical equipment and computer and related activities– have contributed to the growth the most (fordetailed distribution of R&D personnel see Appendices 1.2 and 1.3).
Estonia faces an unfavourable situation regarding the age structure of HRSTE – 42% of the work force isbetween 45 and 64 years old.16 This holds particularly true for academic institutions.
3.4 Shortage of skilled labour is a bottleneck for growth
Legislators, senior officials and managers account for 13% of employed persons, professionals 27% and increasemay be observed over the years. Clerks and service workers account for 18%, skilled workers for 32% and ele-mentary occupations 10% (Table 6).
Table 6. Employed persons, occupation and year
1997 2000 2003 2006
Occupations total 617,2 572,5 594,3 646,3
Legislators, senior officials and managers 84,6 72,4 69,8 83
Professionals 69 75,7 82,6 94,8
physical, mathematical and engineering science professionals 10,8 16,3 17,1 20,8
life science and health professionals 6,5 8,7 7,4 10,1
teaching professionals 26 24,8 33,7 33,6
other professionals 25,6 25,9 24,4 30,3
Technicians and associate professionals 82,5 80,3 71,7 79,1
physical and engineering science associate professionals 16,8 20,9 11,3 13,2
life science and health associate professionals 14,8 11,9 15,8 10
teaching associate professionals 6,7 4,6 2,2 1,4
other associate professionals 44,3 42,9 42,4 54,5
Clerks 28,4 27 30,2 32,8
Service workers and shop and market sales workers 67 62,1 76,3 81,2
Skilled agricultural and fishery workers 28,3 21,3 15 11,7
Craft and related trades workers 105,8 90,7 93,6 100,4
Plant and machine operators and assemblers 80,9 79 83 94
Elementary occupations 68,4 62,5 68,4 65,1
Source: Statistical Office of Estonia, 2007
Various empirical evidence identified during desk research as well as interviews carried out during the projectconfirm that Estonian enterprises have major problems in finding suitable personnel; an extensive study among2000 entrepreneurs confirmed that 70% of enterprises regarded finding skilled workers complicated as of 2005(Saar Poll 2005).
16 Statistics in Focus, Science and Technology, Eurostat.

Innovation Staff Recruitment Programme Feasibility Study3. The Estonian context
25
Figure 6. Finding employees (1 – very simple, 5 – very difficult)
Source: Saar Poll 2005, 34.
Another survey, conducted among 810 low-, middle- and high-technology manufacturers, resource-based indus-trial companies, and companies providing knowledge-based services in May-June of 2005 concluded that theprimary development obstacle was the financing of innovations, then finding sufficient labour, as well as insuf-ficient access to markets. If we compare the measures where the involvement of the state is most anticipated,then a large number of entrepreneurs have specified the weakness of the practice training system and the needto develop respective measures (Figure 7).
Figure 7. Highest-rated and desired support measures
Source: Jürgenson et al. 2005, 12
The problem is also crucial among companies that are undertaking R&D. In an impact evaluation of the R&Dfinancing programme run by Enterprise Estonia, projects that were granted with funding in 2001–2004 werestudied. The beneficiaries were asked about the main factors which inhibited the successful conduct of the proj-ect. The lack of management, scientific and technological skills was revealed (Figure 8).

Innovation Staff Recruitment Programme Feasibility Study3. The Estonian context
26
Figure 8. Factors hindering successful implementation of the projects17
Source: Jürgenson, forthcoming 2007.
There are also many sector studies that have come to similar results. For example, more than half of the com-panies in ICT sector have mentioned that they cannot find the sort of people they would like to employ in thelabour market. The problems include the lack of experience and the required level and motivation of employ-ees (PW Partners 2002; see also Kalvet et al. 2002).
The shortage of a qualified labour force is exacerbated even more with some top specialists and skilled work-ers leaving for abroad (see 3.1).
There are various factors that have caused such a situation, e.g. lack of graduates of science and engineering(e.g. the share of graduates of science and engineering among youth aged 20–29 was 8.9 in 2004; comparedto 23.1 in Ireland, 13.6 in EU15, and 12.7 in EU25), problems with curricula and minor focus on apprentice-ships during studies (see Kattel and Kalvet 2006 for in-depth discussion on ICT education), etc. Such problemsare now well known and steps to reinforce educational and research system are being undertaken.
3.5 Classification of companies and need for Mobility Support Measures
Considering the task at hand (elaboration of the mobility scheme) we have proposed the following division ofEstonian companies based on the desk research and interviews carried out as well as considering previouslyapplied methodological approaches (e.g. staircase model applied by MKM):
Table 7. Distribution of companies according to R&D&I performance
Type Comments and estimated size
a. World-class or There are some 50 world class research intensive companies (type a) in Estonia. Such an close to world-class, assessment was made by various experts. Also, according to data from Archimedes research-intensive Foundation there are 43 companies that have successfully co-ordinated or partnered in companies FP6 projects over 2002–2006.
Type (a) companies belong mostly to the following sectors: information and communication technology, electronics, biotechnology, energy, environment, nanotechnologies (see table 2), but also to the chemical industry in general (according to Appendix 1.2).
17 Preliminary data.

Innovation Staff Recruitment Programme Feasibility Study3. The Estonian context
27
Type Comments and estimated size
b. Internationally Based on the estimation of different experts to expect the number of internationally competitive companies competitive with limited research but strong development companies (type b) to be with limited 150–200. Indeed, according to the Statistical Office the number of companies that have research but strong more then 9 employees and report of R&D costs is 204. According to CIS4 there are development 39 companies with R&D costs between 5–10% of turnover and an additional capacity 99 companies with R&D costs up to 5% of turnover that are co-operating with R&D
institutions. From another perspective: there were 89 companies that submitted application for FP6 funding, but were not successful (Archimedes Foundation).
Type (b) companies belong mostly to the following sectors: information and communication technology (incl. financial intermediation), electronics, chemical industry, manufacture of transport equipment, dairy industry, manufacture of metal as well as non-metallic mineral products (see also Chapter 3.2).
c. Competitive (growing We assume the number of competitive growing companies that have some firms) with limited development capacities, to be some 1,500. According to CIS4 the number of exporting development and no innovative companies with more than 10 employees (2002–2004) is 1342. research capacity In addition, there are companies that are currently focused on the Estonian market,
but about to break through to the world market; thus, we have enlarged the group by some 150 companies.
Type (c) companies as innovative and exporting companies may be found in all economic sectors (Appendixes 1.5 and 1.6). For detailed overview of innovation performance of various economic sectors see CIS4 report on Estonia by Viia et al. 2007.
Non-growth companies n/a
Current science, technology and innovation policy measures have mostly focused on universities and research-intensive companies, but it is of utmost importance to admit that many competitive and growing firms inEstonia have limited development and no research capacity, but can take advantage of product, process, organ-isational and/or marketing innovations in order to increase their crucial success in export markets. Such com-panies are currently in a development phase where they are looking for possibilities to move on into activitieswith higher added value and availability of skilled labour would allow them to rapidly move ahead in areas wherethey already have certain competence for development activities.
Based on interviews carried out during the project and following the typologies of companies the followingrough skill needs have been identified:
Table 8. Need for additional competencies according to company types
Type Need
a. World-class or close to world-class, Senior (top level) researchers; marketing specialists (marketing research-intensive companies specialists usually have to have technical knowledge about the very
research-intensive products – so a double profile is probably needed
b. Internationally competitive companies Internationally experienced managers, people with product and with strong development and some technology management competenceresearch capacity
c. Competitive (growing firms) with limited Internationally experienced managers, engineers, designers, development and no research capacity innovation managers, international sales, other specialists
d. Non-growth companies n/a
Fresh graduates cannot take such places as people who have acquired higher education – they need in-job train-ing from a couple of months to a year before they meet the requirements and interests of companies.
As innovation and particularly R&D activities are risky and costly, there are many companies that cannot bearsuch risks, especially if there are possibilities to earn profits more easily pursuing activities that do not comprisemuch innovation, let alone R&D. It is of public interest, though, that companies be more innovative.
Although there are some mobility support schemes in Estonia (summary in Chapter 3.6), these are mainly direct-ed towards supporting academic mobility or implementation of very R&D intensive projects (thus supportingmainly type (a) companies).

Innovation Staff Recruitment Programme Feasibility Study3. The Estonian context
28
Introducing measures especially for type (b) and type (c) companies has been proposed earlier as well. For exam-ple, in 2002 the feasibility study “Establishing the basis for the elaboration of the Estonian design policy meas-ures” suggested to launch a so-called “icebreaker program” to offer financial support to companies that forthe first time buy professional design services from approved Estonian designers. Also, the analysis of the designand implementation of the Estonian RTDI policy (carried out by Technopolis in 2005) included a proposal forinnovation policy measures for Estonia in 2007–2013 and emphasized the need for more human capital mobil-ity. The study also offered a very preliminary description for the support measure, divided into two categories:1) Recruitment of researchers in enterprises (required: industrial engineering or university degree in science); 2)Recruitment of innovation managers in enterprises (required: third level educational degree or certificate in tech-nology, innovation or quality management, industrial design or an equivalent qualification).
3.6 An estimation of the future need for skilled people
It has already been established that Estonia is facing a serious labour market problem. Growing vacancies arestrongly interrelated both with the age structure of generations as well as labour emigration. It is obvious thatthe population decrease both through demographic situation as well as labour emigration has resulted in seri-ous labour shortage, especially what concerns specialists and skilled workers. This has been recognized as themain problem for the future labour policies to solve in Estonia. Many companies are in need of implementingnew innovations and this will be accompanied by changes in the labour structure – more specialists and skilledworkers are needed and less unskilled labour (in the current situation all kinds of labour force are needed, somecompanies are ready to employ unskilled people and train them by their own resources). Now the question aris-es – can the number of needed skilled workers be quantified? In the following section an attempt is made toquantify also the need of Estonian industry for skilled people in the coming years.
3.6.1 Labour demand prognosis
Recent research of the Estonian Ministry of Economics and Communication “Labour demand prognosis until2012” points out the estimated numbers of the labour demand in economic sectors until 2012. It has estimatedthat there will be over 625.000 people in the age of 15–64 active in the labour market, which makes 26.000new working places in 2012 compared to 2004 (average of 2003-2005). Among those the largest increase willtake place among specialists (increase 19.200) and skilled workers (increase of approx. 7.000). Yearly it wouldmean about 3.800 new working places. In addition, in next years in average 11 000 employees will retire andtherefore the yearly labour need will be about 14.5 thousand. At the same time, the labour force will bedecreased by 44 000 people in 2012.
The prognosis also say that among all the sectors the overwhelming supply of working places will happen inproduction sector, where foreign specialists and skilled workers could be needed in the manufacture of basicmetals and fabricated metal products; manufacture of machinery and equipment, and manufacture of trans-port equipment.
3.6.2 Science and engineers and researchers
R&D-fulltime equivalents (FTE) in Estonian manufacturing industry increased by 34% from 2001 to 2004. Inabsolute numbers there were 1.084 FTE in 2004. Manufacturers of electrical and optical equipment contributedto almost all of the given increase. In the service sector the increase was 155%. Here the sub-sector “Computerand related activities” contributed to most of the increase. In both cases the largest increase could be noticedfrom 2003 to 2004.

Innovation Staff Recruitment Programme Feasibility Study3. The Estonian context
29
Figure 9. R&D FTE in manufacturing sector
Figure 10. R&D FTE in service sector

Innovation Staff Recruitment Programme Feasibility Study3. The Estonian context
30
It should be noted, however, that the volume of R&D carried out is still very low. There are only 159 R&D FTEper 10.000 of work force in Estonia compared to 1.085 in Sweden and 760 in Germany. The ratio of R&D FTEper person working in S&E is also low, 6% compared to 18% in Sweden and 16% in Germany. The numberof companies undertaking R&D has also increased, from 141 in 2000 to 357 in 2005 and there is a rapid increasein their R&D intensity as well as illustrated by the table below.
Table 9. Development of companies carrying out R&D
Export/Turnover Employees BERD/turnover
2005 357 69 31 37 220 33 20 54 97 153 111 16 21 51 158
2004 262 61 22 24 155 26 15 47 71 103 73 22 13 43 111
2003 236 43 16 22 155 25 19 44 47 101 54 16 17 34 115
2002 214 50 14 20 130 19 16 28 56 95 72 17 12 35 78
2001 202 43 25 18 116 25 12 37 49 79 67 18 10 43 64
2000 141 43 10 22 66 25 11 36 48 21 29 14 13 34 51
Source: Statistical Office of Estonia
Using time series to estimate the future need for S&E-people is an uncertain method, as there seem to be fluc-tuations in companies’ R&D efforts over the years. Due to the small sample the large increases can be signifi-cantly influenced e.g. by a large investment by a foreign company, but also interpretations of R&D expenditures.
Nevertheless, available statistics indicate a strong increase in the demand for S&E-competence. A rough esti-mate could be that the 2004 number of approx.1,084 FTE will double in five years. One way of coming to thisestimation is to assume an exponential development of the number of R&D FTE the coming years. This devel-opment is illustrated by the diagram below:
Figure 11. R&D FTE in manufacturing sector
Another approach to make an estimation of the need for R&D people is to assume that the ratio of R&D FTEand number of companies that report R&D activities will remain constant. Using the data available from 2004this ratio is (1,084/262) 4.1 FTE per company reporting R&D activities. Applying a linear or exponential trend(as illustrated below) to the development of the number of companies reporting R&D activities the past yearsthe need for R&D-people in 2010 is approximately 2,100 with linear development and 2,900 with exponentialdevelopment.
Com
pani
es r
epor
ting
BERD
abov
e 49
%
30–4
9%
10–2
9%
belo
w 1
0%
abov
e 24
9
150–
249
50–1
49
10–4
9
belo
w 1
0
abov
e 10
%
5–10
%
3–4%
1–2%
belo
w 1
%

Innovation Staff Recruitment Programme Feasibility Study3. The Estonian context
31
Figure 12 & Figure 13. Estimation of the need for R&D FTE
However, these figures must be seen as an absolute minimum as research activities are likely to rise in the com-ing years.
In order to reach the same intensity of S&E workforce in Estonia as in e.g. Sweden (approx. 5%) a further 17,000people must work in S&E-professions. The number of graduates in S&E was approx. 5,800 in 2005. Assuminga yearly retirement of some 3,000–4,000 persons it means that it will take 7–8 years before this level of S&E-workforce is achieved without importing work force. According to the objectives of the Knowledge-BasedEstonia 2007–2013, the increase must be even higher: According to the Strategy Estonian total R&D expendi-tures are expected to increase to 3.0% by 2014; the share of enterprises (BERD) 1.6%. By 2014 the share ofR&D (researchers and engineers) personnel is expected to rise to 8 per 1,000 employees.
It should also be pointed out that even if the number of new S&E-graduates develops in a satisfactory mannerthis will not solve the problem of availability of experienced people in the short run. The proportion of the pop-ulation in Estonia with Science and Engineering education is biased towards the ages 45–64.18 The yearly netcontribution of some 2.000 S&E-persons is therefore not perfectly matching the needs of the industry. Assumingthat the 3.000–4.000 persons retiring can not be replaced completely by new graduates it will cause a lack ofpeople that can easily amount to 2.000 persons per year during a 5–7 year period.
18 Statistics in focus, SCIENCE AND TECHNOLOGY 11/2006 (Eurostat)

Innovation Staff Recruitment Programme Feasibility Study4. Discussion and conclusions
32
The present chapter discusses, based on the theoretical framework of Chapter 2 and on the analysis of theEstonian situation given in Chapter 3, the policy rationale for public intervention in the given area in Estonia.The discussion, in turn, provides the basis for a set of implications regarding the design of a recruitment andmobility scheme for Estonia.
4.1 Is there a policy rationale for a mobility/recruitment scheme in Estonia?
Assuming that the assumption holds true that skills are crucial to enable innovation, Estonia seems to be fac-ing two problems that prevent the country from utilising its full economic potential:� Industry demands more skilled people than the Estonian educational and vocational system is able to pro-
duce. � Parts of the Estonian industry lack motivation to employ skilled people who could help boost innovation.
Now the question arises if these problems are of such nature that they motivate policy intervention. In gener-al the policy rationale for intervening in private sector innovation processes through mobility/recruitment schemescan find support both in neoclassical theory and in the Systems of Innovation (SI) approach. It is far beyond theambitions and scope of this study to elaborate on innovation policy theory but the fundamental arguments forwhy policy intervention is motivated will be presented nevertheless.
The first problem is a typical system problem or system failure (as opposed to market failure, which typicallyconcerns individual organisations). To use the vocabulary of SI-policy theory the Estonian educational systemseems to be facing what is termed “Infrastructure provision and investment problems” as well as “Transitionproblems” and “Network problems” meaning in short that:19
� Historically, investment in higher education and vocational training has been too small (Infrastructure pro-vision and investment problems)
� Investments have been made in areas not always favourable of innovation and market-orientation.� Linkages between organisations of the innovation system (such as companies and R&D-institutions) have
been and probably still are too weak to allow efficient knowledge transfer.
In terms of rationale for policy intervention the second issue can be motivated relying on neoclassical marketfailure arguments such as:� Companies do not employ staff with innovation skills because they are uncertain about the outcomes of
what this type of staff can contribute with.� Companies are reluctant to employ innovation staff because they are uncertain of how to protect the out-
puts of the innovation process.� Companies are unwilling to make the initial necessary investments in order to produce innovations.
However, this reluctance can also be attributed to system problems such as weak capability of companies toadapt to new situations such as global competition, changing market demands, etc. A crucial point, which isout of scope of this study but nevertheless should be mentioned, is regulatory-related problems (such as redtape) that seem to discourage Estonian companies from employing in particular foreign experts.20
On a more pragmatic level the justification of public intervention in areas related to innovation can be testedby applying the following questions to the given “issue” (here the fact that Estonian industry needs skilled peo-ple in order to continue growing):� How important is it to Estonia or Estonians that the problem is solved in a short time frame?� Will the problem solve itself in a short time frame?� Could public intervention make a difference at reasonable efforts?� Can other policy measures solve the problem in a more effective and efficient manner?� Can public support be maintained until the situation improves?� Would it be possible to assess the contribution of public support to solving the problem?
4 Discussion and conclusions
19 Some of these systemic problems mentioned in the literature include (Norgren and Haucknes, 1999: Smith 2000;Woolthuis, Lankhuizen et al. 2005):
20 The study” Conditions of Entry and Residence of Third Country Highly-Skilled Workers in the EU. SMALL SCALE STUDYIII. ESTONIAN MIGRATION FOUNDATION. TALLINN OCTOBER 2006” points out that in particular extensive red tape in issu-ing work permits hampers the employment of foreign experts.

Innovation Staff Recruitment Programme Feasibility Study4. Discussion and conclusions
33
In Chapter 3 we have shown that large parts of Estonian industry consider the lack of skilled people a bottle-neck for growth. This holds true for as good as all types of companies – from low to high tech. Consequently,it seems to be of strong national interest that industry’s access to skilled people is improved.
Recent efforts in strengthening the education system will improve the availability of people with a science andengineering background in 4–6 years time. At the same time, however, the age distribution of Estonians impliesthat a significant degree of retirements will take place in the coming 10-year period. The consequence will bea work force with quite a lot of people with limited experience and a large cohort on the doorstep of retire-ment. The problem of availability of experienced people will therefore not be solved within at least a ten-yearperiod or probably longer. A consequence of this is that even if other measures are necessary to counter theproblem, recruitment schemes aiming at increasing availability of skilled people seem inevitable to Estonia, atleast in the short run.
In the European perspective there is quite a lot of experience in recruitment and mobility schemes, in particu-lar focusing on the mobility of researchers and graduate students. Although both bad and good practice maybe found, the general conclusion must be that such schemes work quite well, i.e. additionality21 is high,although they are relatively heavy to administer and deliver. At this point it should be pointed out, however,that a recruitment and mobility scheme is a rather advanced intervention tool suitable for:� companies that have the capability to absorb the skills provided by the new staff member and,� companies that are committed to strategic development and innovation.
A general experience made is that larger companies tend to make more use of mobility schemes than SMEsdo. This can be explained largely by the higher absorptive capacity of larger companies and by the fact thatmost mobility schemes in place emphasise recruitment of researchers. Consequently a key risk for any mobili-ty-promoting scheme is that it may be difficult to involve smaller companies, which normally is the primary tar-get group. A short list of success factors for mobility and recruitment schemes would be:22
� Unbureaucratic programme management, in particular regarding application procedures, cost reportingand reimbursement regulations.
� Strong technical assistance, including in-process support to applicants during the entire cycle of activities,from application to final report. Please refer in particular to the experiences of the Danish industrial PhD-programme and CIFRE (France).
� Strong visibility of the programme. To reach all target groups the programme must be marketed in a pro-active way.
� Strong networks. Mobility and recruitment schemes are characterised by a match-making activities. Theprogramme management organisation must have access to strong networks, both domestically and inter-nationally, in order to facilitate the given match-making.
In Estonia there are a number of on-going policy measures in areas related to mobility and recruitment. Themost important ones are listed in section 4.2. In section 6.5 an attempt is also made to estimate potential syn-ergy effects of a new recruitment/mobility scheme and existing schemes. In short it may be concluded that on-going measures do not address the full range of mobility as outlined by the terms of reference of the presentstudy. Existing measures primarily target mobility (also internationally) of researchers between research-institu-tions or indirectly by subsidising companies’ costs for R&D-projects (which may include external staff costs). Thereare no schemes directly supporting the mobility/recruitment of skilled people and in particularly not mobilityfrom abroad to Estonia.23
Another question is if there are more appropriate mechanisms for promoting the recruitment of highly skilledstaff. A different path could be to offer all companies employing skilled people tax-related subsidies such asdouble deduction possibilities for employment costs. However, such instruments seem to be less suitable forEstonia. For a start wage subsidy is probably a more powerful tool, in particular since such intervention alsopositively influences the cash flow of companies. For SMEs struggling with low profit margins this may be adecisive factor for employing or not.
21 Meaning that the companies would not have recruited without the scheme support. Please refer to Appendix 2 for moreinformation about good practice measures.
22 Please refer to appendix 2 for more in-depth information on international good practice schemes 23 For more details please refer to ESTONIAN MIGRATION FOUNDATION. EUROPEAN MIGRATION NETWORK. Conditions of
Entry and Residence of Third Country Highly-Skilled Workers in the EU. SMALL SCALE STUDY III. Tallinn October 2006.

Innovation Staff Recruitment Programme Feasibility Study4. Discussion and conclusions
34
Typically, public policy measures are time limited. The time frame should be set in such a way that the objec-tives of the measure could be achieved. For measures aiming at mobility and recruitment there could be dif-ferent objectives (please refer to Chapter 2 for a more elaborate discussion on objectives). In the case of anEstonian scheme the objective should be to enhance the availability of skilled people to Estonian industry aswell as to provide a final incentive for companies committed to innovation and change. The time frame forachieving this objective is at least five years. A scheme funded by the structural funds programme of 2007–2013therefore offers a sound basis.
Regarding the issue of measuring outputs of a mobility/recruitment scheme in terms of company competitive-ness this is a well known problem related to the fact that it is very difficult to isolate e.g. an increase in profitor turnover to the contribution of one staff member. In general it may be possible that one innovation man-ager can have enough power to activate innovation activities and processes in the firm but how to assess this?It is possible if companies involved in the schemes are questioned on a continuous basis, e.g. annually or bi-annually. In Chapter 4 a comprehensive evaluation framework including indicators is described.
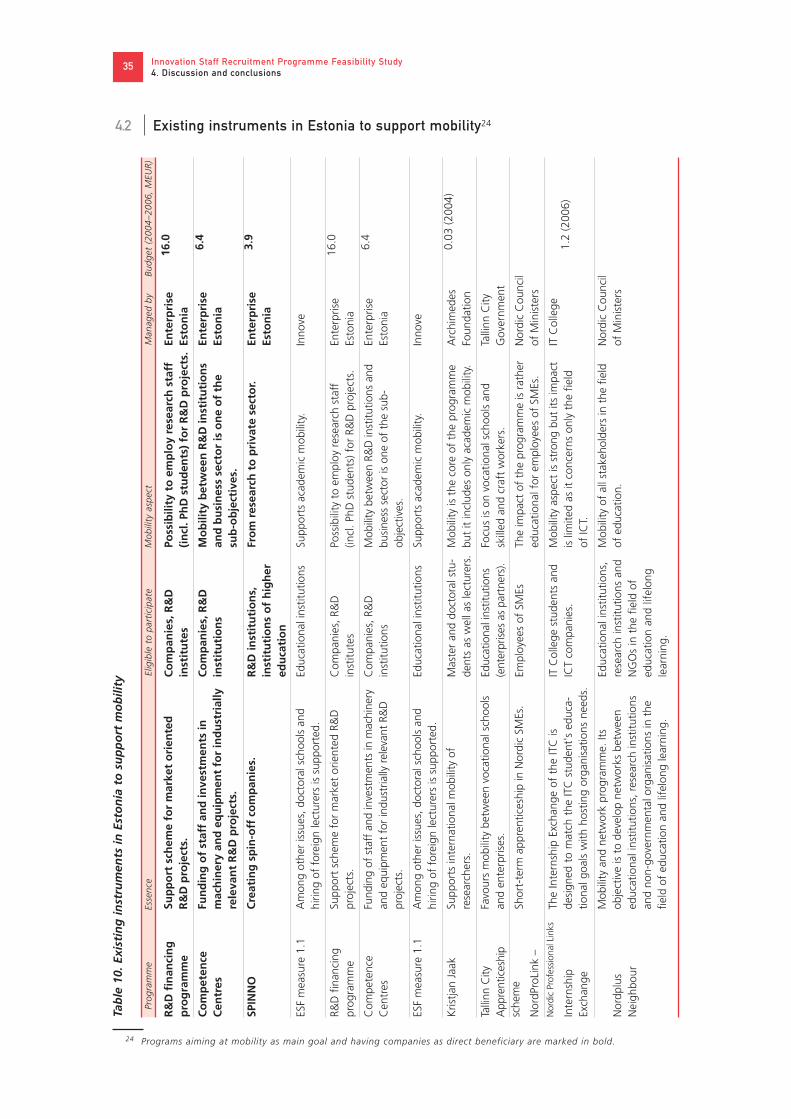
Innovation Staff Recruitment Programme Feasibility Study4. Discussion and conclusions
35
4.2 Existing instruments in Estonia to support mobility24
24 Programs aiming at mobility as main goal and having companies as direct beneficiary are marked in bold.
R&
D f
inan
cin
gp
rog
ram
me
Co
mp
eten
ceC
entr
es
SPIN
NO
ESF
mea
sure
1.1
R&D
fin
anci
ngpr
ogra
mm
e
Com
pete
nce
Cen
tres
ESF
mea
sure
1.1
Kris
tjan
Jaak
Talli
nn C
ityA
ppre
ntic
eshi
psc
hem
e
Nor
dPro
Link
–
Nor
dic
Prof
essi
onal
Lin
ks
Inte
rnsh
ipEx
chan
ge
Nor
dplu
sN
eigh
bour
Sup
po
rt s
chem
e fo
r m
arke
t o
rien
ted
R
&D
pro
ject
s.
Fun
din
g o
f st
aff
and
inve
stm
ents
inm
ach
iner
y an
d e
qu
ipm
ent
for
ind
ust
rial
lyre
leva
nt
R&
D p
roje
cts.
Cre
atin
g s
pin
-off
co
mp
anie
s.
Am
ong
othe
r is
sues
, doc
tora
l sch
ools
and
hirin
g of
for
eign
lect
urer
s is
sup
port
ed.
Supp
ort
sche
me
for
mar
ket
orie
nted
R&
Dpr
ojec
ts.
Fund
ing
of s
taff
and
inve
stm
ents
in m
achi
nery
and
equi
pmen
t fo
r in
dust
rially
rel
evan
t R&
Dpr
ojec
ts.
Am
ong
othe
r is
sues
, doc
tora
l sch
ools
and
hirin
g of
for
eign
lect
urer
s is
sup
port
ed.
Supp
orts
inte
rnat
iona
l mob
ility
of
rese
arch
ers.
Favo
urs
mob
ility
bet
wee
n vo
catio
nal s
choo
lsan
d en
terp
rises
.
Shor
t-te
rm a
ppre
ntic
eshi
p in
Nor
dic
SMEs
.
The
Inte
rnsh
ip E
xcha
nge
of t
he IT
C is
desi
gned
to
mat
ch t
he IT
C s
tude
nt's
edu
ca-
tiona
l goa
ls w
ith h
ostin
g or
gani
satio
ns n
eeds
.
Mob
ility
and
net
wor
k pr
ogra
mm
e. It
s ob
ject
ive
is t
o de
velo
p ne
twor
ks b
etw
een
educ
atio
nal i
nstit
utio
ns, r
esea
rch
inst
itutio
nsan
d no
n-go
vern
men
tal o
rgan
isat
ions
in t
hefie
ld o
f ed
ucat
ion
and
lifel
ong
lear
ning
.
Co
mp
anie
s, R
&D
inst
itu
tes
Co
mp
anie
s, R
&D
inst
itu
tio
ns
R&
D in
stit
uti
on
s,
inst
itu
tio
ns
of
hig
her
edu
cati
on
Educ
atio
nal i
nstit
utio
ns
Com
pani
es, R
&D
inst
itute
s
Com
pani
es, R
&D
inst
itutio
ns
Educ
atio
nal i
nstit
utio
ns
Mas
ter
and
doct
oral
stu
-de
nts
as w
ell a
s le
ctur
ers.
Educ
atio
nal i
nstit
utio
ns(e
nter
pris
es a
s pa
rtne
rs).
Empl
oyee
s of
SM
Es
IT C
olle
ge s
tude
nts
and
ICT
com
pani
es.
Educ
atio
nal i
nstit
utio
ns,
rese
arch
inst
itutio
ns a
ndN
GO
s in
the
fie
ld o
f ed
ucat
ion
and
lifel
ong
lear
ning
.
Poss
ibili
ty t
o e
mp
loy
rese
arch
sta
ff
(in
cl. P
hD
stu
den
ts)
for
R&
D p
roje
cts.
Mo
bili
ty b
etw
een
R&
D in
stit
uti
on
s an
d b
usi
nes
s se
cto
r is
on
e o
f th
e su
b-o
bje
ctiv
es.
Fro
m r
esea
rch
to
pri
vate
sec
tor.
Supp
orts
aca
dem
ic m
obili
ty.
Poss
ibili
ty t
o em
ploy
res
earc
h st
aff
(incl
. PhD
stu
dent
s) f
or R
&D
pro
ject
s.
Mob
ility
bet
wee
n R&
D in
stitu
tions
and
busi
ness
sec
tor
is o
ne o
f th
e su
b-ob
ject
ives
.
Supp
orts
aca
dem
ic m
obili
ty.
Mob
ility
is t
he c
ore
of t
he p
rogr
amm
ebu
t it
incl
udes
onl
y ac
adem
ic m
obili
ty.
Focu
s is
on
voca
tiona
l sch
ools
and
skill
ed a
nd c
raft
wor
kers
.
The
impa
ct o
f th
e pr
ogra
mm
e is
rat
her
educ
atio
nal f
or e
mpl
oyee
s of
SM
Es.
Mob
ility
asp
ect
is s
tron
g bu
t its
impa
ct
is li
mite
d as
it c
once
rns
only
the
fie
ld
of IC
T.
Mob
ility
of
all s
take
hold
ers
in t
he f
ield
of e
duca
tion.
Ente
rpri
se
Esto
nia
Ente
rpri
se
Esto
nia
Ente
rpri
se
Esto
nia
Inno
ve
Ente
rpris
e Es
toni
a
Ente
rpris
e Es
toni
a
Inno
ve
Arc
him
edes
Foun
datio
n
Talli
nn C
ityG
over
nmen
t
Nor
dic
Cou
ncil
of M
inis
ters
IT C
olle
ge
Nor
dic
Cou
ncil
of M
inis
ters
16.0 6.4
3.9
16.0 6.4
0.03
(200
4)
1.2
(200
6)
Prog
ram
me
Esse
nce
Elig
ible
to
part
icip
ate
Mob
ility
asp
ect
Man
aged
by
Budg
et (
2004
–200
6, M
EUR)
Tab
le 1
0. E
xist
ing
inst
rum
ents
in E
sto
nia
to
su
pp
ort
mo
bili
ty

Innovation Staff Recruitment Programme Feasibility Study4. Discussion and conclusions
36
4.3 Which of the available policy measures are appropriate for Estonia?
Recruitment and mobility policy measures can be categorised as according to different factors of which the mostimportant are:� The prioritised goal of the measure� The source of people targeted by the measure� The type of company targeted by the measure
Goals can be of two fundamental categories. 1) Labour market-oriented, e.g. increase employment, 2) Growth-oriented, e.g. increase competitiveness of companies by strengthening the internal knowledge base. These meas-ures usually target so-called skilled people.
The source of people can be either international or domestic. Measures (such as mobility and recruitmentschemes) that source people domestically usually work only in labour markets with a general surplus of workforce or a surplus in specific domains such as public research.
Companies targeted by measures are normally SMEs as large companies are considered to be able to solve recruit-ment on their own. However, companies’ growth potential and knowledge-absorption capacity is also impor-tant, in particular when it comes to growth-oriented measures and recruitment of skilled people.
Here follow the conclusions regarding some common types of mobility/recruitment measures that are in usetoday and their relevance to Estonia. The primary focus is on growth-oriented measures.
4.3.1 Skilled workers migration schemes
Context and key challenges
Systematic approaches to skilled worker migration can primarily be found in countries with a high immigrationpressure such as the US, UK, Canada and Australia. Here, migration schemes targeting skilled people have beenin place for quite some years now. Fast growing economies such as Ireland and Singapore have introduced meas-ures more recently and in a few of the new European member states the introduction of measures is discussed.
The normal “mechanism” of a migration scheme is to offer a fast track to work permit for people that fulfilcertain skill levels. Some schemes also offer additional advantages such as work permit for spouse and the pos-sibility of permanent citizenship.
Relevance to Estonia
Migration schemes for skilled people are highly relevant and important for Estonia but probably more in a mid-to long-term perspective than for achieving fast results in terms of inflow of skilled people. On the one handevery skilled migrant is welcome and there is definitely a need to modernise migration policy. On the other handit is unlikely that even a pro-active migration policy and strong efforts in international marketing would increasesignificantly and rapidly the number of foreigners seeking working permit in Estonia. An exemption to thisassumption may be skilled people from Russia or NIS-countries as can be people from other new EU-memberstates.
Regardless of the time horizon and the origin of potential immigrants Estonia needs to up-grade its migrationpolicy. Several of the people interviewed complained about the difficulty of employing non-Estonians andexpressed a belief that migration policy is protecting a labour market that does not need protection at presenttime. In particular the lack of skilled workers is a strong argument for relieving migration rules at least for peo-ple fulfilling certain skill levels.
Conclusion: Migration schemes are not the core of this study but a modernisation of Estonian migration policy to specifically address the issue of skilled worker deficit is necessary.

Innovation Staff Recruitment Programme Feasibility Study4. Discussion and conclusions
37
4.3.2 Repatriate schemes
Context and key challenges
Repatriate schemes aim at bringing back, on short term or permanent basis, people who due to some reasonhave left the country (expatriates). Normally such schemes are aimed at skilled people who are expected to con-tribute to growth and prosperity through their experiences, networks and knowledge.
Typically concerted repatriate measures are taken by developing countries and there are also major initiativesof the United Nations and countries with colonial history. The repatriate scheme builds on the emotional andcultural ties of the expatriate to his native country and normally offers some kind of service package when thisperson returns to the home country to work. A package can include e.g. wage subsidies for the company, spouseemployment, health care services etc.
Relevance to Estonia
Although the new European members are better positioned than the typical states deploying repatriate meas-ure this instrument should be highly relevant to Estonia in its effort to increase the availability of skilled peoplein the medium-term perspective. An estimation provided by the Estonian Ministry of Social Affairs gives at handthat in the period May to December 2005 about 25.000 Estonians were working abroad on a longer term oreven permanent basis. Most of them can be found in Finland and in the UK but also in Ireland, Sweden andNorway. This constitutes around 2,6% of the total labour force. A rough estimation is that 30–40% of theseare skilled workers whose competence would be valuable contribution to Estonian companies.25 A few casesof repatriation can also be observed in very strong Estonian sectors such as biotechnology. These examples provethat repatriation is possible and indicates that a systematic approach has good chances of being successful.
Conclusion: A repatriation scheme equipped with financial resources of the structural funds pro-grammes could be a valuable instrument for attracting skilled people (back) to Estonia.
4.3.3 Researcher mobility schemes
Context and key challenges
The recognition of science for technological breakthroughs providing the fundaments for marketable innova-tions is a corner stone in modern growth policy. At the same time science and industry often represent twoseparate worlds. Traditionally, the policy answer has been intermediary organisations transferring technologiesfrom research institutions to companies, mostly in a linear way and with debatable success. In recent years theapproach has shifted towards trying to enhance a more direct interaction between science and industry by sup-porting mobility of researchers (public and/or private). This makes sense because human resources are the mostimportant instrument for innovation, and mobility of personnel is an important way to foster inter-organisa-tional learning. However, this is a rather new policy field and statistical data proving success is scarce. One thingsuggested by the literature is that any policy addressing human resource mobility is especially relevant for larg-er firms and for high technology firms.
During the past 5–8 years many European states have launched measures promoting science-industry mobility,e.g. through direct means such as industry PhD-programmes or indirect e.g. through competence centres.
Relevance to Estonia
In general there is certainly a need to raise the level of research competence in Estonian industry, which clear-ly under-spend when it comes to investments in research and development. The key reasons for this weredescribed in section 3.2. Changing the given situation is a delicate, long-term task that demands a wide rangeof different policy measures of which mobility of research-trained people is one.
25 There is, to our knowledge, no verifiable data regarding the educational- or skill level of Estonian expatriates. However,approximately one-third of the Estonian work force has a tertiary education and there is no reason to believe that expa-triates are less educated than the average Estonian.

Innovation Staff Recruitment Programme Feasibility Study4. Discussion and conclusions
38
There are a number of initiatives aiming at strengthening science-industry linkages through people, both direct-ly and indirectly. Examples are the Competence Centre Programme, SPINNO, ESF measure 1.1, etc.26 Furthermore,Enterprise Estonia runs programmes that support companies’ collaboration with research institutions by offer-ing reimbursement of costs for researchers. To our knowledge there is no scheme that supports more perma-nent mobility of researchers to industry. Such a scheme would make sense if it targeted younger researchers(before they advance too far on an academic career) since companies are reluctant to pay full costs for inex-perienced researchers with limited industrial experience – here a support scheme could provide a necessary incen-tive.
“Companies are interested in research competence but not in 25-year-old PhDs”(Director of a Competence Centre)
On the other hand, the number of companies with a capacity to absorb research competence is still relativelylimited.27 According to CIS4 (see Chapter 3) we are speaking about some 200–250 companies nation-wide.
Any measure promoting mobility of researchers from science to industry must take this fact under considera-tion in order to avoid weakening the research base. This could be achieved if there are complementary invest-ments in the R&D-base and if a researcher mobility scheme contributes to additional PhD-positions and not justshift existing ones from academic institutions to industry.
Conclusion: A scheme directly promoting science-industry mobility, e.g. by industrial PhD-positions,should be launched only if such PhD-positions are in addition to the existing ones andpreferably in combination with further investments in the research-base.
4.3.4 Recruitment of skilled people schemes
Context and key challenges
Direct measures aiming at strengthening companies’ willingness and resources to employ skilled workers (com-ing from non-research institutions but regardless of if they are sourced internationally or domestically) for thepurpose of boosting innovation capabilities are rare in the European innovation policy. The exception is madein case there is a need to support the labour market in times of high unemployment (see below Labour mar-ket schemes). The reason for this is the fear that such a public intervention will distort a free labour market.There are also good grounds to doubt the sustainability of positive effects of such schemes in companies whenthe subsidy is stopped – will the company be able to continue paying the wage?
On the other hand, there are situations where there is a policy rationale for such schemes. This could be e.g.smaller companies looking to employ specific purpose experts for a limited time period and for well definedprojects such as the introduction of new product/service development processes, the change of organisationalset-up, company strategy development, etc.
Relevance to Estonia
As shown in Chapter 3 there is definitely a strong demand for skilled people below the level of researchers inEstonian industry. In fact the main bulk of companies with development potential will be much more attractedby a scheme that provides support in employing skilled workers than researchers. The problem is how to avoiddistorting the labour market. As long as people can be sourced from outside Estonia the problem is less immi-nent (but still existing). If the scheme allows companies to source from within Estonia there is a risk that it willdrain some companies of competence while giving it to others, which might be less competitive in the market.In worst cases this could have a serious negative impact on Estonian industry.
Conclusion: A skilled people recruitment scheme could enable innovative Estonian companies to recruittop-class people but care must be taken to prevent distortion of the labour market.
26 For more examples please refer to Chapter 327 Meaning that companies need a certain level of development resources, equipment and competence in order to fully prof-
it from research collaboration.

Innovation Staff Recruitment Programme Feasibility Study4. Discussion and conclusions
39
4.3.5 Labour market schemes
Labour market schemes are typically put in place to support weak labour markets in times of high unemploy-ment. The primary aim of such schemes is not to reinforce competitiveness of companies but to get peopleemployed. A wage subsidy to the employing company is the usual financial instrument used.
In general the skill level of people is of secondary importance for this type of scheme but there are also schemestargeting skilled workers such as unemployed academics. Again, however, such schemes are normally used incases of labour force surplus and therefore of less relevance to Estonia today.
Conclusion: No need to implement labour market schemes targeting skilled workers in Estonia today
4.4 Implications and success factors for an Estonian mobility and recruitment scheme
In general the idea of launching a recruitment and mobility scheme is welcomed by all interviewees. However,a number of issues and concerns on high as well as low level of abstraction were raised. Detailed comments28
will be addressed through the design of the specific schemes. Below more fundamental aspects that any schemeneeds to take under consideration are listed:
1. A recruitment and mobility scheme may not distort a free labour market
Estonia faces work force deficit. This does not mean that there is no unemployment at all. However, unem-ployment is low and of structural character. In other words, the volume of “free” work force of skilled peopleto utilise is very limited. This is in stark contrast to the situation in e.g. Germany where unemployment is rela-tively high also among highly educated people.
The key implications for the scheme to be designed are that the financial instruments put in place must not dis-turb the free labour market. Recruitment of people domestically would primarily be a reshuffling of people whereone company loses and the other wins. A net-contribution of skilled people is necessary.
“Mobility is good if people come to us and bad if people leave us”(Managing director of an Estonian IT-company)
2. One size does not fit all – there is a need for a portfolio of measures
In a growing economy most companies and organisations look to employ. However, the skills wanted differ sig-nificantly depending on how advanced companies are with regards to innovation and development.
Key implications for the recruitment scheme are that there is a need to design different approaches (in particu-lar regarding the source of people) in order to effectively address the needs of the different types of companies.
3. From nothing comes nothing – A set of different measures aiming at increasing the availability of highly skilled people is necessary
a. Estonia needs to reinforce its educational and research systemEven if the future recruitment scheme is successful in attracting foreign specialists and in promoting a moreintense flow of research-trained people from research and higher education institutions to industry, thefundamental problem of labour shortage must be addressed as well. This should be done on two levels:� By strengthening academic education as well as vocational training in areas relevant to Estonian indus-
try.� By investing more public resources in research. This is a crucial measure also to the recruitment scheme
since the average age of scientists in academic institutions is high and the re-growth of younger peo-ple is weak too. A recruitment scheme addressing the mobility of researchers may drain the researchsystem of scarce resources.
28 E.g. how to avoid that funds are used for purposes not intended by the scheme. A key issue may be how to assess theactual skill of a person.

Innovation Staff Recruitment Programme Feasibility Study4. Discussion and conclusions
40
b. Estonia needs to reinforce its vocational training systemWithout going into details the present study did intercept several negative comments from companiesregarding quality and contents of the vocational training offer available. In particular low industrial rele-vance is considered a problem.
c. Estonia needs to address the domestic sector brain drain, i.e. skilled people working in other fields than their real expertise. However this is the task of the educational and research system. This unwanted labour market mobility is not automatically bad but it does indicate a mismatch of educa-tion and demand from companies leading to sub-optimal usage of resources invested in education.
4. The success of a mobility/recruitment scheme is depending on solid support- and accompanying measures
International good practice shows that the success of direct policy measures is dependent on the professional-ism of the support offered to companies and individuals of the scheme’s target group. E.g. it is futile to designand launch a repatriate scheme if there is no one promoting it outside Estonia.
The organisation managing the scheme must therefore have:� The necessary resources to provide sufficient volume of support� The necessary competence to offer the right quality of support� The necessary networks, mandate and acceptance in order to deliver the support.

Innovation Staff Recruitment Programme Feasibility Study5. Scheme descriptions
41
Based on the sources of people and the type of skills sought, three different types of support measures are con-sidered suitable to help Estonia in competing in the global race for talent. These are:� Support to Recruitment of research-trained personnel� Support to Recruitment of international expertise� Support to Recruitment of specific purpose specialists
We suggest that these support initiatives are considered to be different variants of the same scheme and thatthey are managed within the same organisational umbrella. By doing so there is a chance to profit from syn-ergy effects, in particular regarding applications procedures and technical assistance to applicants.
In the following, each scheme is presented with a similar structure. First part is describing the scheme frame-work: its rationale and the addressed challenge, the scheme target and focus areas, expected results or impact.The second part elaborates operational aspects and how the scheme implementation could be organised. Thethird part estimates the financial aspects related to schemes as well as monitoring and evaluation aspects.29
After the scheme description two sections on organisational issues and application procedures follow.
5.1 Type 1 Scheme – Recruitment of research-trained personnel
5.1.1 Framework
Rationale and overview There is a need to strengthen the links between science and industry in Estonia. In particular it is necessary to:
� Increase the industry relevance of public research� Increase the employability of younger researchers in industry� Increase companies’ capability to utilise researchers and research results� Create lasting relations between companies and R&D-institutions
For this purpose the so-called Industry PhD-scheme should be designed. Thescheme makes resources and infrastructure available to companies for employinga PhD-student. The student is supervised by an academic supervisor and thereshould be a contract between the company and the R&D-institutions regulatingthe utilisation of equipment and the sharing of IPR.
The source of people is primarily higher education and research institutions, bothEstonian and foreign. The scheme should mainly contribute to the strengtheningof PhD-student education in Estonia, not to a transition of academic PhD-posi-tions to industry.
Scheme objective and To upgrade technological capacities of enterprises and to maintain contact to expected results research laboratory by subsidising mid-term part-time employment of research
personnel by companies.
Based on the estimations made earlier in this report the target group size isassumed to be 125–150 companies at present time (all type (a) companies andhalf of the type (b) companies).
With reference to similar schemes implemented in other European states theobjective should be to activate 10–20% of the total target group in the schemeevery year. Assuming that the target group will double within two years the expect-ed “deal flow” of this measure should be as follows:
2007: 10 contracts2008: 20 contracts2009: 40 contracts
5 Scheme descriptions
29 Financial and funding estimates are based on a very simple model. The scheme is assumed to cover primarily wages costs(wage subsidy schemes) to a ceiling amount not exceeding 50% of the normal market wage of the skill category in ques-tion. The total cost is the number of cases per year times the subsidy. Of course the cost model must be further refinedand also include the administrative costs of the scheme.

Innovation Staff Recruitment Programme Feasibility Study5. Scheme descriptions
42
Risk assessment and � Could be regarded as brain-drain instrument by research institutionsmanagement / � May be a limited number of applications, at least initiallyKey challenges � Universities may not be able to produce required experts to meet the demand
in specific fields. This risk can be managed by focusing also on PhD-candidates from foreign universities.
� Companies do not have competences to make good use of the research-trained personnel
� The results end up isolated cases and do not have effect on the industry rele-vance of public research in general
5.1.2 Implementation
Application The company applies for co-funding based on a project description presented ina standardised application form. The relation to the research institution must bedescribed in detail. Calls for applications should be continuous with evaluationseach or every second month.
Selection criteria � Strong absorption capacity within company. This probably means that there is already a (R&D)-unit within the company.
� Threshold level of investments in R&D, 3–5% of turnover � Dedicated industrial mentor (strong CV, time committed to the project)� Contract between company and R&D-institution regulating the utilisation of
equipment and sharing of IPR� International scope/potential of the thesis� Added value for the Estonian R&D-base, i.e. the industrial funding should lead
to additional PhDs, not to that funding is enlarged for already enrolled PhDs.
Promotional activities Promotional activities will be very important in order to raise a satisfactory num-ber of applications. The management group should design a marketing plan thatcould include e.g. home page services, information events and industry broker-age seminars for candidates, databases of companies and PhD-aspirants, studytrips, written material, etc. Promotional activities should also be directed towardsselected foreign universities.
The management groups should also be active in assisting companies in formu-lating PhD-thesis and in helping in particular SMEs in negotiations with R&D-insti-tutions. The management group should also assist both sides in IPR-related issues.
5.1.3 Administration and monitoring
Tentative scheme budget The budget for co-funding PhD-positions is based on the assumption that each and time frame PhD costs 30.000 Euro per year and that an additional 20% of this cost is reserved
for expenses such as travels, publication costs, conference fees and other costsnecessary for the work proposed. Based on this the budget for co-funding PhDsare as follows:
2007: 180.000 Euro2008: 540.000 Euro2009: 1.260.000 Euro
Budget for technical In accordance with the recommendations to provide strong technical assistance assistance we suggest that two to three persons work full-time on managing this measure.
The distribution of staffing could be as follows:
Enterprise Estonia: 1 full time equivalentExternal Estonian Expert: 1 full time equivalentInternational expert: 0,5 full time equivalent
The yearly budget for external experts should be in the range of 100.000–150.000Euro per year. The international expert would contribute to identifying expertsabroad and to assist in negotiating with them.

Innovation Staff Recruitment Programme Feasibility Study5. Scheme descriptions
43
Financial incentives and 50% of companies’ direct personnel costs + possibly other costs such as travel eligible costs and accommodation are reimbursable. Wage cost reimbursement should be lim-
ited to a “normal” PhD salary plus additional direct wage costs (presumablytotalling 20.000–30.000 Euro per year) + 10% deviation in specific cases. It shouldalso be possible to reimburse foreign PhD-students. Here costs can be estimatedto approx 40.000–45.000 Euro per year. It is assumed that the number of foreignPhDs will be rather limited and thereby cause no consequence for the total schemebudget.
Co-funding is provided for three years with a decreasing funding rate for com-panies with more than 100 employees.
Companies with less than 100 employees could be offered soft loans to counternegative liquidity effects and/or to help boost accompanying investments inresearch equipment.
Impact, effects and Main effects: increased use of research trained personnel in the targeted compa-indicators nies and the industry in general, increased collaboration between companies and
public research institutions
Main impact: increased innovation orientation of enterprises, increased industryrelevance of public research
Impact indicators: number of participating PhDs hired permanently at the end ofthe contract, number of firms with increased expertise in conducting in-house R&D,share of R&D personnel in the target group of enterprises, share of R&D expen-diture in the target group of enterprises, number of PhDs in target group of enter-prises
Operational indicators: successful organisational setup, number of contracts withPhD students, number of projects perceived as successful by enterprises
5.2 Type 2 Scheme – Recruitment of international expertise
5.2.1 Framework
Rationale and overview Estonian companies lack several skill categories that could be retrieved from abroadif the working conditions offered would be attractive enough. To these categoriesbelong e.g. senior industrial researchers, senior managers, engineering specialistsand international sales managers.
There is a fierce global competition for such competences, though and Estoniamay not be the first choice for this kind of “knowledge mercenaries”. To reachsuccess it will therefore be important to carefully design a scheme that supportscompanies in attracting highly skilled people from abroad.
Within this context expatriate Estonians may prove to be a both promising andimportant target group, but also foreign companies and international researchinstitutions or public sector institutions are important sources of people.
Scheme objective and Raising the competitive edge of Estonian companies by enabling them to employ expected results on a medium to long-term basis internationally acknowledged specialists.
Based on the estimations made earlier in this report the target group size isassumed to be 250–300 companies at present time (half of type (a), all type (b)companies, 5% of type (c) companies).
It is expected that the support provided by the given measure contributes to thefollowing “deals” in the respective year:
2007: 10 cases2008: 20 cases,2009: 30 cases

Innovation Staff Recruitment Programme Feasibility Study5. Scheme descriptions
44
Risk assessment and � May distort the labour market due to the offering of above-market wages to management / certain employees;Key challenges � May be limited number of cases, at least initially;
� Other support measures do not support that the expert stays in Estonia (social relationships, employment prospects for spouses etc). There is a significant need for supporting services, e.g. for finding candidates and for developing “attraction packages”;
� External changes in factors such as politics, legislation or reputation (e.g. lack of tolerance) negate the efforts of the scheme;
� A possibility of “over-education” in certain fields prevents the possibility of finding enough jobs that correspond to education of highly skilled people in Estonia.
5.2.2 Implementation
Application The company applies for co-funding based on a project description presented in astandardised application form. The core part of the application is a detailed busi-ness plan showing the projected development to the company and how the newskills will contribute to this. The application should include at least a Memorandumof Understanding from the foreign specialist in question. Calls for applicationsshould be continuous with evaluations each or every second month.
Selection criteria � Strong business plan showing how the new expertise will contribute to the growth and profitability of the company
� Certain level of internationalisation, e.g. measured in export ratio or strong ambitions to go international
� Threshold level of investments in R&D, e.g. 1–3% of turnover� Certain financial stability in terms of turn-over and profits
Promotional activities The management group should design a marketing plan that could include e.g.homepage services, seminars, databases of companies and people, study trips,written material, etc. As the given scheme targets international experts, interna-tional promotional activities will be important. This work could be carried out e.g.in co-operation with embassies, international chambers of commerce and trade,etc.
5.2.3 Administration and monitoring
Tentative scheme budget Since the range of both skills and nationalities concerned by this measure is very and time frame wide it is impossible to estimate a mean cost of the individual agreements that
will be concluded. Instead we suggest that the eligible costs should be estimatedbased on the business plans of the individual applications. The support providedto applicants will consequently be mirroring the estimated impacts of the peoplehired. Indicative co-funding budget could be as follows:
2007: 500.000 Euro2008: 1.400.000 Euro2009: 2.600.000 Euro
Further budget is foreseen for “attraction packages” as according to section 6.
Budget for technical In accordance with the recommendations to provide strong technical assistance assistance we suggest that two to three persons work full time on managing this measure.
As for the other measures the distribution of staffing could be as follows:
Enterprise Estonia: 1 full time equivalentExternal Estonian Expert: 1 full time equivalentInternational expert: 0,5 full time equivalent
The yearly budget for external experts should be in the range of 100.000–150.000Euro per year.

Innovation Staff Recruitment Programme Feasibility Study5. Scheme descriptions
45
Financial incentives Co-funding is provided to cover direct personnel costs for a period of three years and eligible costs with a decreasing funding rate as follows:
Year 1: 50%Year 2: 40%Year 3: 30%
Gradually decreasing funding will put pressure on the company to realise thepotentials of the expert. The funding period of three years will also give the com-pany sufficient time to evaluate the contributions of the expert to the company.
The scheme should cover the respective percentage of the companies’ wage costs.In addition the scheme should also cover the respective percentage of cost foroffering “attraction packages”. Such packages could comprise e.g.: solutions forhusbands/wives going along, children’s day care, pension funds, health care solu-tions, assistance in finding housing etc.30
Impact, effects and Main effects: Increased immigration flows of experts to Estonia, increase in num-indicators ber of highly educated people working in sectors that corresponds to their edu-
cation;
Main impact: decreased shortage of skilled internationally experienced people inEstonian companies;
Impact indictors: decreased shortage of international experts in the target groupof enterprises (this will be measured through questionnaires to companies) immi-gration flows of highly educated workforce (managers, engineers), immigrationflows of qualified scientists, share of R&D expenditure in the target group of enter-prises, annual growth rate of target enterprises;
Operational indicators: successful organisational setup, number of contracts withinternational experts, number of projects perceived as successful by enterprises.
5.3 Type 3 Scheme – Recruitment of specific purpose specialists
5.3.1 Framework
Rationale and overview In particular SMEs in traditional sectors face difficulties in freeing up time for morefuture-oriented development work. Furthermore, existing resources for new prod-uct and service development are usually scarce or non-existing. Lack of manage-ment skill and networks also hampers the realisation of factual growth potential.
In many cases all that is needed, however, is to facilitate companies’ access to exter-nal competences through some well designed incentives and companies will beable to realise their potential without further assistance. For such cases with well-defined purposes and project plans, in particular smaller companies may be moti-vated to apply subsidies in getting access to so-called specific purpose specialists.Specific purpose specialists could be e.g.:
� Design engineers� Business mentors� Graduate students of innovation management
This scheme type differs from the previous ones through its focus on short-termemployments and well-defined scope of the assignments. To assist companies indefining the assignments it is suggested that companies can apply for funding ofa 2-day review/audit carried out by an external expert. The expert shall help indefining key needs and structure an application but not write it.
Potential sources of people are consultancy companies (Estonian and foreign),academic and research institutions and individuals, possibly retired specialists.
30 We have not found suitable benchmarks from other countries but suggest that attraction costs are also reimbursed to50% and that such cost should not exceed 7% of the total support.

Innovation Staff Recruitment Programme Feasibility Study5. Scheme descriptions
46
Scheme objective and Promoting SME’s ability to upgrade innovation capability by subsidising the employ-expected results ment of specific purpose specialist on a short-term-basis < 1 year. The estimated
target group size is 1,500 companies (all type (c) companies). It is expected thatthe support provided will lead to the following number of assignments:
2007: 25 cases2008: 45 cases2009: 85 cases
Risk assessment and � During a period of fast economic growth enterprises are oriented to short termmanagement / profit seekingKey challenges � Lack of suitable specialists
� The assignments end up being separated from the core activities of the com-panies and do not have expected results in innovation culture of SMEs
� The subsidised employment of specialists becomes a permanent way of action and may distort labour market
5.3.2 Implementation
Application The company applies for co-funding based on a project description presented ina standardised application form. Calls for applications should be continuous withevaluations each or every second month.
Selection criteria Support will be provided on the basis of a detailed project plan indicating the inputfrom the skilled person in question, the expected outputs and economic benefitsexpected. Key selection criteria could be:
� Strong growth ambition and potential of the company� Very well defined relation between specific competence employed and growth
strategy of the company� Feasibility of the presented project plan
Promotional activities The management group should design a marketing plan that could include e.g.homepage services, seminars, databases of companies and people, study trips,written material, etc. As this scheme targets international experts, internationalpromotional activities will be important. This work could be carried out e.g. in co-operation with international partners.
5.3.3 Administration and monitoring
Tentative scheme budget As for the international expert measure it is very difficult to estimate the mean and time frame cost for the contracts. However, assuming that an individual contract will not
exceed total costs of 50.000 Euro the co-funding budget for the measure can becalculated as follows:
2007: 490.000 Euro2008: 880.000 Euro2009: 1.660.000 Euro
Budget for technical In accordance with the recommendations to provide strong technical assistance assistance we suggest that two to three persons work full time on managing this measure.
As for the other measures the distribution of staffing could be as follows:
Enterprise Estonia: 1 full time equivalentExternal Estonian Expert: 1 full time equivalentInternational expert: 0,5 full time equivalent
The yearly budget for external experts should be in the range of 100.000 –150.000Euro per year.

Innovation Staff Recruitment Programme Feasibility Study5. Scheme descriptions
47
Financial incentives and Co-funding is provided for a maximum of 12 months. Maximum public co-fund-eligible cost ing is 35%. Only SMEs are eligible for co-funding.
The scheme should cover the companies’ wage costs but only for people with rel-evant innovation-related competence.
Impact, effects and Main effects: increased use of external specialists in SMEs, increased product and indicators service development activities in SMEs;
Main impact: improved innovation capability of SMEs;
Impact indictors: number of specialists hired at the end of the contract, numberof links between SMEs and technology transfer structures, share of R&D expen-diture in the target group of enterprises, number of new products, services orprocesses developed, share in turnover that comes from new products or servic-es, increase in turnover and/or profitability;
Operational indicators: successful organisational setup, number of contracts withexternal specialists, number of projects perceived as successful by enterprises.

Target groups
Objective
Target group size
Source of skills
Incentives
Expected output
Tentative budget (excl TA)
Impact and indicators
Key challenges
World-class or close to world-class, research-intensivecompanies
To upgrade company R&Dskills and strengthen contactsto research
Estimated target group size:125–150 companies
Higher education andresearch institutions inEstonia and abroad
50% of salary costs. Specialsupport for smallercompanies.
From 10 to 40 persons peryear
0.36–2.16 mill. Euro/year
� Impact indicators:participating PhDs hiredpermanently at the end ofthe contract, number of firmswith increased expertise inconducting in-house R&D,number of PhDs in targetgroup, share of R&Dexpenditure in the targetgroup� Operational indicators:Successful organisationalsetup, number of contractswith PhD students, numberof successful projects
Could draw (too much)resources from researchinstitutions. May be limitedby applications.
Internationally competitivewith limited research butstrong development capacity
Helping SMEs to find and hirehighly skilled people fromabroad
Estimated target group size:250–300 companies
Foreign companies,institutions, returningexpatriates
50% of salary costs,decreasing for three years.Attraction packages.
From 10 to 30 persons per year
0.5–4.8 mill. Euro/year
� Impact indicators:Decreased shortage ofinternational experts in thetarget group of enterprises,emigration flows of highlyeducated workforce(managers, engineers),emigration flows of qualifiedscientists, share of R&Dexpenditure in the targetgroup, annual turnovergrowth rate of targetenterprises� Share of innovation costs� Increase in export turnover� Operational indicators:Successful organisationalsetup, number of contractswith international experts,number of successful projects
May distort labour market byoffering above-marketwages. Limited in number.Requires significant effort.
Competitive (growing firms)with limited developmentand no research capacity
Lowering the barrier for SMEsto hire specialists in projects
Estimated target group size:1.500 companies
Academic institutions, expertcompanies
Up to 35% of salary costs for12 months. Project-relatedapplication.
From 25 to 85 persons per year
0.44–1.5 mill. Euro/year
� Impact indicators: numberof specialists hired at the endof the contract, number oflinks between SMEs andtechnology transferstructures, share of R&Dpersonnel in the targetgroup, share of R&Dexpenditure in the targetgroup, share of innovationexpenditure (based on CIS) inthe target group. Annualgrowth rate of targetenterprises.� Operational indicators:Successful organisationalsetup, number of contractswith external specialists,number of successful projects � May distort labour marketby encouraging short-termcontracts.
Innovation Staff Recruitment Programme Feasibility Study5. Scheme descriptions
48
5.4 Comparison of the scheme types
Table 11. Comparison of the scheme types
Scheme type/ element Type 1: Recruitment of Type 2: Recruitment of Type 3: Recruitment of research-trained personnel international expertise specific purpose specialists

Innovation Staff Recruitment Programme Feasibility Study5. Scheme descriptions
49
5.5 General organisational set-up
The general organisational set-up for delivering the schemes is described in some detail below. At the core ofthe organisation we find the Ministry of Economic Affairs and Communications and Enterprise Estonia. TheMinistry will hold overall responsibility for the schemes, which in particular implies securing the legal basis andthat the schemes comply with EU-regulations. The Ministry also have an important role regarding strategic devel-opment of the schemes. Strategic development should secure that the schemes address the needs of the tar-get groups and Estonia in general. This also includes securing that the scheme(s) are complementary to otherinitiatives and with national as well as EU innovation policy in general. This task implies that the Ministry shouldclosely follow the implementation of the schemes and take action to:� Support exchange between Estonian organisations managing schemes with related purposes� Supply the scheme managers with international good practices and networks
Enterprise Estonia’s function is that of scheme managing organisation but it will also administrate the schemeand manage cash payments. Enterprise Estonia’s task is to secure total quality in scheme management wherethe major goal is effective scheme delivery resulting in high quality applications. This task should be carried outtaking into account the effects among companies, the achievement of quantitative targets but also qualitativeaspects such as satisfaction of the target group with scheme management.
For this it is suggested that Enterprise Estonia is supported by different functions as illustrated by the figurebelow.
Figure 14. General scheme organisational set-up
With exception of the Ministry of Economic Affairs and Communications the tasks and responsibilities of thedifferent functions are briefly outlined in the following.� Scheme Strategy development group: This group comprises representatives from the Ministry of
Economic Affairs and Communications, the Ministry of Social Affairs and the Ministry of Education andResearch as well as from other relevant Estonian stakeholders. This group has an advisory function regard-ing the strategic development of the scheme and for proposing target levels and funding levels. It isexpected to meet regularly with the scheme management group co-ordinated by Enterprise Estonia andwith the in-process evaluators.
� Scheme advisory network: This should be a panel consisting of a network of some 6–8 experts (Estonianand foreign). The experts should be contracted on an individual basis by Enterprise Estonia for assisting inevaluating applications. Two experts (one from industry and one from academia) will be assigned to assesseach application. The profiles of the experts will depend on the nature of the application. The experts makerecommendations to Enterprise Estonia who take the final decision on funding. It is important to pointout that the task of the panel is not to refuse applications but to help in fine-tuning as many proposalsas possible into high-quality proposals.
� Scheme management group: This group should comprise at least three people but its size should bedepending on the tasks it should fulfil. If all schemes outlined here will be put in place the group shouldbe larger, comprising at least two persons per scheme. Enterprise Estonia should co-ordinate the groupand parts of the staffing should come from Enterprise Estonia. Considering the scope and importance of
Ministry of EconomicAffairs & Communication
Enterprise EstoniaIn-process
evaluation team
Scheme Strategydevelopment group
Schemeadvisory network
Schememanagement group
Regional support

Innovation Staff Recruitment Programme Feasibility Study5. Scheme descriptions
50
the tasks assigned to the group we recommend, however, that external experts be also involved to securesufficient resources and expertise. The group is responsible for day-to-day business of the scheme, e.g.designing calls, advising and supporting applicants, promotional activities, administration, preparation ofcases, etc.
� Regional support: This can be e.g. Enterprise Estonia’s regional branch office and County DevelopmentCentres but also people at R&D-institutions, business associations, Chamber of Trade and Industry, NationalContact Point for EU Framework Programmes etc that assist in raising awareness of the scheme and ingenerating applications.
5.6 General application process
Regardless of the scheme, the applications process should be (in standard cases) as follows:
The company applies for co-funding based on a project description presented in a standardised application form.Calls for applications should be continuous with evaluations each or every second month. The application isassessed by the independent expert panel and unless there is reason to refuse the application without furtherdialogue with the applicant recommendations for improvements are made. The recommendations are submit-ted to the applicant and to the scheme management group. The applicant can choose to ask the managementgroup for assistance (maximum two meetings plus telephone advice) or to improve the applications on its own.
The refined application is then reviewed for a second time by the expert panel that again, if necessary, maymake recommendations for improvements. Should the applicant fail to pass the assessment also the secondtime the applications must be postponed for at least six months. The general application process is illustratedby the figure below.
Figure 15. Schematic application process
Preparation of
Application
Assessment
of application
Refinement
of application
Feed-back
to applicant1
2
3
4
Funding decision YES!NO!
5
Preparation cycle
Supp
ortiv
e m
easu
res

Innovation Staff Recruitment Programme Feasibility Study6. Evaluation framework and ex-ante estimation of targets and costs
51
“It is difficult for the policy makers to know ex-ante how the system will react to the policy. Policy makers needto experiment and allow some room for mistakes. For this reason, evaluation of policies is very important.”31
6.1 Evaluation framework
The Terms of Reference of the study stipulates the provision of a set of base-line data to be used for estimat-ing operational targets of the proposed schemes as well as for assessing impacts. However, due to the lack ofappropriate data we suggest a different approach building on an initial investigation of the situation in eachcompany that receives funding from the schemes.32
For each scheme type a set of impact indicators is proposed, which represent essential potential effects of staffrecruitment. These indicators shall be measured at four different stages, initially (i.e. before the company recruit),after two years, after five years and after ten years. The evaluation intervals and types of evaluations are givenin the second table of this section.
The target values of success impact indicators cannot be estimated at this point since the present situation withthe indicators is not known. The impact is about to be evaluated separately with a qualitative assessment, wherethe indicator data are collected from target groups. Typical target levels of impact indicators should be relativeto peer group i.e. the growth in the share of R&D expenditure in those firms that have participated in the schemesshould be stronger than in the target group in general.
The mid term evaluation and the full evaluation assess the impact of the schemes during the operation of theschemes. The Final evaluation after 10 years seeks to assess a) how permanent the impact has been and b) ifit has made a difference to general development.
Table 12. Overview of indicators per scheme type
Scheme type / elementType 1: Recruitment of Type 2: Recruitment of Type 3: Recruitment of specific research-trained personnel international expertise purpose specialists
1. Participating PhDs hired 1. Decreased shortage of 1. Number of specialists hired at thepermanently at the end of the international experts in the target end of the contractcontract group of enterprises33
2. Number of firms with increased 2. Immigration flows of highly 2. Number of links between SMEs expertise in conducting in-house educated workforce (managers, and technology transfer structuresR&D engineers)
3. Number of PhDs in target 3. Immigration flows of qualified 3. Share of innovation expenditure group of enterprises scientists based on CIS
4. Share of R&D expenditure in the 4. Share of R&D expenditure in 4. Share in turnover of new products target group of enterprises the target group of enterprises and services
5. Annual growth rate of target 5. Annual growth rate of target enterprises in terms of: enterprises in:� Turnover � Turnover� Share of innovation costs � Growth in export rate� Increase in export turnover
The core indicators that measure the impact more accurately are listed on the top.
6 Evaluation framework and ex-ante estimation of targets and costs
31 Up-coming paper: Rationales for public policy intervention in the innovation process: A systems of innovation approach.Chaminade and Edquist, Division of Innovation and CIRCLE, Lund University
32 We also suggest running a pre-survey before launching the scheme. This investigation should be a straightforward inter-net-based survey run among the target group of companies to check their a) commitment to the described three schemesand b) estimate their current standing with regard to educated workforce, R&D investments and other indicators.Collecting the data would give a good reference base for later impact analyses. The same questions would then berepeated in the mid-term evaluation and complemented with qualitative analyses.
33 To be measured by annual or bi-annual questionnaires

Innovation Staff Recruitment Programme Feasibility Study6. Evaluation framework and ex-ante estimation of targets and costs
52
Table 13. Overview of evaluation interval and approaches
Evaluation interval Type 1: Recruitment of Type 2: Recruitment of Type 3: Recruitment of specific research-trained personnel international expertise purpose specialists
2 years Mid-term assessment Mid-term assessment Mid-term assessment
5 years Full evaluation Full evaluation Full evaluation
10 years Final evaluation Final evaluation Final evaluation
6.2 Ex-ante evaluation
The Ex-ante evaluation covers three topics:� An estimation of the target values of the success indicators in 2-, 5- and 10-year horizon, � A quantification of the (annual) financial resources that are needed for achieving the target values;� An estimation of the synergy that arises from implementation of the support measure in the system of
other innovation support measures implemented by Enterprise Estonia.
The results of the Ex-ante evaluation is presented in the following:
6.2.1 Operational (success) indicators
The estimated success values for operational indicators are the success in meeting the expected results for theschemes. The schemes are expected to operate at least 5 years and after first three years they are expected tocontinue with suggested third year target levels. For indicative purposes estimations of 10-year cumulative tar-gets are also given in the table below34.
Table 14. Overview of success indicators
Scheme type / element Type 1: Recruitment of Type 2: Recruitment of Type 3: Recruitment of specific research-trained personnel international expertise purpose specialists
Operational (success) Industry PhD-contracts Specialist assignments Specialist recruitmentindicators
2 years 30 30 70
5 years 150 120 325
10 years 350 210 750
6.2.2 Attraction packages
The issue of so-called attraction packages has been mentioned earlier. A general definition of attraction pack-ages within the context of this study is a set of benefits or services offered to employees in addition to salary.International studies skilled workers are worried about and attracted by far more than only money. The tablebelow lists some main motivations and barriers to mobility from the workers’ view.35
34 The estimate is based on the assumption that after 3 years the annual amount of contracts and assignments stay at thesame level.
35 Pricewaterhouse Coopers “Managing mobility matters –a European perspective” 2002

Innovation Staff Recruitment Programme Feasibility Study6. Evaluation framework and ex-ante estimation of targets and costs
53
Table 15. Workers’ barriers and motivations to mobility
Barriers Motivations
Family (e.g. child education) Improve income
Language skills Improve living standard
Info on employment opportunities Experience of life abroad
Recognition of qualifications Develop skills
Spouse employment New employment opportunities
Transferring pension Enhance career opportunities
Suitable housing Commitment to employer
Visa/work permit
Different culture
Consequently workers considering going abroad find the following to be the most desirable elements of a con-tract:� benefits and social security� pensions� sickness benefits� minimum remuneration� holiday provision� termination/notice periods.
For Estonian companies employing in particular foreign work force it is therefore important to consider e.g. payscales, incentives and variable reward arrangements, share schemes, tax and social security treatment/efficien-cy, benefits, pensions/offshore pension arrangements and last but not least domestic/family arrangements. Animportant question for this study is whether the mobility/recruitment schemes proposed here should includeattraction packages and if so in what way.
As attraction packages will look very different from case to case it is important to design offerings that suit all.36
Consequently the starting point should be that the scope and scale of an attraction package is the responsi-bility of the company and employee candidate in question. There should therefore be no general subsidy forextra benefits such as children day-care or house keeping. Nevertheless it is suggested that a few percent ofthe total budget, at least for scheme type 2 and 3, is added to a special “Attraction fund”. These resources canbe used to support e.g. SMEs in special cases where the employee demands certain service that the companycannot arrange for. Further, it is suggested that the parts of the resources reserved for technical assistance toscheme management also cover service that will increase the willingness to work in Estonia. Such assistancecan be e.g.:� Spouse assistance programs� Retaining a search firm/headhunting� Work permit assistance� Training� Networking for professional development� Lifestyle allowance� Childcare provisions
36 Examples of benefits often included in long term assignments are Schooling, Host housing, Medical insurance, Hardship,Goods and services

Innovation Staff Recruitment Programme Feasibility Study6. Evaluation framework and ex-ante estimation of targets and costs
54
6.2.3 Quantification of necessary financial resources
After the first 2–3 years when the schemes have been successfully set up, the expected annual financial resourcesneeded for achieving target values are approximately 4.85 million. After the fifth year the schemes should beevaluated and the subsidy levels adjusted. It is likely that the subsidy level can be reduced but since it is verydifficult to predict the future level we renounce estimating the costs on a 10-year basis.
Table 16. Overview of accumulated costs for scheme implementation
Scheme Type 1: Recruitment of Type 2: Recruitment of Type 3: Recruitment of Attraction Totaltype / research-trained international specific purpose supportelement personnel expertise specialists
Estimated accumulated annual financial resources needed to achieve target values (€)
2007 180 000 500 000 490 000 50 000 1 220 000
2008 540 000 1 400 000 880 000 115 000 2 935 000
2009 1 260 000 2 600 000 1 660 000 230 000 5 750 000
2010 1 800 000 3 300 000 1 660 000 290 000 7 050 000
2011 2 160 000 3 600 000 1 660 000 320 000 7 740 000
These figures exclude fixed costs for technical support to the scheme implementation (one Enterprise Estoniacoordinator, one Estonian expert and half-time international expert) amounting to 125 000 Euro per schemetype and year.37
6.2.4 Synergy effects
Within the scope of this study it is not possible to estimate potential financial synergies of the proposed schemesand already existing programmes. The ex-ante evaluation of such synergies therefore focuses on the potentialreciprocal benefits that could arise out of overlapping contents and purposes of the programmes.
Taking the table in section 3.5 as a starting point the following table indicates the synergy potential (from highto low) for each related programme. Short comments elaborate on which synergies that could be expected.We suggest that further investigations are undertaken in those cases where significant synergy effects can beexpected. We also suggest that the possibility of co-ordinating the application processes of the different pro-grammes be considered. This should be relatively uncomplicated since Enterprise Estonia is co-ordinating mostof the programmes where synergies may arise.
37 The estimation of recruitment costs is based on the following calculations: The cost of Type 1 PhD recruitment with trav-el costs etc is estimated to be 36,000 per year with 50% co-funding. The recruitment of international expertise is basedon the calculation of average annual cost of 100,000 with decreasing co-funding during a three-year period of 50%,40% and 30% respectively. The cost of attraction packages is included in the total cost. The cost recruiting of specificpurpose specialists is estimated to be an average of 50-60,000 per year with 30-35% co-funding.

Innovation Staff Recruitment Programme Feasibility Study6. Evaluation framework and ex-ante estimation of targets and costs
55
Table 17. Overview of potential synergy effects form other schemes
Programme Essence Mobility aspect Synergy potential and content
R&D financing Support scheme for market Possibility to employ research Highprogramme oriented R&D projects. staff (incl. PhD students) This programme can be combined
for R&D projects. with the Type 1 scheme offering companies an additional possibility of employing research personnel.
Competence Funding of staff and Mobility between R&D HighCentres investments in machinery and institutions and business The type 1 scheme should offer a
equipment for industrially sector is one of the very important additional componentrelevant R&D projects. sub-objectives. to the Competence Centre
programme by making funding available for PhD-projects in industry.
SPINNO R&D contracts and creation Mobility may be induced Medium to highof spin-off companies. through the R&D contracts SPINNO tech transfer units may be
ambassadors for mobility schemes.
ESF measure Among other issues, doctoral Supports academic mobility. Medium1.1 schools and hiring of foreign The doctoral schools should be
lecturers is supported. combined with the Type 1 scheme offering research training to the industrial PhD-students and their mentors.
Kristjan Jaak Supports international Mobility is the core of the Mediummobility of researchers. programme but it includes Synergies are low in the programme’s
only academic mobility. present form but synergies may occur if the programme can be marketed jointly with type 2 scheme.
Tallinn City Favours mobility between Focus is on vocational HighApprenticeship vocational schools and schools and skilled and craft There could be strong synergy scheme enterprises. workers. effects of this programme and the
Type 3 scheme.
NordProLink – Short-term apprenticeship in The impact of the pro- LowNordic Nordic SMEs. gramme is rather educational Professional Links for employees of SMEs.
Internship The Internship Exchange of Mobility aspect is strong but LowExchange the ITC is designed to match its impact is limited as it The proposed mobility/recruitment
the ITC student’s educational concerns only the field of scheme does not focus on goals with hosting ICT. undergraduate students.organisations needs.
Nordplus Mobility and network Mobility of all stakeholders LowNeighbour programme. Its objective is to in the field of education. No focus on industry
develop networks between educational institutions, research institutions and non-governmental organisations in the field of education and lifelong learning.

Innovation Staff Recruitment Programme Feasibility StudyAppenxix 1. Statistical tables on Estonian Context
56
Appendix 1.1 R&D intensities and sectoral value added to GDP, 2005
Field of activity NACE Sectoral value R&D intensity Increase in added as % of (share of sectoral R&D intensitynational GDP R&D in sectoral (change in private(%, 2005) value added R&D investment
%, 2005) 2003–2005)
Agriculture, hunting and forestry; fishing NACE A; B 3.28 0.02 n/a
Manufacture of food products, beverages and tobacco NACE 15 1.88 1.91 120.8
Manufacture of textiles and textile products NACE 17–18 1.33 0.09 9.7
Manufacture of wood and products of wood NACE 20 2.16 0.05 n/a
Manufacture of pulp, paper and paper products; publishing NACE 21–22 1.19 n/a n/a
Manufacture of coke, oil shale, nuclear fuel and chemical products NACE 23–24 0.91 3.33 -21.3
Manufacture of other non-metallic mineral products NACE 26 1.12 0.61 19.4
Manufacture of metal, metal products and machinery and equipment n.e.c. NACE 27–29 2.32 0.72 228.2
Manufacture of electrical and optical equipment NACE 30–33 1.61 4.71 144.5
Manufacture of transport equipment NACE 34–35 0.66 3.11 n/a
Manufacture of furniture; manufacturing n.e.c.; recycling NACE 36–37 1.21 0.44 -31.6
Electricity, gas and water supply NACE 40–41 3.03 0.66 22.5
Construction NACE 45 6.42 n/a n/a
Wholesale and retail trade; repair of motor vehicles etc. NACE 50–52 13.18 0.08 88.4
Transport, storage and communication NACE 60–64 10.60 0.10 -56.0
Financial intermediation NACE 65–67 3.33 1.69 17.4
Real estate; education; health; other service NACE 70–71; activities 80; 85; 90–93 19.94 0.01 -76.0
Computer and related activities NACE 72 0.83 11.37 316.4
Other business activities NACE 74 5.01 0.60 -77.7
n/a – data are confidential
Source: Statistical Office of Estonia
The following fields have been left out in Appendix 1 because almost no R&D expenditures reported in thesesectors: hotels and restaurants, manufacturing of leather and leather products. In case of rubber and plasticproducts data was not available.
Appendix 1 Statistical tables on Estonian Context

Innovation Staff Recruitment Programme Feasibility StudyAppenxix 1. Statistical tables on Estonian Context
57
Appendix 1.2 R&D personnel (full-time equivalent), 1998–2004
Field of activity NACE 1998 1999 2000 2001 2002 2003 2004
Economic activities total 440 618 418 626 702 763 1,084
Mining and quarrying 10–14 n/a 0 0.0 0 0.0 n/a n/a
Manufacturing 104 172 163 333 287 298 445
Manufacture of food products and beverages 15 11 17 32 29 20 29 16
Manufacture of textiles and textile products 17–18 6 16 4 6 11 14 16
Manufacture of paper and paper products; publishing 21–22 n/a 2 1 2 n/a 0 3
Manufacture of chemicals and chemical products, coke, refined petroleum products and nuclear fuel 23-24 28 41 69 82 65 61 91
Manufacture of other non-metallic mineral products 26 n/a 1 2 1 n/a 4 5
Manufacture of basic metals and fabricated metal products, machinery and equipment 27–29 7 22 7 29 16 23 56
Manufacture of electrical and optical equipment 30–33 9 23 22 115 106 105 207
Manufacture of transport equipment 34–35 29 33 9 36 32 n/a 31
Manufacture of furniture; manufacturing n.e.c.; recycling 36–37 12 13 11 18 22 23 15
Electricity, gas and water supply 40–41 6 12 1 30 47 21 21
Services
Wholesale trade and commission trade 50–52 11 20 9 15 26 18 18
Transport, storage and communications 60–64 110 98 55 13 12 43 21
Financial intermediation 65–67 … … … … … 69 81
Computer and related activities 72 40 69 62 82 168 148 332
Research and development 73 47 53 55 30 55 78 82
Other business activities 74 92 158 61 95 99 79 66
n/a – data are confidential; … – data were not collected
Source: Statistical Office of Estonia

Innovation Staff Recruitment Programme Feasibility StudyAppenxix 1. Statistical tables on Estonian Context
58
Appendix 1.3 R&D personnel in business sector by level of education, 2004
Field of activity NACE Total Doctor’s Master’s Secondary Withoutdegree degree and education secondary
higher educationeducation
No No % No % No % No %
Economic activities total 1,735 122 7.0 1,222 70.4 158 9.1 16 0.9
Mining and quarrying 10–14 n/a n/a n/a n/a n/a n/a n/a n/a n/a
Manufacturing 668 49 7.3 545 81.6 69 10.3 5 0.7
Manufacture of food products and beverages 15 34 0 0.0 27 79.4 7 20.6 0 0.0
Manufacture of textiles and textile products 17–18 26 0 0.0 20 76.9 4 15.4 2 7.7
Tanning and dressing of leather 19 0 0 0.0 0 0.0 0 0.0 0 0.0
Manufacture of wood and products of wood 20 n/a n/a n/a n/a n/a n/a n/a n/a n/a
Manufacture of paper and paper products; publishing 21–22 8 0 0.0 8 100.0 0 0.0 0 0.0
Manufacture of chemicals and chemical products, coke, refined petroleum products and nuclear fuel 23-24 117 16 13.7 94 80.3 7 6.0 0 0.0
Manufacture of rubber and plastics products 25 n/a n/a n/a n/a n/a n/a n/a n/a n/a
Manufacture of other non-metallic mineral products 26 21 1 4.8 15 71.4 5 23.8 0 0.0
Manufacture of basic metals and fabricated metal products, machinery and equipment 27–29 103 5 4.9 92 89.3 5 4.9 1 1.0
Manufacture of electrical and optical equipment 30–33 291 25 8.6 229 78.7 35 12.0 2 0.7
Manufacture of transport equipment 34–35 37 1 2.7 34 91.9 2 5.4 0 0.0
Manufacture of furniture; manufacturing n.e.c.; recycling 36–37 25 0 0.0 22 88.0 3 12.0 0 0.0
Electricity, gas and water supply 40–41 42 1 2.4 38 90.5 2 4.8 0 0.0
Construction 45 0 0 0 0 0 0 0 0 0.0
Services
Wholesale trade and commission trade 50–52 33 6 18.2 22 66.7 5 15.2 0 0.0
Hotels and restaurants 55 0 0 0 0 0 0 0 0 0.0
Transport, storage and communications 60–64 54 0 0.0 56 103.7 19 35.2 3 5.6
Financial intermediation 65–67 99 2 2.0 86 86.9 11 11.1 0 0.0
Computer and related activities 72 465 27 5.8 340 73.1 96 20.6 2 0.4
Research and development 73 124 21 16.9 91 73.4 12 9.7 0 0.0
Other business activities 74 216 14 6.5 180 83.3 22 10.2 0 0.0
Real estate; education; health; 70, 71, other service activities 75, 80,
85, 90–99 27 2 7.41 23 85.2 1 3.7 1 3.7
Source: Statistical Office of Estonia

Innovation Staff Recruitment Programme Feasibility StudyAppenxix 1. Statistical tables on Estonian Context
59
Appendix 1.4 Total R&D expenditures, 1998–2004
(thousands EUR)
Field of activity NACE 1998 1999 2000 2001 2002 2003 2004
Economic activities total 15.286 12956 11.588 20.409 20.296 26.958 37.010
Manufacturing 4.394 3.487 4363 10.070 10313 10.657 14710
Manufacture of food products and beverages 15 893 336 381 759 985 1.634 1.150
Manufacture of textiles and textile products 17–18 295 290 87 n/a 229 135 252
Manufacture of paper and paper products; publishing 21–22 n/a n/a n/a n/a n/a 0 155
Manufacture of chemicals and chemical products, coke, refined petroleum products and nuclear fuel 23-24 631 969 1.442 3.050 3.055 2.982 3.503
Manufacture of other non-metallic mineral products 26 n/a 165 n/a 353 484 457 732
Manufacture of basic metals and fabricated metal products, machinery and equipment 27–29 62 215 n/a n/a 547 361 1.094
Manufacture of electrical and optical equipment 30–33 n/a n/a 640 2.479 2.374 1.778 5.116
Manufacture of transport equipment 34–35 n/a 881 n/a 909 n/a n/a 2.294
Manufacture of furniture; manufacturing n.e.c.; recycling 36–37 1.771 276 170 526 1.330 736 345
Electricity, gas and water supply 40–41 n/a 1.617 1.606 1.266 1.586 1.473 2.366
Services
Wholesale trade and commission trade 50–52 n/a 542 660 996 565 471 432
Transport. storage and communications 60–64 1.598 2.003 1.282 565 709 2.121 3.259
Financial intermediation 65–67 … … … … … 4.217 4.311
Computer and related activities 72 n/a 1.186 1.569 n/a 2.673 1.822 7.040
Research and development 73 440 640 754 885 1.411 1.610 1.494
Other business activities 74 986 2.630 848 2.275 2.780 2.941 1.603
n/a – data are confidential; … – data were not collected
Source: Statistical Office of Estonia

Innovation Staff Recruitment Programme Feasibility StudyAppenxix 1. Statistical tables on Estonian Context
60
Appendix 1.5 Companies with innovative activities, 2002–2004
Field of activity All enterprises Enterprises Share of innovativewith innovative activities enterprises
Economic activities total 3,789 1844.1 48.7
Mining and quarrying 43 15.4 35.8
Manufacturing 1,917 923.7 48.2
Manufacture of food products and beverages 229 134.2 58.6
Manufacture of textiles and textile products 298 100.2 33.6
Tanning and dressing of leather 33 17.8 53.9
Manufacture of wood and products of wood 352 146 41.5
Manufacture of paper and paper products; publishing 149 85.4 57.3
Manufacture of chemicals and chemical products, coke, refined petroleum products and nuclear fuel 38 33.9 89.2
Manufacture of rubber and plastics products 81 45.6 56.3
Manufacture of other non-metallic mineral products 65 41.2 63.4
Manufacture of basic metals and fabricated metal products, machinery and equipment 327 129.9 39.7
Manufacture of electrical and optical equipment 97 64.6 66.6
Manufacture of transport equipment 61 31 50.8
Manufacture of furniture; manufacturing n.e.c.; recycling 187 94.1 50.3
Electricity, gas and water supply 108 31.7 29.4
Services 1,721 873.3 50.7
Wholesale trade and commission trade 803 504.7 62.9
Transport, storage and communications 641 209 32.6
Financial intermediation 53 39.6 74.7
Computer and related activities 83 60.9 73.4
Architectural and engineering activities 113 46.7 41.3
Technical testing and analysis 28 12.3 43.9
Source: CIS4

Innovation Staff Recruitment Programme Feasibility StudyAppenxix 1. Statistical tables on Estonian Context
61
Appendix 1.6 Innovative and exporting companies, 2002–2004
CIS, total Innovative Co-operating Innovativewith R&D and exporting
institutions% % % %
Manufacture of food products and beverages 6.0 7.3 5.0 4.9
Manufacture of leather and leather products 0.9 1.0 1.2 1.3
Manufacture of wood and wood products 9.3 7.9 2.5 9.4
Manufacture of rubber and plastic products 2.1 2.5 2.0 3.0
Manufacture of other non-metallic mineral products 1.7 2.2 3.8 2.4
Manufacture of machinery and equipment n.e.c. 2.1 2.2 3.6 2.9
Wholesale trade and commission trade, except of motor vehicles and motorcycles 21.2 27.4 25.9 26.5
Computer and related activities 2.2 3.3 6.0 3.0
Other business activities 3.7 3.2 7.8 2.1
Mining and quarrying 1.1 0.8 1.8 0.4
Manufacture of textiles and textile products 7.9 5.4 0.6 6.8
Manufacture of pulp, paper and paper products; publishing and printing 3.9 4.6 3.2 3.7
Manufacture of coke, refined petroleum products and nuclear fuel; manufacture of chemicals, chemical products and man-made fibres 1.0 1.8 7.5 2.4
Manufacture of basic metals and fabricates metal products 6.6 4.8 3.4 5.7
Manufacture of electrical and optical equipment 2.6 3.5 4.6 4.5
Manufacture of transport equipment 1.6 1.7 1.8 2.2
Other manufacturing; recycling 4.9 5.1 2.0 6.7
Electricity, gas and water supply 2.9 1.7 7.6 0.2
Transport, storage and communication 16.9 11.3 5.9 10.5
Financial intermediation 1.4 2.1 3.9 1.3
100.00 100.00 100.00 100.00Source: CIS4

Innovation Staff Recruitment Programme Feasibility StudyAppenxix 1. Statistical tables on Estonian Context
62
Appendix 1.7 Companies reporting R&D expenditures, 2005
Export/Turnover Employees BERD/turnover
Total 357 69 31 37 220 33 20 54 97 153 111 16 21 51 158
Agriculture, hunting, forestry, fishing 4 0 0 0 4 1 1 0 1 1 0 0 0 0 4
Mining and quarrying 3 1 0 0 2 1 0 0 2 0 0 0 1 2 0
Manufacturing 129 52 14 14 49 21 12 34 34 28 24 10 14 35 46
Manufacture of food products and beverages 19 2 1 6 10 7 3 6 3 0 1 1 1 6 10
Manufacture of textiles and textile products 3 3 0 0 0 1 1 1 0 0 0 0 0 3 0
Manufacture of leather and leather products 0 0 0 0 0 0 0 0 0 0 0 0 0 0 0
Manufacture of wood and wood products 4 3 0 1 0 2 0 2 0 0 0 0 0 1 3
Manufacture of coke, refined petroleum products and nuclear fuel; manufacture of chemicals, chemical products and man-made fibres 18 8 4 1 5 3 1 3 7 4 5 3 3 6 1
Manufacture of other non-metallic mineral products 9 1 2 2 4 2 1 2 4 0 0 0 2 3 4
Manufacture of basic metals and fabricates metal products 14 8 4 1 1 0 2 6 6 0 3 1 2 6 2
Manufacture of electrical and optical equipment 44 15 3 0 26 2 2 7 9 24 13 3 3 5 20
Manufacture of transport equipment 5 4 0 0 1 1 0 2 2 0 1 1 1 1 1
Other manufacturing 9 6 0 2 1 2 1 5 1 0 1 0 1 4 3
Electricity, gas and water supply 9 0 0 1 8 5 1 2 1 0 0 0 1 1 7
Services 210 16 17 22 155 4 6 18 58 124 87 6 4 13 100
Wholesale and retail trade; repair of motor vehicles, motorcycles and personal and household foods 30 0 0 6 24 0 0 1 8 21 2 0 1 1 26
Transport, storage and communication 10 2 1 1 6 2 3 2 2 1 2 1 0 4 3
Financial intermediation 5 0 0 0 5 2 2 0 1 0 0 0 0 0 5
Computer and related activities 67 4 12 6 45 0 0 3 14 50 24 2 1 1 39
Research and development 29 8 3 1 17 0 0 0 8 21 27 0 0 0 2
Other business activities 42 1 1 7 33 0 0 8 17 17 18 3 2 6 13
Real estate, renting and business activities (excl. Computer and related activities, R&D and other business activities) 27 1 0 1 25 0 1 4 8 14 14 0 0 1 12
Source: Statistical Office of Estonia
Com
pani
es
repo
rtin
g BE
RD
abov
e 49
%
30–4
9%
10–2
9%
belo
w 1
0%
abov
e 24
9
150–
249
50–1
49
10–4
9
belo
w 1
0
abov
e 10
%
5–10
%
3–4%
1–2%
belo
w 1
%

Innovation Staff Recruitment Programme Feasibility StudyAppenxix 1. Statistical tables on Estonian Context
63
Appendix 1.8 Admittance in doctoral courses, 2000–2005
2000 2001 2002 2003 2004 2005
Fields of study total 370 281 329 354 428 440
Teacher training and education science 15 13 10 11 18 13
Arts 7 6 11 9 9 19
Humanities 26 36 35 42 70 67
Social and behavioural science 21 35 40 45 56 68
Journalism and information 2 2 3 3 5 4
Business and administration 16 17 21 11 21 17
Law 4 7 11 12 12 11
Life science 38 31 33 32 39 38
Physical sciences 34 26 32 36 43 51
Mathematics and statistics 7 5 5 7 7 9
Computer sciences 6 7 25 29 24 34
Engineering and engineering trades 32 39 33 49 49 56
Manufacturing and processing 0 0 0 0 0 0
Architecture and building 10 7 12 12 14 7
Agriculture, forestry and fishery 15 14 20 15 18 16
Veterinary 12 2 4 5 3 3
Health 117 20 21 21 22 17
Social services 3 3 3 3 4 1
Personnel services 2 2 2 3 8 5
Transport services 0 0 0 0 0 0
Environmental protection 3 9 8 9 6 4
Security services 0 0 0 0 0 0
Source: Statistical Office of Estonia

Innovation Staff Recruitment Programme Feasibility StudyAppenxix 1. Statistical tables on Estonian Context
64
Appendix 1.9 Graduates of Doctoral courses, 2000–2005
2000 2001 2002 2003 2004 2005
Fields of study total 117 149 188 226 209 118
Teacher training and education science 0 0 0 2 6 2
Arts 0 0 0 1 2 2
Humanities 10 14 15 16 26 15
Social and behavioural science 4 4 5 10 4 8
Journalism and information 0 1 3 1 0 0
Business and administration 3 5 4 3 6 5
Law 0 4 2 2 3 4
Life science 14 4 12 7 27 15
Physical sciences 16 15 14 22 15 15
Mathematics and statistics 1 2 1 2 5 3
Computer sciences 5 1 4 1 3 5
Engineering and engineering trades 6 8 6 13 13 19
Manufacturing and processing 0 0 1 1 1 2
Architecture and building 0 1 0 3 2 4
Agriculture, forestry and fishery 5 2 5 6 1 7
Veterinary 1 0 0 2 4 0
Health 52 88 113 131 86 10
Social services 0 0 1 0 1 0
Personnel services 0 0 0 1 3 1
Transport services 0 0 0 0 0 0
Environmental protection 0 0 2 2 1 1
Security services 0 0 0 0 0 0
Source: Statistical Office of Estonia

Innovation Staff Recruitment Programme Feasibility StudyAppenxix 2. Overview of good practice programmes
65
One way to overcome the shortage of researchers and the subsequent problems arising from this issue as insuf-ficient research at universities and within R&D departments in companies would be to attract outside experts.Another way to overcome this shortage would be to make use of internal measures/ resources that would fos-ter knowledge transfer and secure new generations of researchers. As stated by the study “OperationalProgramme for Human Resource Development” (2006), the Estonian R&D system suffers severe and chronicfinancial gaps so that for example R&D investments in Estonia per full-time researcher or engineer are morethan seven times smaller than in the European Union. This lack of finance translates into low wages for PhDstudents, which often have to take a second job in order to be able to secure a low living standard and it pre-vents institutions from making investments in cutting-edge technology for R&D on an ongoing perspective. Forthis reason a set of best practices that address that issue will be introduced in the next section. We will talk onthe one hand about “Industrial PhD” programs that aim to build personnel networks of knowledge betweencompanies, domestic universities and research institutions. On the other hand, we will focus on programs thatpay subsidies to SMEs that would hire a high-qualified worker, as e.g. an engineer or technician, in order toupgrade innovative and technological capacities within their operational businesses.
Mobility/recruitment of researchers programmes
The basic idea of this type of programmes is to permit postgraduate students to obtain a PhD-degree throughemployment as researcher in a private company to gain insight into the business related aspects of researchand development. At the same time it is also enhancing research and development in the business sector withthe knowledge of the PhD students. The underlying financial structure is based on the assumption that approx-imately half of the costs (salaries, research costs) are paid for by the company; the other half is financed by thelocal government. Within this context the graduate student works for and gets guidance from both the com-pany and the university. The main objectives stated by the initiatives are to:� Increase rates of expenditure on research and technological innovation in enterprises;� Facilitate access of enterprises to skilled personnel;� Ensuring that the future skills base in the region/sector/country will correspond to the innovation needs
of enterprises;� Provide adequate infrastructure to new technology based firms to facilitate their survival and growth; and� Upgrading innovation related skills and diffusing new technologies in enterprises.
1. Industrial PhD Fellowship Program
The first program that will be introduced is called the “Industrial PhD Fellowship Program”. It was installedin the 1970s by Denmark. Since then the Danish government is supporting between 50–70 new industrial PhDfellowships each year. The company pays approximately half and the governments half of the costs. This pro-gram is also open to foreign PhD students, which is not a common feature. The program has an annual budg-et of approximately 5.4 Million Euros, but future development efforts are aimed at increasing the budget. Italso aims to increase the participation of SMEs, reducing the concentration of companies in Copenhagen (i.e.spreading the benefits throughout the country) and promoting the use of the programs in all academic areas,such as engineering, health, social sciences and arts.
Initially the program managers had to overcome administrative difficulties to allow it to work within timescalesthat are acceptable to companies. However, they did not have any legal or political barriers to designing a transna-tional program and feedback from participants shows that:38
� There is an increased knowledge at the universities and improved networks and cooperation with busi-nesses – this includes networks outside Denmark.
� The quality level of the PhD work is typically as good as or better than a regular PhD.� Companies enhance competencies and develop new fields of world-class R&D.� 44% of companies expected to see increased turnover as a result.� Around half of the companies that have hosted Industrial PhD projects in the last six years claim that the
project has resulted in one or more patents.� PhD fellows enjoy and value their international experience, with it adding a perspective to their study that
they had not envisaged before. � The unemployment rate of all fellows who have completed the education since 1988 is less than 1%.
Appendix 2 Overview of good practice programmes
38 http://www.eua.be/eua/jsp/en/upload/Study_report_designed_version.1151581567476.pdf, European Commission.

Innovation Staff Recruitment Programme Feasibility StudyAppenxix 2. Overview of good practice programmes
66
The program benefits from Denmark’s position as a medium-sized country with small markets and a restrictedresearch infrastructure. Both its companies and its academics are accustomed to working internationally andthe Ministry has recognized this in the development of the program, avoiding any restriction on mobility. Whileit is Danish companies that benefit directly, the cooperative networks that are put in place also benefit the inter-national partners. While it does support academia, the program is very much focused on supporting and devel-oping businesses and industries. Consequently, it has been designed to be very flexible and responsive to busi-ness needs, with the international elements simply reflecting the operating environment faced by Danishcompanies. Keeping it simple and avoiding imposing any barriers has allowed the natural, market driven devel-opment of transnational activity.
2. CIFRE
The second best practice is based on the French program “CIFRE” which stands for Convention industrielle deformation par la recherche or Industrial Agreement for Training Through Research. The queue for permanentresearch positions in the French academic sector in the early 1980s has created a specific labour market for PhDgraduates. In order to facilitate the transition of PhD graduates to the private sector, the Ministry of Researchhas developed a specific programme (CIFRE) that connects PhD candidates, universities and firms in order totrain young graduates more adapted to the needs of the private firms. More precisely, the National Associationfor Technology Research (ANRT), which is attached to the Ministry of Research and Technology, supports for athree-year period a firm hiring a young PhD candidate associated with an external lab. The student spends timebetween the two partners and can also contribute to technology transfer although the thesis topic is usually aproblem of direct concern to the industrial partner. During the three years of the agreement, the company paysan annual gross wage of 20,000 Euros or more to the PhD candidate. Since 1981 13000 students have donetheir PhD thesis in 6000 companies, 50% of them SMEs. The theses were written in the field of technology(5700), material science (3054), nature science (2405) and social science (1519). In 2005 the program had 1100signed students and aims to increase the participation to 2000 students by 2010. An evaluation revealed that83% of the participating companies say they have benefited from the program through generating new know-how (39%), they could enhance product development (17%) as well as processes (18%). Last but not leastnew patents and new prototypes were created with the help of PhD students from the program.39
Recruitment of graduate programmes
Apart from the “Industrial PhD” program another scheme to support the Industry/ SMEs–University relation-ship has evolved that focuses on the funding of projects of students about to take their diploma from collegesof higher education, especially technicians. Those programs focus on highly educated people without a PhDqualification. The objectives of those schemes are similar to the PhD program: (i) to give students the oppor-tunity to gain experience with corporate R&D, and (ii) to stimulate contact between SMEs and people from thetertiary education level. In the process the funding agency, mostly a publicly founded agency, pays between50%–80% of the project’s costs, the other half is often paid by the company. Within this budget the coun-selling staff receive payments too. The best practice within this category includes the “FFF Young ResearchersProgram” from Austria.
1. FFF Young Researchers Program40
The FFF Young Researchers Program was initiated in 1993 in Austria and focuses on the funding of diplomastudents as well as on PhD candidates41. Since then FFF has been pursued. In 2005, about 35 projects werefinanced by the fund for about 6,5 Million Euros that year. The prerequisite for enterprises to be part of theprogram is outlined on the size of the company. Small and Medium sized companies are ranged to fit the cri-teria of either a maximum of 250 employees, a business volume of maximum 50 Million Euros or a balancesheet total of maximum 43 Million Euros. Companies that predominantly work in the field of R&D are not allowedfor funding. The prerequisite for projects is outlined as follows:� projects have to aim at developing new products or techniques;� projects have to fulfil high innovation standards;� projects have to solve an ex ante defined problem relevant to the company;� projects should be utilizable to business.
39 www.anrt.asso.fr40 Contact: +43 5 7755 – 1201 (Austria)41 Focus within this section is given to the diploma student part of the programme.

Innovation Staff Recruitment Programme Feasibility StudyAppenxix 2. Overview of good practice programmes
67
The financial perspective is defined as follows: (i) students about to take their diploma agree upon a salary withthe company, the fund is going to pay 50% of the expenses which do not have to be repaid by the student;(ii) arising expenses at the university are compensated to 50% as well; (iii) companies receive for their admissi-ble expenses a 50% funding which partly consists of a free fund and a loan.
An evaluation carried out in 1997 revealed that the impulse effect towards further projects was at 43%.Companies stated that they would engage in further projects at a rate of 96%. The hiring quota of researcherswas at 30%. The lack of co-operation of universities and too much formalism (reporting) were stated as majorimpediments to the success of the program.
A third form to support knowledge transfer as well as to foster technological projects in companies throughthe hiring of technicians in SMEs would be to pay subsidies to companies that would hire qualified personnel.Those wage-subsidy programs are common within the low-wage sector, but less known as a policy measurefor high-qualified worker schemes. Nonetheless, France and Turkey installed such programs.
2. CORTECHS (France)
Cortechs, introduced in 1988, is a program that favours the recruitment of young graduates in especially tech-nical positions of SMEs with less than 250 employees for well-defined research projects. A third party, compe-tence/-training centres, is involved in this program too. The financial perspective of CORTECHS is handled asfollows: a 50% subsidy to the costs of hiring a young technician is given to the company for a twelve-monthperiod. The maximum amount of money is set at 13.000 . The competence centre also gets a subsidy. Theamount is to be specified. In 2004, the French government spent 1.4 Million Euros on the program. Another1.9 Million Euros came from the Structural Fund of the EU. From 1989–2001, on average 280 technicians par-ticipated in the program. The largest participant rates were achieved in enterprises with 1–10 employees (45%)and enterprises with 11–50 employees (43,5%)42, so that this tool is working very well for small businesses.Another very closely linked project called Diplome Recherche Technologique (DRT) by France builds upon thesame objectives as CORTECHS, to foster technological and innovative capacities of enterprises through the hir-ing of engineers (young graduates). Furthermore, participants of this program have to be able to undertakeR&D activities and that would maintain a close link to the research organization (either a university or techni-cal school). The latter aspect distinguishes DRT from CORTECHS. DRT is an ongoing project installed in 1997.The financial assistance given to participants of DRT is in line with the CORTECHS funding: a 50% subsidy tohiring an engineer is given to the company, with a ceiling of 10.600 Euro per year.
A very similar kind of initiative was set up by Turkey (the project name is not known). They introduced in 2003a measure which focuses on subsidies for enterprises that hire qualified personnel as well. The scheme allowsfor grants provided to the hands of the SMEs. This includes a level of finance between 60% and 80% of thewage of the employee (for graduates from university up to 11250 per year). Grants are provided for eighteenmonths.43
3. The Knowledge Transfer Partnership (UK)
The Knowledge Transfer Partnerships (KTP) is a scheme managed by the Government’s Department of Tradeand Industry (DTI) to strengthen the competitiveness and wealth creation of the UK by the stimulation of inno-vation in business through the establishment of collaborative partnerships with the UK knowledge base. KTPhelp businesses to improve their competitiveness and productivity through the better use of knowledge, tech-nology and skills that reside within UK’s public and private sector research institutes and higher education insti-tutions.
The objectives of the Knowledge Transfer Partnerships are to facilitate the transfer of knowledge and the spreadof technical and management skills; to encourage investments in training, research and development and tostimulate collaborative research and development projects, forging lasting partnerships.
42 Source: www.recherche.gouv.fr/technologie/mesur/chapitre6idt.pdf#search=%22CORTECHS43 As there is no further information on this program yet, it has to be inquired whether those positions will be continued
on both sides after the expiring of the grants.
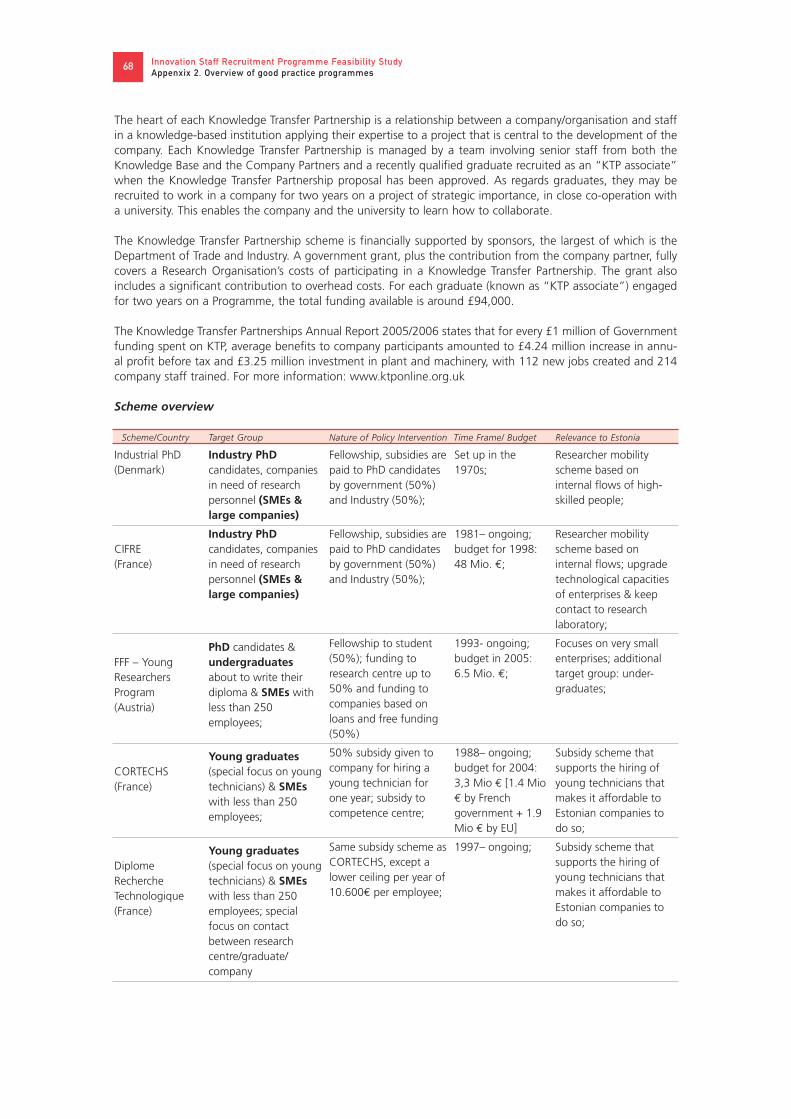
Innovation Staff Recruitment Programme Feasibility StudyAppenxix 2. Overview of good practice programmes
68
The heart of each Knowledge Transfer Partnership is a relationship between a company/organisation and staffin a knowledge-based institution applying their expertise to a project that is central to the development of thecompany. Each Knowledge Transfer Partnership is managed by a team involving senior staff from both theKnowledge Base and the Company Partners and a recently qualified graduate recruited as an “KTP associate”when the Knowledge Transfer Partnership proposal has been approved. As regards graduates, they may berecruited to work in a company for two years on a project of strategic importance, in close co-operation witha university. This enables the company and the university to learn how to collaborate.
The Knowledge Transfer Partnership scheme is financially supported by sponsors, the largest of which is theDepartment of Trade and Industry. A government grant, plus the contribution from the company partner, fullycovers a Research Organisation’s costs of participating in a Knowledge Transfer Partnership. The grant alsoincludes a significant contribution to overhead costs. For each graduate (known as “KTP associate”) engagedfor two years on a Programme, the total funding available is around £94,000.
The Knowledge Transfer Partnerships Annual Report 2005/2006 states that for every £1 million of Governmentfunding spent on KTP, average benefits to company participants amounted to £4.24 million increase in annu-al profit before tax and £3.25 million investment in plant and machinery, with 112 new jobs created and 214company staff trained. For more information: www.ktponline.org.uk
Scheme overview
Scheme/Country Target Group Nature of Policy Intervention Time Frame/ Budget Relevance to Estonia
Industrial PhD(Denmark)
CIFRE(France)
FFF – YoungResearchersProgram(Austria)
CORTECHS(France)
DiplomeRechercheTechnologique(France)
Industry PhDcandidates, companiesin need of researchpersonnel (SMEs &large companies)
Industry PhDcandidates, companiesin need of researchpersonnel (SMEs &large companies)
PhD candidates &undergraduatesabout to write theirdiploma & SMEs withless than 250employees;
Young graduates(special focus on youngtechnicians) & SMEswith less than 250employees;
Young graduates(special focus on youngtechnicians) & SMEswith less than 250employees; specialfocus on contactbetween researchcentre/graduate/company
Fellowship, subsidies arepaid to PhD candidatesby government (50%)and Industry (50%);
Fellowship, subsidies arepaid to PhD candidatesby government (50%)and Industry (50%);
Fellowship to student(50%); funding toresearch centre up to50% and funding tocompanies based onloans and free funding(50%)
50% subsidy given tocompany for hiring ayoung technician forone year; subsidy tocompetence centre;
Same subsidy scheme asCORTECHS, except alower ceiling per year of10.600€ per employee;
Set up in the1970s;
1981– ongoing;budget for 1998:48 Mio. €;
1993- ongoing;budget in 2005:6.5 Mio. €;
1988– ongoing;budget for 2004:3,3 Mio € [1.4 Mio€ by Frenchgovernment + 1.9Mio € by EU]
1997– ongoing;
Researcher mobilityscheme based oninternal flows of high-skilled people;
Researcher mobilityscheme based oninternal flows; upgradetechnological capacitiesof enterprises & keepcontact to researchlaboratory;
Focuses on very smallenterprises; additionaltarget group: under-graduates;
Subsidy scheme thatsupports the hiring ofyoung technicians thatmakes it affordable toEstonian companies todo so;
Subsidy scheme thatsupports the hiring ofyoung technicians thatmakes it affordable toEstonian companies todo so;

Innovation Staff Recruitment Programme Feasibility StudyAppenxix 2. Overview of good practice programmes
69
KIM: The instrument was last evaluated in 2000. The evaluation has assessed the impact of the subsidy in termsof: 1. the importance of the subsidy: for approx. 75% of the firms the non granting of the subsidy would havehad an impact on the implementation/size/start/duration of the project. In 23% of the cases the projects wouldhave proceeded anyway (free riders). 2. first order effects (impact on R&D input): for 50% of the “old partici-pants” and 53% of the “new participants” KIM has had a positive effect on the R&D intensity – an averageincrease of 0,9 fte in personnel for R&D in case of “old participants” (n=13) and 0,5 fte in the case of “newparticipants” (n=11). On the other hand, there are also companies where there has been no demonstrable oreven a negative impact. 3. second order effects (impact on R&D output/innovativeness): 91% of the “old par-ticipants” and 84% of the “new participants” have realised innovations; the majority of product innovationshas been successfully commercialised; 57% of the companies have improved their efficiency due to process inno-vation 4. third order effects (impact on company performance): in 52% of “old participants” and 80% of “newparticipants” KIM has had a positive impact on turn-over. In 45% of “old participants” and 68% of “new par-ticipants” KIM has had a positive impact on employment – an average increase of 3,6 fte in “old participants”(n=5) and 3,3 fte in “new participants” (n=12); in 20% of “old participants” and 23% of “new participants”KIM has contributed to retention of jobs – on average 2,0 fte in new participants (n=3). In 30% of “old par-ticipants” and 42% of “new participants” KIM has contributed to an increase in the number of high-skilledpersonnel in the company – on average an increase of 1,4 fte in “old participants” (n=5) and 1,8 fte in “newparticipants” (n=13).
Conditions: – applicant should formulate an innovation plan (in co-operation with Syntens in the region of theapplicant), including: a. description of the development trajectory b. goal of the innovation project; c. defini-tion of the contribution of the knowledge bearer. At the time of submitting the proposal no agreement shouldyet exist between employer and knowledge bearer regarding carrying out activities (with the exception ofapprenticeships or final projects).
UK
Turkey
KIM (Netherlands)
Qualified personnel(graduates, vocationalstudents) & SMEs
Qualified personnel(graduates, vocationalstudents) & SMEs
SMEs (<100employees) &graduated students
Contact: Boersma,Wim Tel.: + 31.70.37969 00 (Ministry ofEconomic Affairs)
Subsidy given tocompany to hireemployee from targetgroup;
Subsidy given tocompany to hireemployee from targetgroup;
Subsidy; Enlargeinnovative capacity ofSMEs44
1987 under nameTeaching CompanyScheme
Introduced in2003- ongoing; nooverall budgetsknown;
1994–2001afterwards mergedwith otherprogram (Transferof knowledgebetween SME's(SKO));Budgets in previousyears:
1997 – € 1 million1998 – € 6 million1999 – € 5 million2000 – € 4 million
Subsidy scheme forlower educationalgroups that wouldsupport companies tohire urgently neededworkers with at leastsome standard ofqualification;
Subsidy scheme forlower educationalgroups that wouldsupport companies tohire urgently neededworkers with at leastsome standard ofqualification;
Subsidy scheme thatsupports the hiring ofyoung technicians thatmakes it affordable toEstonian companies todo so;
Scheme/Country Target Group Nature of Policy Intervention Time Frame/ Budget Relevance to Estonia
44 subsidy to company for hiring a “knowledge carrier” (master level); graduate implements a previously drafted innovationplan, They must hire the knowledge carrier for at least 32 hours on a weekly basis for a period of at least one year.

Innovation Staff Recruitment Programme Feasibility StudyAppenxix 3. List of interviewees
70
Riin Ehin, Competence Centre for Cancer ResearchÜlo Jaaksoo, Cybernetica ASTeet Jagomägi, AS RegioIndrek Kelder, Enterprise Estonia Katrin Kiisler, Archimedes FoundationIlmar Kink, Nanotechnologies Competence CentreArvo Kivikas, AS Ilves-ExtraErki Mölder, AS QuattromedRein Parelo, TERE ASMehis Pilv, AS SilmetKatri Ristal, Estonian Academy of Arts Suido Saarmets, Enterprise Estonia Urmas Sannik, Competence Centre of Food and Fermentation TechnologiesAlvar Savolainen, Tallinn University of TechnologyMarek Tiits, Estonian Academy of SciencesRene, Tõnnisson, Biotechnology Park, Tartu Science ParkKadri Ukrainski, University of TartuUrmas Varblane, University of TartuMadis Võõras, Enterprise Estonia
Appendix 3 List of interviewees

Innovation Staff Recruitment Programme Feasibility StudyAppenxix 4. List of references
71
1. Aghion, P. and Howitt, P., (1990): A model of growth through creative destruction, WorkingPaper 32, Cambridge, MA: National Bureau of Economic Research, Inc.
2. Aghion, P., Howitt, P. (1997): Endogenous Growth Theory. MIT Press.3. Archimedes Foundation (2007): Database of FP5 and FP6 projects.4. Bhagwati, J. N. (1976): The Brain Drain and Taxation – Theory and Empirical Analysis.
Amsterdam: North-Holland.5. European Commission (2006): Annual Innovation Policy Trends and Appraisal Report. Estonia
2004–2005, European Trend C hart on Innovation, Enterprise Directorate-General.http://trendchart.cordis.lu/tc_country_list.cfm?ID=23.
6. European Commission (2001): European Trend Chart on Innovation, Policy BenchmarkingWorkshop. Favouring Industry-Science Relationships through Human Capital Mobility.
7. European Commission (2003): Evaluation of the Trend Chart Policy Benchmarking Workshops,2001–2002, Trendchart.
8. Eurostat, Eurostat On-line Database, 2006.http://epp.eurostat.cec.eu.int/pls/portal/url/page/PGP_QUEEN/PGE_QUEEN_TREE?screen=welcomeref&open=/&product=EU_MAIN_TREE&depth=1
9. Estonian Research, Development and Innovation Strategy 2007–2013 (2007),http://web.riigikogu.ee/
10. Florio, M., Ozzio, E. (2006): Innovation Strategies for SMEs and Clusters: The challenges of aglobalized Europe, Working Paper n. 2006–16, Guigno.
11. Fraunhofer ISI (2002): Research on the Estonian Biotechnology Sector Innovation System,Karlsruhe. http://www.biotech.city.ee/images/Fraunh-raport150203.pdf orhttp://www.mkm.ee.
12. Grossman, G. and Helpman, E., (1991): Innovation and growth in the global economy,Cambridge, MA: MIT Press.
13. Innobarometer (2004): Flash Eurobarometer 164, EOS Gallup Europe,http://cordis.europa.eu/innovation-smes/src/innobarometer2004.html
14. Jürgenson, A. (forthcoming in 2007), Impact evaluation of Estonian R&D financingprogramme, Tallinn: PRAXIS Center for Policy Studies.
15. Jürgenson, A., Kalvet, T., Kattel, R. (2005): Business Support Measures in the Budget Strategyfor 2007–2013, Policy Analysis No 9, Tallinn: PRAXIS Center for Policy Studies.
16. Kalvet, T., Kattel, R., Küünarpuu, K., Vaarik, D., Rahu, K. and E. Ojamets (2005): Innovatsioonja Eesti arvamusliidrid. Eeluuring riikliku innovatsiooniteadlikkuse programmi sihtrühmaderelevantsete vajaduste leidmiseks (Innovation and Public Opinion Leaders in Estonia: Studywith Recommendations for National Innovation Awareness Programme), Tallinn: PRAXISCenter for Policy Studies.
17. Kattel R. And Kalvet, T. (2006) Knowledge-based Economy and ICT-Related Education:Overview of the Current Situation and Challenges for the Education System. Tallinn: PRAXISCenter for Policy Studies.
18. Kalvet, T., Pihl, T., Tiits, M. (2002): Analysis of the Innovation System in the Estonian ITSector. Summary, Tartu: SA Archimedes.
19. Labour demand prognosis until 2012 (2006), Tallinn: Estonian Ministry of Economics andCommunication.
20. Lankhuizen, M., Klein Woolthuis, R. (2003): The National Systems of Innovation Approachand Innovation by SMEs, Netherlands.
21. Mahroum, S. (2000): Highly Skilled Globetrotters: The International Migration of HumanCapital. Seville: Institute for Prospective Technological Studies.
22. Meyer, J.B., Brown, M. (1999): Scientific Diasporas: A New Approach to the Brain Drain,Prepared for the World Conference on Science UNESCO – ICSU, Budapest, Hungary.http://www.unesco.org/most/meyer.htm#note1.
23. Ministry of Economic Affairs and Communications (2003): Overview of Research TechnologyDevelopment and Innovation (RTDI) policy in Estonia.http://www.riigikantselei.ee/failid/Overview_of_RTDI_Policy_in_Estonia_for_OECD___MoEC__2003.pdf
24. Mollerup Designlab A/S, (2002): Establishing the basis for the elaboration of the Estoniandesign policy measures, http:// www.mkm.ee.
25. N.S.F (1998): National Science Foundation, Science and Engineering Indicators 1998, N.S.F.Washington, DC.
Appendix 4 List of references

Innovation Staff Recruitment Programme Feasibility StudyAppenxix 4. List of references
72
26. Nedeva, M., Georghiu, L. (2003): Assessment of the Estonian Research DevelopmentTechnology and Innovation Funding System, PREST, http://www.mkm.ee.
27. OECD (2006): Labour Force Statistics.28. Oliveira Martins J., F. Gonand, P. Antolin, C. de la Maisonneuve and K.-Y. Yoo (2005): The
Impact of Ageing on Demand, Factor Markets and Growth, OECD Economics DepartmentWorking Papers, No. 420, OECD, Paris.
29. Open Doors (2006): Students on the Move: The Future of International Students in the UnitedStates. ACE Issue Brief.
30. Operational Programme for the Development of the Economic Environment, Draft (in Estonian), (2006), http://www.struktuurifondid.ee
31. Operational Programme for Human Resource Development, Draft (in Estonian) (2006),http://www.struktuurifondid.ee
32. Pavitt, K., (1984). Sectoral Patterns of Technical Change: Towards a Taxonomy and a Theory,Research Policy, 13, 6.
33. PW Partners (2002): Sector Research of Estonian Information Technology andTelecommunications, Tallinn: SA Eesti Kutsehariduse Reform.
34. Ramböll Management AB (2006): „När kunskap ger resultat – värdet av ingenjörer i mindreföretag”.
35. Reid, A, Kurik, S. and V. Rouwmaat, (2003): Business Incubation: Review of Current Situationand Guidelines for Government Intervention in Estonia.
36. Reid, A. (2003): Optimising the Design and Delivery of Innovation Policy in Estonia: anEvaluation of Policy Instruments for Intensifying Business Innovation.
37. Saar Poll (2005): Development Trends of Estonian SME’s.38. Schmidt, E. (1997): Innovation im Mittelstand: Theoretische und empirische Aspekte, RWI,
Essen.39. SQW Limited (2003): Evaluation of the Spinno Programme, Final Report to Enterprise Estonia,
Cambridge. http://www.eas.ee/ vfs/2127/Evaluation_of_the_Spinno_programme.pdf or viahttp://www.mkm.ee.
40. Study assessing the impact and implementation of the SPINNO programme in years2001–2006
41. Statistical Office of Estonia (2006): The Community Innovation Survey (CIS IV 2002–2004).42. Statistical Office of Estonia (2007), www.stat.ee and direct contacts.43. Technopolis BV (2001): High Tech Venturing in Estonia: Background Report for the ESTPIN
programme, (attached file).44. Technopolis Ltd. (2002): Competence Centre Programme Estonia Feasibility Study.45. Technopolis Consulting Group (2003): Estonian Innovation Awareness Programme Final
Report, Pera International, http://www.mkm.ee.46. Technopolis Consulting Group Belgium SPRL (2005): Evaluation of the design and
implementation of Estonian RTDI policy: implications for policy planning. Final report,http://www.mkm.ee.
47. Thorn & Holm-Nielsen, 2006: International Mobility of Researchers and Scientists, UNU-WIDER, Research Paper 2006/83.
48. Tiits, M., Kattel, R., and T. Kalvet (2006): Made in Estonia, Tartu: Institute of Baltic Studies.49. Tiits, M., Kattel, R., Kalvet, T. and R. Kaarli (2003): Competitiveness and Future Outlooks of
the Estonian Economy, Tallinn: Research and Development Council50. Todisco, E., M.C.Brandi, and G. Tattolo (2003): A theoretical Framework and the Case of
Foreign Researchers in Italy, Fulor 1(3).51. UNESCO (2004): UIS Survey of Science and Technology Statistics. www.uis.unesco.org52. Wickramasekara, P. (2002): Policy responses to skilled migration: Retention, return and
circulation, Social Protection sector international migration programme, ILO, Geneva.53. Viia, A., Terk, E., Lumiste, R., Heinlo, A. Innovaatiline tegevus Eesti ettevõtetes Euroopa Liidu
neljanda innovatsiooniuuringu (CIS 4) tulemused (Innovative Activities in Estonian EnterprisesAccording to the EU CIS4 Study), Tallinn: EAS, 2007,
54. Zernike Group (2004): Access of Enterprises to Venture Financing in Estonia: Feasibility Studyof Government Support Scheme.
55. Zimmermann, H. (2004): European Labour Mobility: Challenges and Potentials, DiscussionPaper No. 1410, IZA, Bonn.
56. United Nations (2007), Population Division, Department of Economic and Social Affairs.

Previously published in "Innovation Studies":
1/2002 Competence Centre Programme Estonia. Feasibility StudyAvailable in English
2/2002 Innovation in Estonian Enterprises 1998–2000Available in English and Estonian
3/2003 Business Incubation: Review of Current Situation and Guidelines for Government Intervention in EstoniaAvailable in English
4/2003 Optimising the Design and Delivery of Innovation Policy in Estonia: an Evaluation of Policy Instruments for IntensifyingBusiness InnovationAvailable in English
5/2004 Access of Enterprises to Venture Financing in Estonia: Feasibility Study of Government Support SchemeAvailable in English
6/2006 Evaluation of the Design and Implementation of EstonianRTDI Policy: Implications for Policy PlanningAvailable in English
7/2007 Innovation in Estonian Enterprises 2002–2004 Available in English and Estonian
8/2007 Impact Evaluation of Spinno Programme in 2001–2006Available in English
"Innovation Studies" series consists of research publications, reportsand evaluation studies on Estonian innovation system and policy.
To order copies of publications in the "Innovation Studies" series, please contact the Division of Technology and Innovation in Estonian Ministry of Economic Affairs and Communications at phone +372 625 6392 or at e-mail [email protected].
Innovation Studies can be downloaded in PDF format from the website of Ministry of Economic Affairs and Communications for Estonia www.mkm.ee following the links of Innovatsioon › Uuringud › Innovation Studies.
ISBN 978-9985-9875-0-6ISBN 978-9985-9875-1-3 (PDF)