
INJECTION SPRAY ANALYSES FROM MEDIUM SPEED ENGINES...
9
ILASS 2008 Sep. 8-10, 2008, Como Lake, Italy INTRODUCTION Exhaust gas emissions from maritime diesel engines have been legislated the first time by the IMO (International Maritime Organisation) in 2000 [1]. With a share of 95%, diesel engines are by far the leading propulsion sources of merchant ships bigger than 100 BRT [2]. Until 2000 these engines were optimised only regarding their fuel consumption resulting in efficiencies of 50% and more for large two stroke engines. This induces low soot emissions but very high NO x emissions. Ship engines are considered to produce up to 18% of the global NO x emissions [2]. 0 2 4 6 8 10 12 14 16 18 0 500 1000 1500 2000 Rated engine speed / (rpm) NO X -emissions / (g/kWh) IMO Tier 1 IMO Tier 3 IMO Tier 2 Figure 1 Current and prospective IMO-NO x limits Thereon, the IMO limited the NO x output per kWh depending on engine speed since the year 2000 as seen in Figure 1. Following emission legislation steps (IMO TIER 2 and TIER 3) will come into action in 2011 and 2016 implying a further drastic reduction of NO x emissions. Whereas IMO TIER 3 may only be achieved by exhaust gas treatment systems, TIER 2 seams to be attainable by the application of engine internal measures. These measures commonly imply an extended Miller-cycle, improved turbo charging and charge air cooling as well as the use of modern flexible injection systems such as the common-rail system. Exhaust gas recirculation, known from automotive and industrial engines, is not possible since marine fuels contain typically 0.5-5% sulphur which causes corrosion of engine internal parts by sulphurous acid. Engine manufacturers are currently working on the development and application of flexible common-rail injection systems which are principally similar to those known from the automotive sector. Here, the injection systems capability to cope with marine fuels is the major challenge, i.e. viscosity, temperature and abrasive acting components. Marine fuels Table 1 gives an overview of typical marine fuel properties in comparison to diesel fuel. HFO are categorised according to ISO 8217 (Third Edition 2005-11-01) standard. Roughly 2/3 of all merchant ships are operated with heavy or residual fuel oils (HFO). These fuels vary commonly in a wide range regarding their composition and properties making specific treatment (e.g. water and sediment separation) unalterable. When injecting and combusting HFO in diesel engines it is necessary to heat the fuel in order to reach an appropriate viscosity. Injection system suppliers quantify the allowable INJECTION SPRAY ANALYSES FROM MEDIUM SPEED ENGINES USING MARINE FUELS Christian Fink, Bert Buchholz, Mathias Niendorf, Horst Harndorf University of Rostock, [email protected] ABSTRACT The achievement of future exhaust gas emission limits for medium speed ship engines requires the application of modern, flexible fuel injection systems. However, ship diesel engines are typically operated with a wide range of fuels, which differ significantly in composition and properties. Consequently, a considerable impact of the fuel type on combustion process and emission generation is to be expected. In order to deliver basic information of spray properties and mixture generation process used for the development and improvement of simulation models as well as the examination of engine experimental data a number of experiments were carried out at the University of Rostock. Two modern heavy fuel capable common-rail injectors of medium speed engines have been applied to a pressurised research chamber. By means of different optical measurement methods injection sprays were analysed regarding their different macroscopic and microscopic spray parameters, i.e. spray penetration length, cone angle, droplet size and velocity. Measurements were performed using diesel test fuel or diesel fuel respectively, a heavy fuel oil (HFO) and a fuel water emulsion (FWE 18%) consisting of diesel and 18% water. While the latter was only applied for cold chamber tests, a few more measurements have been done at a chamber temperature of 650 K using diesel fuel and HFO. The measurements clearly indicate a strong impact of fuel type on spray parameters. Paper ID ILASS08-6-9 1
Transcript of INJECTION SPRAY ANALYSES FROM MEDIUM SPEED ENGINES...
ILASS 2008
Sep. 8-10, 2008, Como Lake, Italy
Paper ID ILASS08-102
INTRODUCTION
Exhaust gas emissions from maritime diesel engines have been legislated the first time by the IMO (International Maritime Organisation) in 2000 [1]. With a share of 95%, diesel engines are by far the leading propulsion sources of merchant ships bigger than 100 BRT [2]. Until 2000 these engines were optimised only regarding their fuel consumption resulting in efficiencies of 50% and more for large two stroke engines. This induces low soot emissions but very high NOx
emissions. Ship engines are considered to produce up to 18% of the global NOx emissions [2].
0
2
4
6
8
10
12
14
16
18
0 500 1000 1500 2000
Rated engine speed / (rpm)
NO
X-e
mis
sion
s /
(g/k
Wh
)
IMO Tier 1
IMO Tier 3
IMO Tier 2
Figure 1 Current and prospective IMO-NOx limits
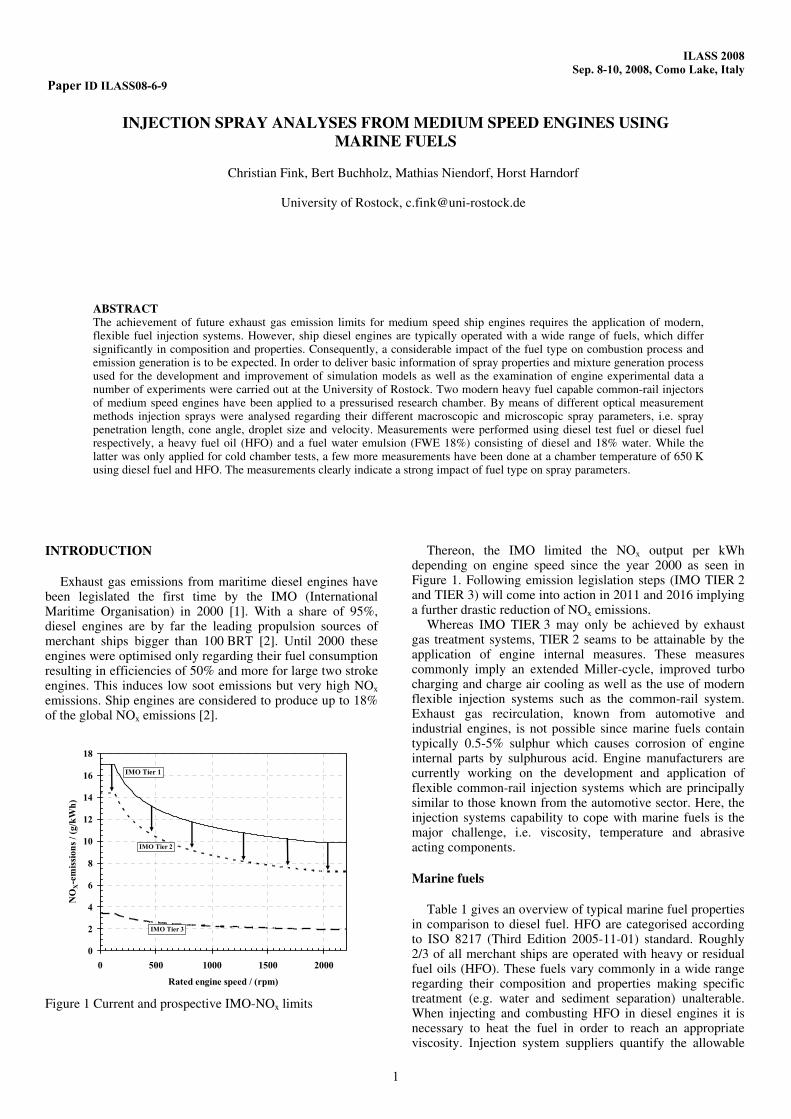
Thereon, the IMO limited the NOx output per kWh depending on engine speed since the year 2000 as seen in Figure 1. Following emission legislation steps (IMO TIER 2 and TIER 3) will come into action in 2011 and 2016 implying a further drastic reduction of NOx emissions.
Whereas IMO TIER 3 may only be achieved by exhaust gas treatment systems, TIER 2 seams to be attainable by the application of engine internal measures. These measures commonly imply an extended Miller-cycle, improved turbo charging and charge air cooling as well as the use of modern flexible injection systems such as the common-rail system. Exhaust gas recirculation, known from automotive and industrial engines, is not possible since marine fuels contain typically 0.5-5% sulphur which causes corrosion of engine internal parts by sulphurous acid. Engine manufacturers are currently working on the development and application of flexible common-rail injection systems which are principally similar to those known from the automotive sector. Here, the injection systems capability to cope with marine fuels is the major challenge, i.e. viscosity, temperature and abrasive acting components.
Marine fuels
Table 1 gives an overview of typical marine fuel properties in comparison to diesel fuel. HFO are categorised according to ISO 8217 (Third Edition 2005-11-01) standard. Roughly 2/3 of all merchant ships are operated with heavy or residual fuel oils (HFO). These fuels vary commonly in a wide range regarding their composition and properties making specific treatment (e.g. water and sediment separation) unalterable. When injecting and combusting HFO in diesel engines it is necessary to heat the fuel in order to reach an appropriate viscosity. Injection system suppliers quantify the allowable
INJECTION SPRAY ANALYSES FROM MEDIUM SPEED ENGINES USING MARINE FUELS
Christian Fink, Bert Buchholz, Mathias Niendorf, Horst Harndorf
University of Rostock, [email protected]
ABSTRACTThe achievement of future exhaust gas emission limits for medium speed ship engines requires the application of modern, flexible fuel injection systems. However, ship diesel engines are typically operated with a wide range of fuels, which differ significantly in composition and properties. Consequently, a considerable impact of the fuel type on combustion process and emission generation is to be expected. In order to deliver basic information of spray properties and mixture generation processused for the development and improvement of simulation models as well as the examination of engine experimental data a number of experiments were carried out at the University of Rostock. Two modern heavy fuel capable common-rail injectors of medium speed engines have been applied to a pressurised research chamber. By means of different optical measurement methods injection sprays were analysed regarding their different macroscopic and microscopic spray parameters, i.e. spray penetration length, cone angle, droplet size and velocity. Measurements were performed using diesel test fuel or diesel fuel respectively, a heavy fuel oil (HFO) and a fuel water emulsion (FWE 18%) consisting of diesel and 18% water. While the latter was only applied for cold chamber tests, a few more measurements have been done at a chamber temperature of 650 K using diesel fuel and HFO. The measurements clearly indicate a strong impact of fuel type on spray parameters.
Paper ID ILASS08-6-9
1
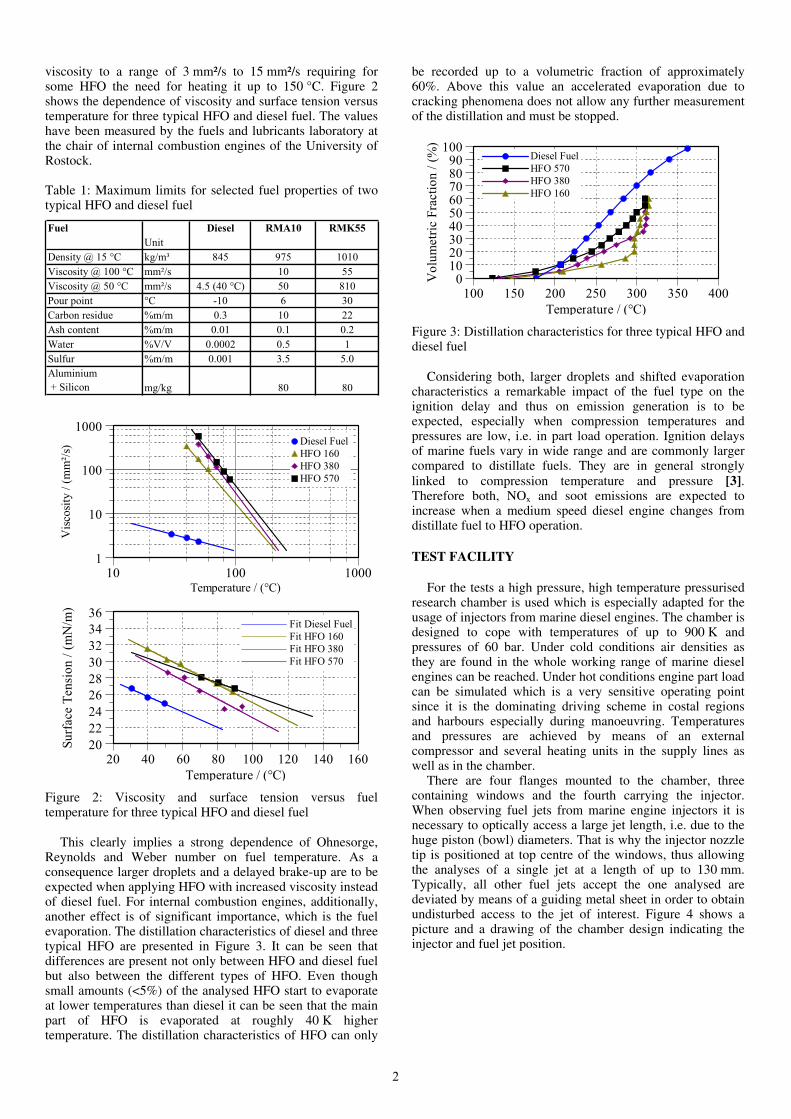
viscosity to a range of 3 mm²/s to 15 mm²/s requiring for some HFO the need for heating it up to 150 °C. Figure 2 shows the dependence of viscosity and surface tension versus temperature for three typical HFO and diesel fuel. The values have been measured by the fuels and lubricants laboratory at the chair of internal combustion engines of the University of Rostock.
Table 1: Maximum limits for selected fuel properties of two typical HFO and diesel fuel
Fuel Diesel RMA10 RMK55
Unit
Density @ 15 °C kg/m³ 845 975 1010
Viscosity @ 100 °C mm²/s 10 55
Viscosity @ 50 °C mm²/s 4.5 (40 °C) 50 810
Pour point °C -10 6 30
Carbon residue %m/m 0.3 10 22
Ash content %m/m 0.01 0.1 0.2
Water %V/V 0.0002 0.5 1
Sulfur %m/m 0.001 3.5 5.0
Aluminium
+ Silicon mg/kg 80 80
Vis
cosi
ty /
(m
m²/
s)
1
10
100
1000
Temperature / (°C)
10 100 1000
Diesel Fuel
HFO 160
HFO 380
HFO 570
Su
rface T
en
sio
n /
(m
N/m
)
20
22
24
26
28
30
32
34
36
Temperature / (°C)
20 40 60 80 100 120 140 160
Fit Diesel Fuel
Fit HFO 160
Fit HFO 380
Fit HFO 570
Figure 2: Viscosity and surface tension versus fuel temperature for three typical HFO and diesel fuel
This clearly implies a strong dependence of Ohnesorge, Reynolds and Weber number on fuel temperature. As a consequence larger droplets and a delayed brake-up are to be expected when applying HFO with increased viscosity instead of diesel fuel. For internal combustion engines, additionally, another effect is of significant importance, which is the fuel evaporation. The distillation characteristics of diesel and three typical HFO are presented in Figure 3. It can be seen that differences are present not only between HFO and diesel fuel but also between the different types of HFO. Even though small amounts (<5%) of the analysed HFO start to evaporate at lower temperatures than diesel it can be seen that the main part of HFO is evaporated at roughly 40 K higher temperature. The distillation characteristics of HFO can only
be recorded up to a volumetric fraction of approximately 60%. Above this value an accelerated evaporation due to cracking phenomena does not allow any further measurement of the distillation and must be stopped.
Vo
lum
etr
ic F
racti
on
/ (
%)
0102030405060708090
100
Temperature / (°C)
100 150 200 250 300 350 400
Diesel Fuel
HFO 570
HFO 380
HFO 160
Figure 3: Distillation characteristics for three typical HFO and diesel fuel
Considering both, larger droplets and shifted evaporation characteristics a remarkable impact of the fuel type on the ignition delay and thus on emission generation is to be expected, especially when compression temperatures and pressures are low, i.e. in part load operation. Ignition delays of marine fuels vary in wide range and are commonly larger compared to distillate fuels. They are in general strongly linked to compression temperature and pressure [3].Therefore both, NOx and soot emissions are expected to increase when a medium speed diesel engine changes from distillate fuel to HFO operation.
TEST FACILITY
For the tests a high pressure, high temperature pressurised research chamber is used which is especially adapted for the usage of injectors from marine diesel engines. The chamber is designed to cope with temperatures of up to 900 K and pressures of 60 bar. Under cold conditions air densities as they are found in the whole working range of marine diesel engines can be reached. Under hot conditions engine part load can be simulated which is a very sensitive operating point since it is the dominating driving scheme in costal regions and harbours especially during manoeuvring. Temperatures and pressures are achieved by means of an external compressor and several heating units in the supply lines as well as in the chamber.
There are four flanges mounted to the chamber, three containing windows and the fourth carrying the injector. When observing fuel jets from marine engine injectors it is necessary to optically access a large jet length, i.e. due to the huge piston (bowl) diameters. That is why the injector nozzle tip is positioned at top centre of the windows, thus allowing the analyses of a single jet at a length of up to 130 mm. Typically, all other fuel jets accept the one analysed are deviated by means of a guiding metal sheet in order to obtain undisturbed access to the jet of interest. Figure 4 shows a picture and a drawing of the chamber design indicating the injector and fuel jet position.
2
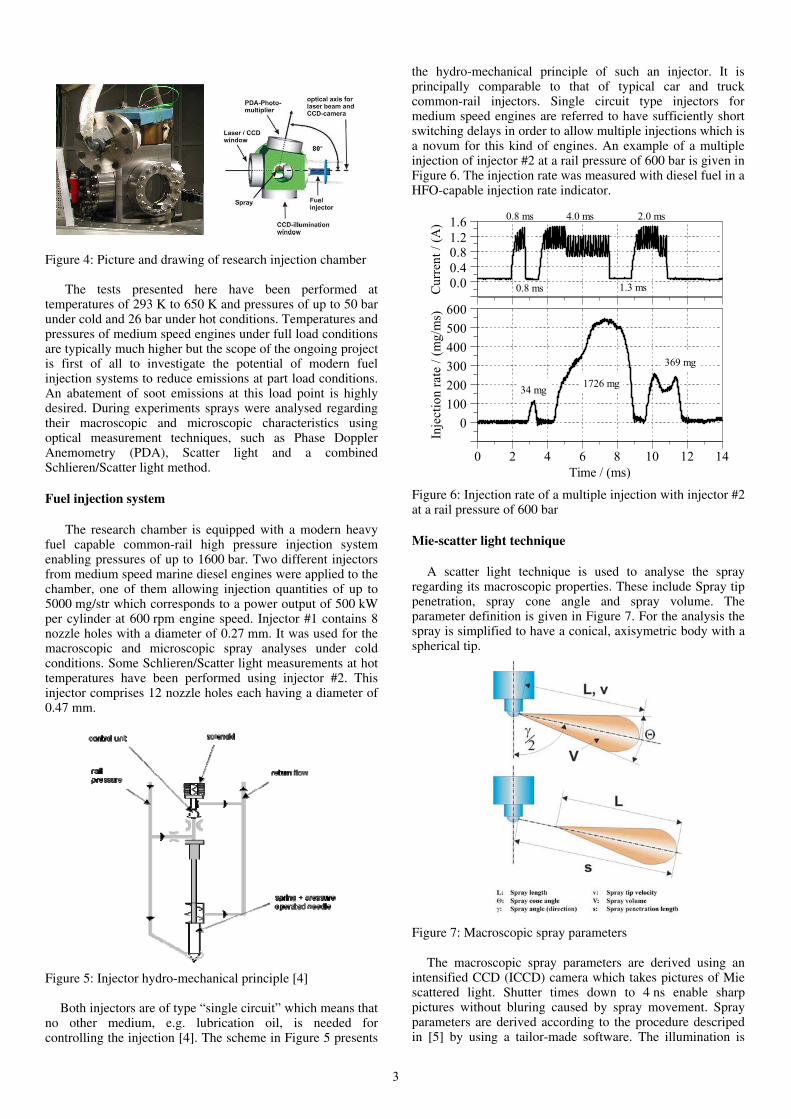
Figure 4: Picture and drawing of research injection chamber
The tests presented here have been performed at temperatures of 293 K to 650 K and pressures of up to 50 bar under cold and 26 bar under hot conditions. Temperatures and pressures of medium speed engines under full load conditions are typically much higher but the scope of the ongoing project is first of all to investigate the potential of modern fuel injection systems to reduce emissions at part load conditions. An abatement of soot emissions at this load point is highly desired. During experiments sprays were analysed regarding their macroscopic and microscopic characteristics using optical measurement techniques, such as Phase Doppler Anemometry (PDA), Scatter light and a combined Schlieren/Scatter light method.
Fuel injection system
The research chamber is equipped with a modern heavy fuel capable common-rail high pressure injection system enabling pressures of up to 1600 bar. Two different injectors from medium speed marine diesel engines were applied to the chamber, one of them allowing injection quantities of up to 5000 mg/str which corresponds to a power output of 500 kW per cylinder at 600 rpm engine speed. Injector #1 contains 8 nozzle holes with a diameter of 0.27 mm. It was used for the macroscopic and microscopic spray analyses under cold conditions. Some Schlieren/Scatter light measurements at hot temperatures have been performed using injector #2. This injector comprises 12 nozzle holes each having a diameter of 0.47 mm.
Figure 5: Injector hydro-mechanical principle [4]
Both injectors are of type “single circuit” which means that no other medium, e.g. lubrication oil, is needed for controlling the injection [4]. The scheme in Figure 5 presents
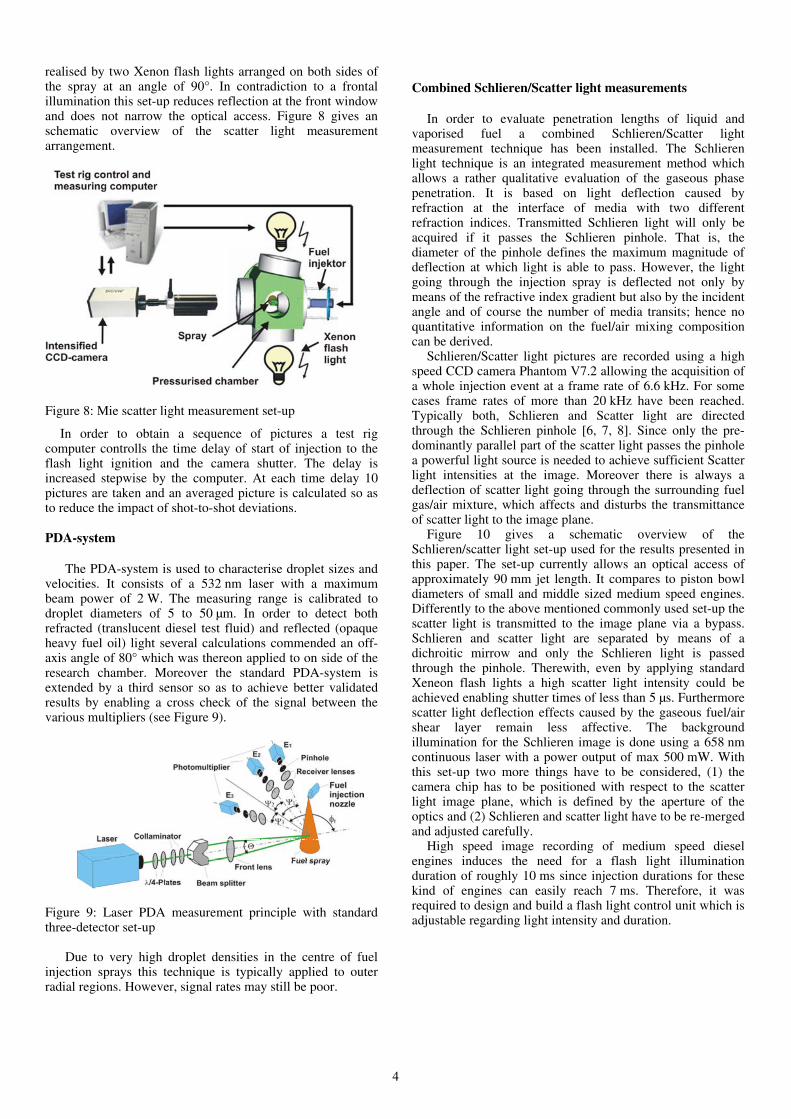
the hydro-mechanical principle of such an injector. It is principally comparable to that of typical car and truck common-rail injectors. Single circuit type injectors for medium speed engines are referred to have sufficiently short switching delays in order to allow multiple injections which is a novum for this kind of engines. An example of a multiple injection of injector #2 at a rail pressure of 600 bar is given in Figure 6. The injection rate was measured with diesel fuel in a HFO-capable injection rate indicator.
0.8 ms 4.0 ms 2.0 ms
1.3 ms0.8 msCu
rren
t /
(A)
0.0
0.4
0.81.2
1.6
Inje
cti
on
rate
/ (
mg
/ms)
0
100
200
300
400
500
600
Time / (ms)
0 2 4 6 8 10 12 14
34 mg1726 mg
369 mg
Figure 6: Injection rate of a multiple injection with injector #2 at a rail pressure of 600 bar
Mie-scatter light technique
A scatter light technique is used to analyse the spray regarding its macroscopic properties. These include Spray tip penetration, spray cone angle and spray volume. The parameter definition is given in Figure 7. For the analysis the spray is simplified to have a conical, axisymetric body with a spherical tip.
Figure 7: Macroscopic spray parameters
The macroscopic spray parameters are derived using an intensified CCD (ICCD) camera which takes pictures of Mie scattered light. Shutter times down to 4 ns enable sharp pictures without bluring caused by spray movement. Spray parameters are derived according to the procedure descriped in [5] by using a tailor-made software. The illumination is
3
realised by two Xenon flash lights arranged on both sides of the spray at an angle of 90°. In contradiction to a frontal illumination this set-up reduces reflection at the front window and does not narrow the optical access. Figure 8 gives an schematic overview of the scatter light measurement arrangement.
Figure 8: Mie scatter light measurement set-up
In order to obtain a sequence of pictures a test rig computer controlls the time delay of start of injection to the flash light ignition and the camera shutter. The delay is increased stepwise by the computer. At each time delay 10 pictures are taken and an averaged picture is calculated so as to reduce the impact of shot-to-shot deviations.
PDA-system
The PDA-system is used to characterise droplet sizes and velocities. It consists of a 532 nm laser with a maximum beam power of 2 W. The measuring range is calibrated to droplet diameters of 5 to 50 µm. In order to detect both refracted (translucent diesel test fluid) and reflected (opaque heavy fuel oil) light several calculations commended an off-axis angle of 80° which was thereon applied to on side of the research chamber. Moreover the standard PDA-system is extended by a third sensor so as to achieve better validated results by enabling a cross check of the signal between the various multipliers (see Figure 9).
Figure 9: Laser PDA measurement principle with standard three-detector set-up
Due to very high droplet densities in the centre of fuel injection sprays this technique is typically applied to outer radial regions. However, signal rates may still be poor.
Combined Schlieren/Scatter light measurements
In order to evaluate penetration lengths of liquid and vaporised fuel a combined Schlieren/Scatter light measurement technique has been installed. The Schlieren light technique is an integrated measurement method which allows a rather qualitative evaluation of the gaseous phase penetration. It is based on light deflection caused by refraction at the interface of media with two different refraction indices. Transmitted Schlieren light will only be acquired if it passes the Schlieren pinhole. That is, the diameter of the pinhole defines the maximum magnitude of deflection at which light is able to pass. However, the light going through the injection spray is deflected not only by means of the refractive index gradient but also by the incident angle and of course the number of media transits; hence no quantitative information on the fuel/air mixing composition can be derived.
Schlieren/Scatter light pictures are recorded using a high speed CCD camera Phantom V7.2 allowing the acquisition of a whole injection event at a frame rate of 6.6 kHz. For some cases frame rates of more than 20 kHz have been reached. Typically both, Schlieren and Scatter light are directed through the Schlieren pinhole [6, 7, 8]. Since only the pre-dominantly parallel part of the scatter light passes the pinhole a powerful light source is needed to achieve sufficient Scatter light intensities at the image. Moreover there is always a deflection of scatter light going through the surrounding fuel gas/air mixture, which affects and disturbs the transmittance of scatter light to the image plane.
Figure 10 gives a schematic overview of the Schlieren/scatter light set-up used for the results presented in this paper. The set-up currently allows an optical access of approximately 90 mm jet length. It compares to piston bowl diameters of small and middle sized medium speed engines. Differently to the above mentioned commonly used set-up the scatter light is transmitted to the image plane via a bypass. Schlieren and scatter light are separated by means of a dichroitic mirrow and only the Schlieren light is passed through the pinhole. Therewith, even by applying standard Xeneon flash lights a high scatter light intensity could be achieved enabling shutter times of less than 5 µs. Furthermore scatter light deflection effects caused by the gaseous fuel/air shear layer remain less affective. The background illumination for the Schlieren image is done using a 658 nm continuous laser with a power output of max 500 mW. With this set-up two more things have to be considered, (1) the camera chip has to be positioned with respect to the scatter light image plane, which is defined by the aperture of the optics and (2) Schlieren and scatter light have to be re-merged and adjusted carefully.
High speed image recording of medium speed diesel engines induces the need for a flash light illumination duration of roughly 10 ms since injection durations for these kind of engines can easily reach 7 ms. Therefore, it was required to design and build a flash light control unit which is adjustable regarding light intensity and duration.
4
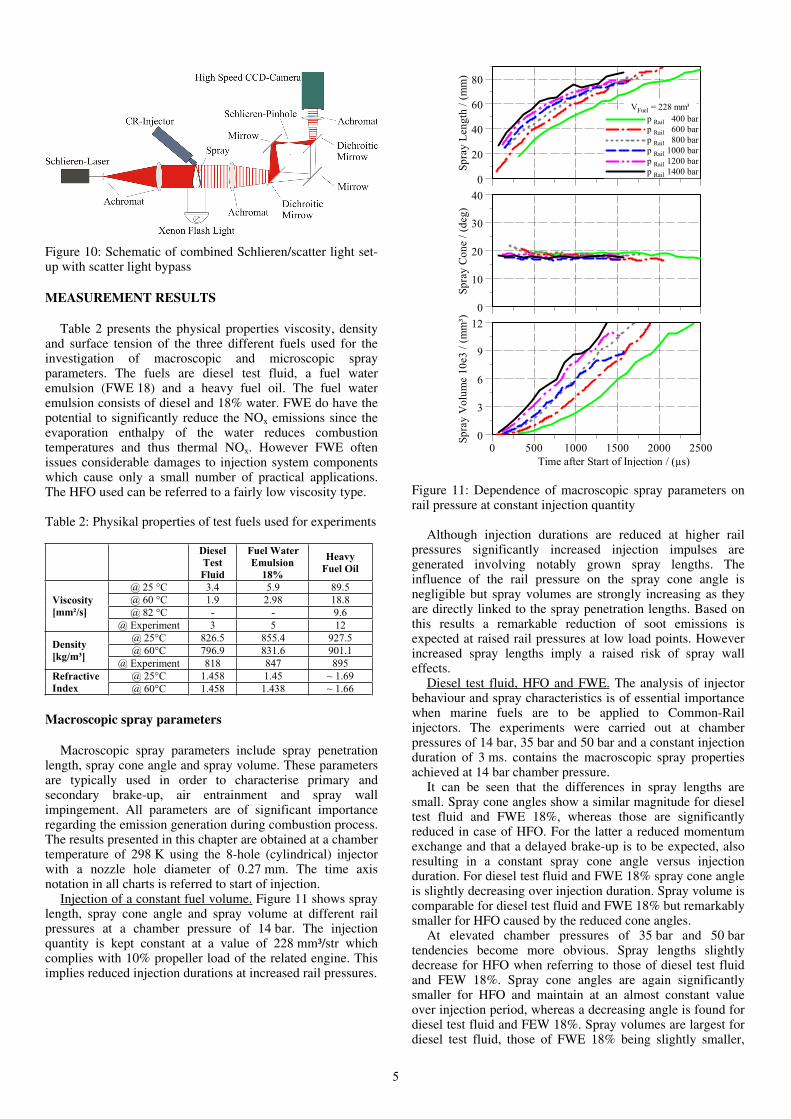
Figure 10: Schematic of combined Schlieren/scatter light set-up with scatter light bypass
MEASUREMENT RESULTS
Table 2 presents the physical properties viscosity, density and surface tension of the three different fuels used for the investigation of macroscopic and microscopic spray parameters. The fuels are diesel test fluid, a fuel water emulsion (FWE 18) and a heavy fuel oil. The fuel water emulsion consists of diesel and 18% water. FWE do have the potential to significantly reduce the NOx emissions since the evaporation enthalpy of the water reduces combustion temperatures and thus thermal NOx. However FWE often issues considerable damages to injection system components which cause only a small number of practical applications. The HFO used can be referred to a fairly low viscosity type.
Table 2: Physikal properties of test fuels used for experiments
Diesel
Test
Fluid
Fuel Water
Emulsion
18%
Heavy
Fuel Oil
@ 25 °C 3.4 5.9 89.5
@ 60 °C 1.9 2.98 18.8
@ 82 °C - - 9.6
Viscosity
[mm²/s]
@ Experiment 3 5 12
@ 25°C 826.5 855.4 927.5
@ 60°C 796.9 831.6 901.1 Density
[kg/m³] @ Experiment 818 847 895
@ 25°C 1.458 1.45 ~ 1.69 Refractive
Index @ 60°C 1.458 1.438 ~ 1.66
Macroscopic spray parameters
Macroscopic spray parameters include spray penetration length, spray cone angle and spray volume. These parameters are typically used in order to characterise primary and secondary brake-up, air entrainment and spray wall impingement. All parameters are of significant importance regarding the emission generation during combustion process. The results presented in this chapter are obtained at a chamber temperature of 298 K using the 8-hole (cylindrical) injector with a nozzle hole diameter of 0.27 mm. The time axis notation in all charts is referred to start of injection.
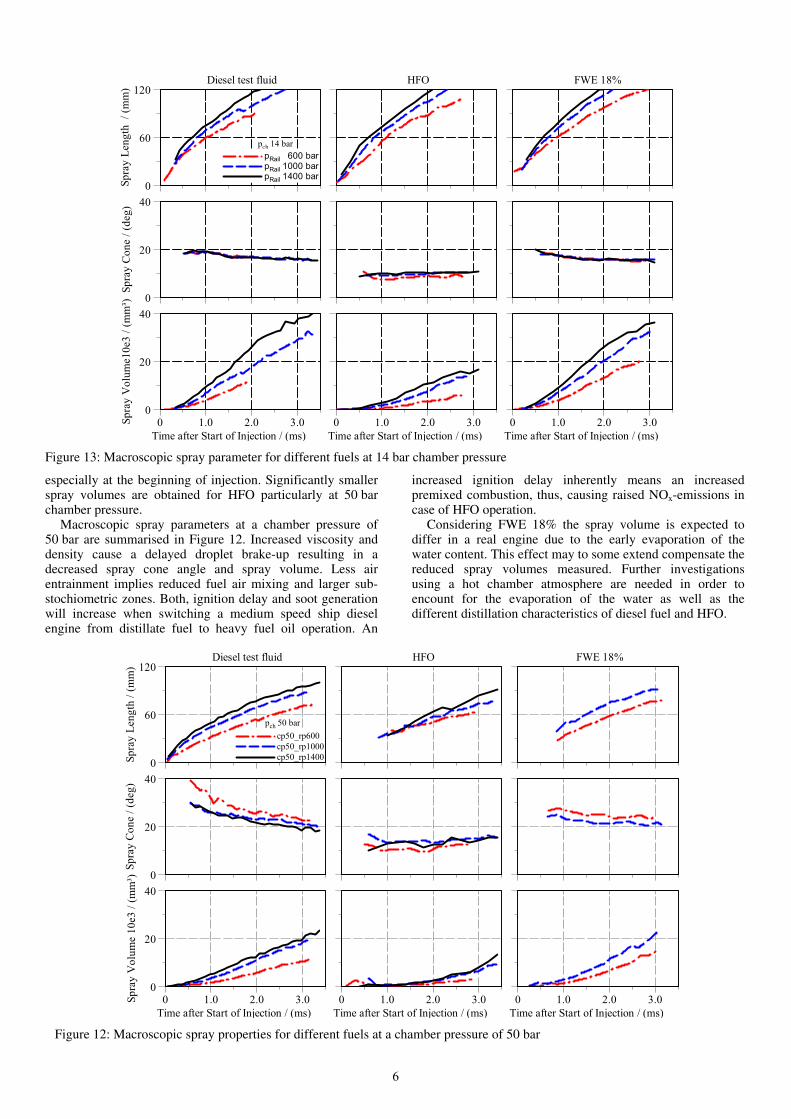
Injection of a constant fuel volume. Figure 11 shows spray length, spray cone angle and spray volume at different rail pressures at a chamber pressure of 14 bar. The injection quantity is kept constant at a value of 228 mm³/str which complies with 10% propeller load of the related engine. This implies reduced injection durations at increased rail pressures.
Sp
ray
Len
gth
/ (
mm
)
0
20
40
60
80
p Rail 400 bar
p Rail 600 bar
p Rail 800 bar
p Rail 1000 bar
p Rail 1200 bar
p Rail 1400 bar
VFuel = 228 mm³
Sp
ray
Co
ne /
(d
eg
)
0
10
20
30
40
Sp
ray
Vo
lum
e 1
0e3
/ (
mm
³)
0
3
6
9
12
Time after Start of Injection / (µs)
0 500 1000 1500 2000 2500
Figure 11: Dependence of macroscopic spray parameters on rail pressure at constant injection quantity
Although injection durations are reduced at higher rail pressures significantly increased injection impulses are generated involving notably grown spray lengths. The influence of the rail pressure on the spray cone angle is negligible but spray volumes are strongly increasing as they are directly linked to the spray penetration lengths. Based on this results a remarkable reduction of soot emissions is expected at raised rail pressures at low load points. However increased spray lengths imply a raised risk of spray wall effects.
Diesel test fluid, HFO and FWE. The analysis of injector behaviour and spray characteristics is of essential importance when marine fuels are to be applied to Common-Rail injectors. The experiments were carried out at chamber pressures of 14 bar, 35 bar and 50 bar and a constant injection duration of 3 ms. contains the macroscopic spray properties achieved at 14 bar chamber pressure.
It can be seen that the differences in spray lengths are small. Spray cone angles show a similar magnitude for diesel test fluid and FWE 18%, whereas those are significantly reduced in case of HFO. For the latter a reduced momentum exchange and that a delayed brake-up is to be expected, also resulting in a constant spray cone angle versus injection duration. For diesel test fluid and FWE 18% spray cone angle is slightly decreasing over injection duration. Spray volume is comparable for diesel test fluid and FWE 18% but remarkably smaller for HFO caused by the reduced cone angles.
At elevated chamber pressures of 35 bar and 50 bar tendencies become more obvious. Spray lengths slightly decrease for HFO when referring to those of diesel test fluid and FEW 18%. Spray cone angles are again significantly smaller for HFO and maintain at an almost constant value over injection period, whereas a decreasing angle is found for diesel test fluid and FEW 18%. Spray volumes are largest for diesel test fluid, those of FWE 18% being slightly smaller,
5
especially at the beginning of injection. Significantly smaller spray volumes are obtained for HFO particularly at 50 bar chamber pressure.
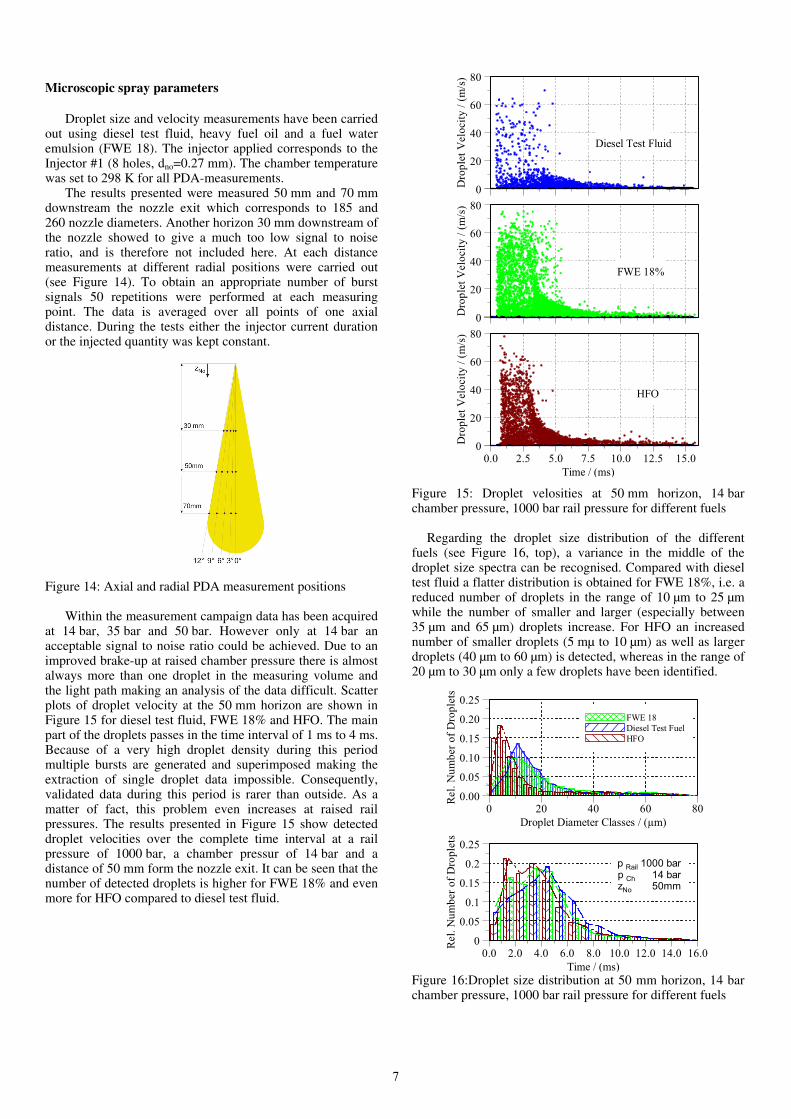
Macroscopic spray parameters at a chamber pressure of 50 bar are summarised in Figure 12. Increased viscosity and density cause a delayed droplet brake-up resulting in a decreased spray cone angle and spray volume. Less air entrainment implies reduced fuel air mixing and larger sub-stochiometric zones. Both, ignition delay and soot generation will increase when switching a medium speed ship diesel engine from distillate fuel to heavy fuel oil operation. An
increased ignition delay inherently means an increased premixed combustion, thus, causing raised NOx-emissions in case of HFO operation.
Considering FWE 18% the spray volume is expected to differ in a real engine due to the early evaporation of the water content. This effect may to some extend compensate the reduced spray volumes measured. Further investigations using a hot chamber atmosphere are needed in order to encount for the evaporation of the water as well as the different distillation characteristics of diesel fuel and HFO.
Diesel test fluid HFO FWE 18%
pch 14 bar
Time after Start of Injection / (ms)
0 1.0 2.0 3.0
Time after Start of Injection / (ms)
0 1.0 2.0 3.0
Sp
ray
Co
ne /
(d
eg
)
0
20
40
Sp
ray
Len
gth
/
(mm
)
0
60
120
pRail 600 bar pRail 1000 bar pRail 1400 bar
Sp
ray
Vo
lum
e1
0e3
/ (
mm
³)
0
20
40
Time after Start of Injection / (ms)
0 1.0 2.0 3.0
Figure 13: Macroscopic spray parameter for different fuels at 14 bar chamber pressure
Diesel test fluid HFO FWE 18%
pch 50 bar
Sp
ray
Len
gth
/ (
mm
)
0
60
120
cp50_rp600
cp50_rp1000
cp50_rp1400
Sp
ray
Co
ne /
(d
eg
)
0
20
40
Sp
ray
Vo
lum
e 1
0e3
/ (
mm
³)
0
20
40
Time after Start of Injection / (ms)
0 1.0 2.0 3.0
Time after Start of Injection / (ms)
0 1.0 2.0 3.0
Time after Start of Injection / (ms)
0 1.0 2.0 3.0
Figure 12: Macroscopic spray properties for different fuels at a chamber pressure of 50 bar
6
Microscopic spray parameters
Droplet size and velocity measurements have been carried out using diesel test fluid, heavy fuel oil and a fuel water emulsion (FWE 18). The injector applied corresponds to the Injector #1 (8 holes, dno=0.27 mm). The chamber temperature was set to 298 K for all PDA-measurements.
The results presented were measured 50 mm and 70 mm downstream the nozzle exit which corresponds to 185 and 260 nozzle diameters. Another horizon 30 mm downstream of the nozzle showed to give a much too low signal to noise ratio, and is therefore not included here. At each distance measurements at different radial positions were carried out (see Figure 14). To obtain an appropriate number of burst signals 50 repetitions were performed at each measuring point. The data is averaged over all points of one axial distance. During the tests either the injector current duration or the injected quantity was kept constant.
Figure 14: Axial and radial PDA measurement positions
Within the measurement campaign data has been acquired at 14 bar, 35 bar and 50 bar. However only at 14 bar an acceptable signal to noise ratio could be achieved. Due to an improved brake-up at raised chamber pressure there is almost always more than one droplet in the measuring volume and the light path making an analysis of the data difficult. Scatter plots of droplet velocity at the 50 mm horizon are shown in Figure 15 for diesel test fluid, FWE 18% and HFO. The main part of the droplets passes in the time interval of 1 ms to 4 ms. Because of a very high droplet density during this period multiple bursts are generated and superimposed making the extraction of single droplet data impossible. Consequently, validated data during this period is rarer than outside. As a matter of fact, this problem even increases at raised rail pressures. The results presented in Figure 15 show detected droplet velocities over the complete time interval at a rail pressure of 1000 bar, a chamber pressur of 14 bar and a distance of 50 mm form the nozzle exit. It can be seen that the number of detected droplets is higher for FWE 18% and even more for HFO compared to diesel test fluid.
Dro
ple
t V
elo
city
/ (
m/s
)
0
20
40
60
80
Diesel Test Fluid
Dro
ple
t V
elo
city
/ (
m/s
)
0
20
40
60
80
FWE 18%
Dro
ple
t V
elo
city
/ (
m/s
)
0
20
40
60
80
Time / (ms)
0.0 2.5 5.0 7.5 10.0 12.5 15.0
HFO
Figure 15: Droplet velosities at 50 mm horizon, 14 bar chamber pressure, 1000 bar rail pressure for different fuels
Regarding the droplet size distribution of the different fuels (see Figure 16, top), a variance in the middle of the droplet size spectra can be recognised. Compared with diesel test fluid a flatter distribution is obtained for FWE 18%, i.e. a reduced number of droplets in the range of 10 µm to 25 µm while the number of smaller and larger (especially between 35 µm and 65 µm) droplets increase. For HFO an increased number of smaller droplets (5 mµ to 10 µm) as well as larger droplets (40 µm to 60 µm) is detected, whereas in the range of 20 µm to 30 µm only a few droplets have been identified.
Rel.
Nu
mb
er o
f D
rop
lets
0.00
0.05
0.10
0.15
0.20
0.25
Droplet Diameter Classes / (µm)
0 20 40 60 80
Rel.
Nu
mb
er o
f D
rop
lets
0
0.05
0.1
0.15
0.2
0.25
Time / (ms)
0.0 2.0 4.0 6.0 8.0 10.0 12.0 14.0 16.0
p Rail 1000 barp Ch 14 barzNo 50mm
FWE 18
Diesel Test Fuel
HFO
Figure 16:Droplet size distribution at 50 mm horizon, 14 bar chamber pressure, 1000 bar rail pressure for different fuels
7
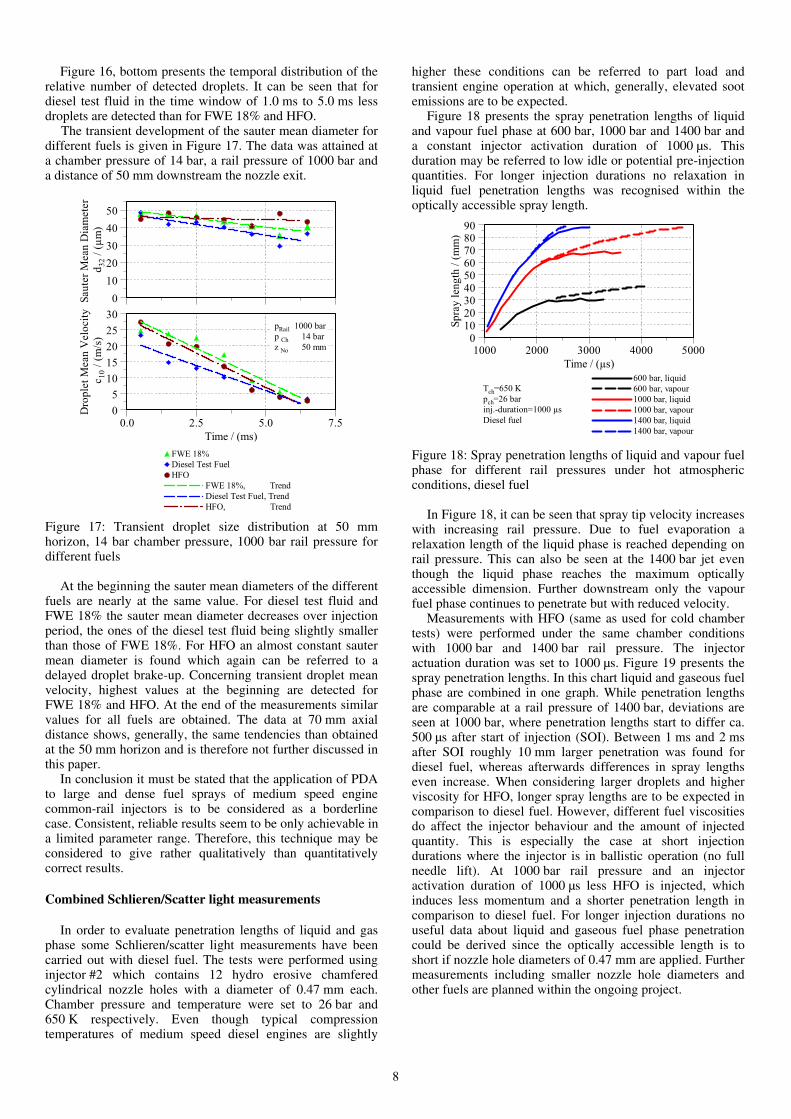
Figure 16, bottom presents the temporal distribution of the relative number of detected droplets. It can be seen that for diesel test fluid in the time window of 1.0 ms to 5.0 ms less droplets are detected than for FWE 18% and HFO.
The transient development of the sauter mean diameter for different fuels is given in Figure 17. The data was attained at a chamber pressure of 14 bar, a rail pressure of 1000 bar and a distance of 50 mm downstream the nozzle exit.
Sau
ter
Mean
Dia
met
er
d3
2 /
(µ
m)
0
10
20
30
40
50
Dro
ple
t M
ean
Vel
oci
ty
c1
0 /
(m
/s)
0
5
10
15
20
25
30
Time / (ms)
0.0 2.5 5.0 7.5
FWE 18%
Diesel Test Fuel
HFO
FWE 18%, Trend
Diesel Test Fuel, Trend
HFO, Trend
pRail 1000 bar
p Ch 14 bar
z No 50 mm
Figure 17: Transient droplet size distribution at 50 mm horizon, 14 bar chamber pressure, 1000 bar rail pressure for different fuels
At the beginning the sauter mean diameters of the different fuels are nearly at the same value. For diesel test fluid and FWE 18% the sauter mean diameter decreases over injection period, the ones of the diesel test fluid being slightly smaller than those of FWE 18%. For HFO an almost constant sauter mean diameter is found which again can be referred to a delayed droplet brake-up. Concerning transient droplet mean velocity, highest values at the beginning are detected for FWE 18% and HFO. At the end of the measurements similar values for all fuels are obtained. The data at 70 mm axial distance shows, generally, the same tendencies than obtained at the 50 mm horizon and is therefore not further discussed in this paper.
In conclusion it must be stated that the application of PDA to large and dense fuel sprays of medium speed engine common-rail injectors is to be considered as a borderline case. Consistent, reliable results seem to be only achievable in a limited parameter range. Therefore, this technique may be considered to give rather qualitatively than quantitatively correct results.
Combined Schlieren/Scatter light measurements
In order to evaluate penetration lengths of liquid and gas phase some Schlieren/scatter light measurements have been carried out with diesel fuel. The tests were performed using injector #2 which contains 12 hydro erosive chamfered cylindrical nozzle holes with a diameter of 0.47 mm each. Chamber pressure and temperature were set to 26 bar and 650 K respectively. Even though typical compression temperatures of medium speed diesel engines are slightly
higher these conditions can be referred to part load and transient engine operation at which, generally, elevated soot emissions are to be expected.
Figure 18 presents the spray penetration lengths of liquid and vapour fuel phase at 600 bar, 1000 bar and 1400 bar and a constant injector activation duration of 1000 µs. This duration may be referred to low idle or potential pre-injection quantities. For longer injection durations no relaxation in liquid fuel penetration lengths was recognised within the optically accessible spray length.
Sp
ray
len
gth
/ (
mm
)
0102030405060708090
Time / (µs)
1000 2000 3000 4000 5000
600 bar, liquid
600 bar, vapour
1000 bar, liquid
1000 bar, vapour
1400 bar, liquid
1400 bar, vapour
Tch=650 K
pch=26 bar
inj.-duration=1000 µs
Diesel fuel
Figure 18: Spray penetration lengths of liquid and vapour fuel phase for different rail pressures under hot atmospheric conditions, diesel fuel
In Figure 18, it can be seen that spray tip velocity increases with increasing rail pressure. Due to fuel evaporation a relaxation length of the liquid phase is reached depending on rail pressure. This can also be seen at the 1400 bar jet even though the liquid phase reaches the maximum optically accessible dimension. Further downstream only the vapour fuel phase continues to penetrate but with reduced velocity.
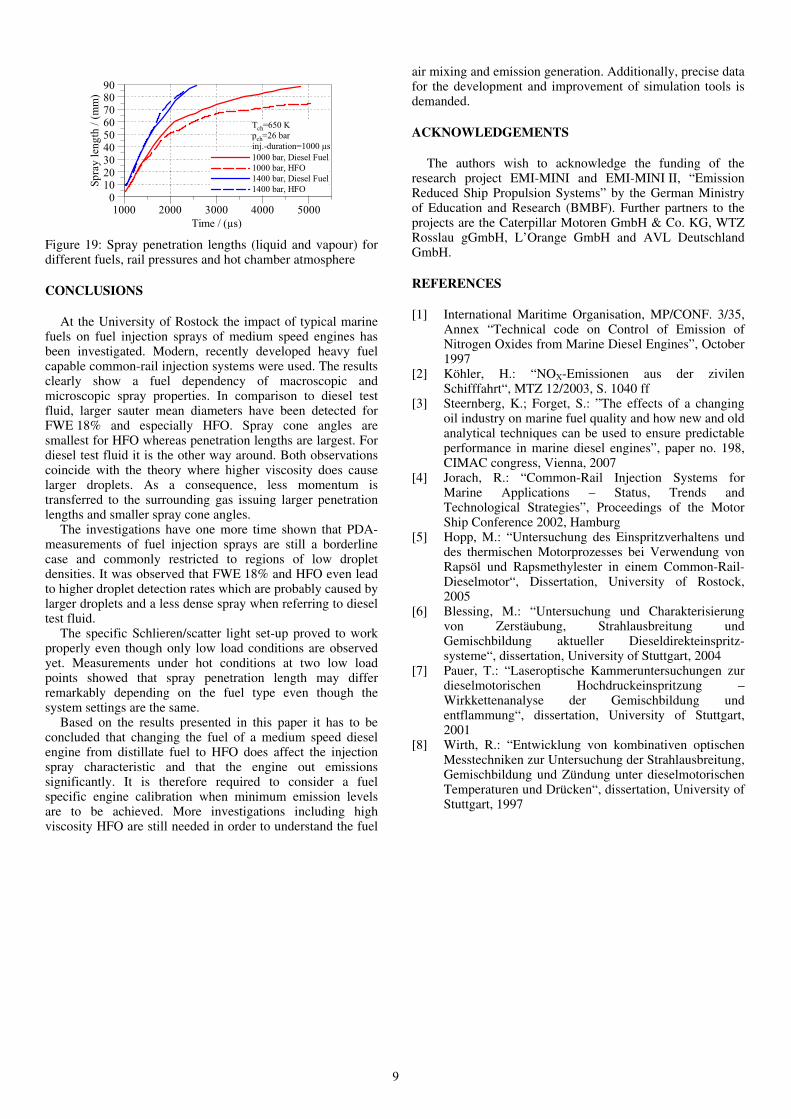
Measurements with HFO (same as used for cold chamber tests) were performed under the same chamber conditions with 1000 bar and 1400 bar rail pressure. The injector actuation duration was set to 1000 µs. Figure 19 presents the spray penetration lengths. In this chart liquid and gaseous fuel phase are combined in one graph. While penetration lengths are comparable at a rail pressure of 1400 bar, deviations are seen at 1000 bar, where penetration lengths start to differ ca. 500 µs after start of injection (SOI). Between 1 ms and 2 ms after SOI roughly 10 mm larger penetration was found for diesel fuel, whereas afterwards differences in spray lengths even increase. When considering larger droplets and higher viscosity for HFO, longer spray lengths are to be expected in comparison to diesel fuel. However, different fuel viscosities do affect the injector behaviour and the amount of injected quantity. This is especially the case at short injection durations where the injector is in ballistic operation (no full needle lift). At 1000 bar rail pressure and an injector activation duration of 1000 µs less HFO is injected, which induces less momentum and a shorter penetration length in comparison to diesel fuel. For longer injection durations no useful data about liquid and gaseous fuel phase penetration could be derived since the optically accessible length is to short if nozzle hole diameters of 0.47 mm are applied. Further measurements including smaller nozzle hole diameters and other fuels are planned within the ongoing project.
8
Sp
ray
len
gth
/ (
mm
)
0102030405060708090
Time / (µs)
1000 2000 3000 4000 5000
Tch=650 K
pch=26 bar
inj.-duration=1000 µs
1000 bar, Diesel Fuel
1000 bar, HFO
1400 bar, Diesel Fuel
1400 bar, HFO
Figure 19: Spray penetration lengths (liquid and vapour) for different fuels, rail pressures and hot chamber atmosphere
CONCLUSIONS
At the University of Rostock the impact of typical marine fuels on fuel injection sprays of medium speed engines has been investigated. Modern, recently developed heavy fuel capable common-rail injection systems were used. The results clearly show a fuel dependency of macroscopic and microscopic spray properties. In comparison to diesel test fluid, larger sauter mean diameters have been detected for FWE 18% and especially HFO. Spray cone angles are smallest for HFO whereas penetration lengths are largest. For diesel test fluid it is the other way around. Both observations coincide with the theory where higher viscosity does cause larger droplets. As a consequence, less momentum is transferred to the surrounding gas issuing larger penetration lengths and smaller spray cone angles.
The investigations have one more time shown that PDA-measurements of fuel injection sprays are still a borderline case and commonly restricted to regions of low droplet densities. It was observed that FWE 18% and HFO even lead to higher droplet detection rates which are probably caused by larger droplets and a less dense spray when referring to diesel test fluid.
The specific Schlieren/scatter light set-up proved to work properly even though only low load conditions are observed yet. Measurements under hot conditions at two low load points showed that spray penetration length may differ remarkably depending on the fuel type even though the system settings are the same.
Based on the results presented in this paper it has to be concluded that changing the fuel of a medium speed diesel engine from distillate fuel to HFO does affect the injection spray characteristic and that the engine out emissions significantly. It is therefore required to consider a fuel specific engine calibration when minimum emission levels are to be achieved. More investigations including high viscosity HFO are still needed in order to understand the fuel
air mixing and emission generation. Additionally, precise data for the development and improvement of simulation tools is demanded.
ACKNOWLEDGEMENTS
The authors wish to acknowledge the funding of the research project EMI-MINI and EMI-MINI II, “Emission Reduced Ship Propulsion Systems” by the German Ministry of Education and Research (BMBF). Further partners to the projects are the Caterpillar Motoren GmbH & Co. KG, WTZ Rosslau gGmbH, L’Orange GmbH and AVL Deutschland GmbH.
REFERENCES
[1] International Maritime Organisation, MP/CONF. 3/35, Annex “Technical code on Control of Emission of Nitrogen Oxides from Marine Diesel Engines”, October 1997
[2] Köhler, H.: “NOX-Emissionen aus der zivilen Schifffahrt“, MTZ 12/2003, S. 1040 ff
[3] Steernberg, K.; Forget, S.: ”The effects of a changing oil industry on marine fuel quality and how new and old analytical techniques can be used to ensure predictable performance in marine diesel engines”, paper no. 198, CIMAC congress, Vienna, 2007
[4] Jorach, R.: “Common-Rail Injection Systems for Marine Applications – Status, Trends and Technological Strategies”, Proceedings of the Motor Ship Conference 2002, Hamburg
[5] Hopp, M.: “Untersuchung des Einspritzverhaltens und des thermischen Motorprozesses bei Verwendung von Rapsöl und Rapsmethylester in einem Common-Rail-Dieselmotor“, Dissertation, University of Rostock, 2005
[6] Blessing, M.: “Untersuchung und Charakterisierung von Zerstäubung, Strahlausbreitung und Gemischbildung aktueller Dieseldirekteinspritz-systeme“, dissertation, University of Stuttgart, 2004
[7] Pauer, T.: “Laseroptische Kammeruntersuchungen zur dieselmotorischen Hochdruckeinspritzung – Wirkkettenanalyse der Gemischbildung und entflammung“, dissertation, University of Stuttgart, 2001
[8] Wirth, R.: “Entwicklung von kombinativen optischen Messtechniken zur Untersuchung der Strahlausbreitung, Gemischbildung und Zündung unter dieselmotorischen Temperaturen und Drücken“, dissertation, University of Stuttgart, 1997
9